
 Facebook
 X
X
 Pinterest
 Copy Link

Scugog Housing March 2025

Each office is independently owned and operated
![]()

![]()
Housing Market Report for March 2025
Here is the Region of Durham Housing March 2025 report (all housing types), with reports from the Canadian Real Estate Association, and Toronto Regional Real Estate Board included.
This housing report for Durham Region includes the number of new listings, average list price, number of properties sold, average selling price, average days on market and average asking price to selling price ratio for all property types within the Region of Durham.
Scroll to the bottom for links to take you to the housing market reports for Uxbridge, Scugog and Brock.
![]()
![]()
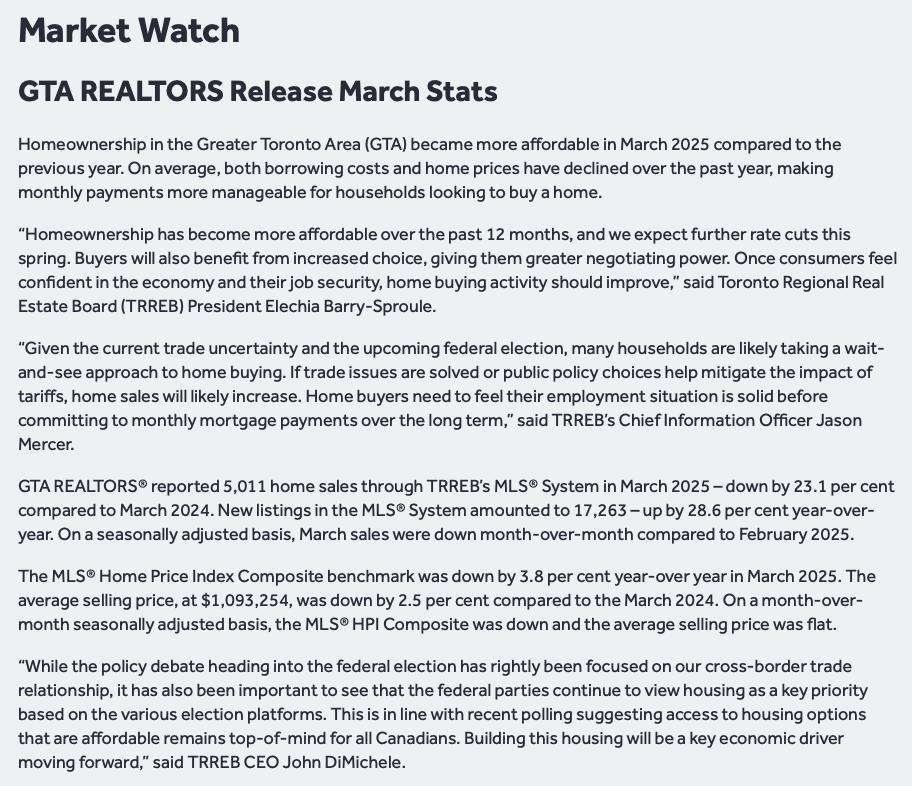
From Toronto Regional Real Estate Board
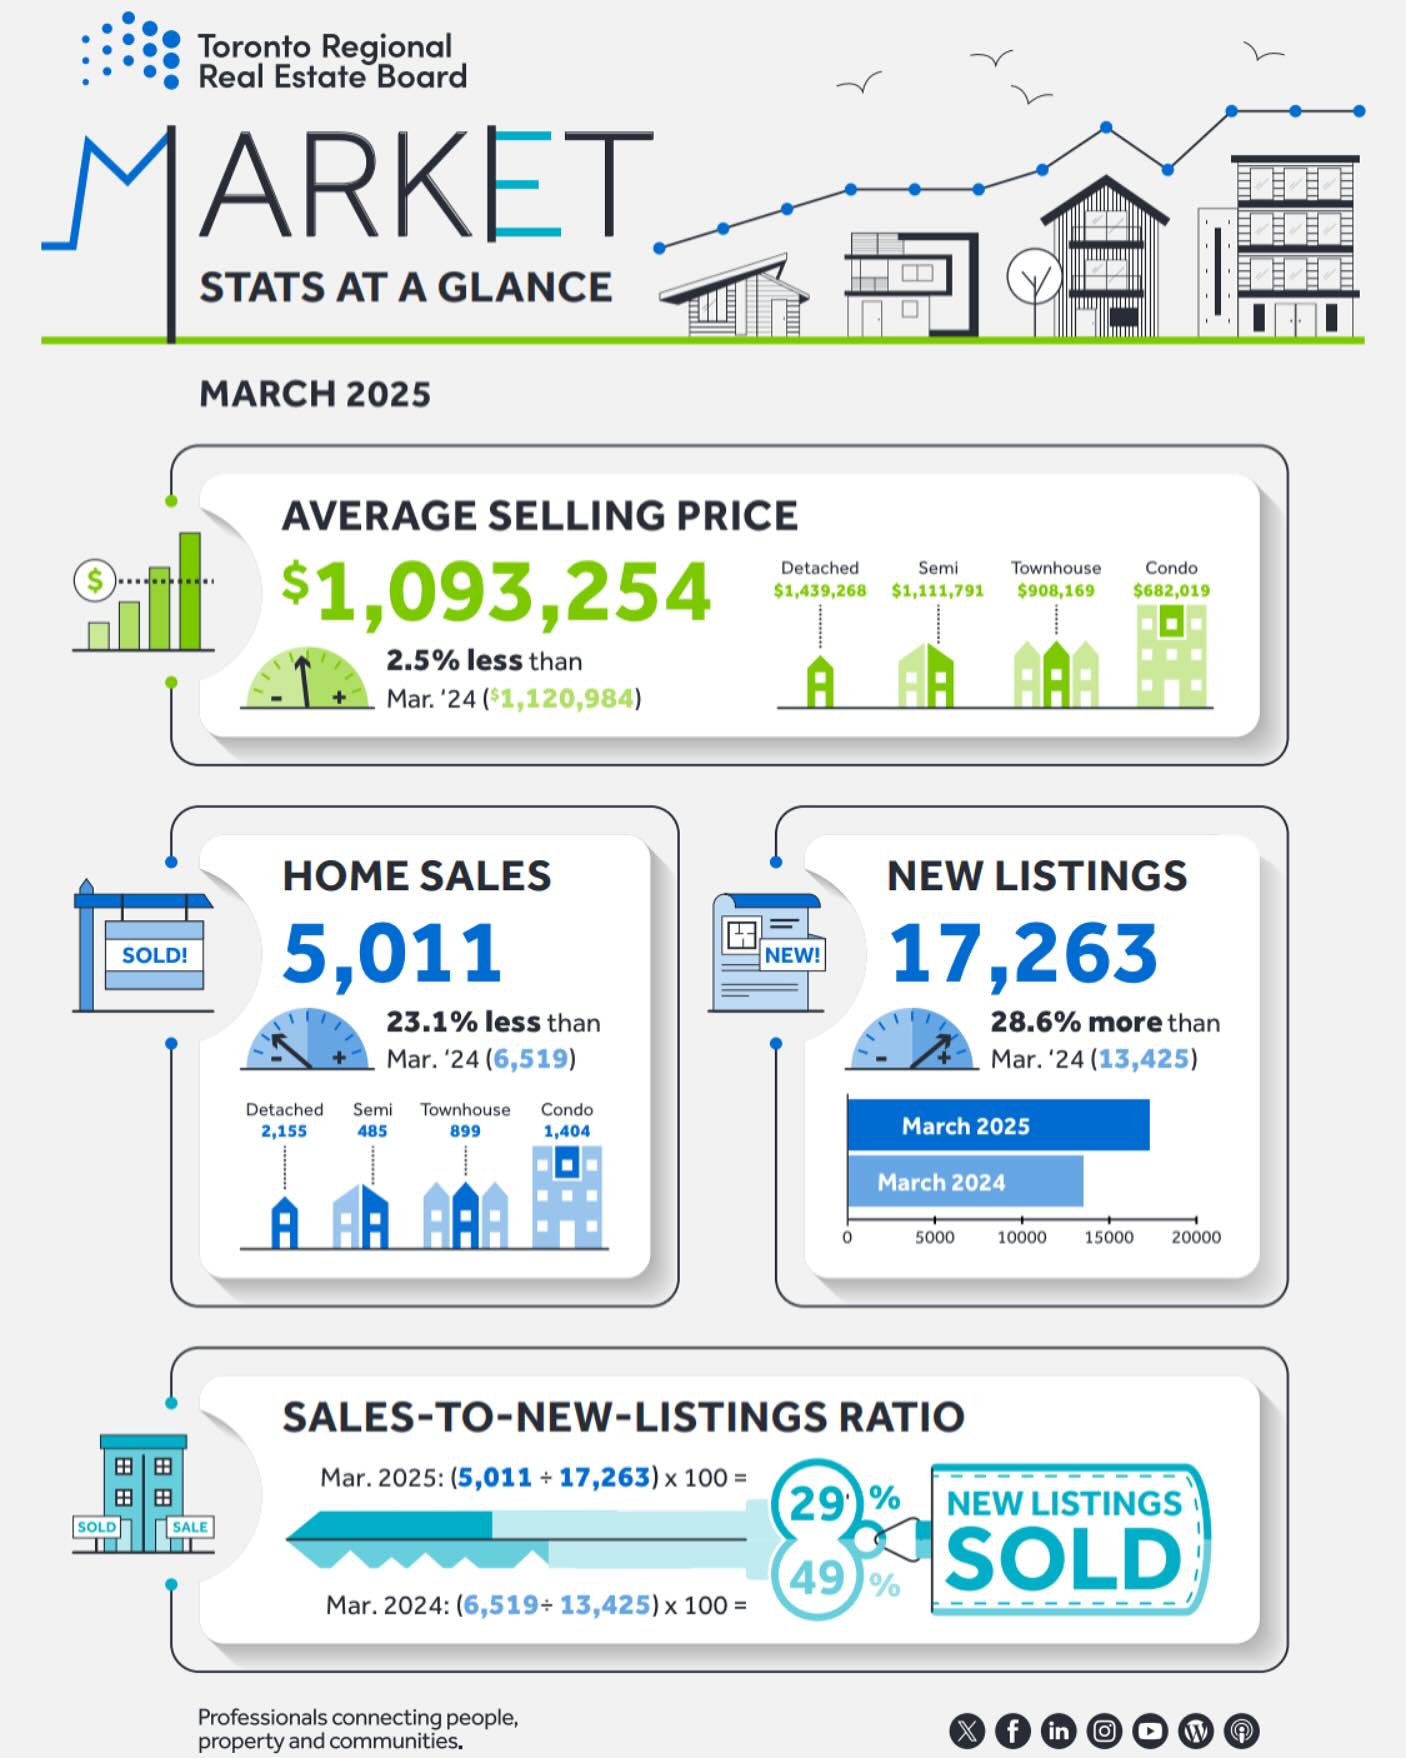
Toronto Regional Real Estate Board – Market Stats At A Glance – March 2025
Read the Toronto Regional Real Estate Board Market Watch Report
![]()
Township of Scugog Full Report
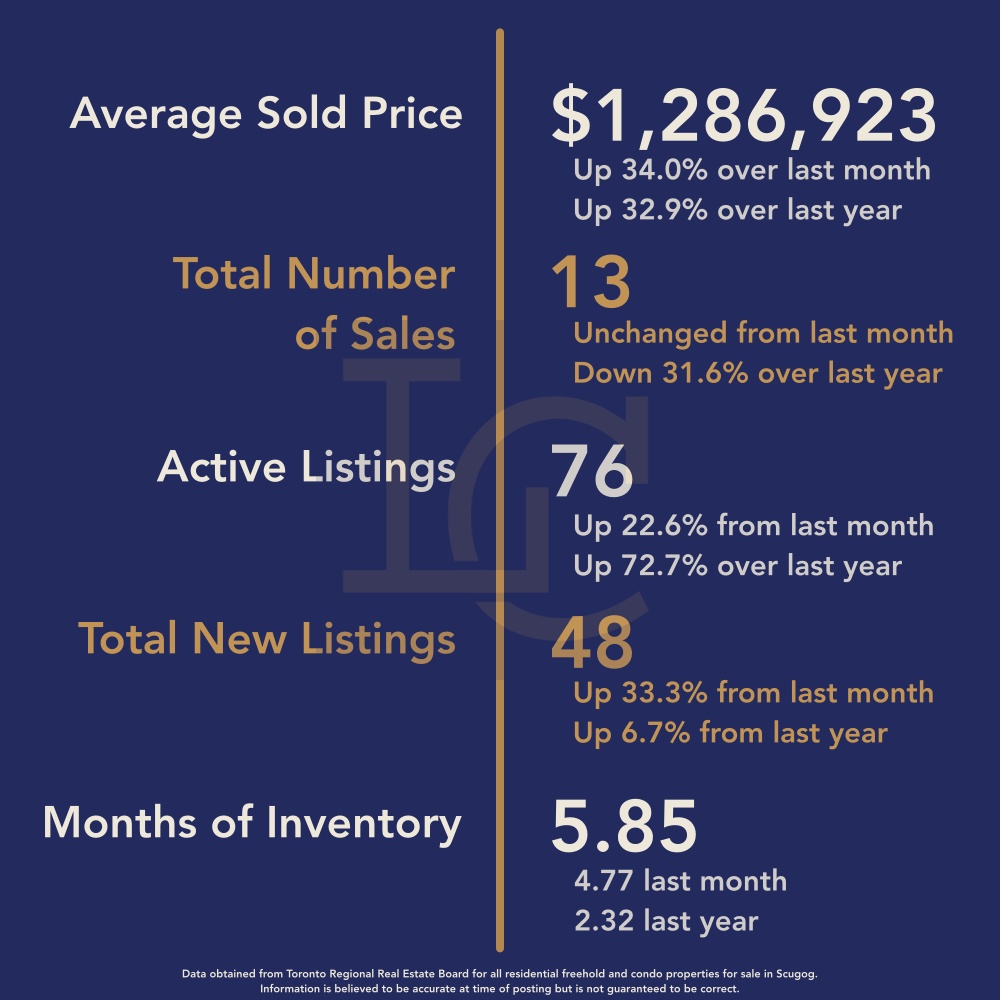
Scugog Township Real Estate Market Analysis – March 2025
The real estate market in Scugog Township experienced a noticeable price surge in March 2025, though deeper analysis reveals that the dramatic rise in average sales price was heavily skewed by a few high-value rural property transactions. While demand indicators such as time on market and listing activity showed signs of market vitality, underlying uncertainty due to external economic factors continues to cast a shadow over long-term trends.
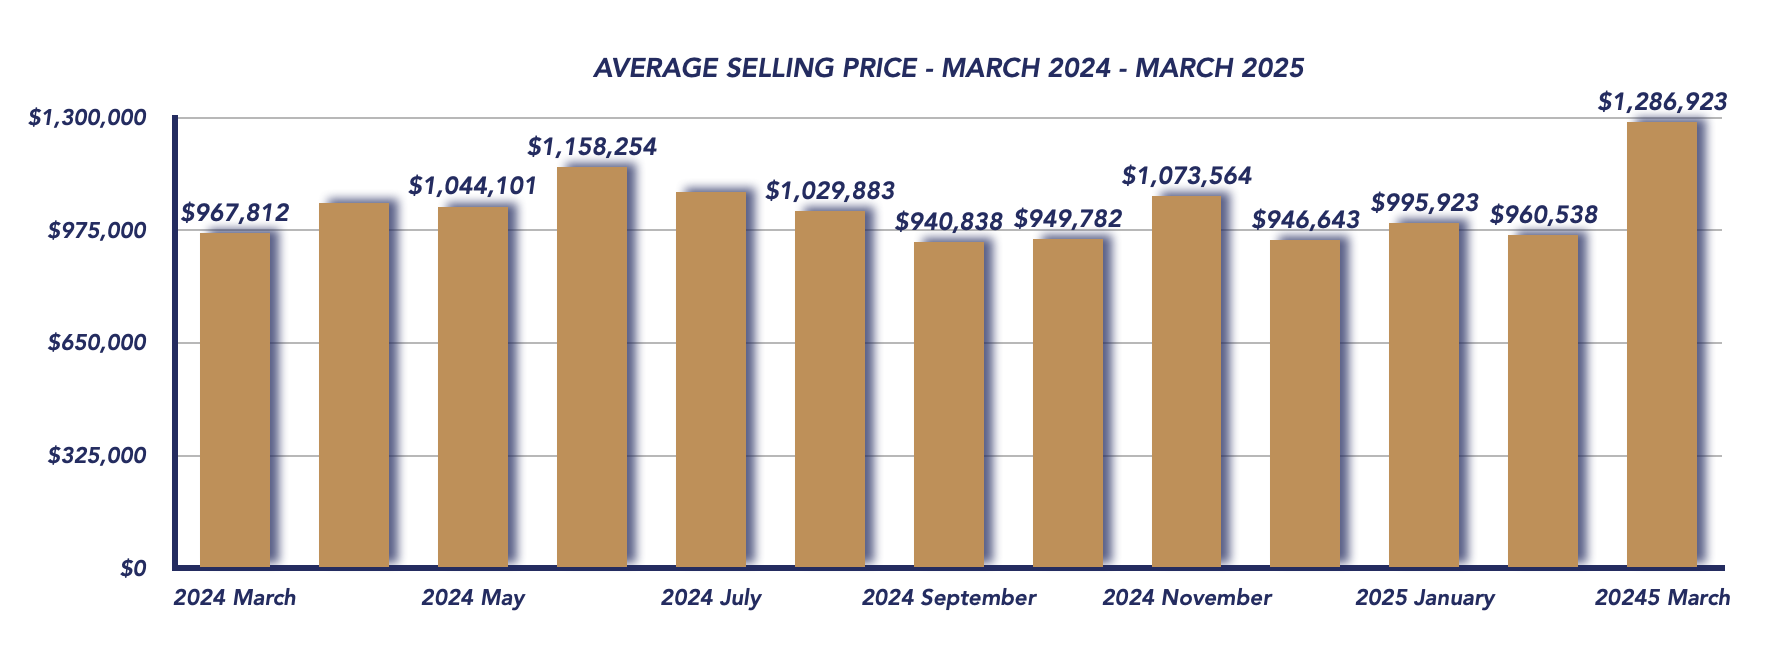
Price Trends: Average Sales Price Surge Driven by High-End Rural Sales
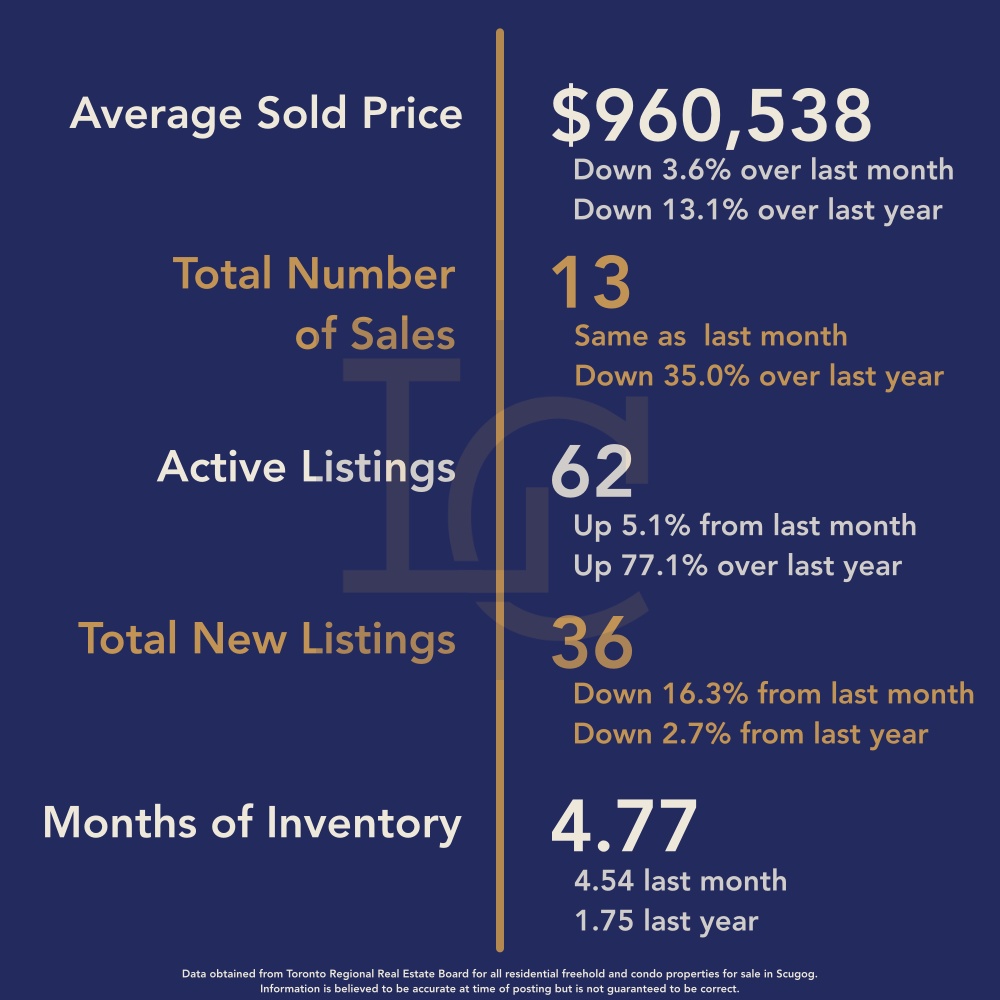
The average sales price jumped to $1,286,923, marking a 32.9% increase from March 2024 ($967,812) and a 34.0% increase from just last month ($960,538 in February 2025). However, this dramatic upswing is largely attributed to three high-priced rural sales at $1,630,000, $1,820,000, and $3,225,000, which significantly inflated the average. Without these outliers, the market would likely show a more stable pricing trend.
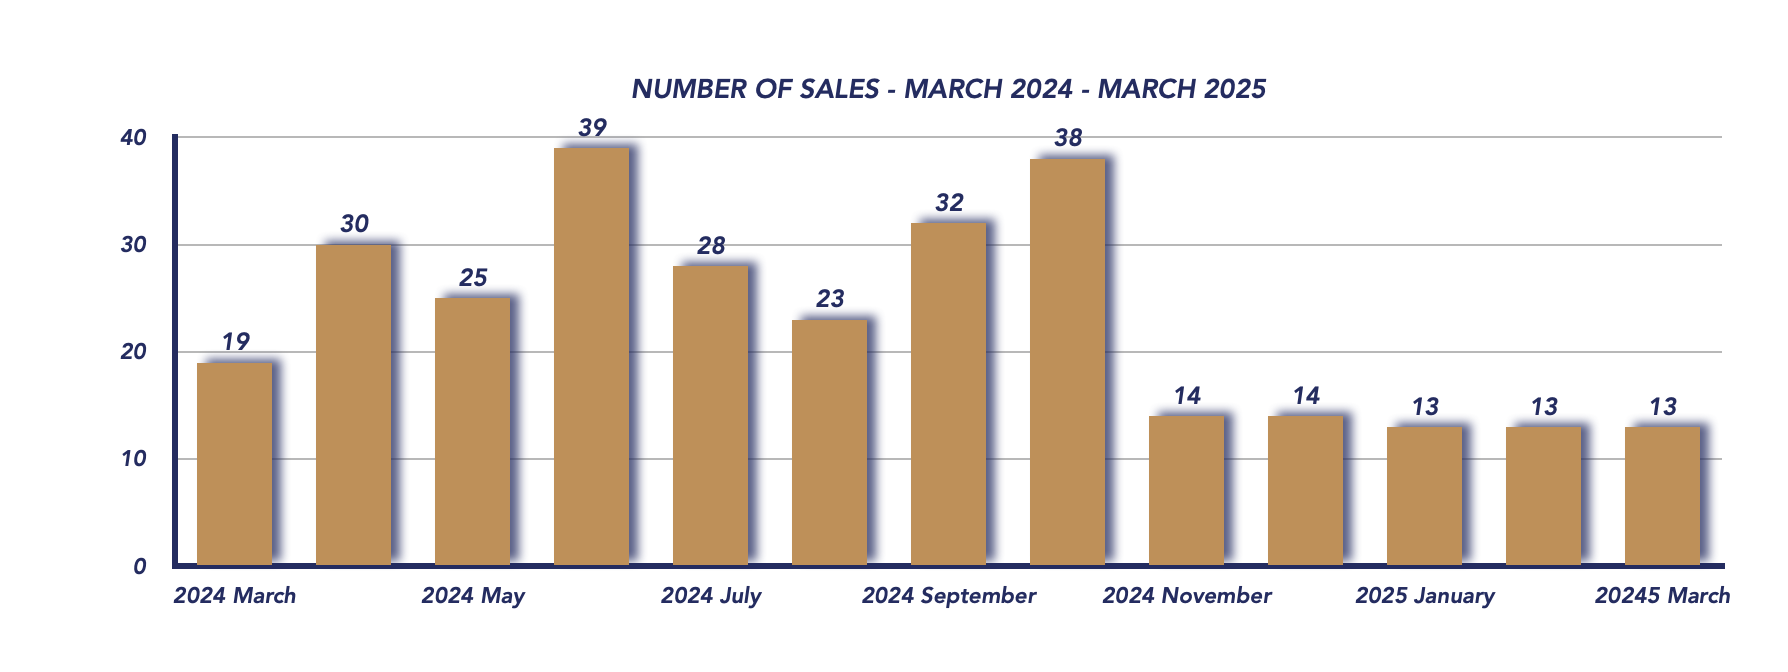
Sales Activity: Steady Volume but Below Last Year’s Levels
Sales volume remained flat month-over-month with 13 properties sold, mirroring February’s total, but still below the 19 sales in March 2024. This continued softening of sales activity reflects a moderation in buyer enthusiasm, despite the presence of premium sales that suggest there is still demand at the top end of the market.
Market Competitiveness: Slight Recovery in Seller Leverage
The sale-to-list price ratio improved modestly to 97%, up from 96% last month, indicating that buyers were slightly more willing to meet seller expectations. However, this is still short of the high-competition ratios seen in previous years, pointing to a market that’s gradually stabilizing.
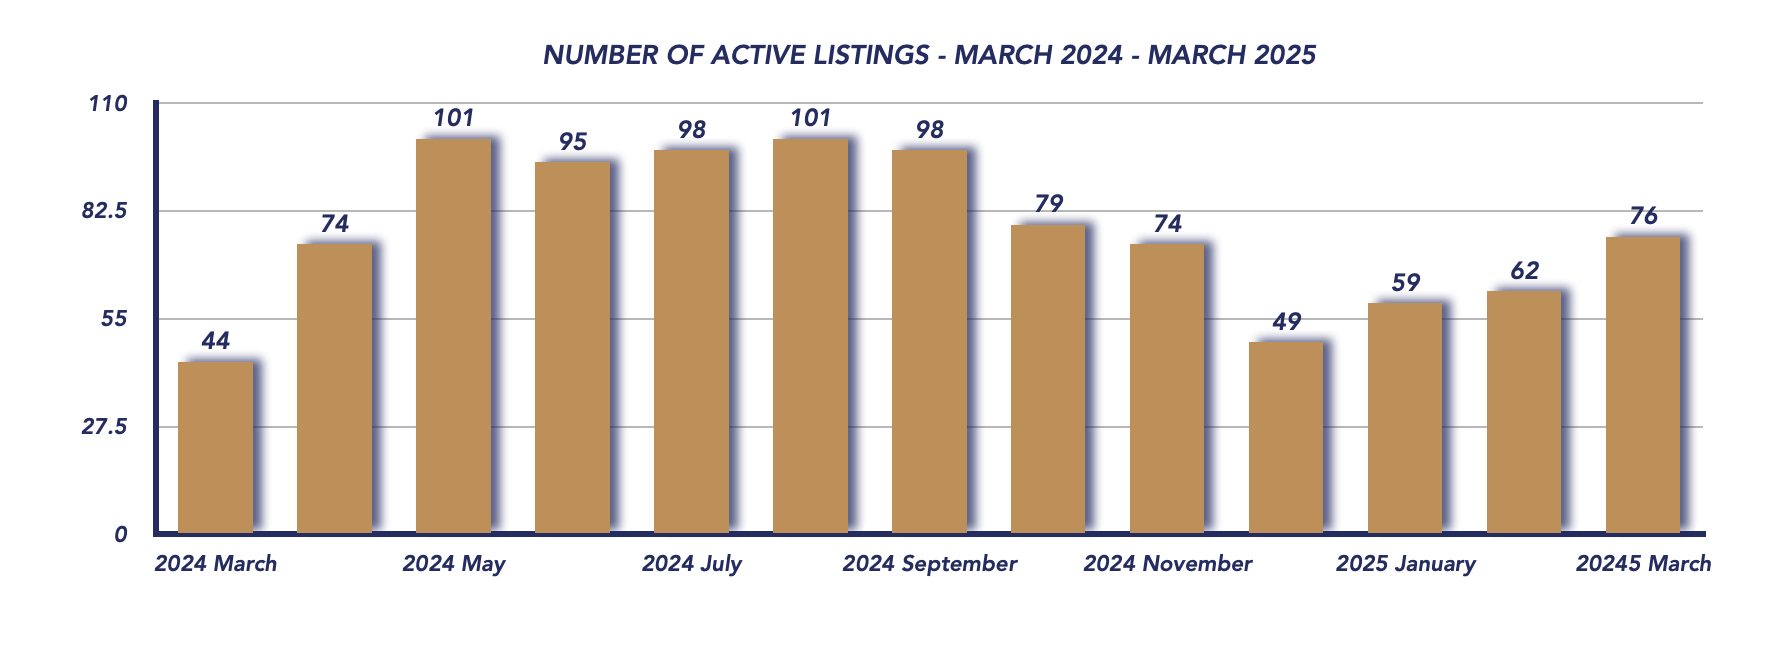
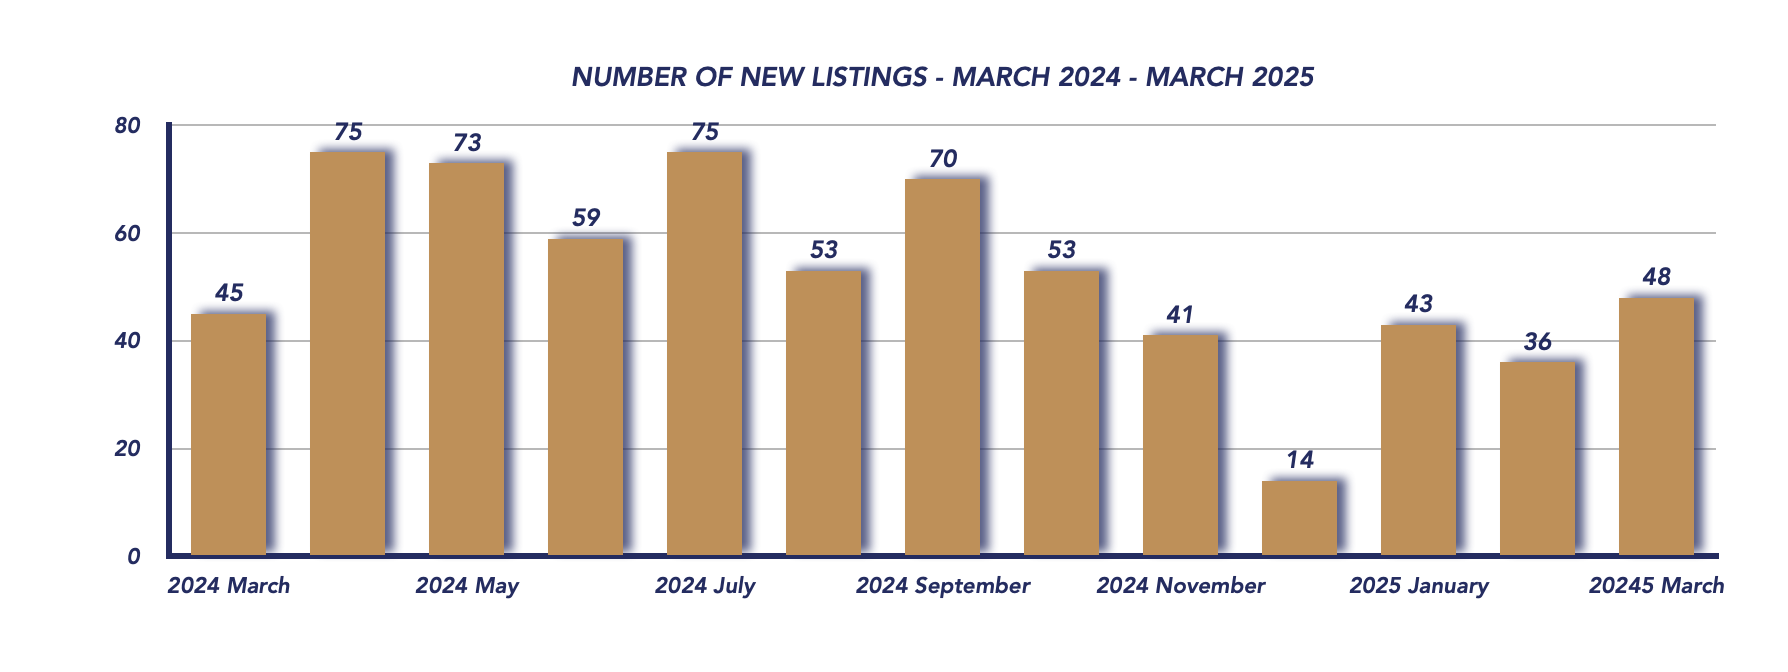
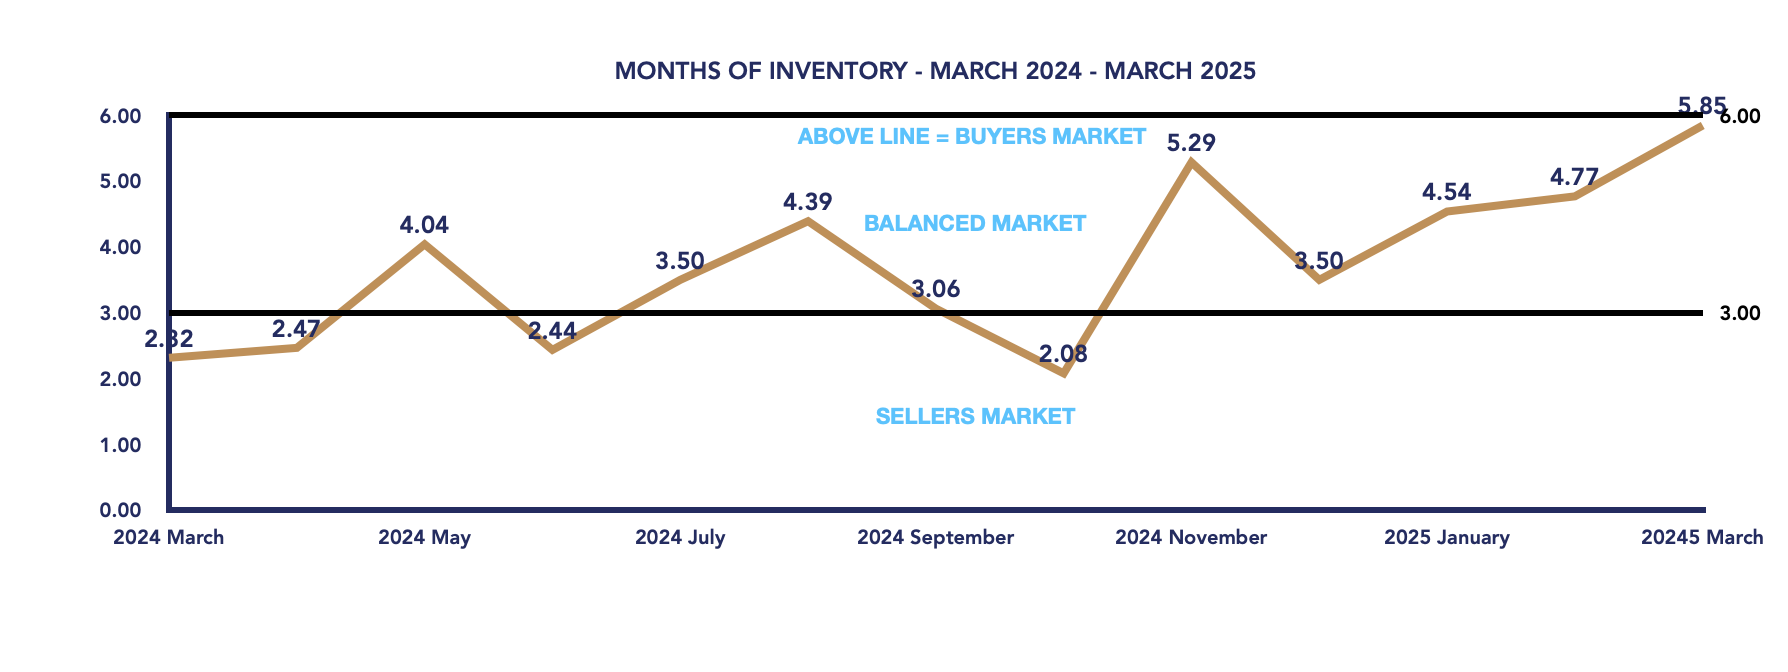
Inventory & Supply: Listings Rise as Months of Inventory Climbs
New listings rose to 48 in March, up from 36 in February and 45 in March 2024, signaling renewed confidence among sellers. Meanwhile, months of inventory increased to 5.85, up from 4.77 last month, nudging the market closer to a buyers market threshold while remaining technically balanced. This increase in available homes gives buyers more options and can moderate price pressures moving forward.
Time on Market: Homes Selling Faster
The average days on market dropped to 33 days, down from 52 in February, suggesting that well-priced properties—particularly in desirable segments—are moving more quickly. This may reflect urgency among buyers ahead of potential economic shifts or interest rate changes.
Market Outlook: Cautious Optimism Amid Economic Uncertainty
While March data points to a short-term spike in pricing and quicker sales, uncertainty looms over the market. Ongoing economic tensions due to the trade war, as well as geopolitical instability south of the border and Canada’s upcoming federal election, are creating hesitation among both buyers and sellers. These factors may lead to fluctuations in demand and pricing volatility in the months ahead.
Conclusion: Volatility Ahead Despite March Strength
Scugog Township’s real estate market showed unusual strength in March, but the sharp increase in average sales price is not reflective of overall market trends, having been distorted by a few high-end transactions. The balanced inventory level and improved days on market suggest underlying buyer interest, but external economic pressures could heavily influence activity in the second quarter of 2025. Caution is advised as the market navigates this uncertain landscape.
March 2025
February 2025
Average Sold Price
Number of Properties Sold
Active Listings
Number of New Listings
Months of Inventory
WATCH OUR MONDAY MARKET MINUTES

*Information is believed to be accurate at time of posting but is not guaranteed to be correct. Some values may vary slightly based on the exact date and time the reports were generated. Market stats are provided by TRREB (Toronto Regional Real Estate Board) and are based on sales for the month of Attached/Row/Townhouses, Condo Apartments, Condo Townhouses, Detached, Detached with Common Elements, Link Homes and Semi-detached. *Some values may vary slightly based on the exact date and time the reports were generated.
Not intended as a solicitation if your property is already listed by another broker. Affiliated real estate agents are independent contractor sales associates, not employees. ©2021 Coldwell Banker. All Rights Reserved. Coldwell Banker and the Coldwell Banker logos are trademarks of Coldwell Banker Real Estate LLC. The Coldwell Banker® System is comprised of company owned offices which are owned by a subsidiary of Realogy Brokerage Group LLC and franchised offices which are independently owned and operated. The Coldwell Banker System fully supports the principles of the Fair Housing Act and the Equal Opportunity Act.
Click below for more reports
Check out our Uxbridge and Scugog Events Pages to keep up to date on whats going on around town. Click the links or scan the Code with your phone to take you directly there.

UXBRIDGE EVENTS

SCUGOG EVENTS


