
 Facebook
 X
X
 Pinterest
 Copy Link

Durham Region Housing July 2025

Each office is independently owned and operated
![]()

![]()
Housing Market Report for July 2025
Here is the Region of Durham Housing July 2025 report (all housing types), with reports from the Canadian Real Estate Association, and Toronto Regional Real Estate Board included.
This housing report for Durham Region includes the number of new listings, average list price, number of properties sold, average selling price, average days on market and average asking price to selling price ratio for all property types within the Region of Durham.
Scroll to the bottom for links to take you to the housing market reports for Uxbridge, Scugog and Brock.
![]()
![]()
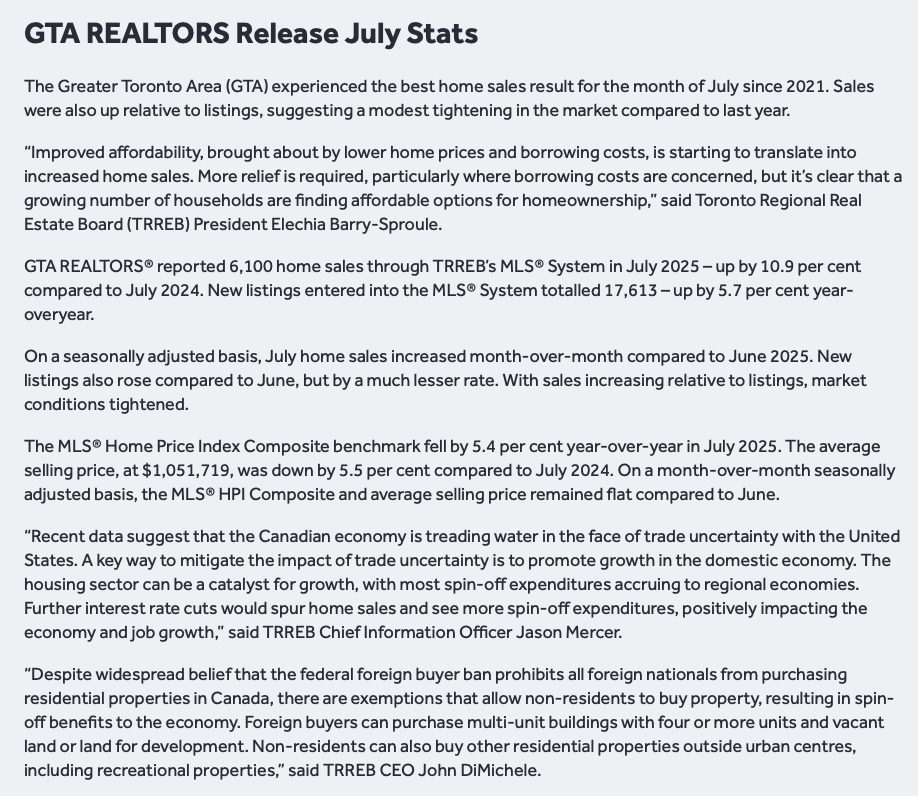
From Toronto Regional Real Estate Board
Please note: The PropTx MLS® System, of which TRREB is a part, has added a number of new client boards over the last year. Many of these boards’ Members trade within the Greater Toronto Area and broader Greater Golden Horseshoe regions. As a result, historic data have been updated to reflect the addition of these boards’ listings and transactions. This means historic data have changed relative to previously published static reports. To view updated historic data, click here.
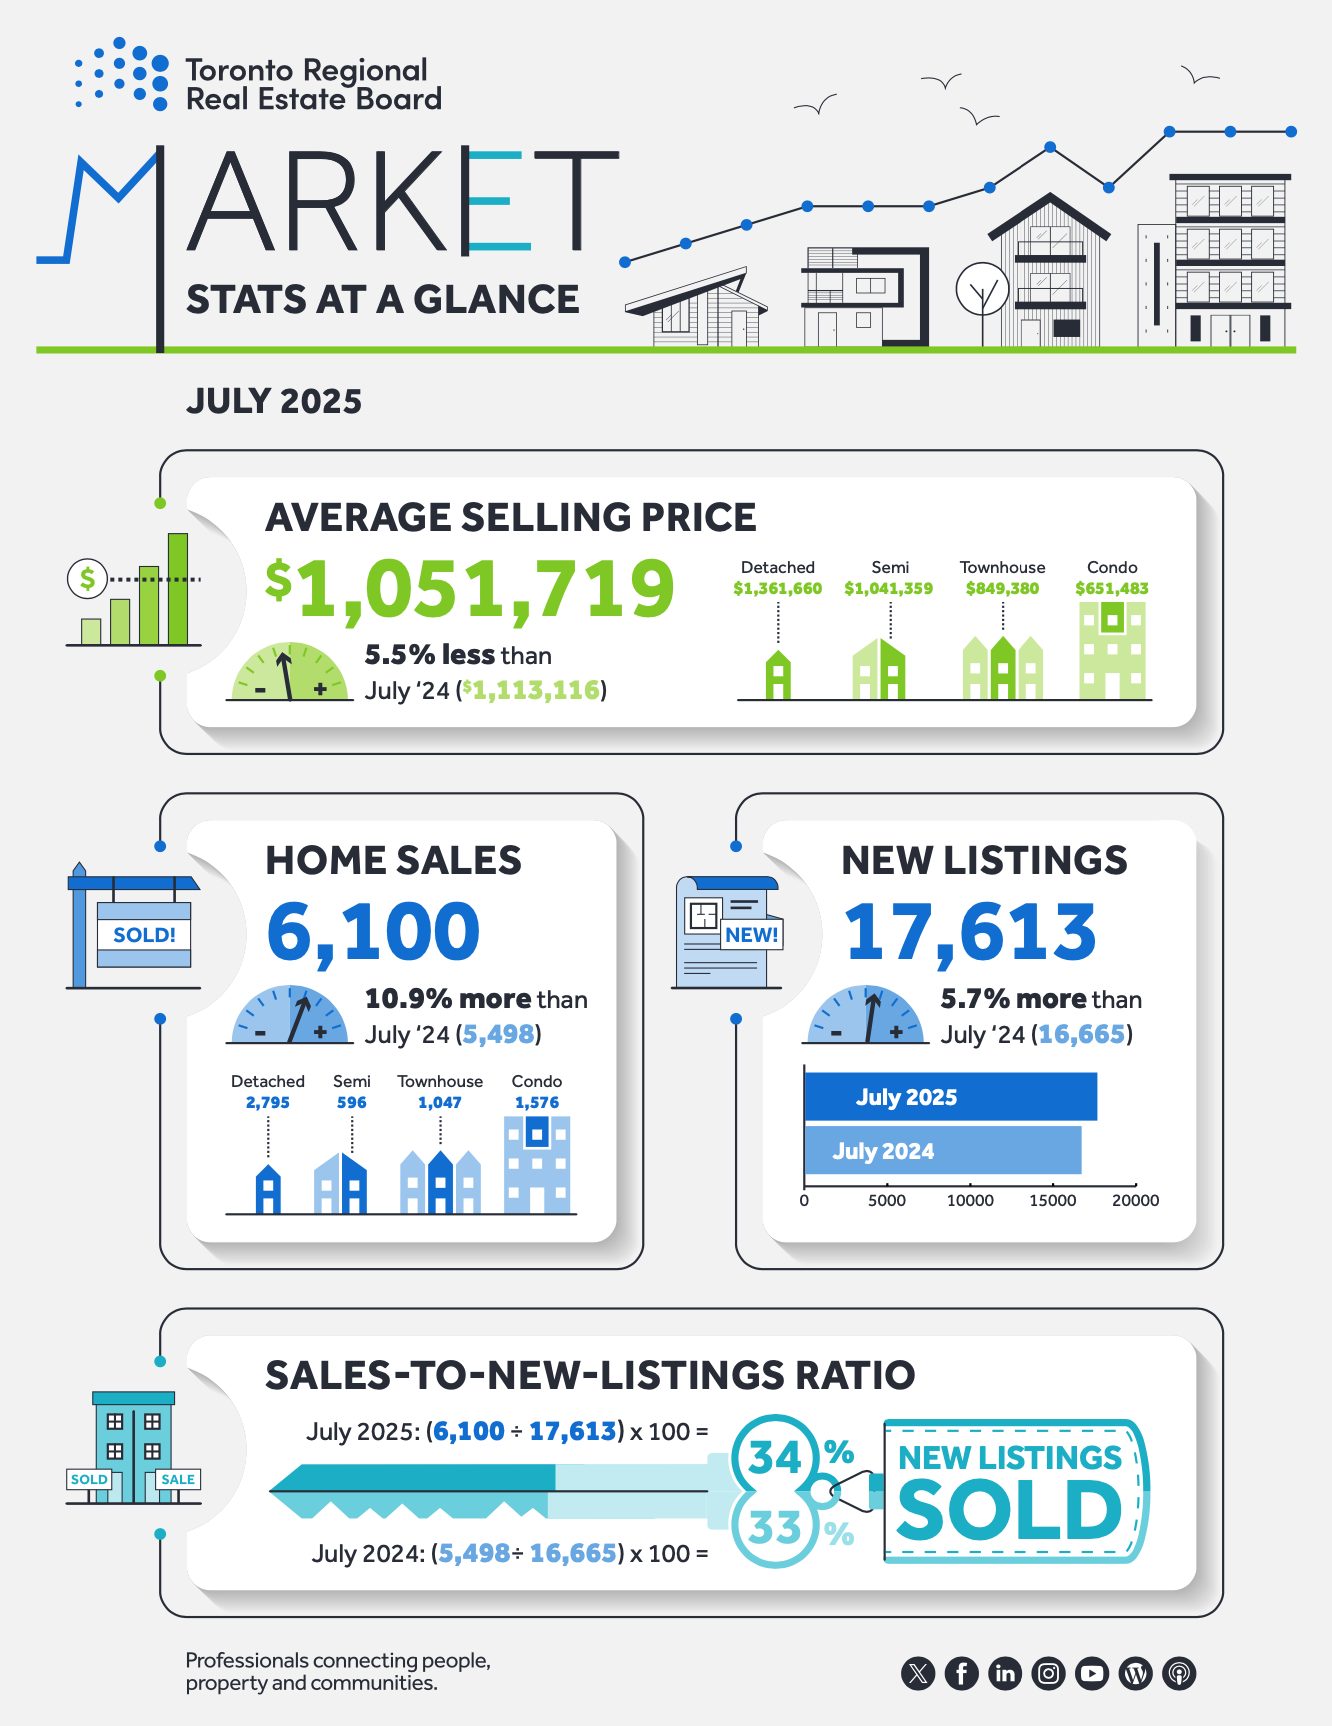
Toronto Regional Real Estate Board – Market Stats At A Glance – July 2025
Read the Toronto Regional Real Estate Board Market Watch Report
![]()
Durham Region Real Estate Market Analysis – July 2025
The Durham Region housing market in July 2025 showed a mix of cooling prices and improving sales activity, hinting at subtle shifts in market momentum. While home values continued their gradual decline, this month marked the first year-over-year increase in sales since May 2024—suggesting buyer confidence may be creeping back despite ongoing affordability challenges.
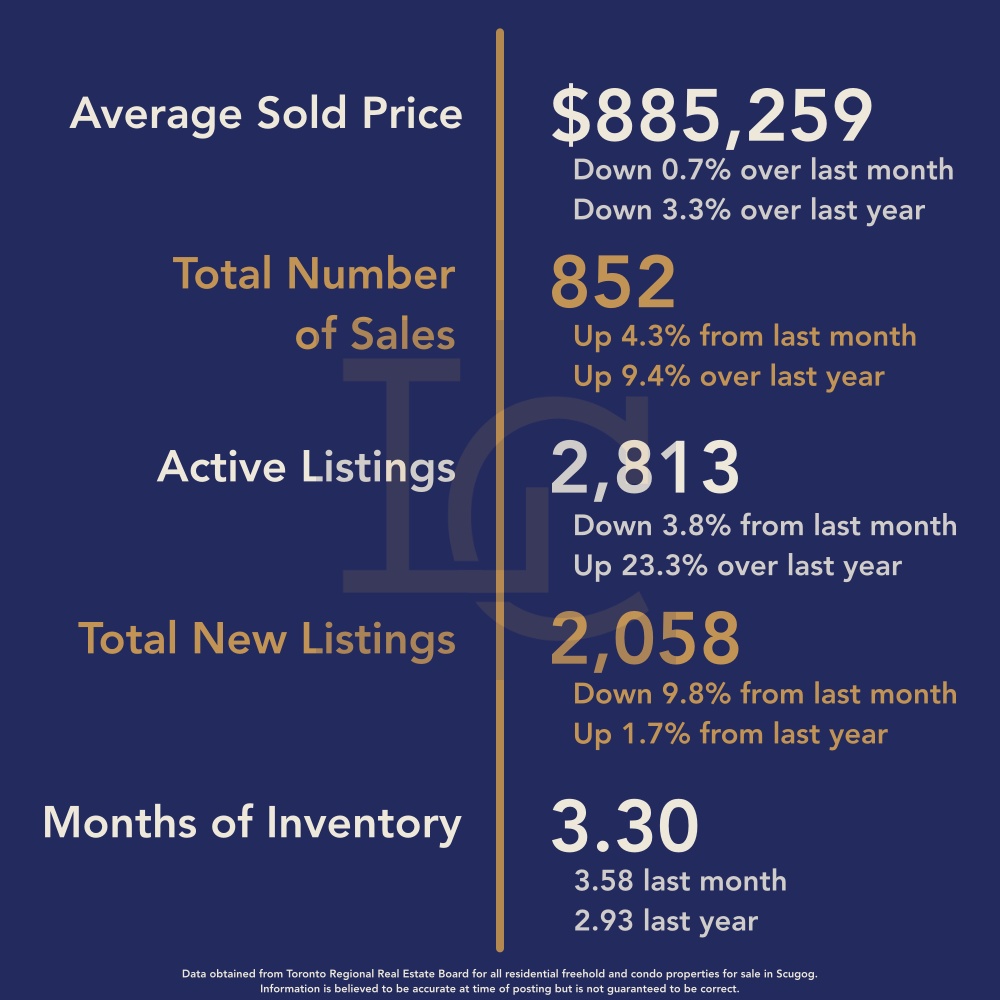
July 2025
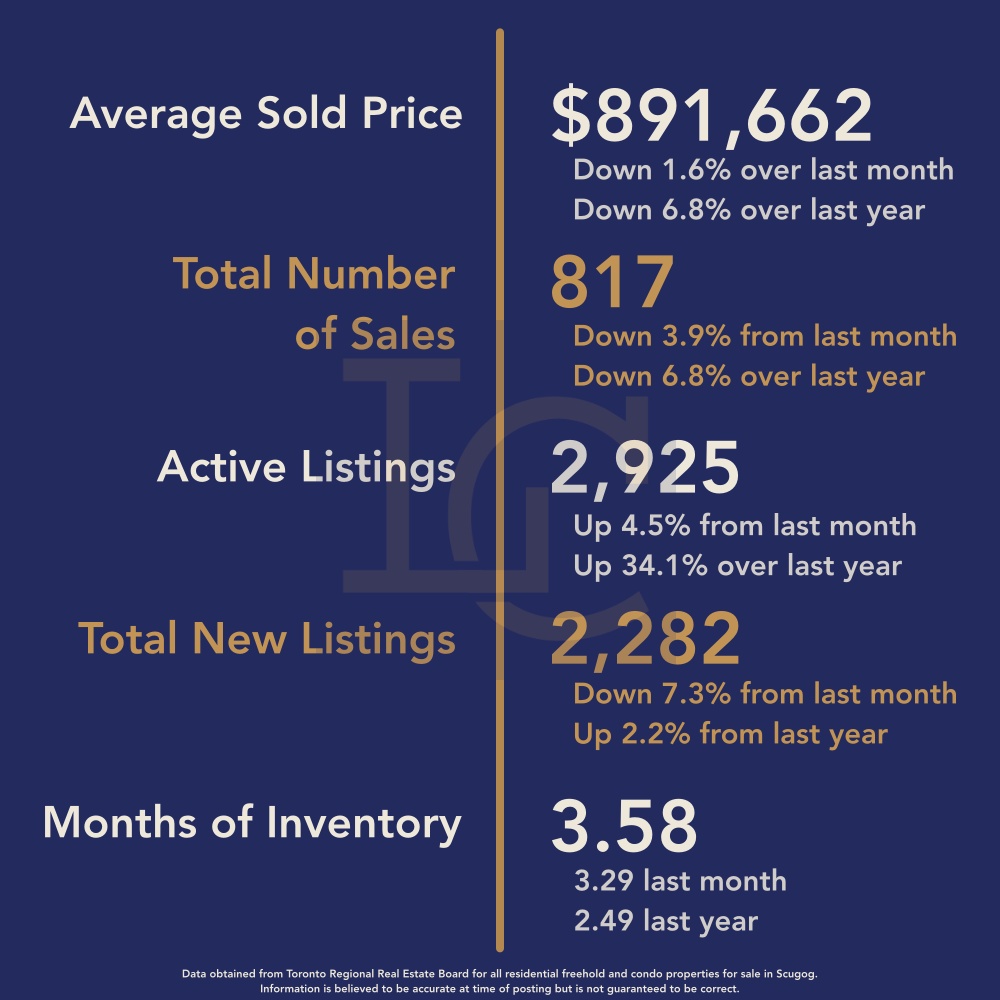
June 2025
📉 Average Home Price Continues to Ease
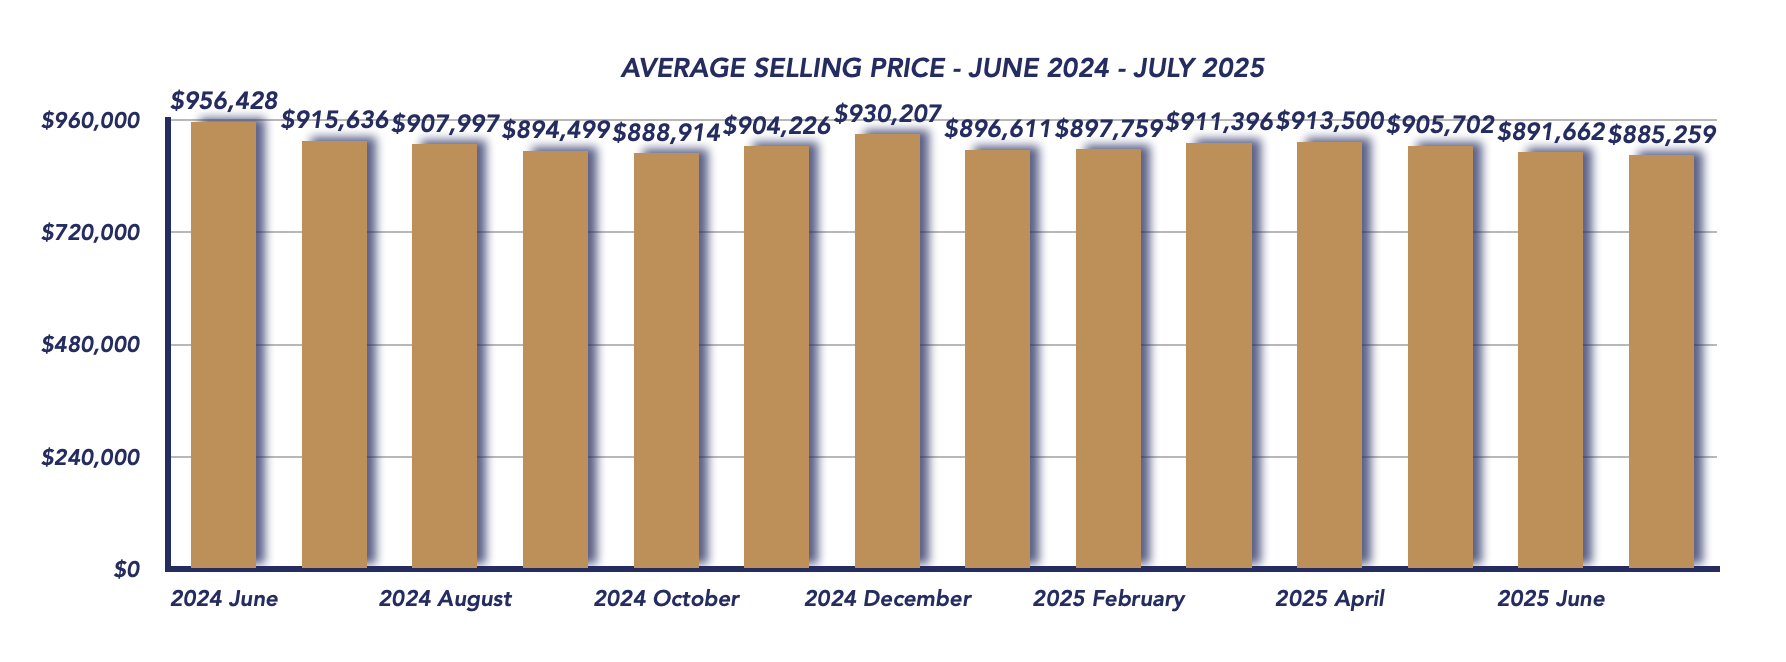
The average sales price fell to $885,259 in July, down 0.7% from June’s $891,662 and 3.3% lower than July 2024’s $915,636. This steady softening in prices reflects a market still working toward balance, as buyers remain cautious and selective in their purchases.
📊 Sales Activity Sees a Positive Turn
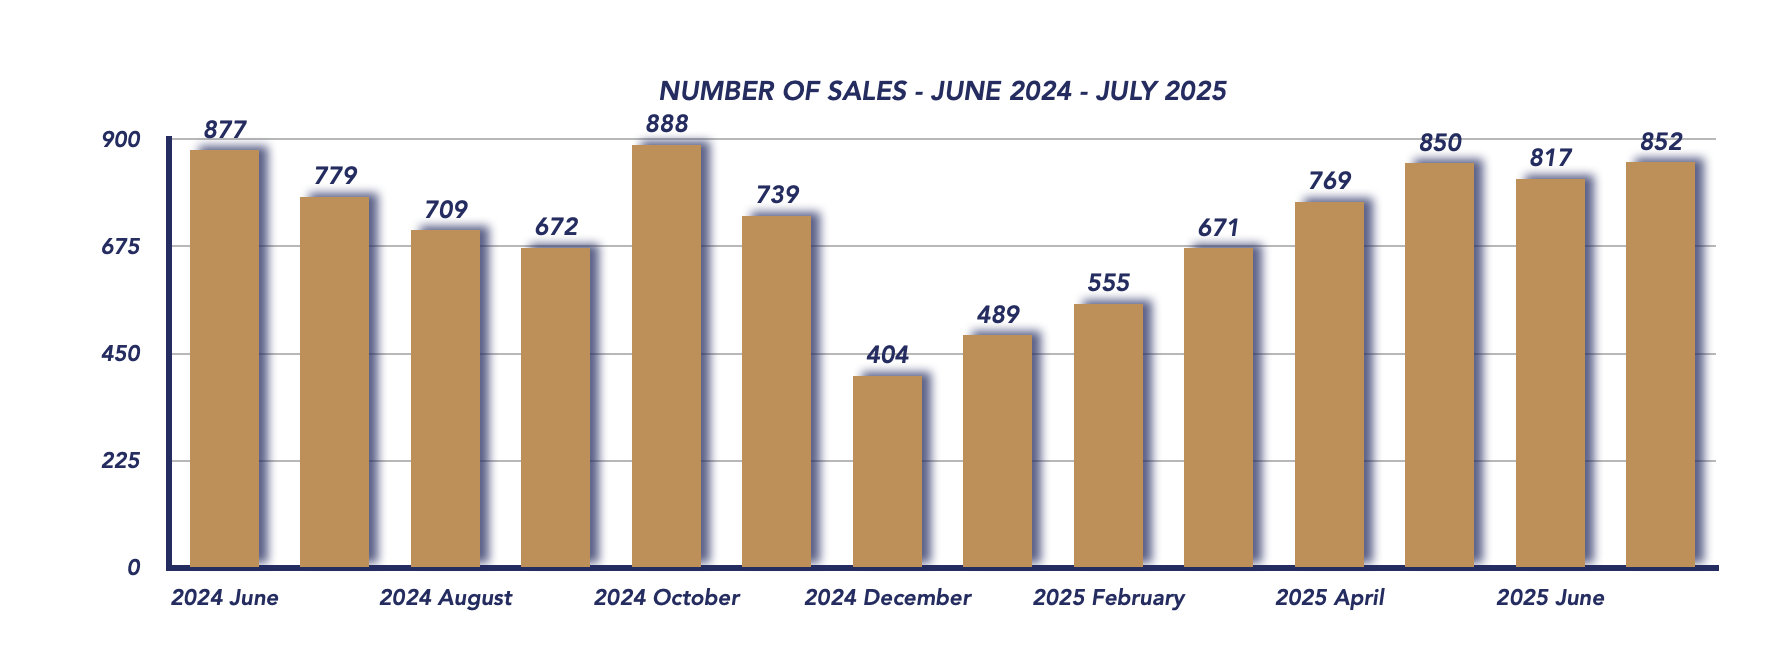
July recorded 852 sales, up from 817 in June and 779 in July 2024. This marks the first year-over-year sales increase since May 2024, a sign that some buyers are re-entering the market—possibly encouraged by greater inventory and a slight pullback in prices.
📉 Sale-to-List Price Ratio Slips Below 100%
The sale-to-list price ratio dipped to 99%, down from 100% last month and the first time below 100% since January 2024. This indicates that sellers are now, on average, accepting offers below asking price—a notable shift from the bidding war climate of recent years.
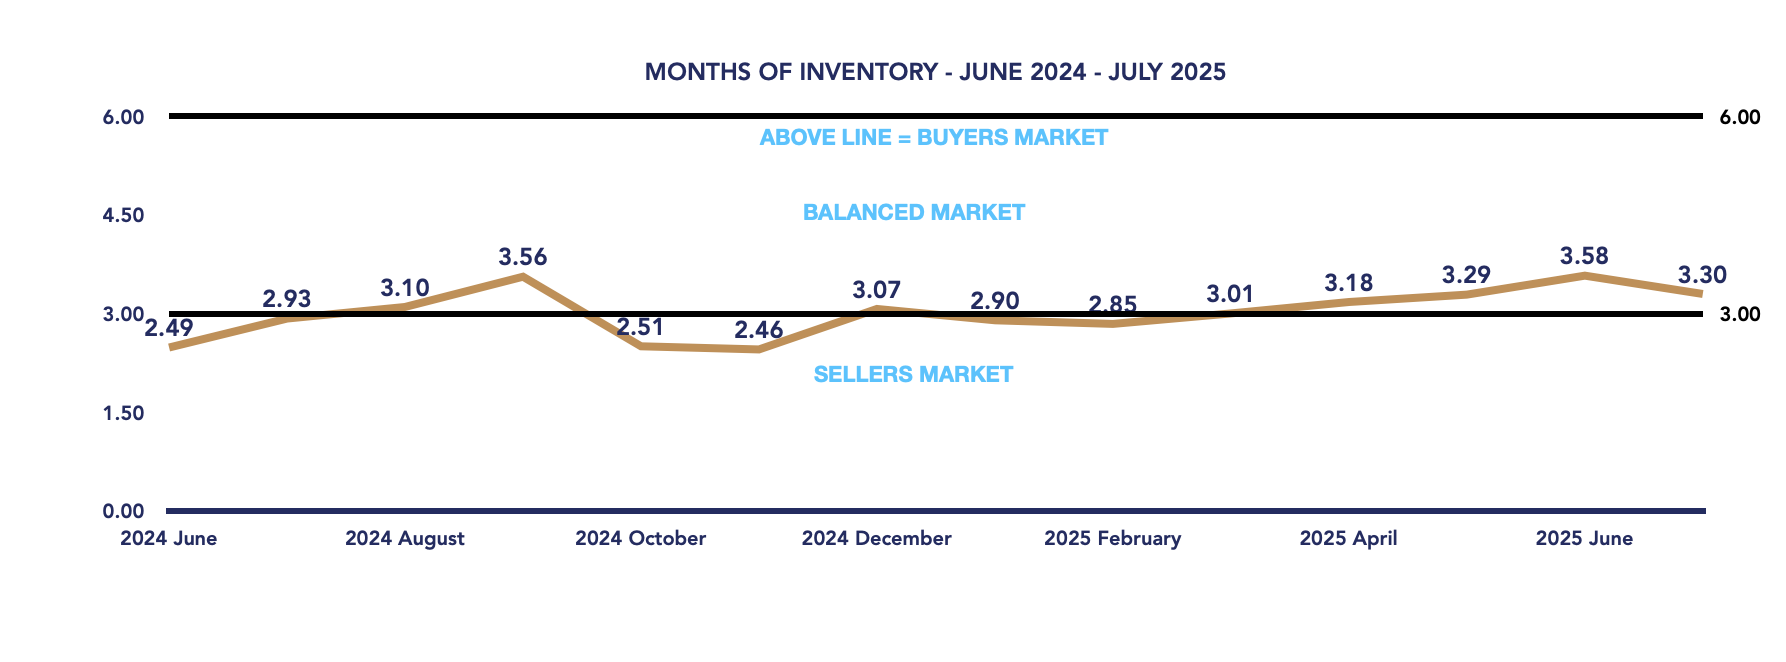
📈 Inventory Levels Adjust Slightly
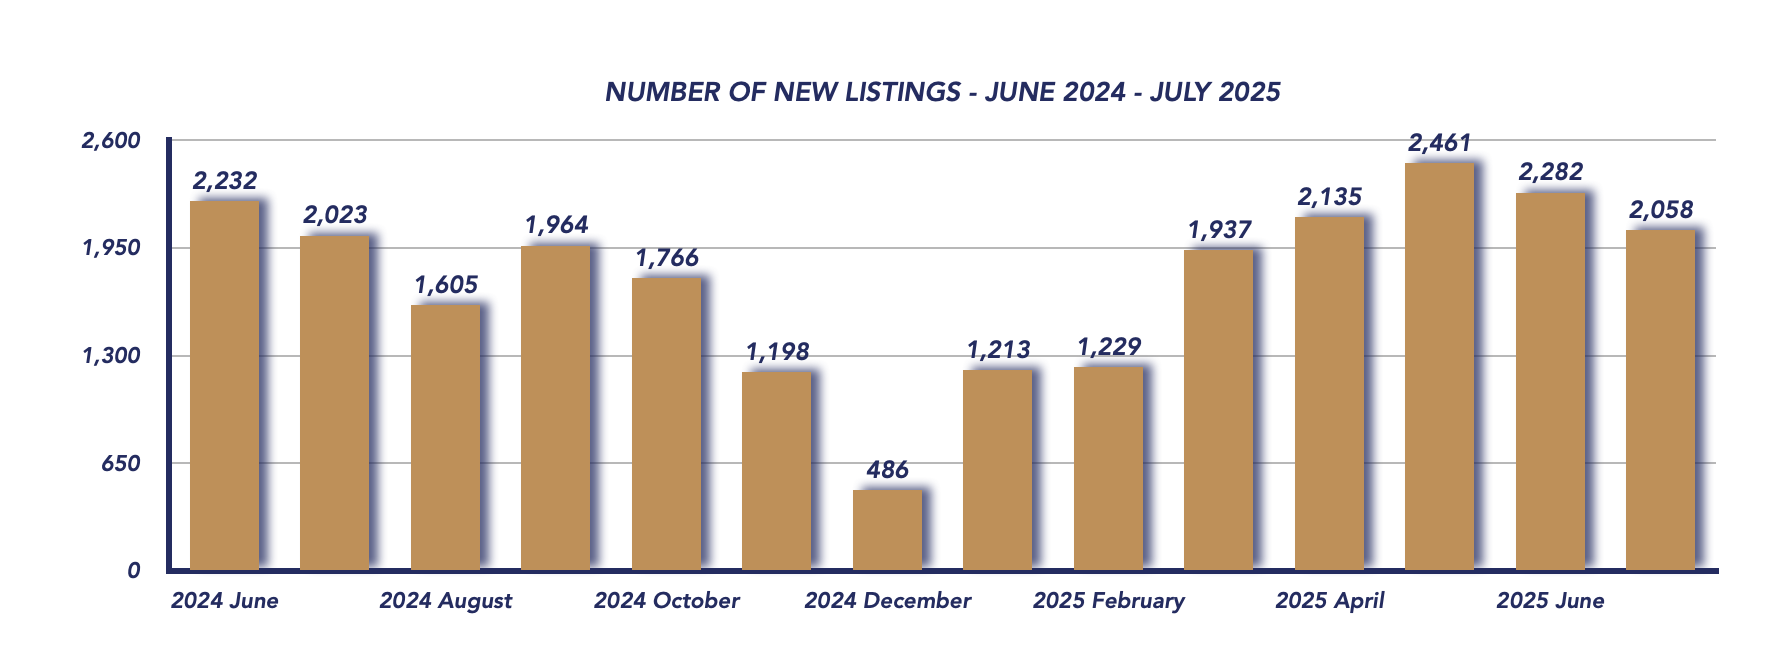
New listings came in at 2,058, slightly below June’s 2,282 but almost identical to July 2024’s 2,023. The months of inventory dipped to 3.30 from 3.58, keeping the market right at the edge of a balanced state. This marginal change suggests that buyer demand is just strong enough to offset the available supply.
⏳ Homes Taking Longer to Sell
The average days on market rose to 39 days, up from 34 in June, showing that buyers are taking their time to evaluate options. Sellers may need to remain flexible with pricing and negotiation to secure offers in this slower-moving environment.
Conclusion
July 2025’s Durham Region housing market delivered a mixed message: prices are still edging down, but sales activity is picking up—breaking a year-long streak of annual declines. The dip in the sale-to-list price ratio below 100% is significant, as it signals a shift toward a buyer-friendly market where negotiations are more common.
If this sales momentum continues into late summer, we could see more stability in pricing heading into the fall. However, with homes taking longer to sell and buyers holding more negotiating power, sellers will need to adapt their strategies to stay competitive.
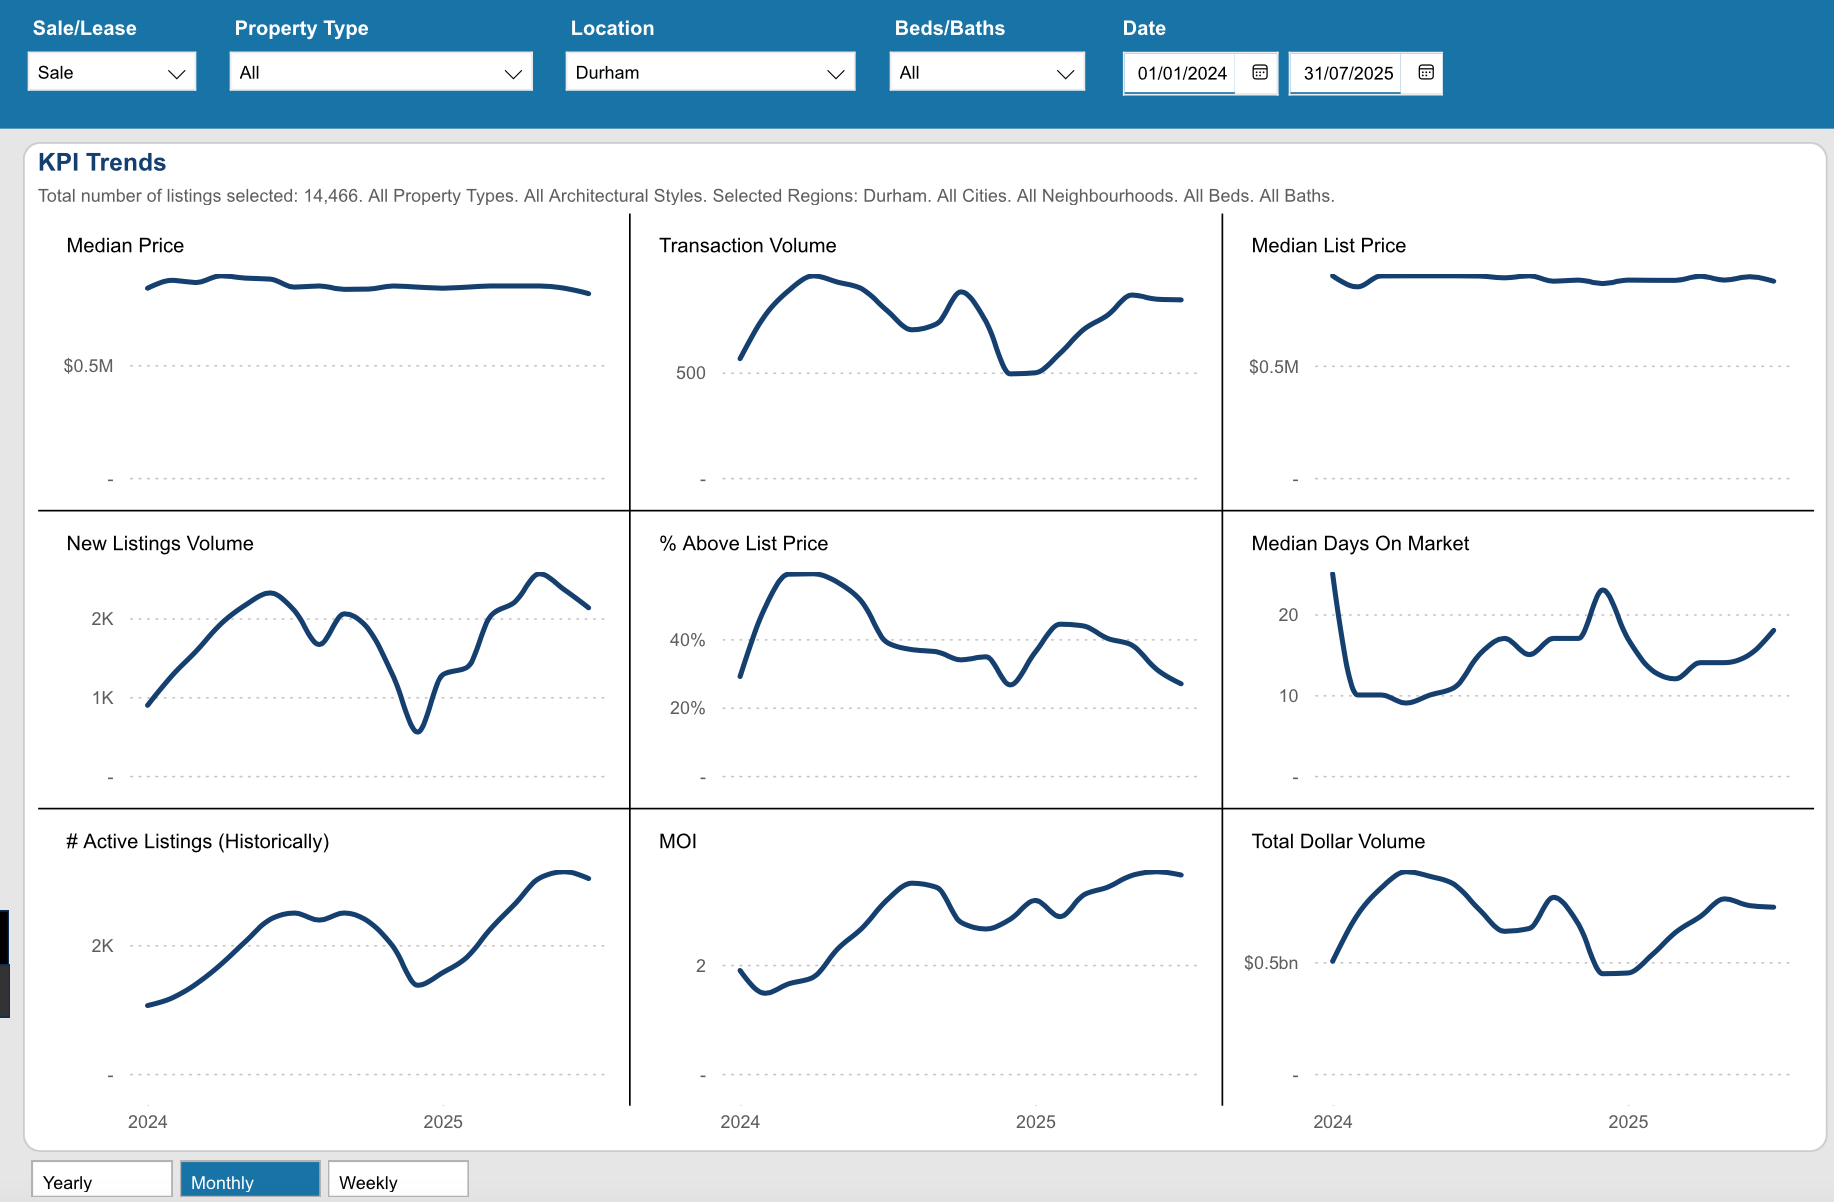
Key Performance Indicators (KPIs) from January 2024 through July 2025 provide a clear snapshot of how the Durham Region real estate market has evolved across all property types, architectural styles, and home configurations.
*Information is believed to be accurate at time of posting but is not guaranteed to be correct. Some values may vary slightly based on the exact date and time the reports were generated. Market stats are provided by TRREB (Toronto Regional Real Estate Board) and are based on sales for the month of Attached/Row/Townhouses, Condo Apartments, Condo Townhouses, Detached, Detached with Common Elements, Link Homes and Semi-detached. *Some values may vary slightly based on the exact date and time the reports were generated.
Not intended as a solicitation if your property is already listed by another broker. Affiliated real estate agents are independent contractor sales associates, not employees. ©2021 Coldwell Banker. All Rights Reserved. Coldwell Banker and the Coldwell Banker logos are trademarks of Coldwell Banker Real Estate LLC. The Coldwell Banker® System is comprised of company owned offices which are owned by a subsidiary of Realogy Brokerage Group LLC and franchised offices which are independently owned and operated. The Coldwell Banker System fully supports the principles of the Fair Housing Act and the Equal Opportunity Act.
Click below for more reports
Check out our Uxbridge and Scugog Events Pages to keep up to date on whats going on around town. Click the links or scan the Code with your phone to take you directly there.

UXBRIDGE EVENTS

SCUGOG EVENTS


