
 Facebook
 X
X
 Pinterest
 Copy Link

Durham Region Housing October 2025

Each office is independently owned and operated
![]()

![]()
Housing Market Report for October 2025
Here is the Region of Durham Housing October 2025 report (all housing types), with reports from the Canadian Real Estate Association, and Toronto Regional Real Estate Board included.
This housing report for Durham Region includes the number of new listings, average list price, number of properties sold, average selling price, average days on market and average asking price to selling price ratio for all property types within the Region of Durham.
Scroll to the bottom for links to take you to the housing market reports for Uxbridge, Scugog and Brock.
![]()
![]()

From Toronto Regional Real Estate Board
Please note: The PropTx MLS® System, of which TRREB is a part, has added a number of new client boards over the last year. Many of these boards’ Members trade within the Greater Toronto Area and broader Greater Golden Horseshoe regions. As a result, historic data have been updated to reflect the addition of these boards’ listings and transactions. This means historic data have changed relative to previously published static reports. To view updated historic data, click here.
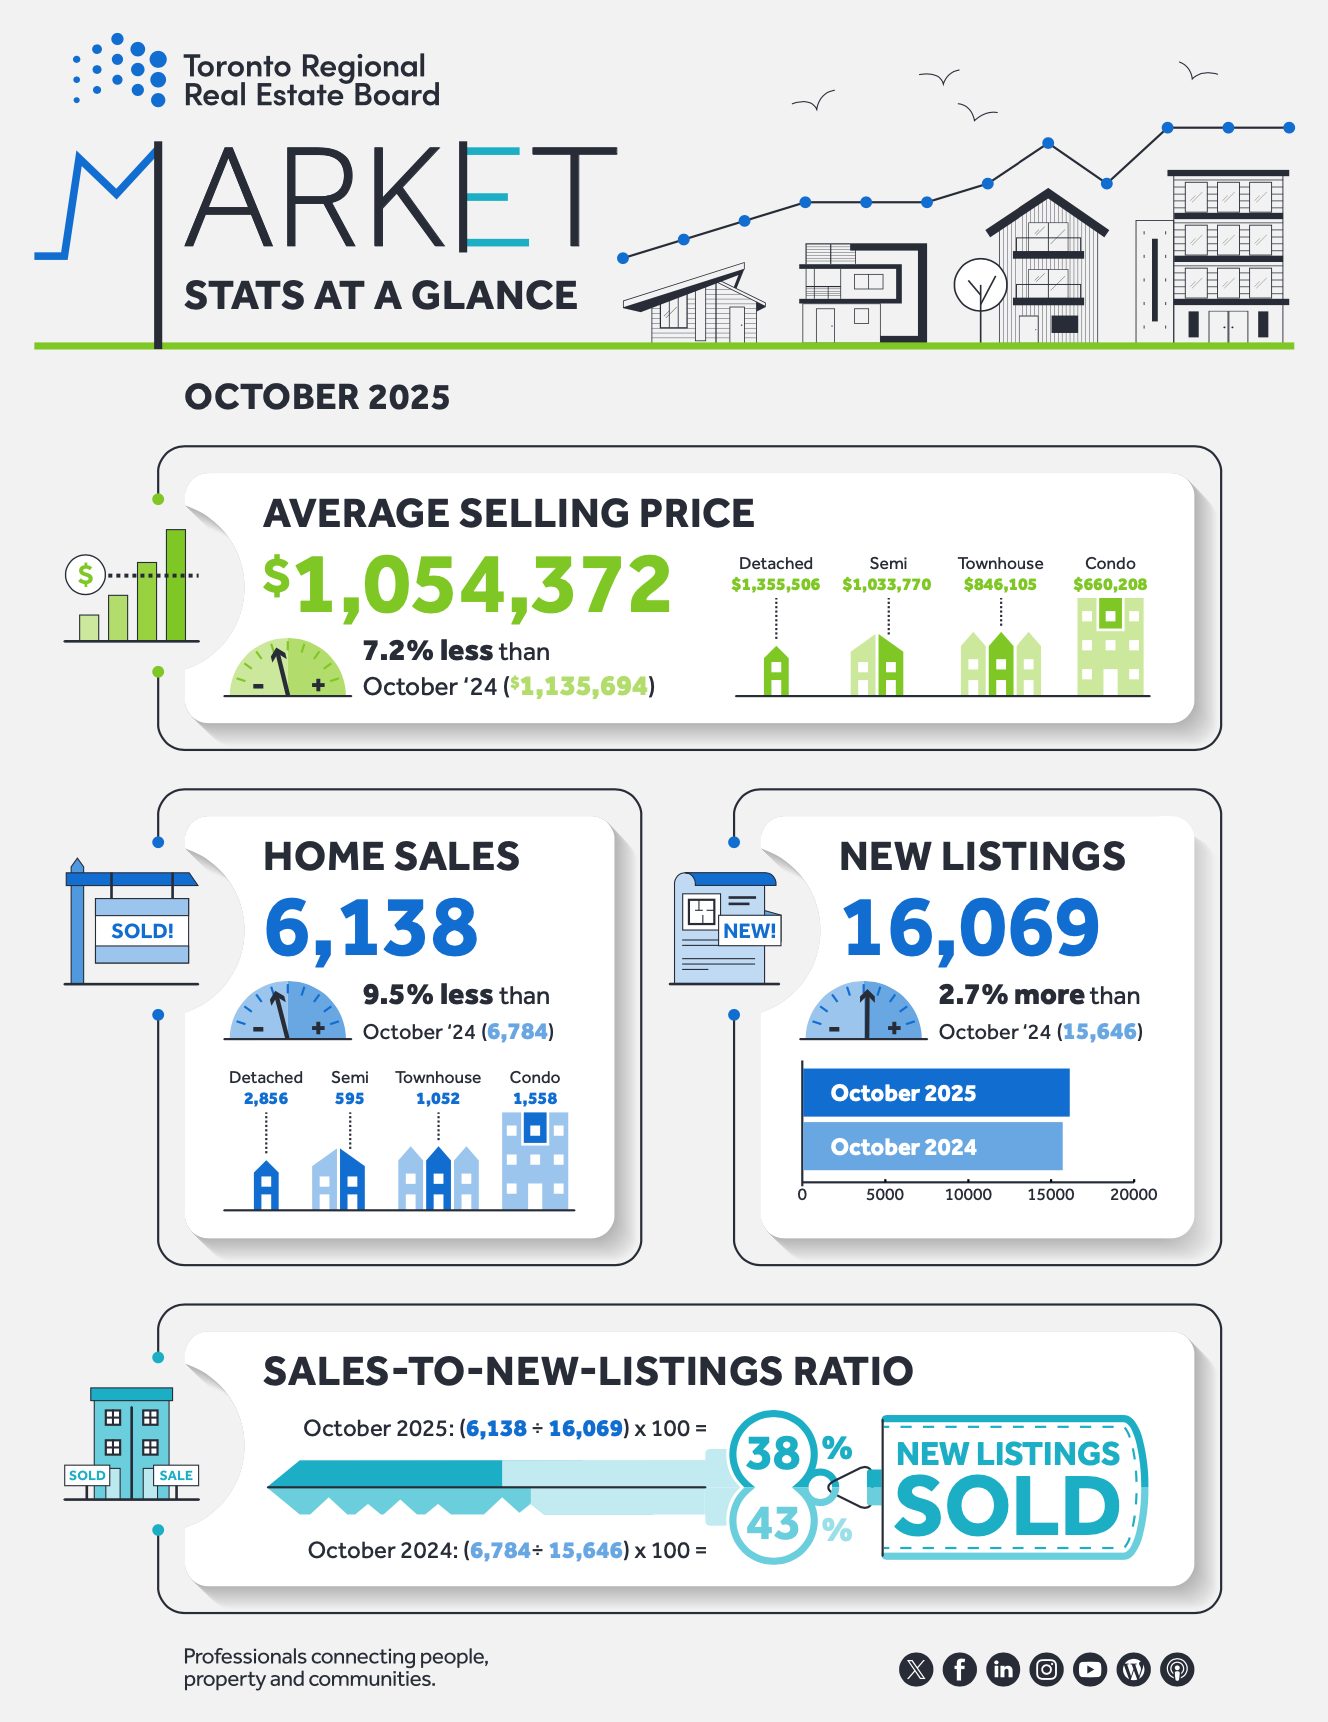
Toronto Regional Real Estate Board – Market Stats At A Glance – October 2025
Read the Toronto Regional Real Estate Board Market Watch Report
![]()
Durham Region Real Estate Market Analysis – October 2025
Durham Region Real Estate Finds its Balance
The Durham Region real estate market continued to demonstrate balance in October 2025, with sales activity holding steady, inventory levels tightening slightly, and prices edging lower. While year-over-year figures remain down, the market is showing signs of resilience as both buyers and sellers adjust to shifting conditions and seasonal slowdowns.
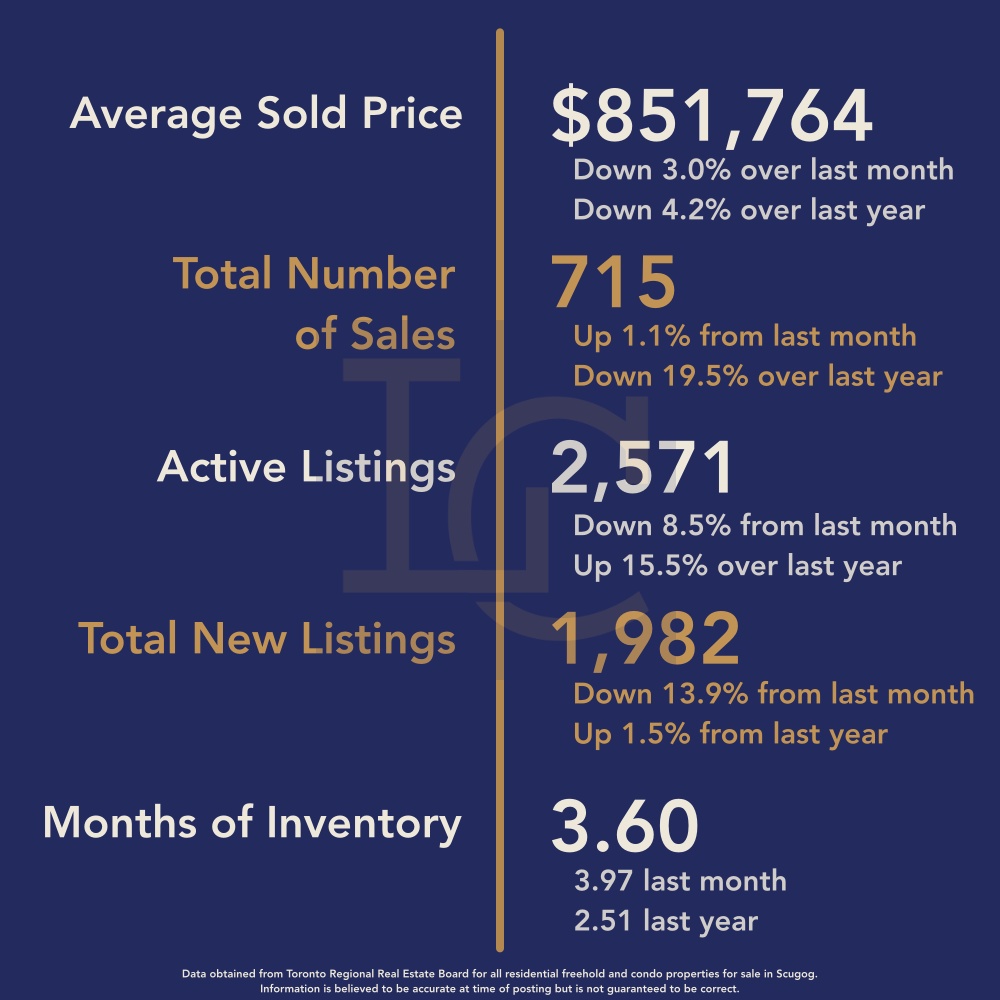
October 2025
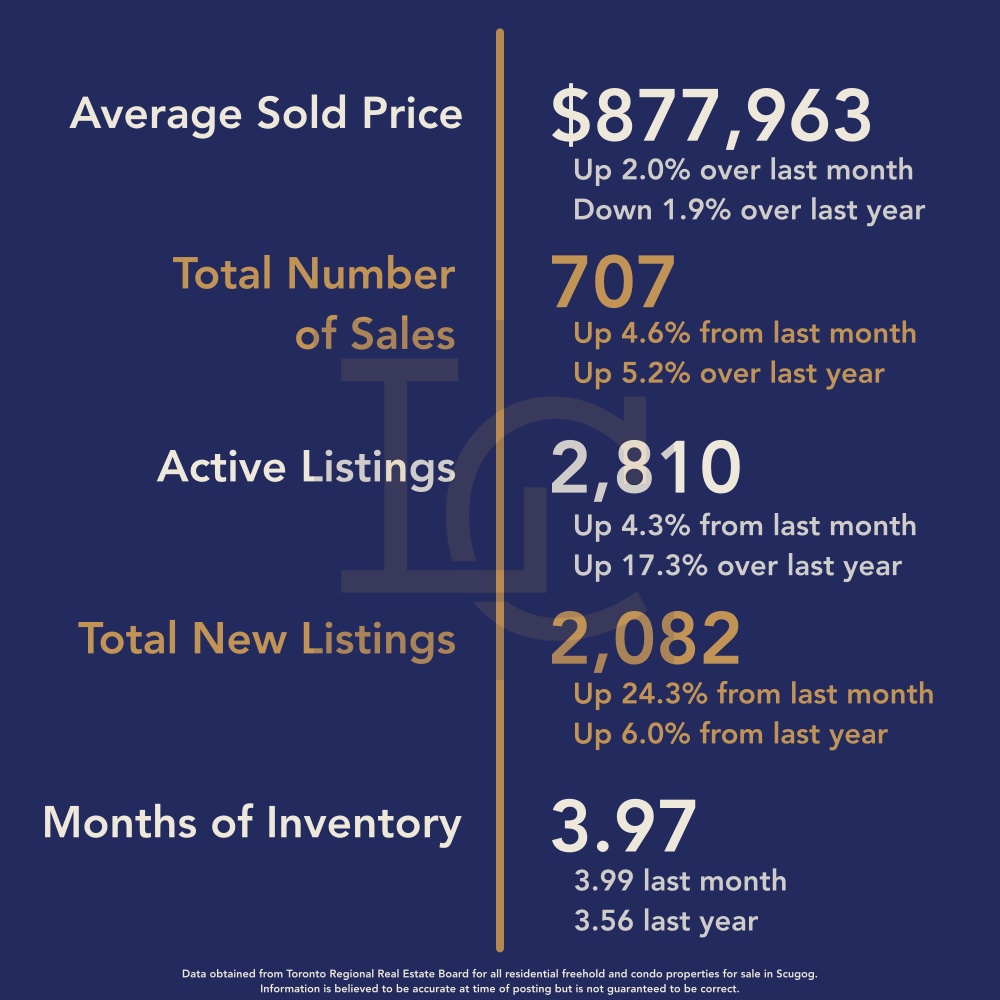
September 2025
Average Sale Price Slips Month-Over-Month
The average sale price in Durham Region for October was $851,764, representing a 3.0% decrease from September’s $877,963 and a 4.2% drop from October 2024’s $888,914. The pullback in prices aligns with typical fall market trends, as activity cools from the busier spring and summer months. However, despite this decline, prices remain relatively stable given broader economic uncertainty and ongoing affordability constraints.

Sale-to-List Price Ratio Rebounds Slightly
The sale-to-list price ratio improved to 99%, up from 98% in September, signaling that sellers are still achieving close to their asking prices. Though down from 100% last year, this small gain shows that buyer demand remains healthy and that well-priced homes continue to attract strong offers.
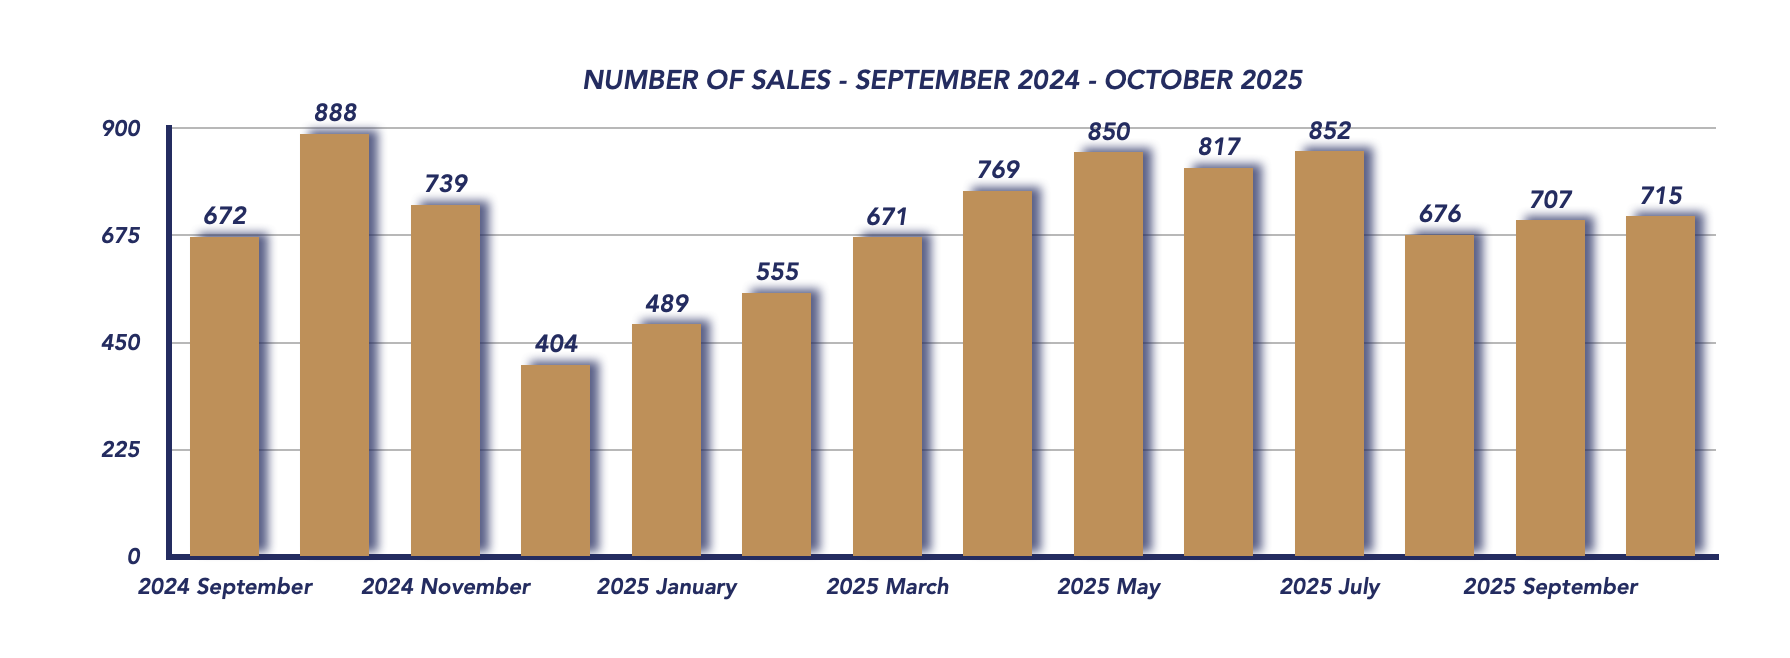
Sales Activity Steady Despite Seasonal Slowdown
Durham Region saw 715 total sales in October, a slight increase from 707 in September, but down from 888 sales in October 2024. While year-over-year activity remains softer, the monthly uptick suggests buyers are still active heading into the cooler months, taking advantage of stable interest rates and improved negotiating conditions.
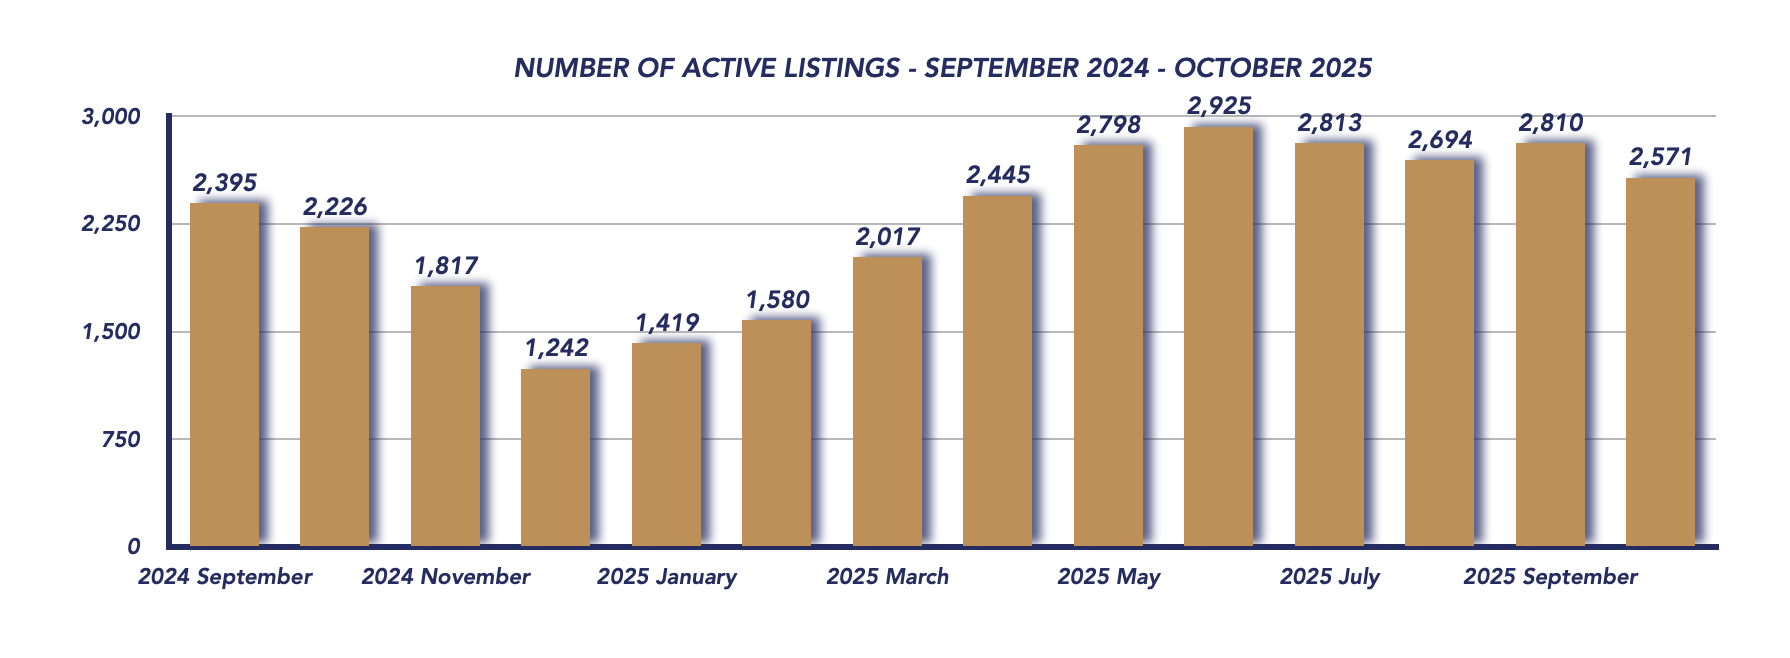
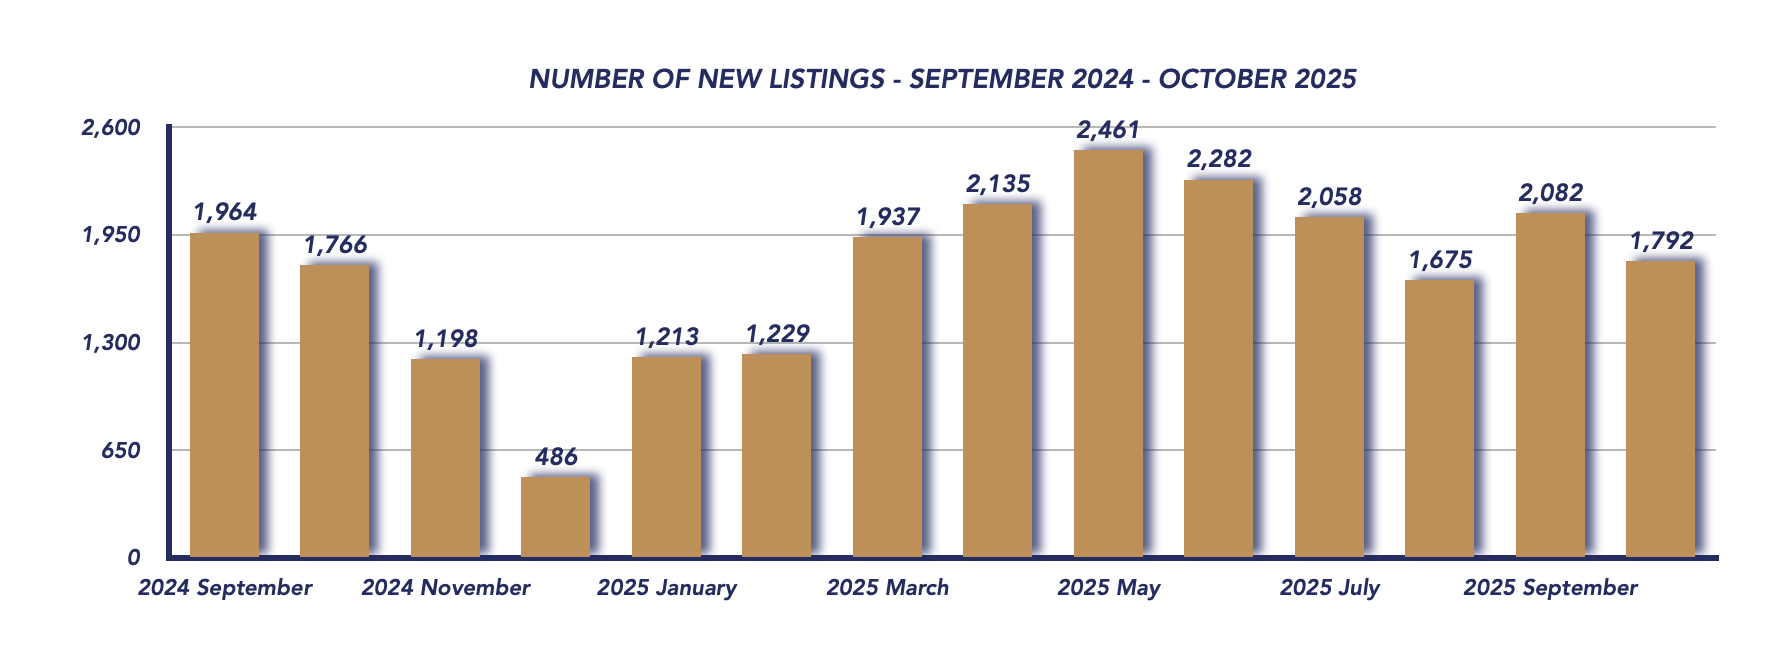
Fewer Listings Enter the Market
New listings fell to 1,792, down from 2,082 in September, but slightly above 1,766 in October 2024. This dip in new inventory reflects the typical fall slowdown as fewer sellers list before the holidays. However, combined with steady sales, this drop helped tighten supply across the region.
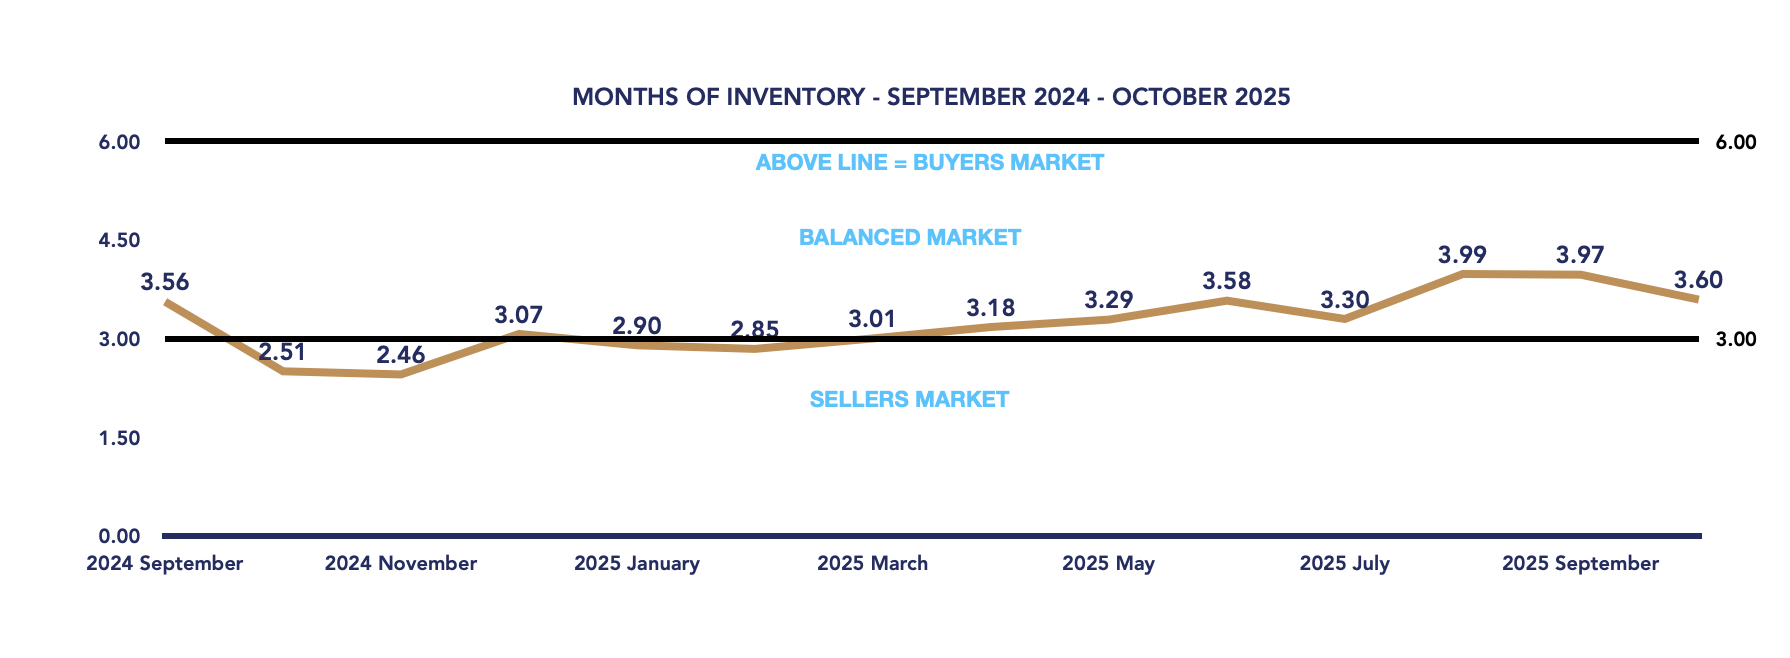
Days on Market and Inventory Show Stability
Homes spent an average of 47 days on the market, up marginally from 46 days in September, suggesting buyers are taking more time to make decisions. Meanwhile, months of inventory decreased to 3.60 from 3.97, keeping Durham in balanced market territory. This equilibrium between supply and demand continues to define the region’s housing environment in 2025.
Conclusion
The Durham Region housing market in October 2025 remained balanced, with modest price adjustments, steady sales, and slightly tighter inventory levels. While activity has slowed from last year, the overall picture remains stable, offering opportunities for both sides of the market.
As we head into the final months of the year, buyers may find increased flexibility and negotiating power, while sellers who price strategically can still achieve solid results. With the GTA market showing ongoing strength, time will tell whether that confidence extends eastward into Durham as we move into the winter season.
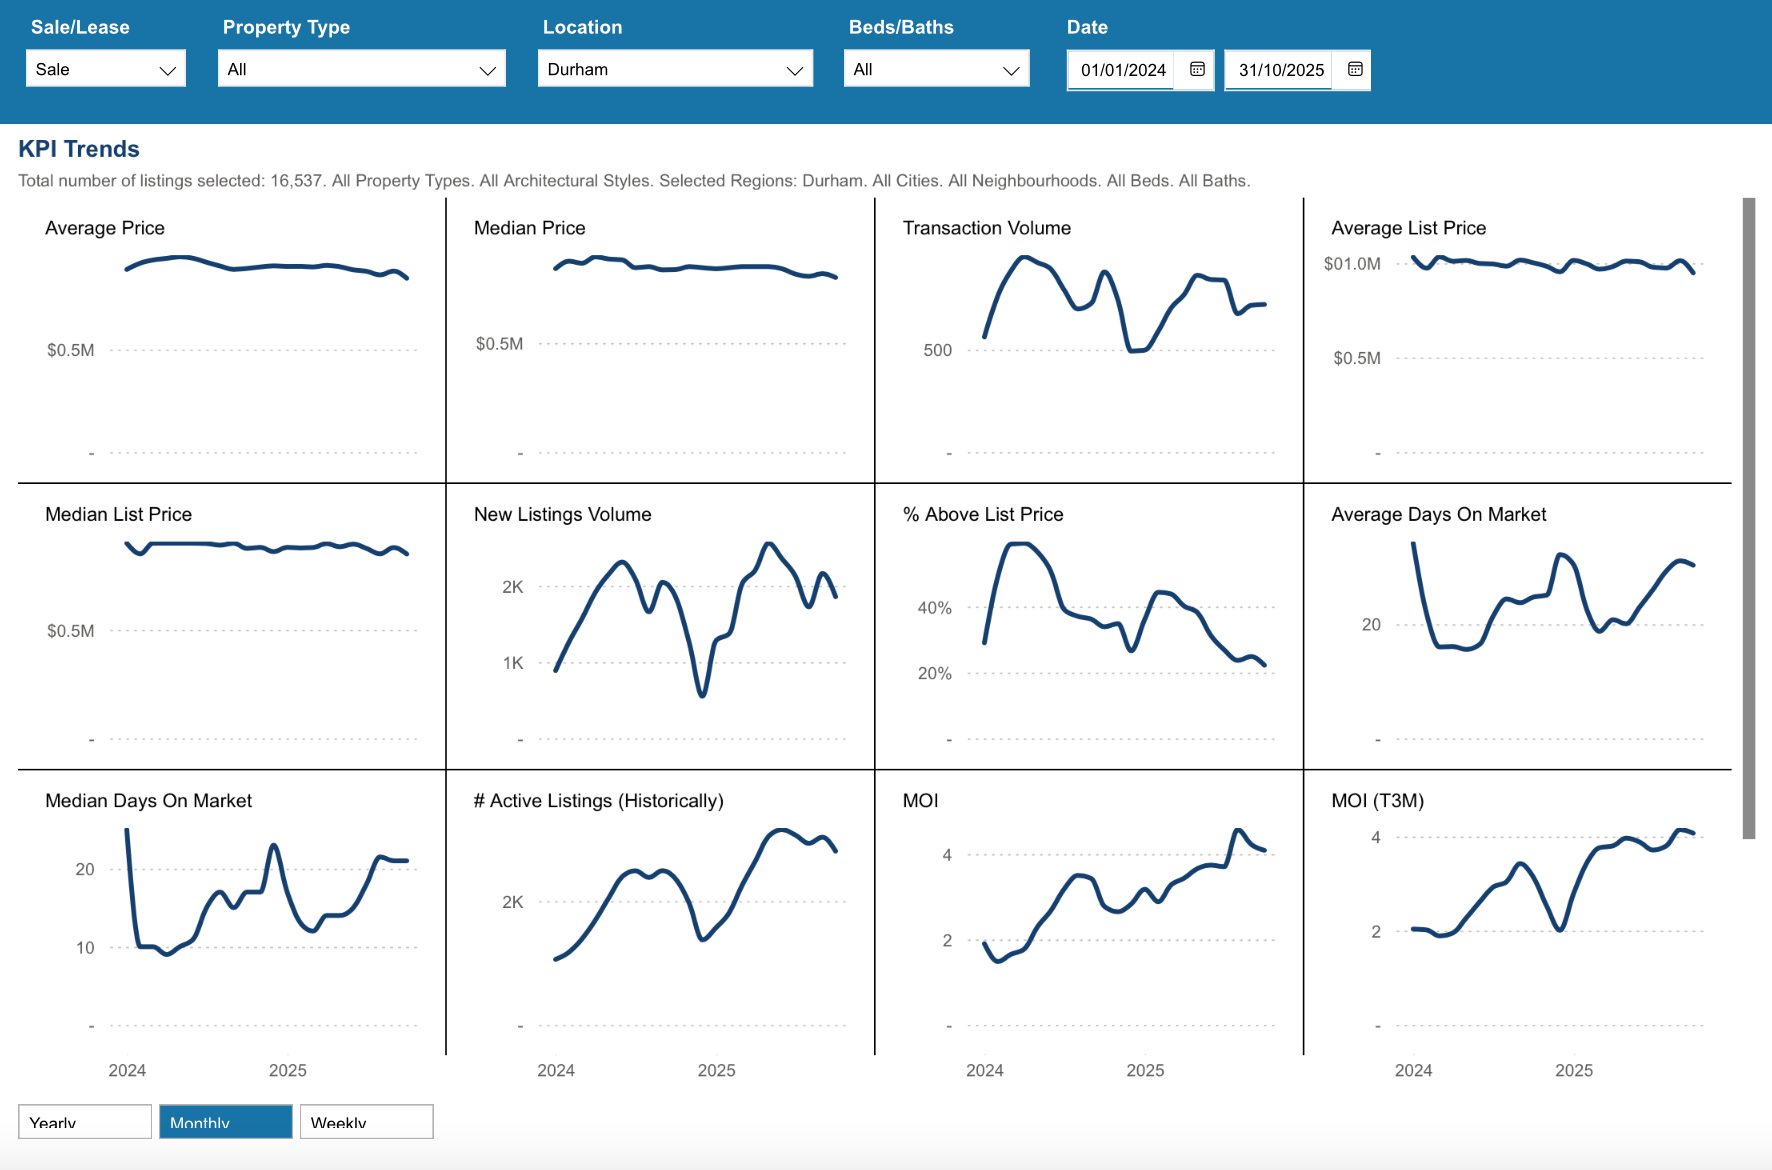
Key Performance Indicators (KPIs) from January 2024 through October 2025 provide a clear snapshot of how the Durham Region real estate market has evolved across all property types, architectural styles, and home configurations
*Information is believed to be accurate at time of posting but is not guaranteed to be correct. Some values may vary slightly based on the exact date and time the reports were generated. Market stats are provided by TRREB (Toronto Regional Real Estate Board) and are based on sales for the month of Attached/Row/Townhouses, Condo Apartments, Condo Townhouses, Detached, Detached with Common Elements, Link Homes and Semi-detached. *Some values may vary slightly based on the exact date and time the reports were generated.
Not intended as a solicitation if your property is already listed by another broker. Affiliated real estate agents are independent contractor sales associates, not employees. ©2021 Coldwell Banker. All Rights Reserved. Coldwell Banker and the Coldwell Banker logos are trademarks of Coldwell Banker Real Estate LLC. The Coldwell Banker® System is comprised of company owned offices which are owned by a subsidiary of Realogy Brokerage Group LLC and franchised offices which are independently owned and operated. The Coldwell Banker System fully supports the principles of the Fair Housing Act and the Equal Opportunity Act.
Click below for more reports
Check out our Uxbridge and Scugog Events Pages to keep up to date on whats going on around town. Click the links or scan the Code with your phone to take you directly there.

UXBRIDGE EVENTS

SCUGOG EVENTS


