
 Facebook
 X
X
 Pinterest
 Copy Link

Durham Region Housing February 2025

Each office is independently owned and operated
![]()

![]()
Housing Market Report for February 2025
Here is the Region of Durham Housing February 2025 report (all housing types), with reports from the Canadian Real Estate Association, and Toronto Regional Real Estate Board included.
This housing report for Durham Region includes the number of new listings, average list price, number of properties sold, average selling price, average days on market and average asking price to selling price ratio for all property types within the Region of Durham.
Scroll to the bottom for links to take you to the housing market reports for Uxbridge, Scugog and Brock.
![]()
![]()
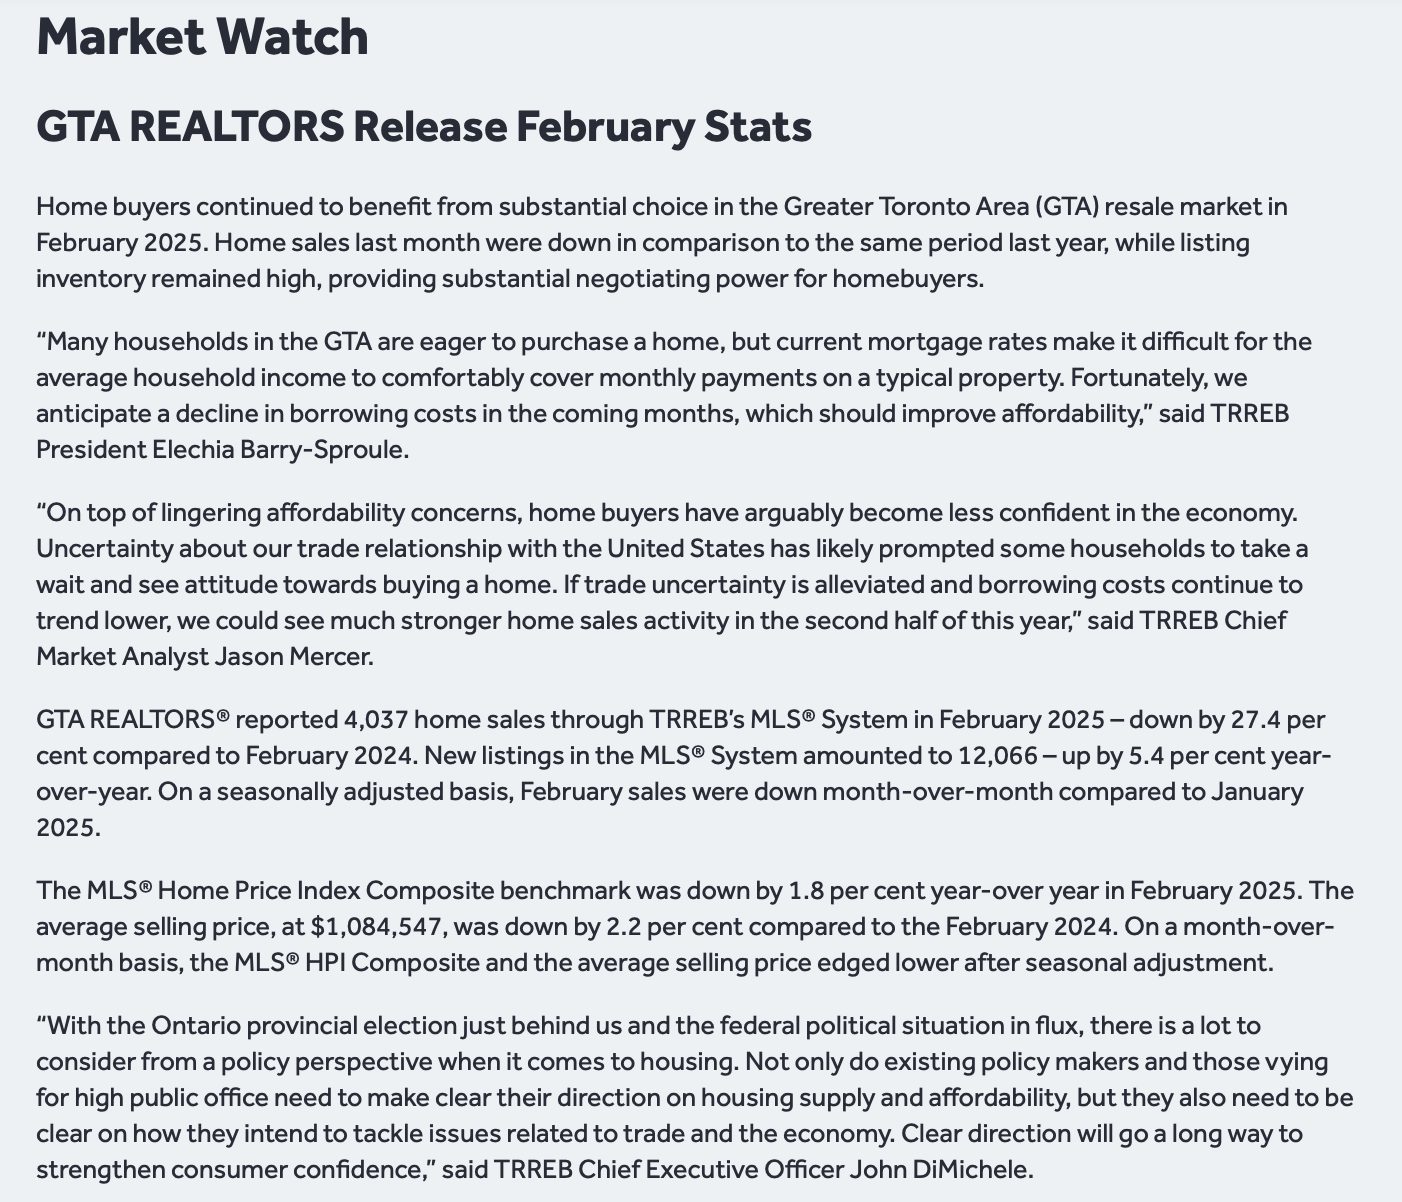
From Toronto Regional Real Estate Board
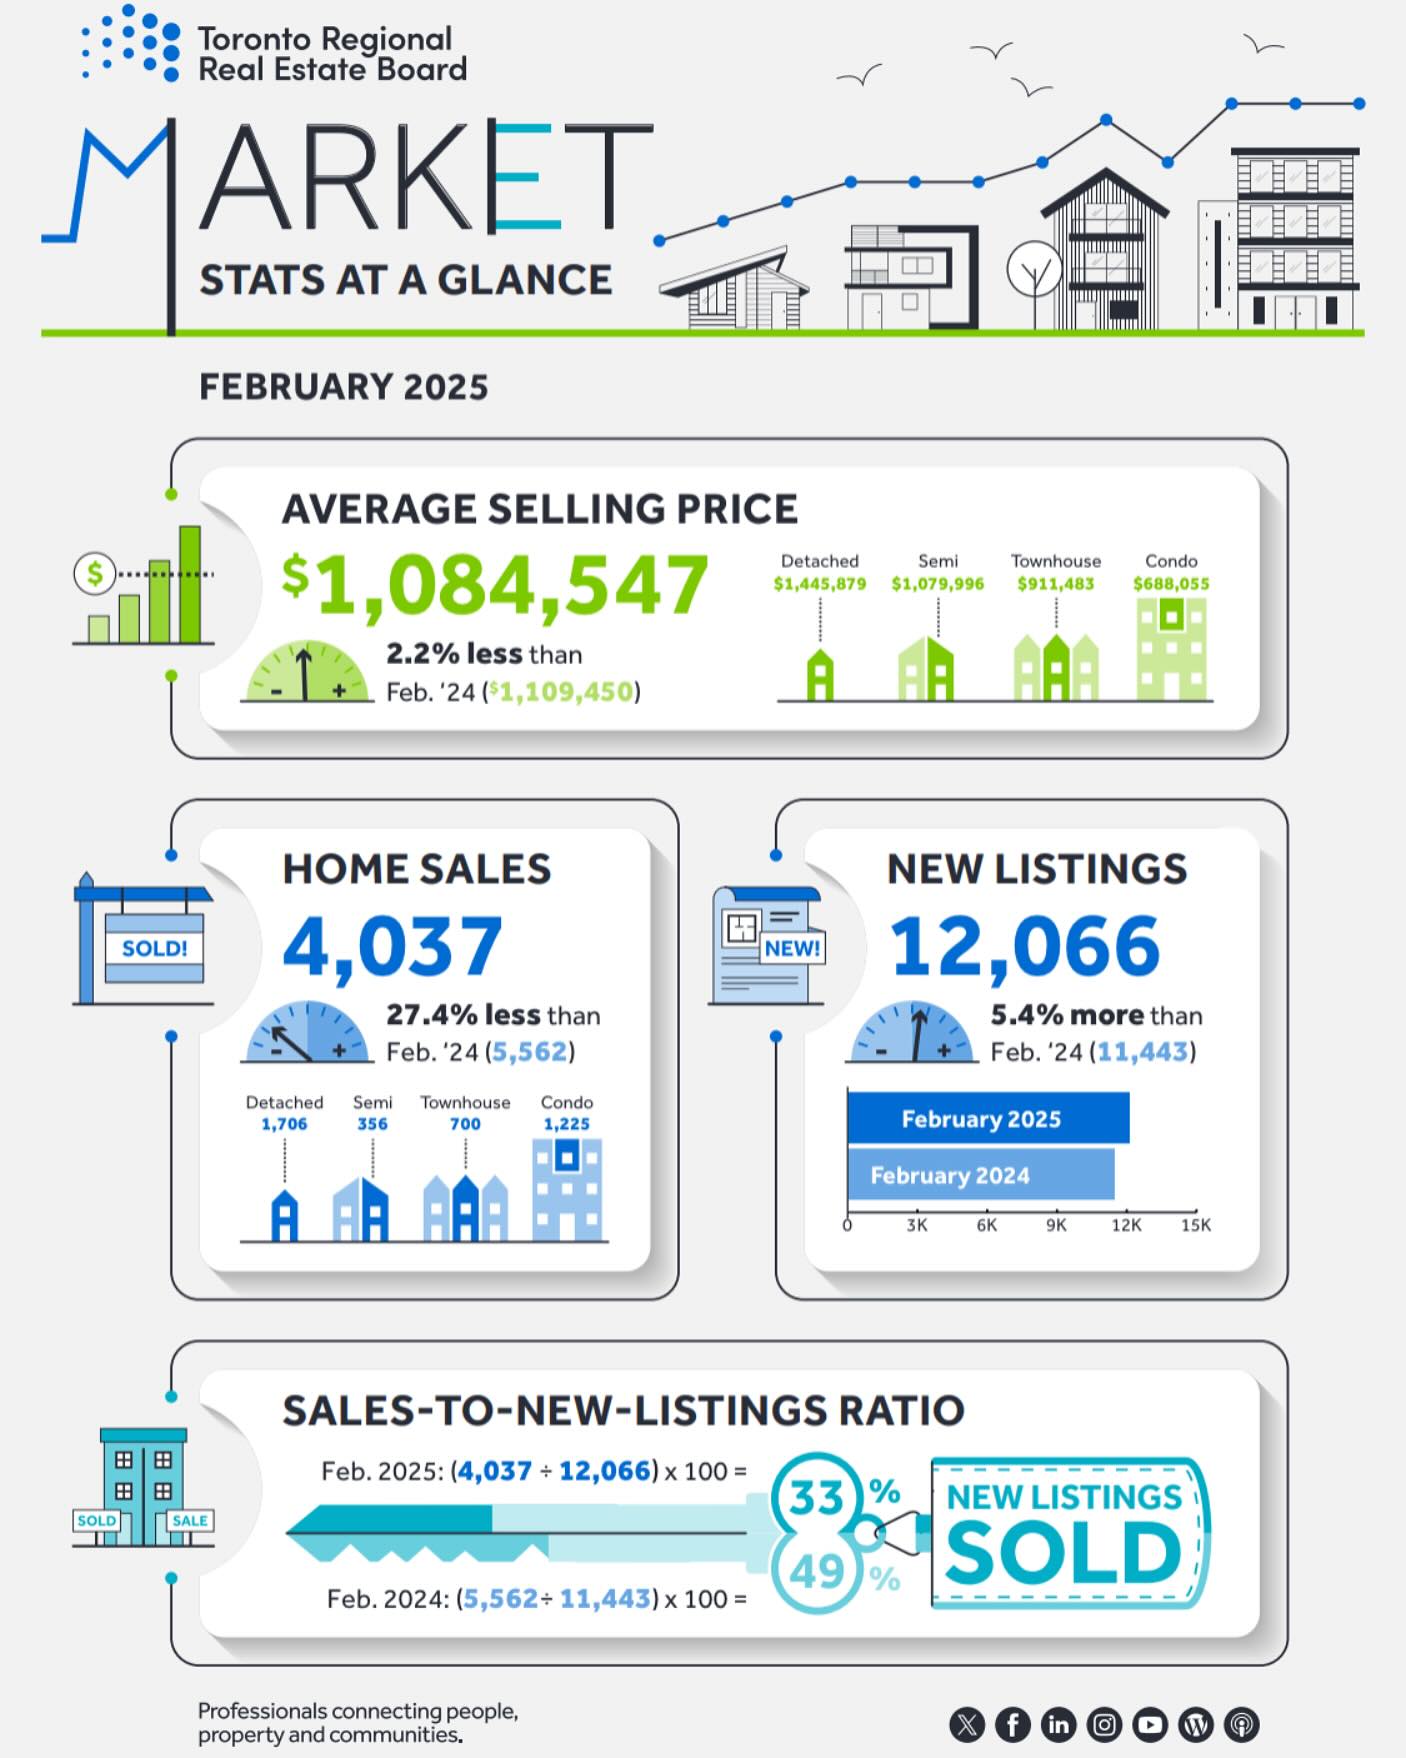
Toronto Regional Real Estate Board – Market Stats At A Glance – February 2025
Read the Toronto Regional Real Estate Board Market Watch Report
![]()
Durham Region Full Report
Durham Region Real Estate Market Analysis – February 2025
The Durham Region real estate market in February 2025 showed a mix of stability and gradual shifts, with pricing trends indicating a market still finding its footing.
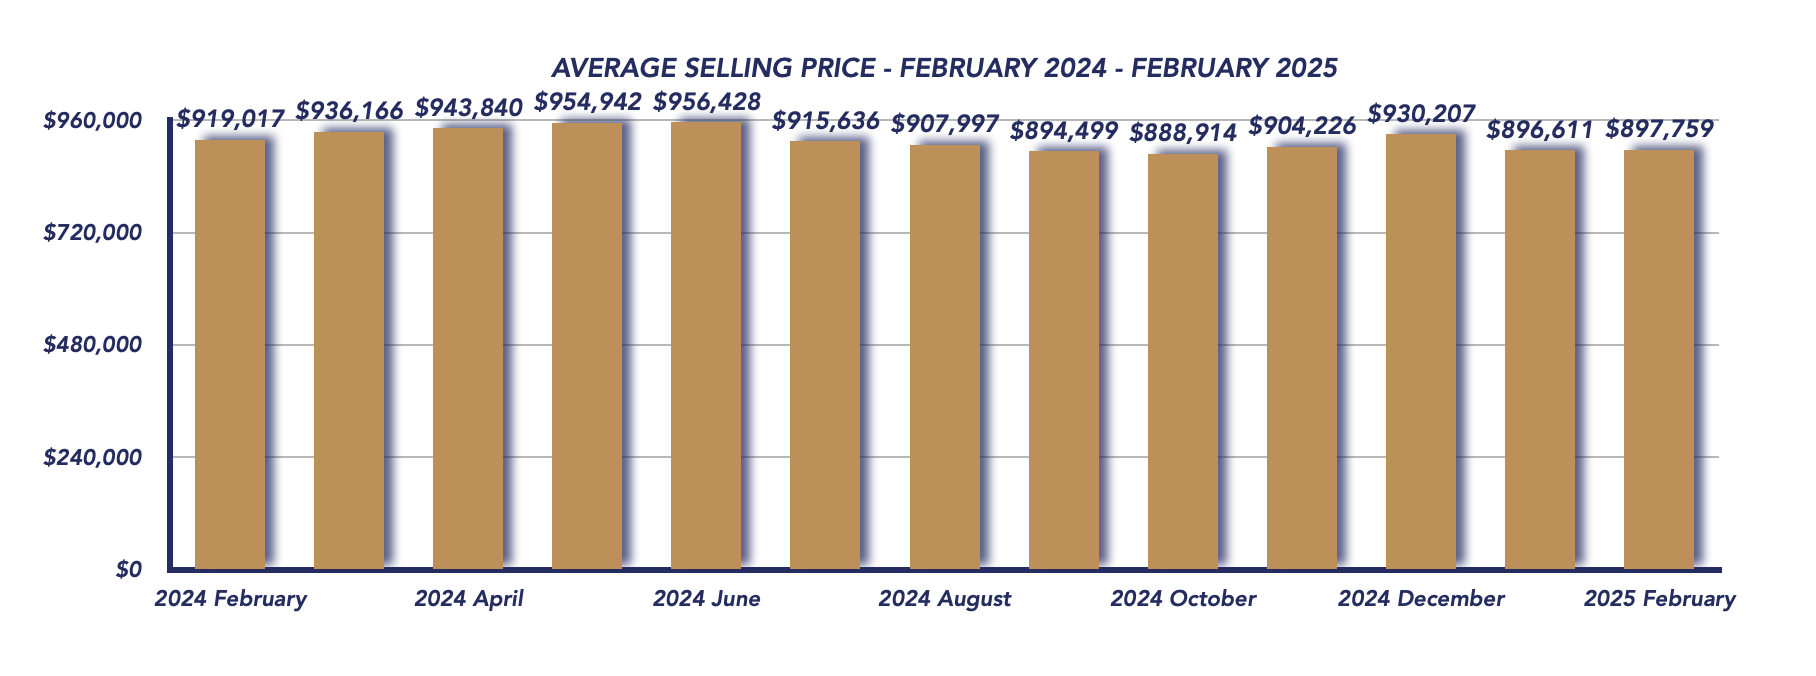
Home Prices: A Slight Year-Over-Year Decline, but Month-Over-Month Stability
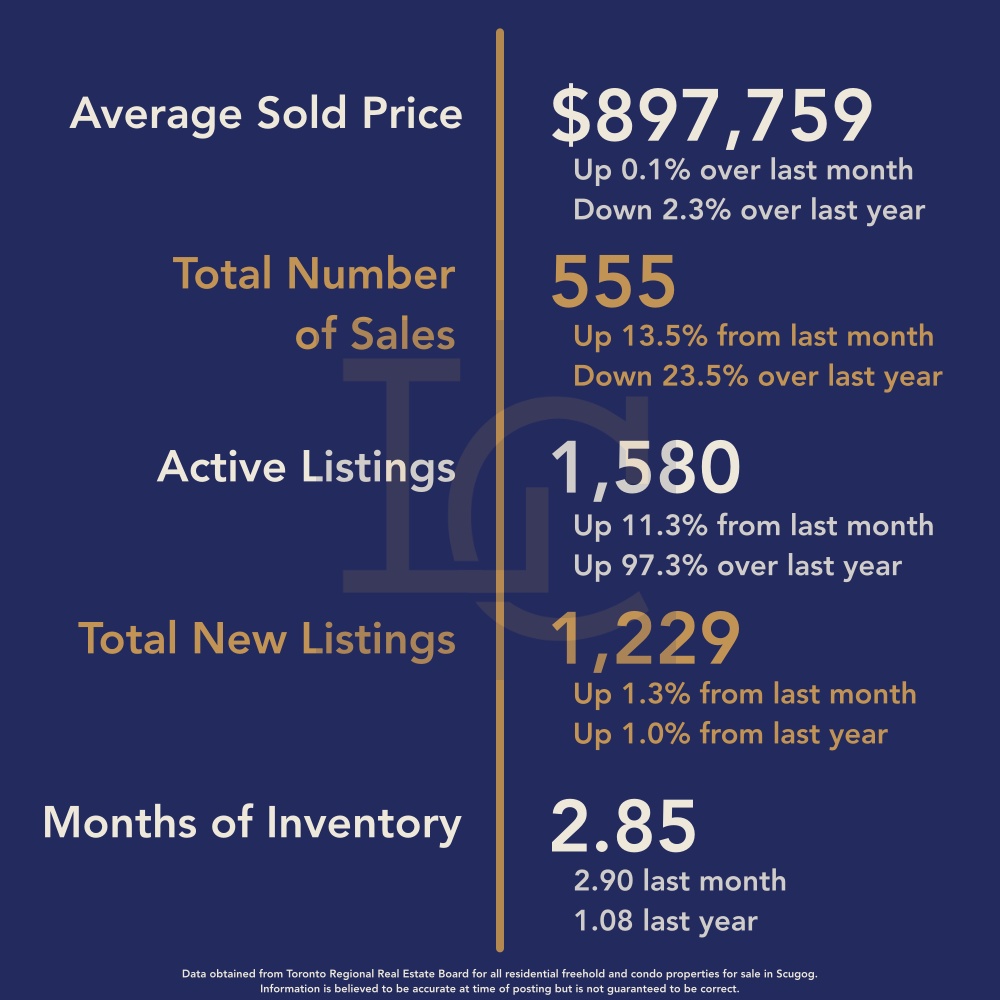
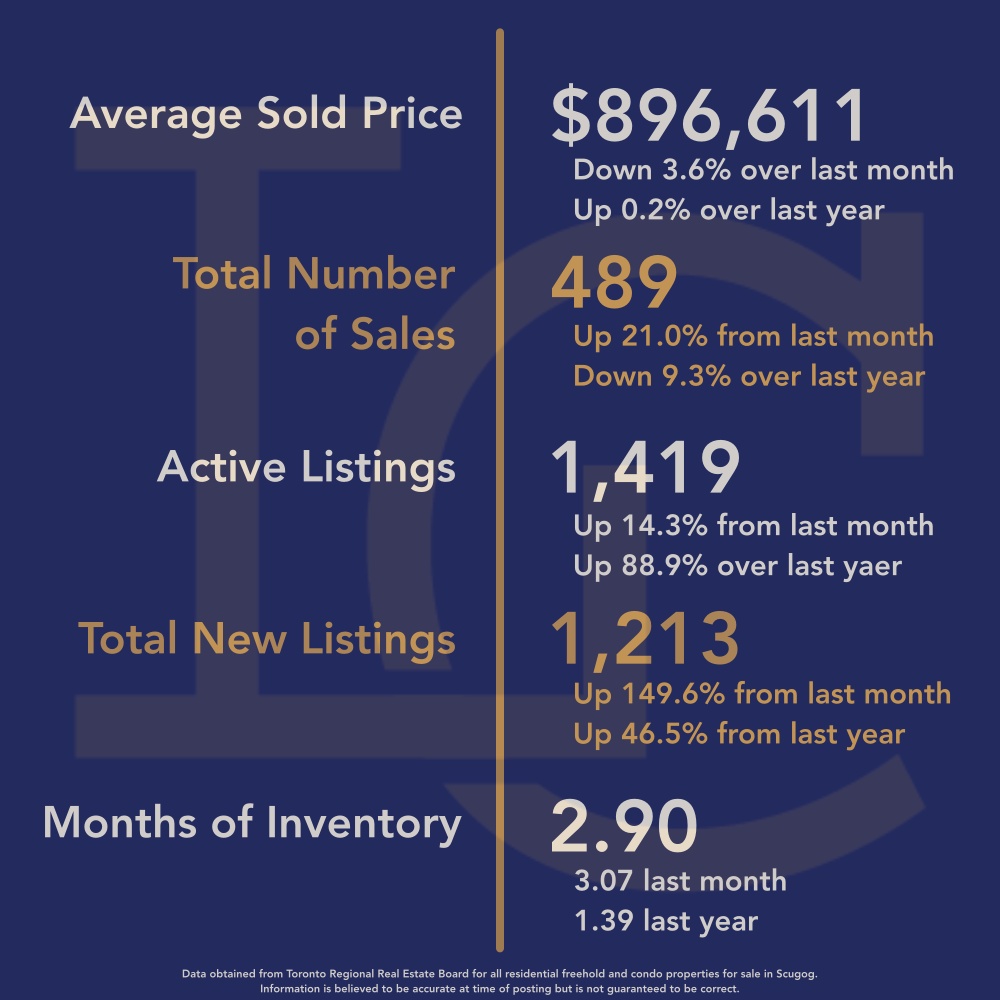
The average sales price for February 2025 was $897,759, reflecting a 2.3% decrease from February 2024 when the average was $919,017. However, on a month-over-month basis, prices remained virtually unchanged, rising by just 0.1% from January’s $896,611. This suggests that while prices have softened compared to last year, they may be stabilizing as buyers and sellers adjust to evolving market conditions.
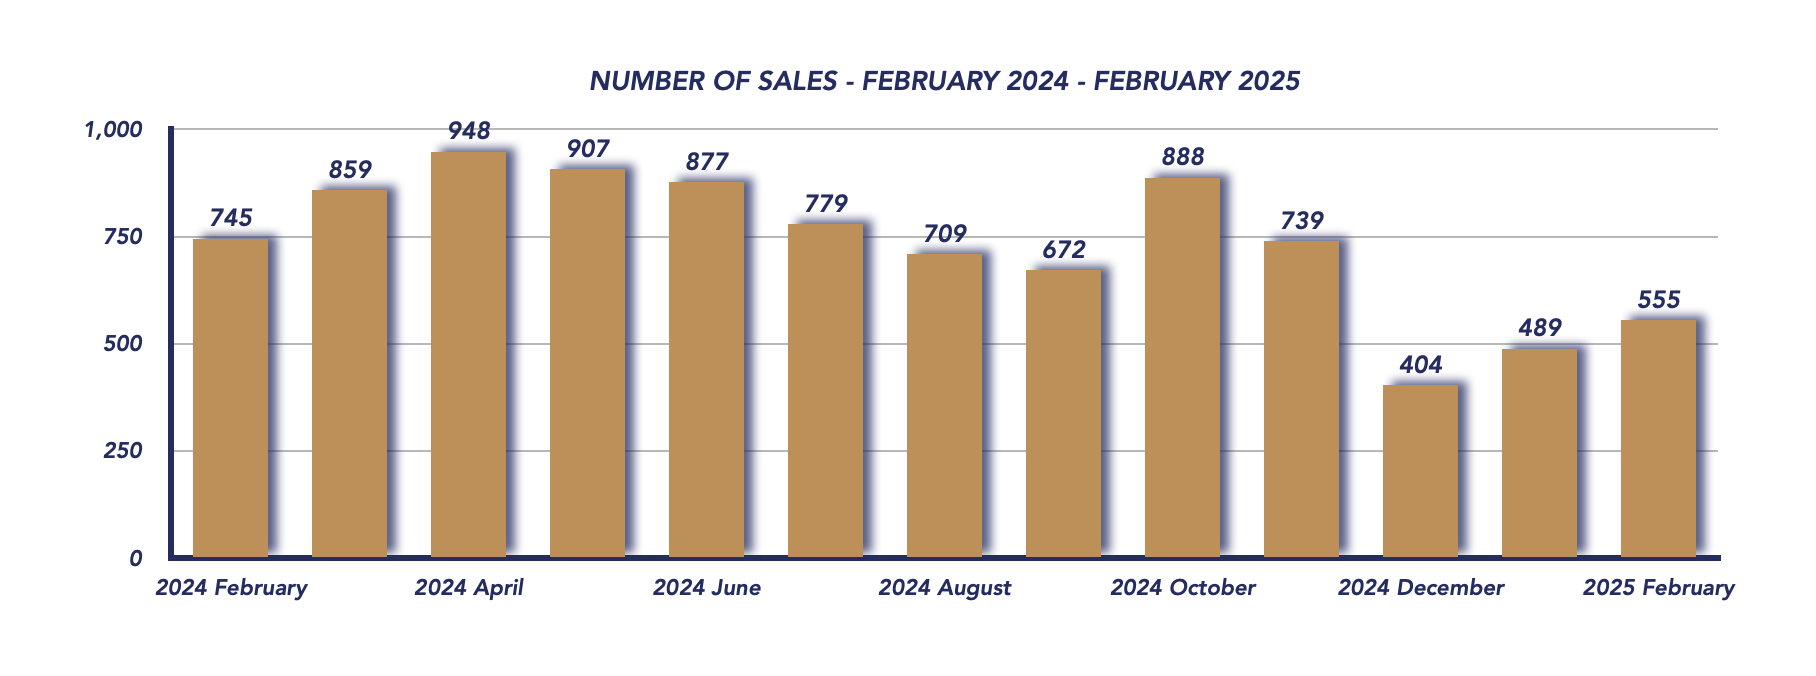
Sales Activity: Slower Than Last Year but Improving Monthly
Total home sales in February reached 555, which represents a 25.5% decline from the 745 sales recorded in February 2024. However, sales showed an encouraging increase from 489 transactions in January, indicating a seasonal uptick in activity as we move toward the traditionally busier spring market.
List-to-Sale Price Ratio Indicates Strong Buyer Competition
Despite the lower overall sales volume, the sale-to-list price ratio rose to 101%, up from 100% in January. This suggests that homes are still selling close to, or slightly above, asking prices, indicating continued demand in certain property segments.
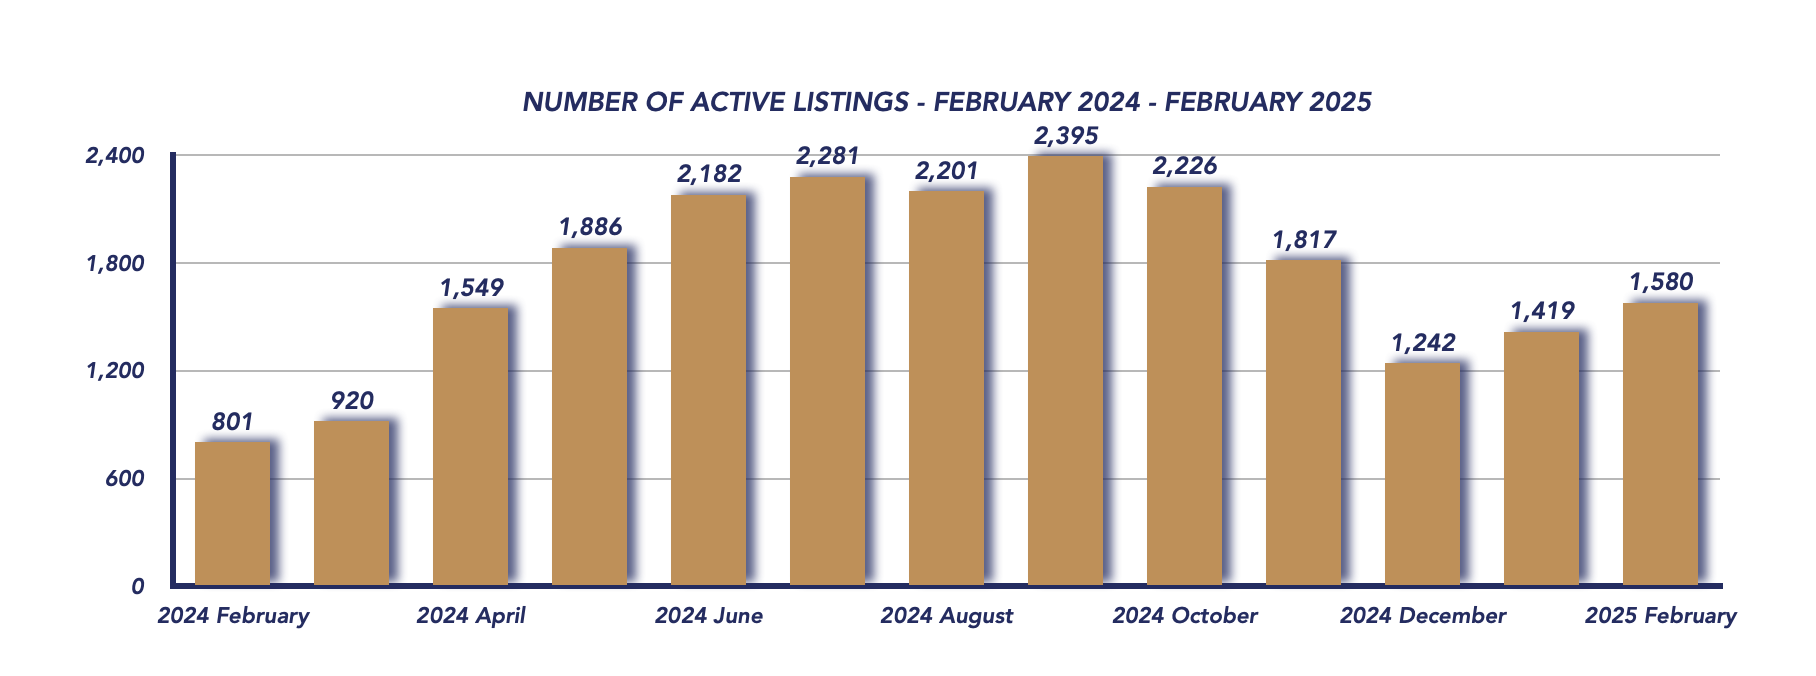
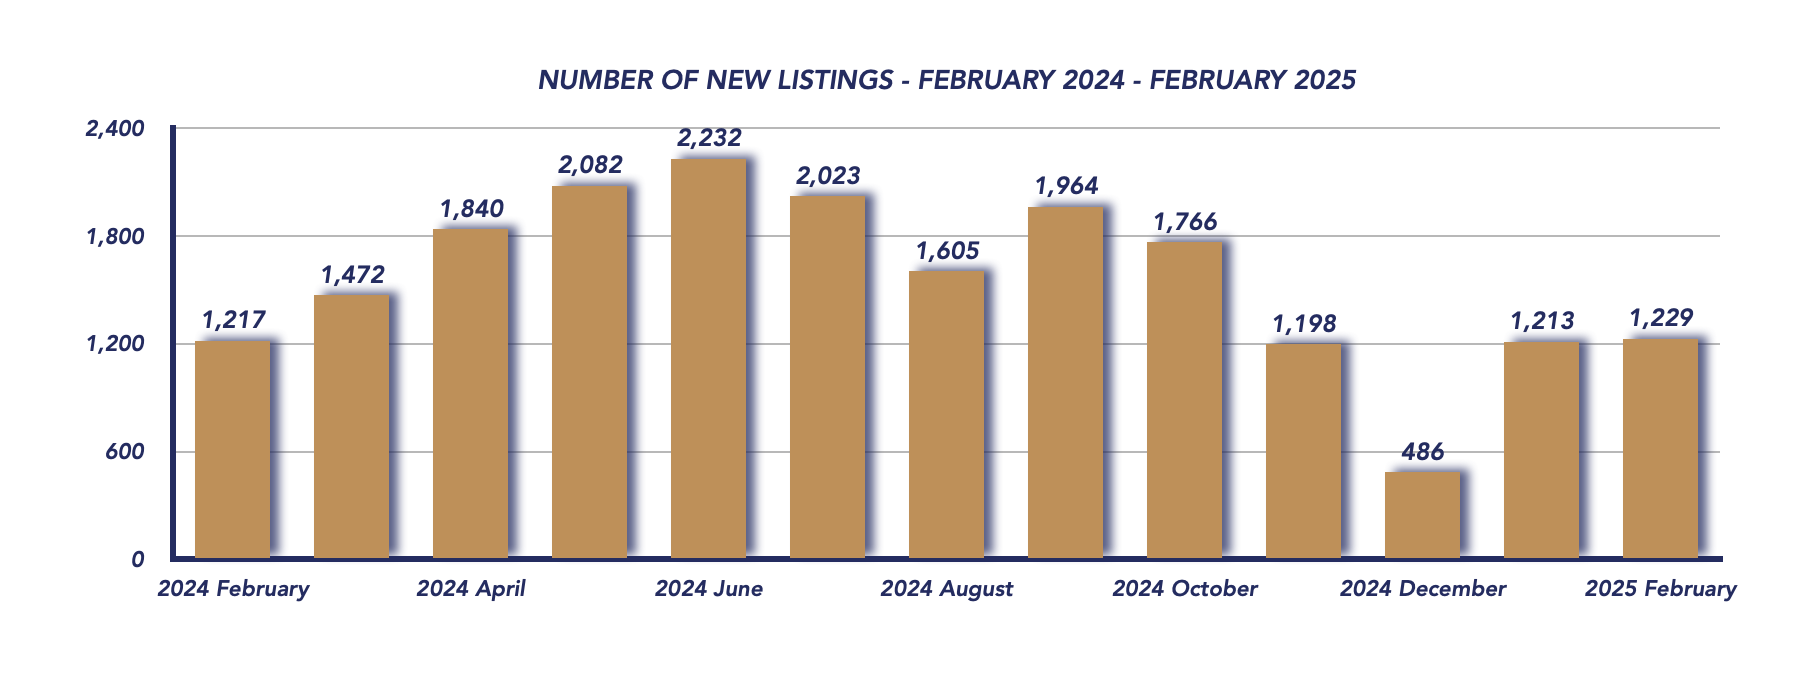
New Listings Slightly Up, Inventory Remains Tight
The number of new listings in February was 1,229, showing a slight increase from 1,213 in January and 1,217 in February 2024. This consistent listing activity is keeping inventory levels relatively stable, preventing a significant swing toward a buyer’s market.
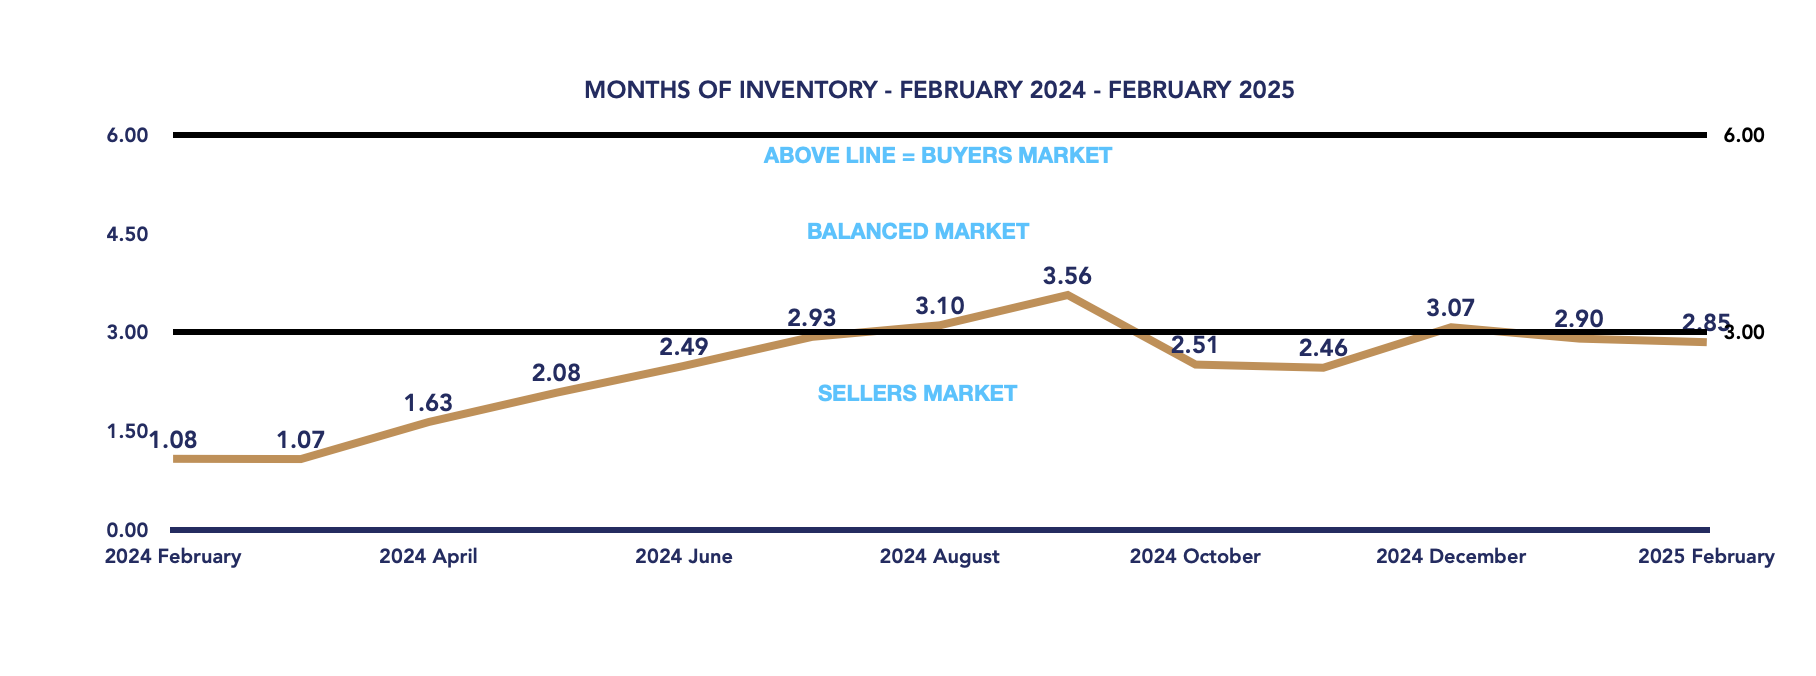
The months of inventory remained at 2.85, down slightly from 2.90 in January. This figure remains right on the cusp of a seller’s market and a balanced market, suggesting that while buyers have a bit more selection than during peak seller’s market conditions, sellers are still maintaining some leverage.
Days on Market: A Balanced Market Signal
The average days on market (DOM) for February was 34 days, reflecting a relatively stable timeline for selling properties. This suggests that while homes are not moving as quickly as in highly competitive periods, the market is still functioning efficiently.
Conclusion
The Durham Region real estate market in February 2025 continued to show signs of adjustment. While average prices remain slightly lower than last year, month-over-month stability suggests a potential price floor forming. Sales activity is picking up from January lows, and with the list-to-sale price ratio at 101%, there is evidence of buyer demand in select areas. Inventory levels remain relatively tight, reinforcing a market teetering between balanced and seller-friendly conditions. As we head into the spring market, it will be crucial to watch whether increasing listings meet demand or if buyer competition continues to push prices upward.
February 2025
January 2025
Average Sold Price
Number of Properties Sold
Active Listings
Number of New Listings
Months of Inventory
*Information is believed to be accurate at time of posting but is not guaranteed to be correct. Some values may vary slightly based on the exact date and time the reports were generated. Market stats are provided by TRREB (Toronto Regional Real Estate Board) and are based on sales for the month of Attached/Row/Townhouses, Condo Apartments, Condo Townhouses, Detached, Detached with Common Elements, Link Homes and Semi-detached. *Some values may vary slightly based on the exact date and time the reports were generated.
Not intended as a solicitation if your property is already listed by another broker. Affiliated real estate agents are independent contractor sales associates, not employees. ©2021 Coldwell Banker. All Rights Reserved. Coldwell Banker and the Coldwell Banker logos are trademarks of Coldwell Banker Real Estate LLC. The Coldwell Banker® System is comprised of company owned offices which are owned by a subsidiary of Realogy Brokerage Group LLC and franchised offices which are independently owned and operated. The Coldwell Banker System fully supports the principles of the Fair Housing Act and the Equal Opportunity Act.
Click below for more reports
Check out our Uxbridge and Scugog Events Pages to keep up to date on whats going on around town. Click the links or scan the Code with your phone to take you directly there.

UXBRIDGE EVENTS

SCUGOG EVENTS


