
 Facebook
 X
X
 Pinterest
 Copy Link

Scugog Housing February 2025

Each office is independently owned and operated
![]()

![]()
Housing Market Report for February 2025
Here is the Region of Durham Housing February 2025 report (all housing types), with reports from the Canadian Real Estate Association, and Toronto Regional Real Estate Board included.
This housing report for Durham Region includes the number of new listings, average list price, number of properties sold, average selling price, average days on market and average asking price to selling price ratio for all property types within the Region of Durham.
Scroll to the bottom for links to take you to the housing market reports for Uxbridge, Scugog and Brock.
![]()
![]()
From Toronto Regional Real Estate Board
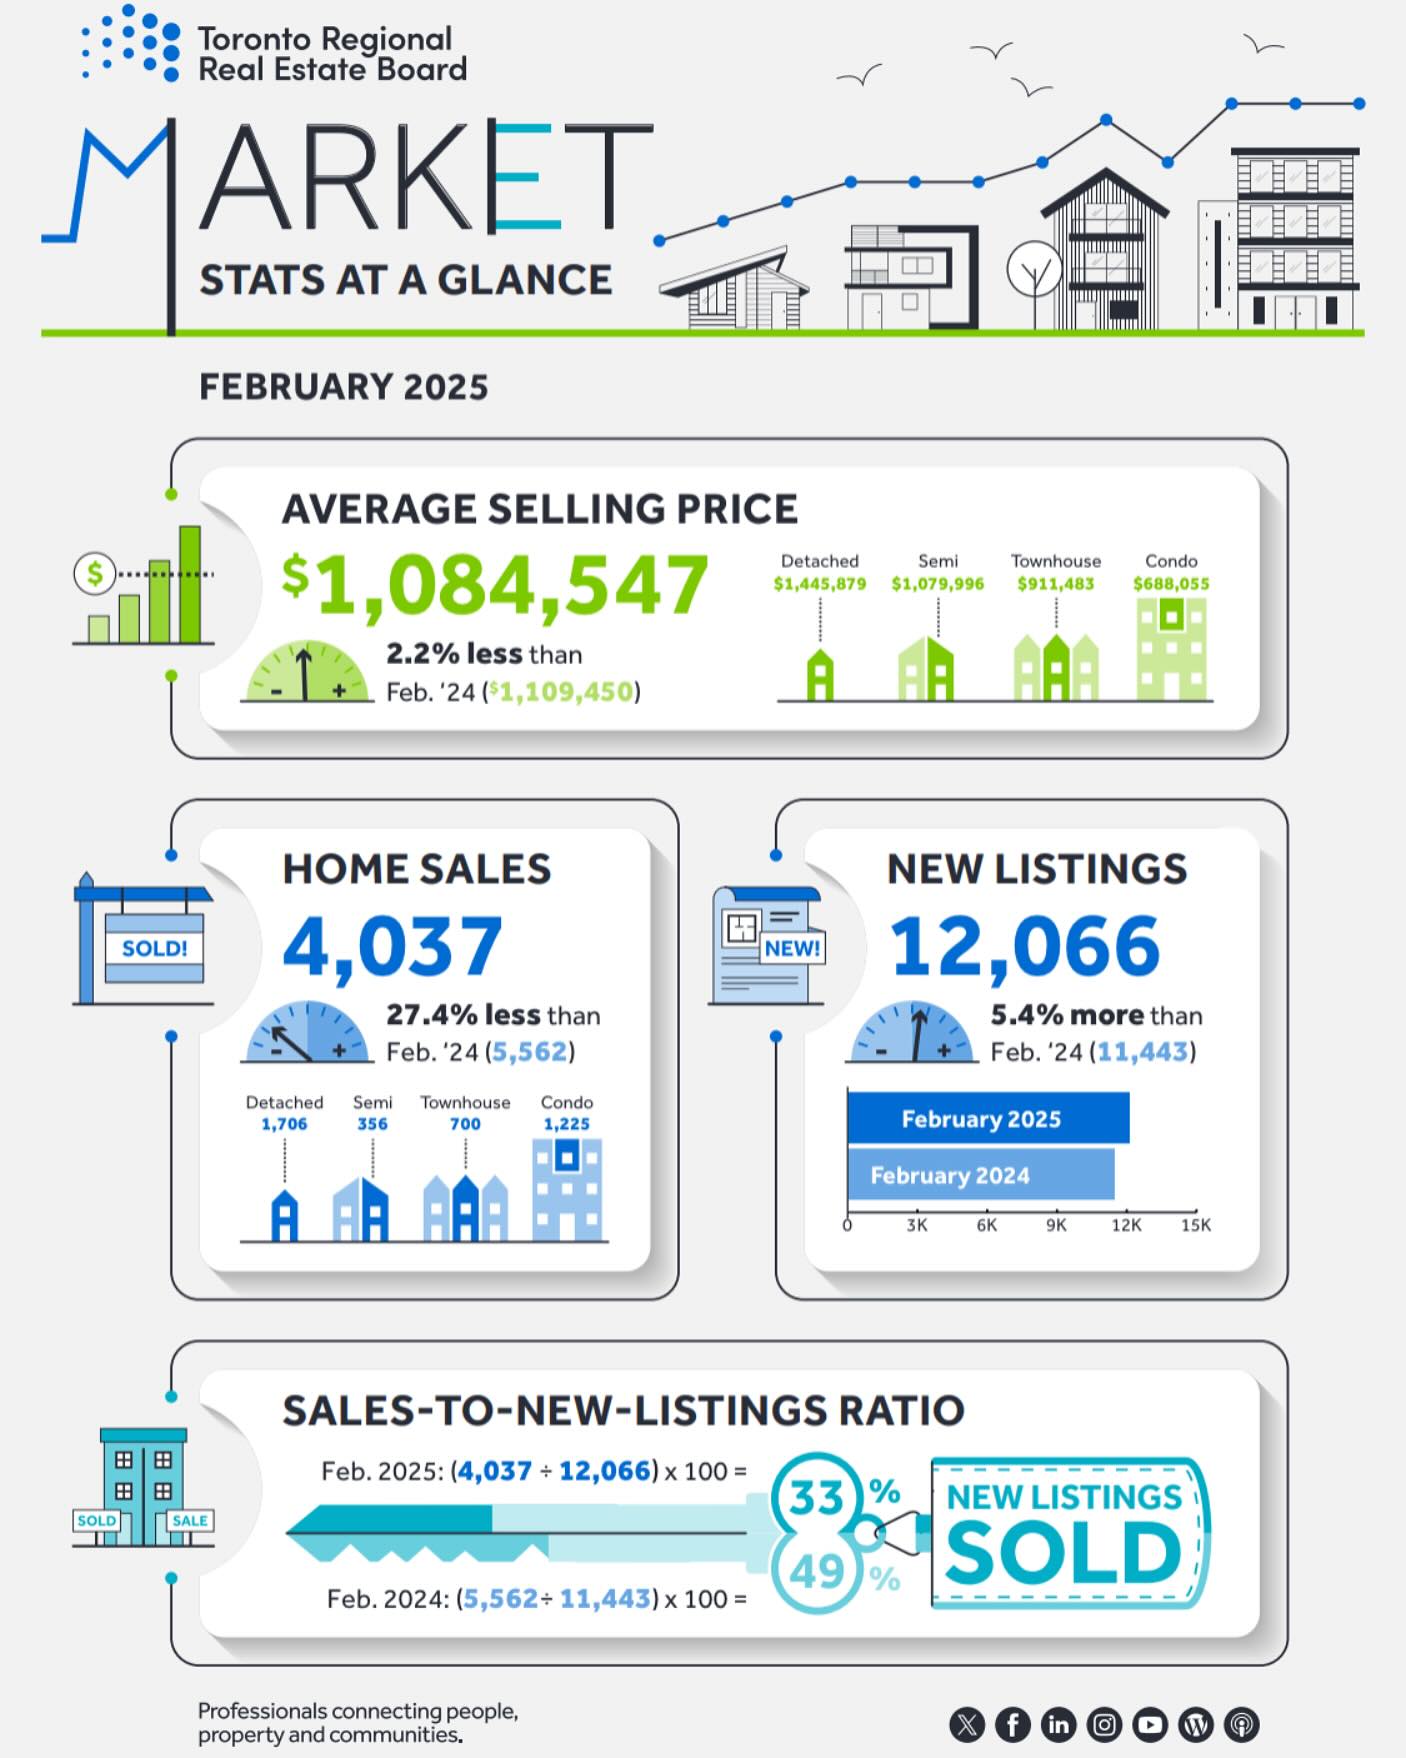
Toronto Regional Real Estate Board – Market Stats At A Glance – February 2025
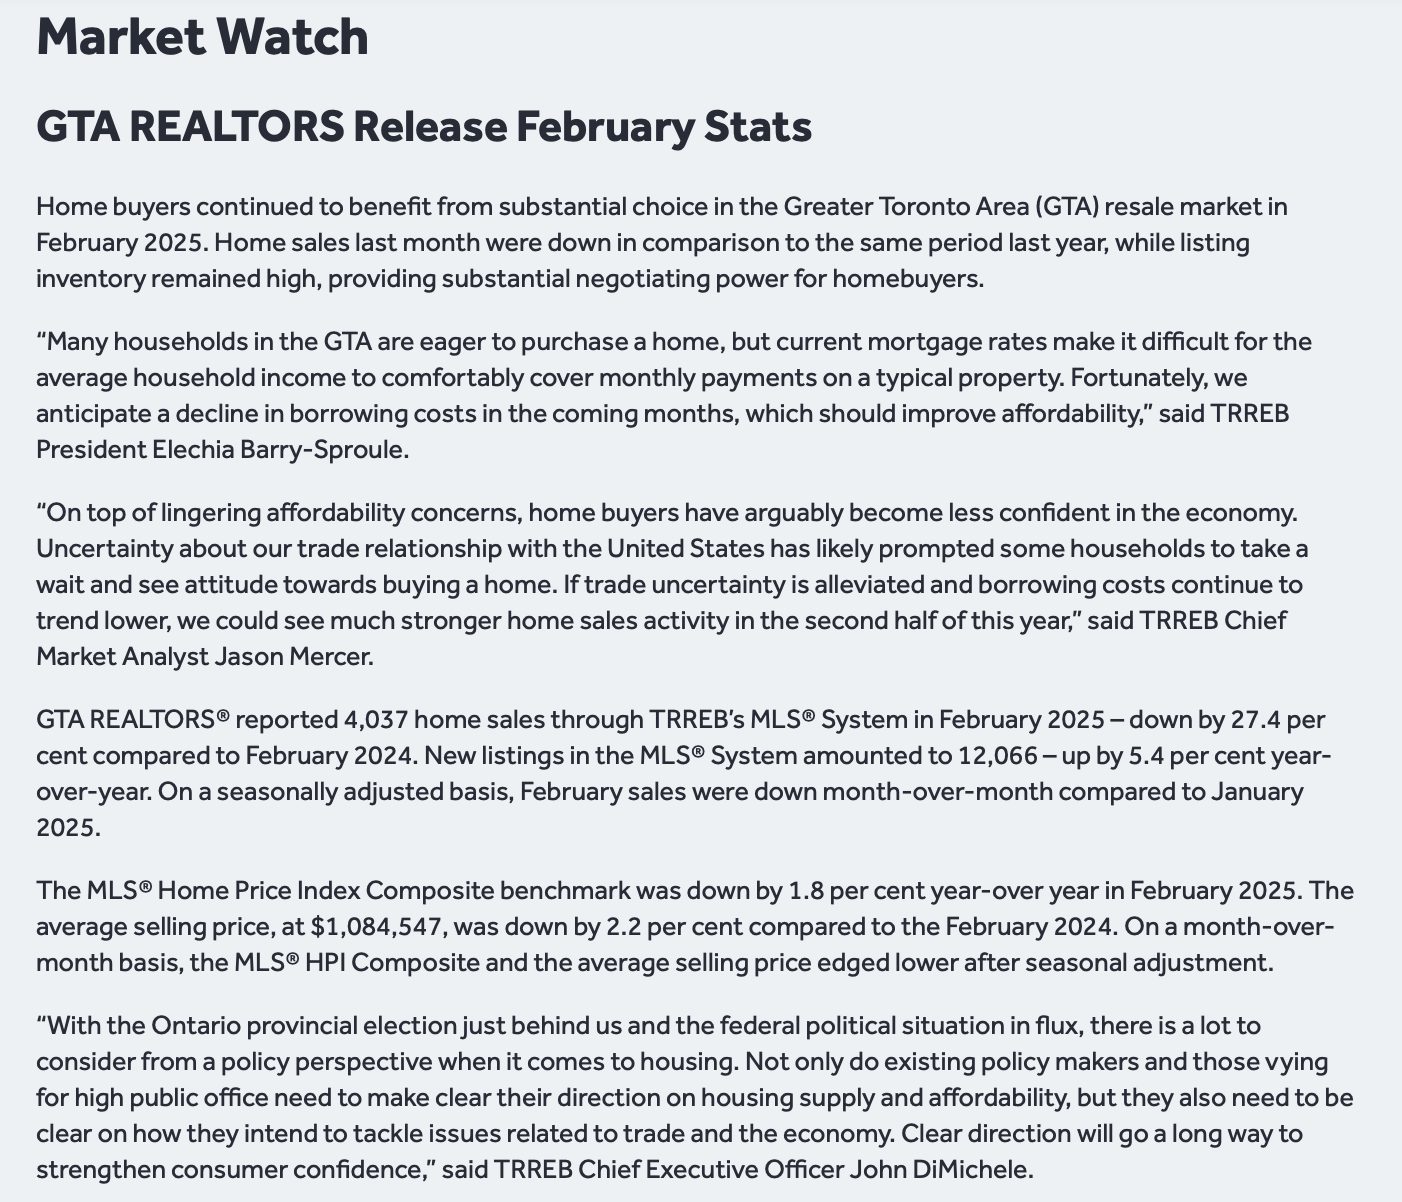
Read the Toronto Regional Real Estate Board Market Watch Report
![]()
Township of Scugog Full Report
Scugog Township Real Estate Market Analysis – February 2025
The real estate market in Scugog Township showed signs of continued cooling in February 2025, with declining home prices and stable but subdued sales activity.
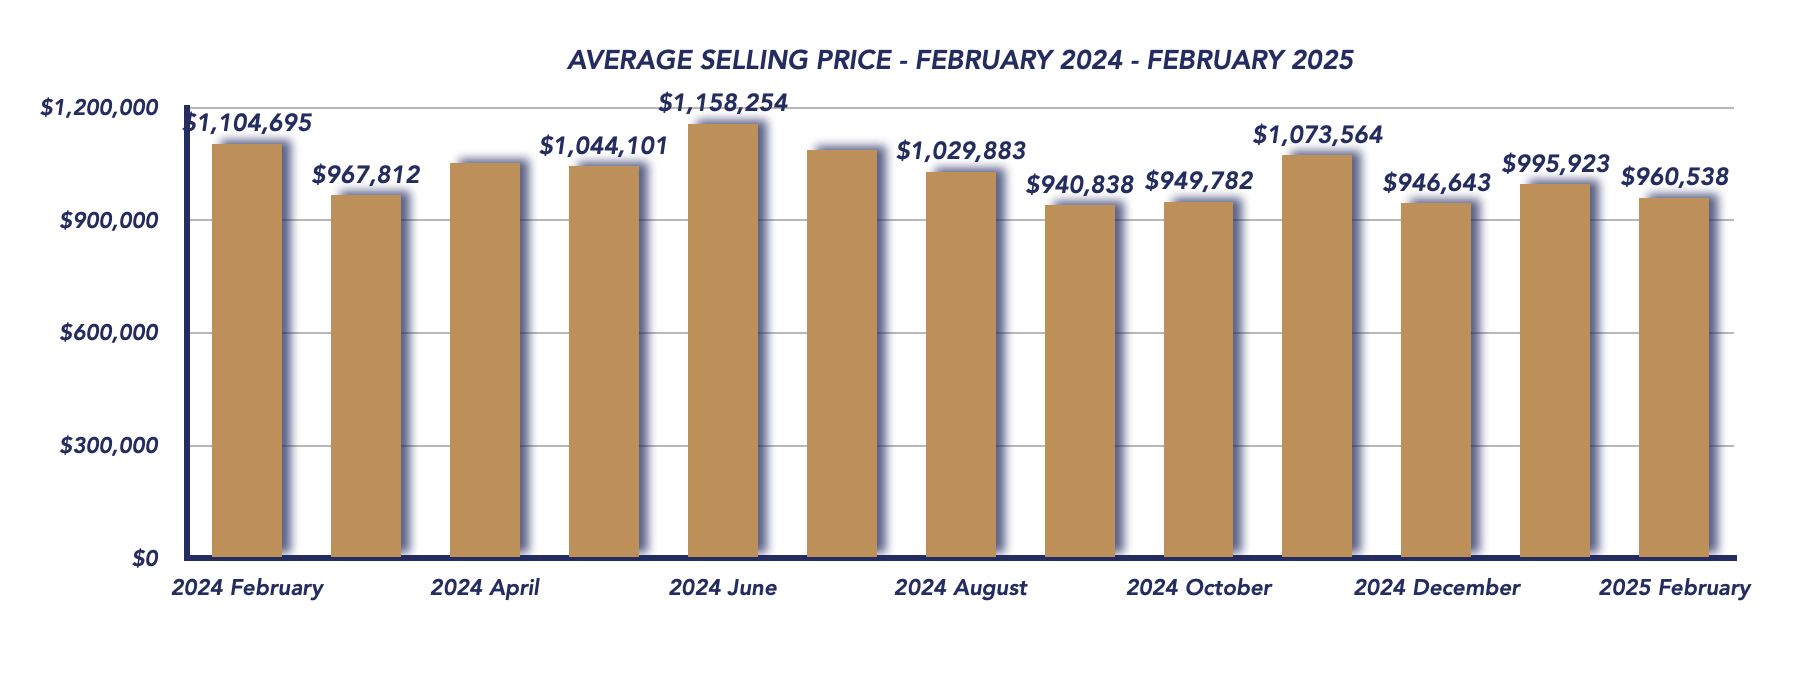
Price Trends: Decline in Average Sales Price
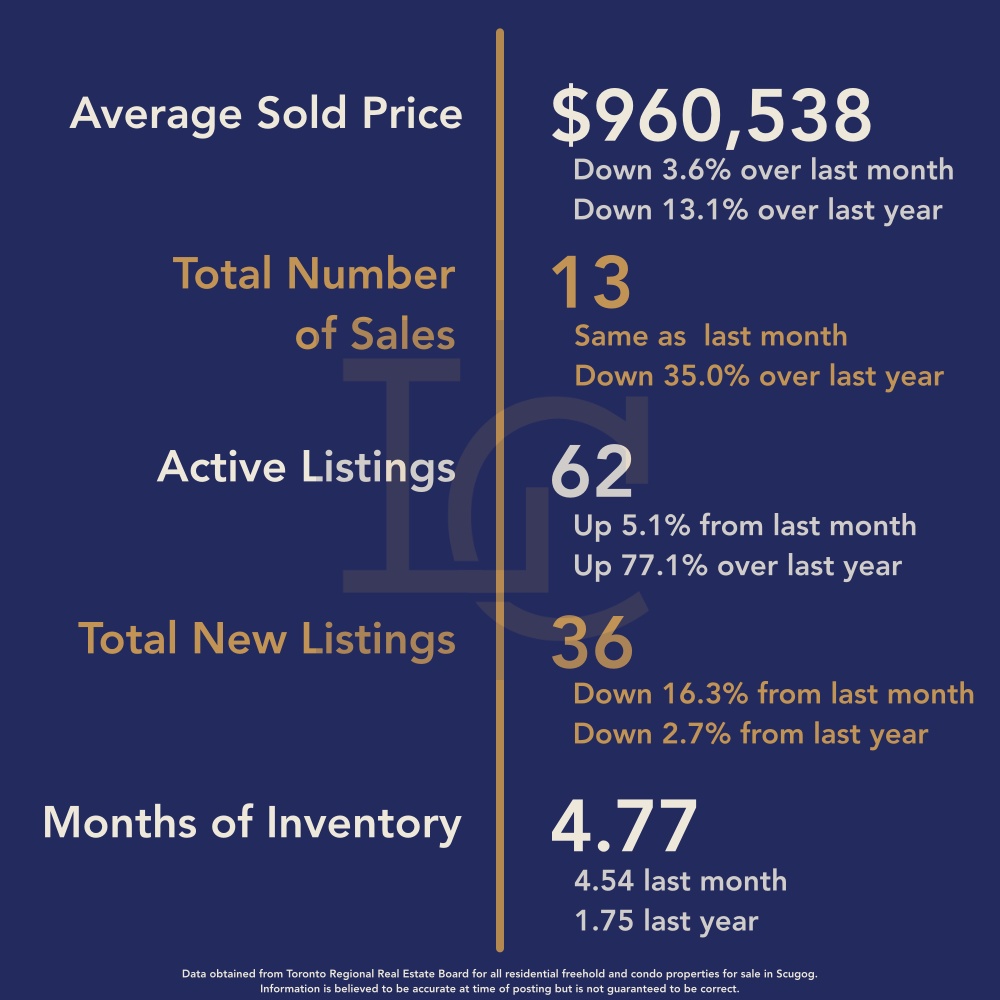
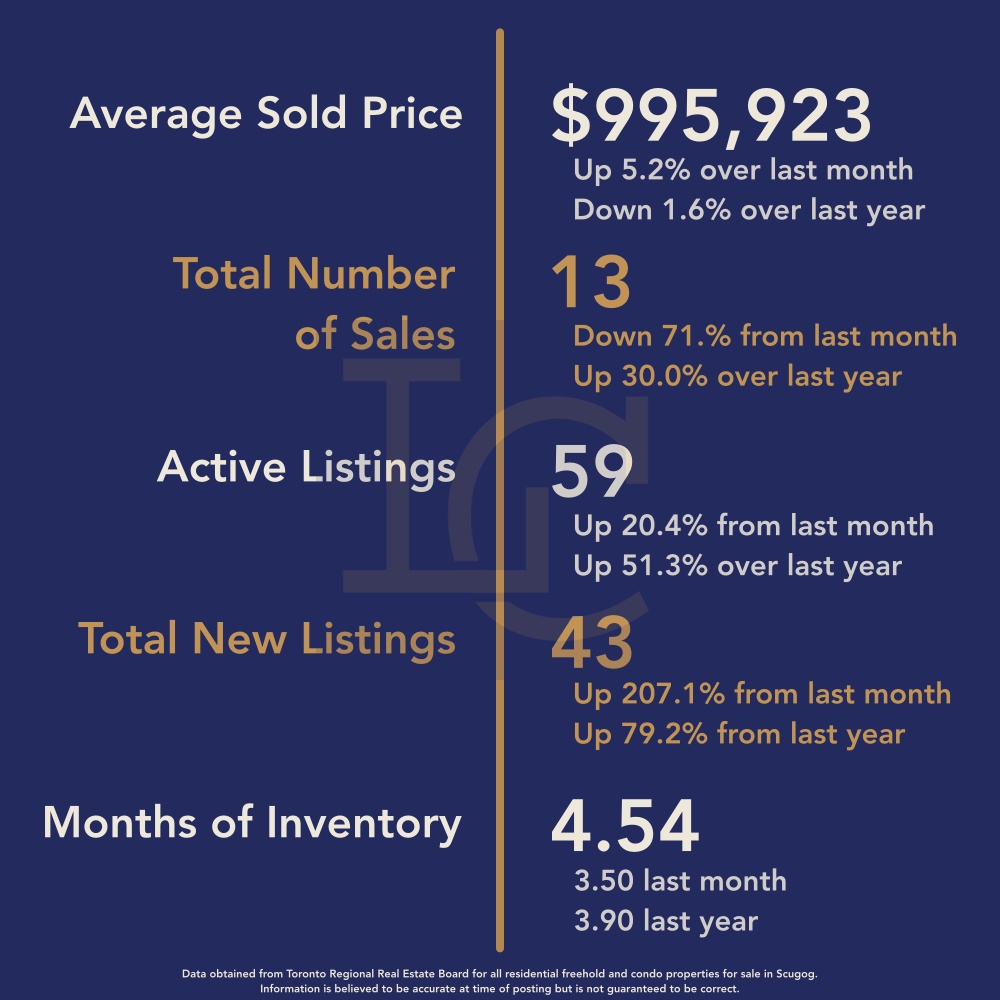
The average sales price for February 2025 was $960,538, reflecting a 13.1% decline from February 2024 ($1,104,695) and a 3.6% drop from January 2025 ($995,923). This downward trend suggests a shift in buyer behavior, potentially influenced by affordability concerns, higher borrowing costs, or a general market correction after previous price surges.
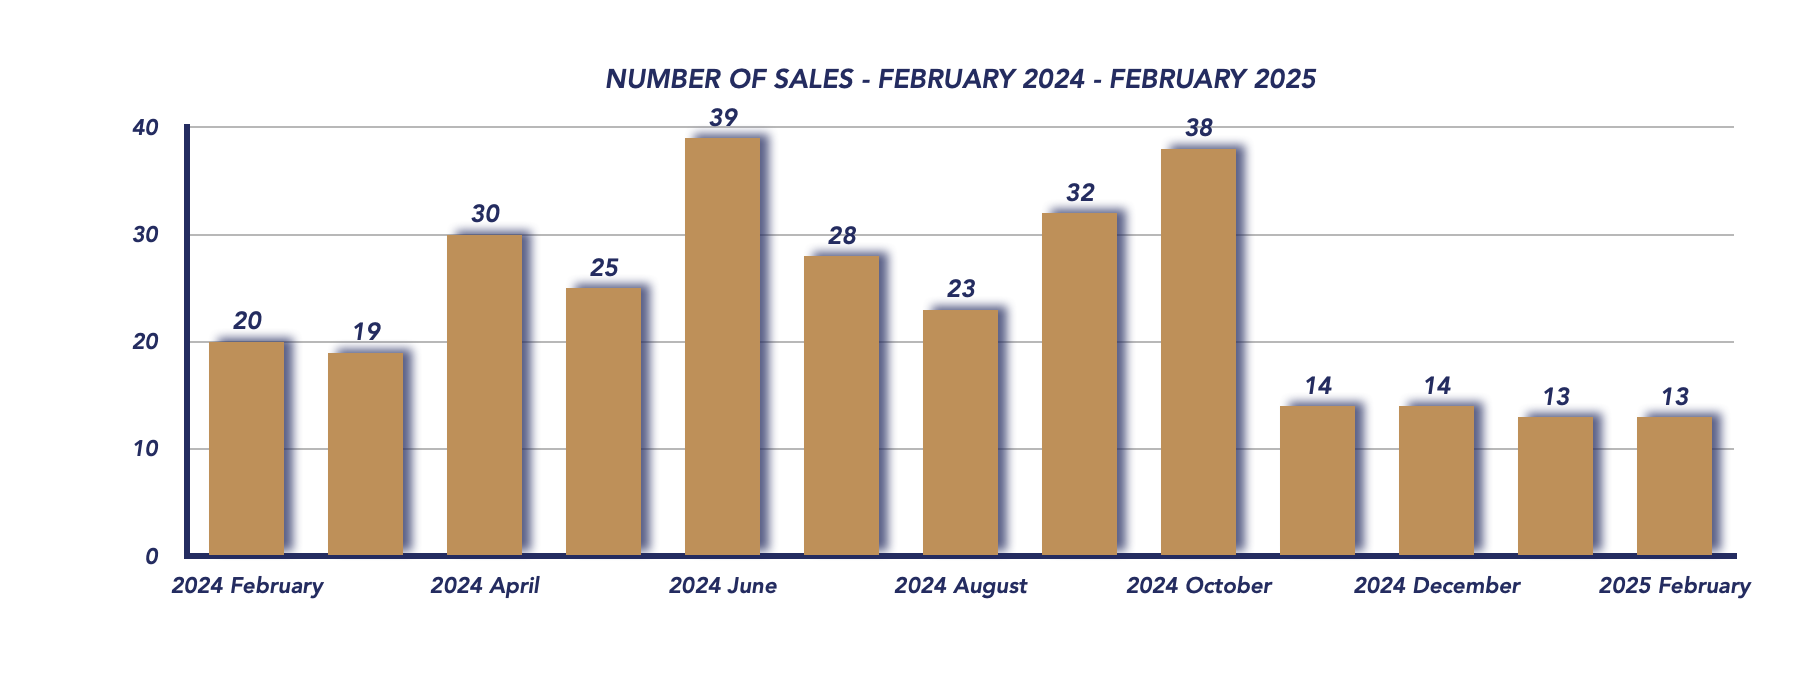
Sales Activity: Fewer Transactions Compared to Last Year
Total sales remained stagnant at 13 transactions, the same as January but significantly lower than 20 sales in February 2024. Despite this, the range of property sales remained diverse, spanning from $641,000 to $1,400,000, with three homes selling for over $1.2 million. This indicates that while demand has softened, there are still buyers in the market for higher-end properties.
Market Competitiveness: Lower Sale-to-List Price Ratio
The sale-to-list price ratio declined to 96%, down from 98% last month, signaling increased negotiation between buyers and sellers. This suggests that properties are not achieving as close to their asking prices as they were in the previous month, a sign of a market favoring buyers more than sellers.
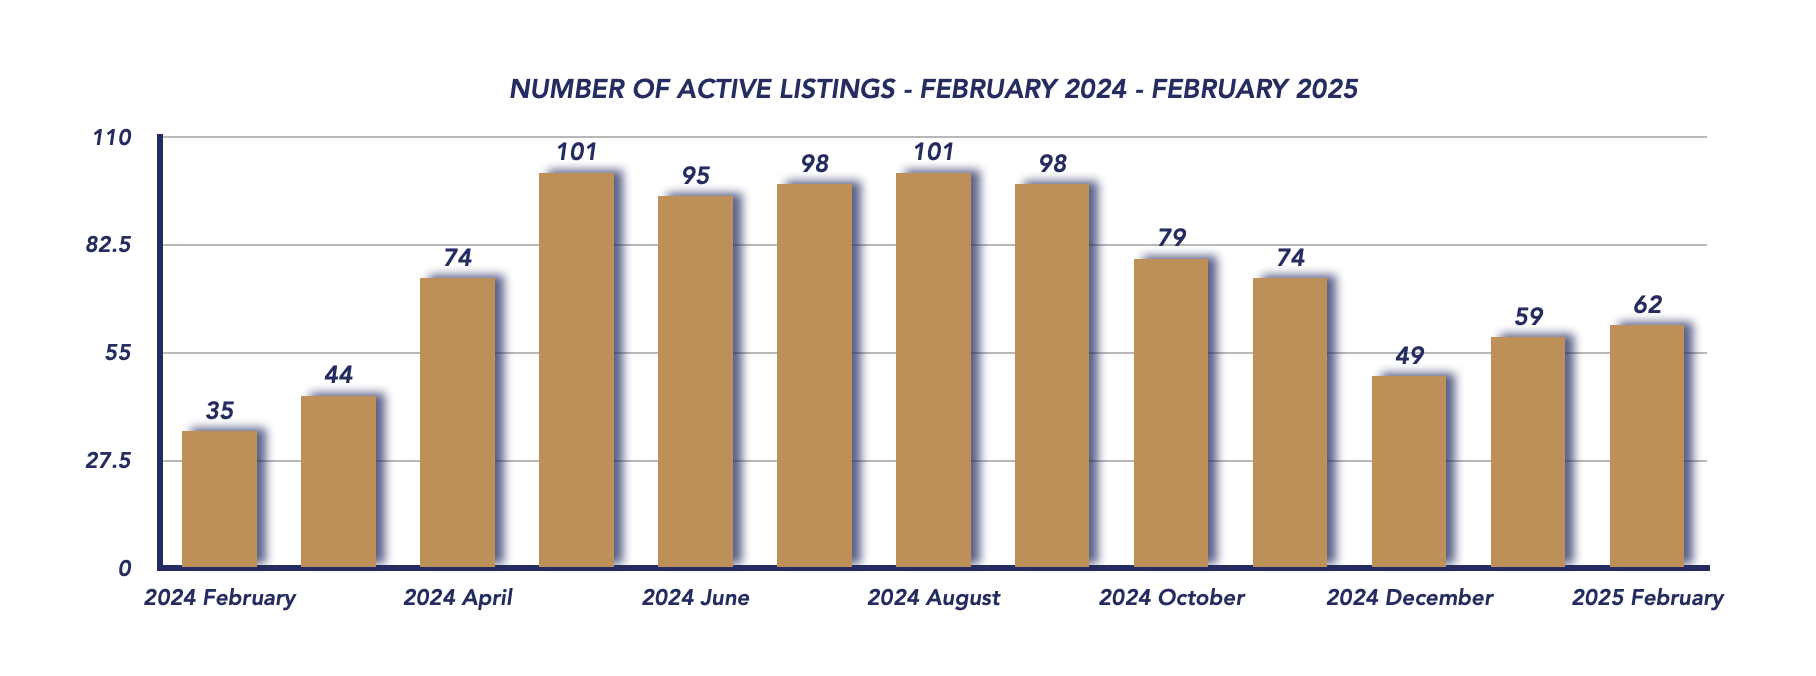
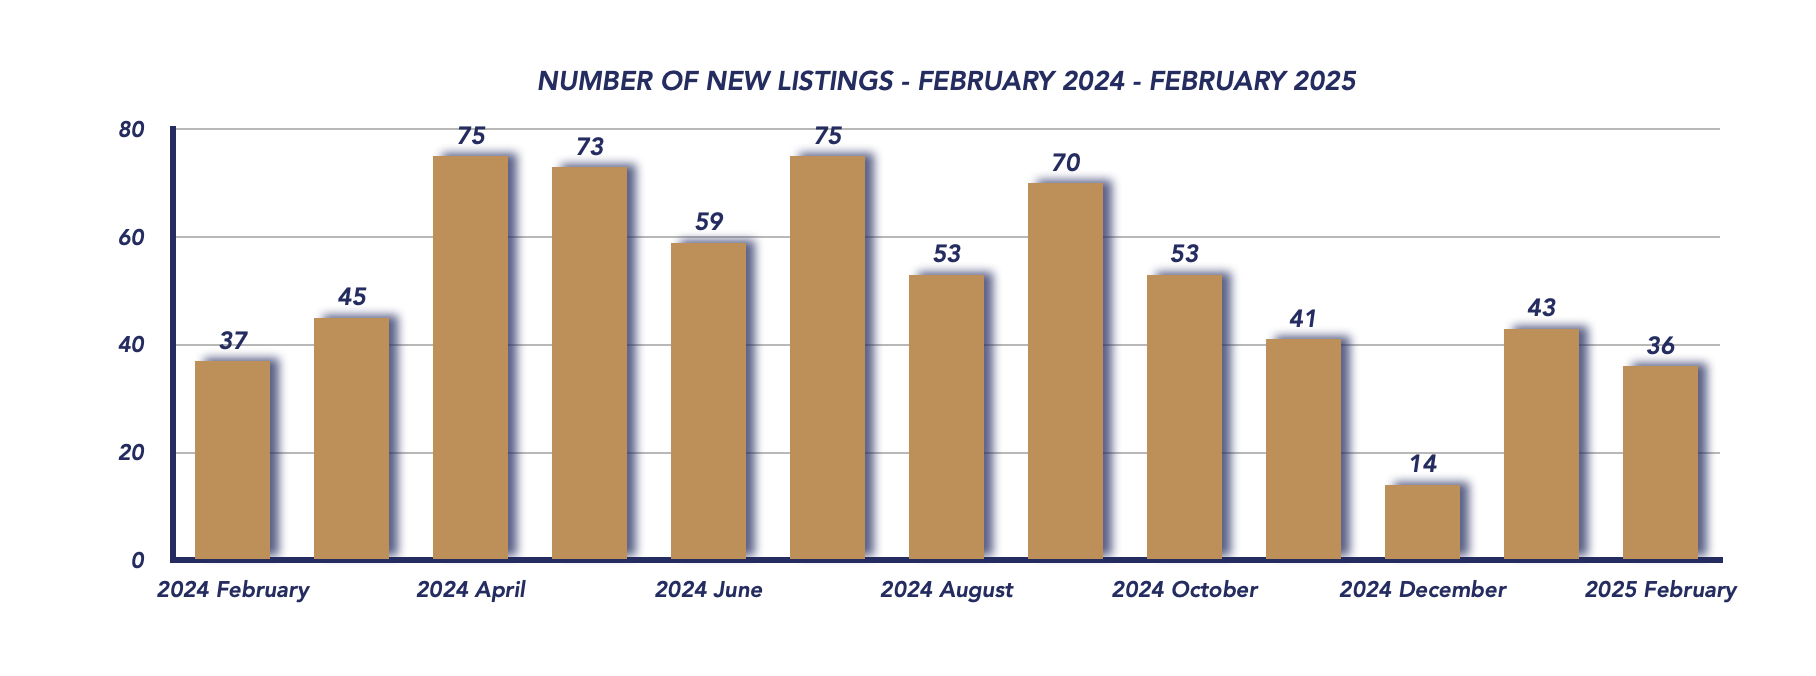
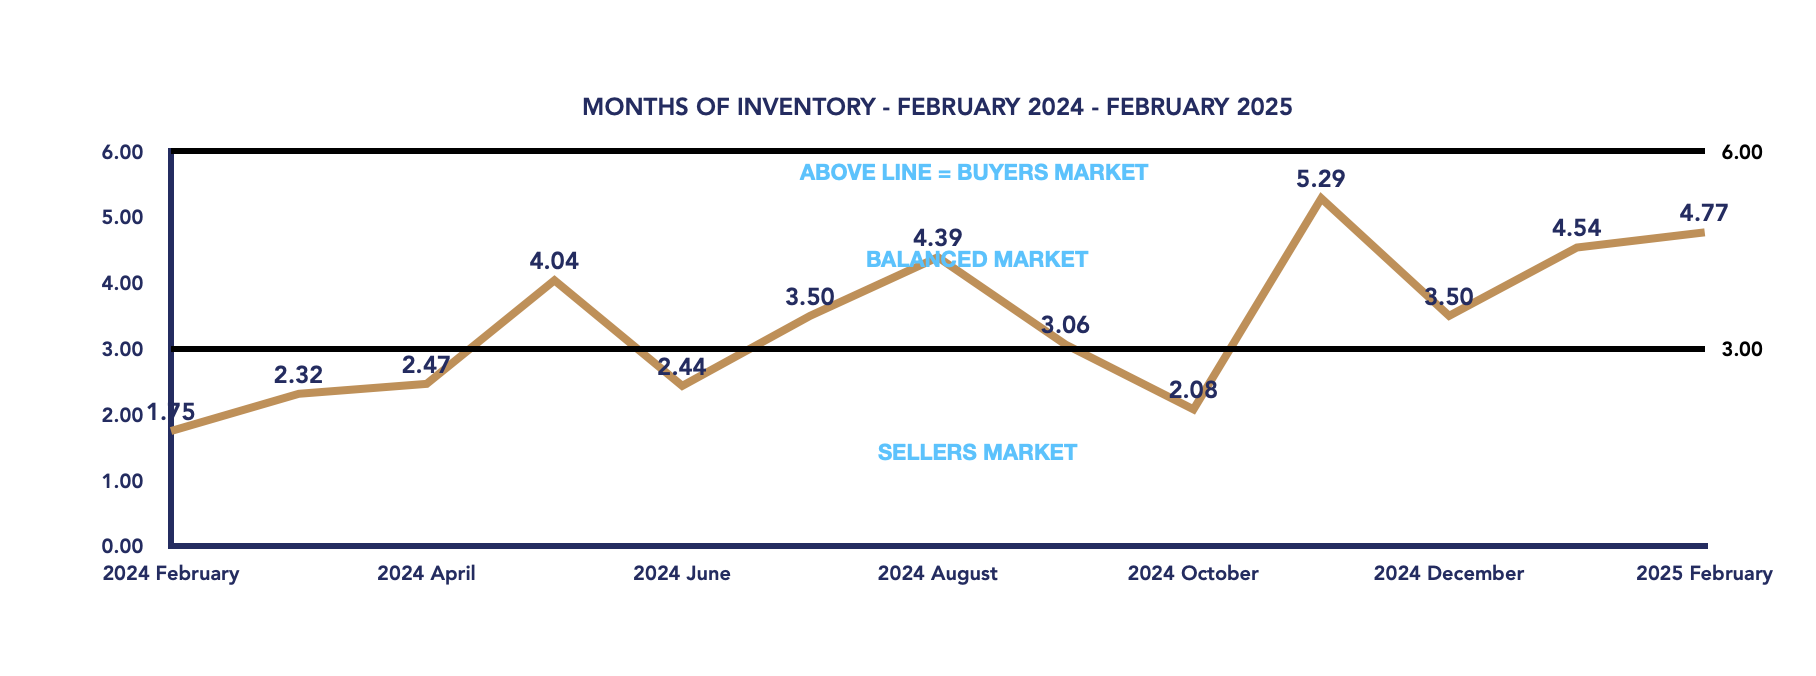
Inventory & Supply: Balanced Market Continues
New listings fell to 36, compared to 43 in January and 37 in February 2024, indicating a moderate decrease in seller activity. Meanwhile, the months of inventory edged slightly higher to 4.77 months, up from 4.54 in January, further reinforcing the presence of a balanced market where neither buyers nor sellers hold a strong advantage.
Time on Market: Homes Taking Longer to Sell
The average days on market for properties in February was 52 days, reinforcing the trend of longer selling times. This suggests that buyers are being more selective, and sellers may need to adjust pricing expectations or offer more incentives to close deals.
Conclusion: A Cooling Market with Opportunities for Buyers
The Scugog Township real estate market is continuing its cooling trend, with declining home prices, steady but reduced sales, and longer time on market. While sellers are still achieving respectable prices, the lower sale-to-list price ratio and increasing inventory suggest buyers may have more negotiating power in the coming months. However, with sales remaining steady, the market continues to exhibit characteristics of a balanced environment, rather than a steep downturn.
As we move into the spring market, it will be important to monitor whether increased listing activity and potential interest rate shifts impact buyer confidence and overall market momentum.
February 2025
January 2025
Average Sold Price
Number of Properties Sold
Active Listings
Number of New Listings
Months of Inventory
MONDAY MARKET MINUTES
Monday February 3
Monday February 10
Monday February 24
Monday March 3
*Information is believed to be accurate at time of posting but is not guaranteed to be correct. Some values may vary slightly based on the exact date and time the reports were generated. Market stats are provided by TRREB (Toronto Regional Real Estate Board) and are based on sales for the month of Attached/Row/Townhouses, Condo Apartments, Condo Townhouses, Detached, Detached with Common Elements, Link Homes and Semi-detached. *Some values may vary slightly based on the exact date and time the reports were generated.
Not intended as a solicitation if your property is already listed by another broker. Affiliated real estate agents are independent contractor sales associates, not employees. ©2021 Coldwell Banker. All Rights Reserved. Coldwell Banker and the Coldwell Banker logos are trademarks of Coldwell Banker Real Estate LLC. The Coldwell Banker® System is comprised of company owned offices which are owned by a subsidiary of Realogy Brokerage Group LLC and franchised offices which are independently owned and operated. The Coldwell Banker System fully supports the principles of the Fair Housing Act and the Equal Opportunity Act.
Click below for more reports
Check out our Uxbridge and Scugog Events Pages to keep up to date on whats going on around town. Click the links or scan the Code with your phone to take you directly there.

UXBRIDGE EVENTS

SCUGOG EVENTS


