
 Facebook
 X
X
 Pinterest
 Copy Link
Uxbridge Housing May 2025

Uxbridge Housing May 2025

Each office is independently owned and operated
![]()

![]()
Housing Market Report for May 2025
Here is the Township of Uxbridge Housing May 2025 report (all housing types), with reports from the Canadian Real Estate Association, and Toronto Regional Real Estate Board included.
This housing report for Durham Region includes the number of new listings, average list price, number of properties sold, average selling price, average days on market and average asking price to selling price ratio for all property types within the Region of Durham.
Scroll to the bottom for links to take you to the housing market reports for Durham Region, Scugog and Brock.
![]()
![]()
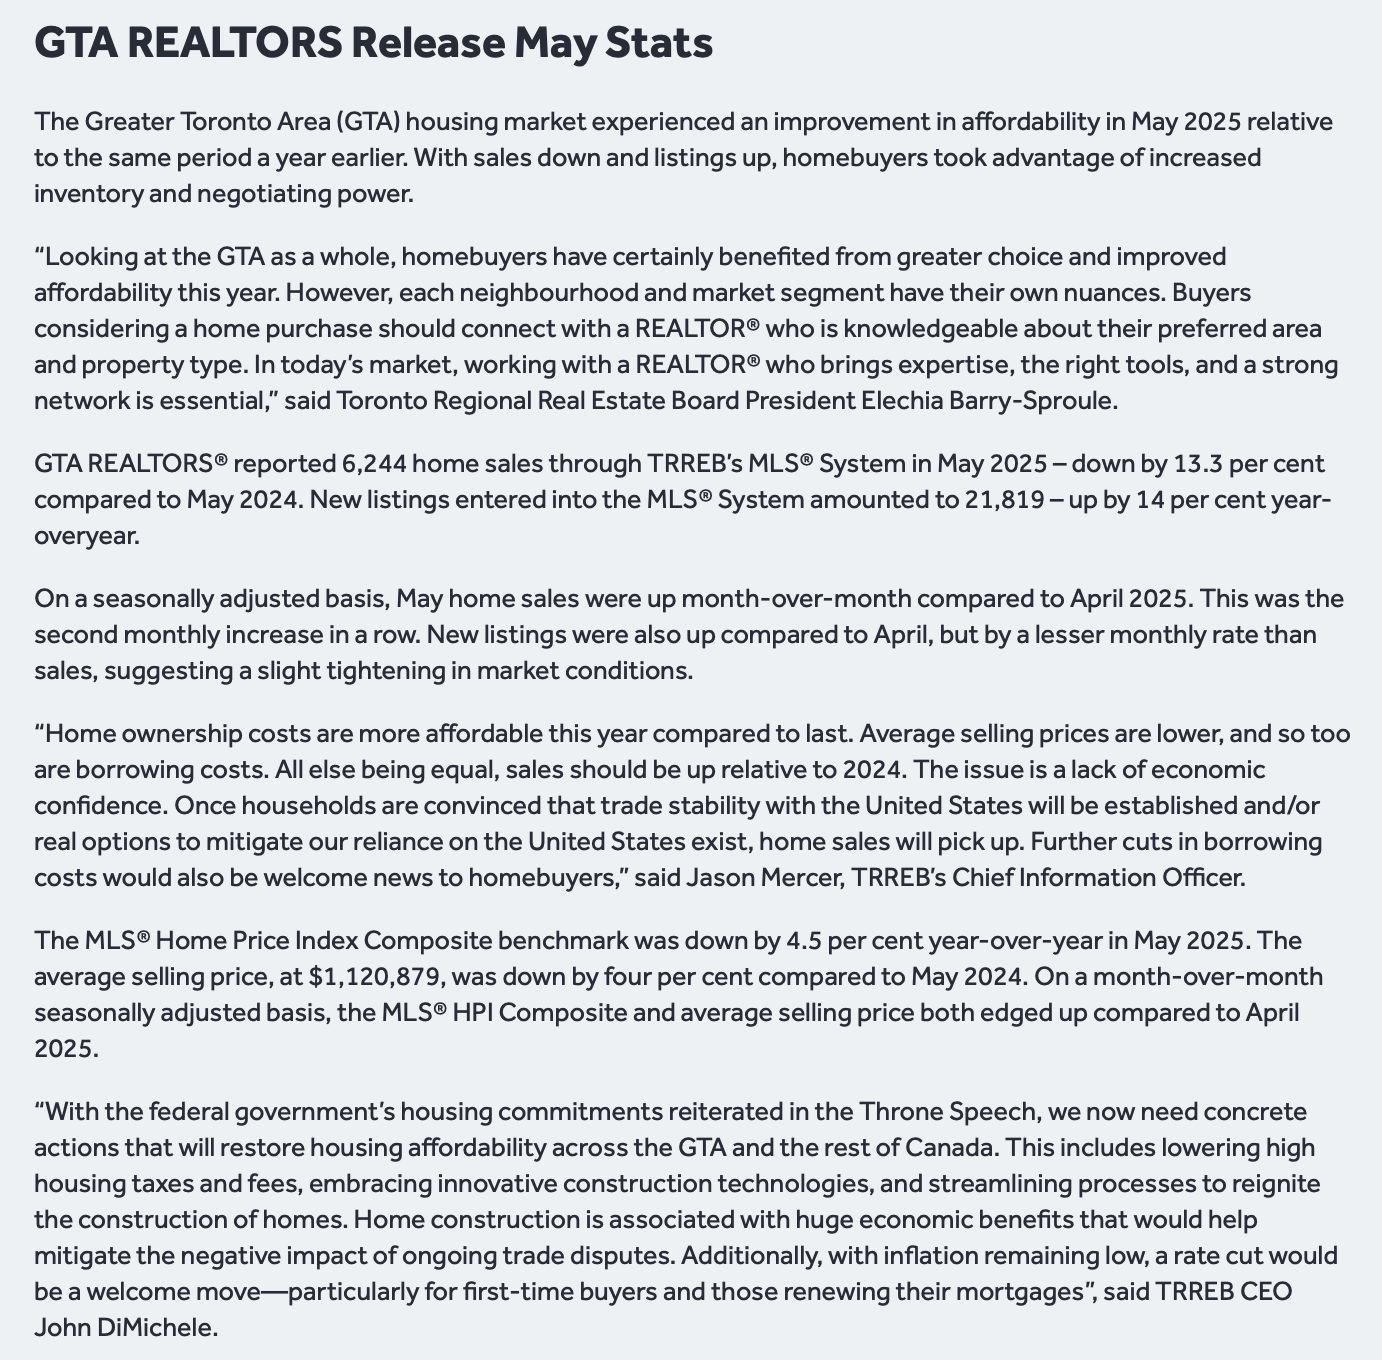
From Toronto Regional Real Estate Board
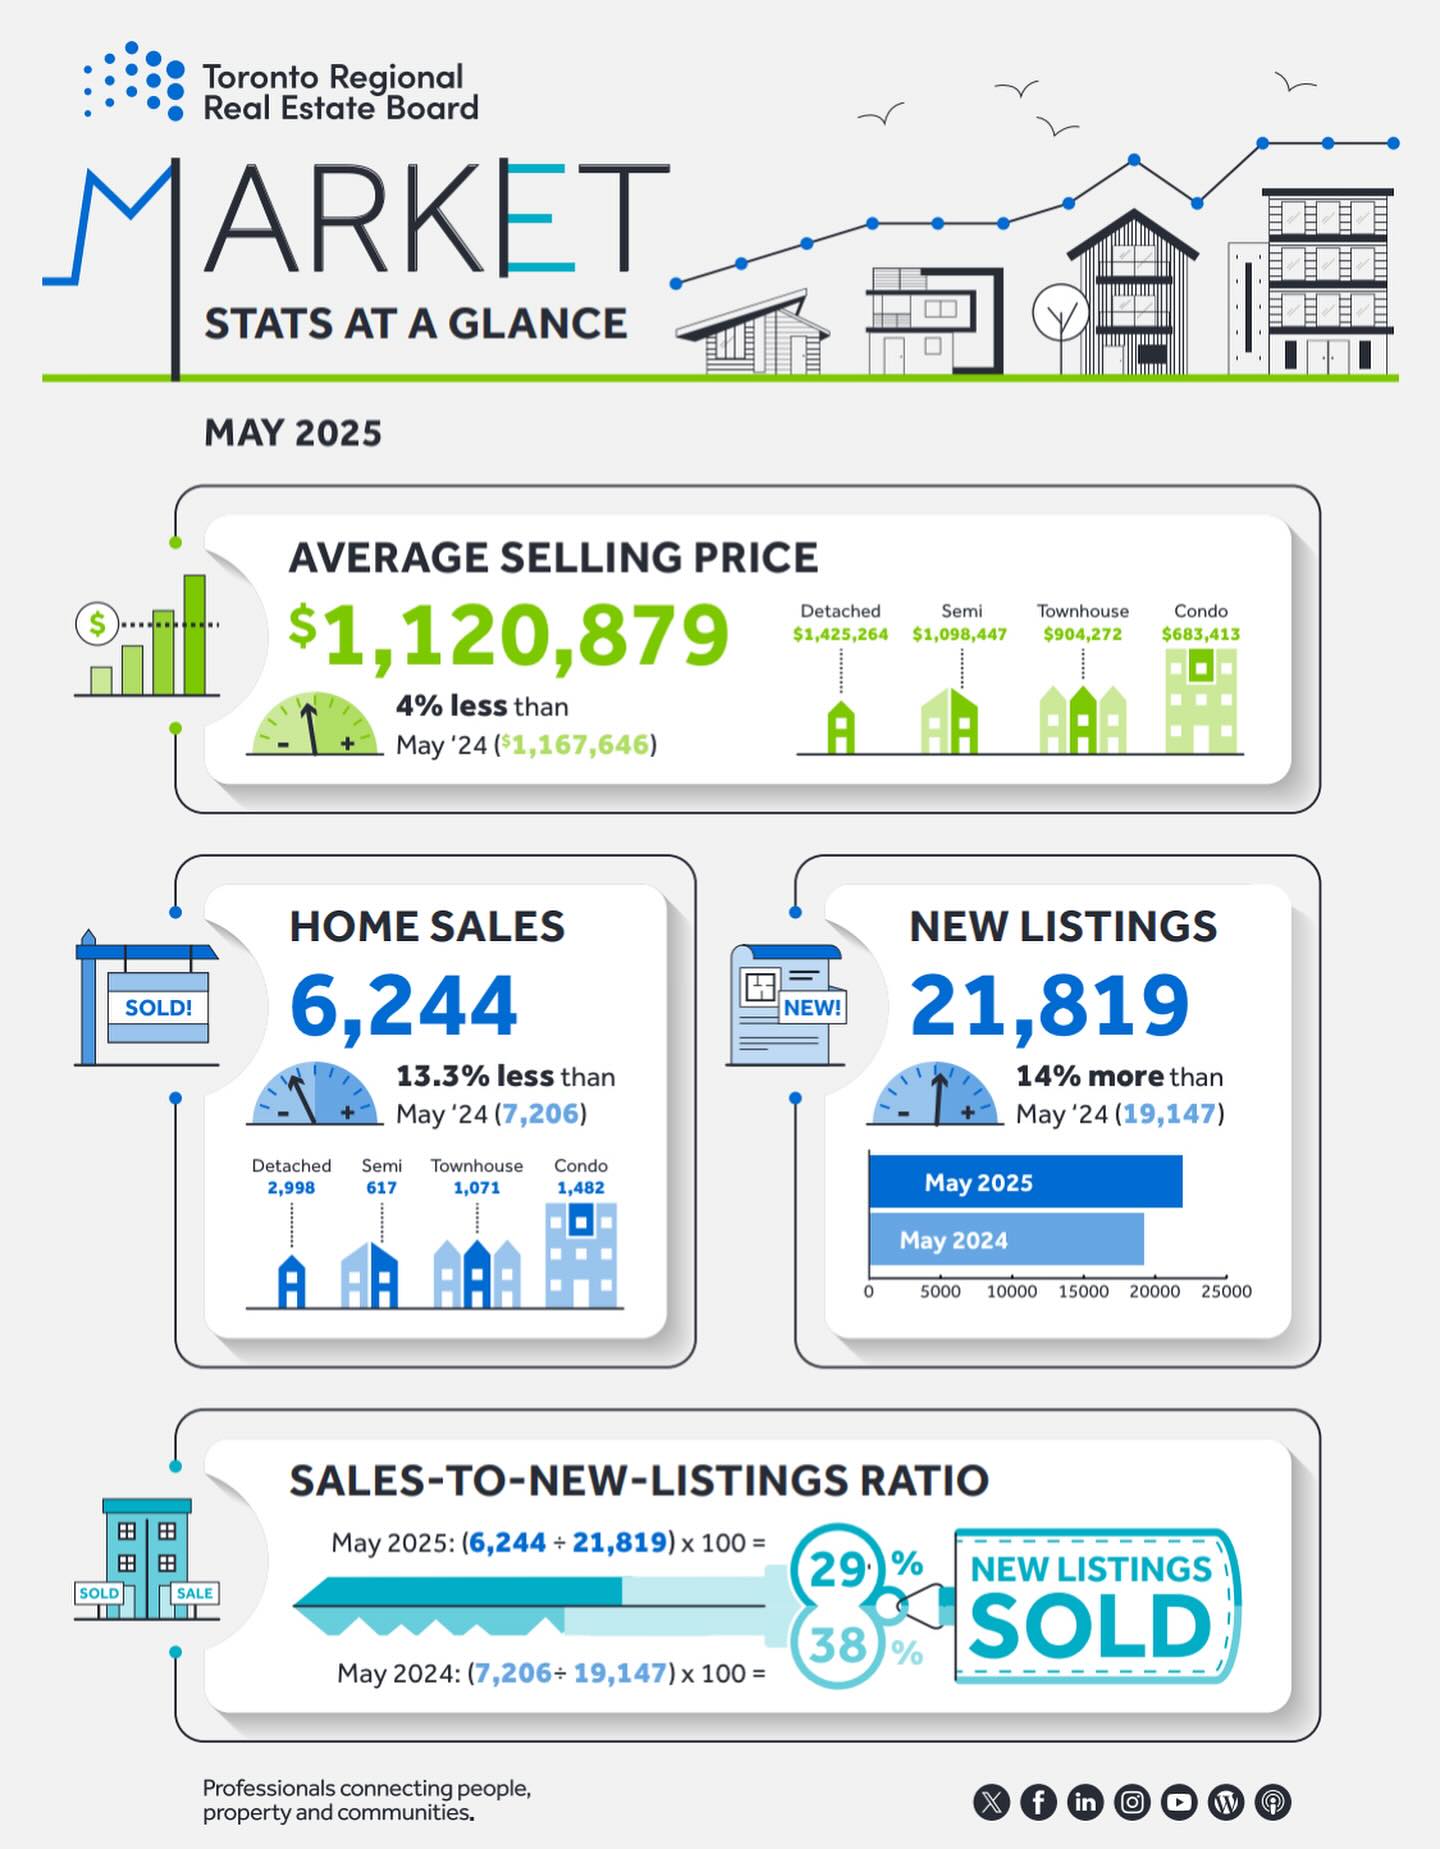
Read the Toronto Regional Real Estate Board Market Watch Report
![]()
Uxbridge Township Real Estate Market Analysis – May 2025
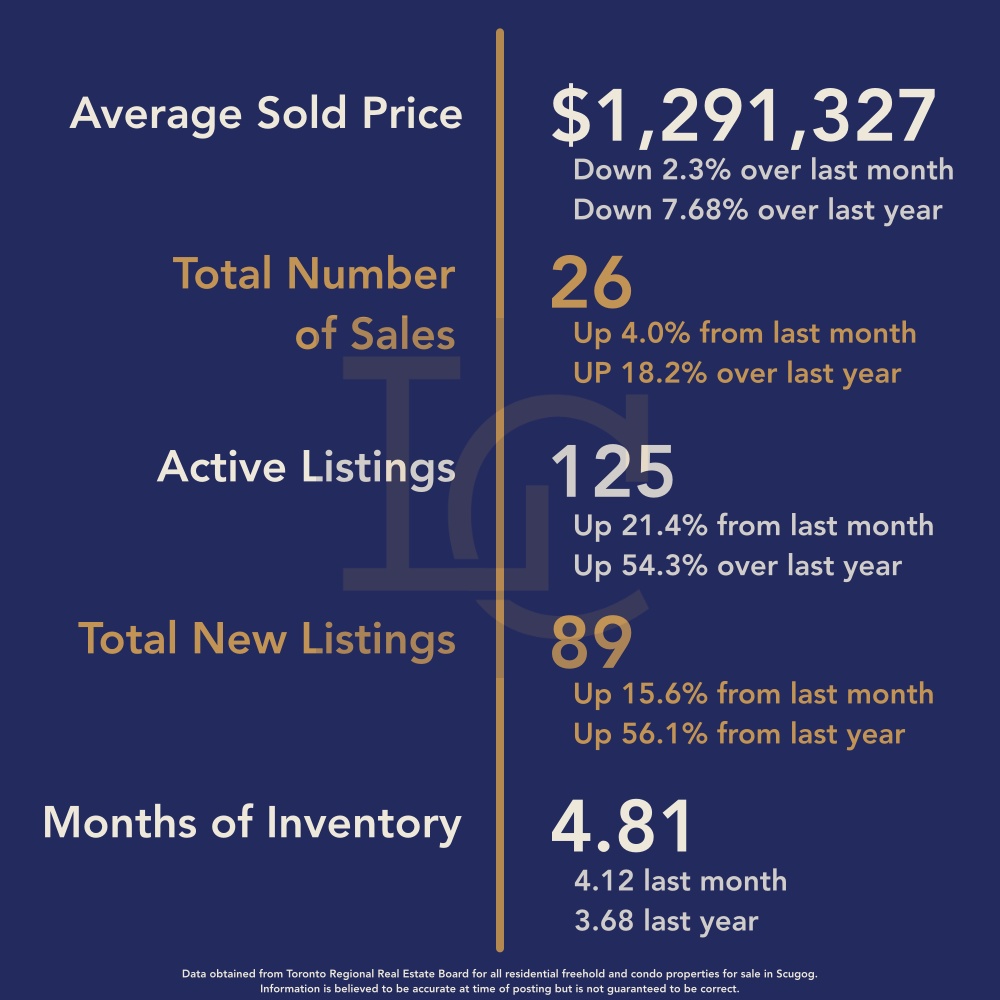
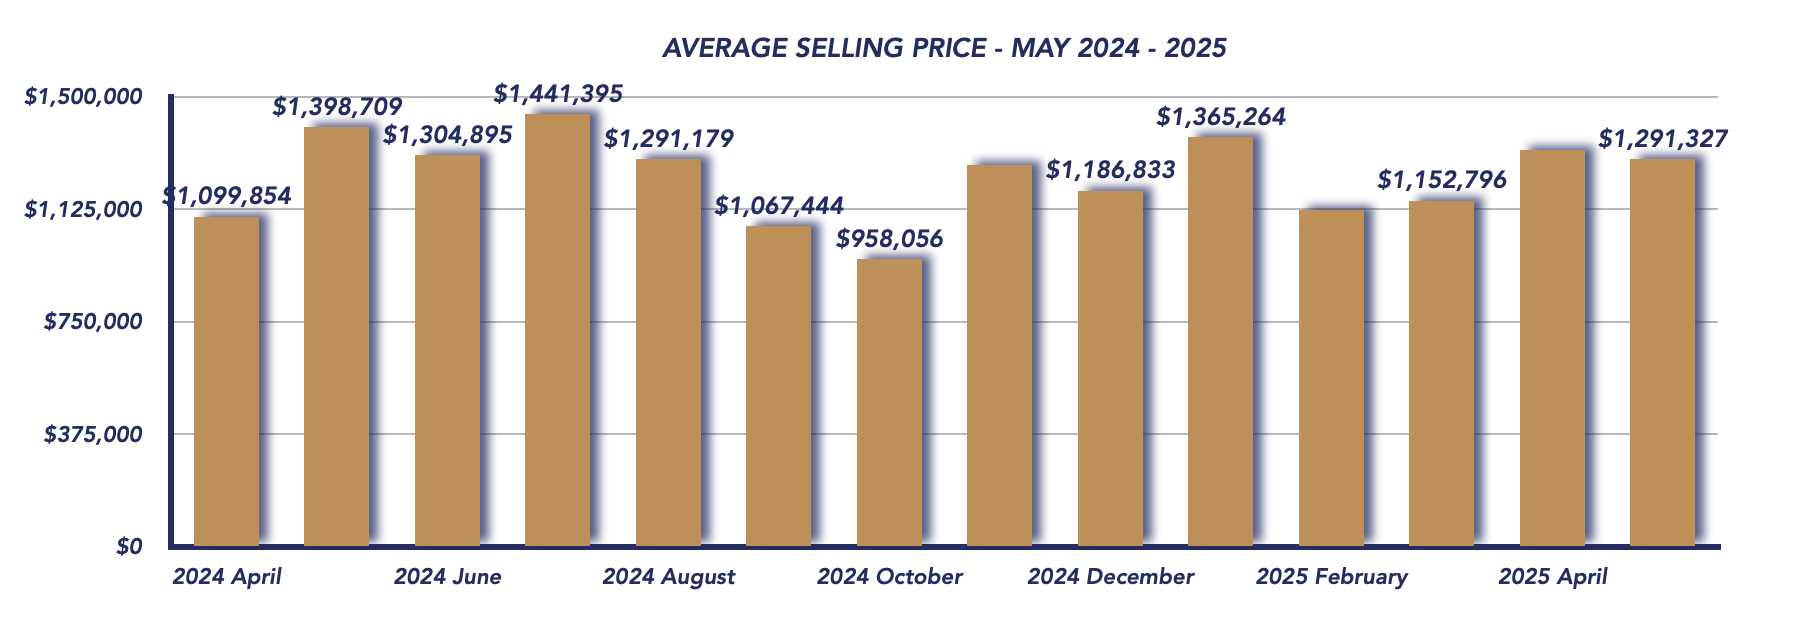
The real estate market in Uxbridge Township continued to show signs of stability in May 2025, though pricing and inventory shifts suggest that buyers are gaining more choice and leverage. The average sale price settled at $1,291,327, marking a 2.3% decline from April’s $1,321,060 and a 7.7% drop compared to May 2024’s $1,398,709. It’s worth noting that a single high-value sale at $3.7 million likely elevated the average price, masking the full extent of the price softening in the general market.
May 2025
April 2025
Sales Volume & Price Positioning
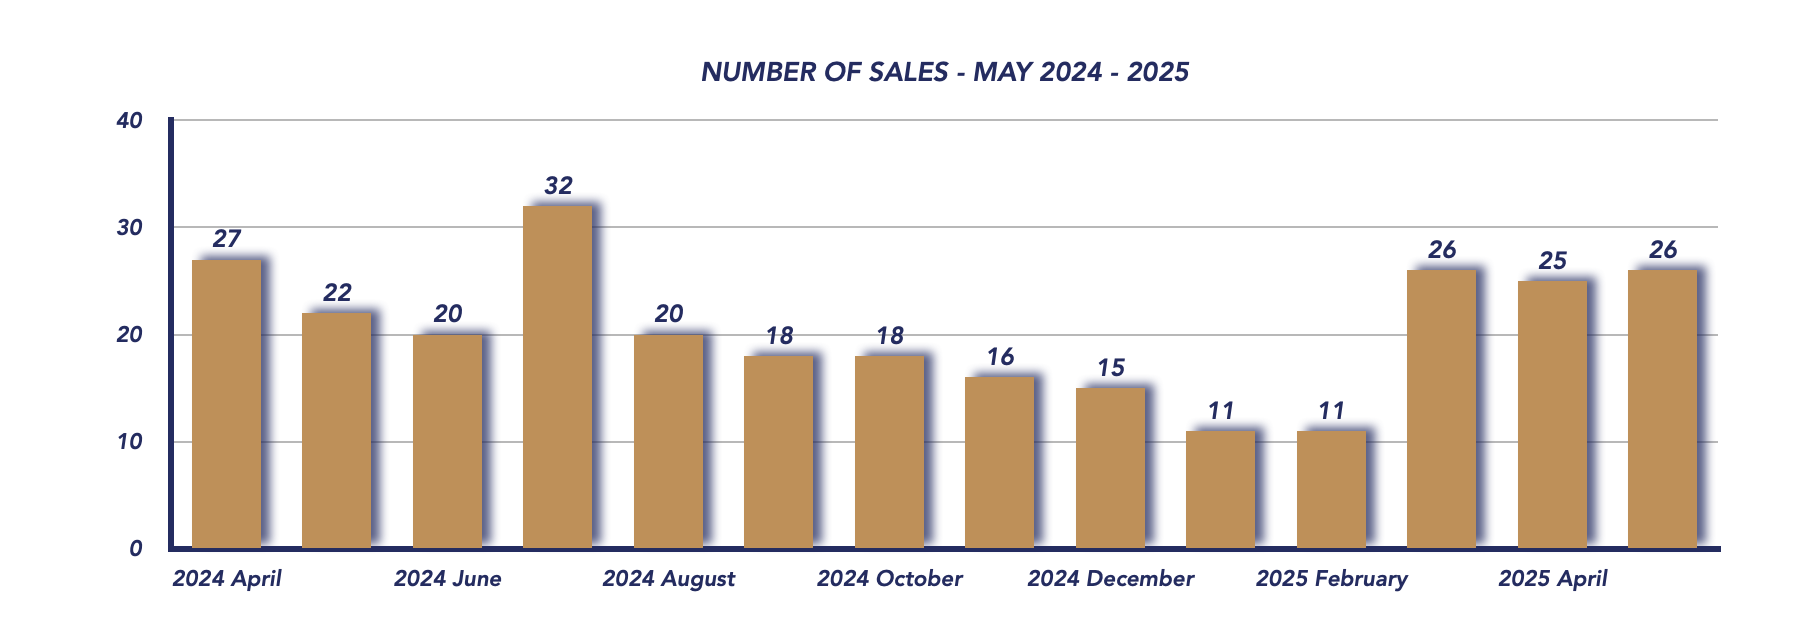
Despite the downward trend in average pricing, total sales increased to 26 transactions, slightly up from 25 in April and 22 last May, suggesting that buyer activity remains steady. The sale-to-list price ratio held firm at 97%, unchanged from both the previous month and last year, indicating a market where properties are still selling close to asking but without the aggressive bidding seen in previous years.
Inventory Growth & New Listings
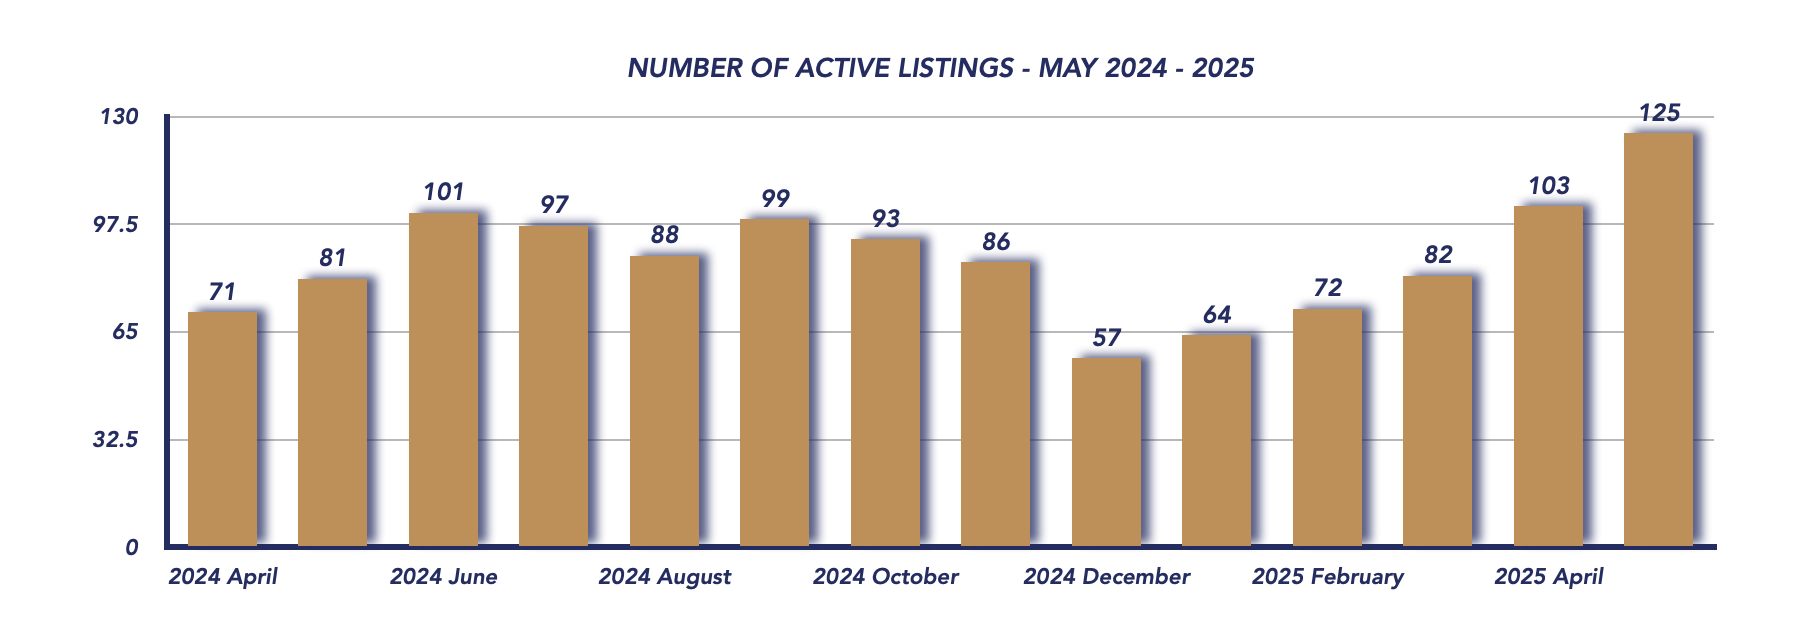
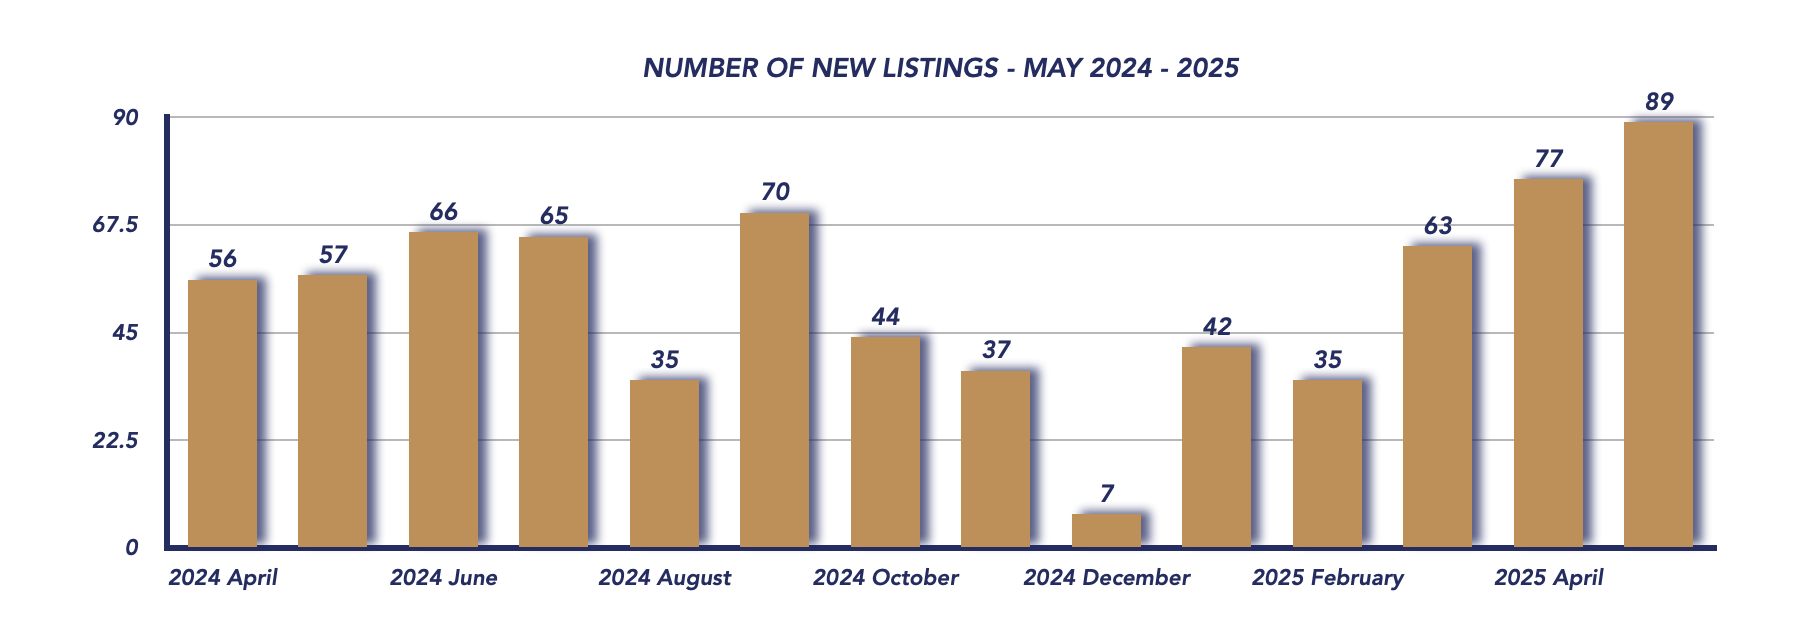
The number of active listings surged to 125, up from 103 in April and significantly higher than the 81 listings recorded in May 2024. At the same time, new listings rose to 89, representing an increase of 15% from last month and a remarkable 56% jump from the same time last year.
This influx of listings suggests that sellers are entering the market in greater numbers, likely motivated by the active spring season and perhaps a desire to list before any broader economic shifts impact buyer confidence.
Market Balance & Buyer Behavior
With more inventory available, the months of inventory climbed to 4.81, up from 4.12 in April, maintaining a position within the balanced market range. This means supply and demand are roughly aligned, giving both buyers and sellers reasonable negotiating ground.
Homes also sold in an average of 27 days, a strong improvement from 48 days in April, indicating a faster-moving market, likely fueled by motivated buyers who are capitalizing on increased selection and slightly softer prices.
Looking Ahead
While average prices continue to adjust, the Uxbridge market remains fundamentally healthy and balanced. Rising inventory and steady sales suggest we’re entering a more normalized real estate cycle, with both buyers and sellers adapting to current conditions.
As the summer market approaches, all eyes remain on broader economic trends and consumer confidence. For now, Uxbridge offers a stable environment for those looking to make a move, whether entering the market or looking to list.
WATCH OUR MONDAY MARKET MINUTES
*Information is believed to be accurate at time of posting but is not guaranteed to be correct. Some values may vary slightly based on the exact date and time the reports were generated. Market stats are provided by TRREB (Toronto Regional Real Estate Board) and are based on sales for the month of Attached/Row/Townhouses, Condo Apartments, Condo Townhouses, Detached, Detached with Common Elements, Link Homes and Semi-detached. *Some values may vary slightly based on the exact date and time the reports were generated.
Not intended as a solicitation if your property is already listed by another broker. Affiliated real estate agents are independent contractor sales associates, not employees. ©2021 Coldwell Banker. All Rights Reserved. Coldwell Banker and the Coldwell Banker logos are trademarks of Coldwell Banker Real Estate LLC. The Coldwell Banker® System is comprised of company owned offices which are owned by a subsidiary of Realogy Brokerage Group LLC and franchised offices which are independently owned and operated. The Coldwell Banker System fully supports the principles of the Fair Housing Act and the Equal Opportunity Act.
Click below for more reports
Check out our Uxbridge and Scugog Events Pages to keep up to date on whats going on around town. Click the links or scan the Code with your phone to take you directly there.

UXBRIDGE EVENTS

SCUGOG EVENTS

Brock Housing May 2025

Brock Housing May 2025
Each office is independently owned and operated
![]()
![]()
Housing Market Report for May 2025
Here is the Township of Brock Housing May 2025 report (all housing types), with reports from the Canadian Real Estate Association, and Toronto Regional Real Estate Board included.
This housing report for Durham Region includes the number of new listings, average list price, number of properties sold, average selling price, average days on market and average asking price to selling price ratio for all property types within the Region of Durham.
Scroll to the bottom for links to take you to the housing market reports for Durham Region, Uxbridge and Scugog.
![]()
![]()
From Toronto Regional Real Estate Board
Toronto Regional Real Estate Board – Market Stats At A Glance – May 2025
Read the Toronto Regional Real Estate Board Market Watch Report
![]()
Brock Township Real Estate Market Analysis – May 2025
The Brock Township real estate market saw a strong performance in May 2025, with key indicators pointing to an active and balanced marketplace. Although average prices surged, the month’s data also highlights the impact of high-end transactions and an increase in both supply and demand.
May 2025
April 2025
Average Sale Price Surges — But Needs Context
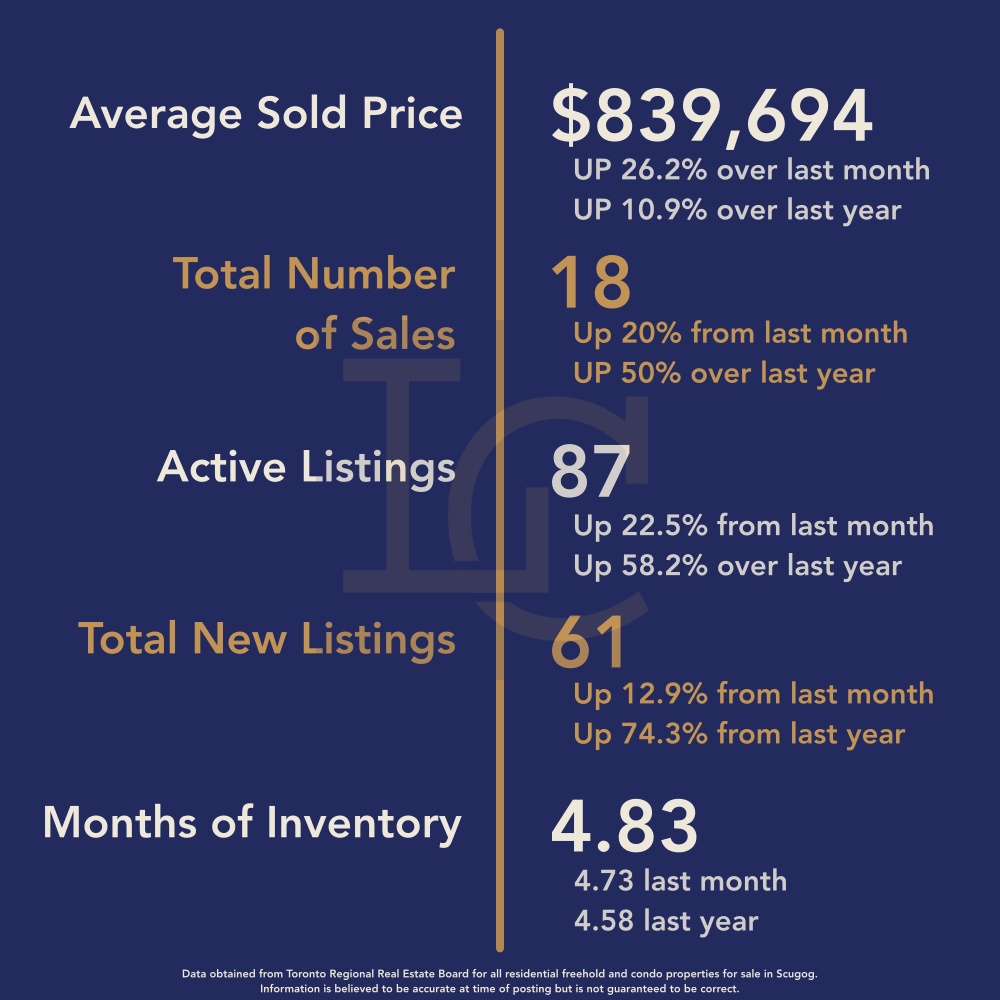
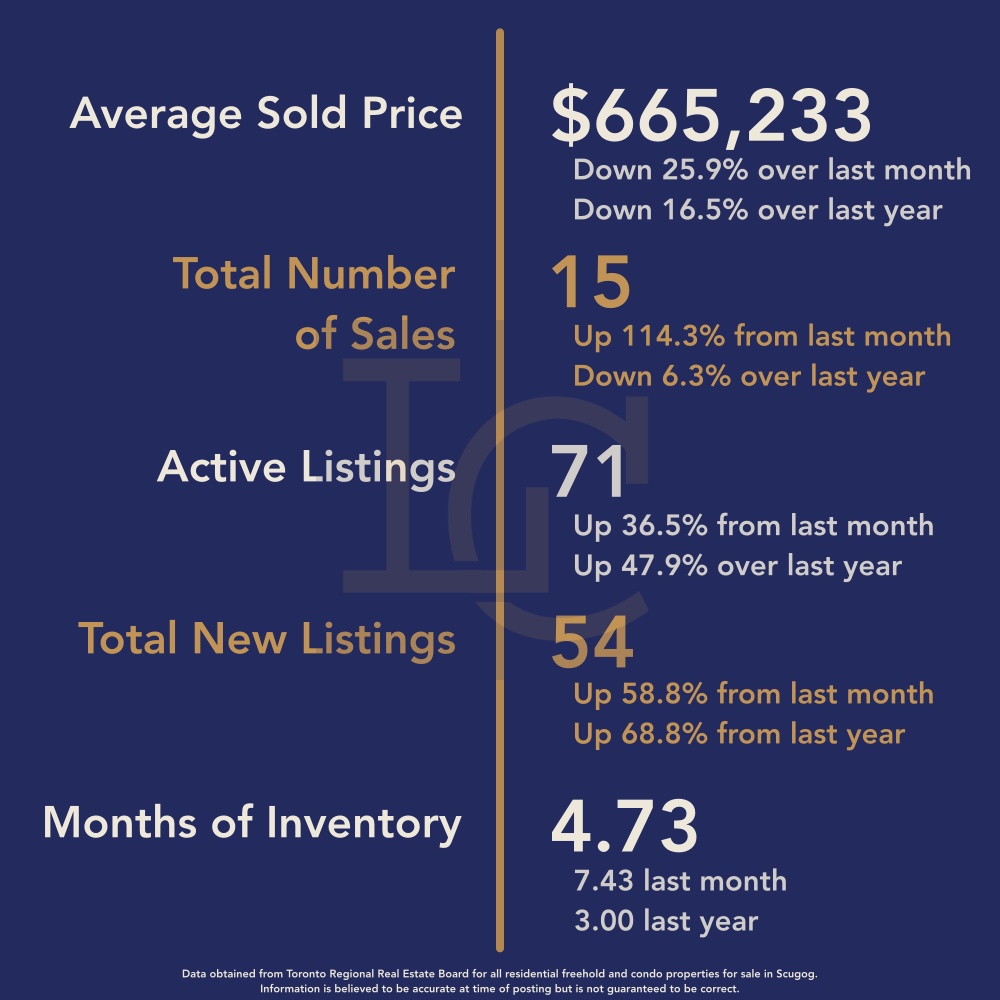
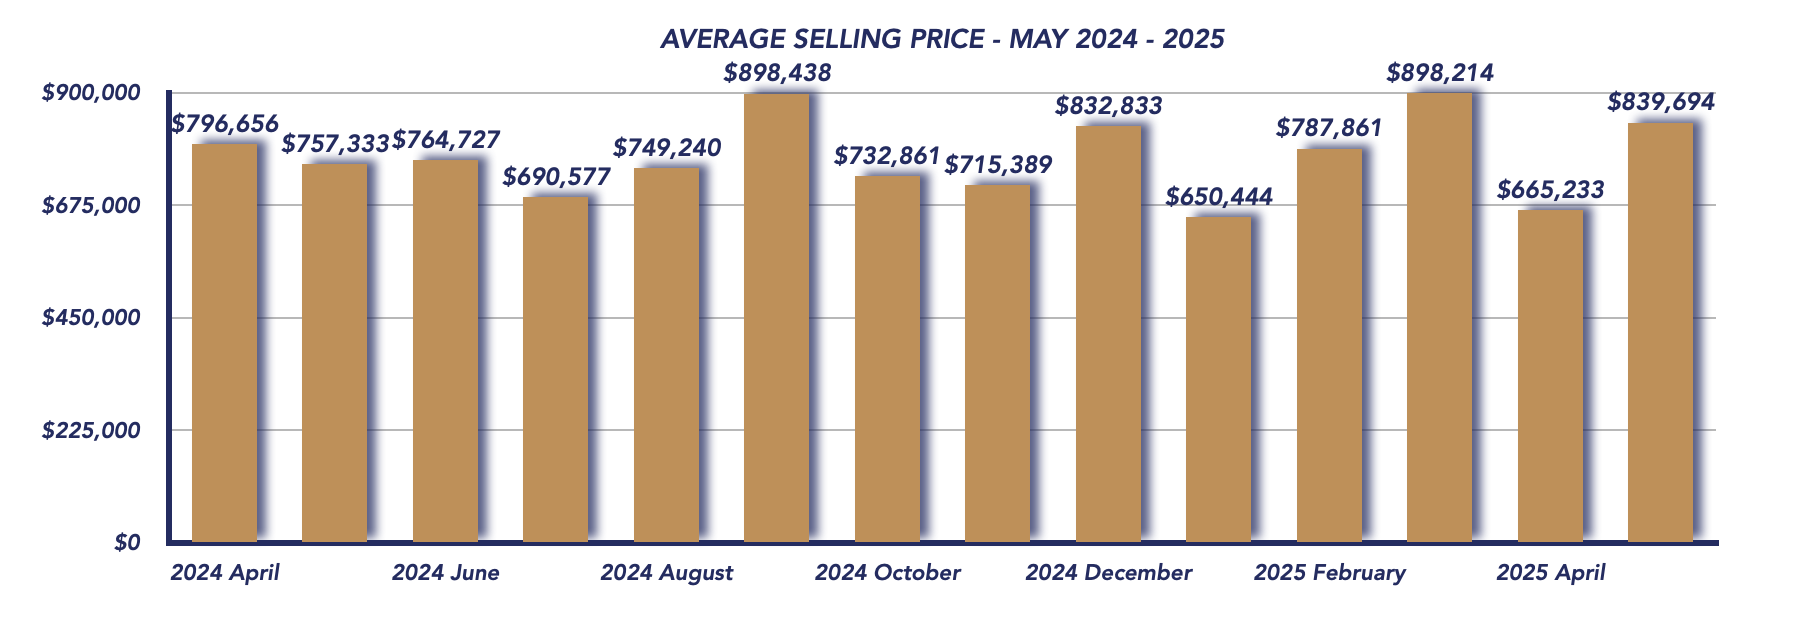
The average sale price jumped to $839,694, reflecting a 26.2% increase from April 2025 ($665,233) and a 10.8% gain over May 2024 ($757,333). However, this spike should be viewed with caution. Two significant high-end sales—one at $1,630,000 and another at $1,400,000—played a major role in elevating the overall average.
When those two sales are removed from the equation, the adjusted average price drops to $717,972, which paints a more balanced and representative picture of the typical home sale in the area. This figure suggests that, while the market remains healthy, it’s not experiencing unchecked price inflation.
Sales Activity on the Rise
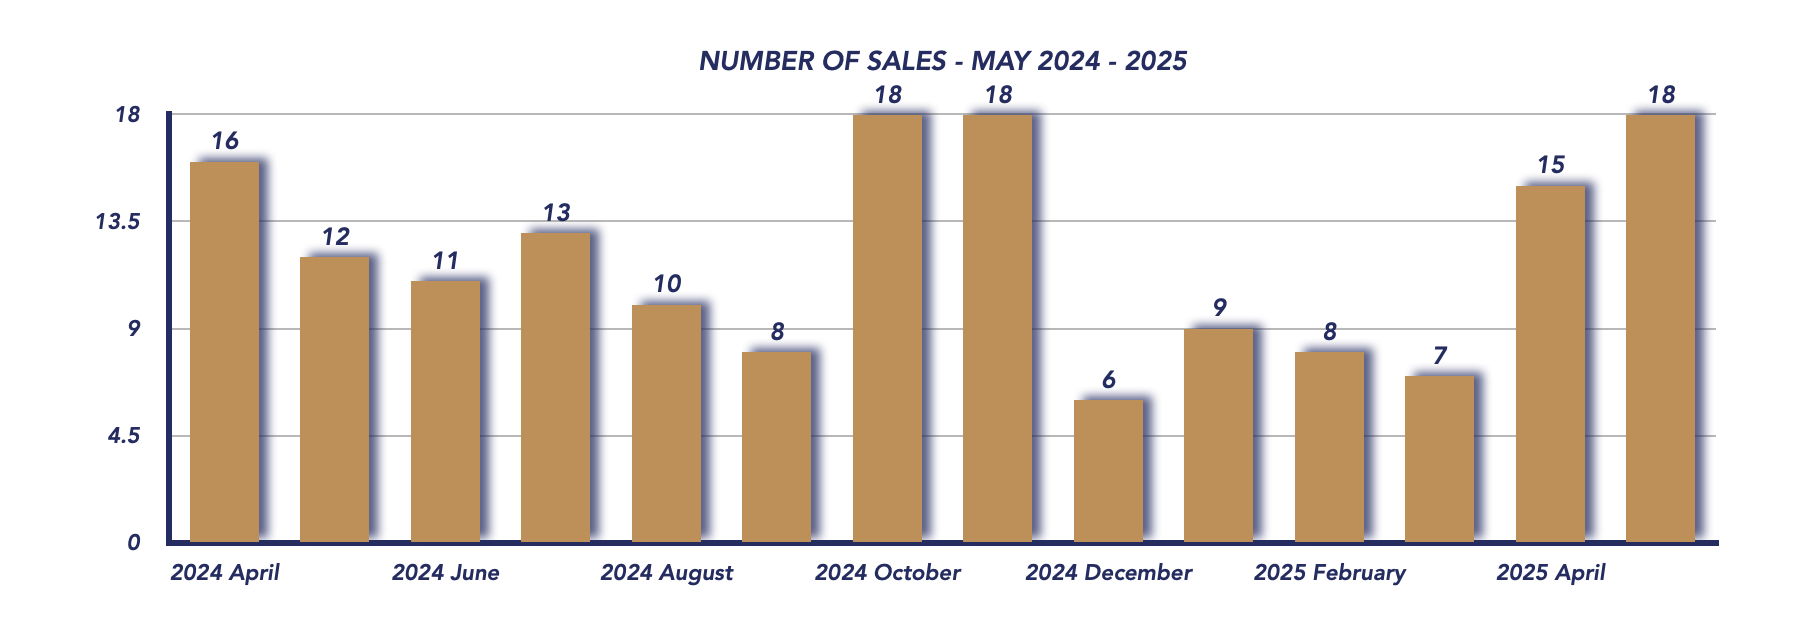
May saw a total of 18 homes sold, up from 15 in April and a notable increase over the 12 homes sold in May 2024. This uptick in sales reflects stronger buyer confidence and ongoing demand, consistent with seasonal trends as the spring market approaches its peak.
Seller Confidence Holding Steady
The sale-to-list price ratio rose slightly to 97%, up from 96% in April and consistent with May 2024. This indicates that sellers are largely achieving their asking prices, and homes are being listed at market-appropriate values.
Inventory & Listings Expand
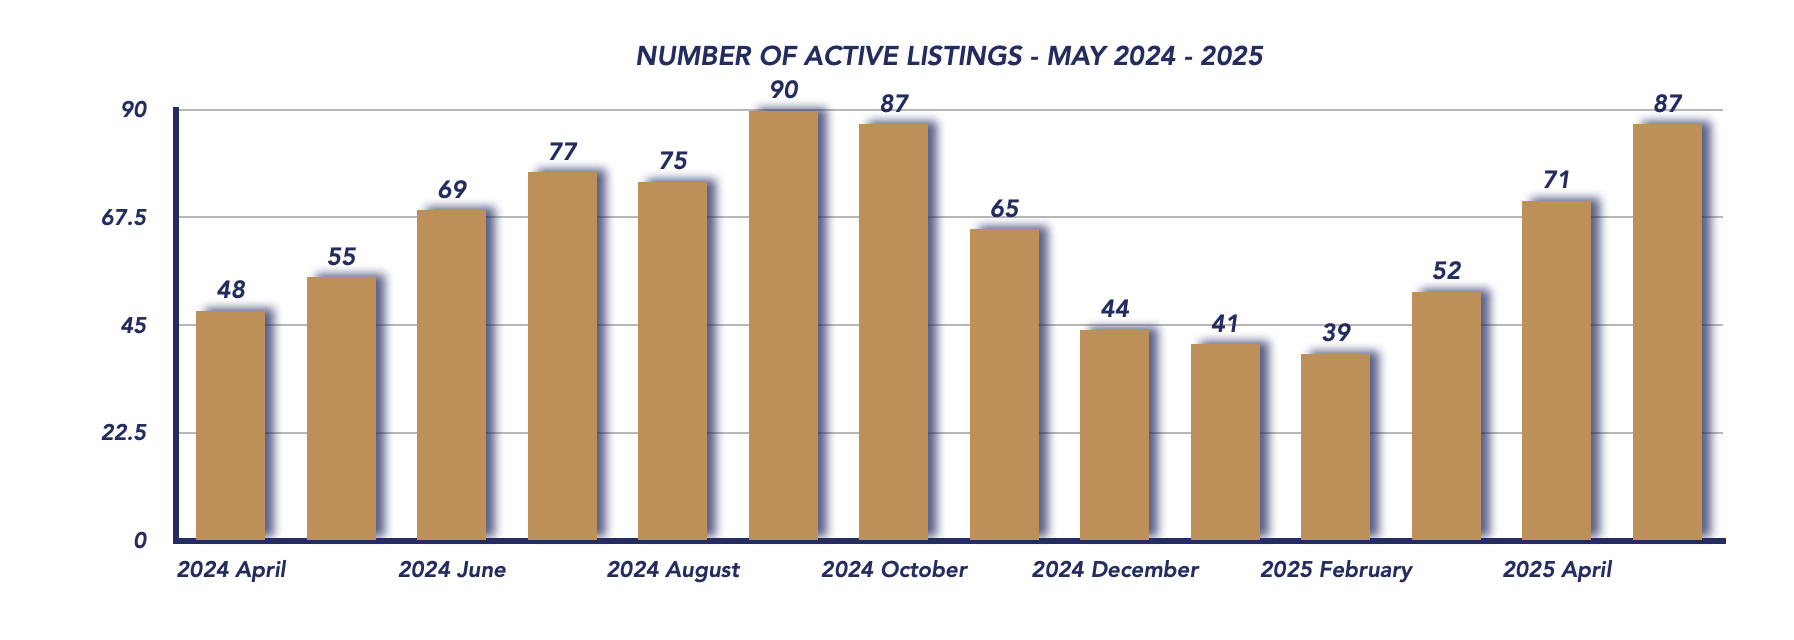
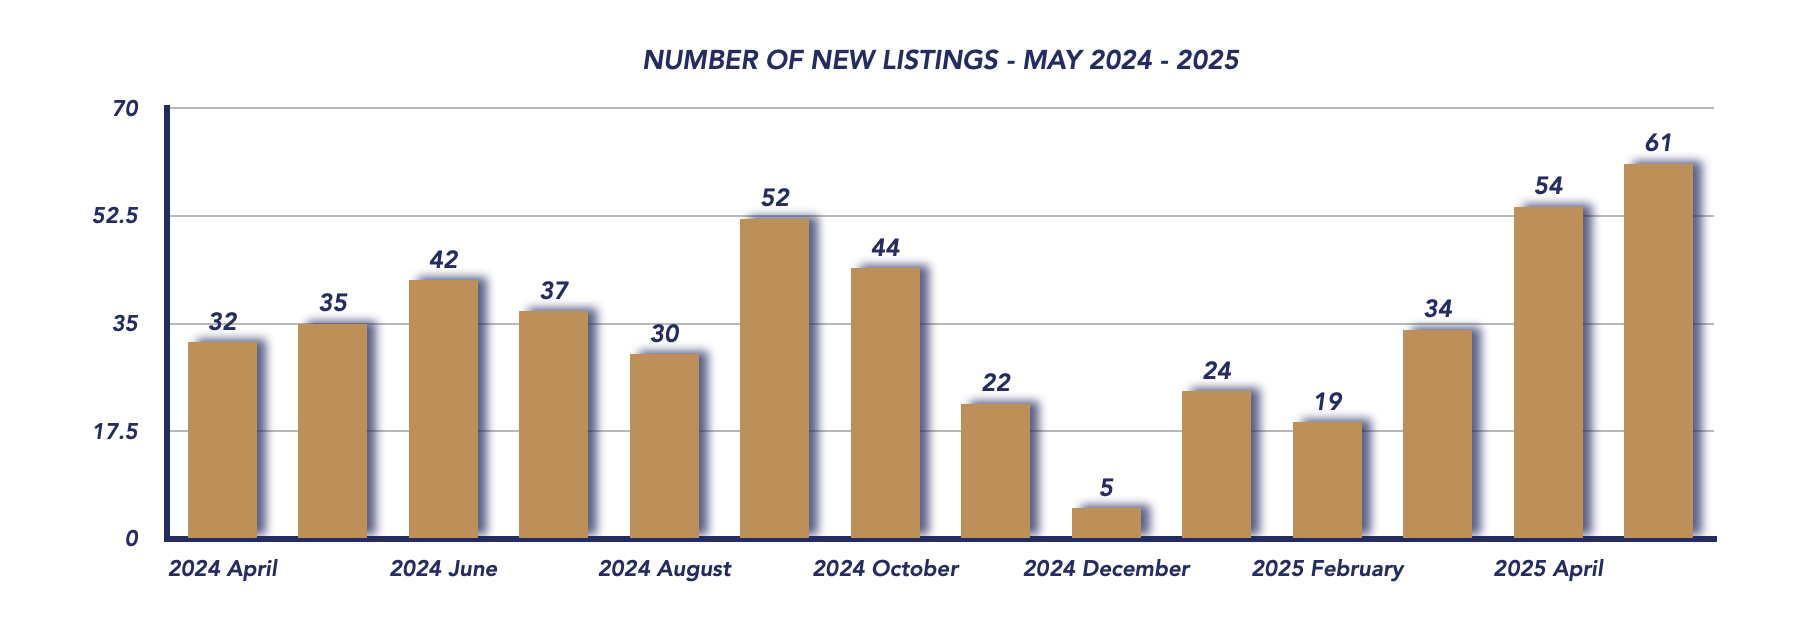
The market welcomed an influx of supply in May. Active listings climbed to 87, up from 71 in April and significantly higher than 55 in May 2024. Additionally, new listings rose to 61, compared to 54 in April and 35 one year ago. This increase is a welcome development for buyers, providing more choice and easing upward pressure on prices.
Days on Market & Inventory Balance
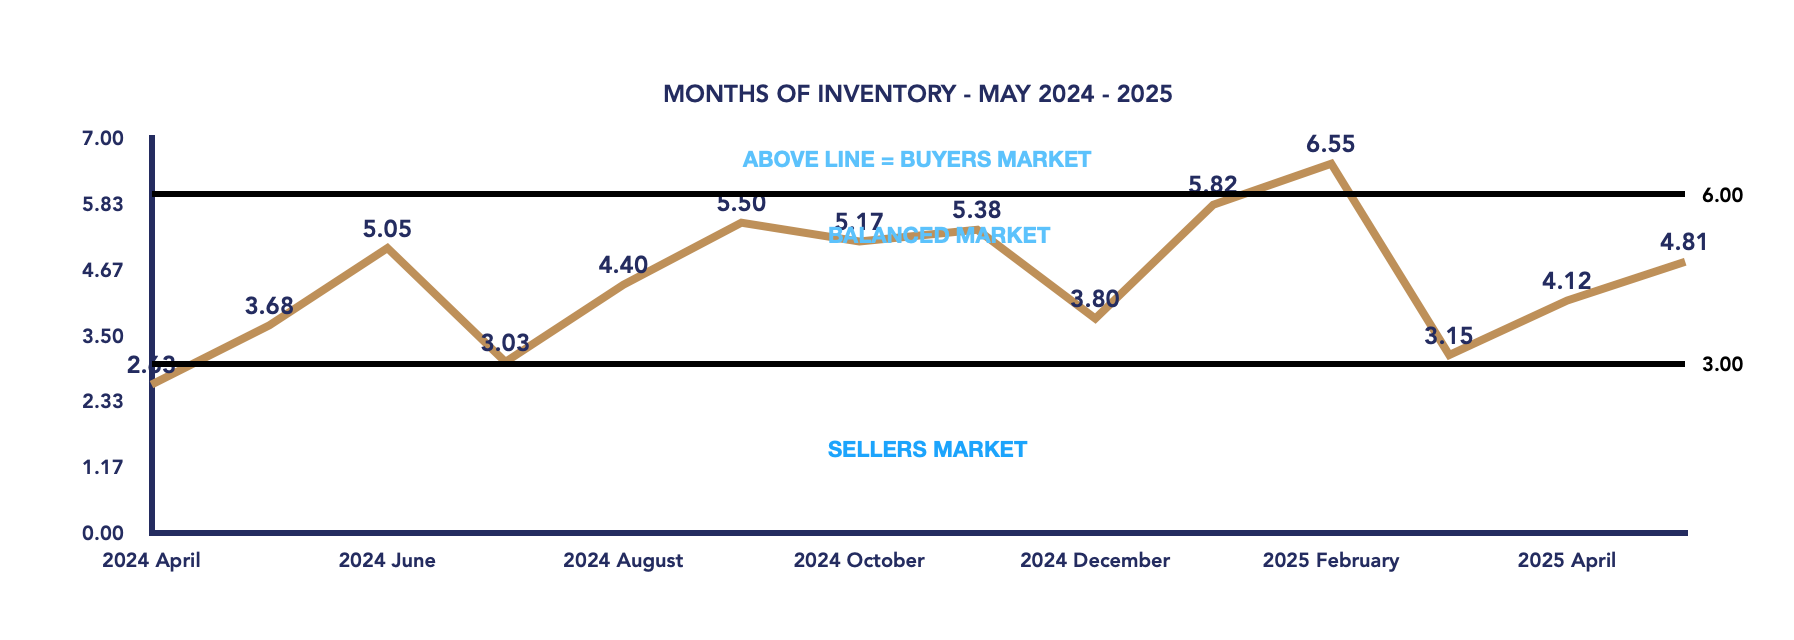
Homes sold more quickly in May, with an average days on market of just 22 days, down from 35 in April, indicating that well-priced properties are attracting immediate attention. Despite the rise in new listings, months of inventory only increased slightly to 4.83, up from 4.73, keeping Brock Township firmly within balanced market territory.
Conclusion
May 2025 was an encouraging month for Brock Township’s real estate market. While the average sale price appeared to jump significantly, it was clearly influenced by a couple of high-value sales. Adjusted figures suggest a steadier, more moderate growth. With increased sales activity, rising inventory, and healthy buyer engagement, the market continues to present stable conditions for both buyers and sellers as we head into the summer months.
*Information is believed to be accurate at time of posting but is not guaranteed to be correct. Some values may vary slightly based on the exact date and time the reports were generated. Market stats are provided by TRREB (Toronto Regional Real Estate Board) and are based on sales for the month of Attached/Row/Townhouses, Condo Apartments, Condo Townhouses, Detached, Detached with Common Elements, Link Homes and Semi-detached. *Some values may vary slightly based on the exact date and time the reports were generated.
Not intended as a solicitation if your property is already listed by another broker. Affiliated real estate agents are independent contractor sales associates, not employees. ©2021 Coldwell Banker. All Rights Reserved. Coldwell Banker and the Coldwell Banker logos are trademarks of Coldwell Banker Real Estate LLC. The Coldwell Banker® System is comprised of company owned offices which are owned by a subsidiary of Realogy Brokerage Group LLC and franchised offices which are independently owned and operated. The Coldwell Banker System fully supports the principles of the Fair Housing Act and the Equal Opportunity Act.
Click below for more reports
Check out our Uxbridge and Scugog Events Pages to keep up to date on whats going on around town. Click the links or scan the Code with your phone to take you directly there.
UXBRIDGE EVENTS
SCUGOG EVENTS
Scugog Housing May 2025

Scugog Housing May 2025
Each office is independently owned and operated
![]()
![]()
Housing Market Report for May 2025
Here is the Township of Scugog Housing May 2025 report (all housing types), with reports from the Canadian Real Estate Association, and Toronto Regional Real Estate Board included.
This housing report for Durham Region includes the number of new listings, average list price, number of properties sold, average selling price, average days on market and average asking price to selling price ratio for all property types within the Region of Durham.
Scroll to the bottom for links to take you to the housing market reports for Durham Region, Uxbridge and Brock.
![]()
![]()
From Toronto Regional Real Estate Board
Toronto Regional Real Estate Board – Market Stats At A Glance – May 2025
Read the Toronto Regional Real Estate Board Market Watch Report
![]()
Scugog Township Real Estate Market Analysis – May 2025
The Scugog Township real estate market continued to demonstrate strong price performance in May 2025, though the sharp increase in average sale price was once again influenced by a few standout transactions. While sales volume remained consistent, the surge in both listings and inventory indicates a market with growing activity, albeit with signs of shifting buyer-seller dynamics.
May 2025
April 2025
Price Trends: Inflated Averages Due to High-End Sales
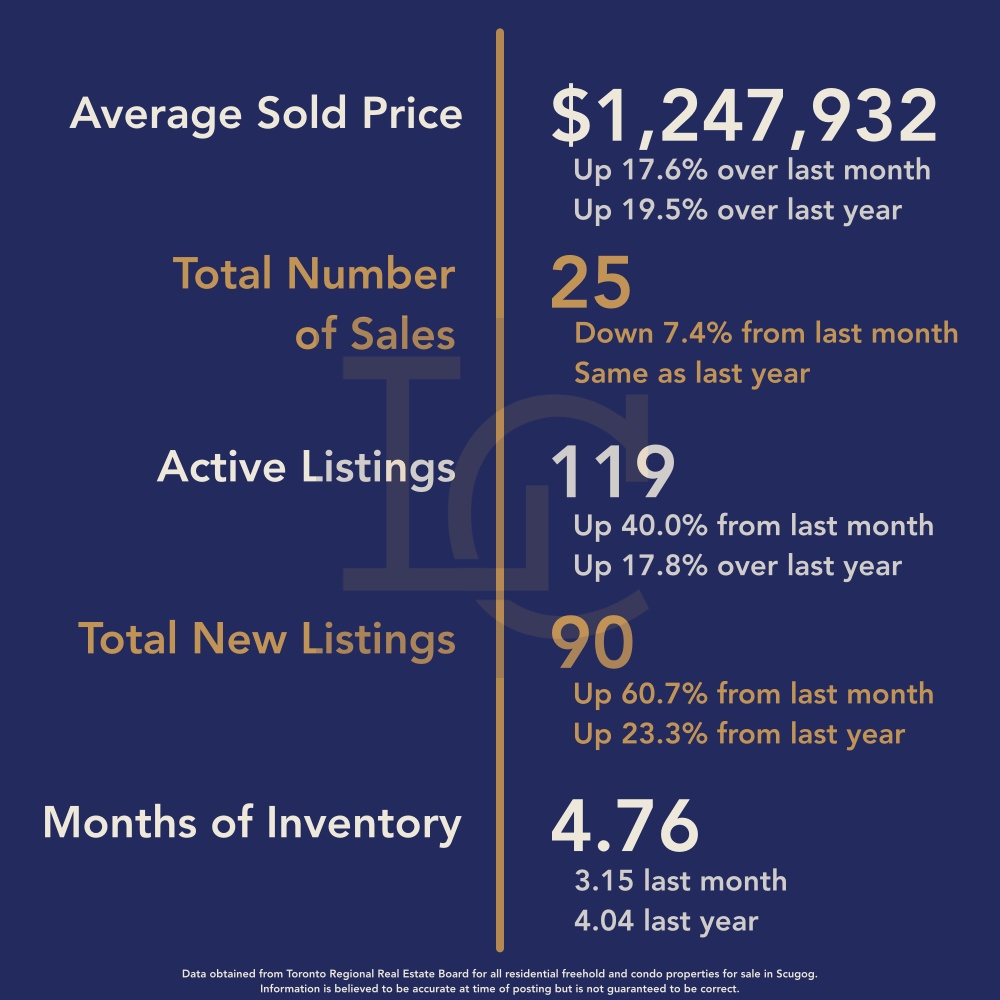
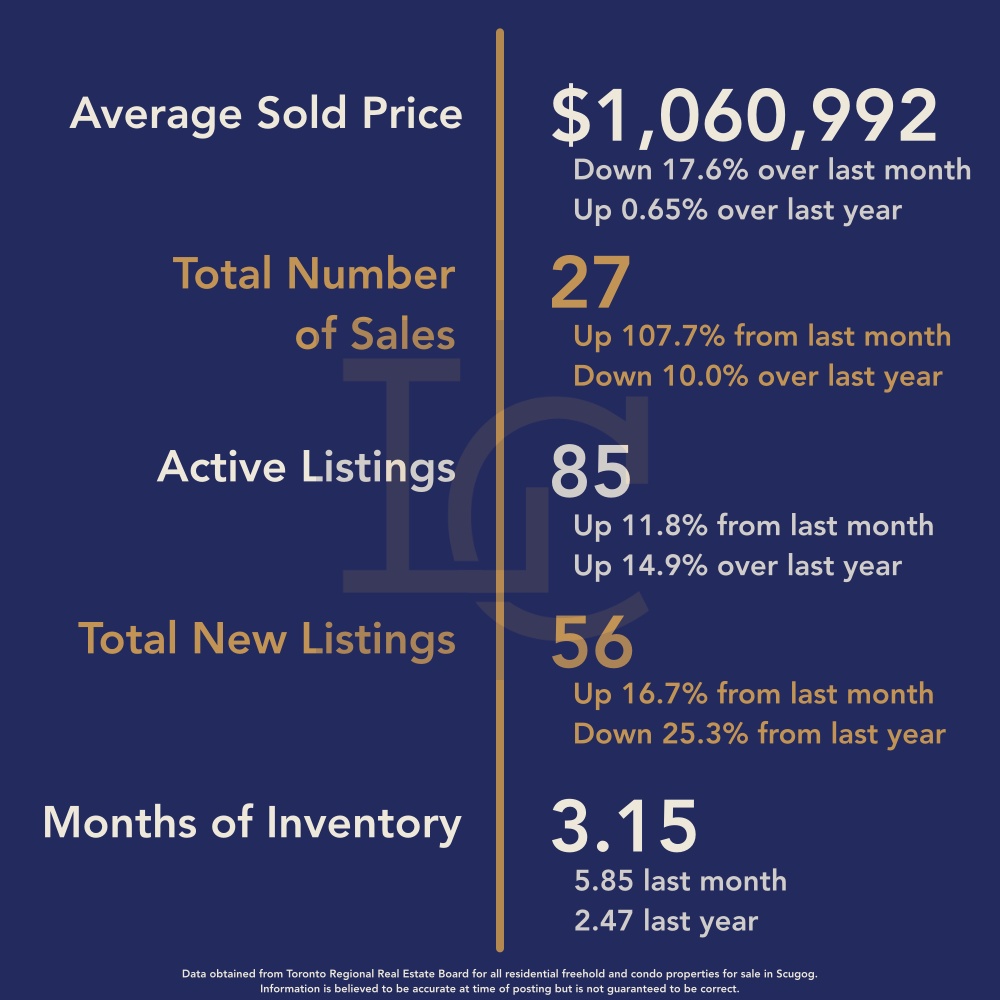
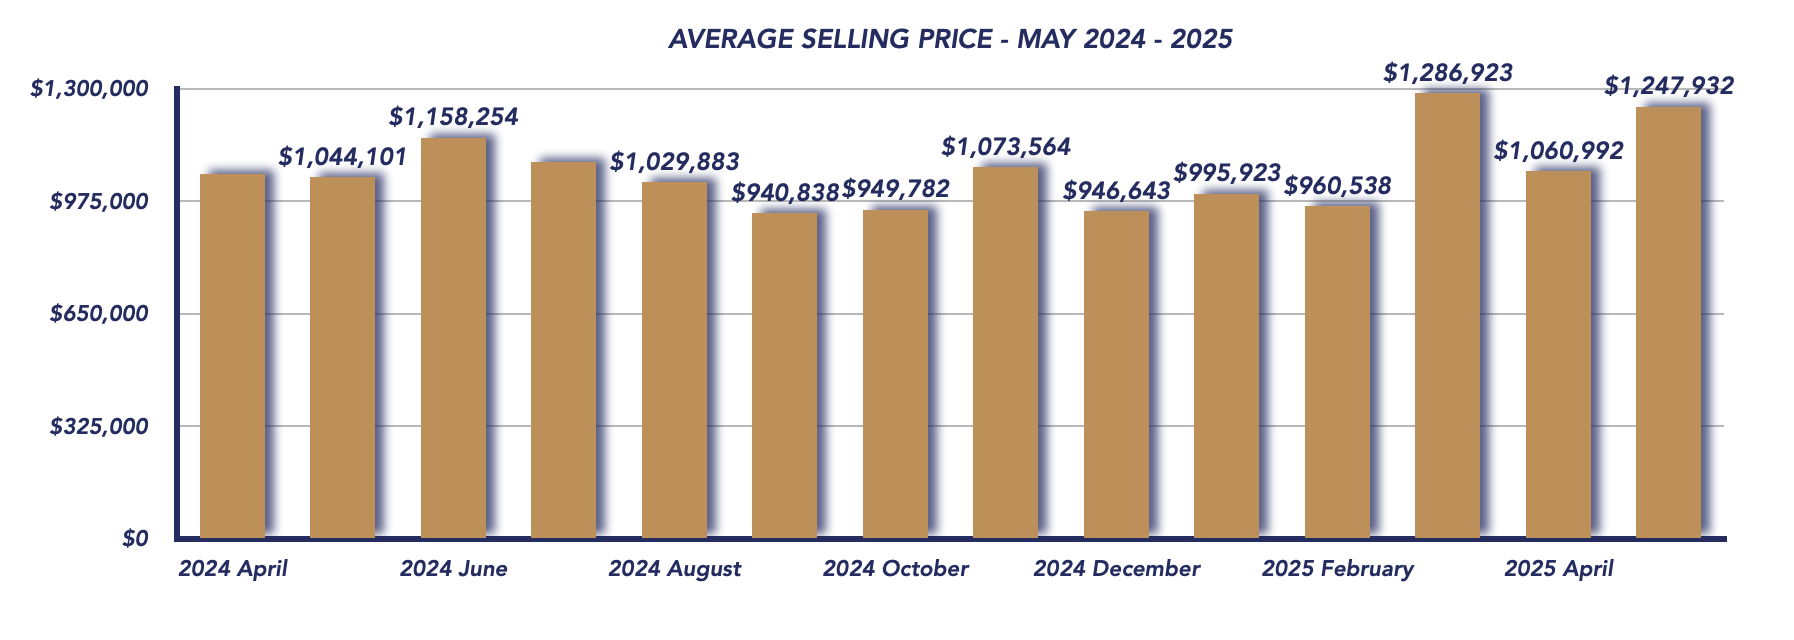
The average sales price for May 2025 climbed to $1,247,932, marking a 17.6% increase from April and a 19.5% year-over-year jump from May 2024 ($1,044,101). However, this substantial rise is largely due to two luxury home sales—one at $3,650,000 and another at $2,770,000—which heavily skewed the monthly average. When adjusted for these outliers, the pricing trend appears less dramatic and more in line with moderate market appreciation.
Sales Activity: Steady and Predictable
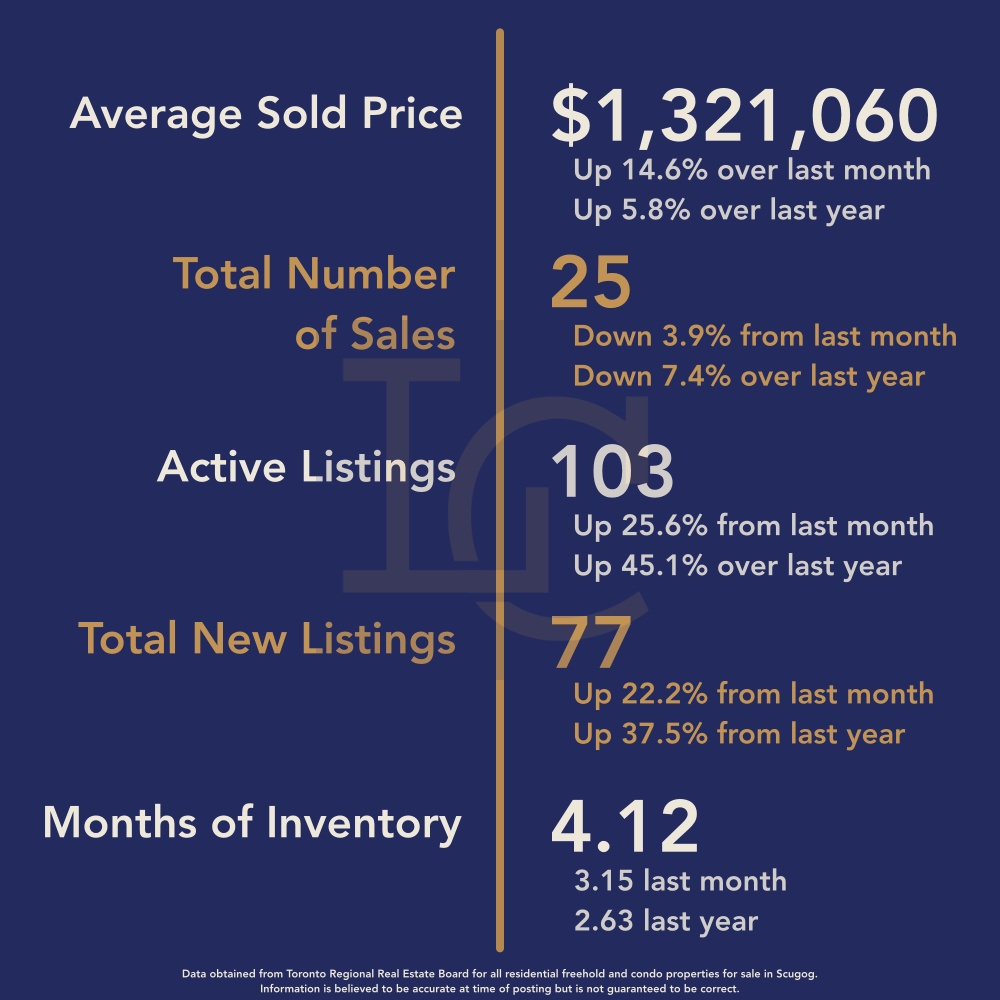
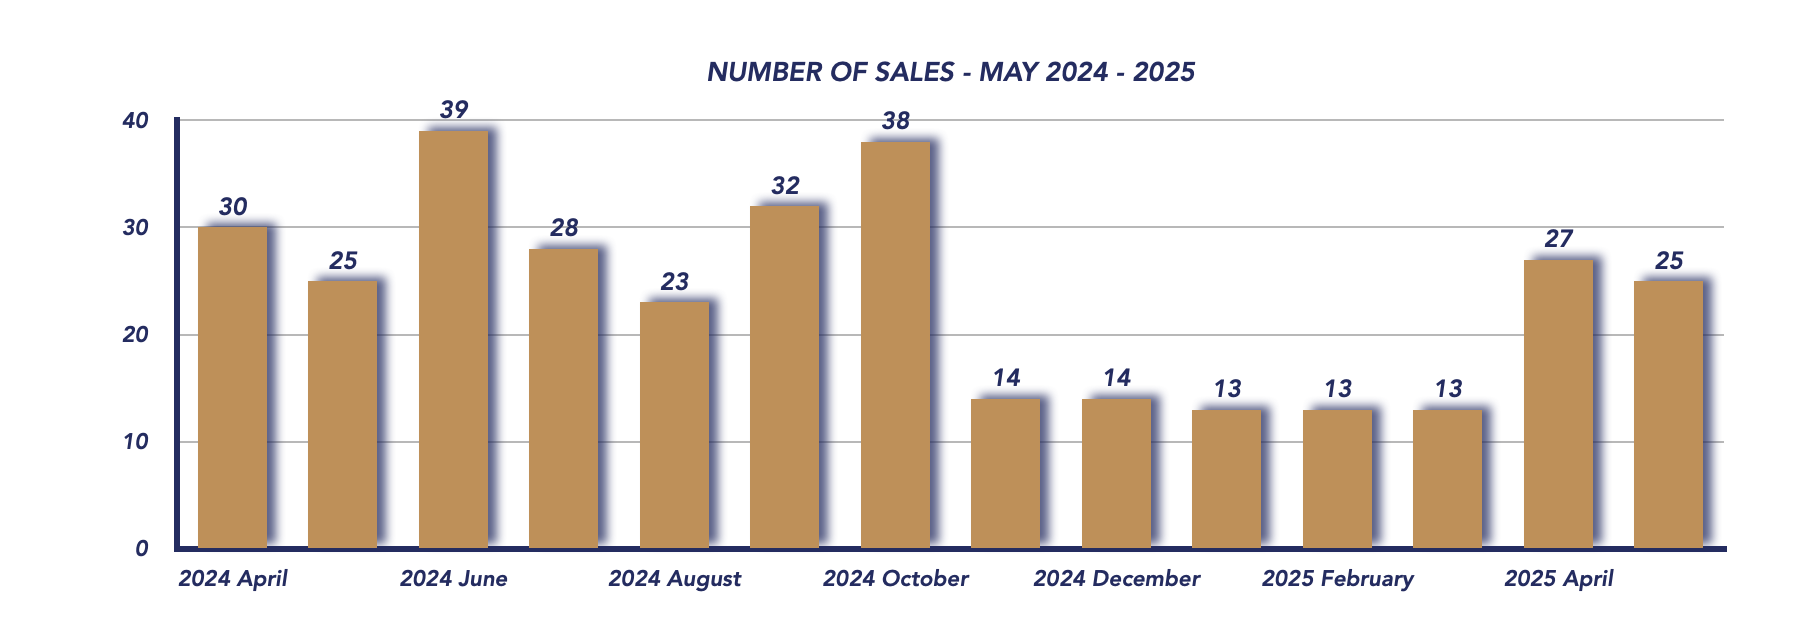
Total home sales came in at 25, matching the level from May 2024 and slightly below April’s 27. This consistency reflects stable buyer interest, even as prices remain elevated and inventory expands. The market is holding a steady rhythm, which can be seen as a positive in an otherwise uncertain economic landscape.
Market Competitiveness: Slight Erosion in Seller Leverage
The sale-to-list price ratio dipped to 97%, down from 98% in April and 100% in May 2024, indicating that sellers are accepting slightly less than their asking prices. While still reflective of a relatively balanced environment, it does suggest that buyers are gaining modest leverage in negotiations—likely due to expanded inventory and greater choice.
Inventory & Listings: A Surge in Supply Driven by New Builds
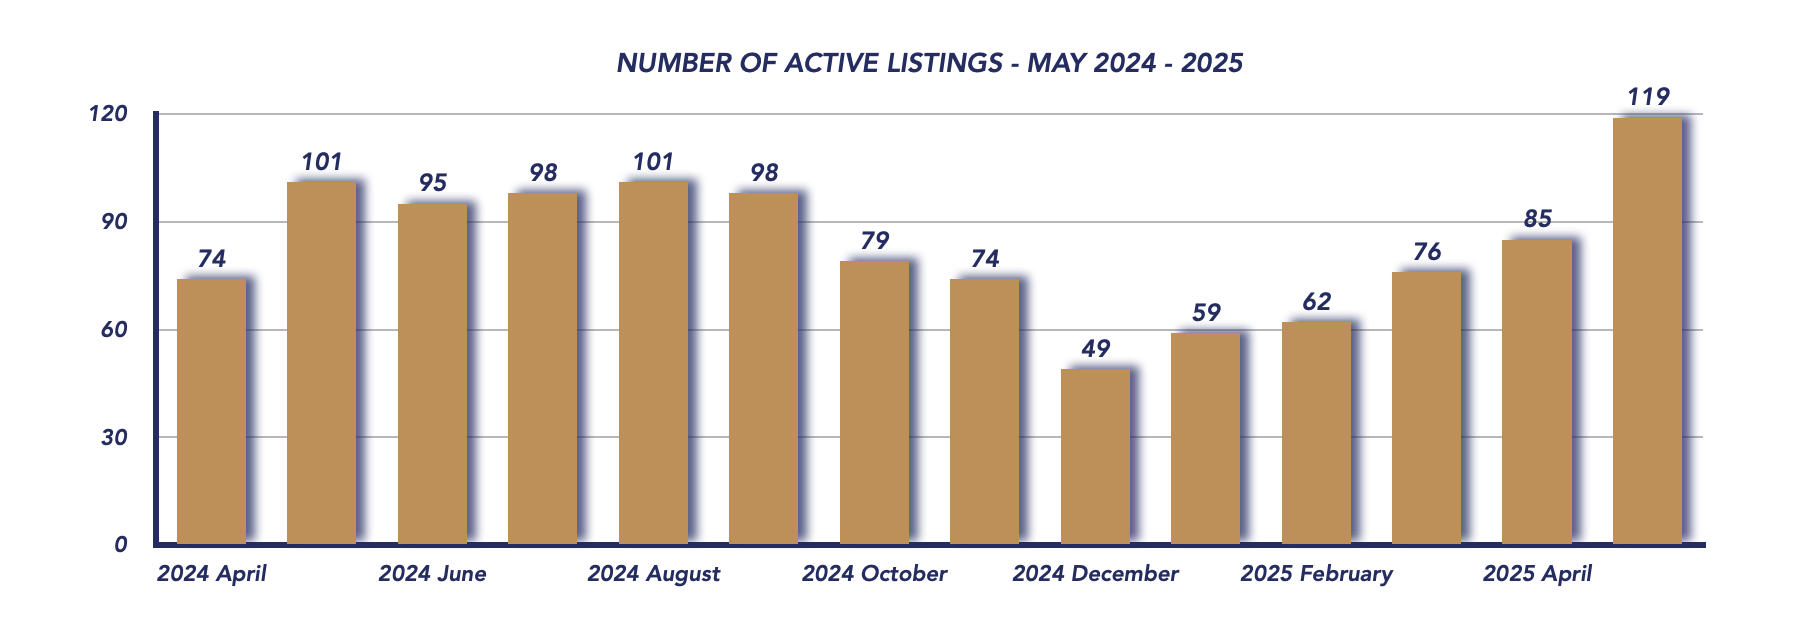
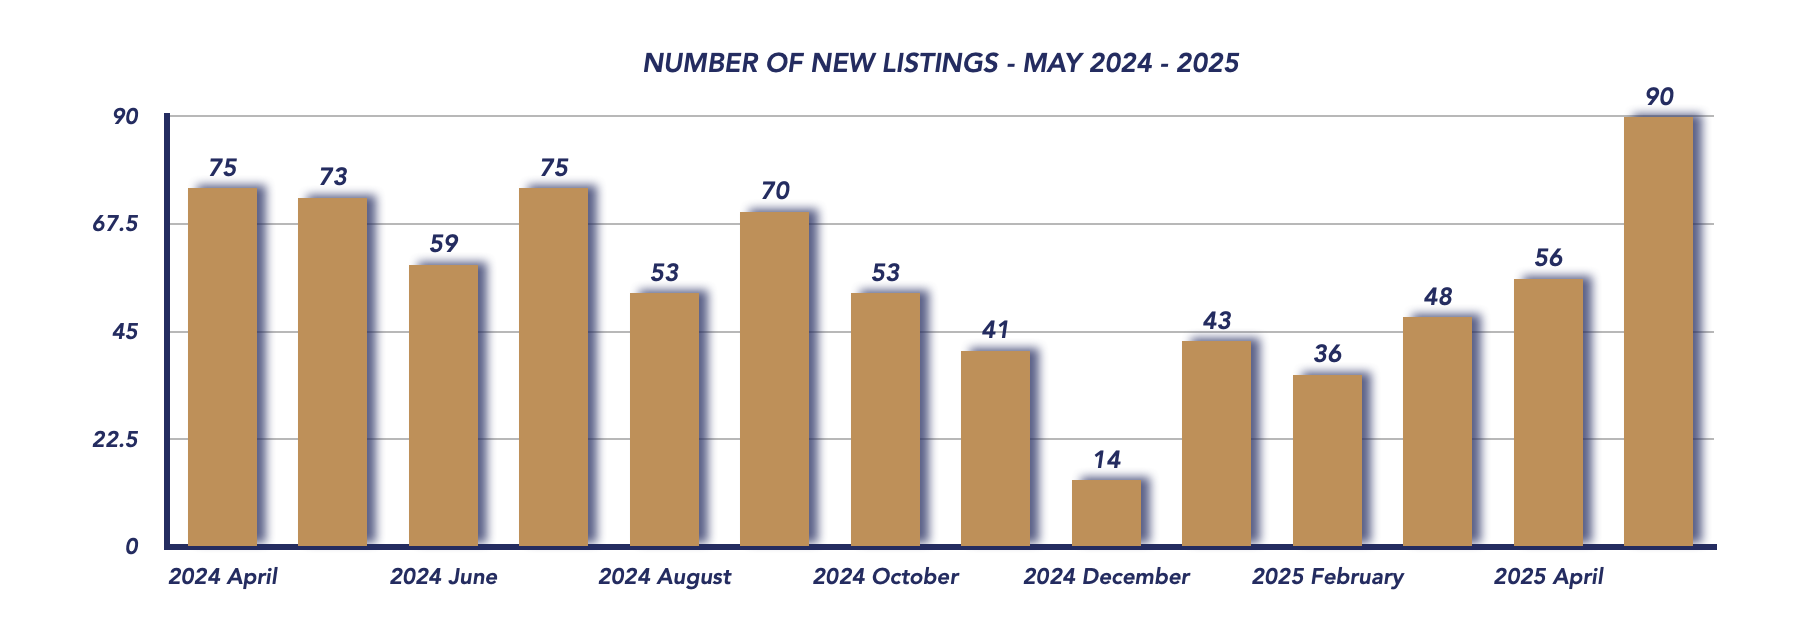
Inventory climbed significantly with 119 active listings, up from 85 in April and 101 a year ago. New listings surged to 90, compared to just 56 last month and 73 in May 2024. This increase is partly due to an influx of newly built homes entering the market, which is expanding buyer options and gradually increasing overall housing supply.
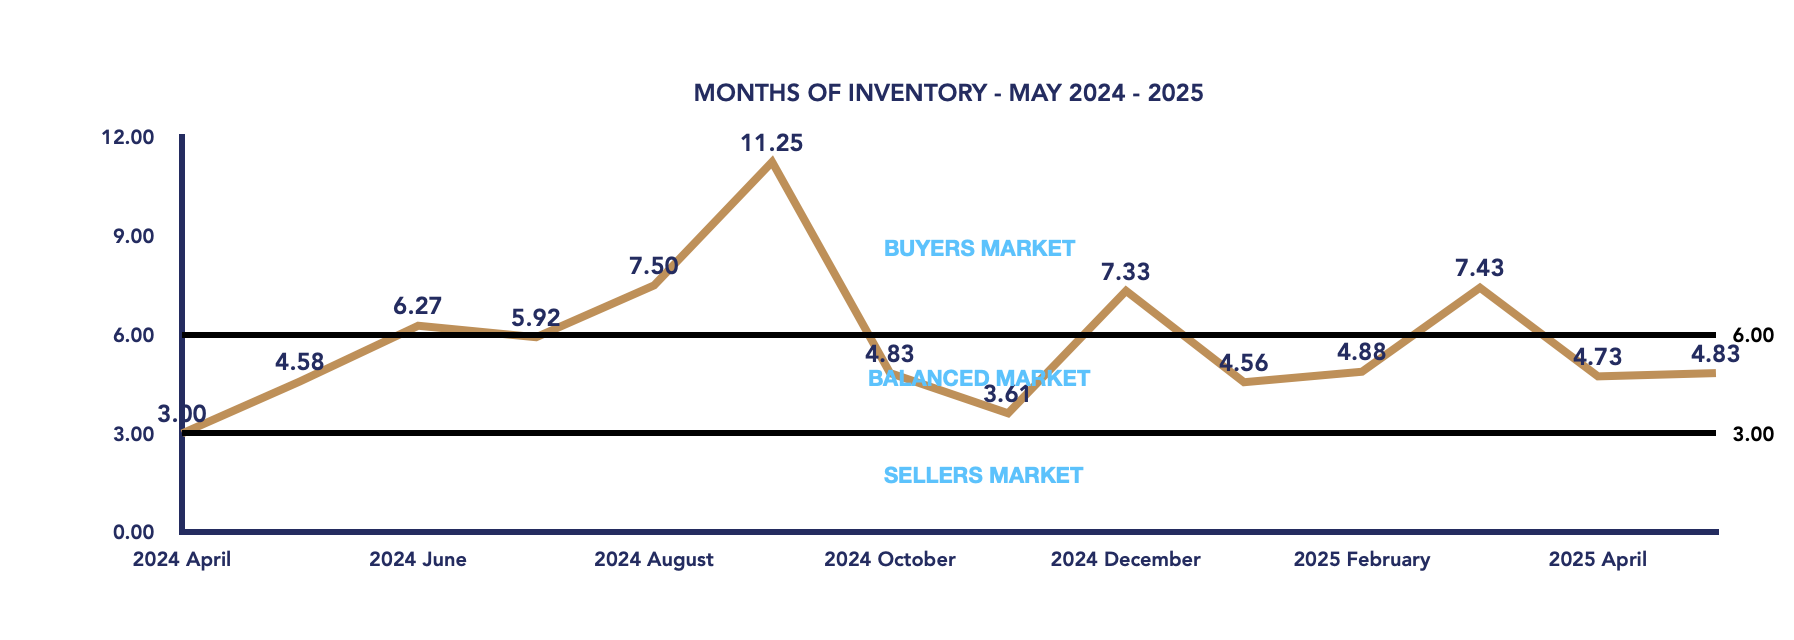
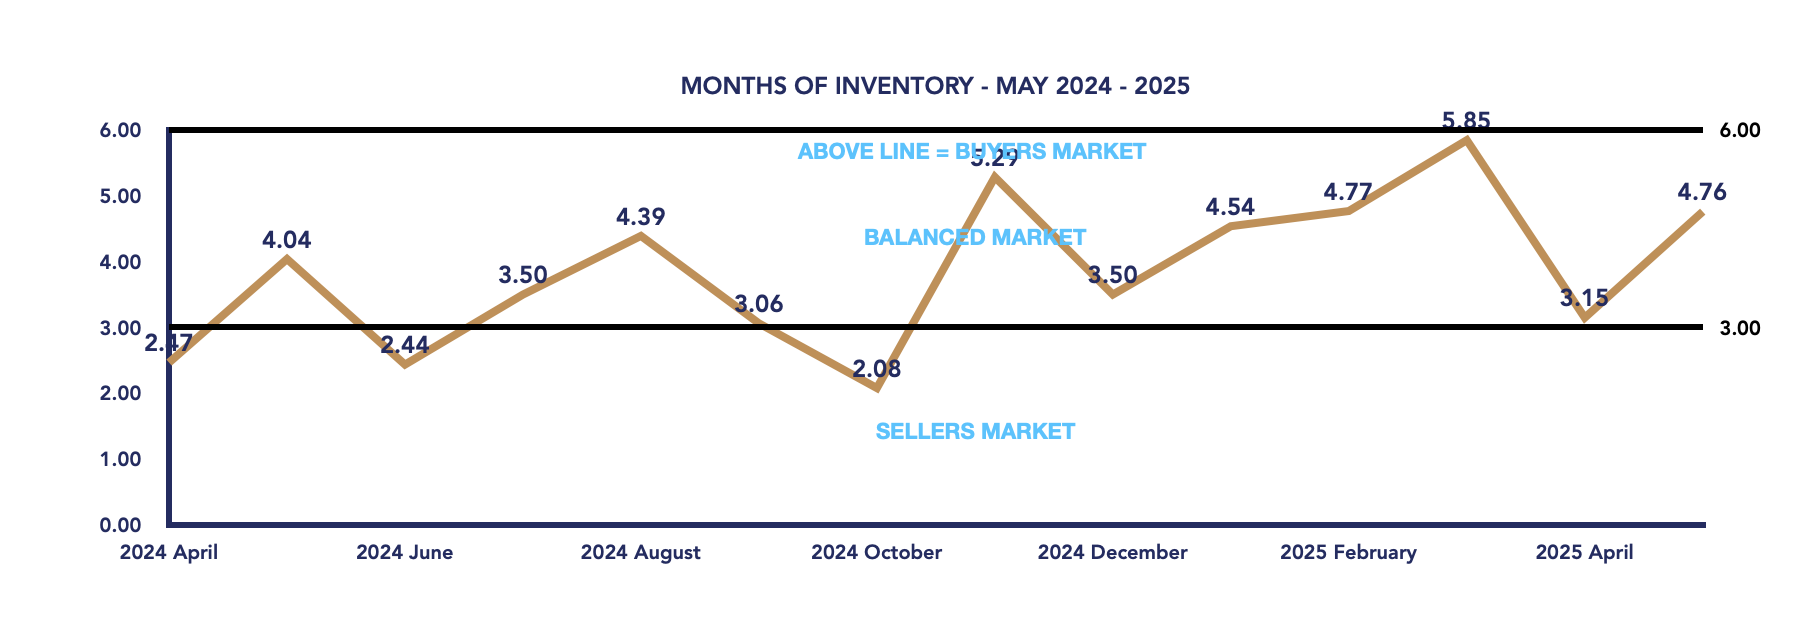
The months of inventory rose to 4.76, up from 3.15, keeping the market in balanced territory, though trending toward a buyer’s market if inventory continues to grow without a corresponding increase in demand.
Time on Market: Quick Turnarounds Continue
Days on market averaged 40 days, showing that homes are still selling at a healthy pace, despite the rise in inventory. This indicates a continued appetite among buyers, especially for well-priced and desirable properties.
Market Outlook: Stability Amid Expansion
While headline figures suggest strength, especially in average pricing, the underlying data points to a market that’s stabilizing. The consistent sales volume, slower price negotiation, and rising inventory levels show that buyers are becoming more selective. With more housing options, especially through new construction, competition could increase, potentially moderating price growth in the months ahead.
Conclusion: A Balanced Market With Expanding Inventory
The Scugog housing market in May 2025 remains resilient, but it’s also evolving. High-end sales have lifted averages, but the overall pace of sales and increase in available listings point toward a more balanced and competitive environment. For sellers, pricing strategically is key. For buyers, greater inventory and slightly softer negotiation margins make this a more favorable time to explore opportunities. As we head into the summer market, all eyes will be on whether inventory growth outpaces demand and how interest rates and economic signals influence buyer behavior.
WATCH OUR MONDAY MARKET MINUTES
*Information is believed to be accurate at time of posting but is not guaranteed to be correct. Some values may vary slightly based on the exact date and time the reports were generated. Market stats are provided by TRREB (Toronto Regional Real Estate Board) and are based on sales for the month of Attached/Row/Townhouses, Condo Apartments, Condo Townhouses, Detached, Detached with Common Elements, Link Homes and Semi-detached. *Some values may vary slightly based on the exact date and time the reports were generated.
Not intended as a solicitation if your property is already listed by another broker. Affiliated real estate agents are independent contractor sales associates, not employees. ©2021 Coldwell Banker. All Rights Reserved. Coldwell Banker and the Coldwell Banker logos are trademarks of Coldwell Banker Real Estate LLC. The Coldwell Banker® System is comprised of company owned offices which are owned by a subsidiary of Realogy Brokerage Group LLC and franchised offices which are independently owned and operated. The Coldwell Banker System fully supports the principles of the Fair Housing Act and the Equal Opportunity Act.
Click below for more reports
Check out our Uxbridge and Scugog Events Pages to keep up to date on whats going on around town. Click the links or scan the Code with your phone to take you directly there.
UXBRIDGE EVENTS
SCUGOG EVENTS


