
 Facebook
 X
X
 Pinterest
 Copy Link
Brock Housing September 2025

Brock Housing September 2025

Each office is independently owned and operated
![]()

![]()
Housing Market Report for September 2025
Here is the Township of Brock Housing September 2025 report (all housing types), with reports from the Canadian Real Estate Association, and Toronto Regional Real Estate Board included.
This housing report for Durham Region includes the number of new listings, average list price, number of properties sold, average selling price, average days on market and average asking price to selling price ratio for all property types within the Region of Durham.
Scroll to the bottom for links to take you to the housing market reports for Durham Region, Uxbridge and Scugog.
![]()
![]()
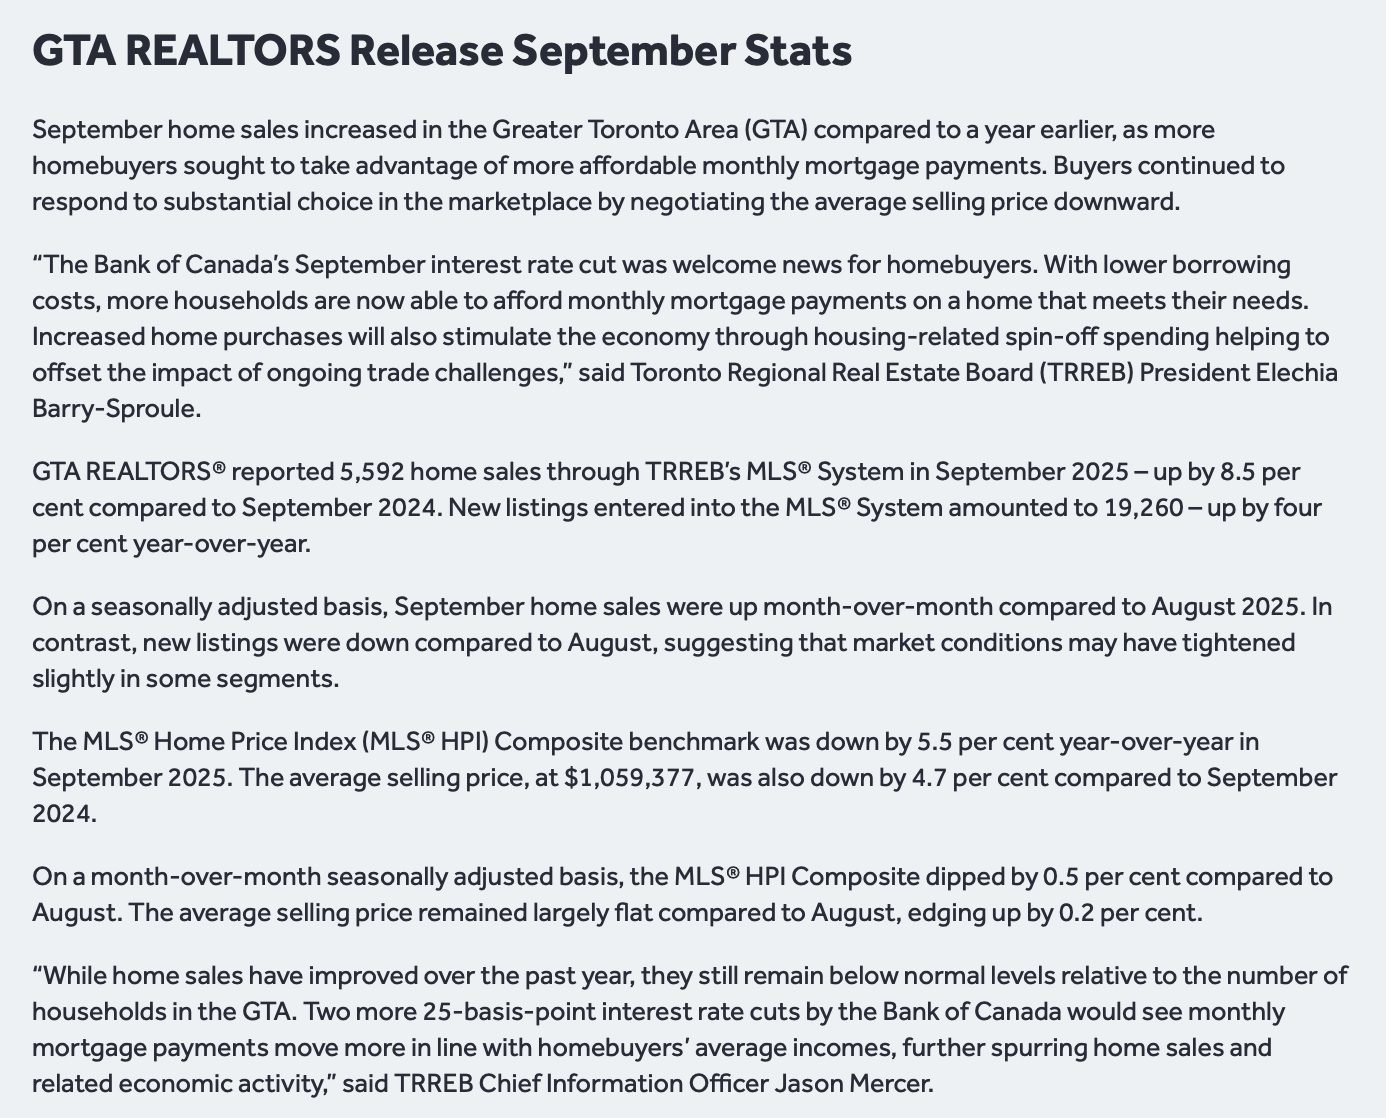
From Toronto Regional Real Estate Board
Please note: The PropTx MLS® System, of which TRREB is a part, has added a number of new client boards over the last year. Many of these boards’ Members trade within the Greater Toronto Area and broader Greater Golden Horseshoe regions. As a result, historic data have been updated to reflect the addition of these boards’ listings and transactions. This means historic data have changed relative to previously published static reports. To view updated historic data, click here.
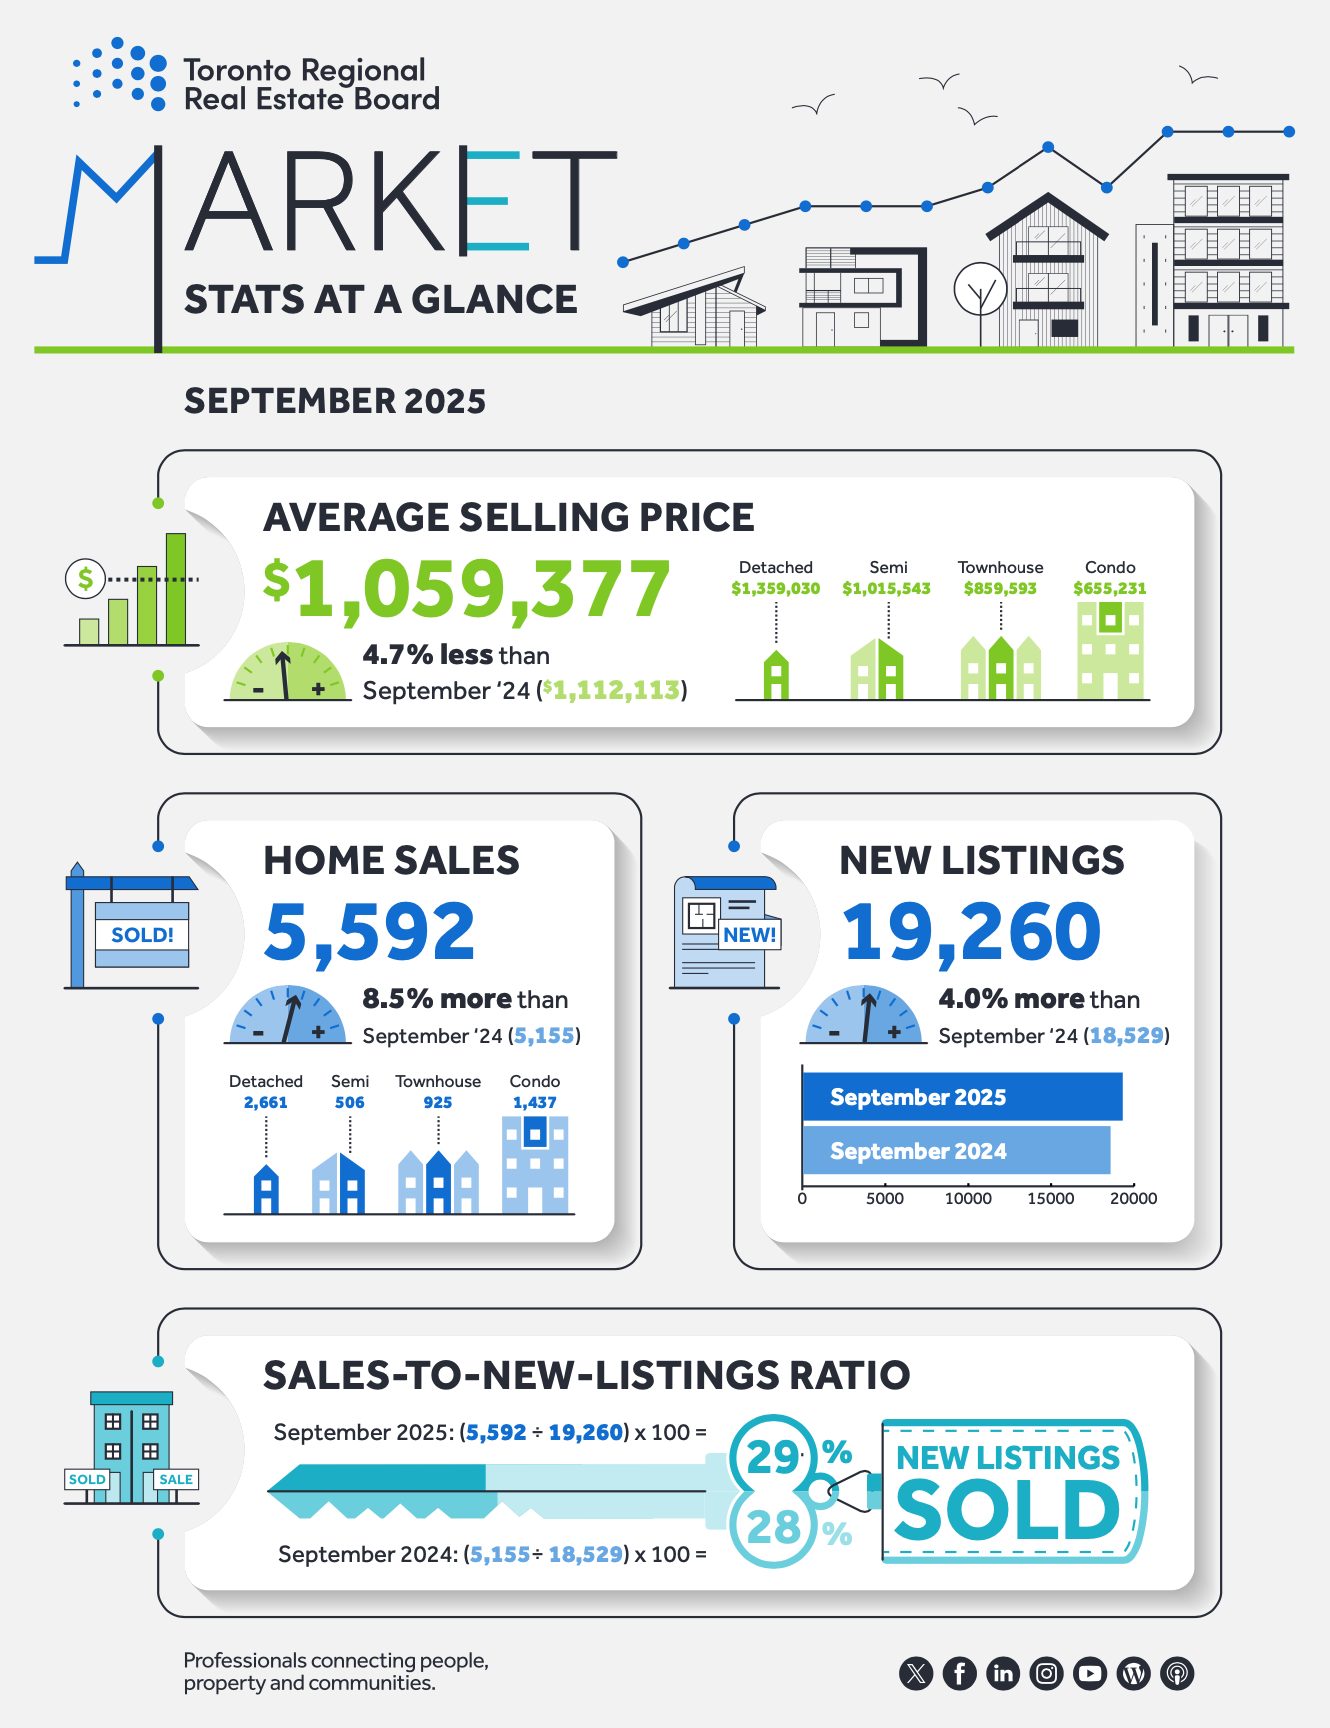
Toronto Regional Real Estate Board – Market Stats At A Glance – September 2025
Read the Toronto Regional Real Estate Board Market Watch Report
![]()
Brock Township Real Estate Market Analysis – September 2025
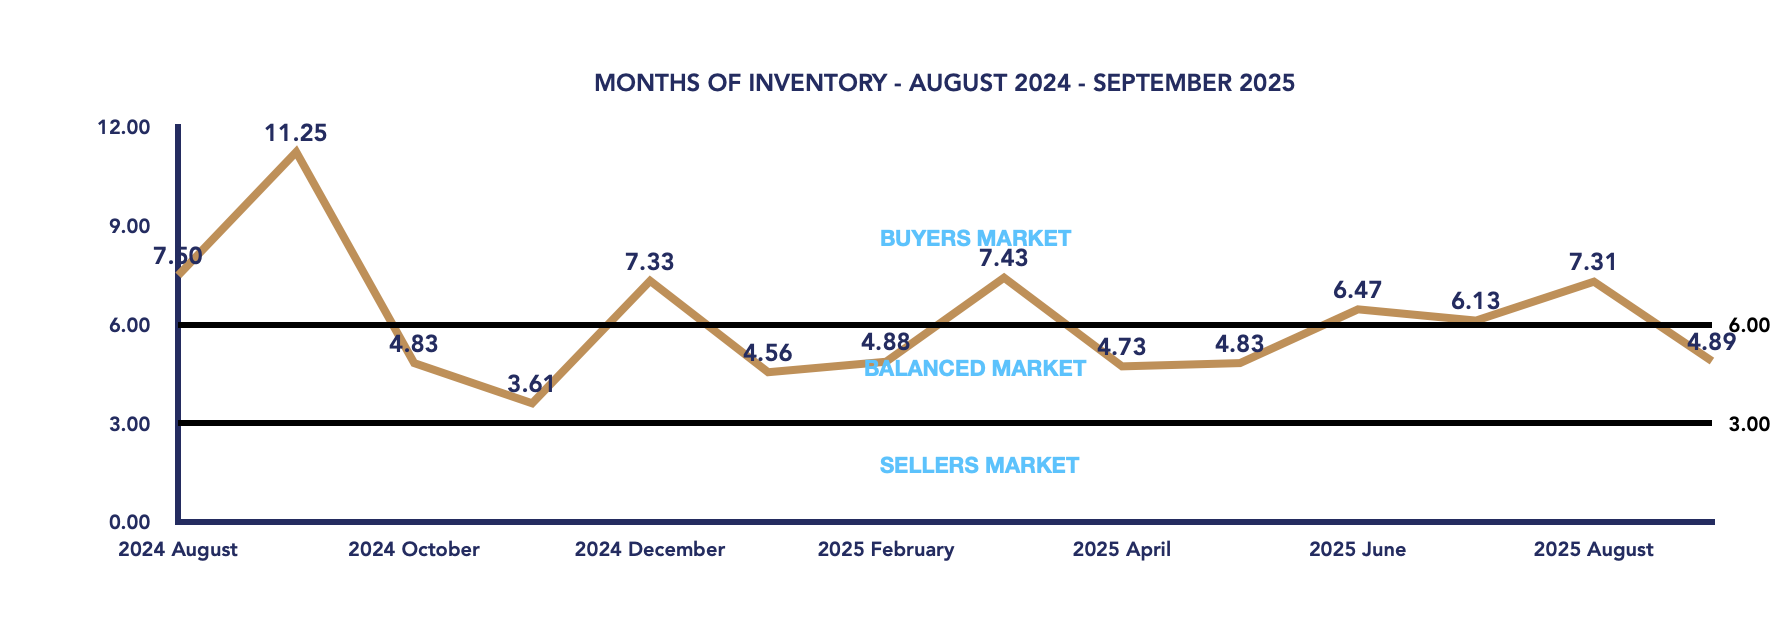
The real estate market in the Township of Brock experienced a significant price correction in September 2025, as average sale prices dropped sharply from August’s highs. However, despite lower prices, sales activity strengthened, and inventory levels stabilized—signaling a shift back toward a balanced market after several months favoring buyers.
September 2025
August 2025
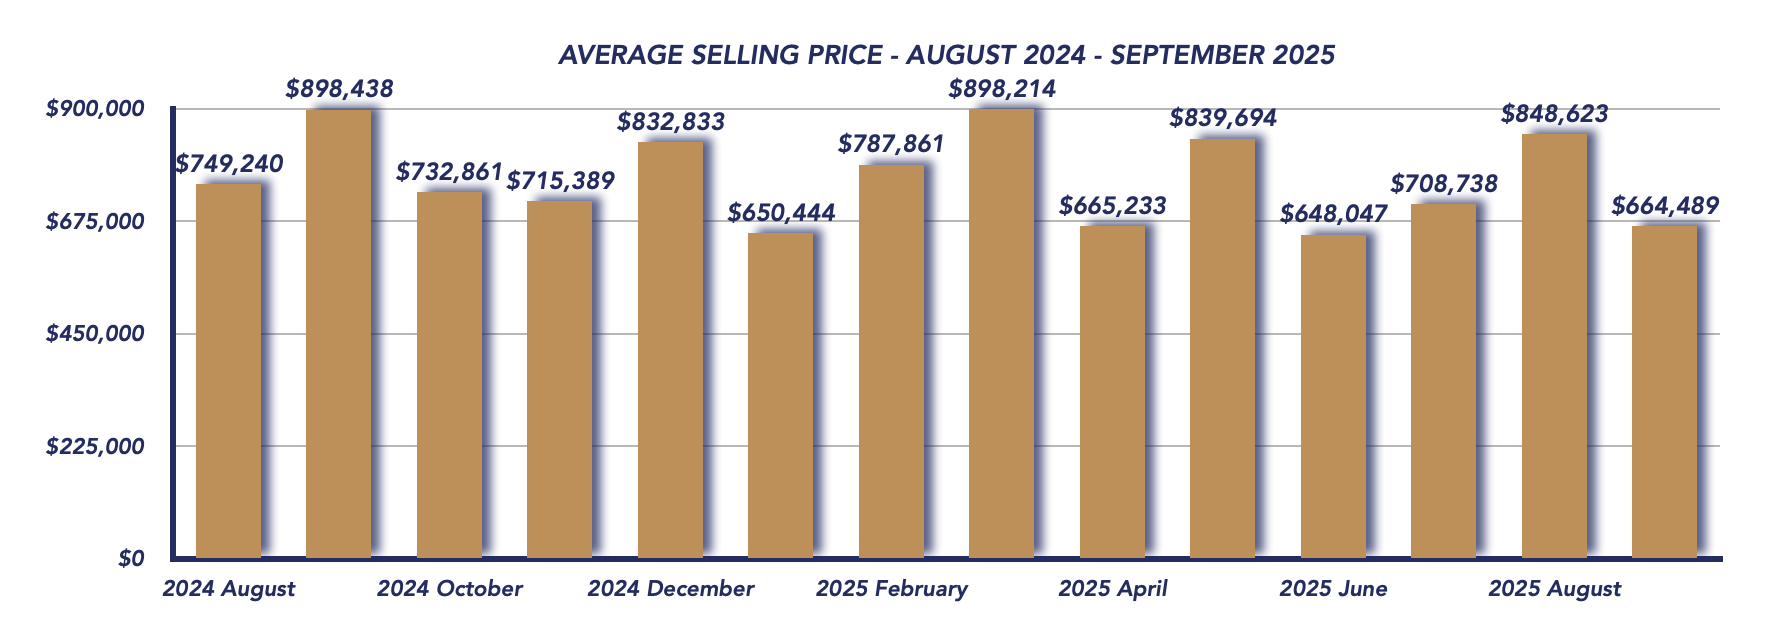
Average Sale Price Declines Sharply
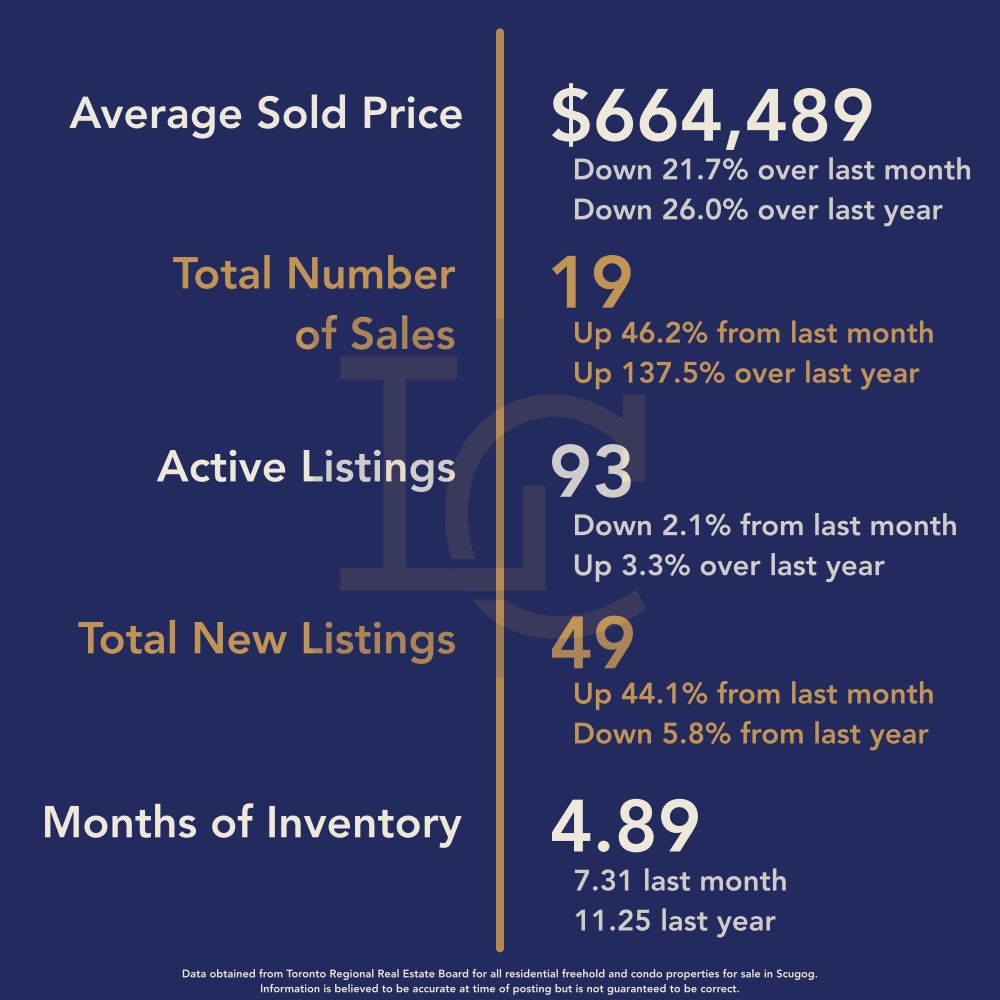
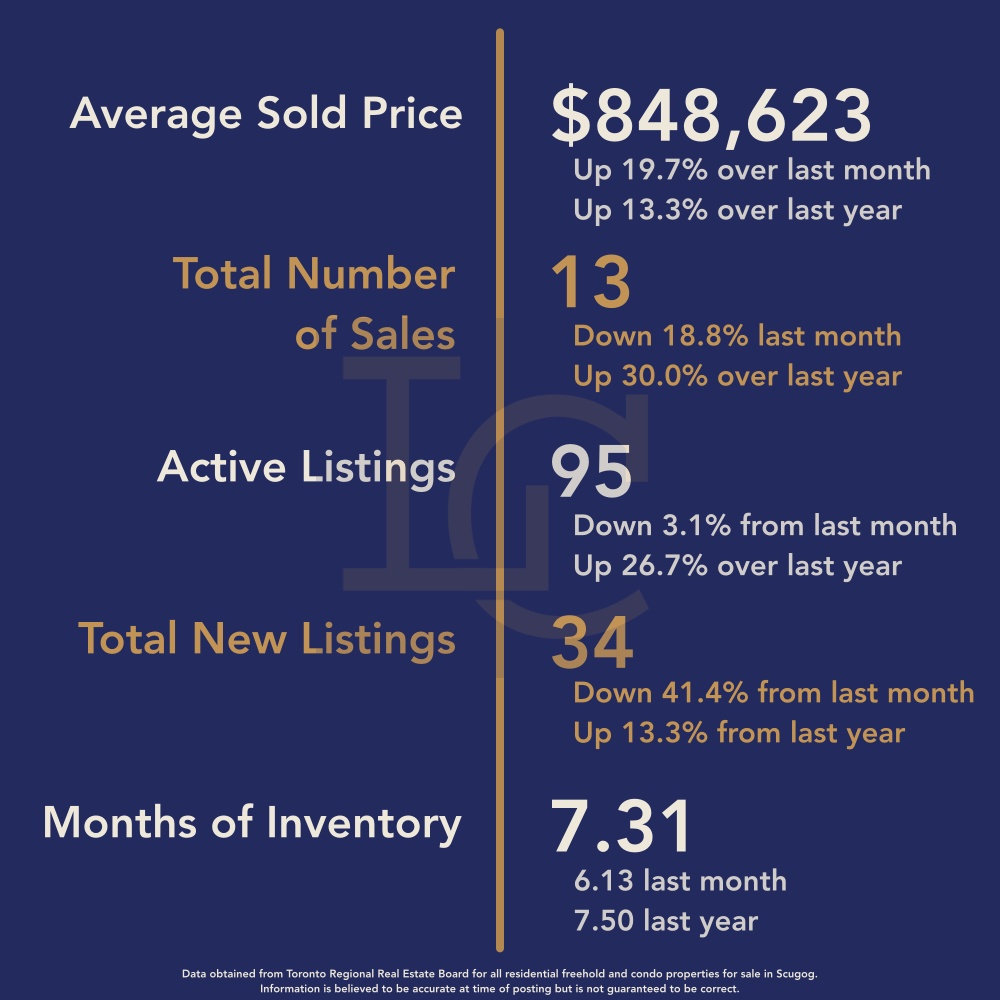
The average sale price in September 2025 was $664,489, a 21.7% decrease from August’s $848,623 and a 26.0% drop year-over-year from $898,438 in September 2024.
This sharp decline can largely be attributed to fewer high-end sales. In August, two properties sold for over $1.5 million, heavily influencing that month’s average. In contrast, September saw only one property sell for $1.1 million, with the remaining 13 homes selling for under $700,000. This shift toward lower-priced transactions offers a clearer reflection of the true mid-market activity in Brock Township.
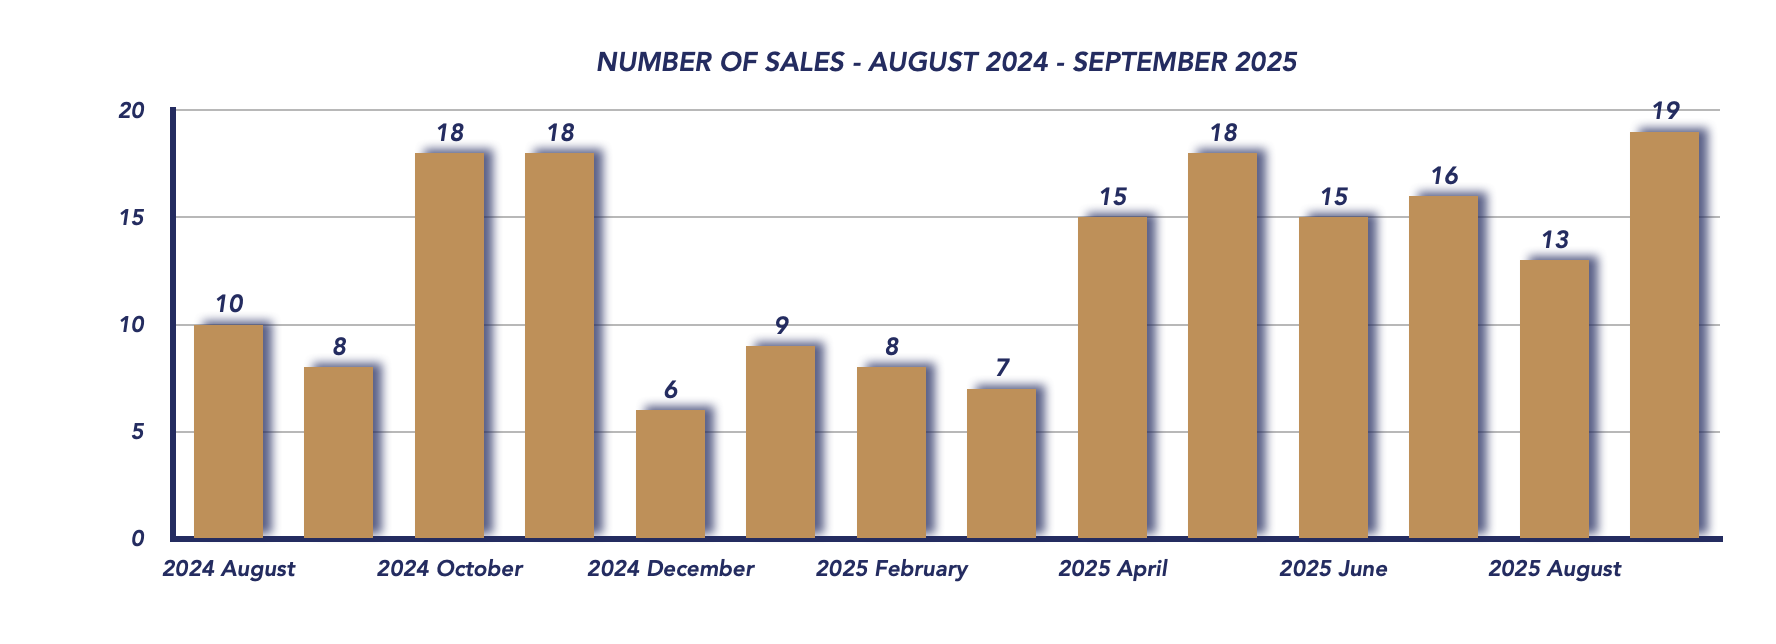
Sales Volume Increases Despite Lower Prices
Interestingly, sales activity picked up in September, with 19 homes sold, compared to 13 in August and 8 in September 2024. This uptick suggests that more affordable pricing has re-engaged buyers who may have been previously priced out of the market.
Sale-to-List Price Ratio Falls
The sale-to-list price ratio dropped to 93%, down notably from 98% in August and 97% this time last year. This decline indicates that buyers are negotiating more aggressively, and sellers may be adjusting expectations in response to broader market conditions.
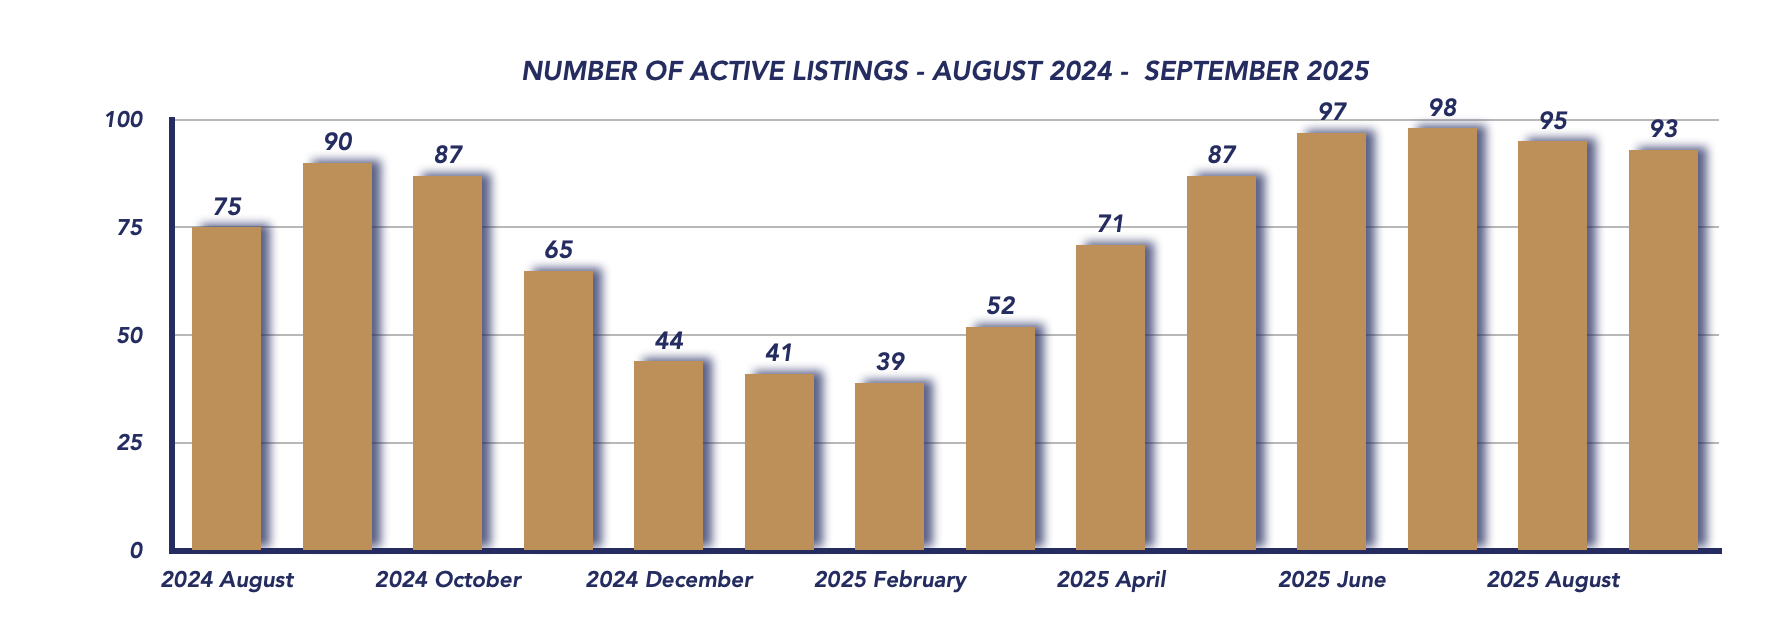
Inventory Remains Stable
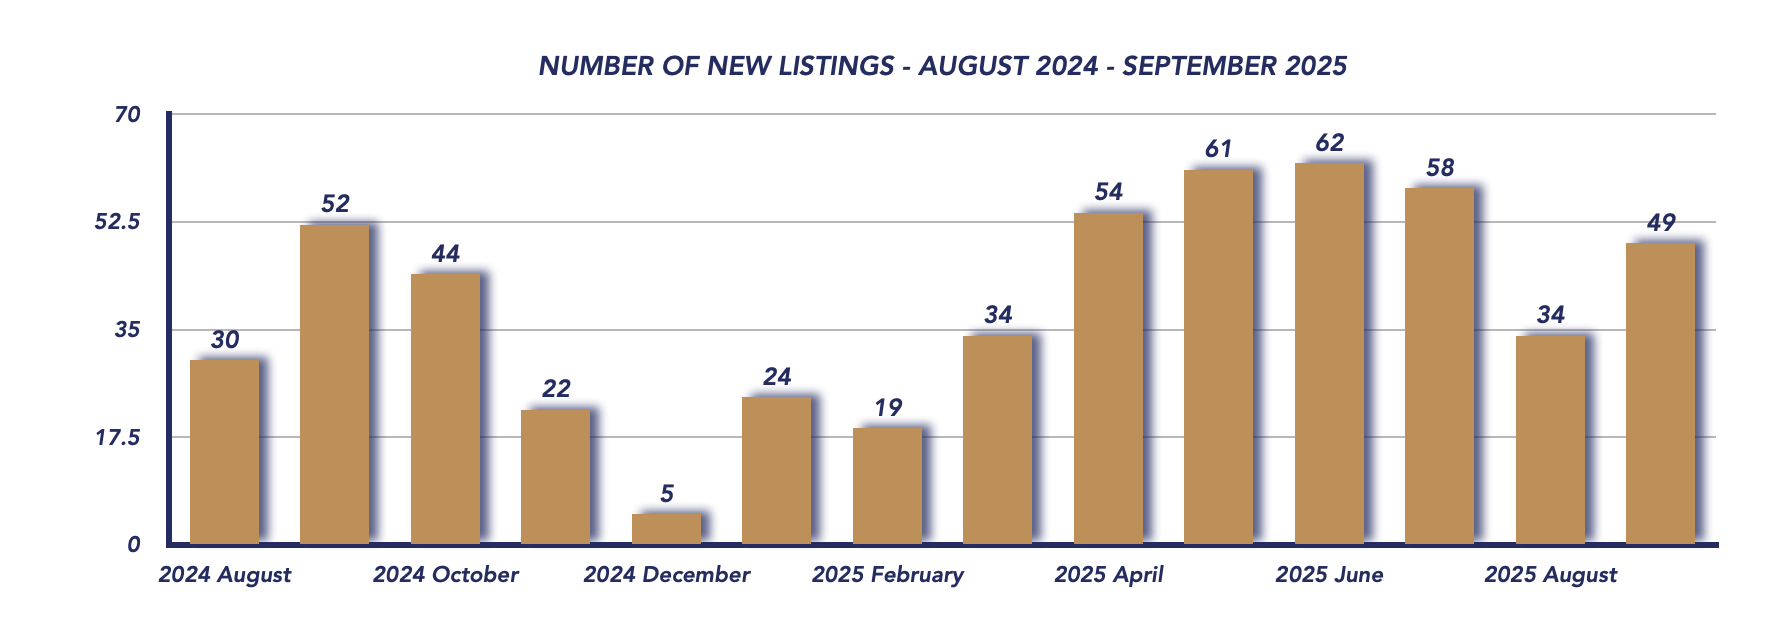
Inventory levels held relatively steady, with 93 active listings, just below 95 in August and slightly above 90 listings in September 2024. New listings rose to 49, up from 34 in August, though still below the 52 recorded last year. The consistent number of available homes suggests the market is maintaining a healthy level of supply as demand continues to adjust.
Days on Market & Inventory Balance
Properties spent an average of 61 days on the market, indicating that homes are taking longer to sell compared to earlier in the year. Meanwhile, months of inventory dipped to 4.89, down from 7.31 in August, moving Brock Township back into a balanced market where supply and demand are more evenly aligned.
Conclusion
September 2025 marked a correction phase in the Brock Township real estate market. Prices pulled back significantly after several months of luxury-driven averages, but sales volume increased as more buyers entered the market at lower price points. With inventory stabilizing and months of supply moderating, the market is now finding its footing in a more balanced position.
Heading into the fall, expect continued cautious optimism—buyers have regained some leverage, while sellers who price competitively will continue to see solid interest and successful sales.
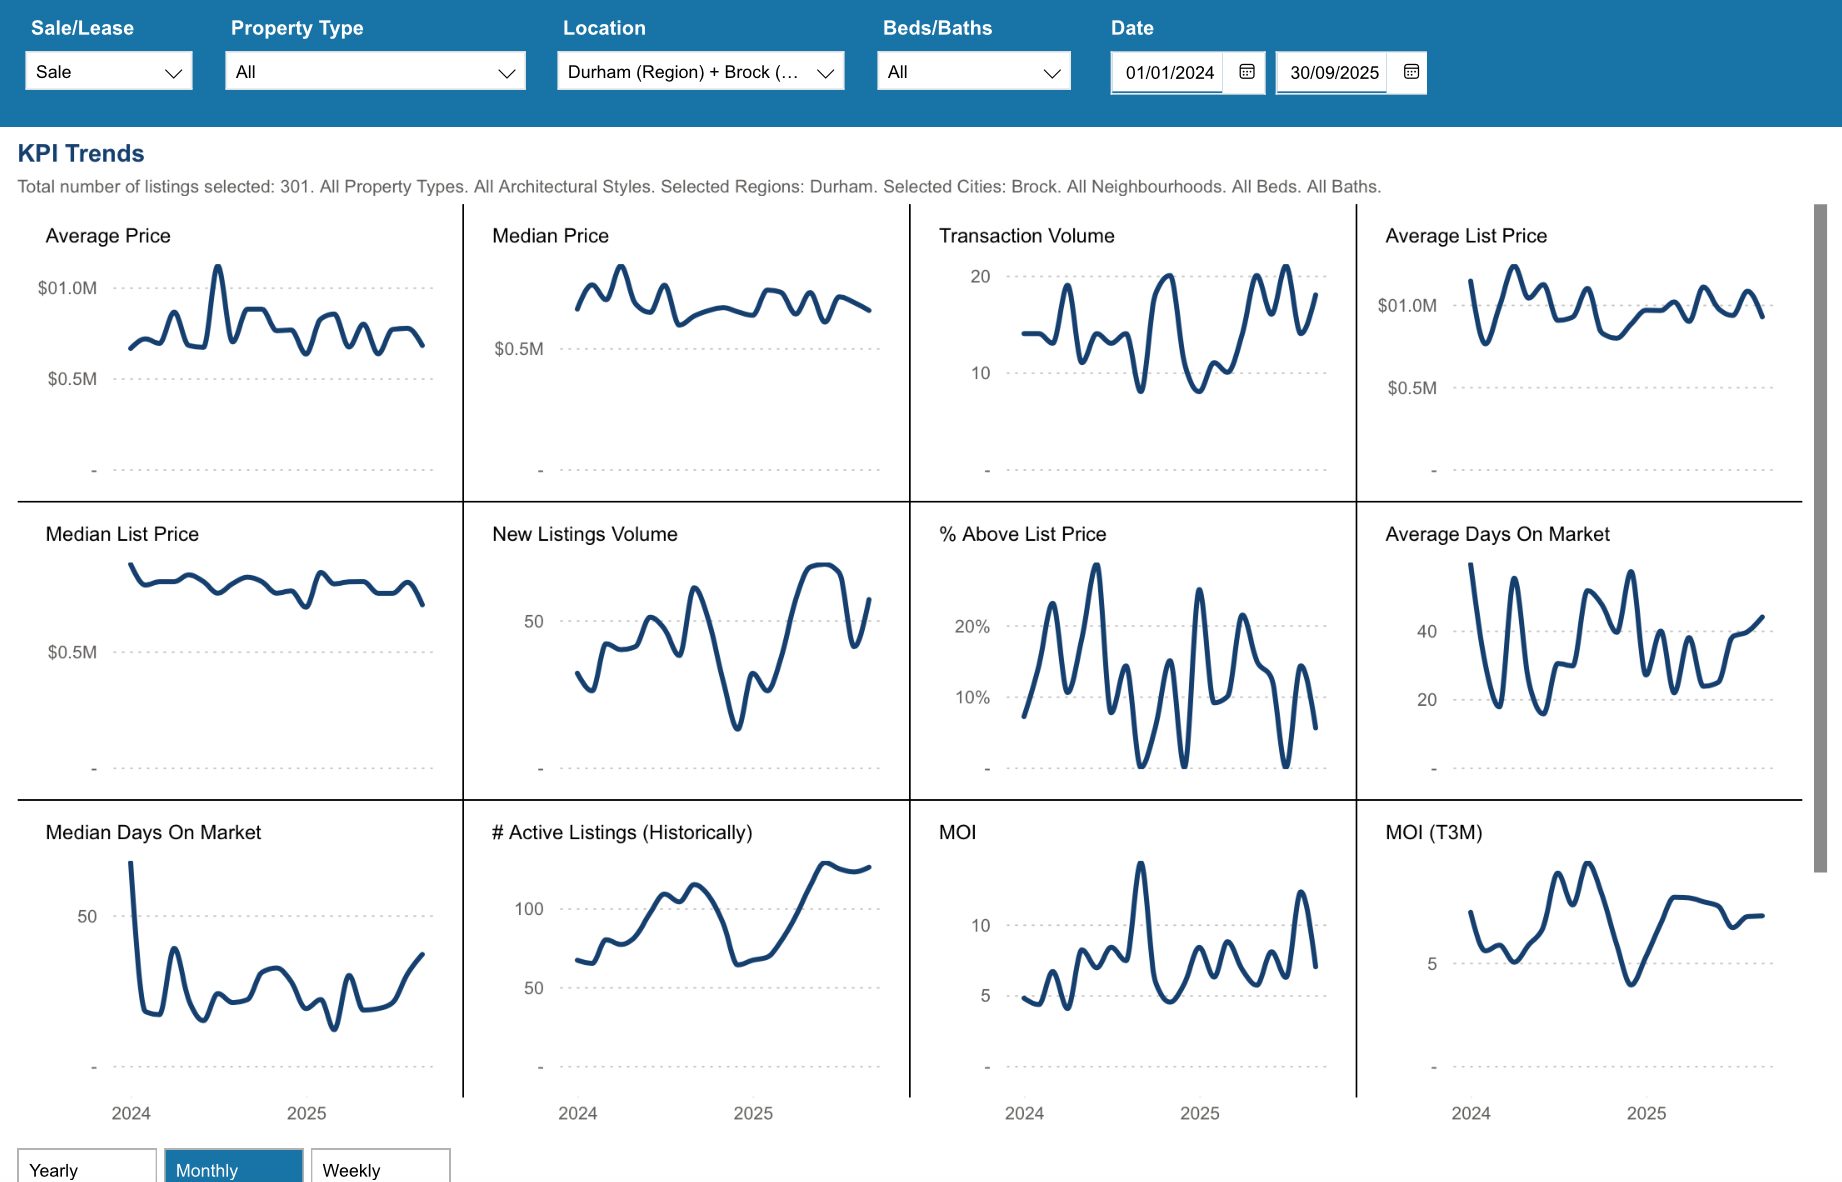
Key Performance Indicators (KPIs) from January 2024 through September 2025 provide a clear snapshot of how the Durham Region real estate market has evolved across all property types, architectural styles, and home configurations
*Information is believed to be accurate at time of posting but is not guaranteed to be correct. Some values may vary slightly based on the exact date and time the reports were generated. Market stats are provided by TRREB (Toronto Regional Real Estate Board) and are based on sales for the month of Attached/Row/Townhouses, Condo Apartments, Condo Townhouses, Detached, Detached with Common Elements, Link Homes and Semi-detached. *Some values may vary slightly based on the exact date and time the reports were generated.
Not intended as a solicitation if your property is already listed by another broker. Affiliated real estate agents are independent contractor sales associates, not employees. ©2021 Coldwell Banker. All Rights Reserved. Coldwell Banker and the Coldwell Banker logos are trademarks of Coldwell Banker Real Estate LLC. The Coldwell Banker® System is comprised of company owned offices which are owned by a subsidiary of Realogy Brokerage Group LLC and franchised offices which are independently owned and operated. The Coldwell Banker System fully supports the principles of the Fair Housing Act and the Equal Opportunity Act.
Click below for more reports
Check out our Uxbridge and Scugog Events Pages to keep up to date on whats going on around town. Click the links or scan the Code with your phone to take you directly there.

UXBRIDGE EVENTS

SCUGOG EVENTS

Scugog Housing September 2025

Scugog Housing September 2025
Each office is independently owned and operated
![]()
![]()
Housing Market Report for September 2025
Here is the Township of Scugog Housing September 2025 report (all housing types), with reports from the Canadian Real Estate Association, and Toronto Regional Real Estate Board included.
This housing report for Durham Region includes the number of new listings, average list price, number of properties sold, average selling price, average days on market and average asking price to selling price ratio for all property types within the Region of Durham.
Scroll to the bottom for links to take you to the housing market reports for Durham Region, Uxbridge and Brock.
![]()
![]()
From Toronto Regional Real Estate Board
Please note: The PropTx MLS® System, of which TRREB is a part, has added a number of new client boards over the last year. Many of these boards’ Members trade within the Greater Toronto Area and broader Greater Golden Horseshoe regions. As a result, historic data have been updated to reflect the addition of these boards’ listings and transactions. This means historic data have changed relative to previously published static reports. To view updated historic data, click here.
Toronto Regional Real Estate Board – Market Stats At A Glance – September 2025
Read the Toronto Regional Real Estate Board Market Watch Report
![]()
Scugog Township Real Estate Market Analysis – September 2025
The Township of Scugog’s real estate market saw a noticeable shift in September 2025, with stronger sales activity and a surge in average prices, largely driven by higher-end property transactions. While buyer opportunities remain, the market edged closer to balance as demand picked up heading into the fall season.
September 2025
August 2025
Average Sales Price
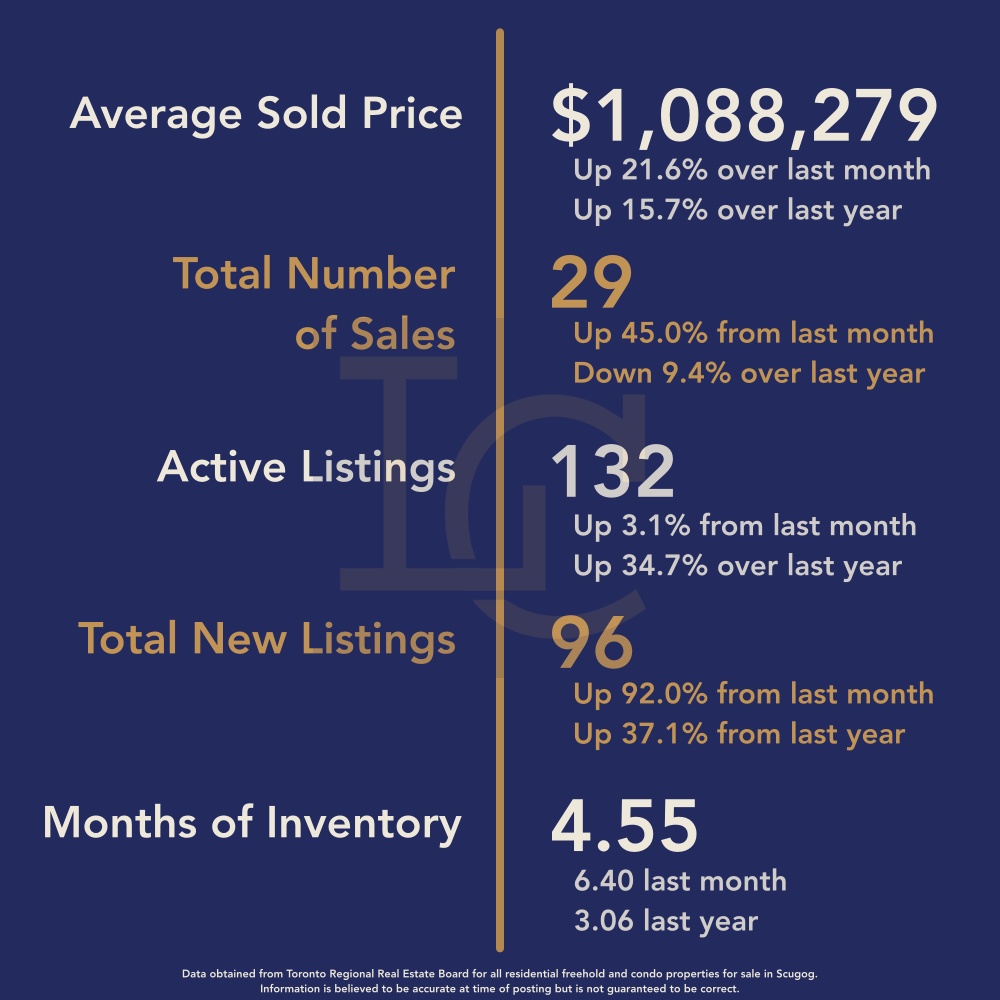
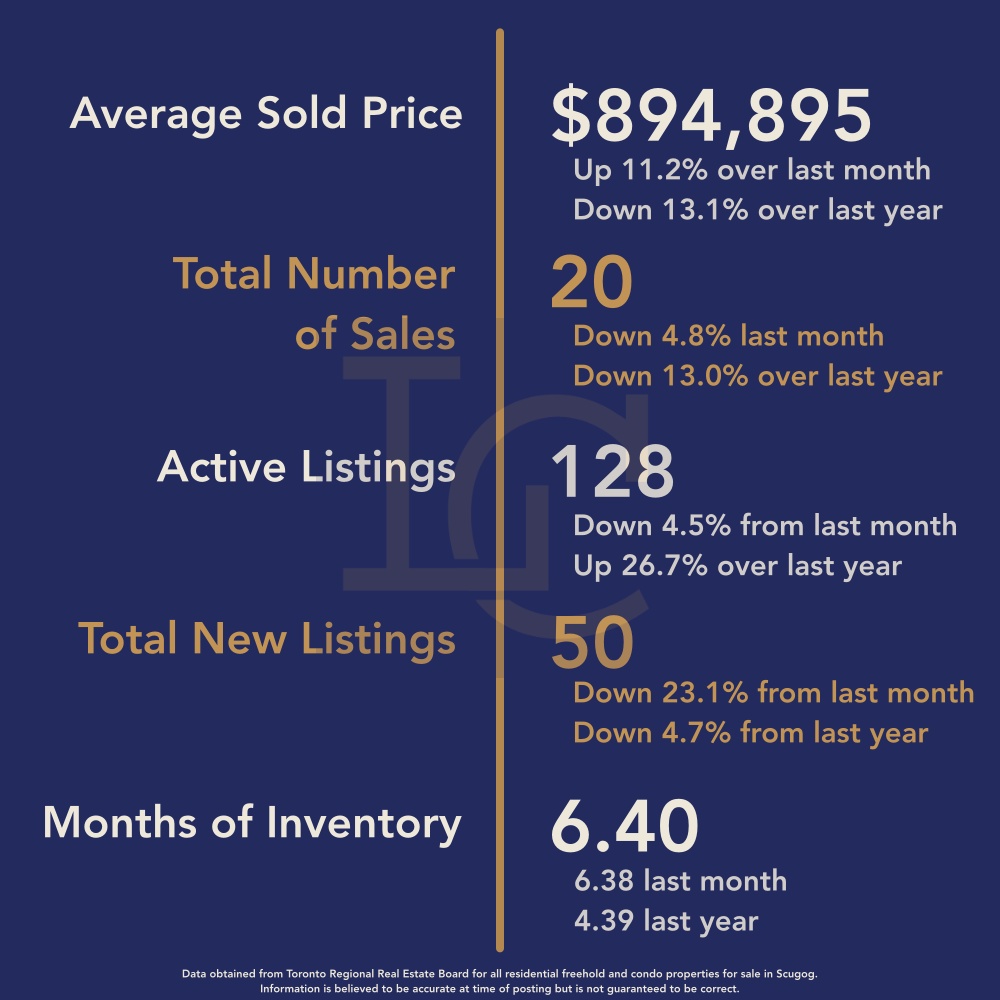
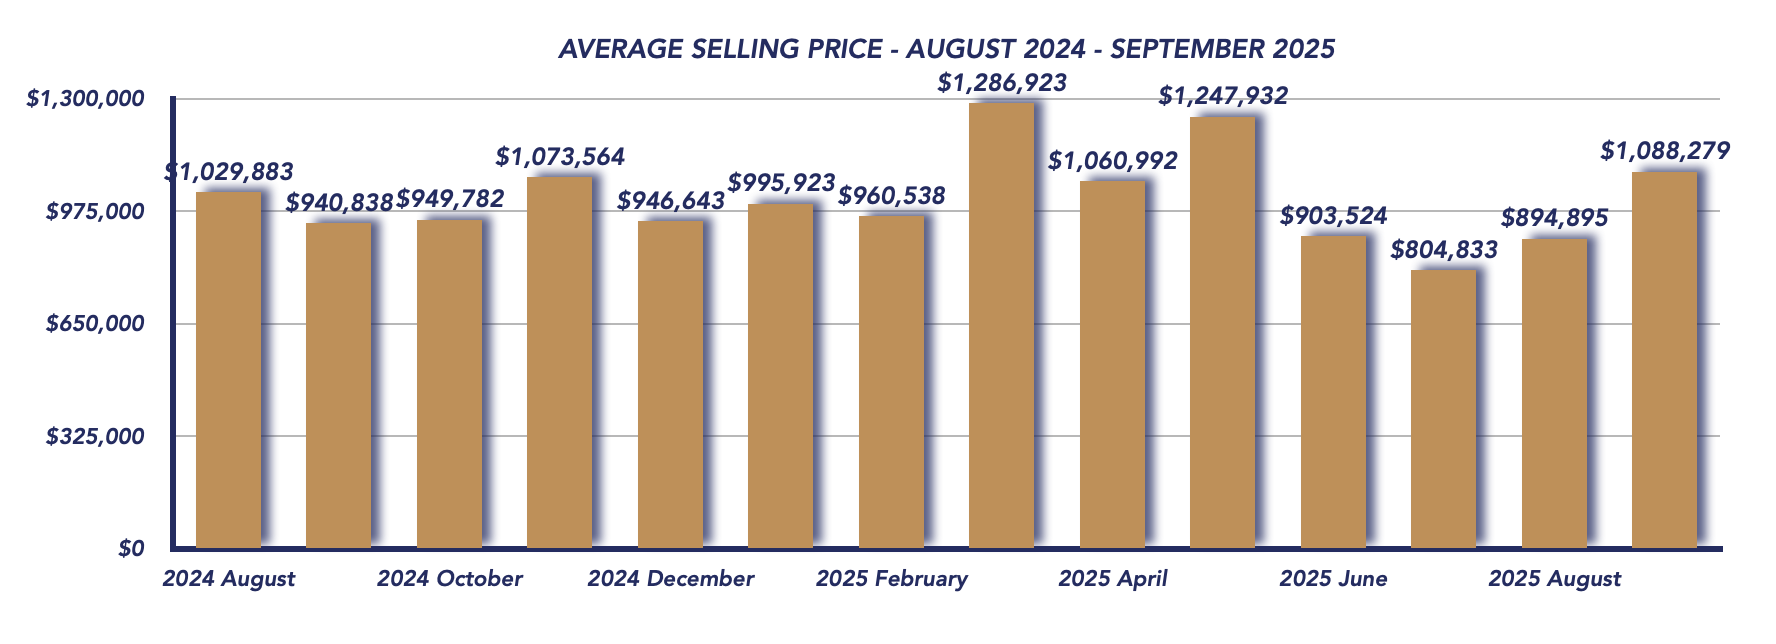
The average sales price in Scugog climbed to $1,088,279 in September 2025 — a 15.7% increase year-over-year from $940,838 in September 2024, and a 21.6% jump month-over-month from $894,895 in August 2025.
This sharp rise was influenced by several luxury transactions. Five properties sold between $1.5 million and $2 million, compared to just one in August. Meanwhile, 16 homes sold under $1 million, showing that while the upper-end sales boosted the average, the market still has activity across various price points.
This blend of affordability and high-value sales suggests a healthy mix of market interest from both move-up buyers and first-time homeowners.
Sales Activity
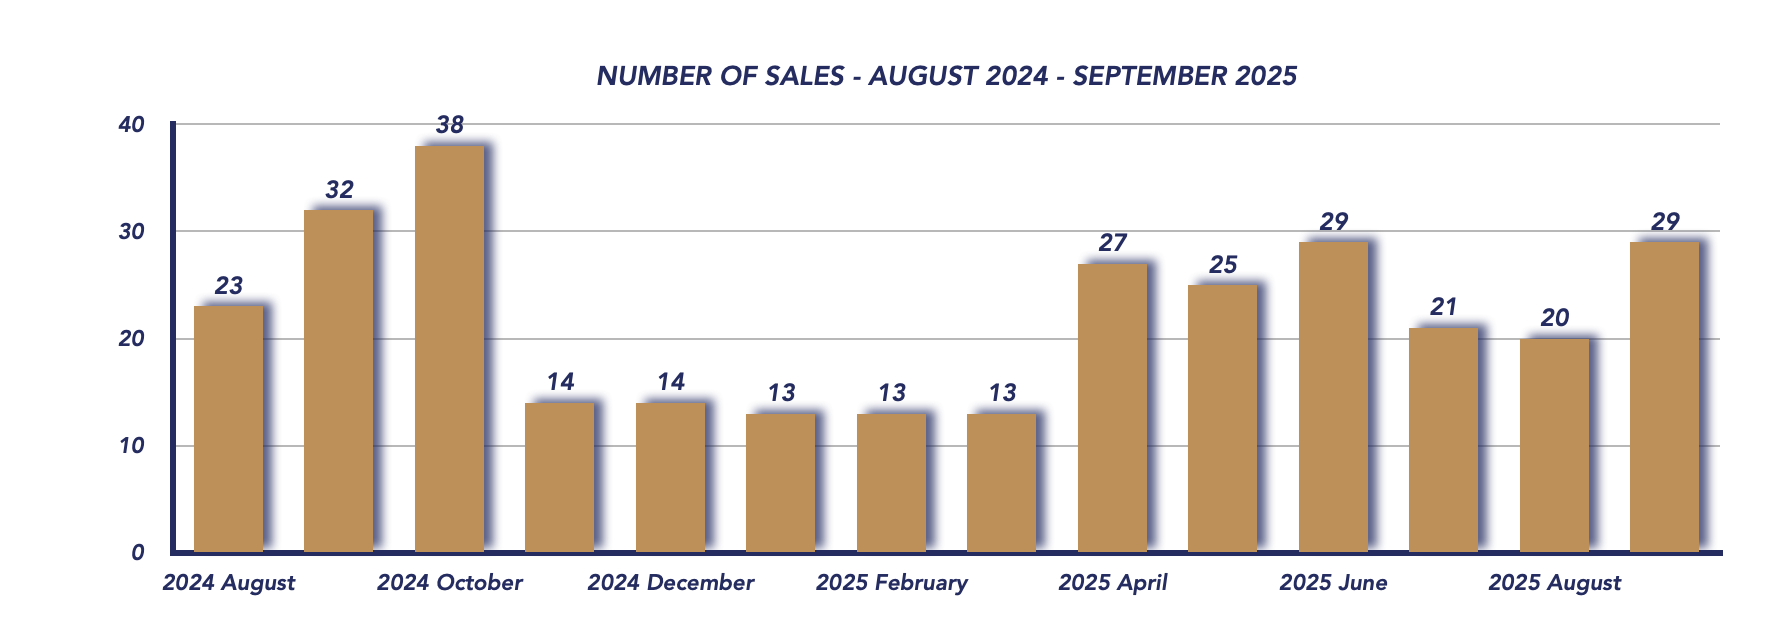
September saw 29 total sales, up from 20 in August, but slightly below the 32 sales recorded last September. The sale-to-list price ratio came in at 96%, dipping slightly from 97% in August, which shows buyers are still negotiating successfully — though the gap between asking and selling prices remains relatively tight.
This pickup in sales volume reflects renewed buyer confidence, even amid broader economic uncertainty and lingering affordability challenges across the GTA.
Listings & Inventory
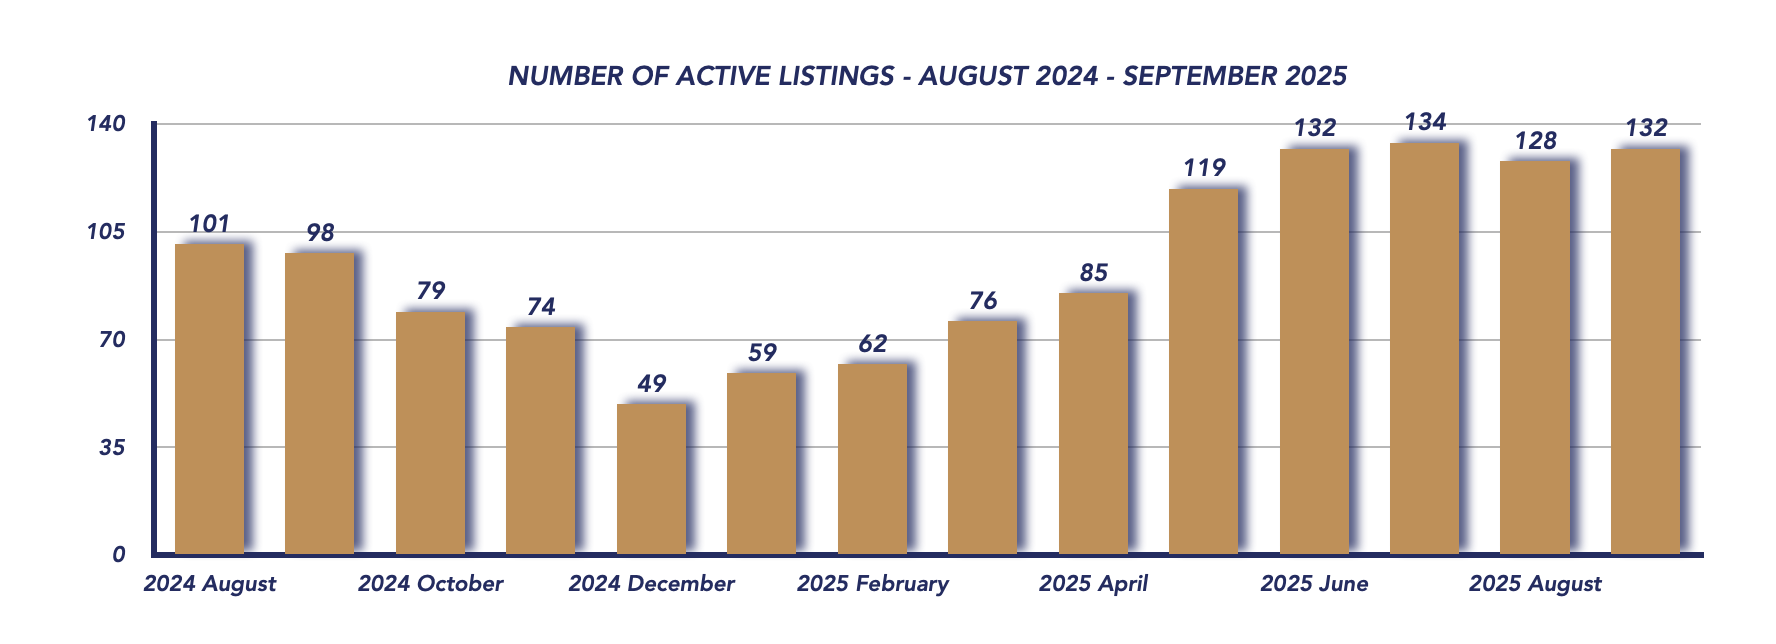
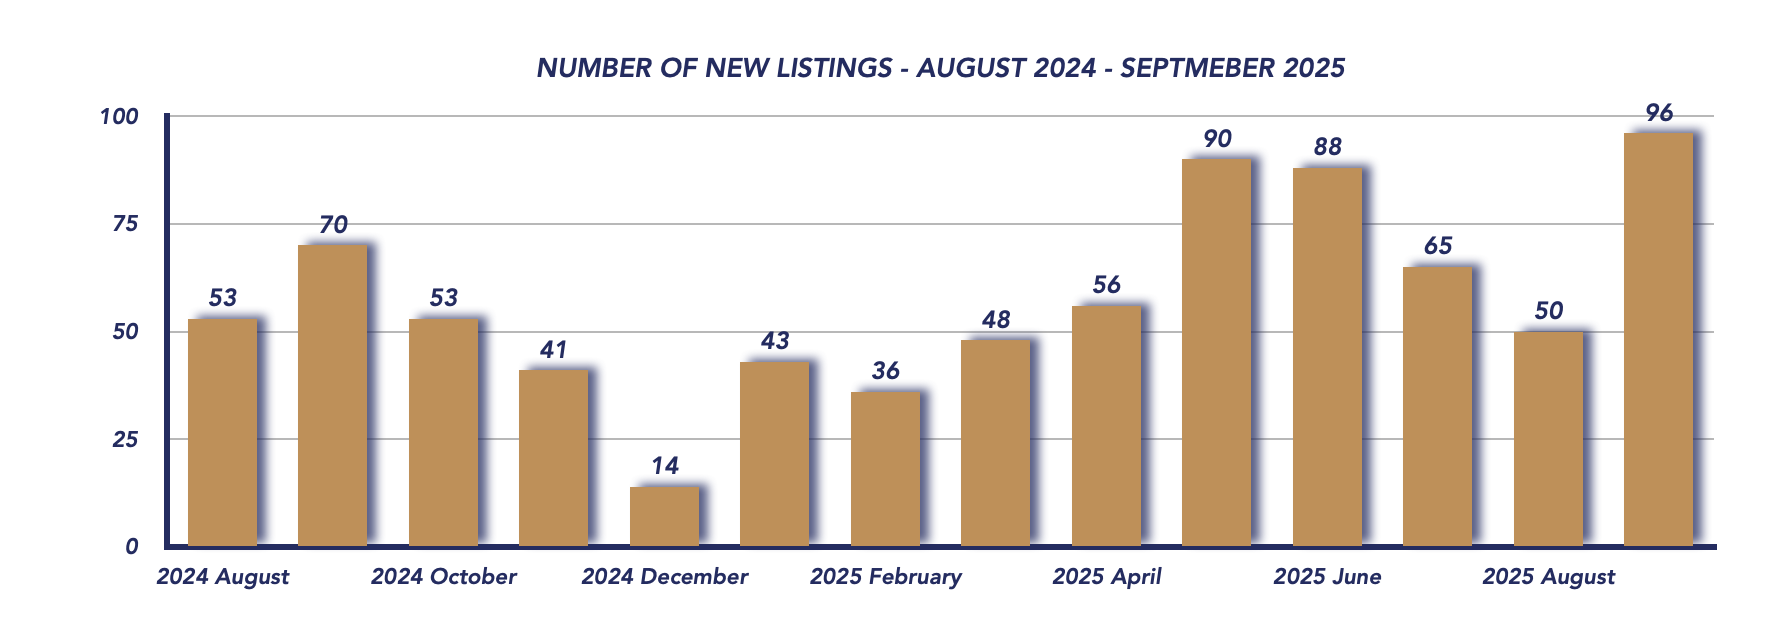
New listings surged in September, reaching 96, nearly doubling the 50 new listings recorded in August and well above 70 from last year. Active listings also ticked up to 132, compared to 128 last month and 98 a year ago, offering buyers more choice and sellers more competition.
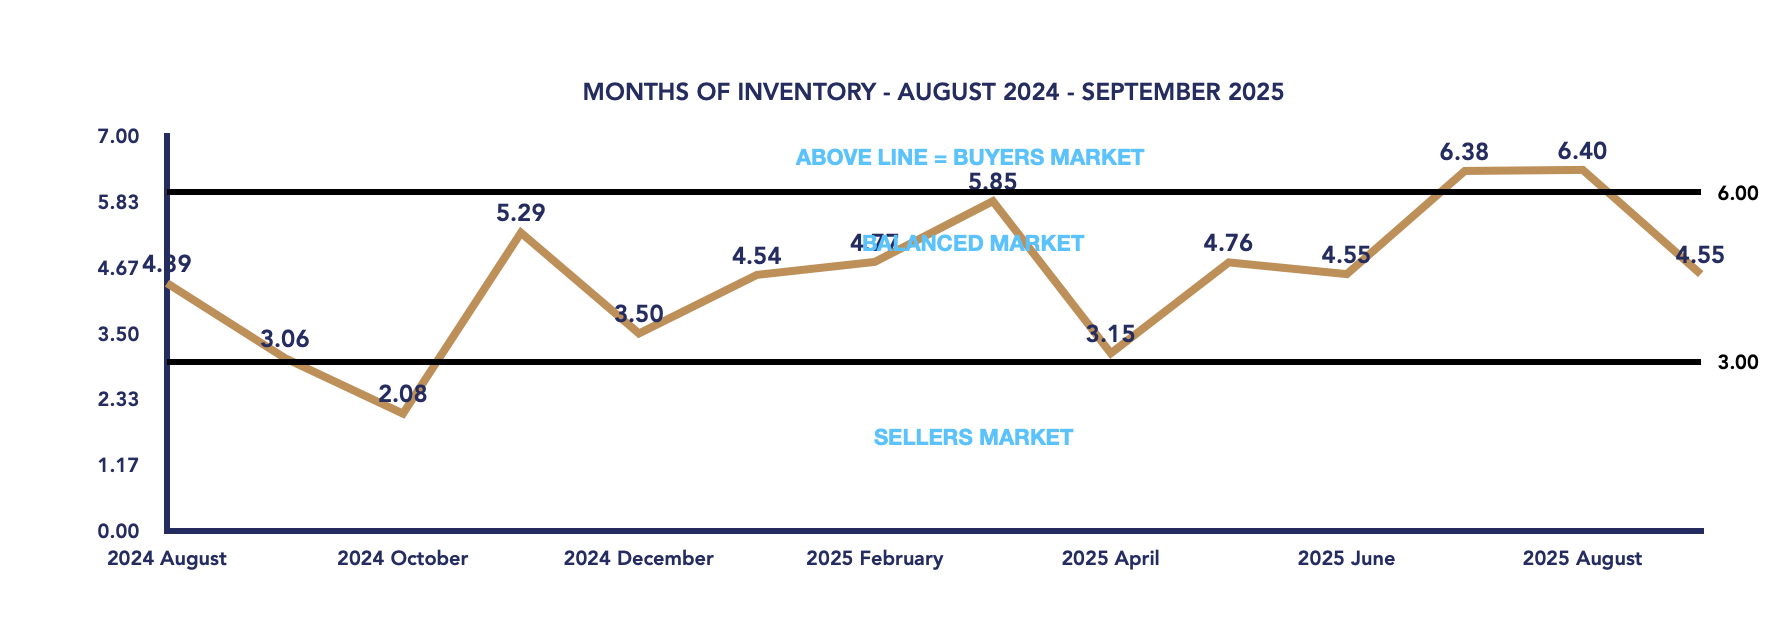
The months of inventory fell from 6.40 in August to 4.55, marking a move from a buyer’s market back into balanced market territory. This tightening suggests demand is absorbing listings more quickly as the fall market gains momentum.
Days on Market
Homes in Scugog took an average of 57 days to sell, a modest improvement from 64 days in August. While properties are still spending nearly two months on the market, this shorter timeline hints at stronger buyer engagement compared to the slower pace earlier this summer.
Key Takeaways
-
Average price jumped 21.6% month-over-month, boosted by five luxury sales over $1.5 million.
-
Sales volume increased, showing renewed market activity heading into fall.
-
New listings nearly doubled, expanding buyer choice and easing pressure on prices.
-
Months of inventory dropped to 4.55, signaling a shift toward balance.
-
Homes sold faster, reflecting improving buyer confidence.
As we move deeper into the fall market, Scugog continues to stabilize. With prices trending upward and inventory holding steady, both buyers and sellers can find opportunities. Buyers should act decisively on well-priced listings, while sellers should stay realistic on pricing to stand out in an active but balanced market.
Key Performance Indicators (KPIs) from January 2024 through September 2025 provide a clear snapshot of how the Durham Region real estate market has evolved across all property types, architectural styles, and home configurations

WATCH OUR MONDAY MARKET MINUTES
*Information is believed to be accurate at time of posting but is not guaranteed to be correct. Some values may vary slightly based on the exact date and time the reports were generated. Market stats are provided by TRREB (Toronto Regional Real Estate Board) and are based on sales for the month of Attached/Row/Townhouses, Condo Apartments, Condo Townhouses, Detached, Detached with Common Elements, Link Homes and Semi-detached. *Some values may vary slightly based on the exact date and time the reports were generated.
Not intended as a solicitation if your property is already listed by another broker. Affiliated real estate agents are independent contractor sales associates, not employees. ©2021 Coldwell Banker. All Rights Reserved. Coldwell Banker and the Coldwell Banker logos are trademarks of Coldwell Banker Real Estate LLC. The Coldwell Banker® System is comprised of company owned offices which are owned by a subsidiary of Realogy Brokerage Group LLC and franchised offices which are independently owned and operated. The Coldwell Banker System fully supports the principles of the Fair Housing Act and the Equal Opportunity Act.
Click below for more reports
Check out our Uxbridge and Scugog Events Pages to keep up to date on whats going on around town. Click the links or scan the Code with your phone to take you directly there.
UXBRIDGE EVENTS
SCUGOG EVENTS
Uxbridge Housing September 2025

Uxbridge Housing September 2025
Each office is independently owned and operated
![]()
![]()
Housing Market Report for September 2025
Here is the Township of Uxbridge Housing September 2025 report (all housing types), with reports from the Canadian Real Estate Association, and Toronto Regional Real Estate Board included.
This housing report for Durham Region includes the number of new listings, average list price, number of properties sold, average selling price, average days on market and average asking price to selling price ratio for all property types within the Region of Durham.
Scroll to the bottom for links to take you to the housing market reports for Durham Region, Scugog and Brock.
![]()
![]()
From Toronto Regional Real Estate Board
Please note: The PropTx MLS® System, of which TRREB is a part, has added a number of new client boards over the last year. Many of these boards’ Members trade within the Greater Toronto Area and broader Greater Golden Horseshoe regions. As a result, historic data have been updated to reflect the addition of these boards’ listings and transactions. This means historic data have changed relative to previously published static reports. To view updated historic data, click here.
Toronto Regional Real Estate Board – Market Stats At A Glance – September 2025
Read the Toronto Regional Real Estate Board Market Watch Report
![]()
Uxbridge Township Real Estate Market Analysis – September 2025
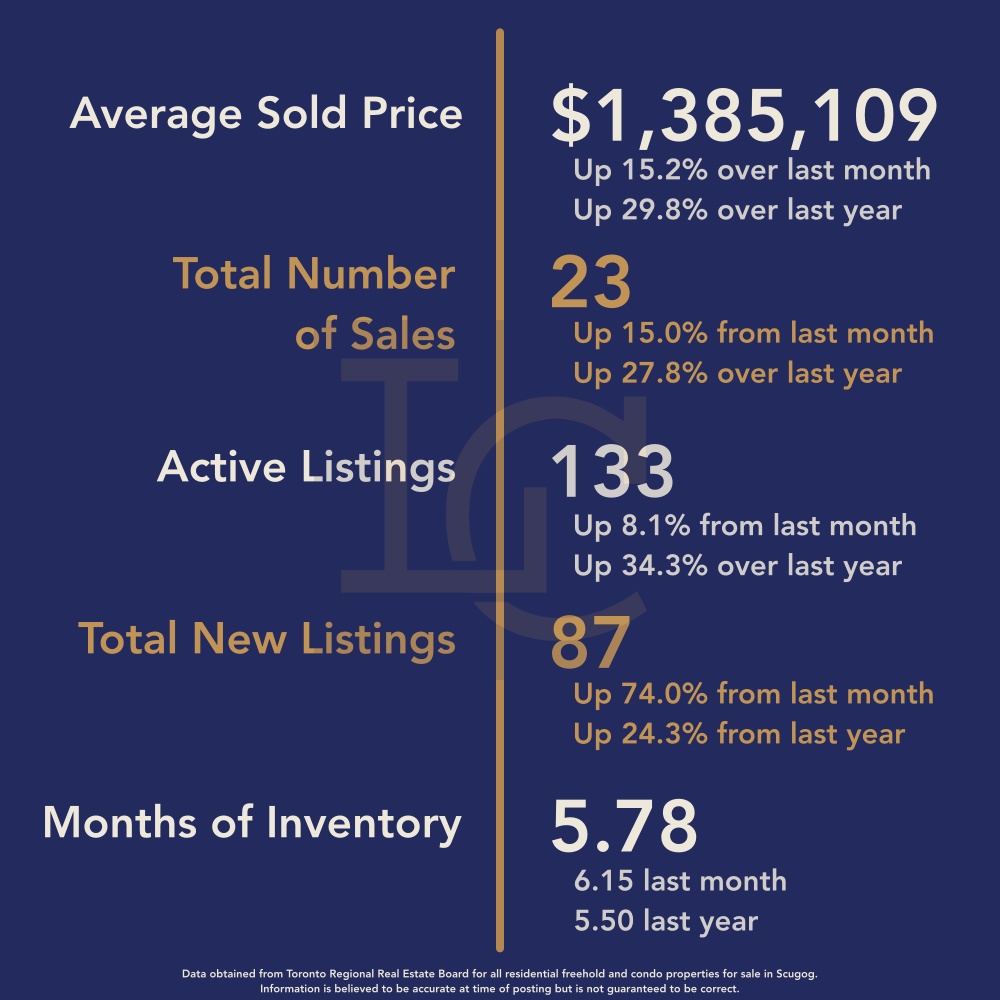
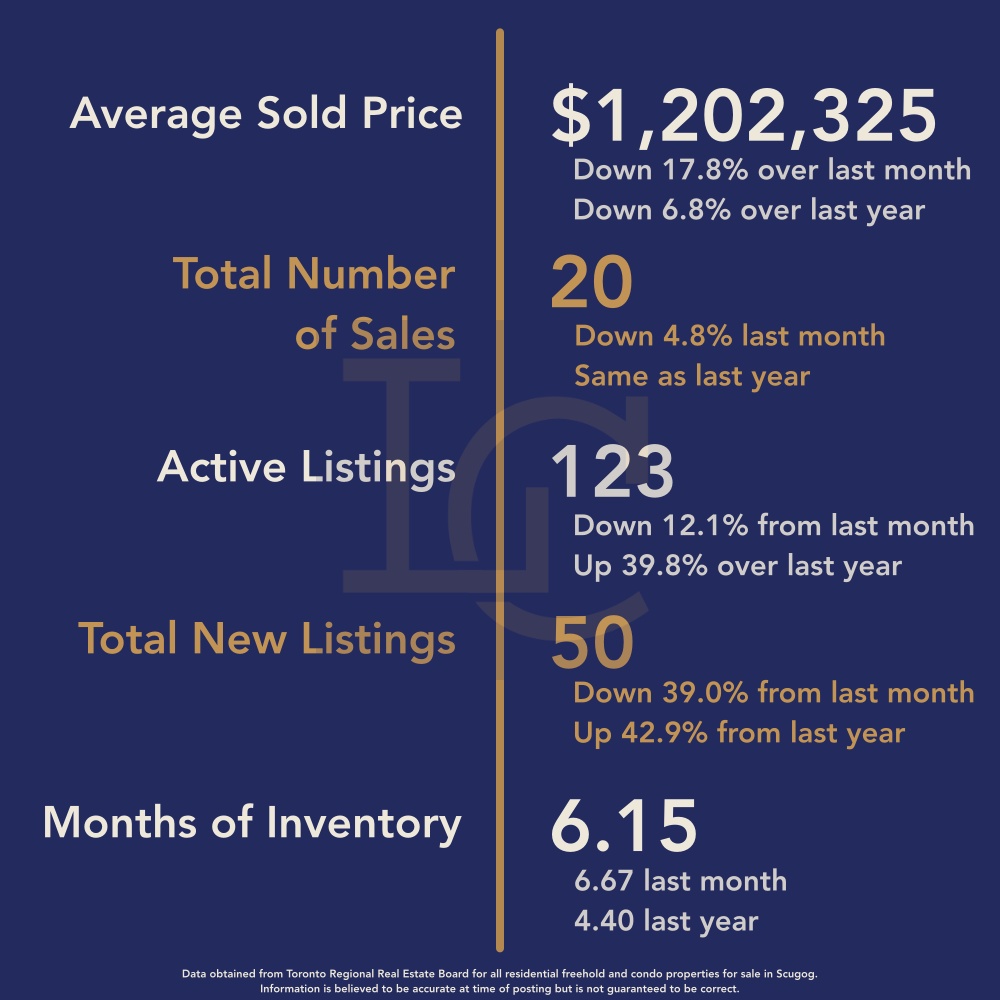
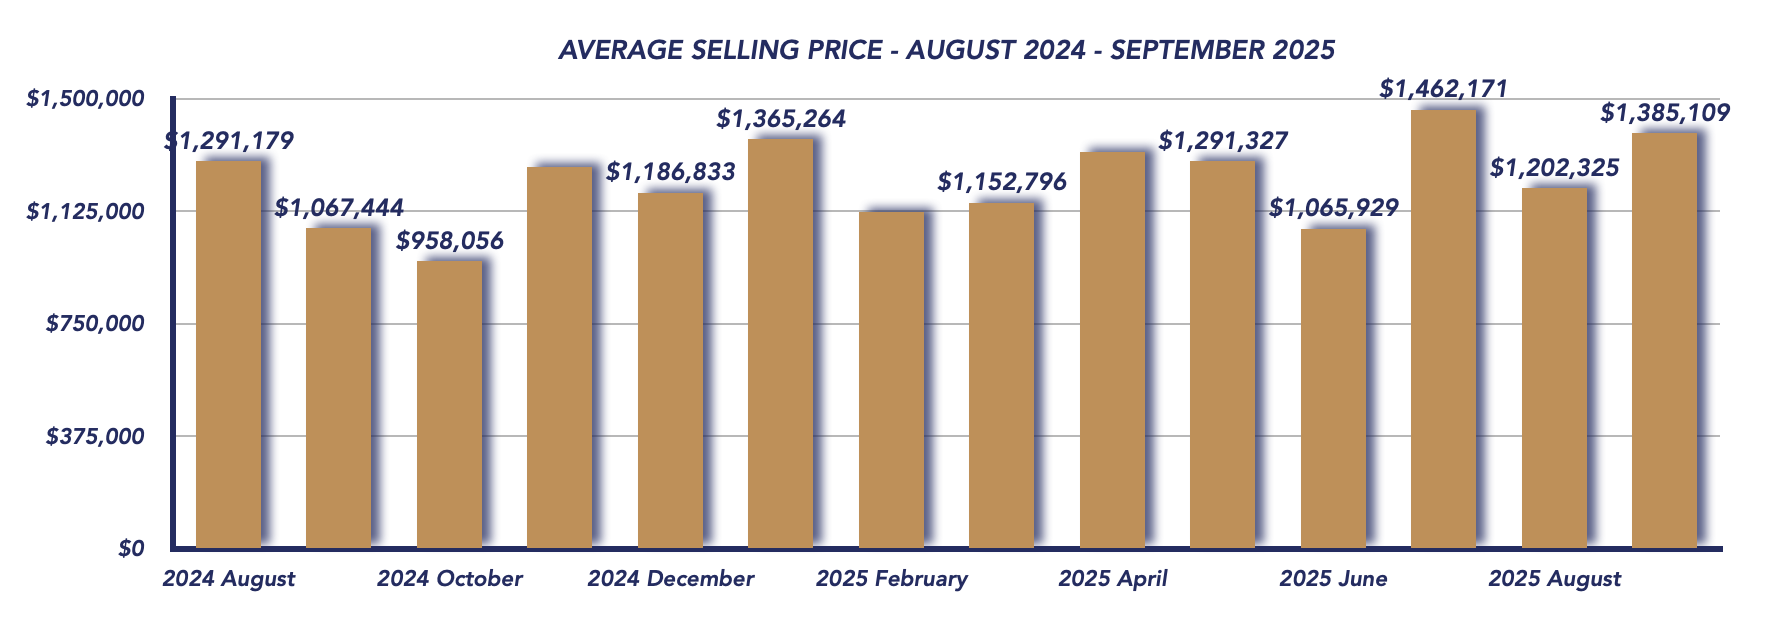
The Uxbridge housing market showed a strong rebound in September 2025, with the average sale price climbing to $1,385,109, marking a 15.2% increase from August’s $1,202,325 and an impressive 29.8% jump from September 2024’s $1,067,444. This upward movement was driven by a noticeable shift in the types of properties selling — with more higher-end homes trading hands compared to the previous month and the same period last year.
In August 2025, only one property sold above $2 million, and nearly half of all sales were under $1 million. In contrast, September saw two properties sell over $2 million and eight additional properties sell between $1.5 million and $2 million, pulling the average price upward. This change in sales composition highlights a return of mid- to upper-tier buyers to the market.
September 2025
August 2025
Sales Activity
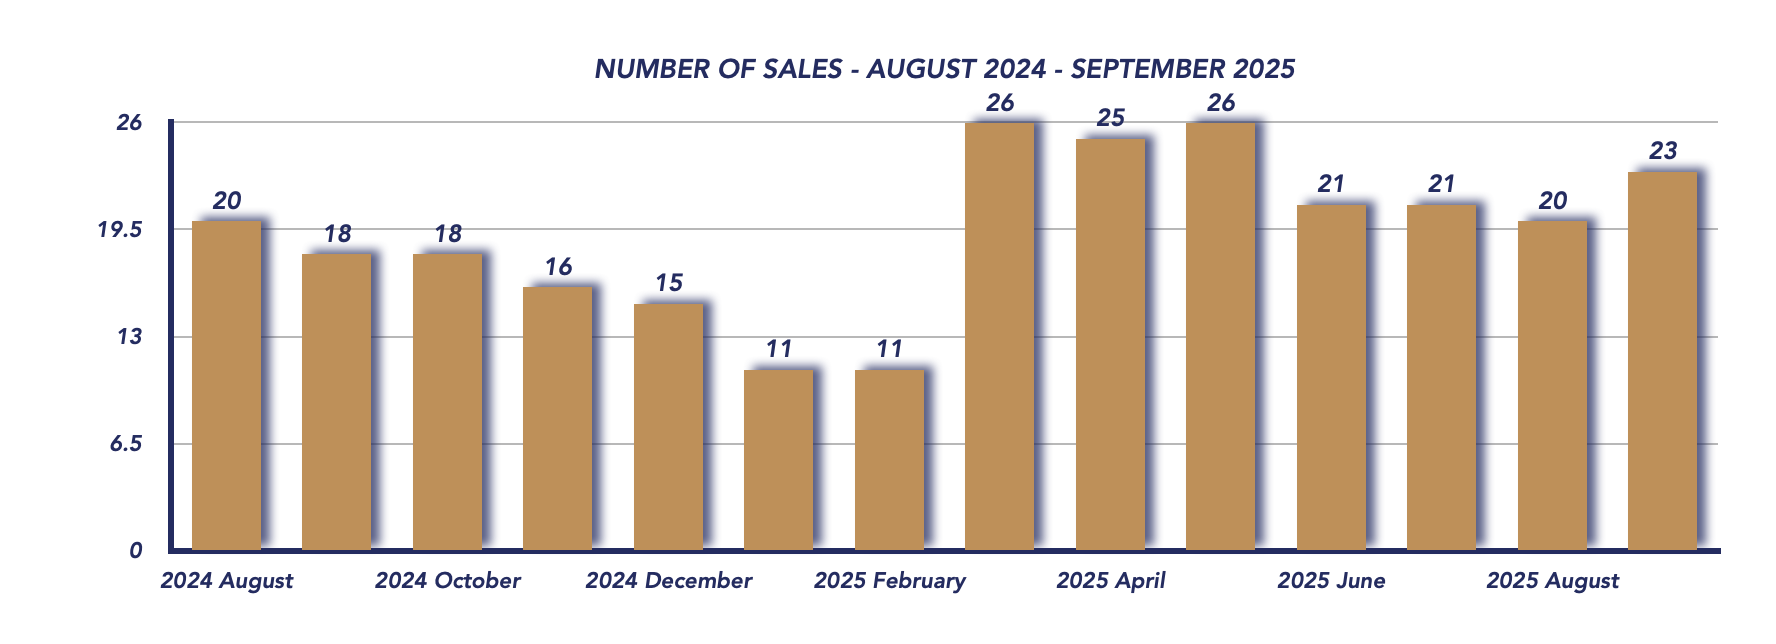
A total of 23 homes were sold in September, slightly higher than August’s 21 sales and September 2024’s 20 sales. The modest increase suggests steady buyer interest, especially in higher-value properties, despite broader market uncertainty.
Sale-to-List Price Ratio
The sale-to-list price ratio remained steady at 96%, unchanged from August. This consistency indicates that while prices rose, buyers are still negotiating, and sellers are pricing properties more realistically to meet current market conditions.
Active Listings
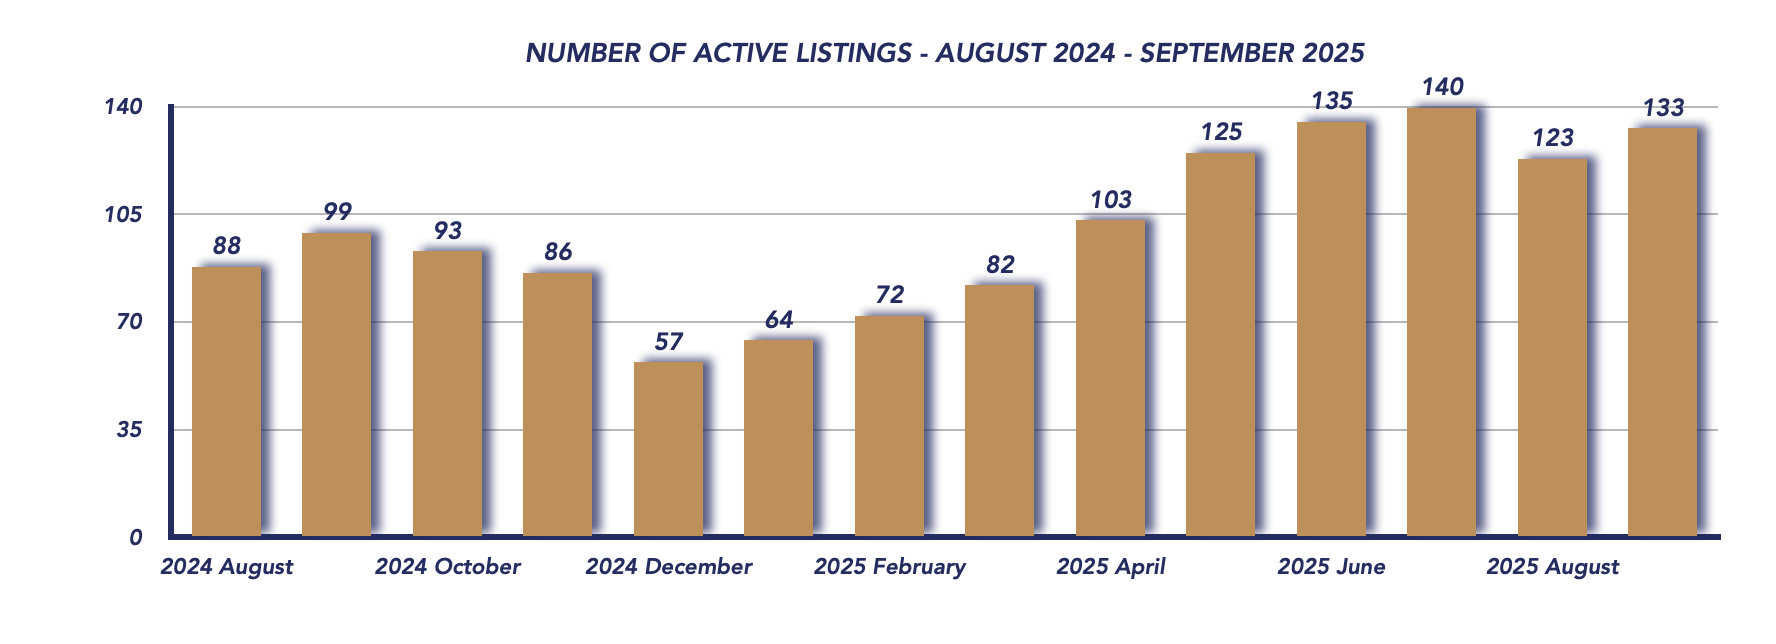
Active listings increased to 133, up from 123 in August and 99 at the same time last year. The ongoing rise in available properties reflects a healthy level of supply, providing buyers with plenty of options while preventing prices from overheating.
New Listings
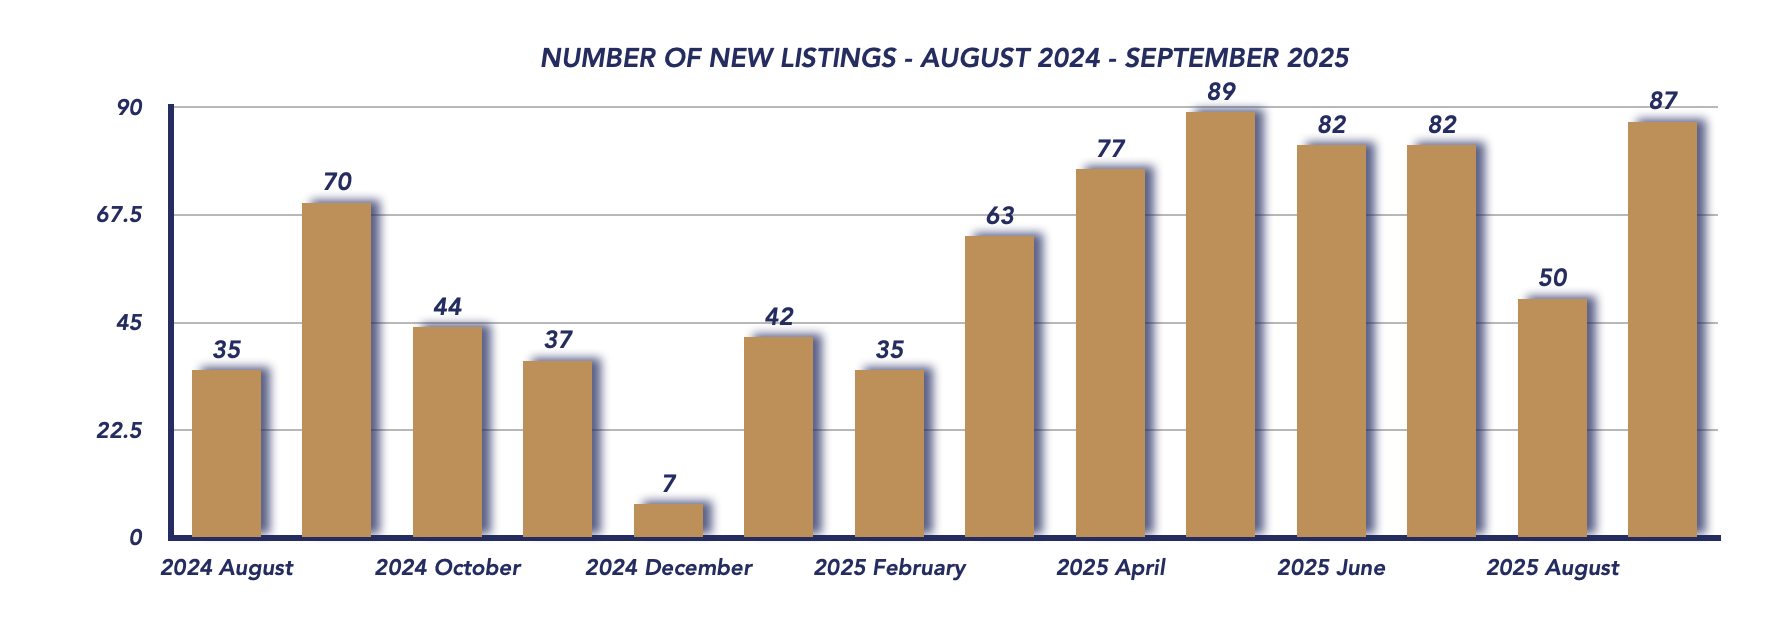
The number of new listings jumped to 87, compared to 50 in August and 70 in September 2024. This surge in new inventory could signal renewed seller confidence, as homeowners look to take advantage of stronger prices and steady sales activity heading into the fall market.
Days on Market
Properties took an average of 73 days to sell in September, up slightly from 67 days in August, suggesting that while buyer interest is solid, transactions are still taking time to finalize—especially in higher price brackets.
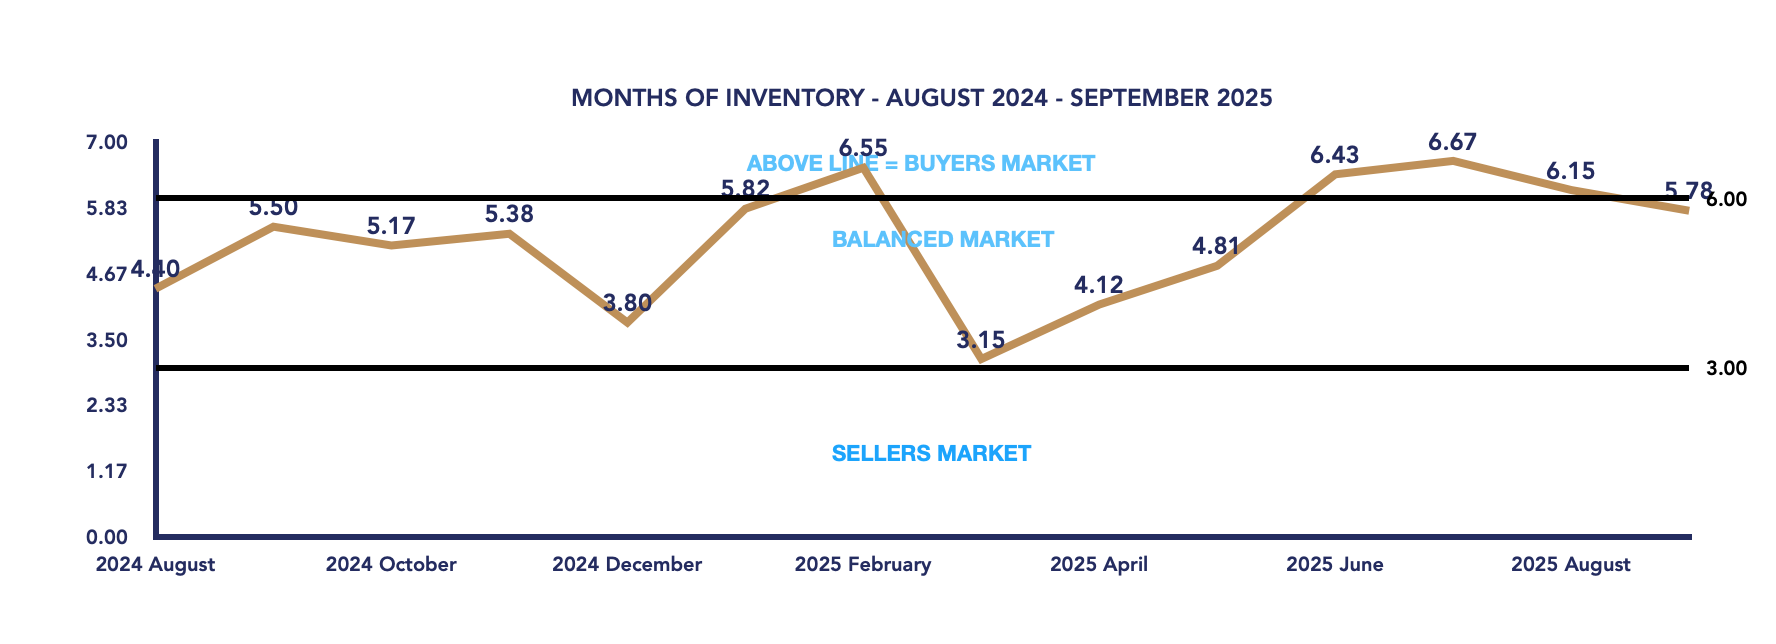
Months of Inventory
The months of inventory fell slightly to 5.78, down from 6.15 in August, moving the market just into balanced territory. This subtle shift hints that while buyers still hold some leverage, market conditions are stabilizing, balancing supply and demand more evenly.
Conclusion
September 2025 marked a turning point for the Uxbridge real estate market, with a significant rise in average sale prices driven by a wave of higher-end home sales. Despite longer selling times and a steady sale-to-list ratio, the market continues to show resilience as it edges closer to balance.
With more listings coming to market and consistent buyer interest, Uxbridge is showing signs of stability after months of fluctuation. As we move into the fall, both buyers and sellers will be watching closely to see whether this momentum carries forward or if the market cools once again.
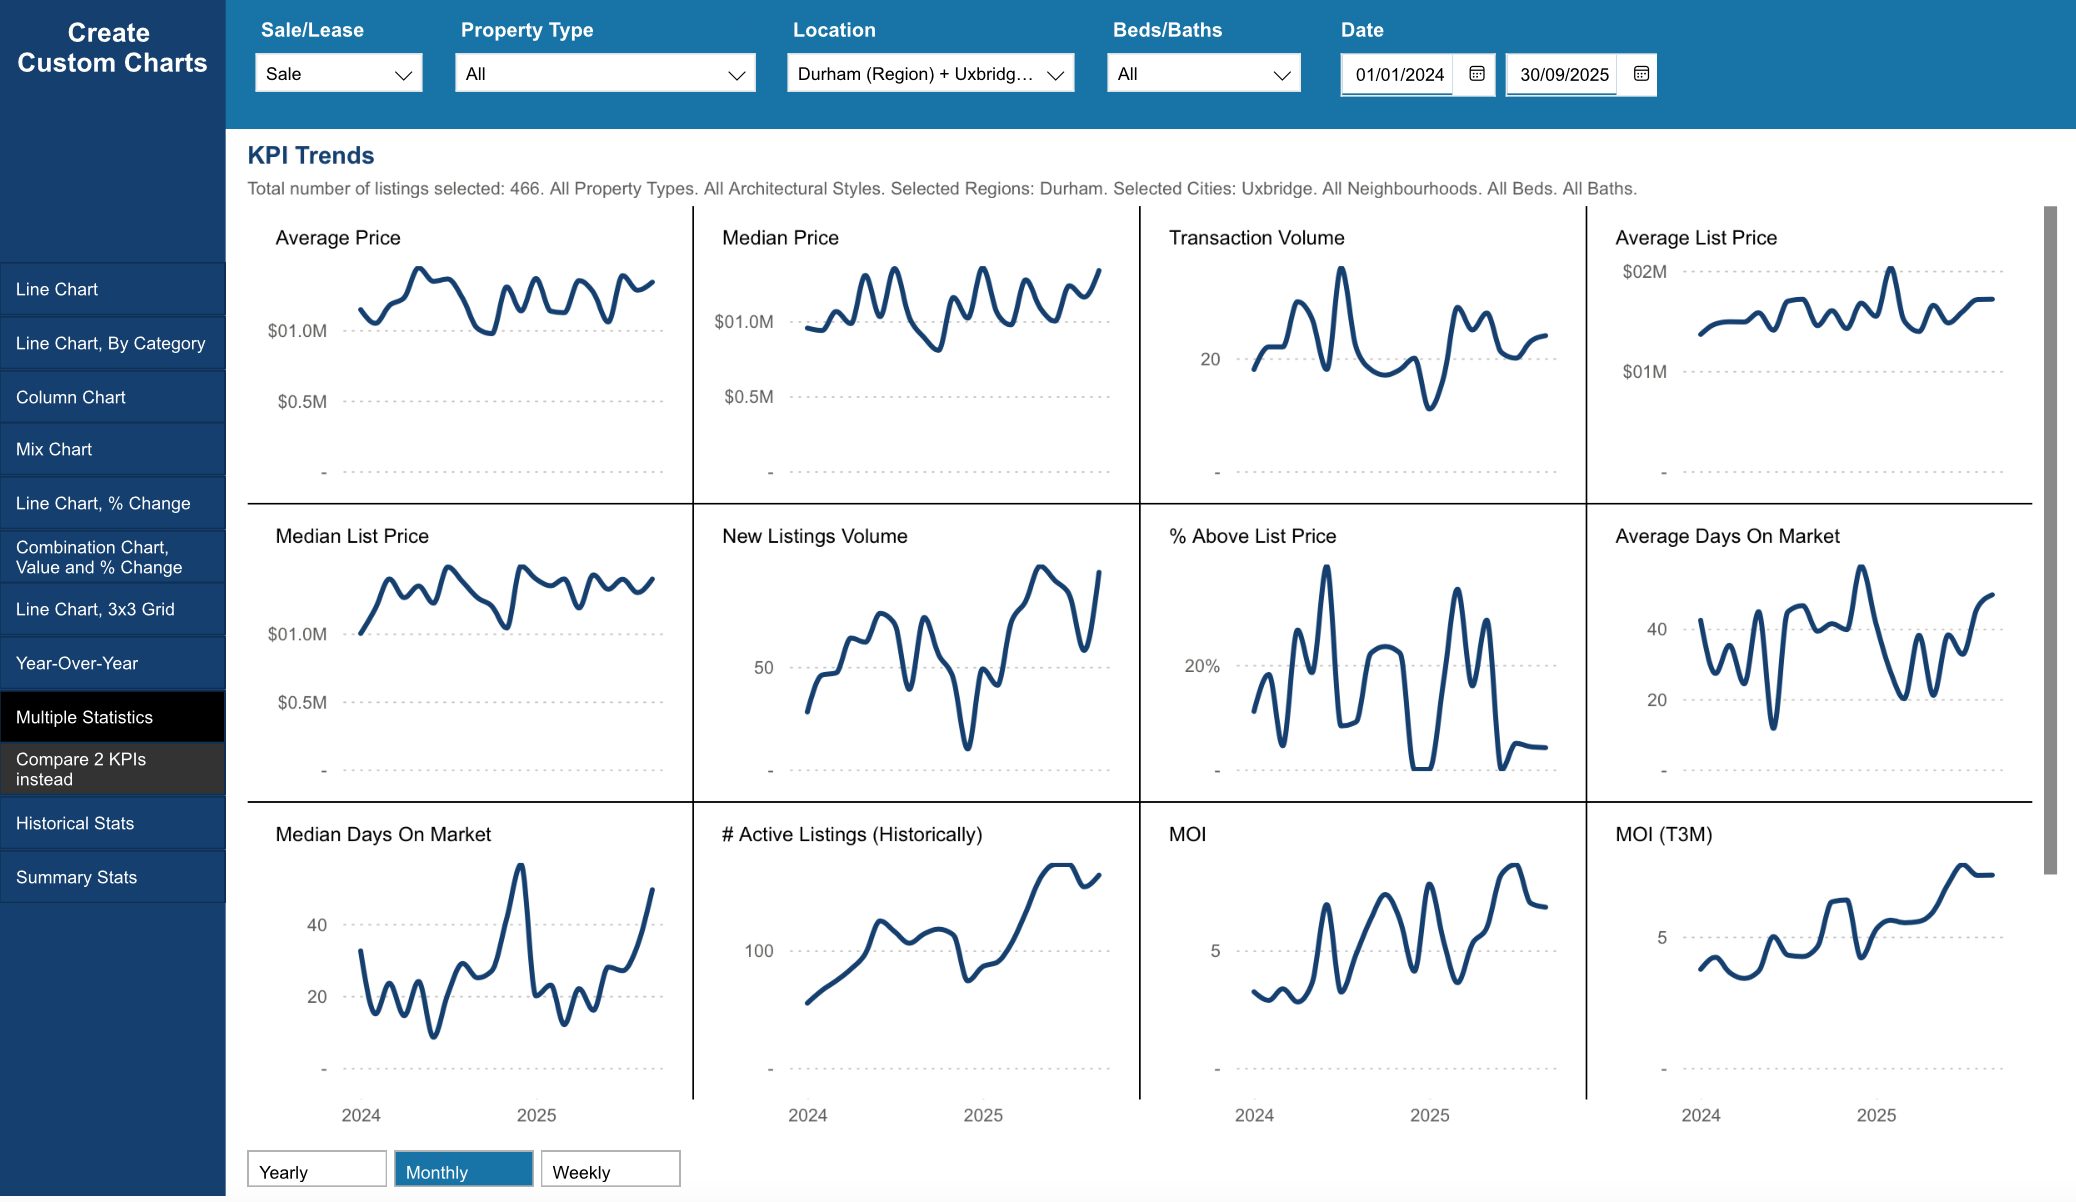
Key Performance Indicators (KPIs) from January 2024 through September 2025 provide a clear snapshot of how the Durham Region real estate market has evolved across all property types, architectural styles, and home configurations
WATCH OUR MONDAY MARKET MINUTES
*Information is believed to be accurate at time of posting but is not guaranteed to be correct. Some values may vary slightly based on the exact date and time the reports were generated. Market stats are provided by TRREB (Toronto Regional Real Estate Board) and are based on sales for the month of Attached/Row/Townhouses, Condo Apartments, Condo Townhouses, Detached, Detached with Common Elements, Link Homes and Semi-detached. *Some values may vary slightly based on the exact date and time the reports were generated.
Not intended as a solicitation if your property is already listed by another broker. Affiliated real estate agents are independent contractor sales associates, not employees. ©2021 Coldwell Banker. All Rights Reserved. Coldwell Banker and the Coldwell Banker logos are trademarks of Coldwell Banker Real Estate LLC. The Coldwell Banker® System is comprised of company owned offices which are owned by a subsidiary of Realogy Brokerage Group LLC and franchised offices which are independently owned and operated. The Coldwell Banker System fully supports the principles of the Fair Housing Act and the Equal Opportunity Act.
Click below for more reports
Check out our Uxbridge and Scugog Events Pages to keep up to date on whats going on around town. Click the links or scan the Code with your phone to take you directly there.
UXBRIDGE EVENTS
SCUGOG EVENTS
Durham Region Housing September 2025

Durham Region Housing September 2025
Each office is independently owned and operated
![]()
![]()
Housing Market Report for September 2025
Here is the Region of Durham Housing September 2025 report (all housing types), with reports from the Canadian Real Estate Association, and Toronto Regional Real Estate Board included.
This housing report for Durham Region includes the number of new listings, average list price, number of properties sold, average selling price, average days on market and average asking price to selling price ratio for all property types within the Region of Durham.
Scroll to the bottom for links to take you to the housing market reports for Uxbridge, Scugog and Brock.
![]()
![]()
From Toronto Regional Real Estate Board
Please note: The PropTx MLS® System, of which TRREB is a part, has added a number of new client boards over the last year. Many of these boards’ Members trade within the Greater Toronto Area and broader Greater Golden Horseshoe regions. As a result, historic data have been updated to reflect the addition of these boards’ listings and transactions. This means historic data have changed relative to previously published static reports. To view updated historic data, click here.
Toronto Regional Real Estate Board – Market Stats At A Glance – September 2025
Read the Toronto Regional Real Estate Board Market Watch Report
![]()
Durham Region Real Estate Market Analysis – September 2025
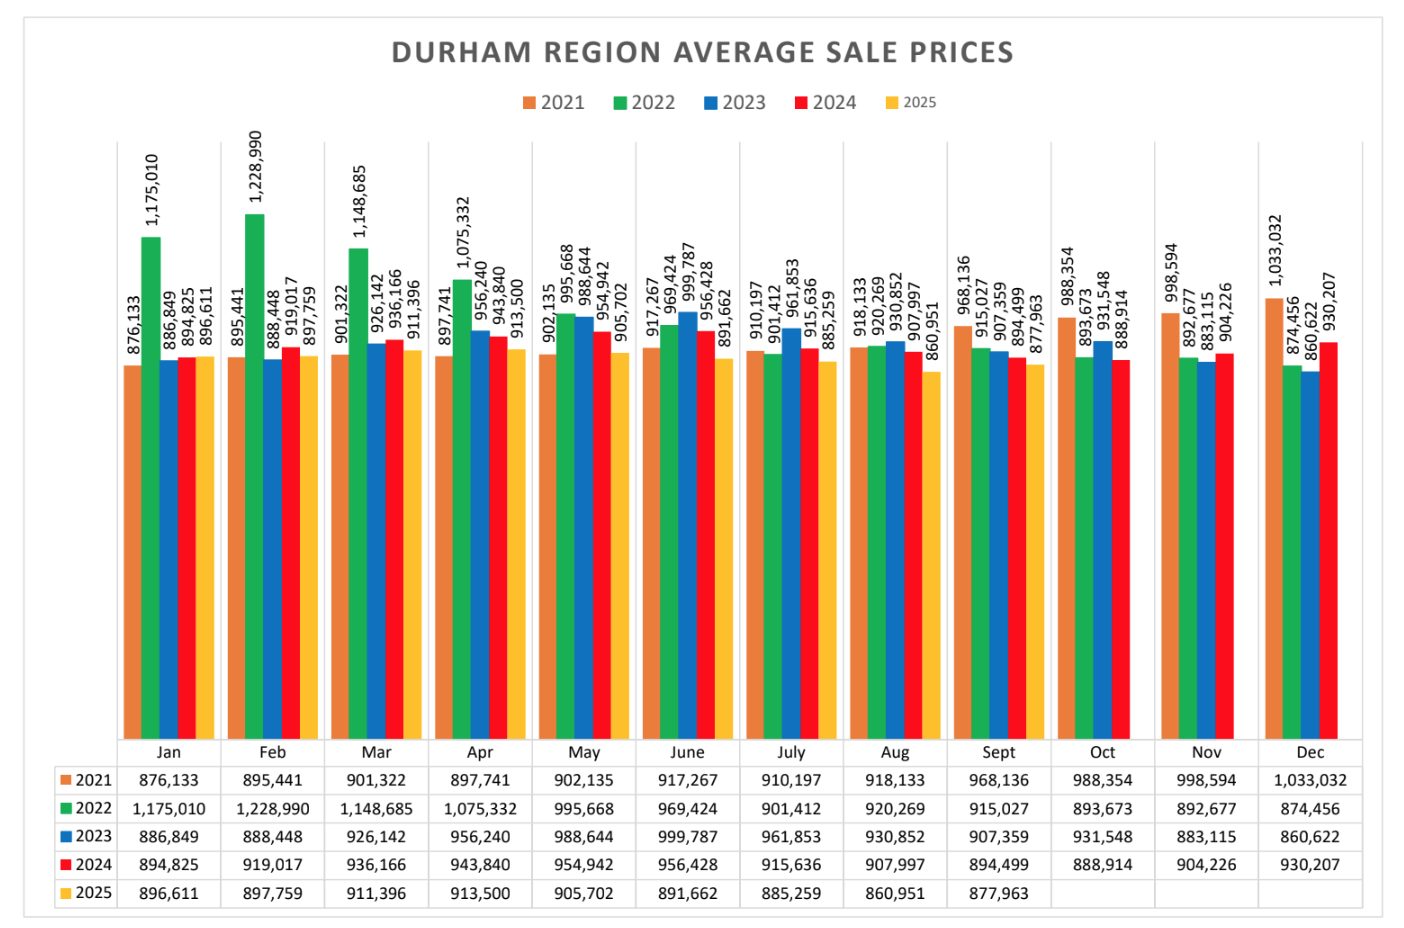
As summer turned to fall, the Durham Region real estate market showed encouraging signs of balance and resilience in September 2025. Prices edged higher for the first time in months, sales activity gained momentum, and inventory levels remained stable—suggesting that buyers and sellers are adapting to a new normal. While year-over-year prices are still slightly lower, the gap continues to narrow, hinting at renewed stability. With the GTA market seeing renewed strength, time will tell whether that momentum will ripple eastward into Durham or if the region will continue to move at its own steady pace.
September 2025
August 2025
📈 Average Sale Price Edges Up for the First Time in Months
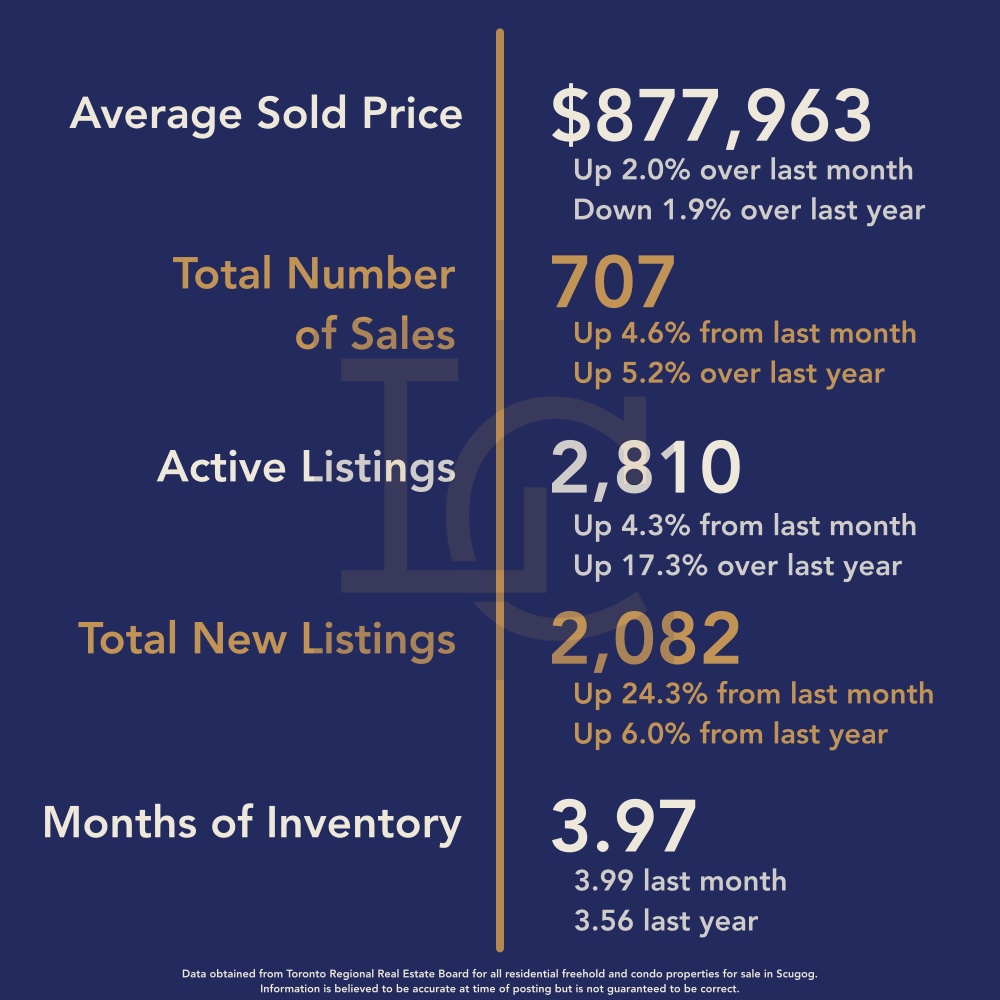
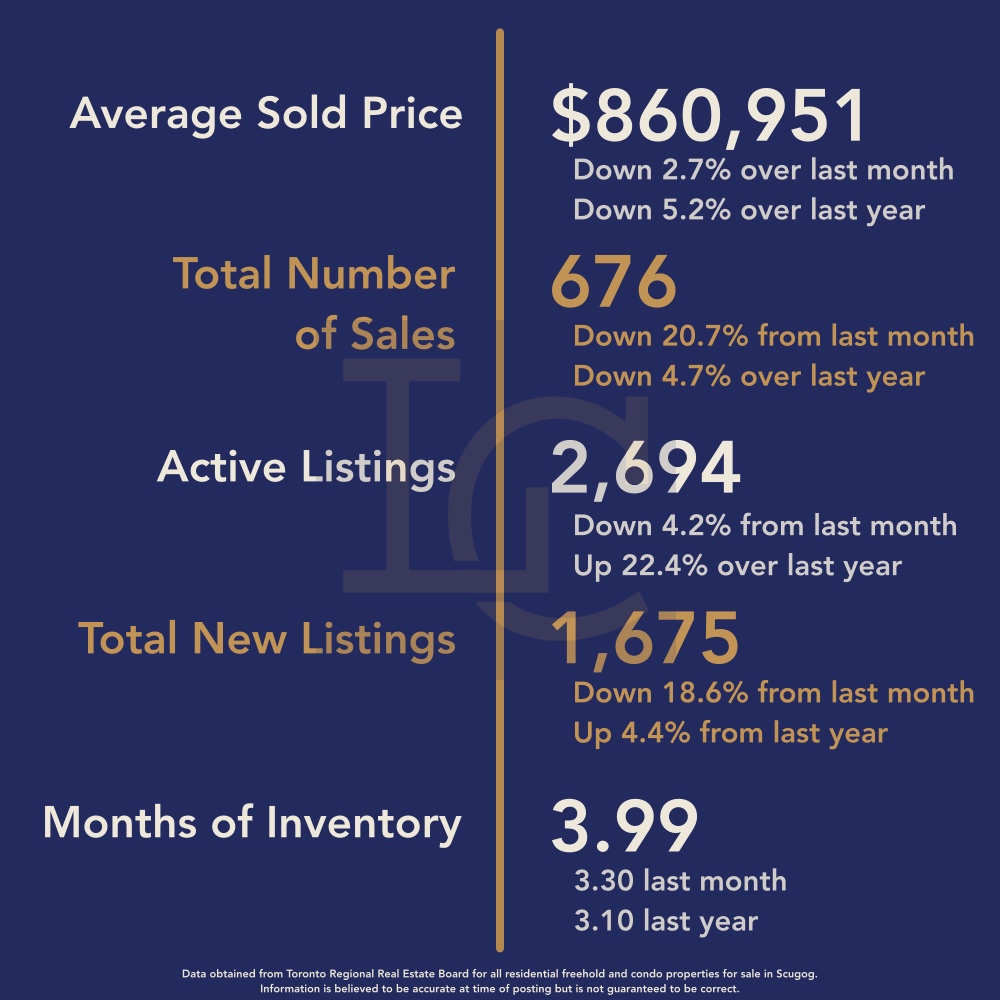
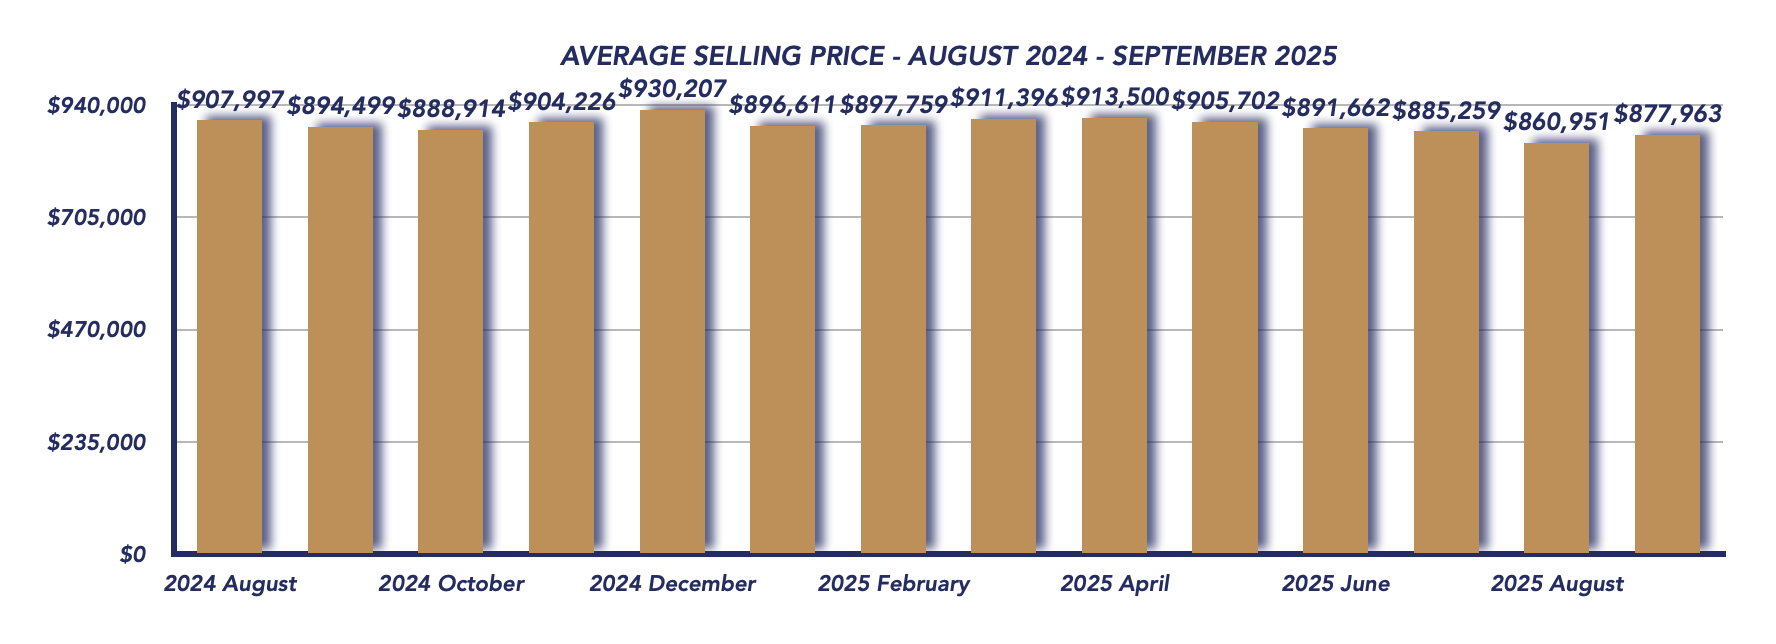
The average sale price rose to $877,963 in September, up 2.0% from August’s $860,951, though still 1.85% lower than September 2024’s $894,499. This is the first month-over-month price increase since the spring, indicating a modest rebound in buyer confidence as the market adjusts to new realities.
📊 Sales Activity Strengthens Year Over Year
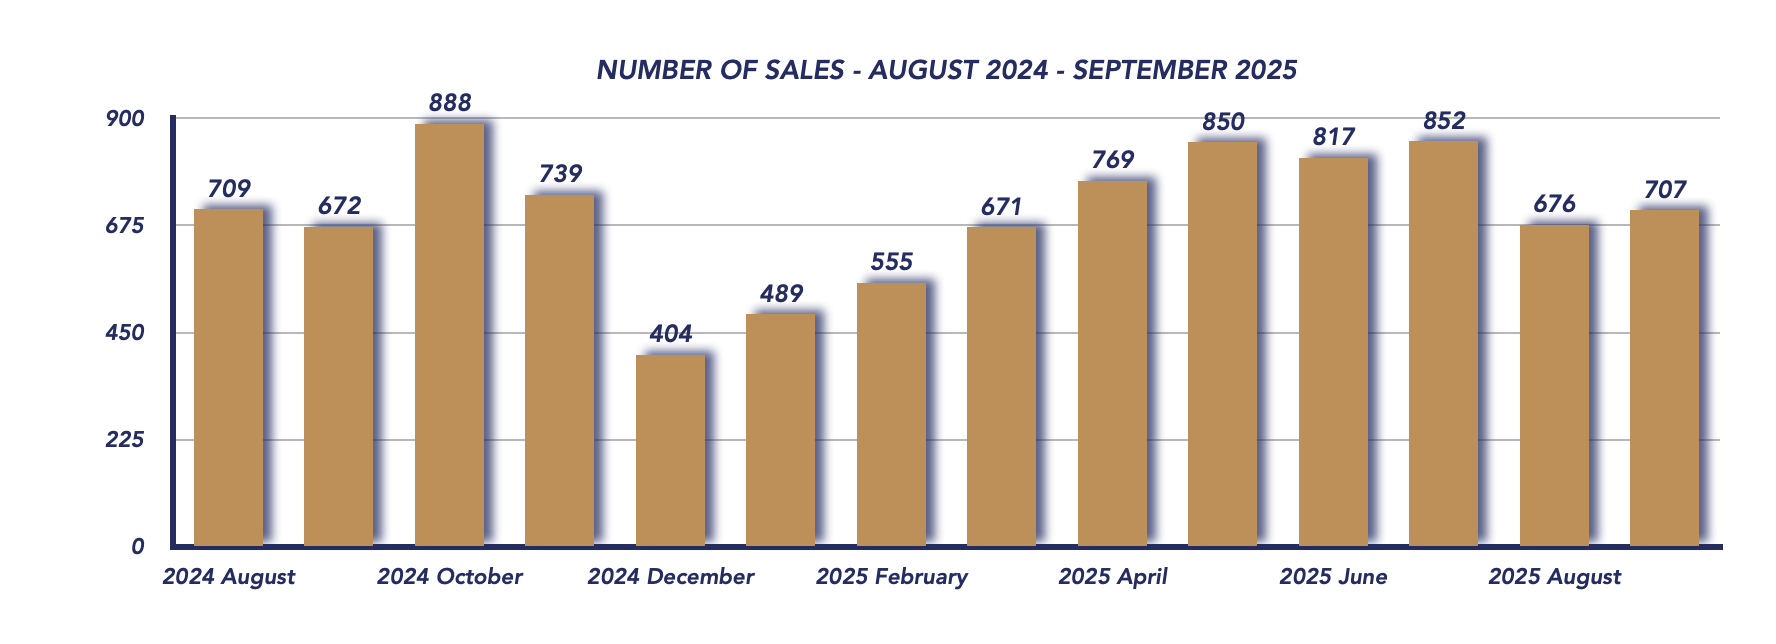
There were 707 home sales in September 2025, up from 676 in August and 672 in September 2024. This marks the second consecutive month of year-over-year sales growth, signaling that demand remains steady despite affordability challenges. Buyers appear to be re-engaging as prices soften and more options become available.
📉 Sale-to-List Price Ratio Holds Steady
The sale-to-list price ratio remained at 98%, unchanged from August but down from 100% last year. This consistency shows that sellers are pricing more realistically, while buyers continue to negotiate with confidence. Homes are still selling close to asking, but the era of frequent bidding wars has clearly passed.
📈 Listings Increase, Keeping the Market Balanced
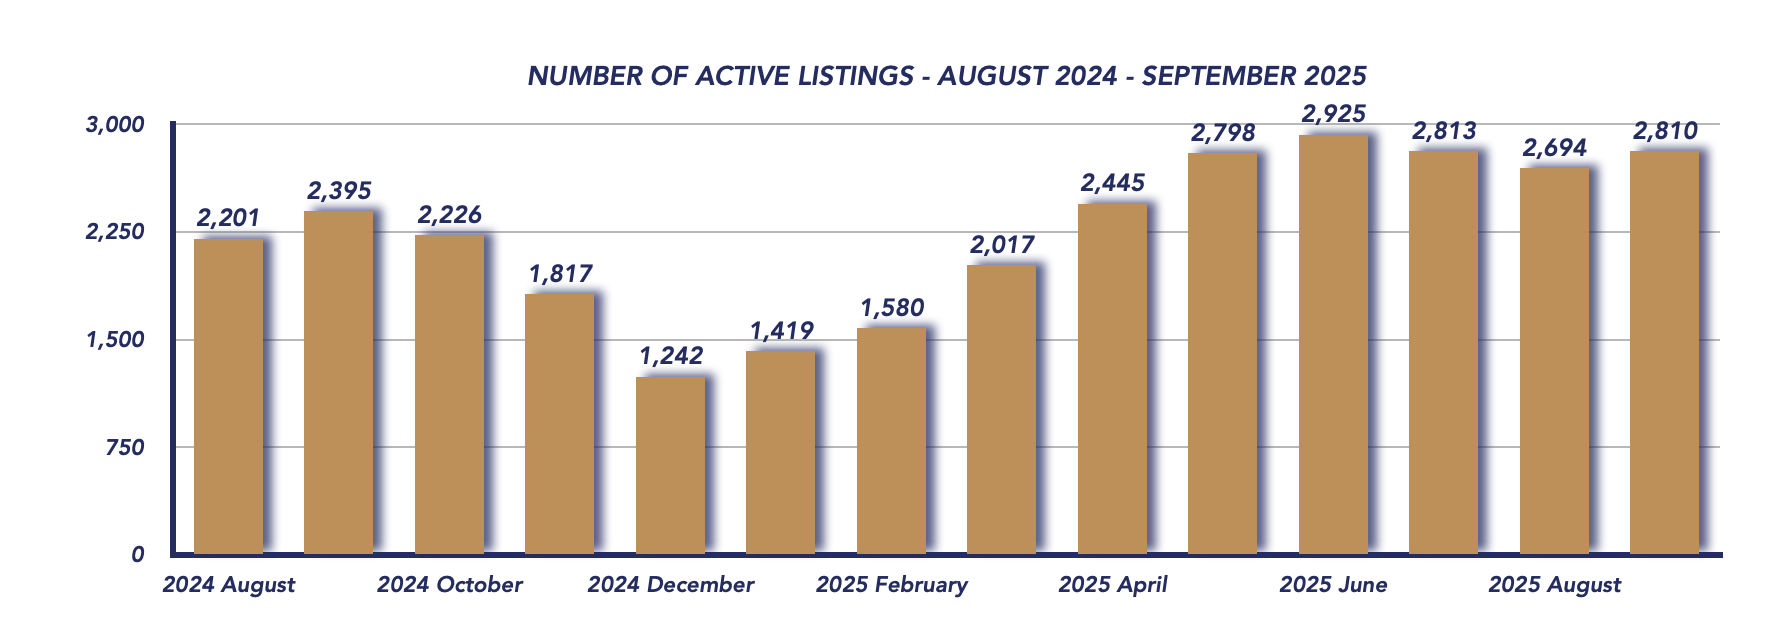
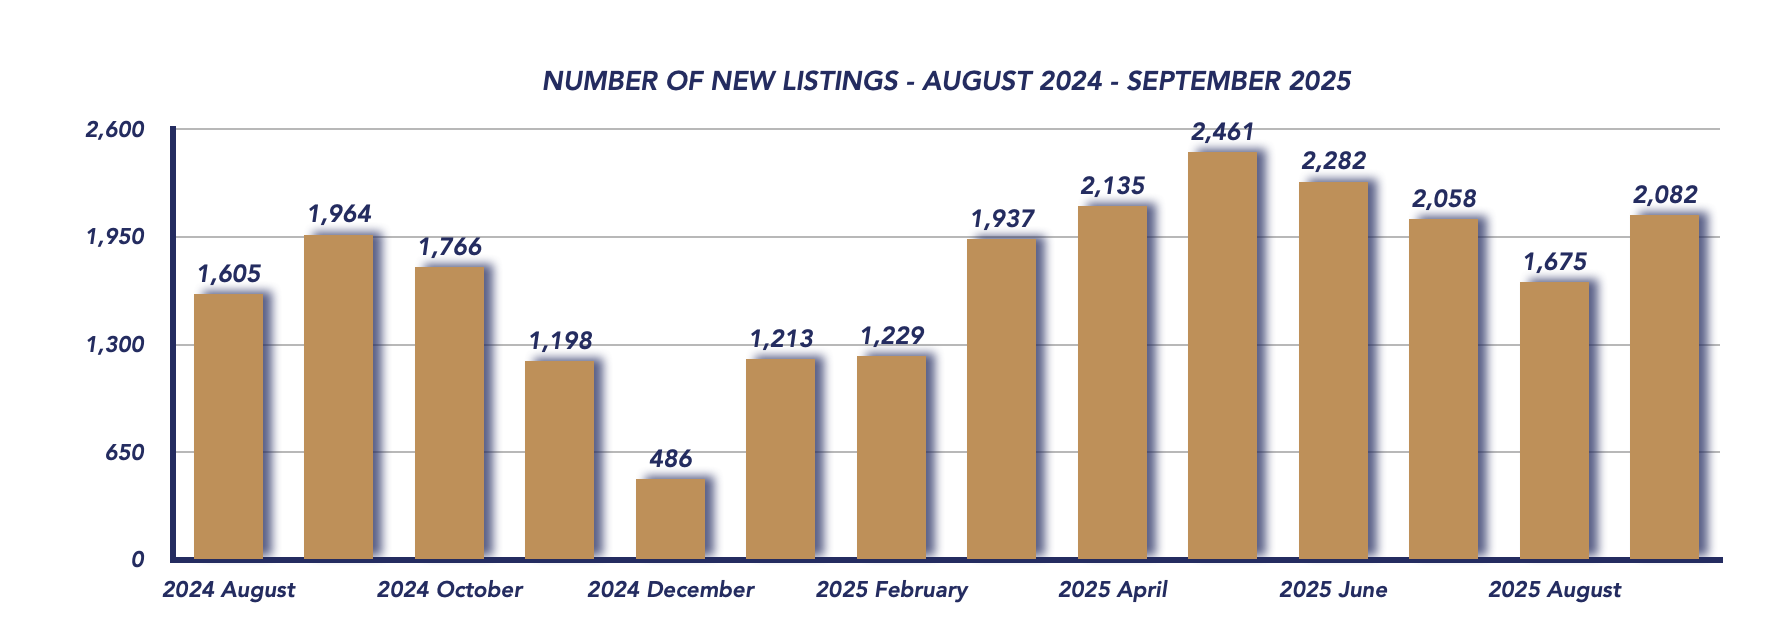
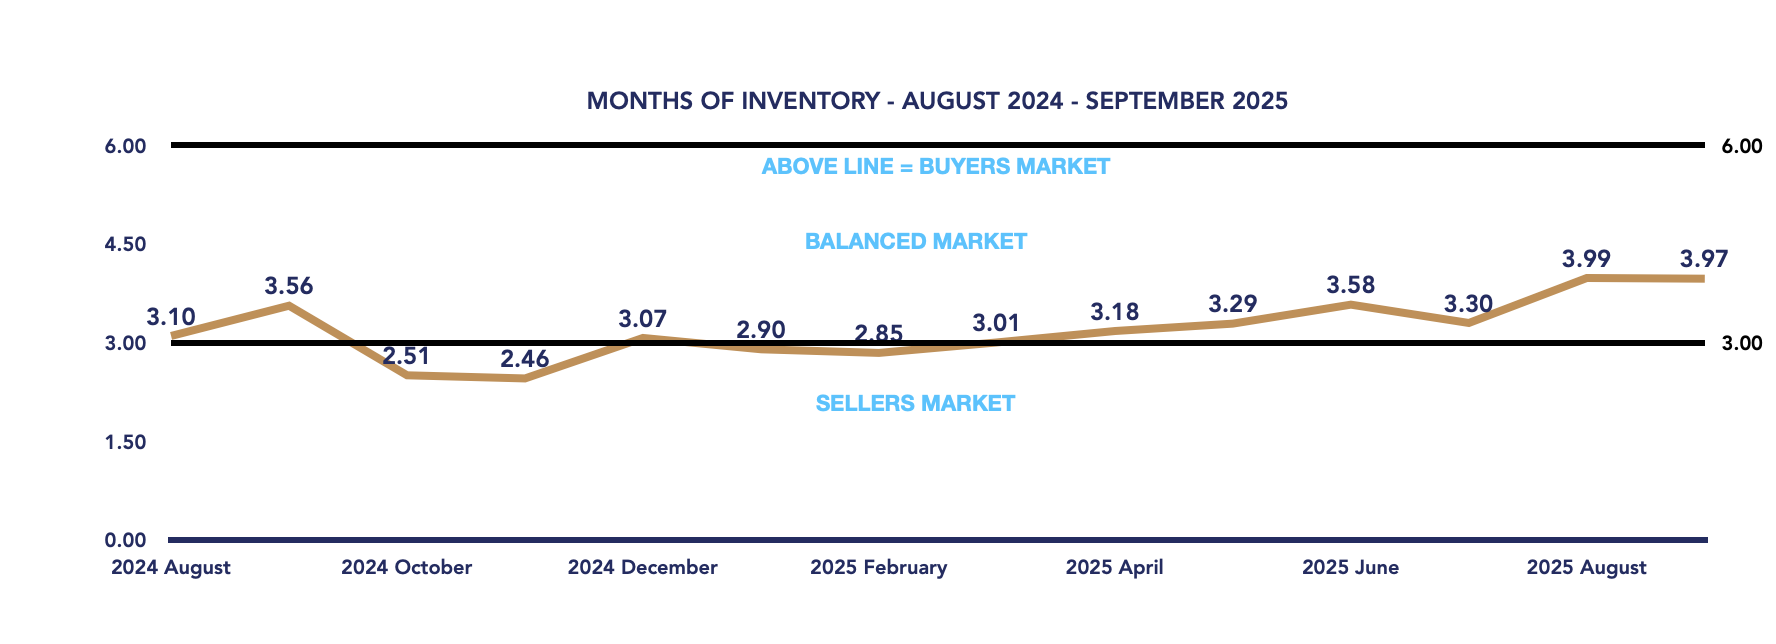
New listings climbed to 2,082, up from 1,675 in August and 1,964 in September 2024. Despite the increase in supply, the months of inventory held steady at 3.97, virtually unchanged from 3.99 the month before. This stability indicates that supply and demand are moving in tandem, maintaining a balanced market environment across the region.
⏳ Homes Taking Slightly Longer to Sell
The average property took 46 days to sell in September, up slightly from 43 days in August. This continues the trend of slower-moving sales seen throughout the summer, reflecting a market where buyers are deliberate, and homes require more time and marketing exposure before selling.
Conclusion
The Durham Region real estate market in September 2025 continued to show resilience and balance. Prices rose slightly for the first time in several months, sales improved both month-over-month and year-over-year, and inventory remained stable. While the market is clearly more measured than in past years, it’s also more sustainable—offering opportunities for both buyers and sellers.
With the GTA market showing renewed energy, time will tell if that momentum trickles eastward into Durham or if local conditions continue to chart their own steady course. For now, Durham remains a balanced and competitive market—defined by realistic pricing, steady demand, and a gradual return to normalcy after several dynamic years.
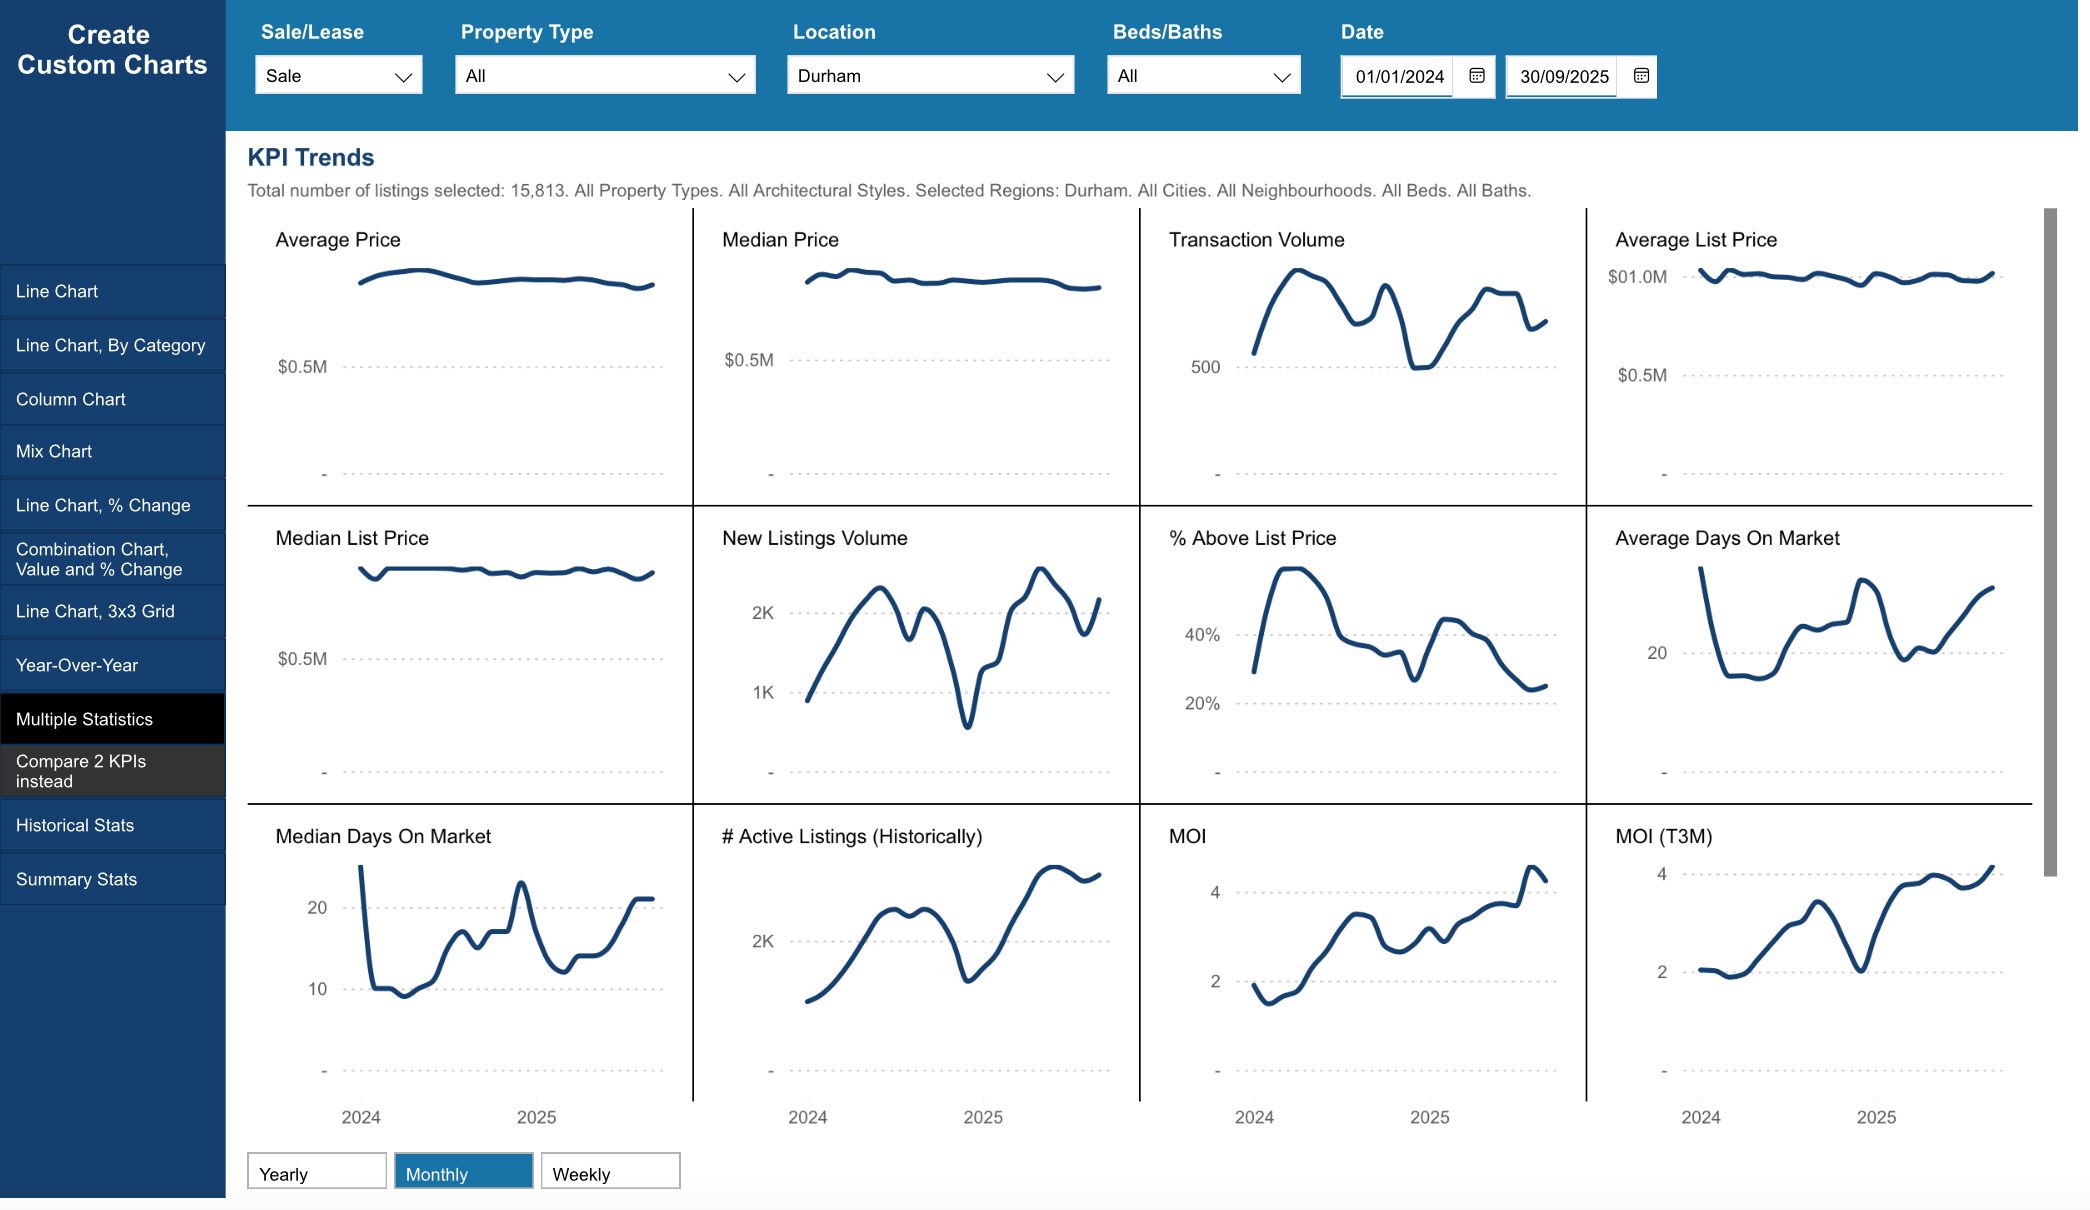
Key Performance Indicators (KPIs) from January 2024 through September 2025 provide a clear snapshot of how the Durham Region real estate market has evolved across all property types, architectural styles, and home configurations
*Information is believed to be accurate at time of posting but is not guaranteed to be correct. Some values may vary slightly based on the exact date and time the reports were generated. Market stats are provided by TRREB (Toronto Regional Real Estate Board) and are based on sales for the month of Attached/Row/Townhouses, Condo Apartments, Condo Townhouses, Detached, Detached with Common Elements, Link Homes and Semi-detached. *Some values may vary slightly based on the exact date and time the reports were generated.
Not intended as a solicitation if your property is already listed by another broker. Affiliated real estate agents are independent contractor sales associates, not employees. ©2021 Coldwell Banker. All Rights Reserved. Coldwell Banker and the Coldwell Banker logos are trademarks of Coldwell Banker Real Estate LLC. The Coldwell Banker® System is comprised of company owned offices which are owned by a subsidiary of Realogy Brokerage Group LLC and franchised offices which are independently owned and operated. The Coldwell Banker System fully supports the principles of the Fair Housing Act and the Equal Opportunity Act.
Click below for more reports
Check out our Uxbridge and Scugog Events Pages to keep up to date on whats going on around town. Click the links or scan the Code with your phone to take you directly there.
UXBRIDGE EVENTS
SCUGOG EVENTS


