
 Facebook
 X
X
 Pinterest
 Copy Link
Uxbridge Housing April 2026

Uxbridge Housing April 2026

Each office is independently owned and operated
![]()
![]()
Housing Market Report for April 2026
Here is the Township of Uxbridge Housing April 2026 report (all housing types), with reports from the Canadian Real Estate Association, and Toronto Regional Real Estate Board included.
This housing report for Durham Region includes the number of new listings, average list price, number of properties sold, average selling price, average days on market and average asking price to selling price ratio for all property types within the Region of Durham.
Scroll to the bottom for links to take you to the housing market reports for Durham Region, Scugog and Brock.
![]()
![]()
From Toronto Regional Real Estate Board
Please note: The PropTx MLS® System, of which TRREB is a part, has added a number of new client boards over the last year. Many of these boards’ Members trade within the Greater Toronto Area and broader Greater Golden Horseshoe regions. As a result, historic data have been updated to reflect the addition of these boards’ listings and transactions. This means historic data have changed relative to previously published static reports. To view updated historic data, click here.
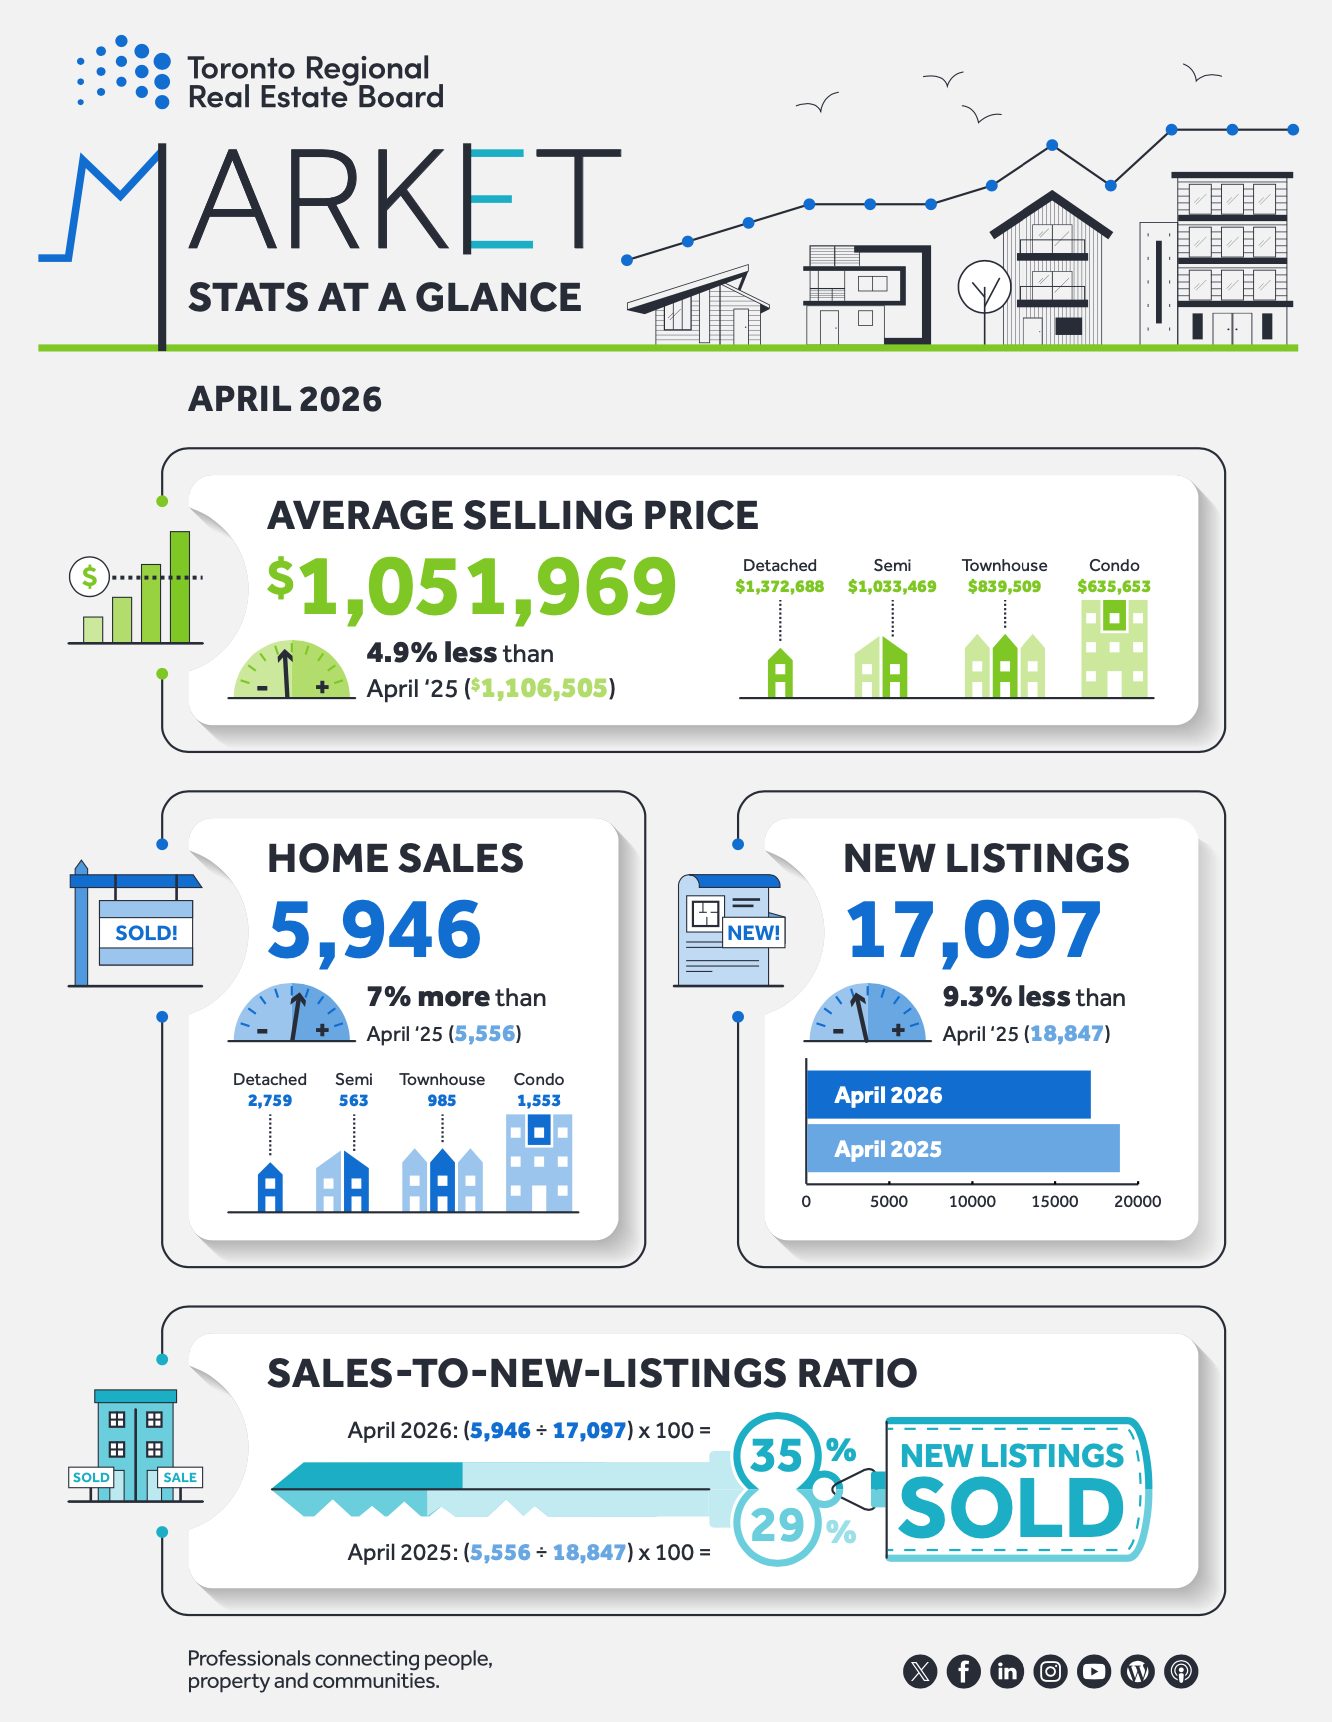
Toronto Regional Real Estate Board – Market Stats At A Glance – April 2026
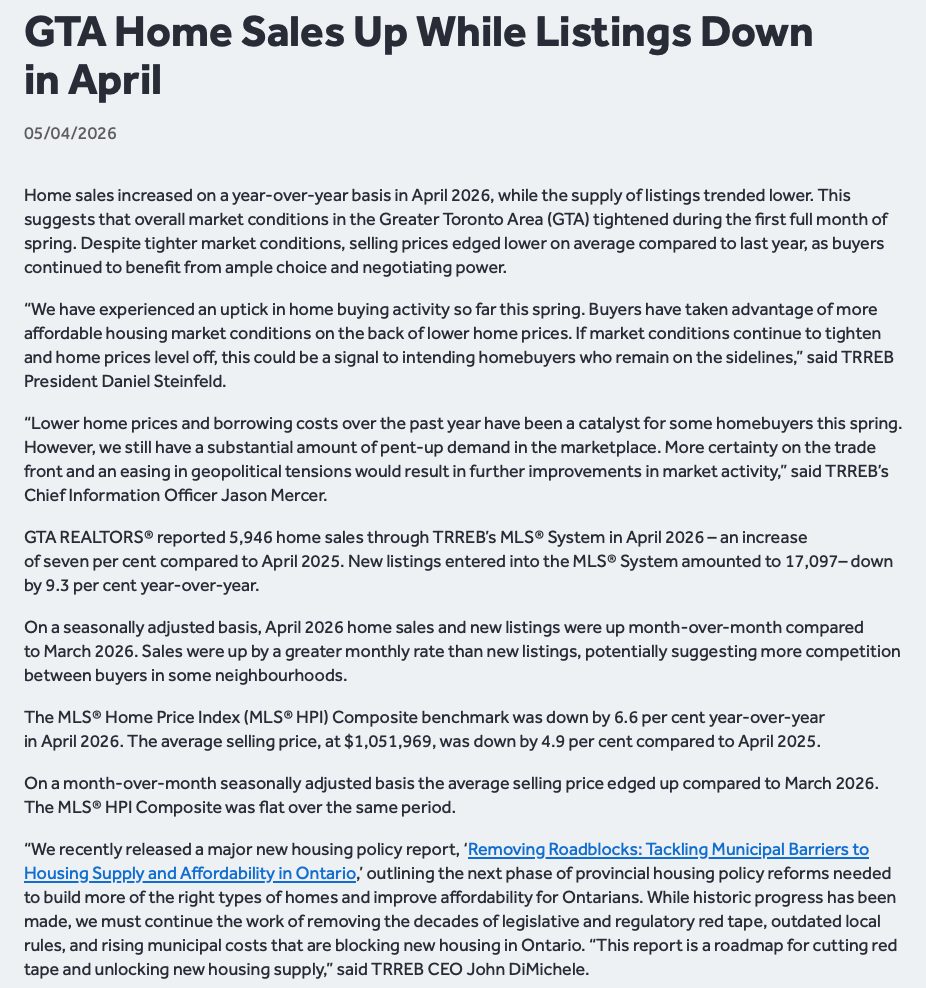
Read the Toronto Regional Real Estate Board Market Watch Report
![]()
Uxbridge Township Real Estate Market Analysis – April 2026
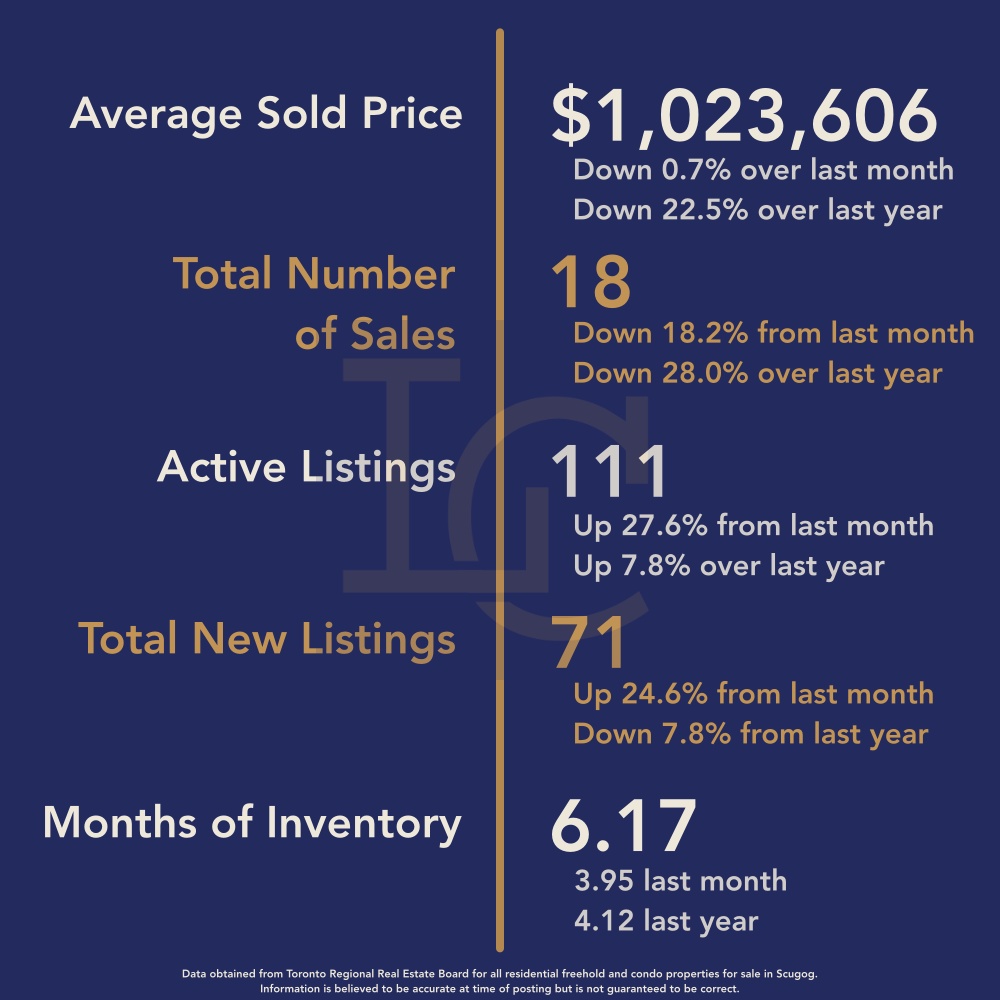
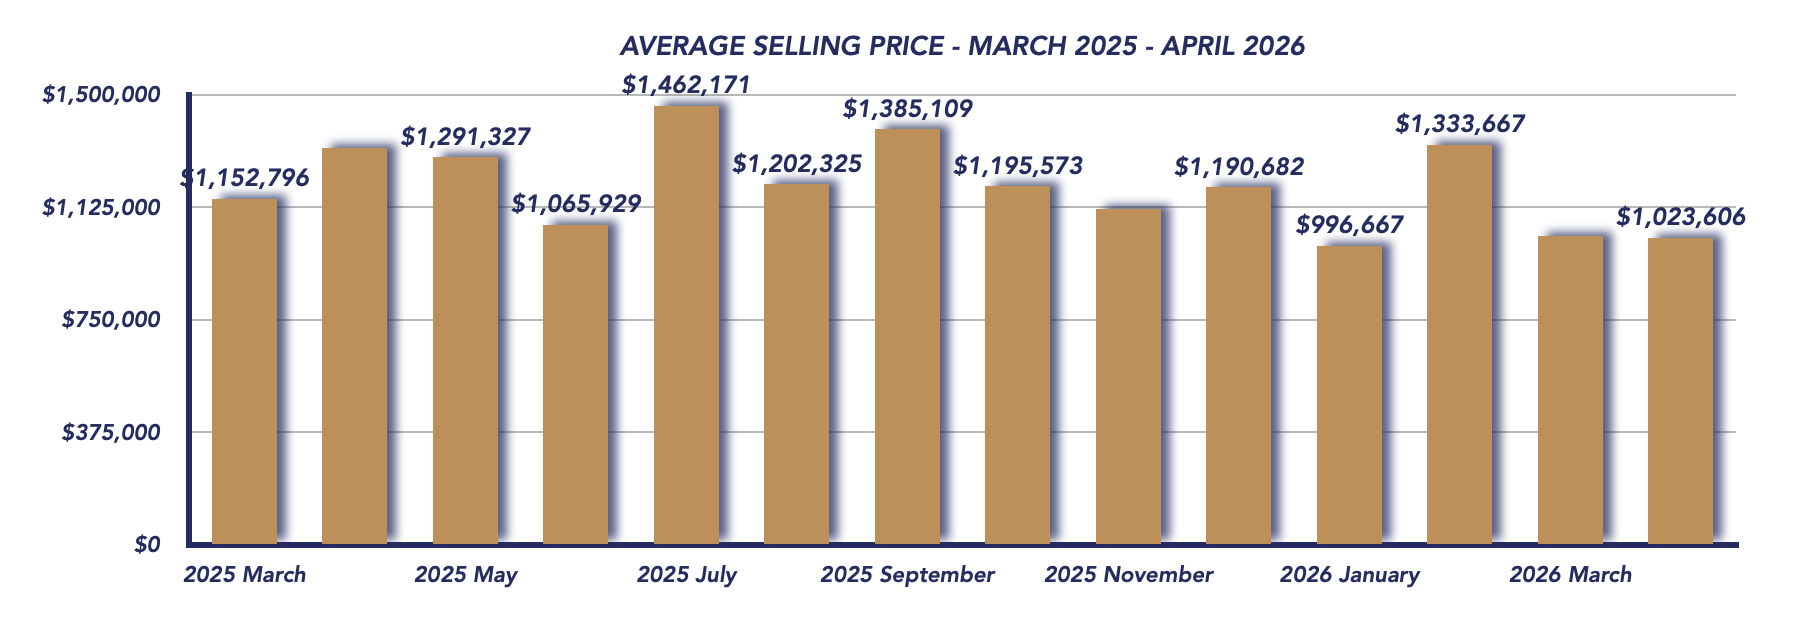
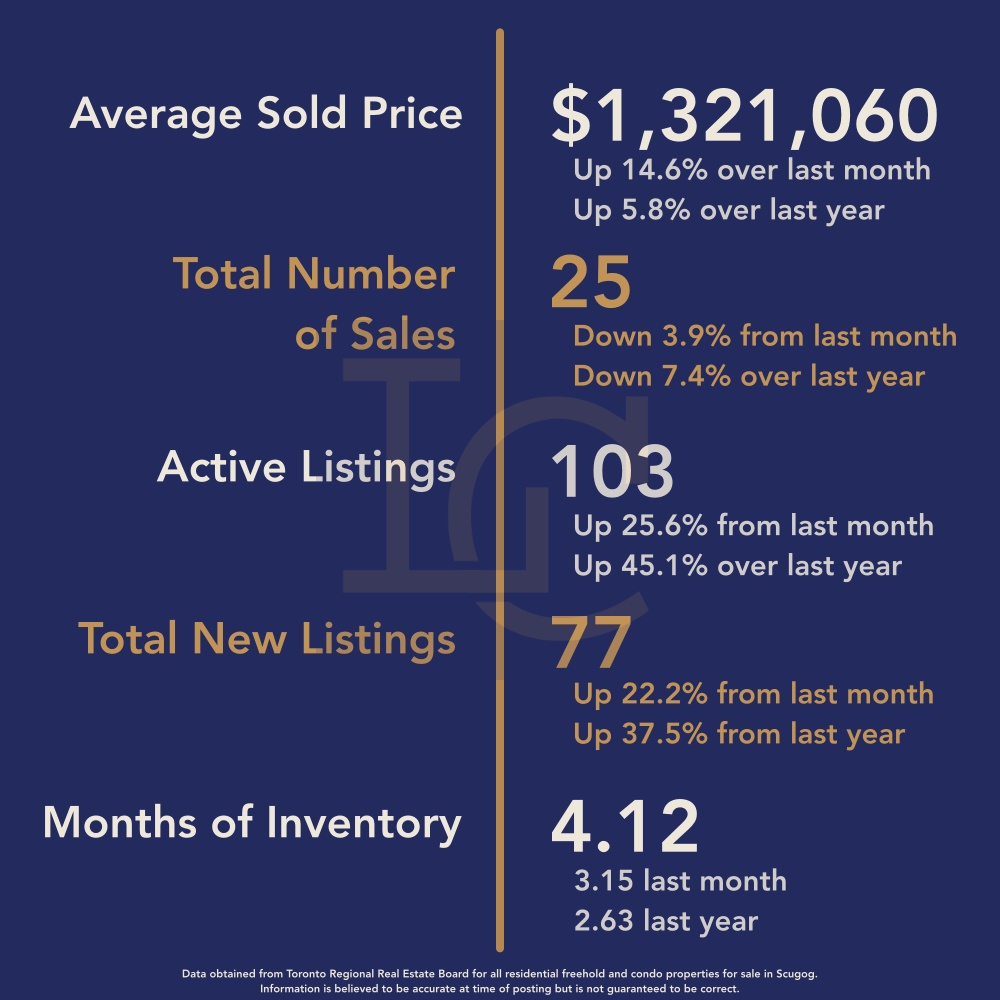
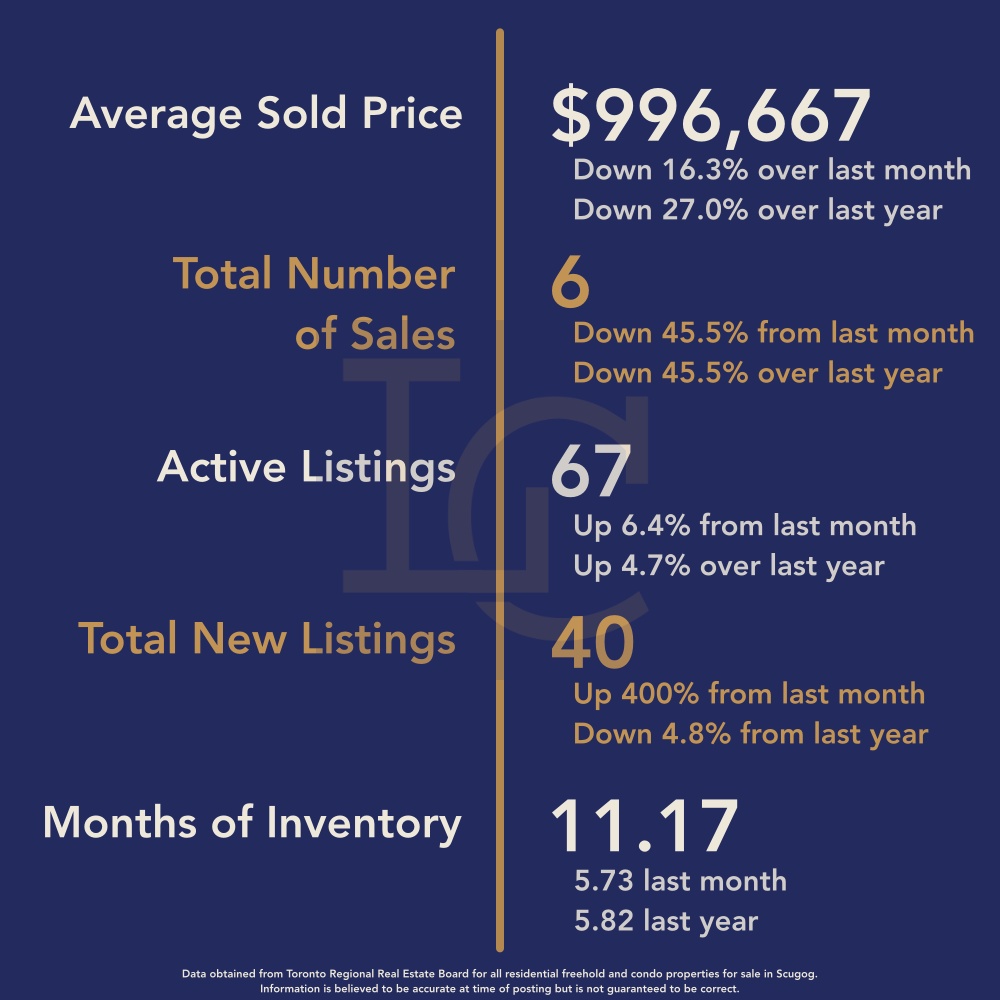
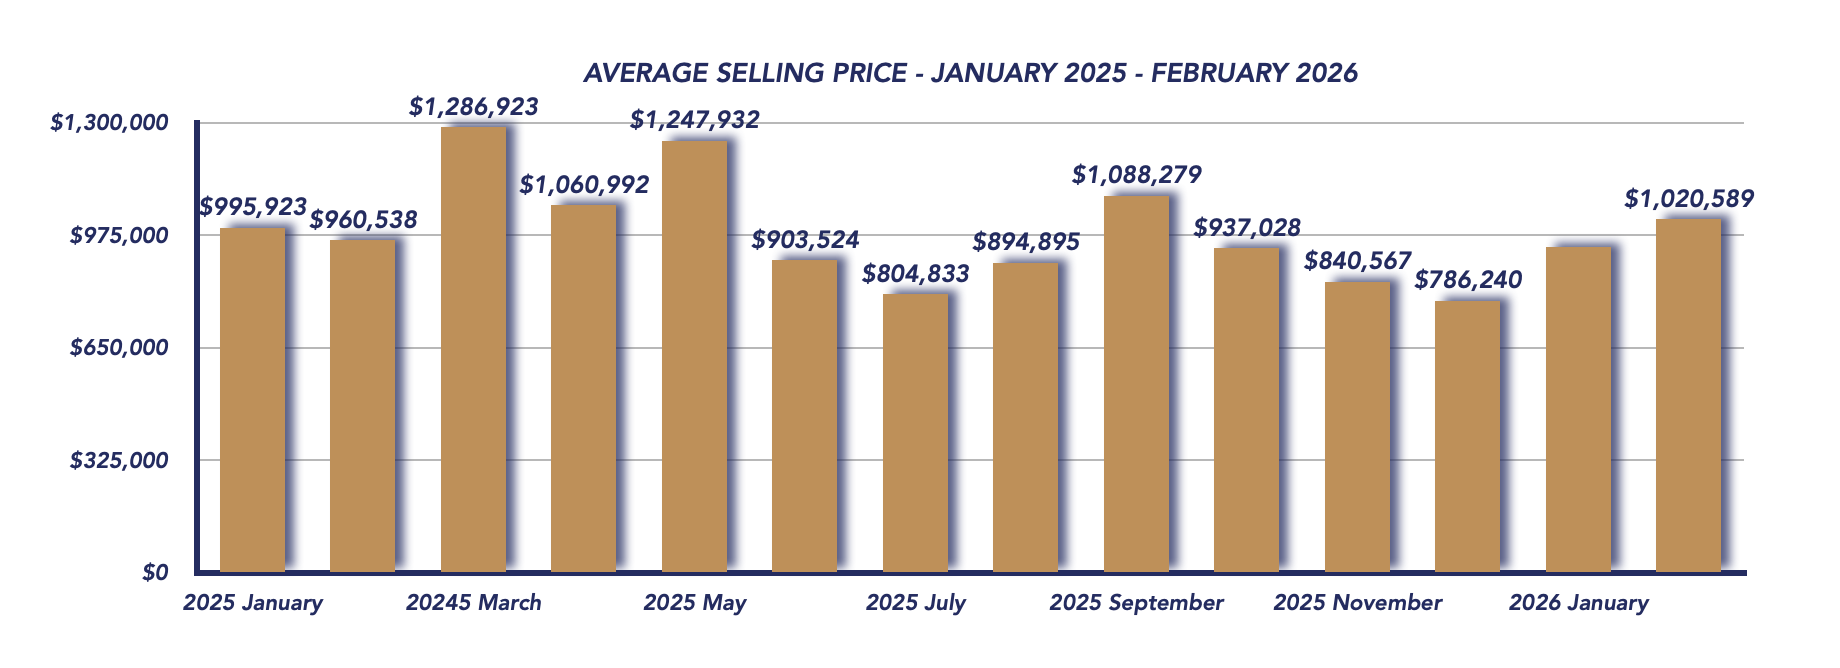
The Uxbridge real estate market softened in April 2026, with prices holding relatively steady month-over-month but showing a notable decline compared to last year. The average sale price came in at $1,023,606, down just 0.7% from March’s $1,030,470, but significantly lower by 22.5% compared to April 2025’s $1,321,060.
April 2026
March 2026
This year-over-year drop is largely explained by the difference in sales composition. In April 2025, the market saw two luxury sales at $2,585,000 and $3,050,000, along with a strong number of homes in the $1.5M–$2M range, which elevated the average price. In contrast, April 2026 had no ultra-luxury sales, with the highest sale reaching $1,850,000. The bulk of activity shifted toward more moderate price points, with nine homes selling between $1 million and $1.5 million and twelve properties selling under $1 million, pulling the overall average down.
Sales Activity
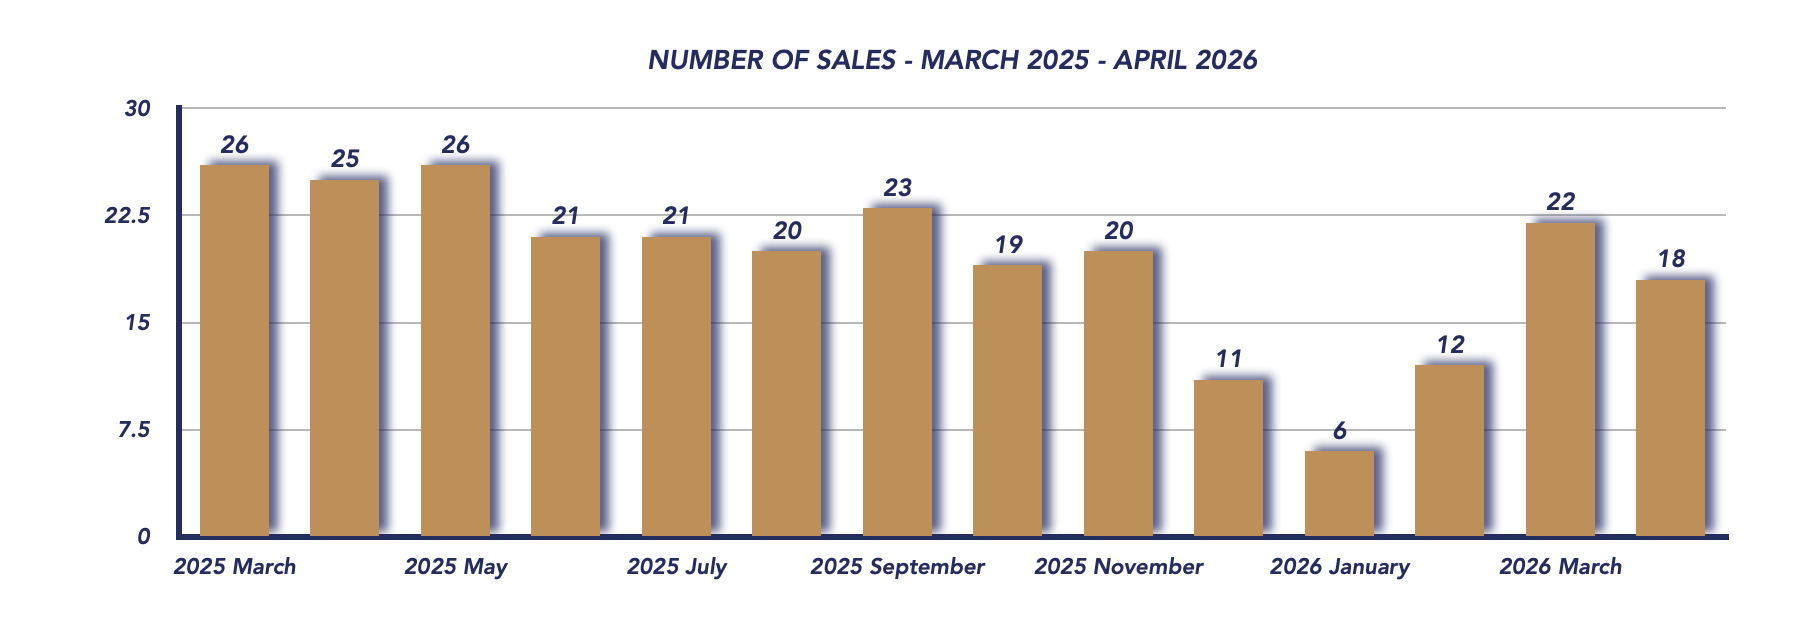
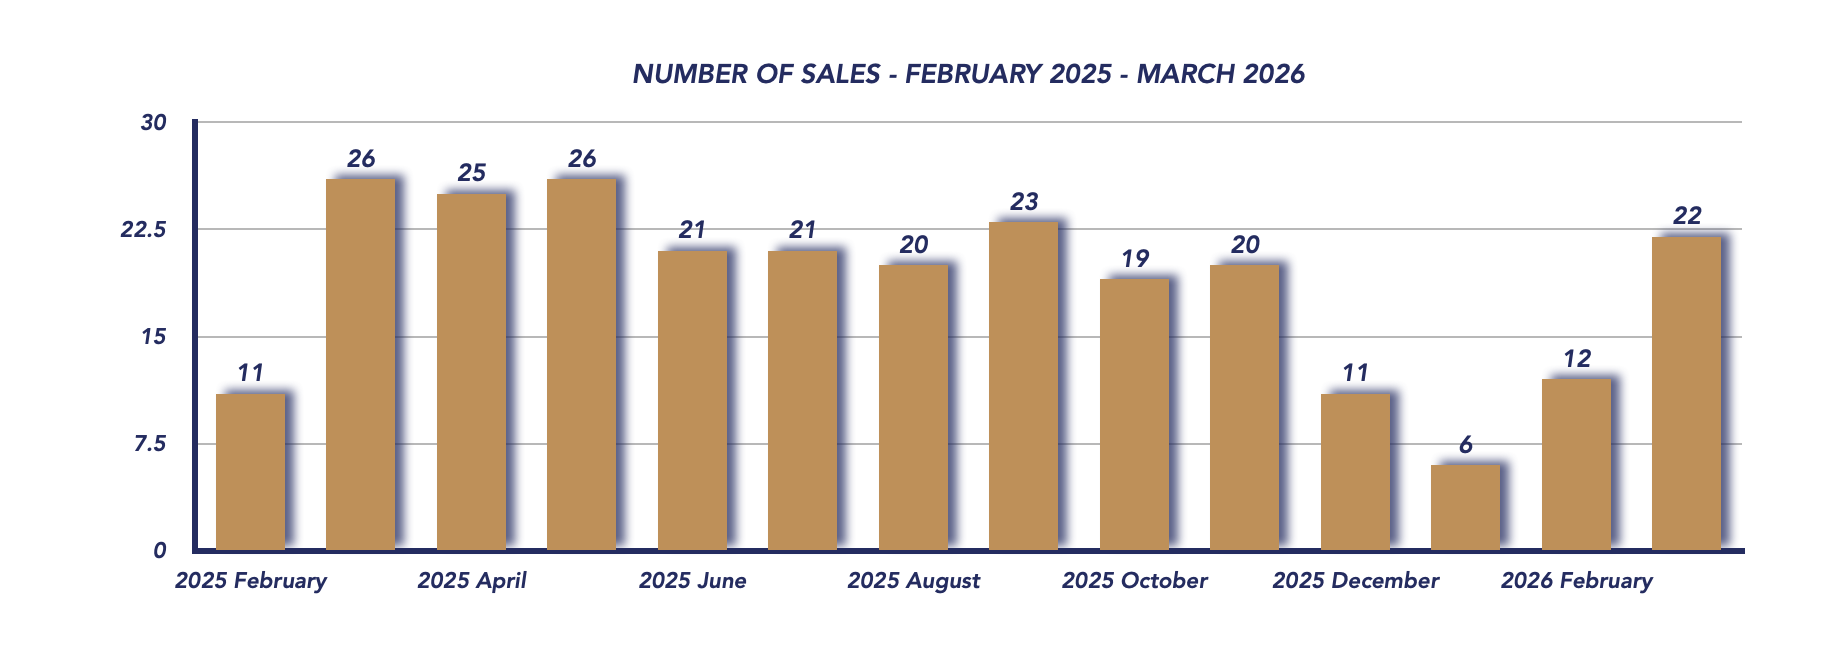
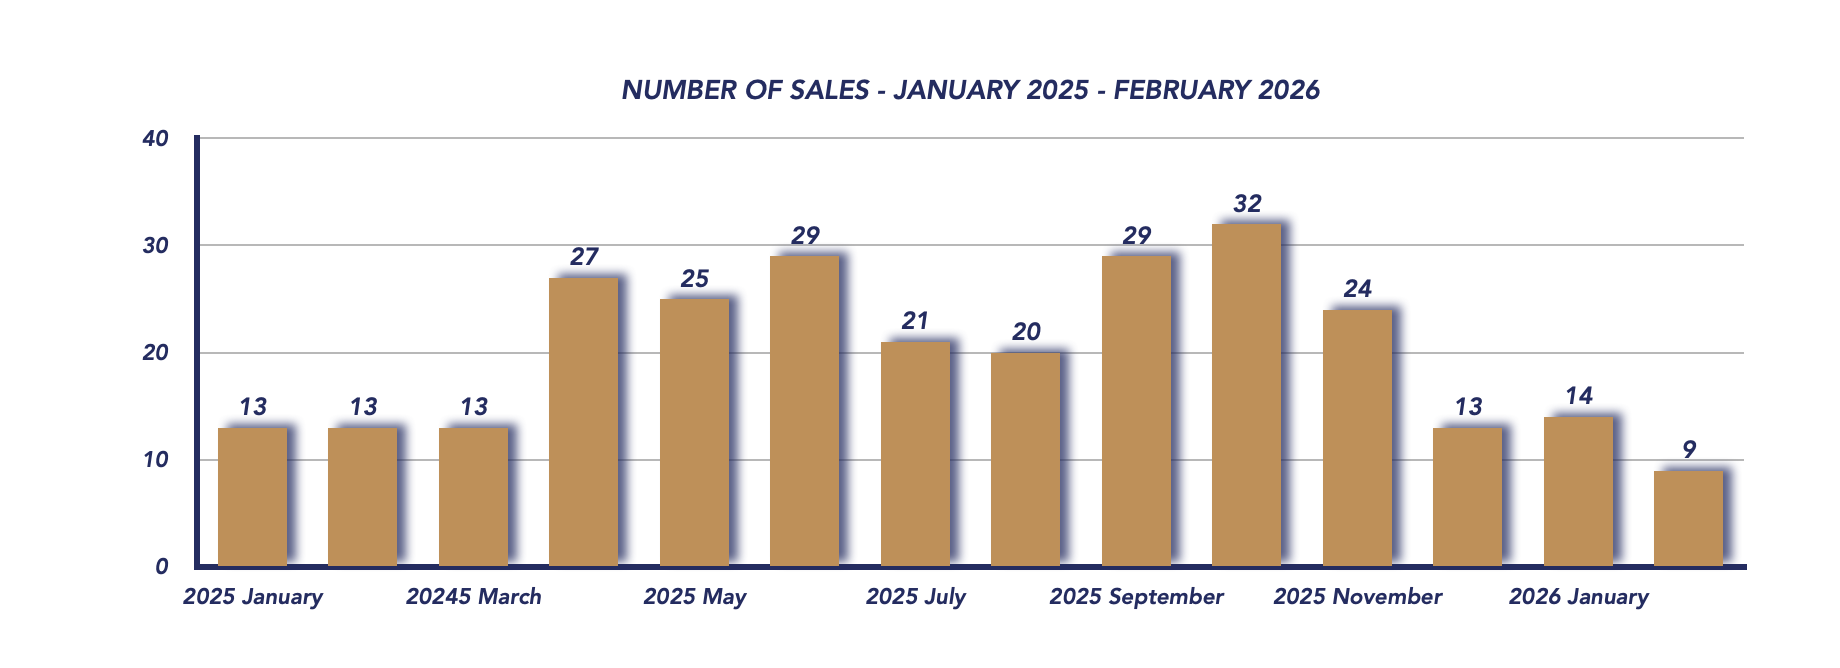
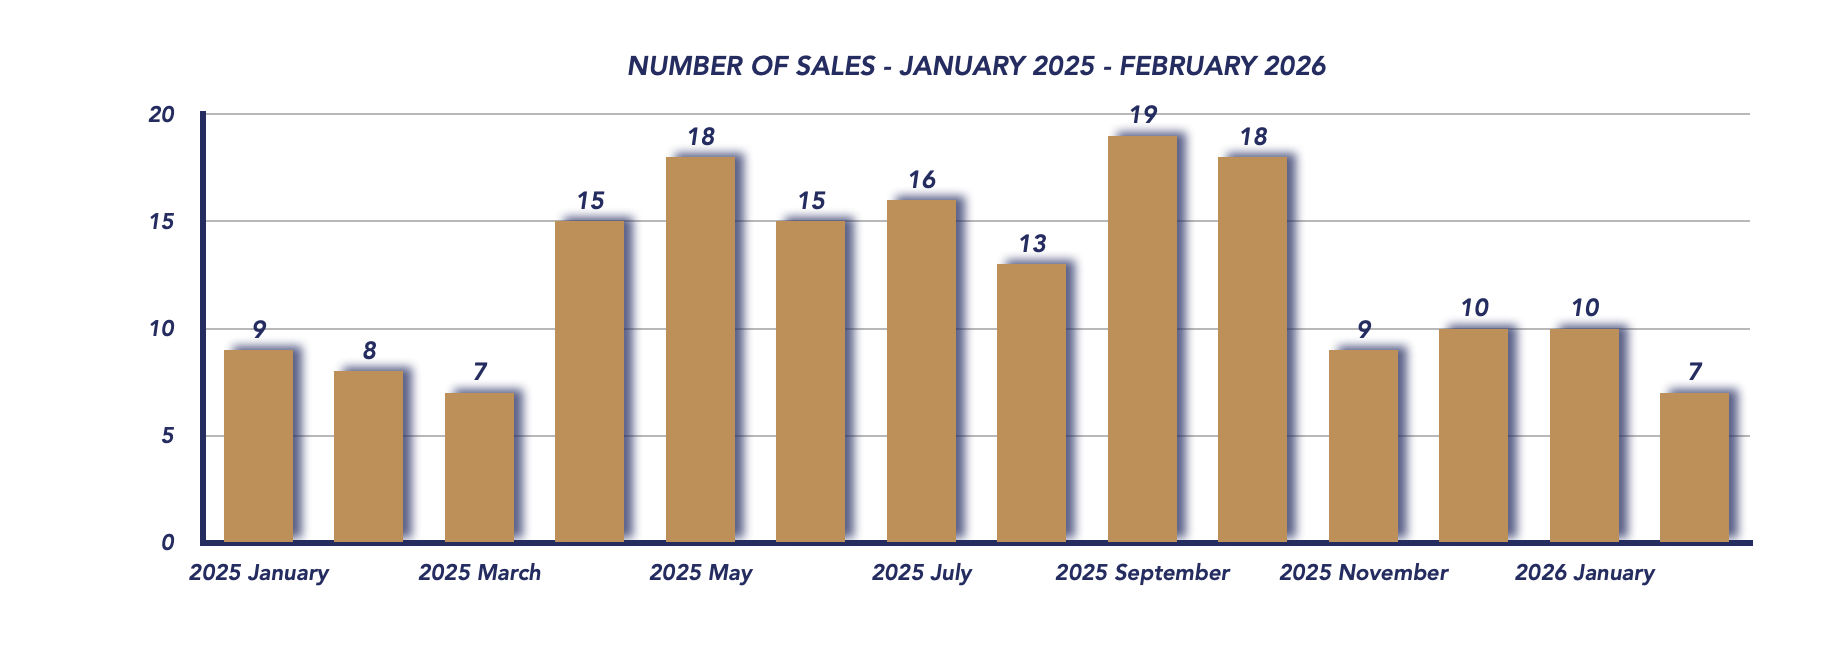
Total sales declined to 18 transactions, down from 22 in March and 25 in April 2025. This drop suggests a slight cooling in buyer activity, even as we move through what is typically a busy spring season.
Sale-to-List Price Ratio
The sale-to-list price ratio remained steady at 96%, unchanged from March. This consistency indicates that well-priced homes continue to sell close to asking, even in a market that is becoming more competitive for sellers.
Active Listings
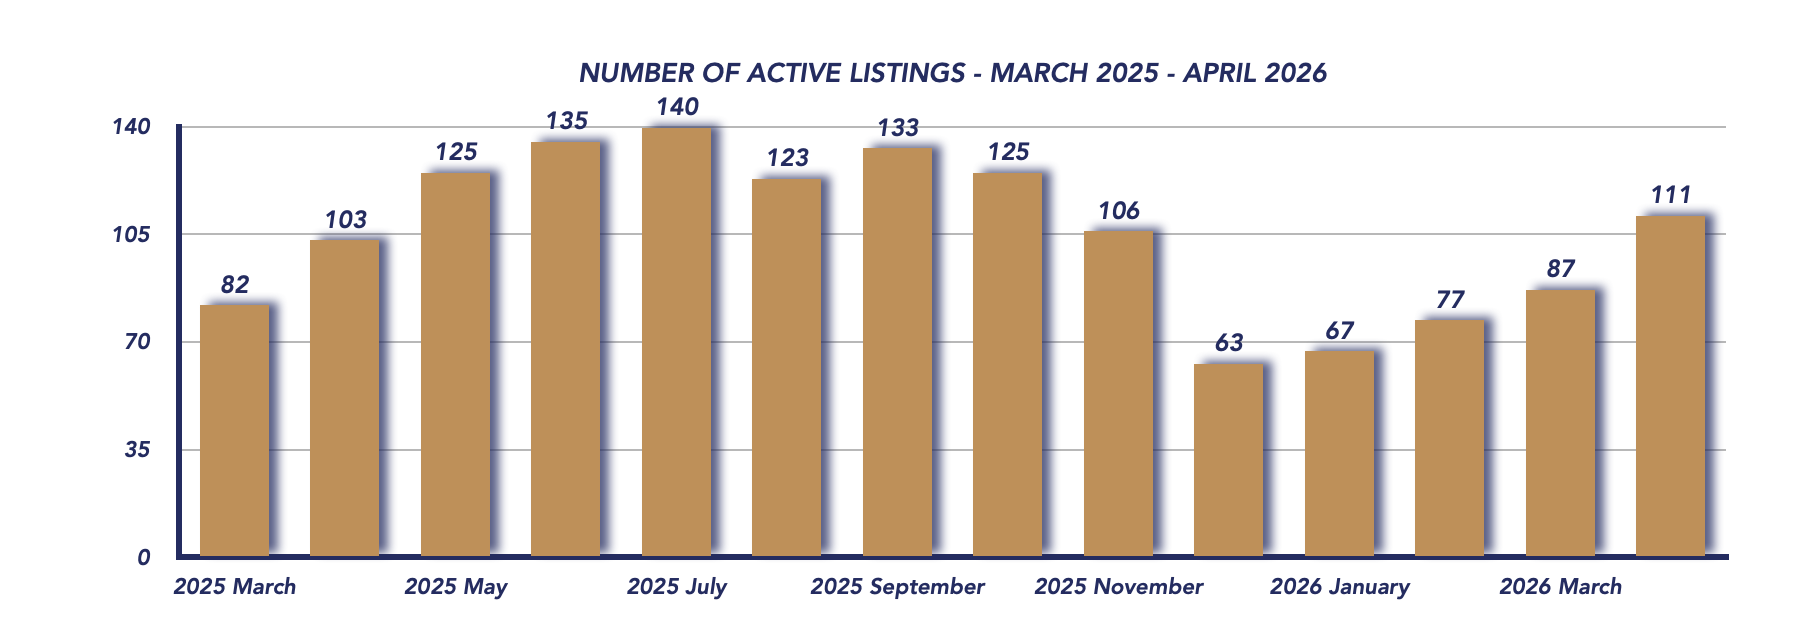
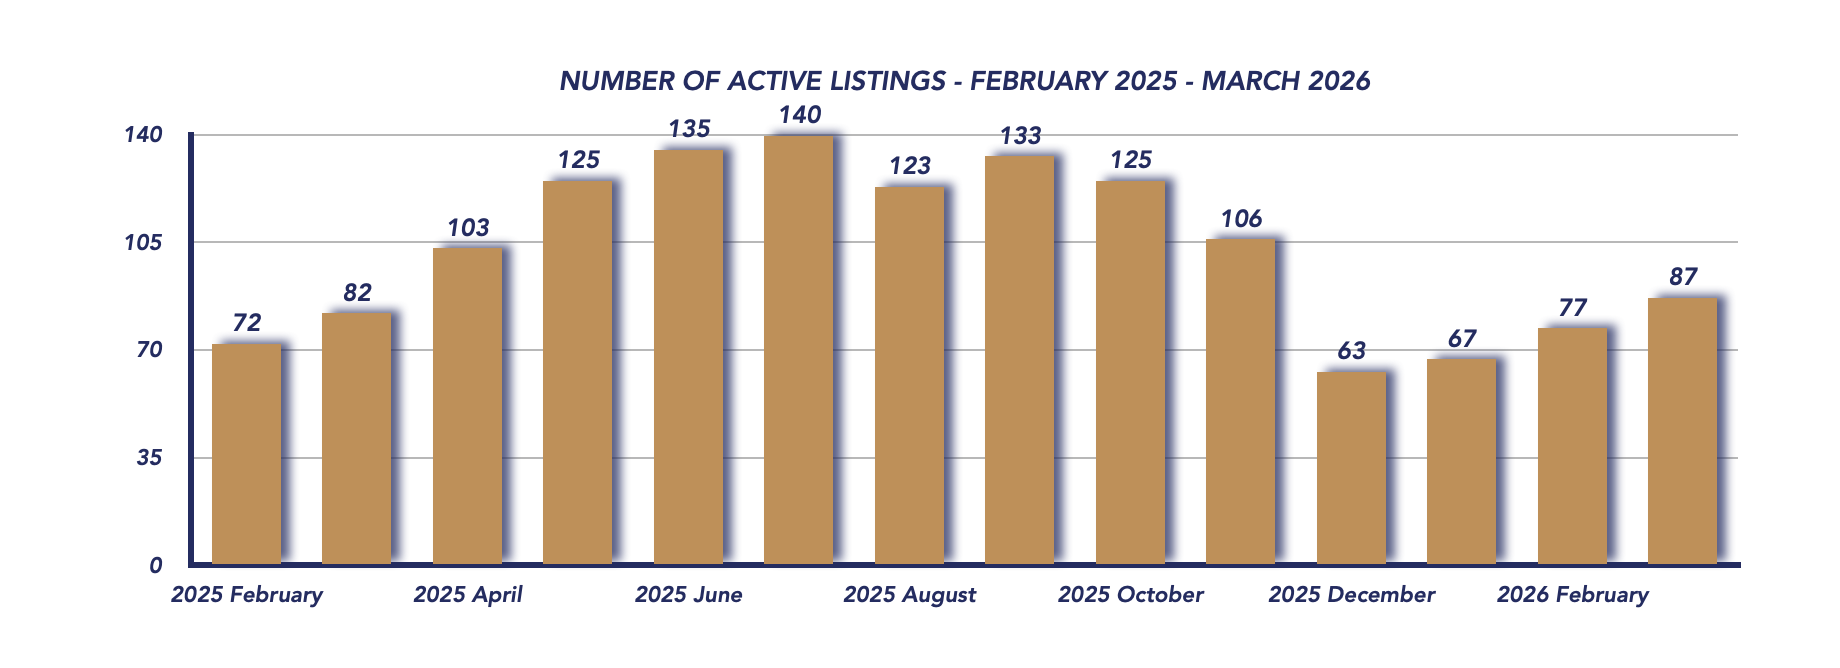
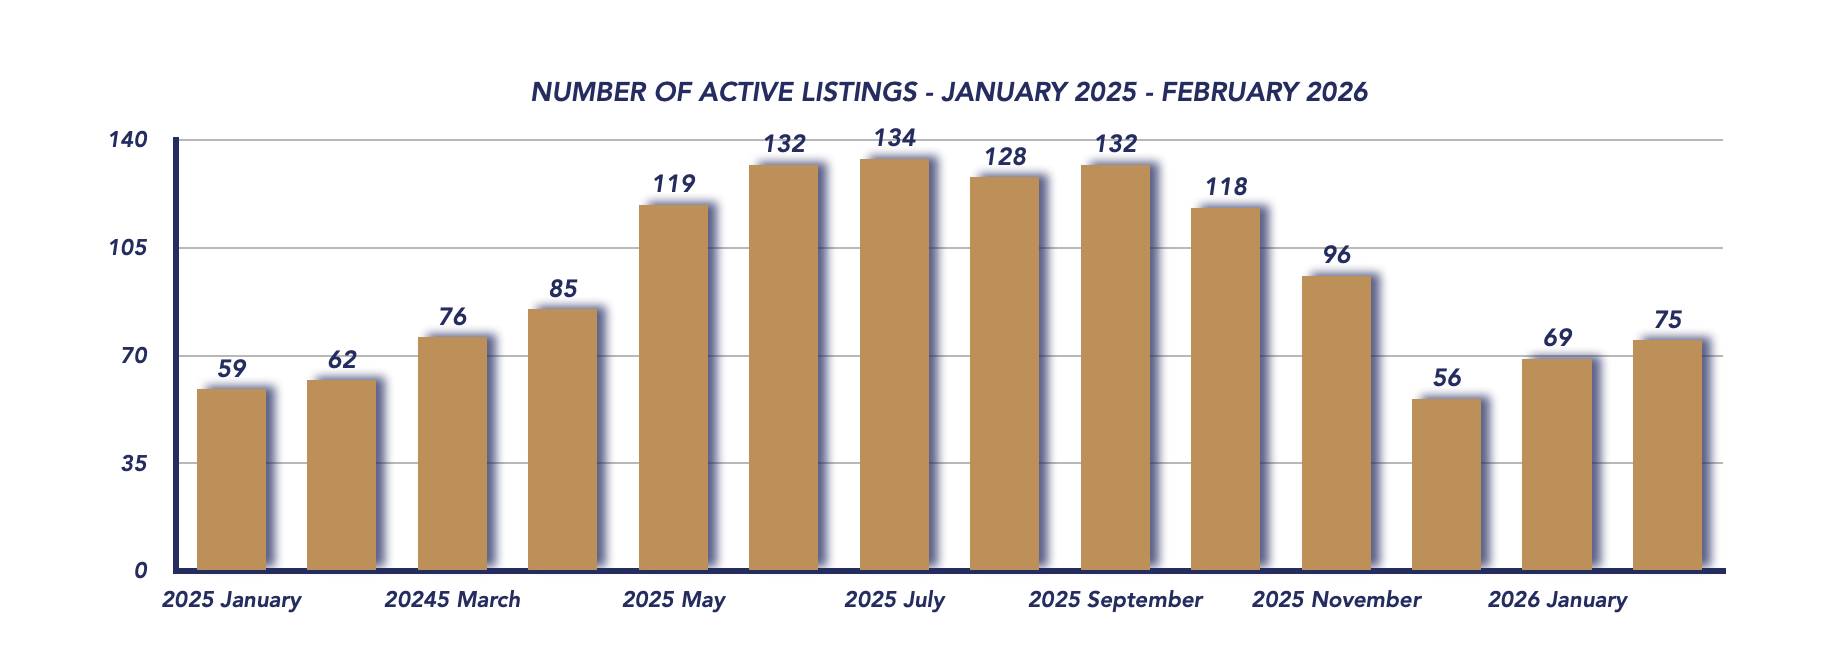
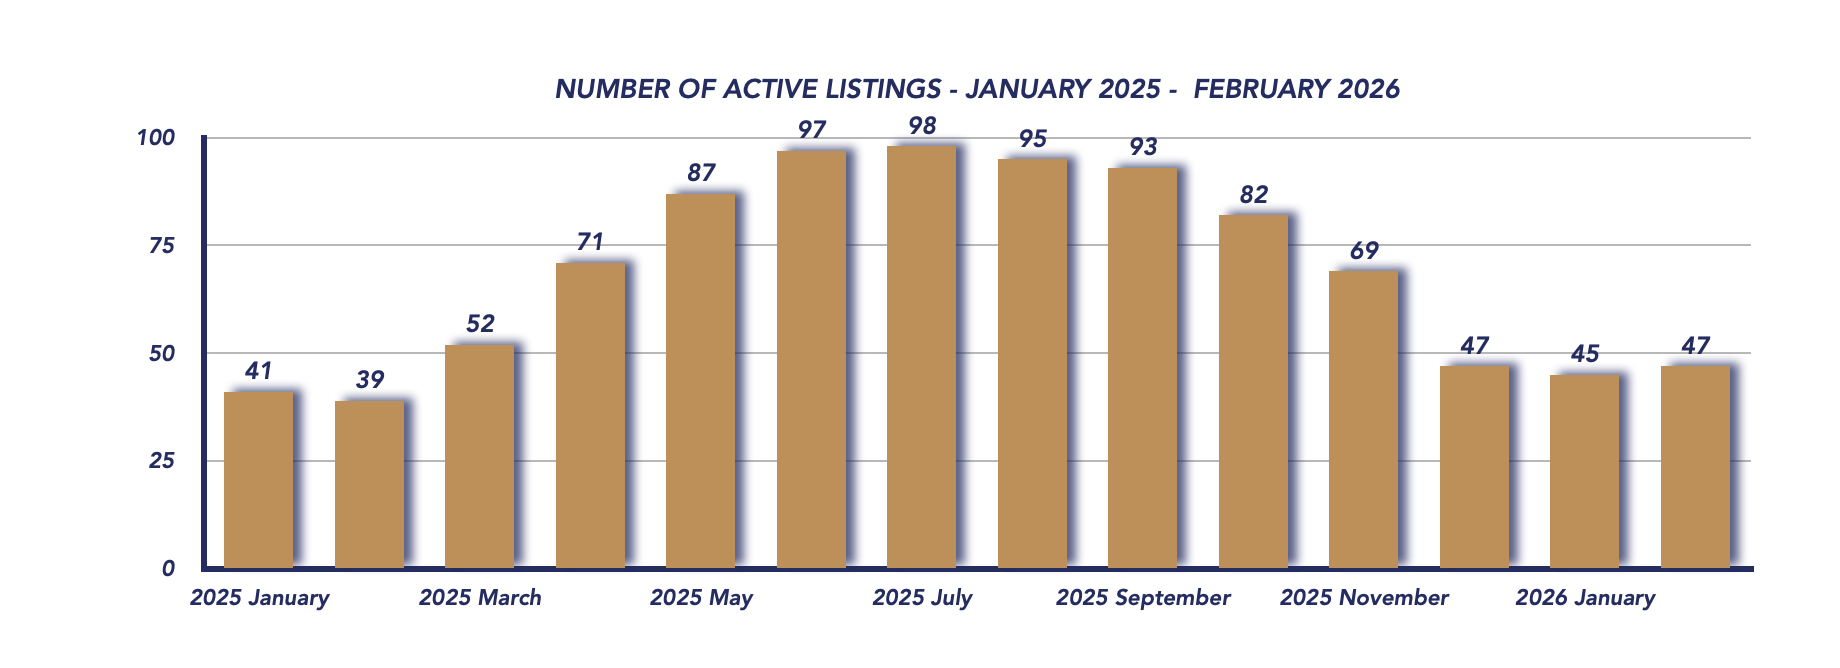
Inventory saw a noticeable increase, with 111 active listings, up from 87 in March and slightly above the 103 listings recorded in April 2025. This rise reflects a growing number of available properties and contributes to a shift in market dynamics.
New Listings
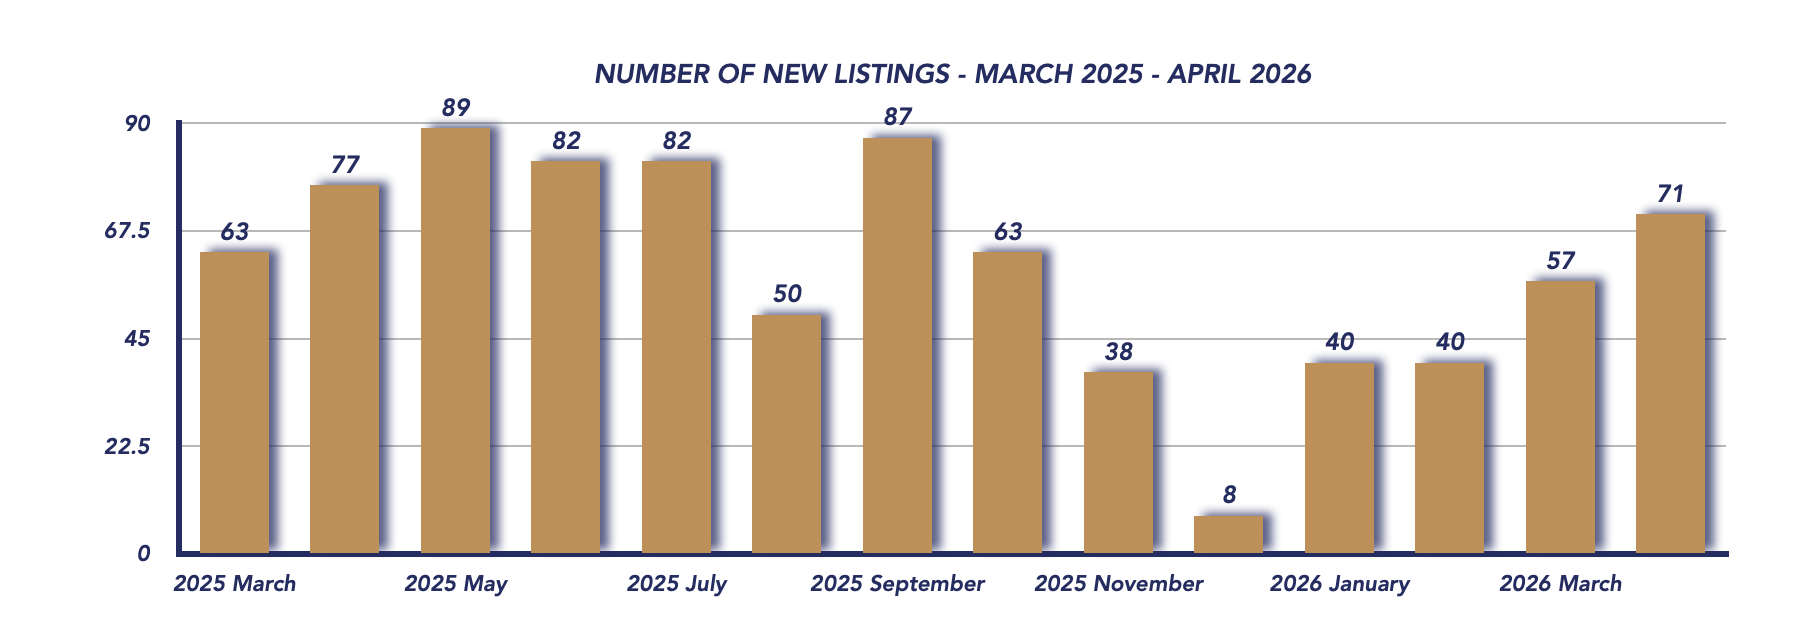
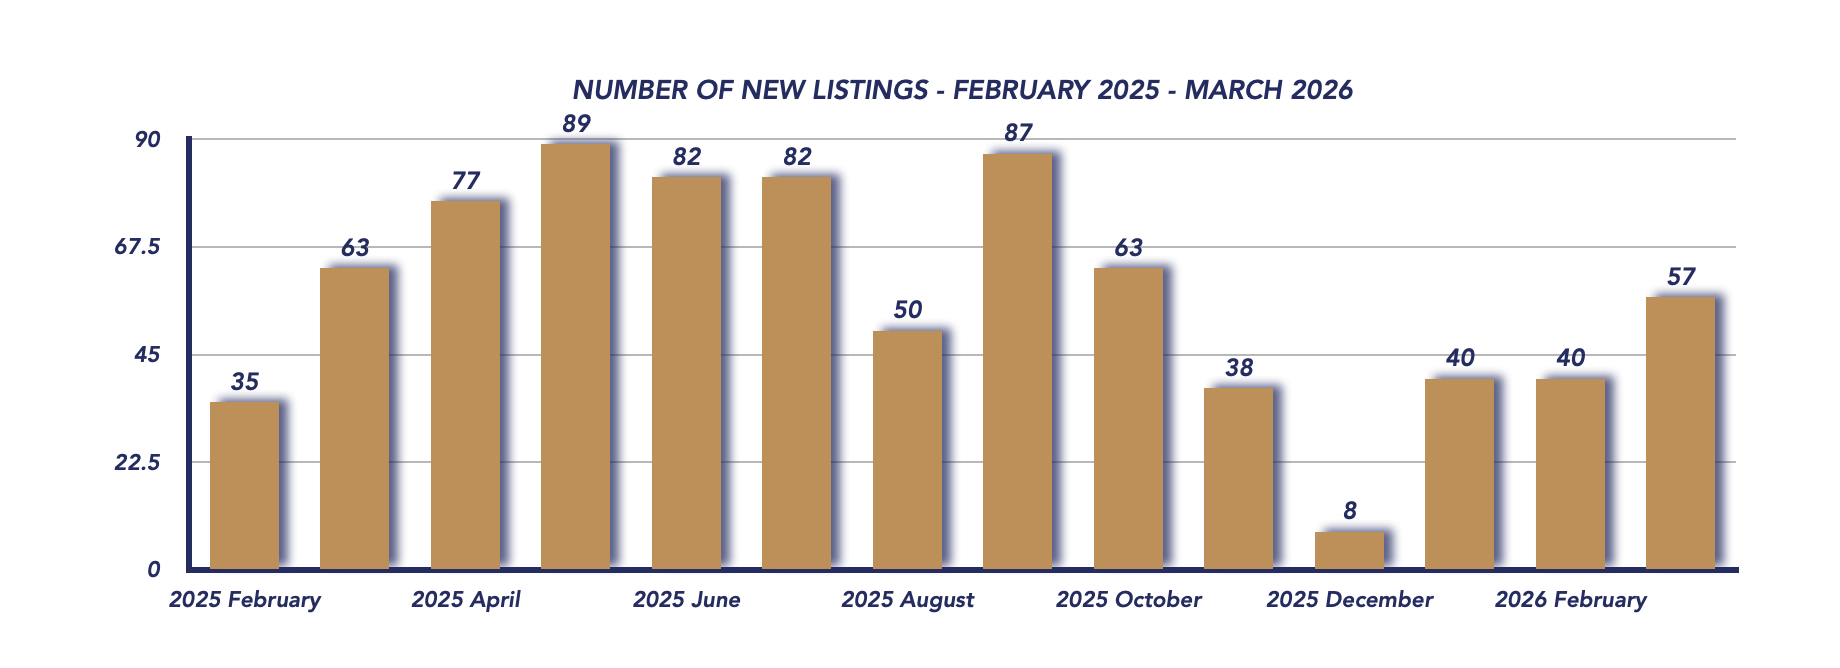
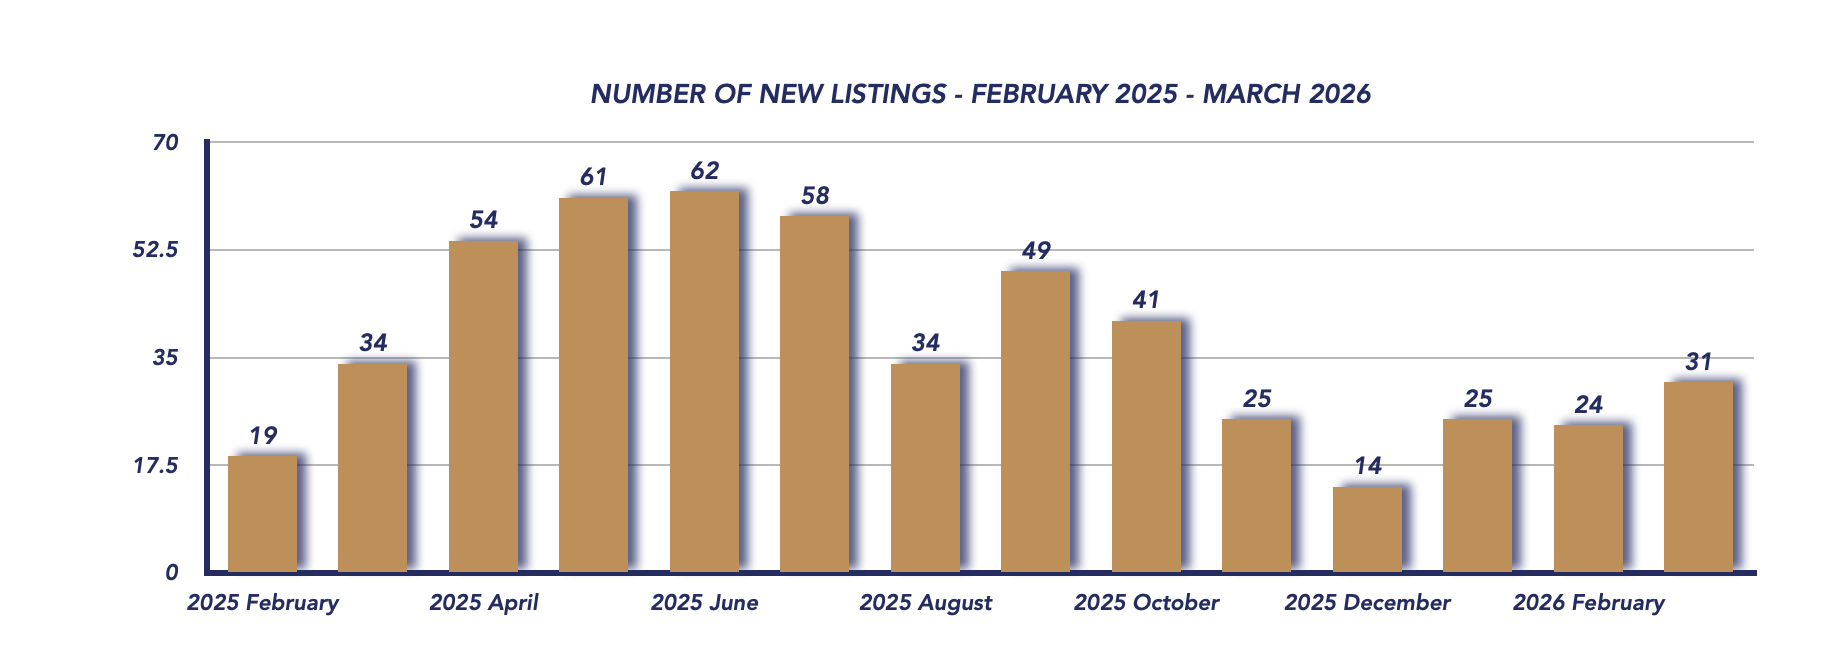
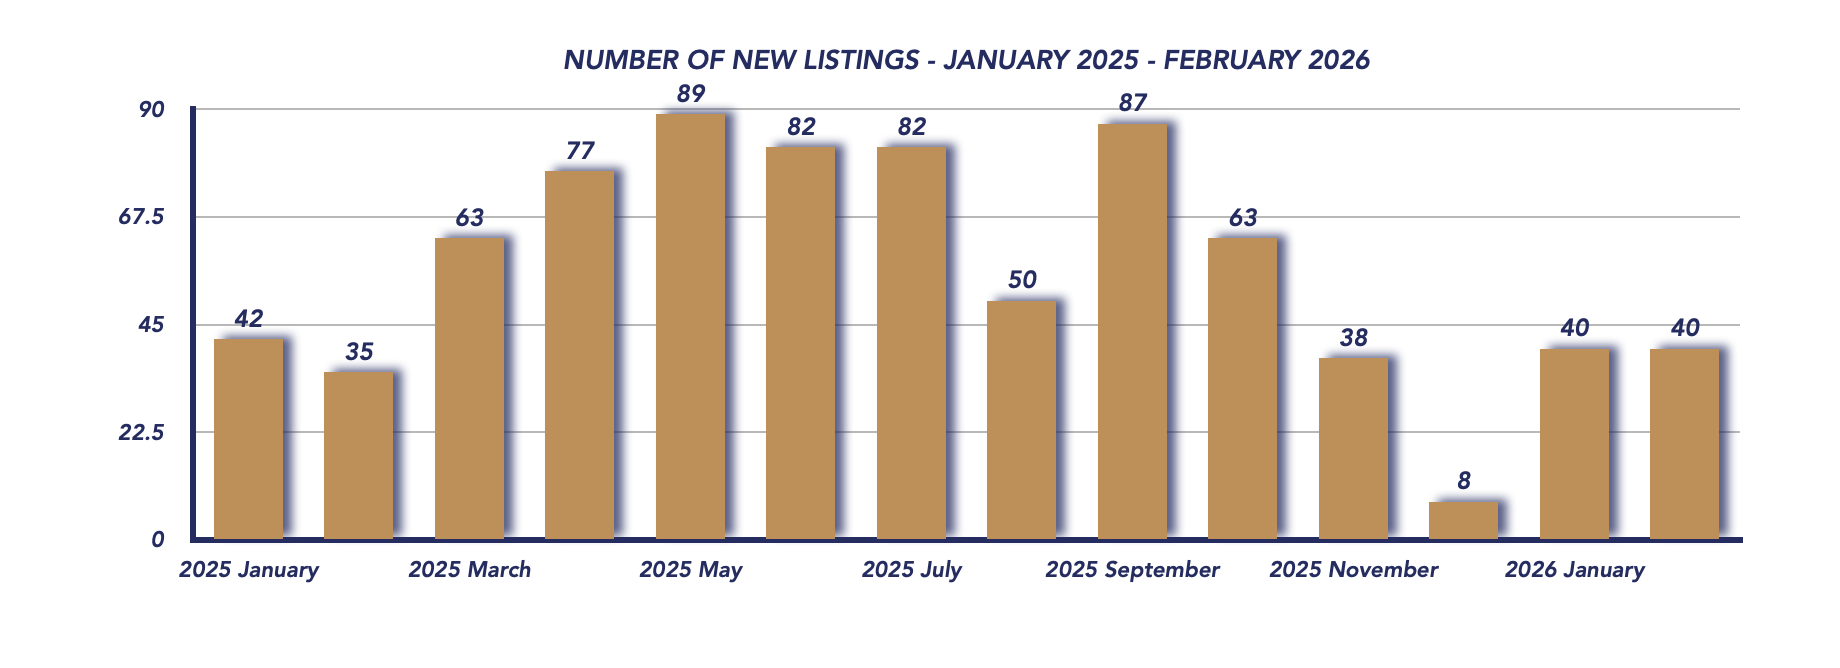
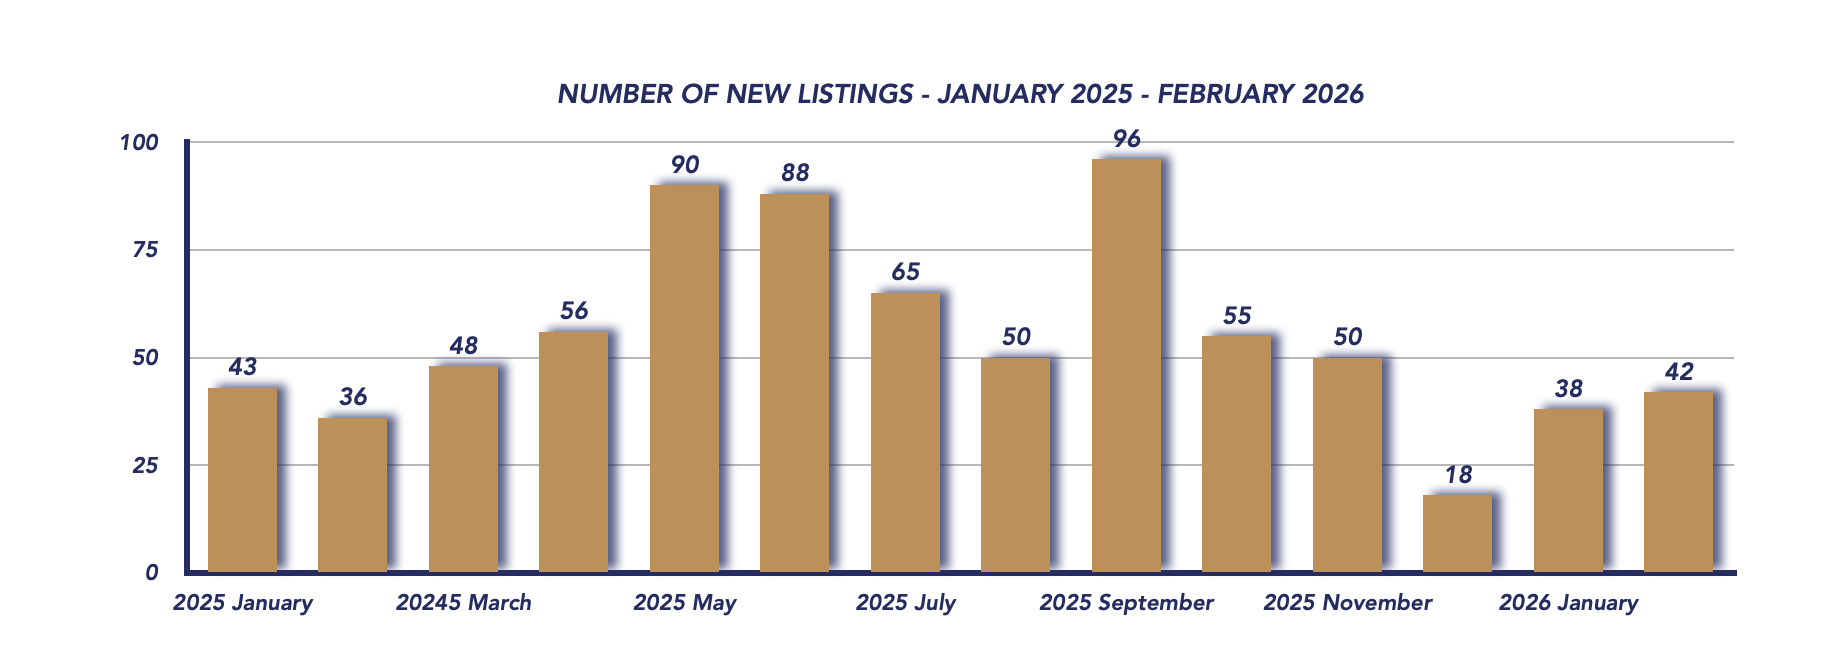
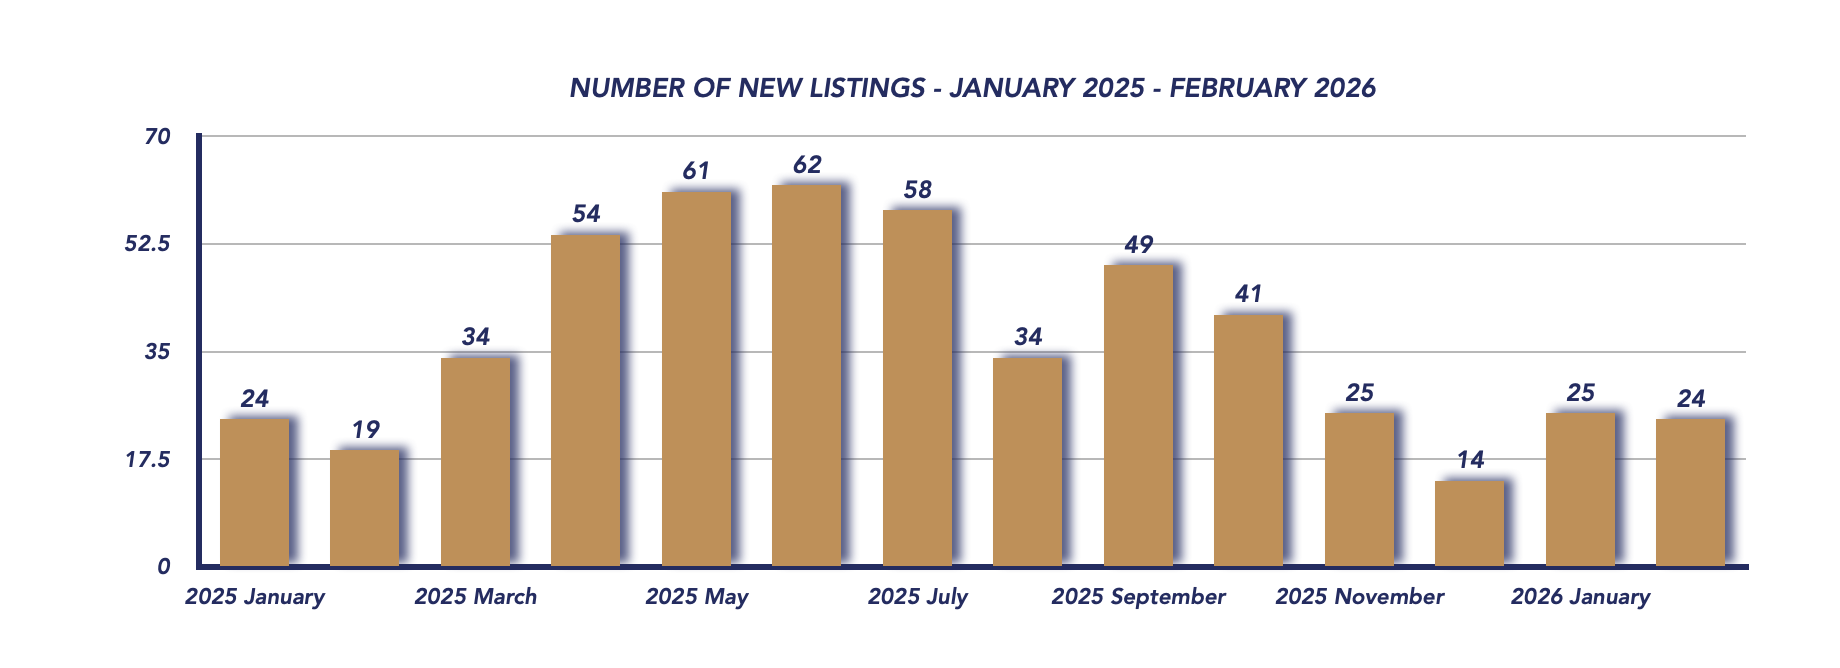
There were 71 new listings in April, up from 57 in March, though slightly below the 77 new listings recorded last April. This increase aligns with typical seasonal patterns, as more sellers enter the market in the spring.
Days on Market
Homes took an average of 63 days to sell, up from 39 days in March, indicating a slower pace of transactions. Buyers are taking more time to evaluate options, likely due to increased inventory and greater choice.
Months of Inventory
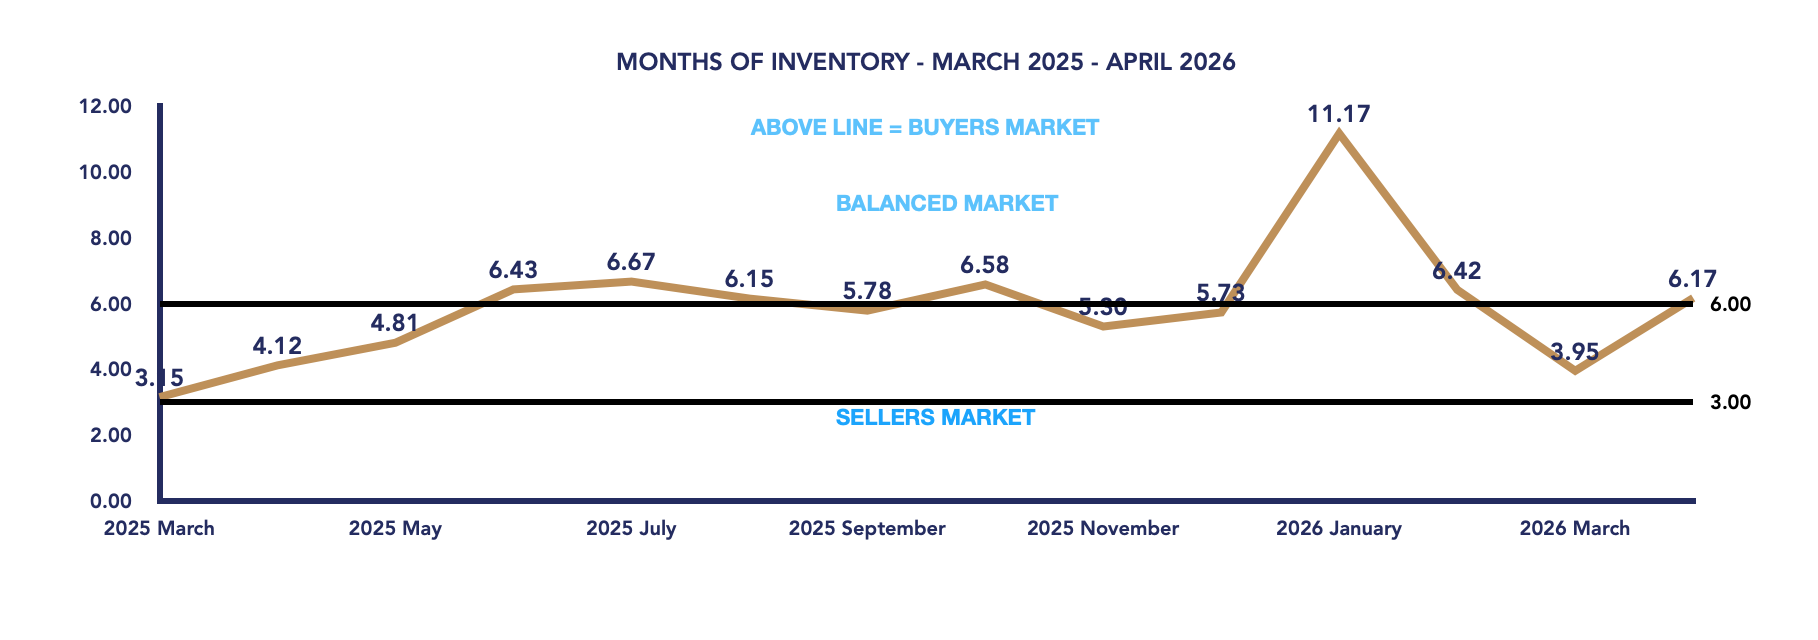
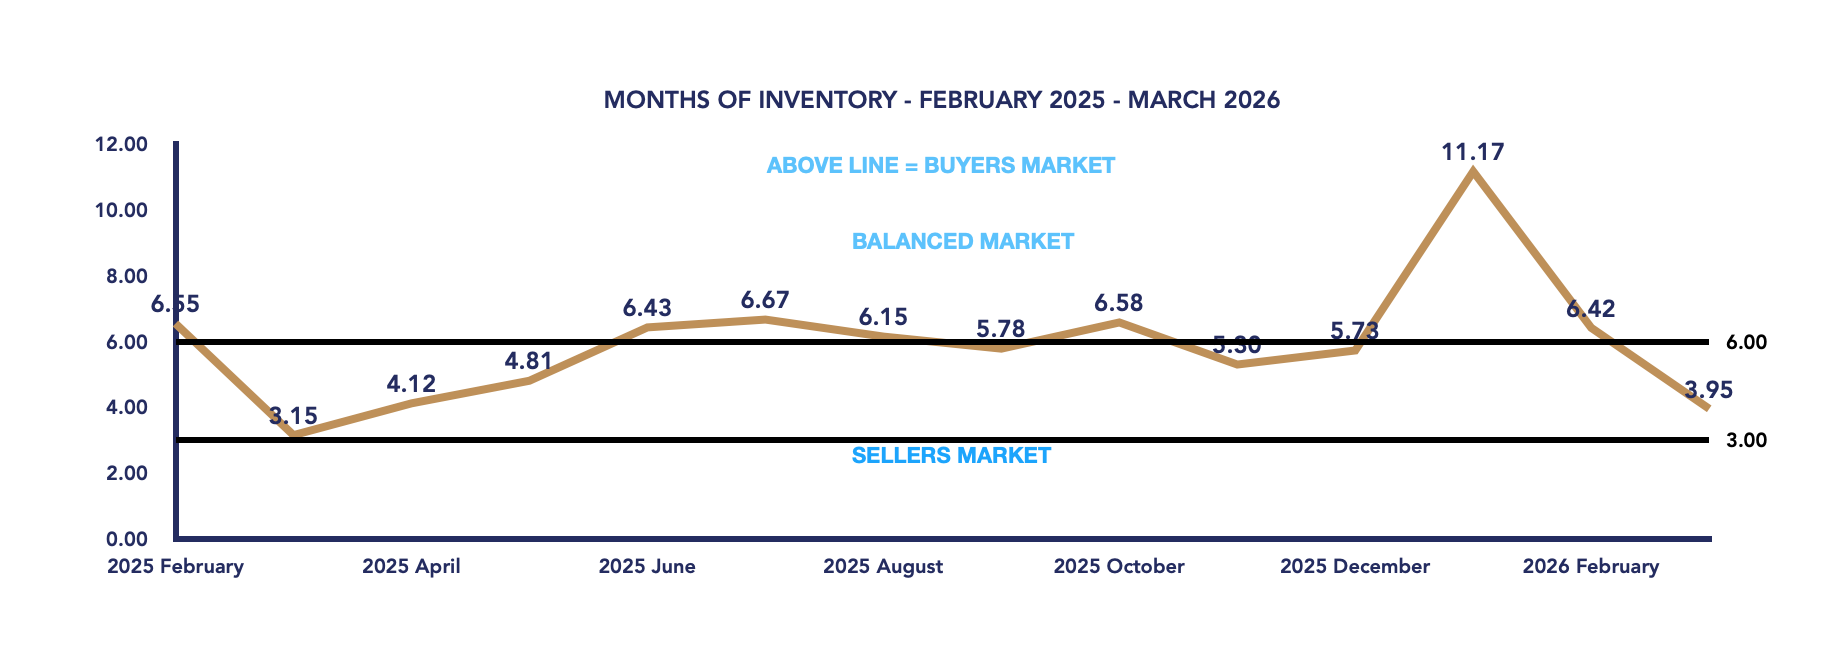
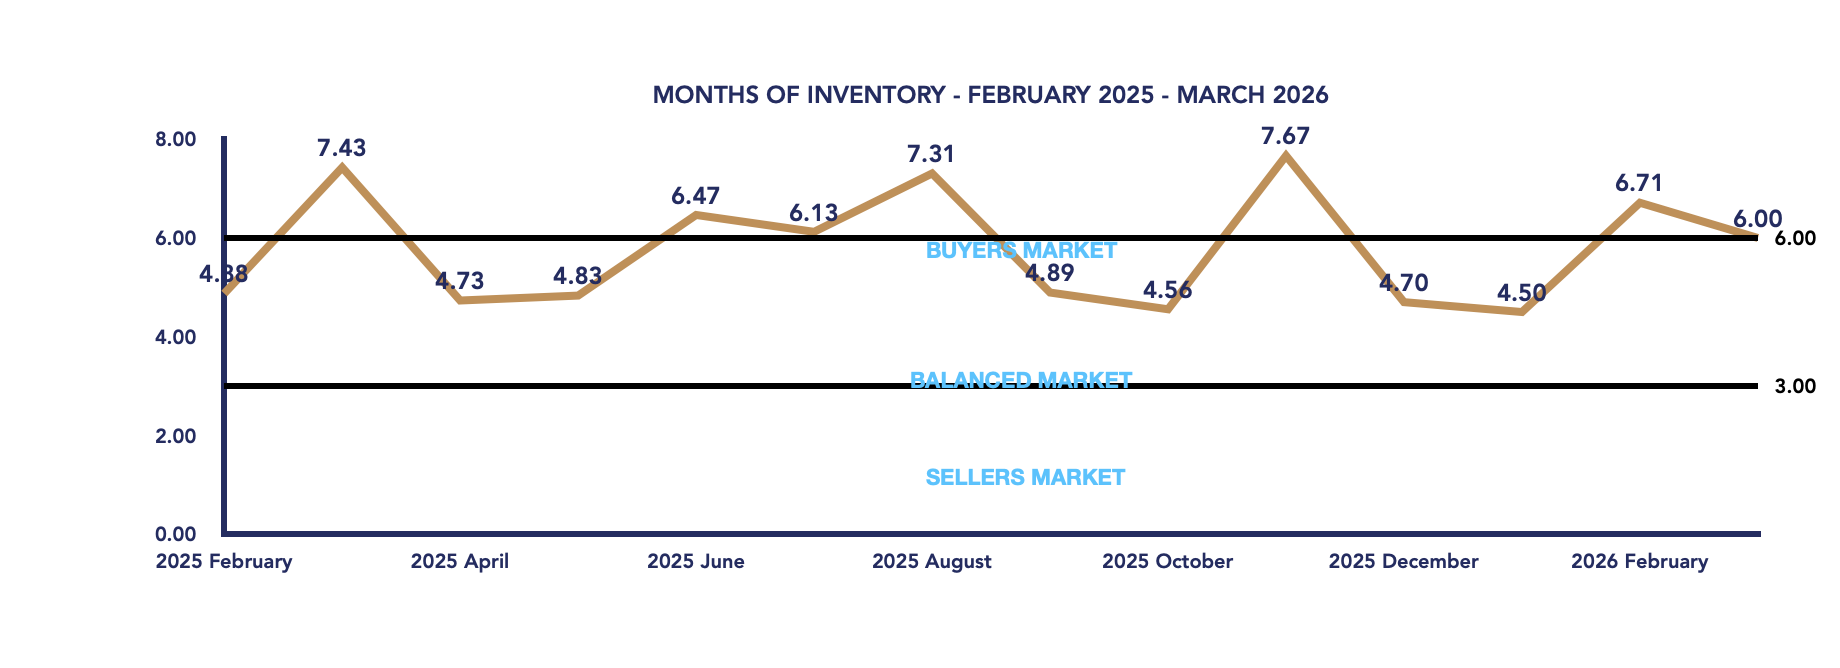
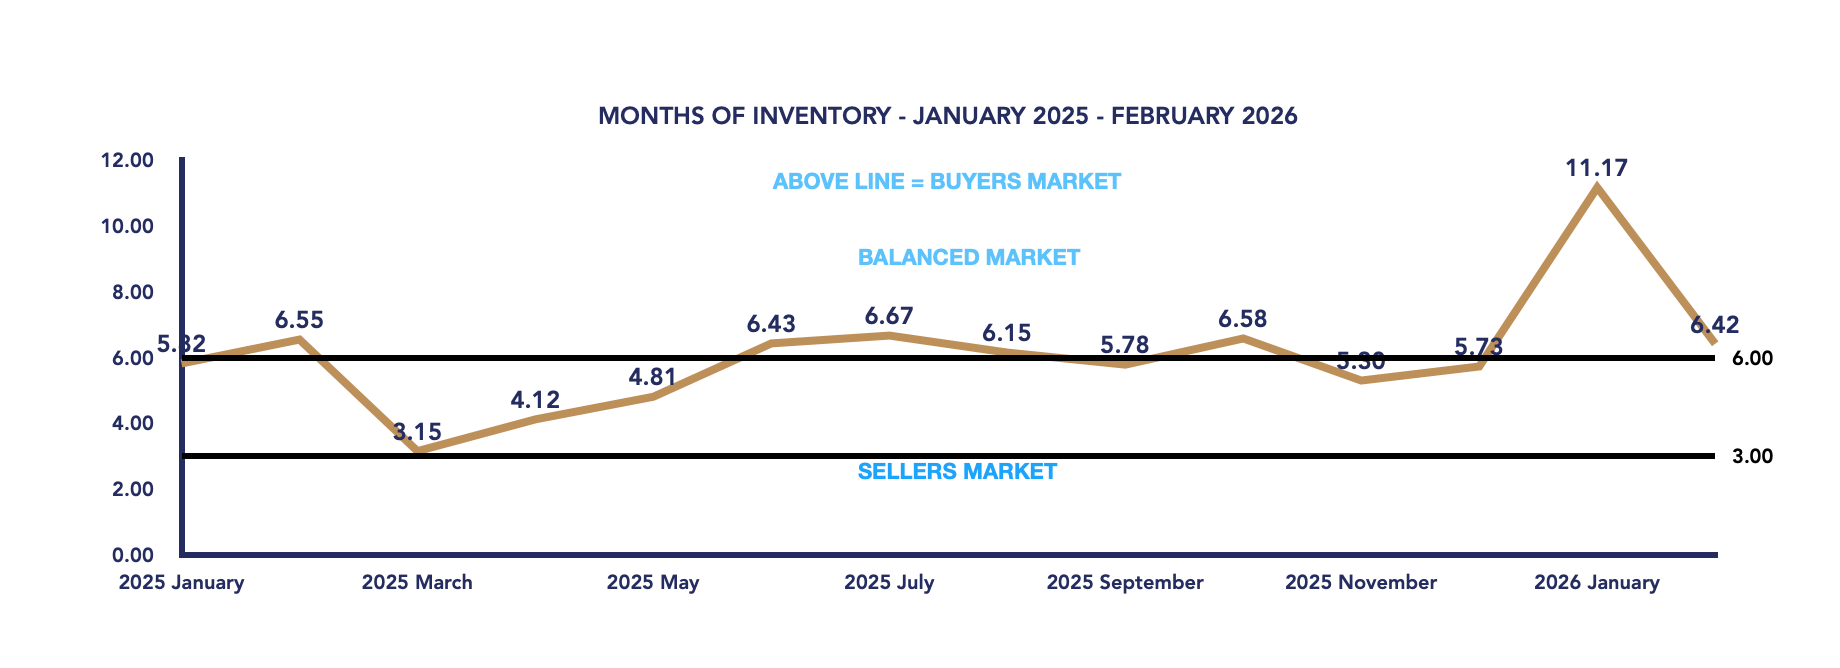
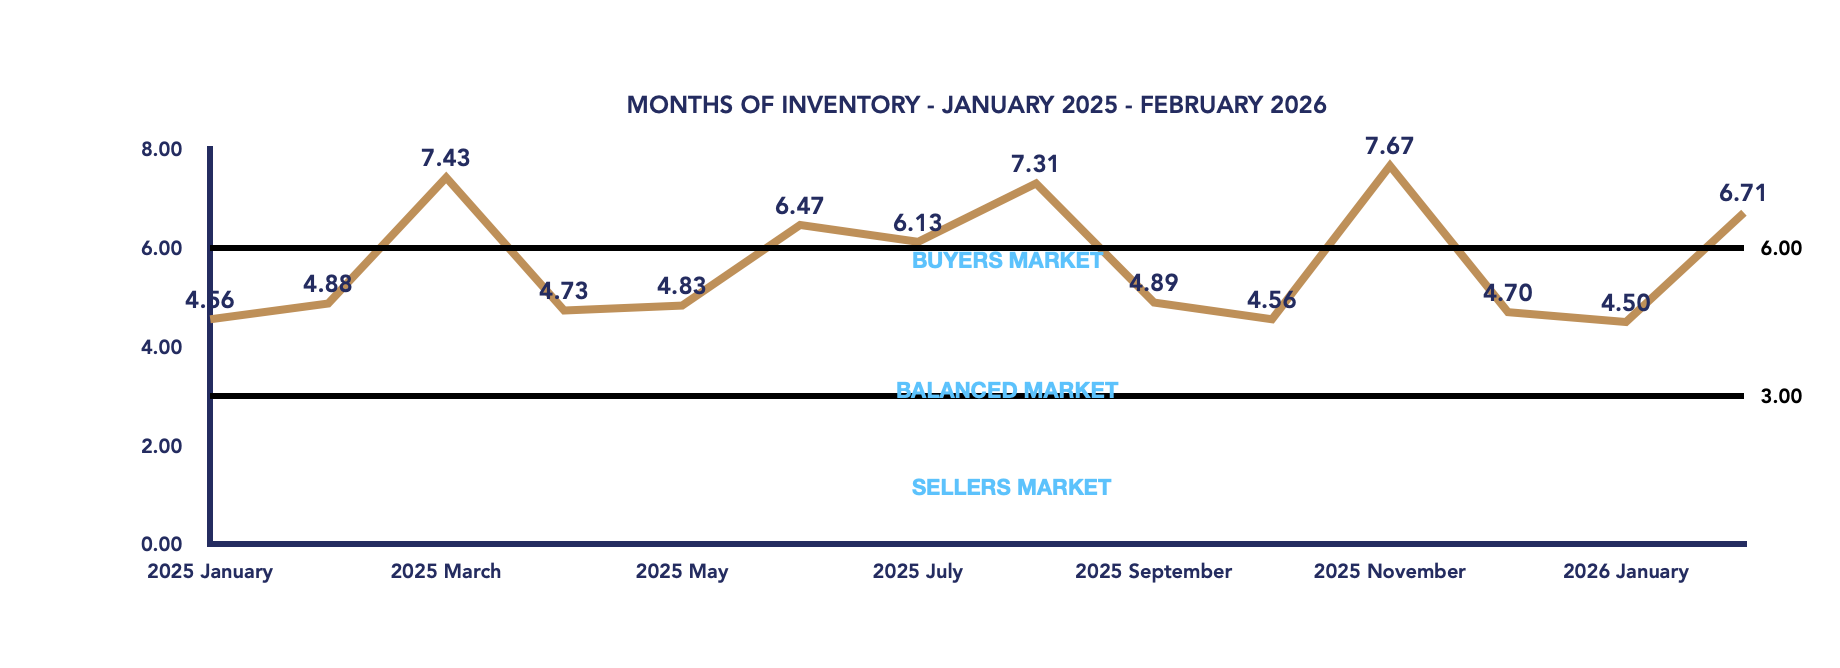
One of the most significant changes this month is the increase in months of inventory to 6.17, up from 3.95 in March. This shift moves the market back into buyer’s territory, as supply begins to outpace demand.
Conclusion
April 2026 reflects a market adjusting to increased inventory and shifting buyer behavior. While average prices remained stable month-over-month, the absence of high-end sales and a greater concentration of mid-range and entry-level properties contributed to a notable year-over-year decline.
With rising inventory, longer days on market, and months of supply moving into buyer’s market territory, conditions are becoming more favorable for buyers. Sellers, on the other hand, will need to be strategic with pricing and presentation to stand out in a more competitive environment.
As we move further into the spring market, the key question will be whether buyer demand strengthens enough to absorb the growing supply, or if the market continues to tilt further in favour of buyers.
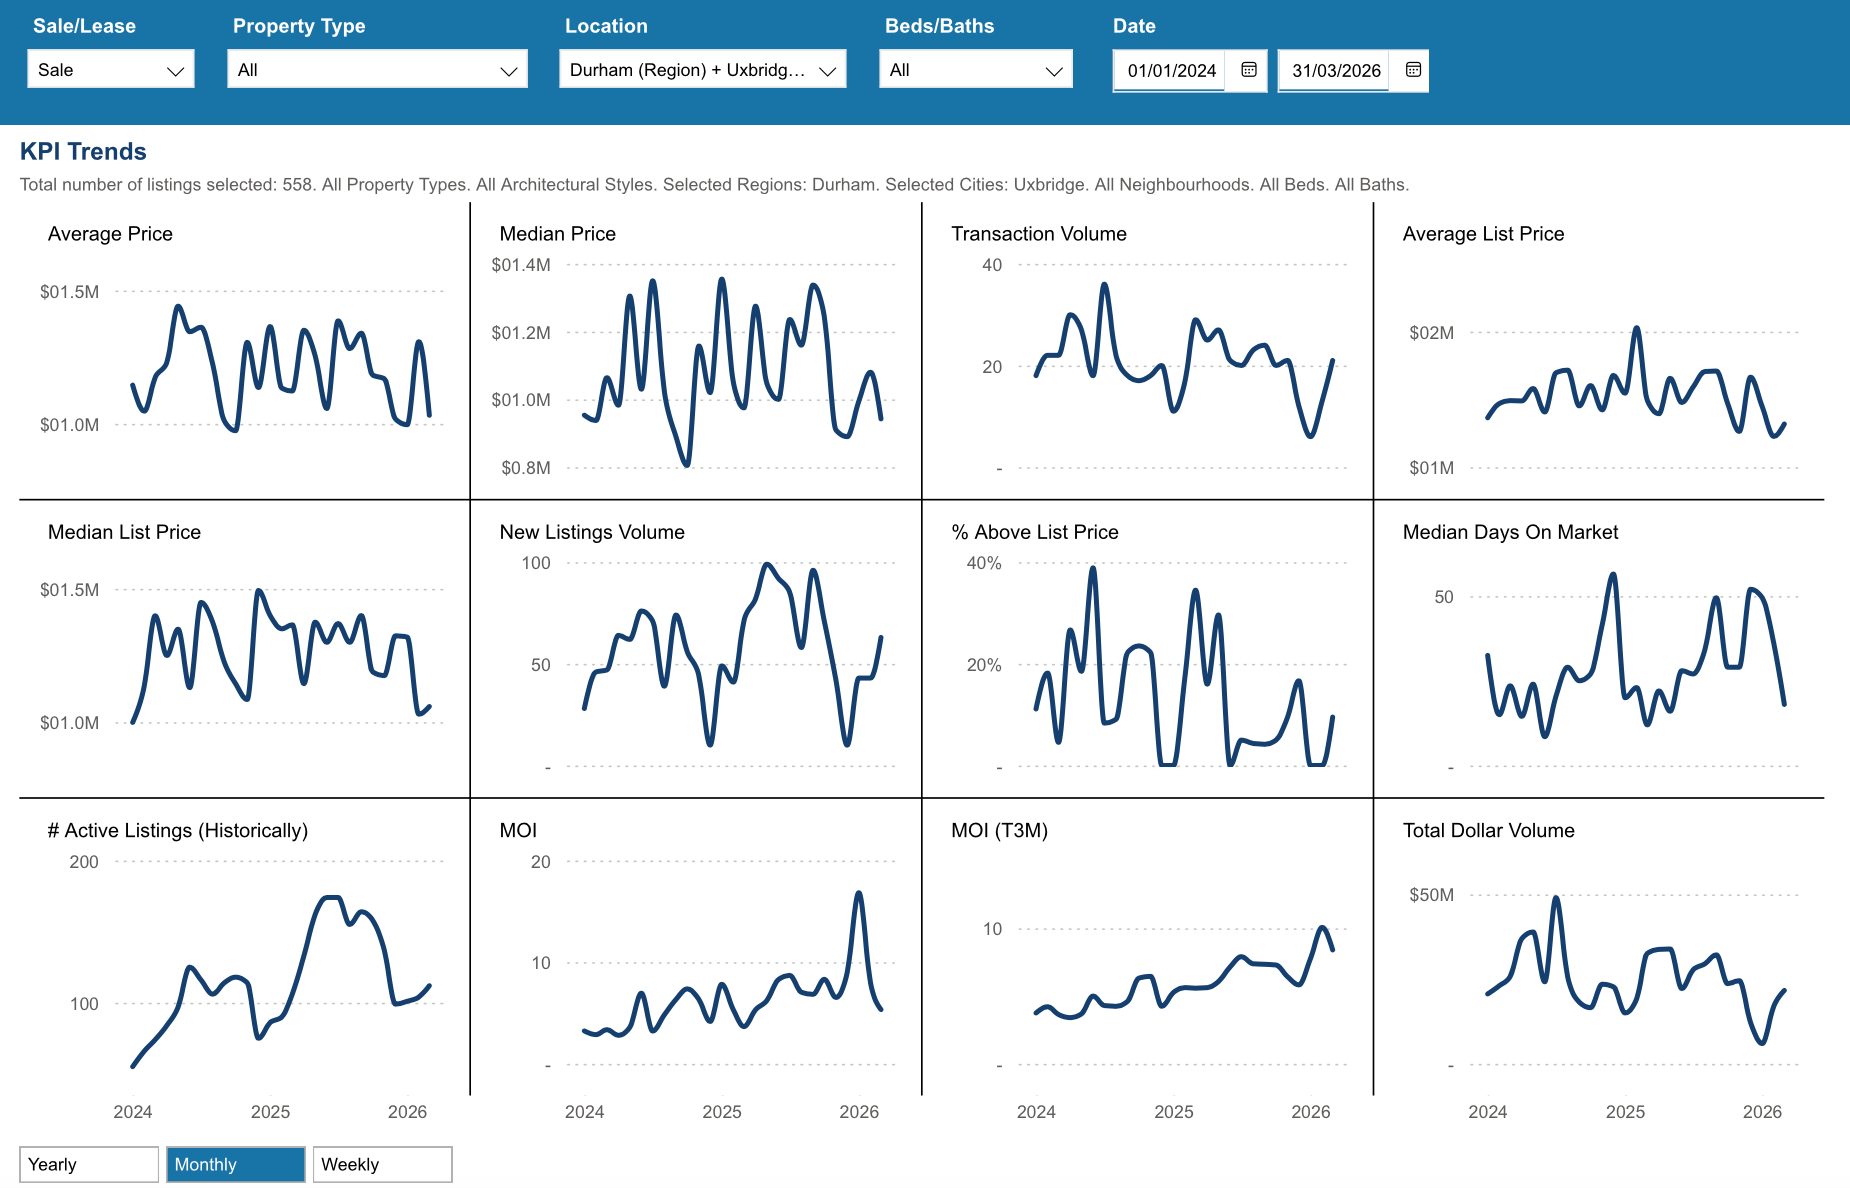
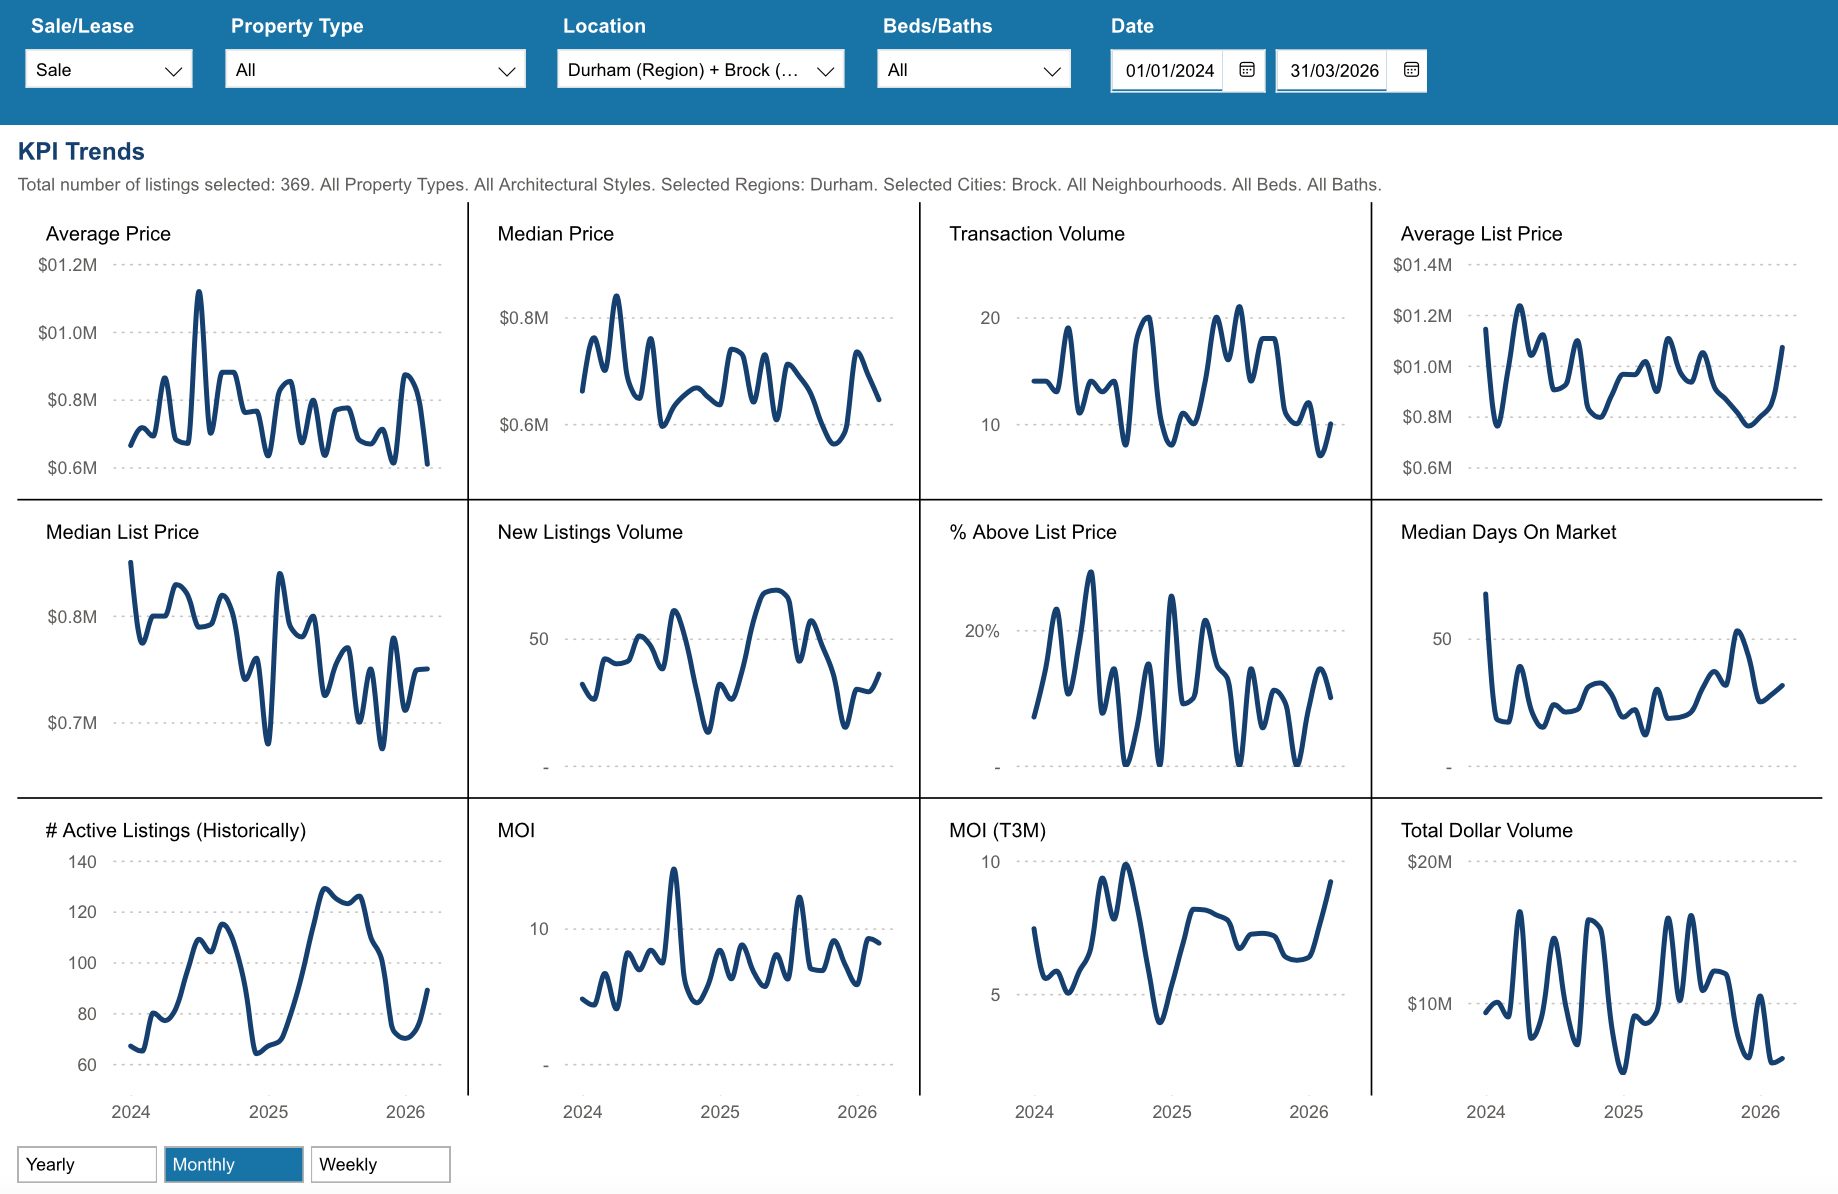
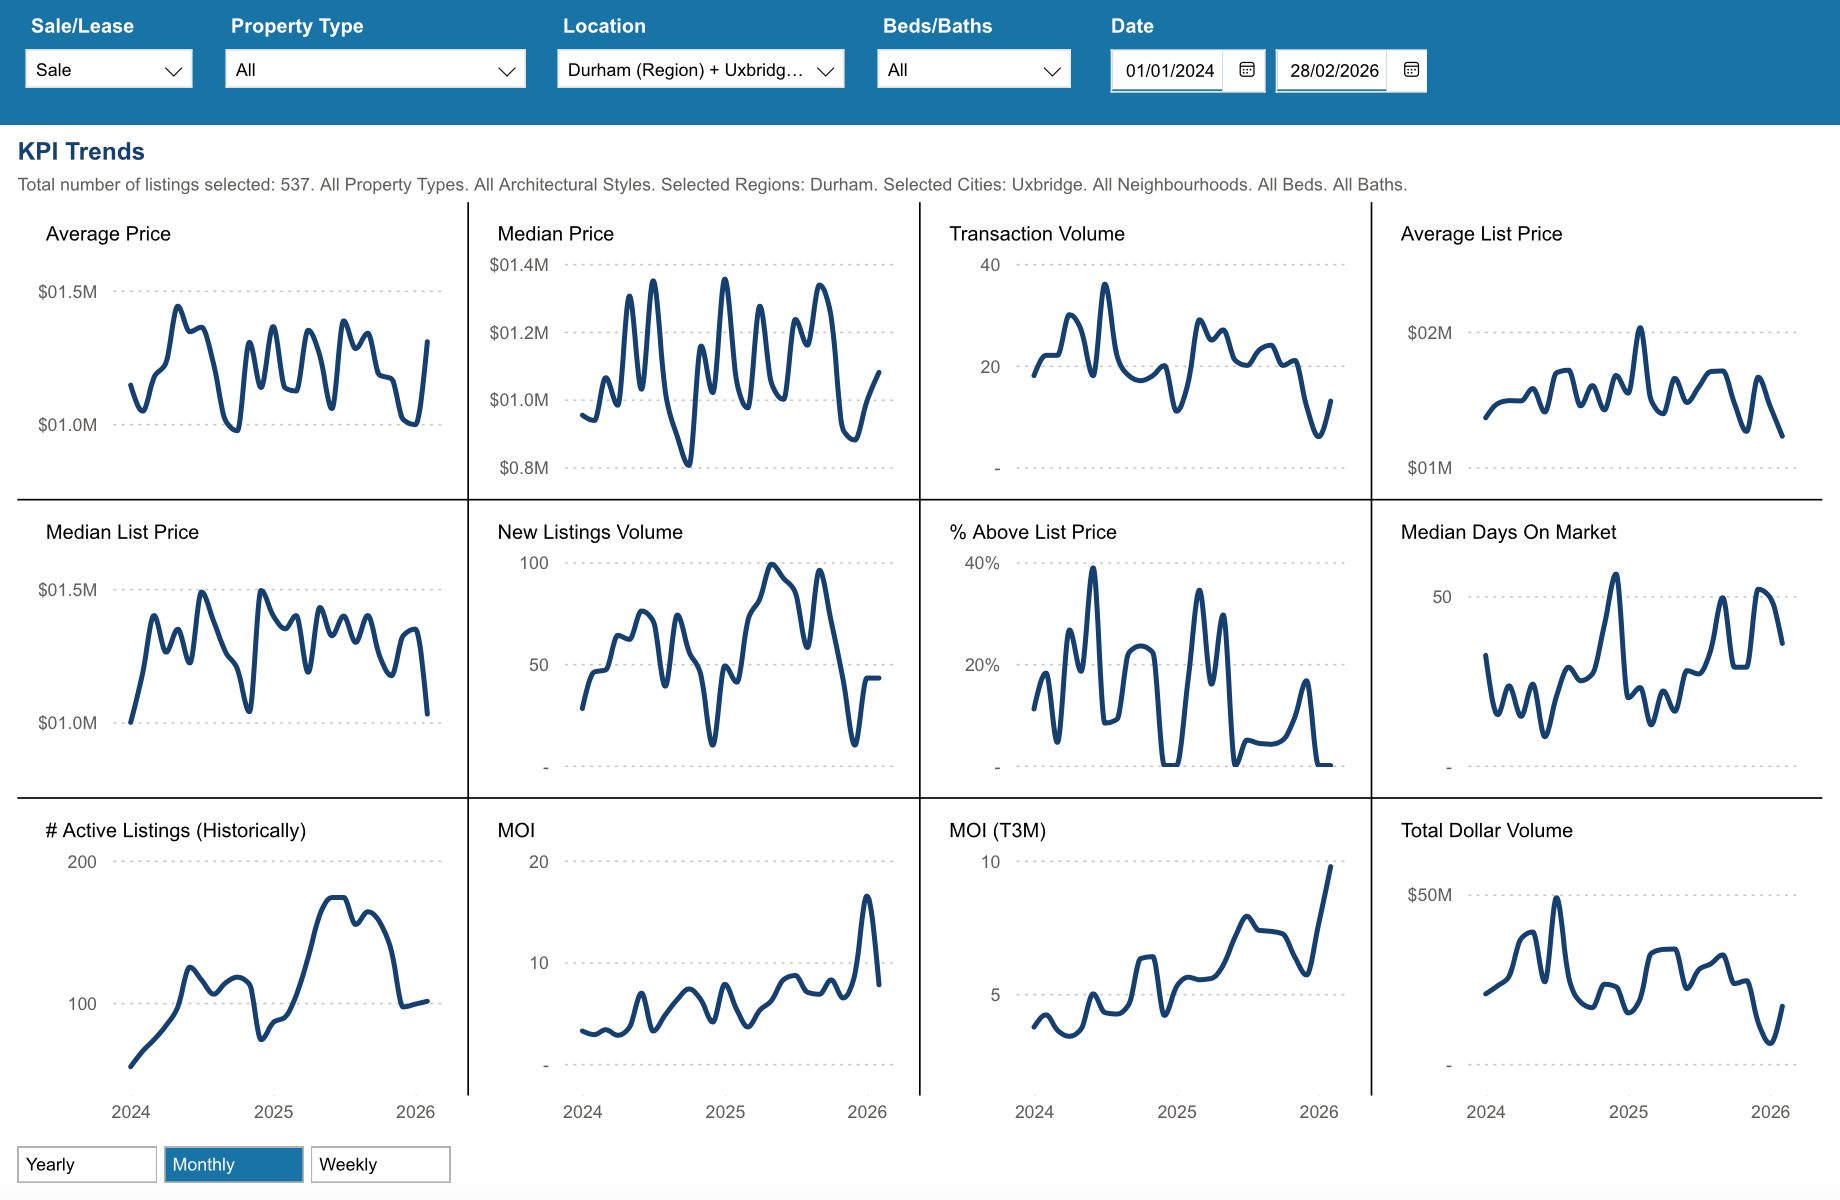
Key Performance Indicators (KPIs) from January 2024 through April 2026 provide a clear snapshot of how the Township of Uxbridge real estate market has evolved across all property types, architectural styles, and home configurations
WATCH OUR MONDAY MARKET MINUTES

*Information is believed to be accurate at time of posting but is not guaranteed to be correct. Some values may vary slightly based on the exact date and time the reports were generated. Market stats are provided by TRREB (Toronto Regional Real Estate Board) and are based on sales for the month of Attached/Row/Townhouses, Condo Apartments, Condo Townhouses, Detached, Detached with Common Elements, Link Homes and Semi-detached. *Some values may vary slightly based on the exact date and time the reports were generated.
Not intended as a solicitation if your property is already listed by another broker. Affiliated real estate agents are independent contractor sales associates, not employees. ©2021 Coldwell Banker. All Rights Reserved. Coldwell Banker and the Coldwell Banker logos are trademarks of Coldwell Banker Real Estate LLC. The Coldwell Banker® System is comprised of company owned offices which are owned by a subsidiary of Realogy Brokerage Group LLC and franchised offices which are independently owned and operated. The Coldwell Banker System fully supports the principles of the Fair Housing Act and the Equal Opportunity Act.
Click below for more reports
Check out our Uxbridge and Scugog Events Pages to keep up to date on whats going on around town. Click the links or scan the Code with your phone to take you directly there.

UXBRIDGE EVENTS

SCUGOG EVENTS

Scugog Housing April 2026

Scugog Housing April 2026
Each office is independently owned and operated
![]()
![]()
Housing Market Report for April 2026
Here is the Township of Scugog Housing April 2026 report (all housing types), with reports from the Canadian Real Estate Association, and Toronto Regional Real Estate Board included.
This housing report for Durham Region includes the number of new listings, average list price, number of properties sold, average selling price, average days on market and average asking price to selling price ratio for all property types within the Region of Durham.
Scroll to the bottom for links to take you to the housing market reports for Durham Region, Uxbridge and Brock.
![]()
![]()
From Toronto Regional Real Estate Board
Please note: The PropTx MLS® System, of which TRREB is a part, has added a number of new client boards over the last year. Many of these boards’ Members trade within the Greater Toronto Area and broader Greater Golden Horseshoe regions. As a result, historic data have been updated to reflect the addition of these boards’ listings and transactions. This means historic data have changed relative to previously published static reports. To view updated historic data, click here.
Toronto Regional Real Estate Board – Market Stats At A Glance – April 2026
Read the Toronto Regional Real Estate Board Market Watch Report
![]()
Scugog Township Real Estate Market Analysis – April 2026
The Township of Scugog’s real estate market in April 2026 showed a mix of increased activity and continued downward pressure on pricing. While more homes sold and new listings surged, the overall market remained firmly in buyer’s territory, with elevated inventory and softer price trends shaping conditions.
April 2026
March 2026
Average Sales Price
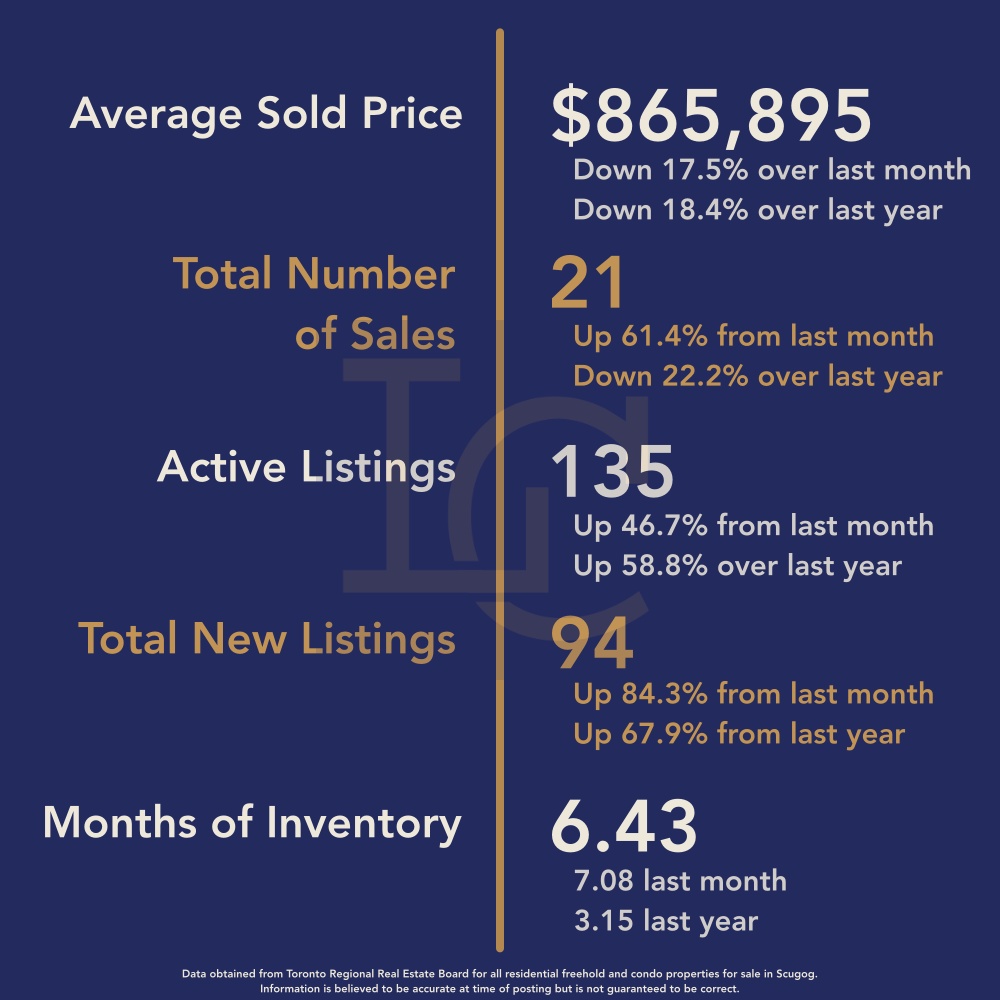
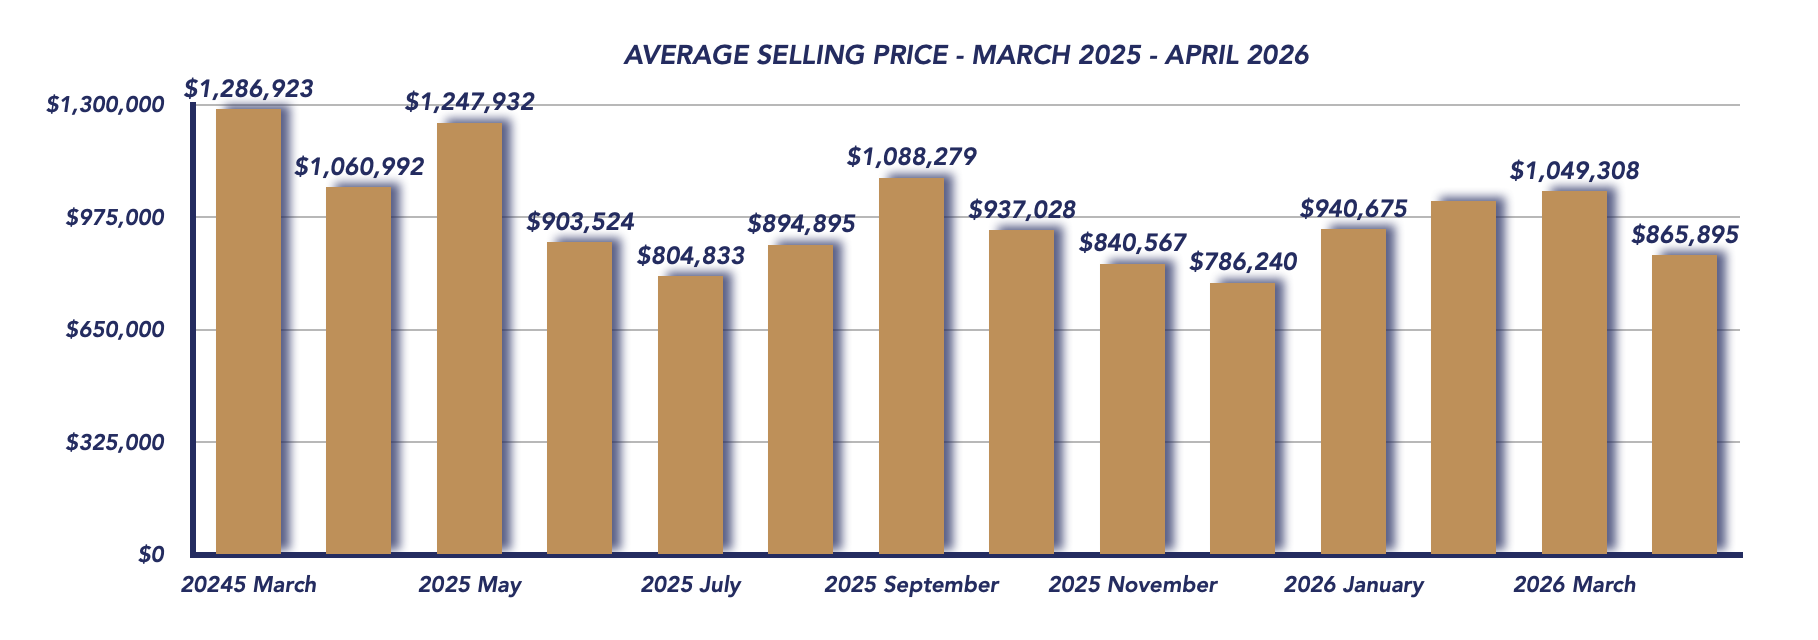
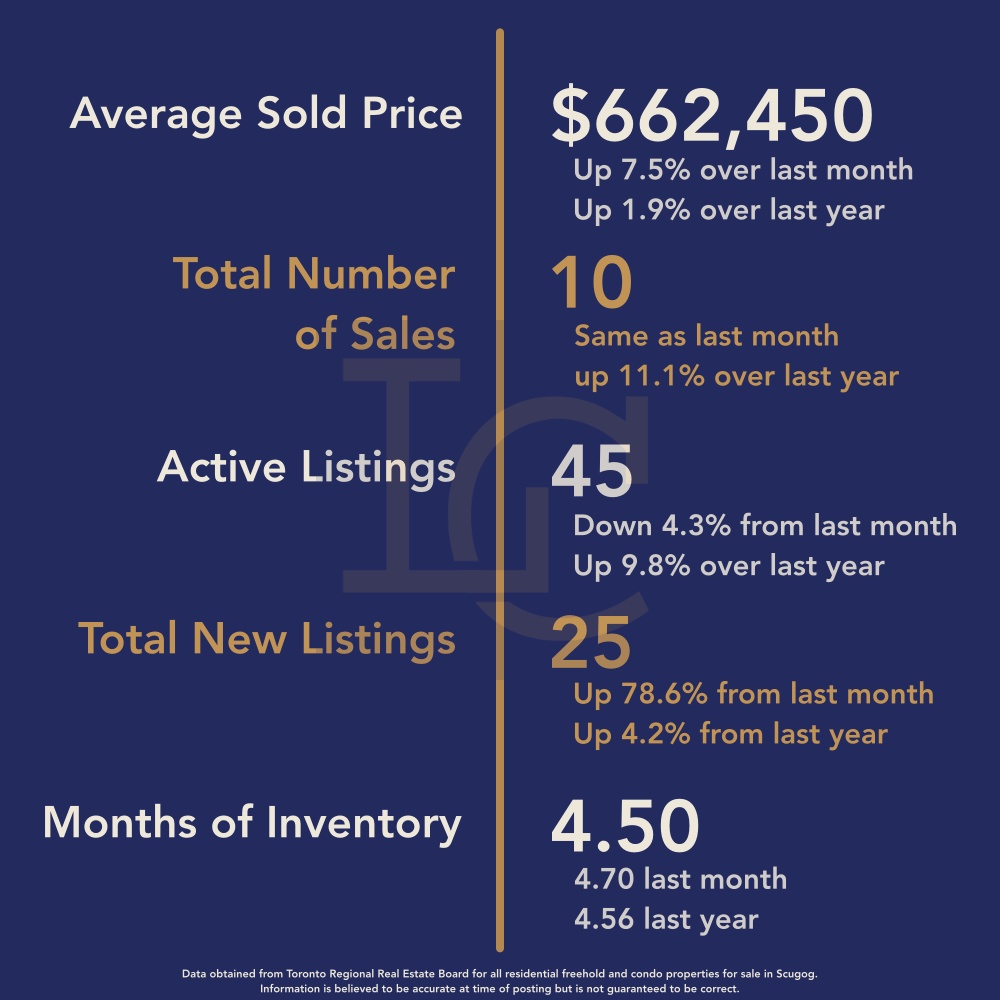
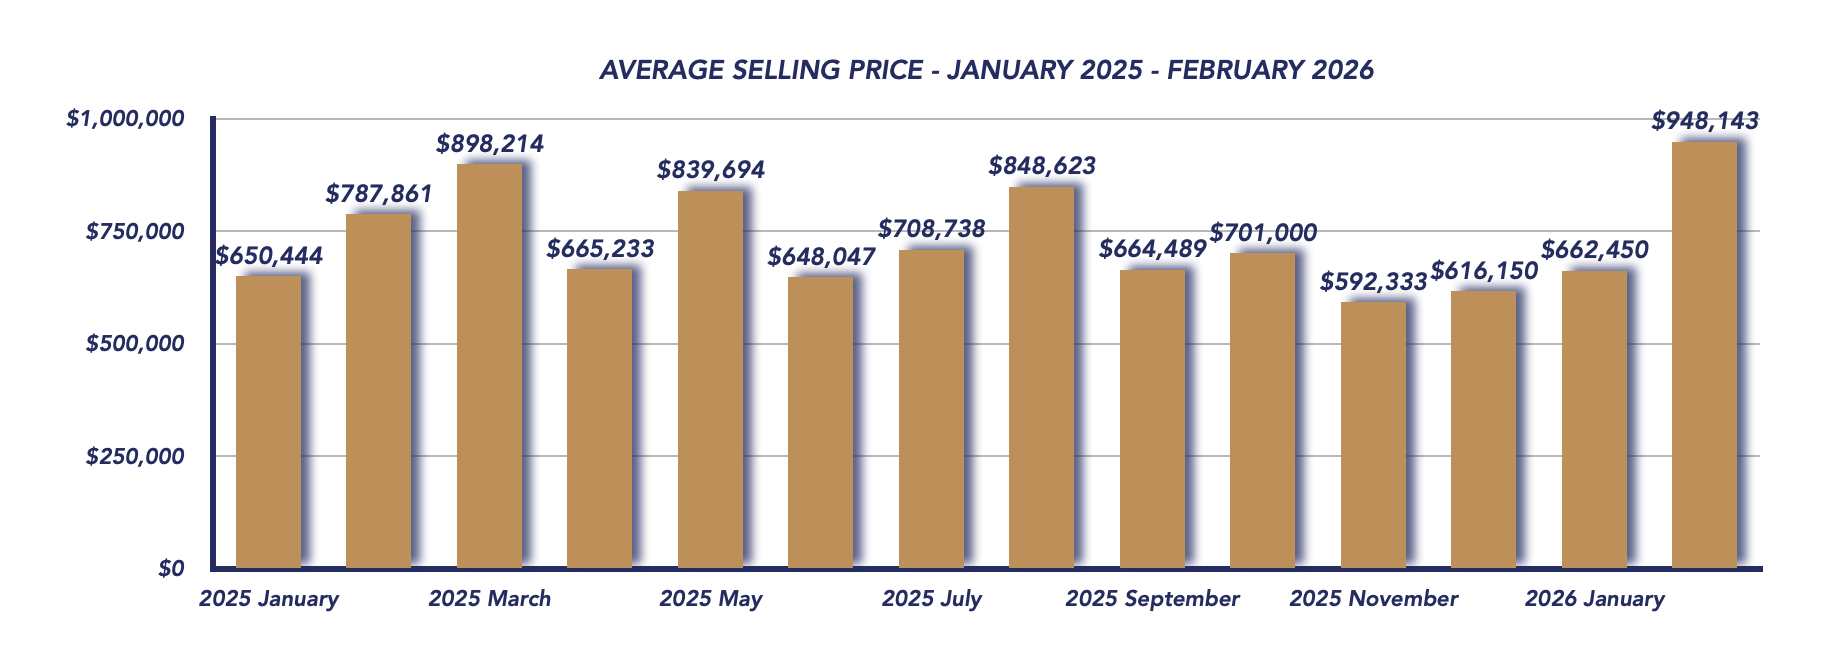
The average sales price in April 2026 came in at $865,895, representing a 17.4% decline from March ($1,049,308) and an 18.4% drop year-over-year compared to $1,060,992 in April 2025.
While this appears to be a sharp correction, it’s important to look at the mix of sales. In March, there were three properties that sold over $1 million, with the highest reaching $1,800,000, which helped elevate the monthly average.
In April, although seven properties sold for over $1 million (with the highest at $1,400,000), a larger share of transactions occurred at the lower end:
- 12 properties sold under $800,000
- The lowest sale was $486,000
This shift toward more mid-range and entry-level sales pulled the average price downward despite an increase in higher-end transactions.
Sales Activity
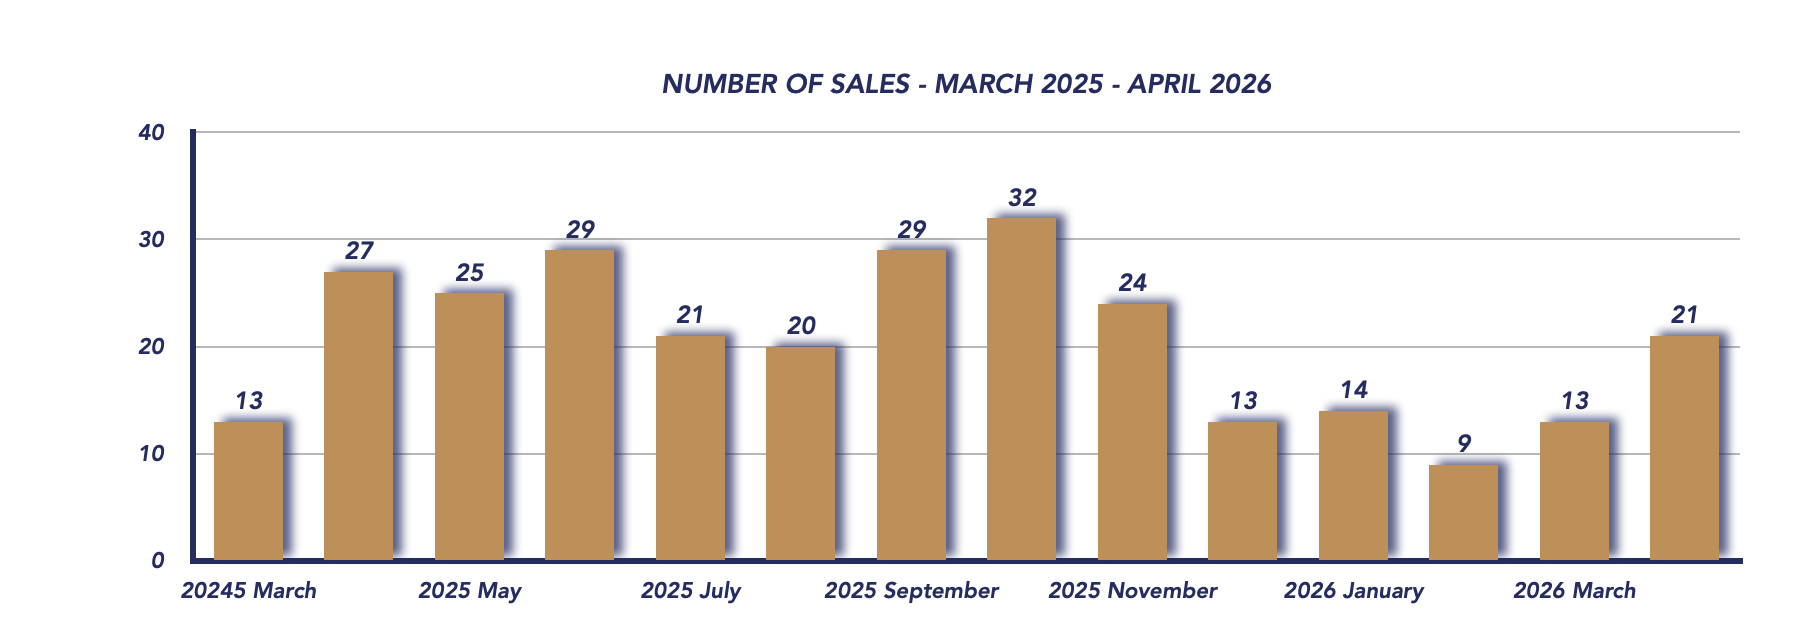
A total of 21 homes sold in April, up from 13 in March, showing a seasonal boost in activity as the spring market gained traction. However, sales were still below the 27 transactions recorded in April 2025, indicating that demand has not fully returned to last year’s levels.
The sale-to-list price ratio improved slightly to 96%, up from 95% in March, suggesting that while buyers still have leverage, sellers are seeing slightly stronger offers relative to their asking prices.
Listings & Inventory
April saw a significant increase in supply:
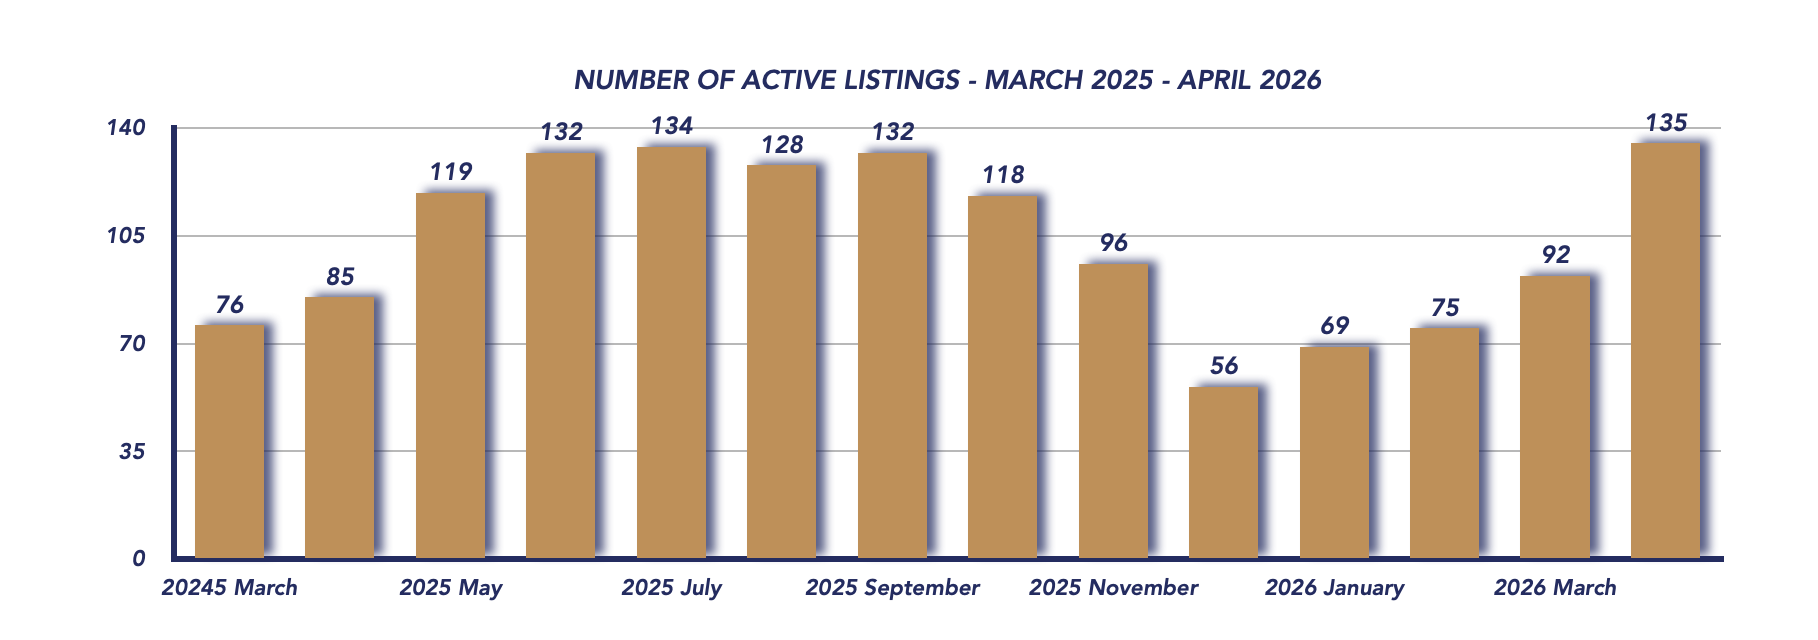
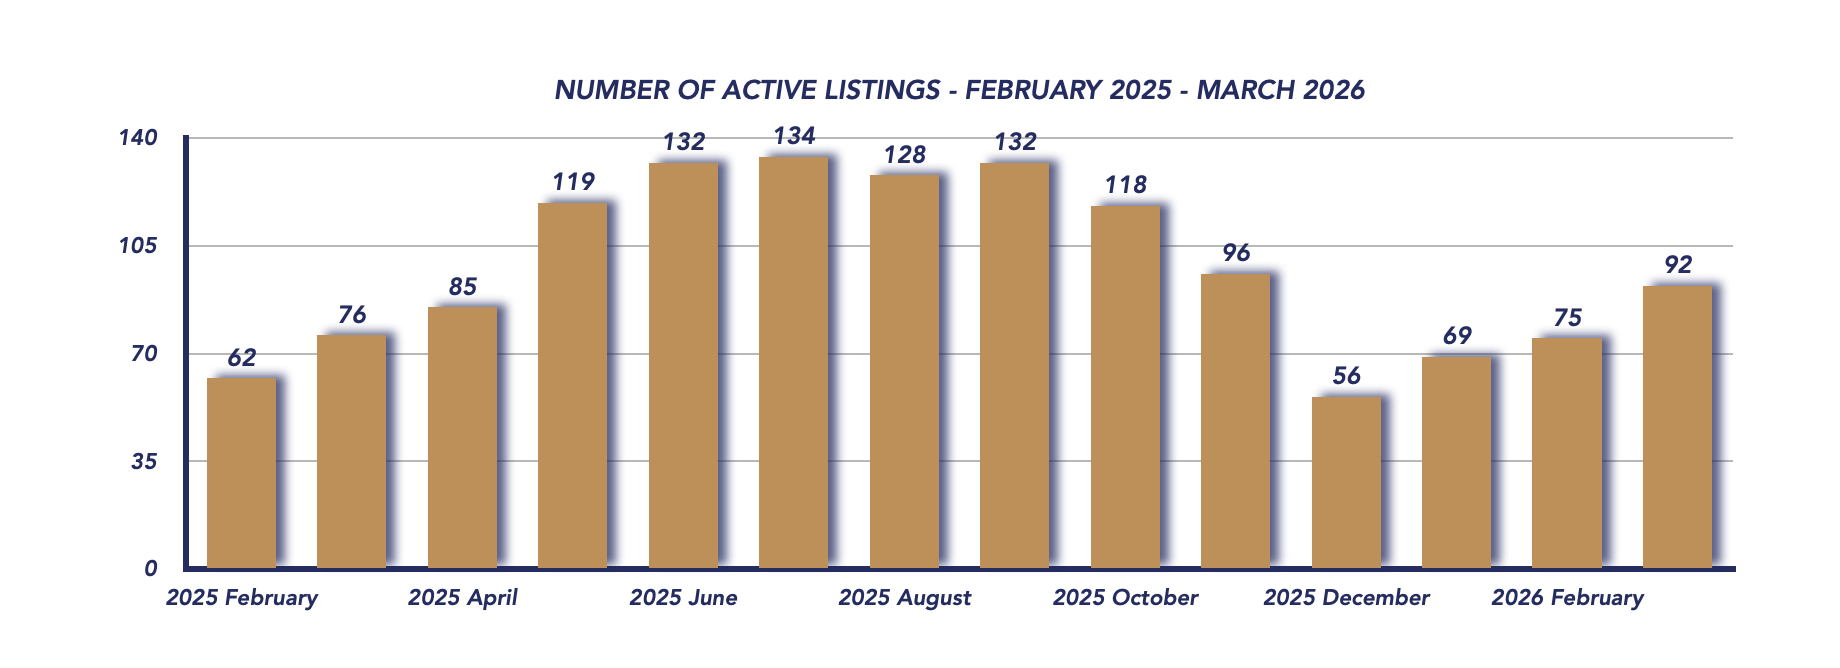
- Active listings jumped to 135, up from 92 in March and 85 last year
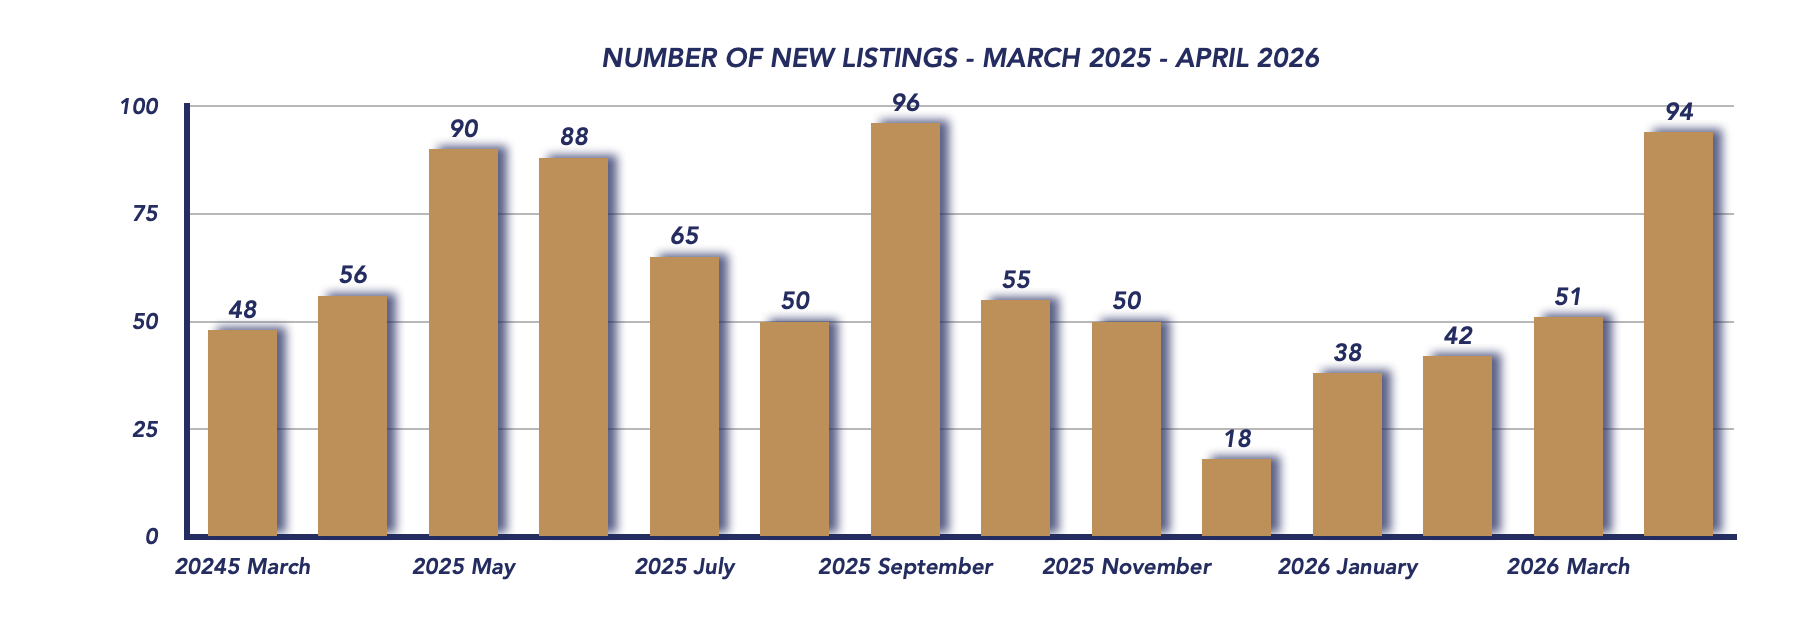
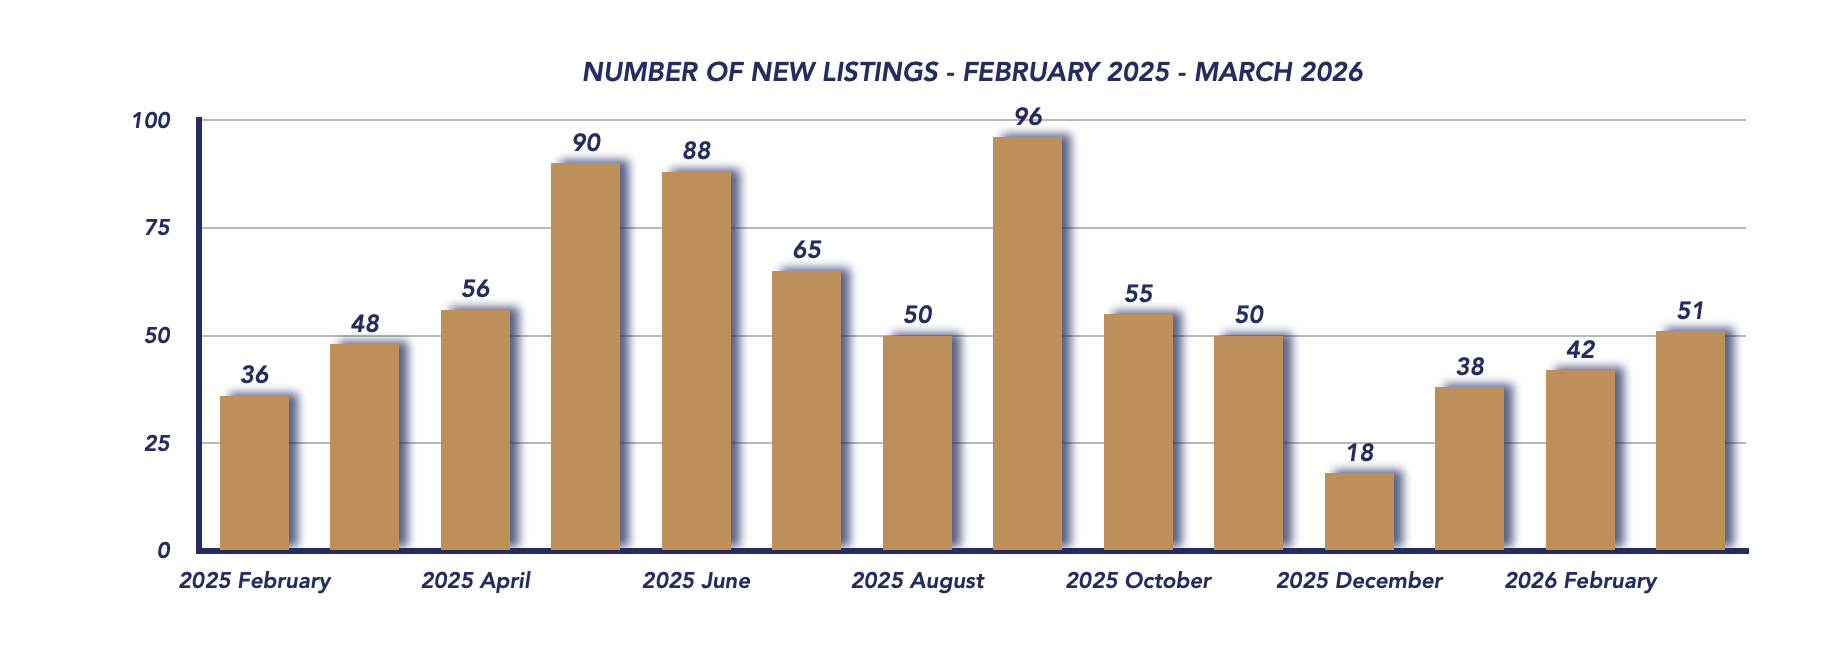
- New listings surged to 94, compared to 51 last month and 56 in April 2025
This sharp rise in listings reflects the typical spring influx of homes entering the market, but it has also contributed to increased competition among sellers.
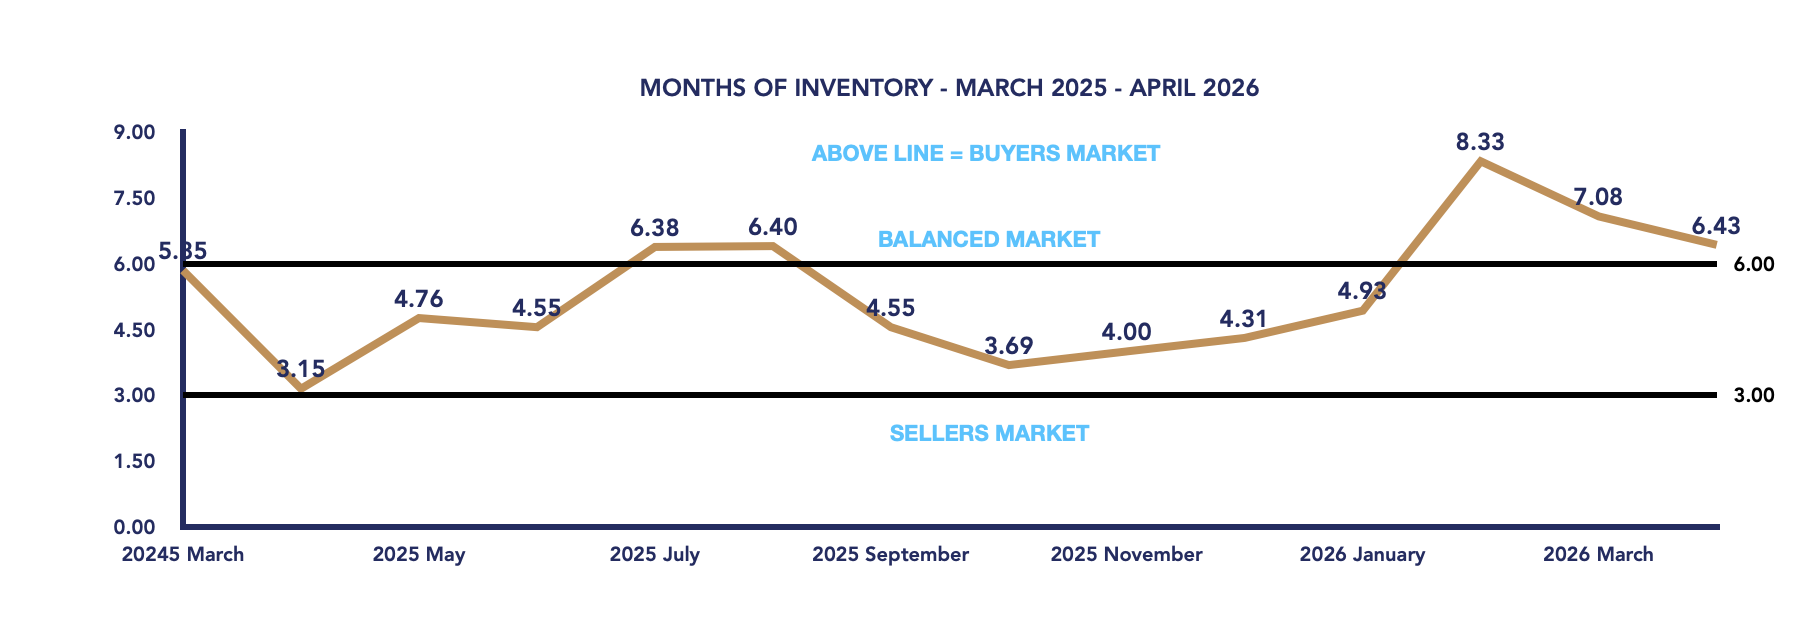
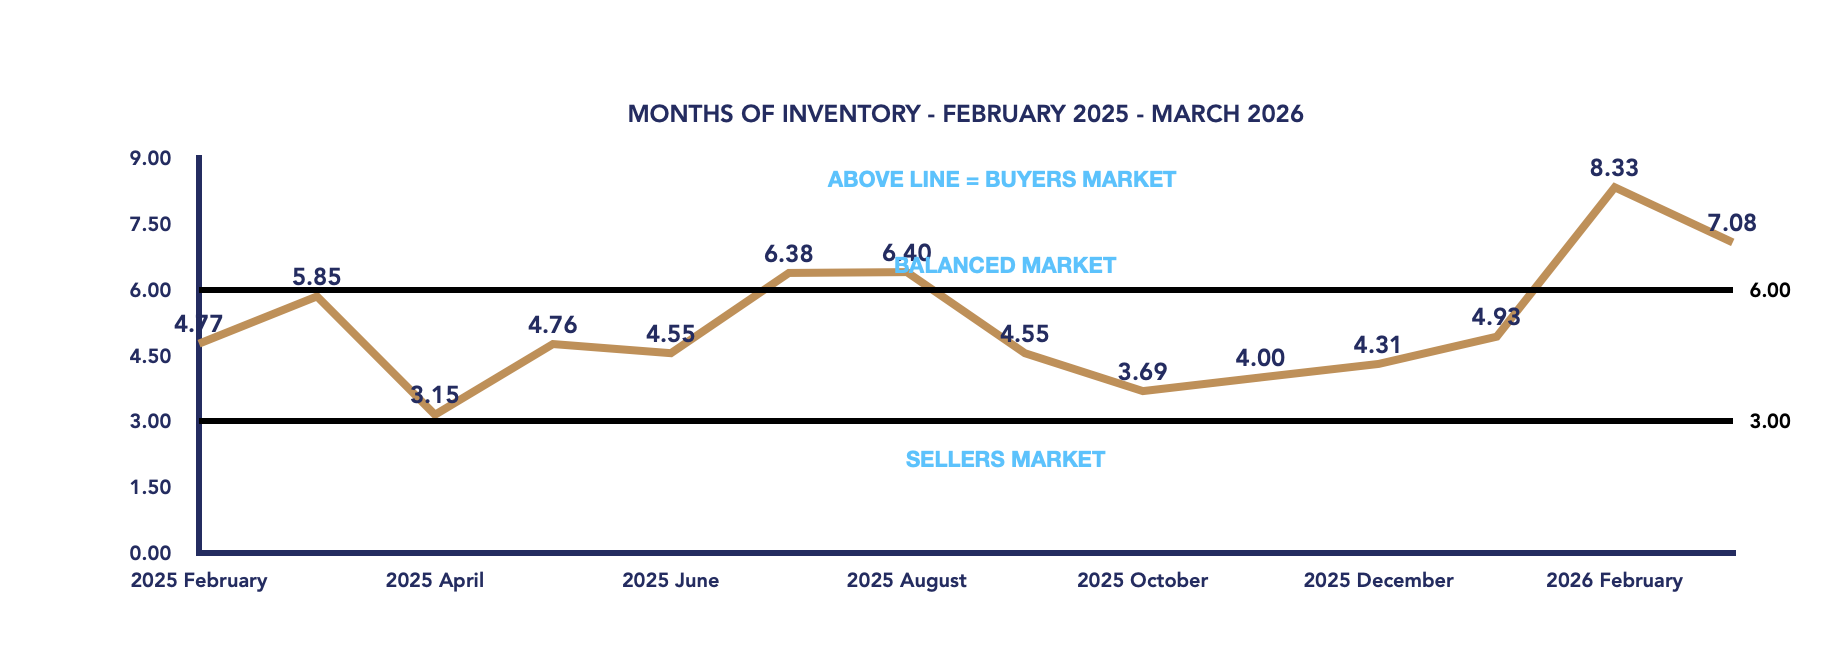
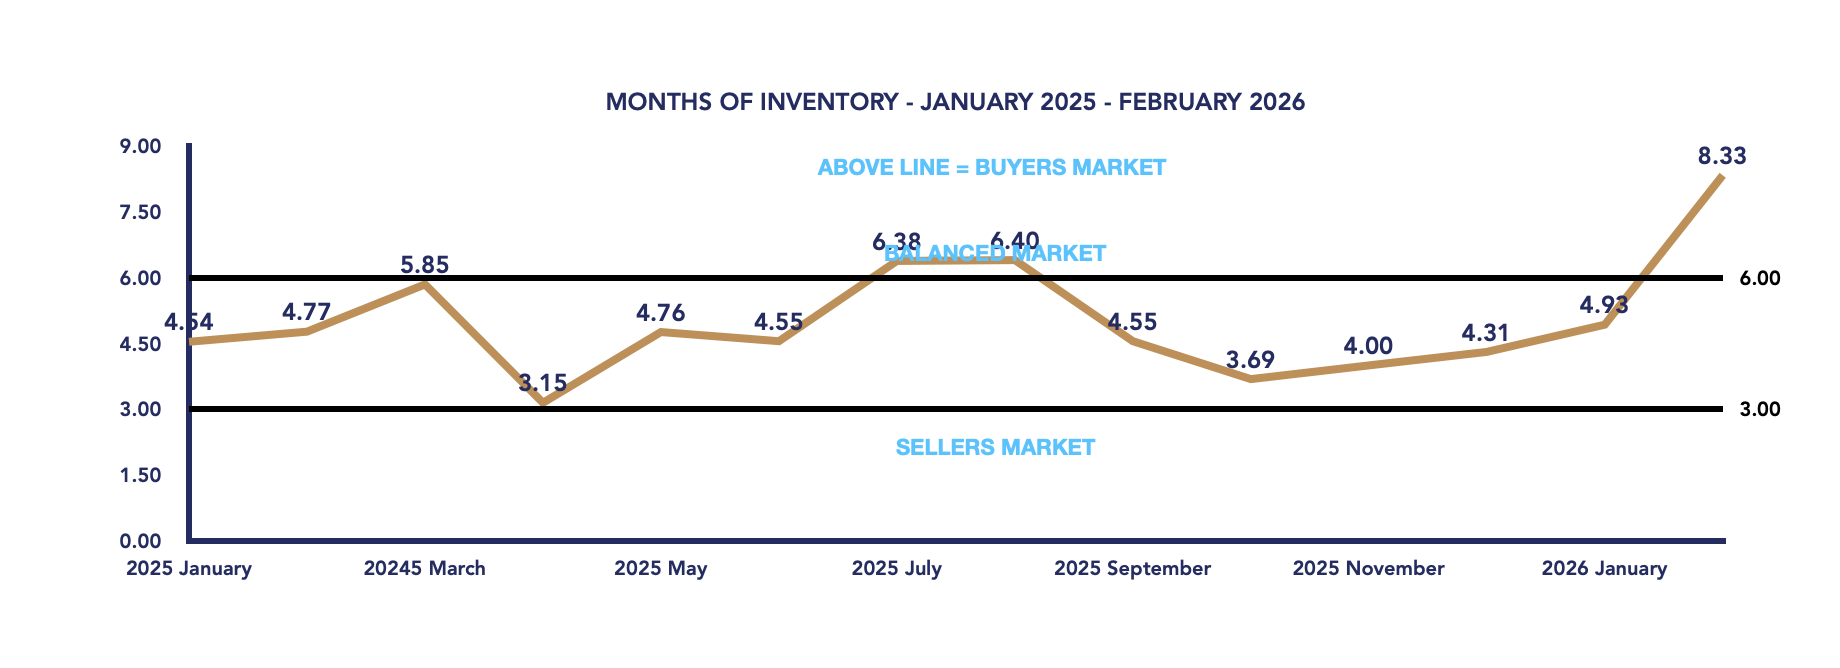
The months of inventory dipped slightly to 6.43, down from 7.08 in March, but still firmly within buyer’s market territory. While sales activity improved, it has not kept pace with the rapid increase in supply.
Days on Market
Homes in April took an average of 63 days to sell, an improvement from 75 days in March, indicating that while inventory is high, well-priced homes are attracting buyers more quickly as spring demand increases.
Key Takeaways
- Average prices declined sharply, influenced by a higher proportion of lower-priced sales.
- Sales activity increased, reflecting typical spring market momentum.
- Inventory surged, with a significant rise in both active and new listings.
- Sale-to-list ratio improved slightly, showing modest strengthening in seller positioning.
- Months of inventory remains elevated at 6.43, keeping Scugog in a buyer’s market.
- Homes are selling faster than last month, signaling improving buyer engagement.
Market Outlook
April 2026 highlights a market that is becoming more active but remains supply-heavy. While buyer interest is clearly increasing with the spring season, the large volume of listings continues to give buyers the upper hand.
If demand continues to strengthen in the coming months, the market could gradually move toward more balanced conditions. For now, buyers benefit from greater choice and negotiating power, while sellers must focus on competitive pricing and strong presentation to stand out in a crowded marketplace.
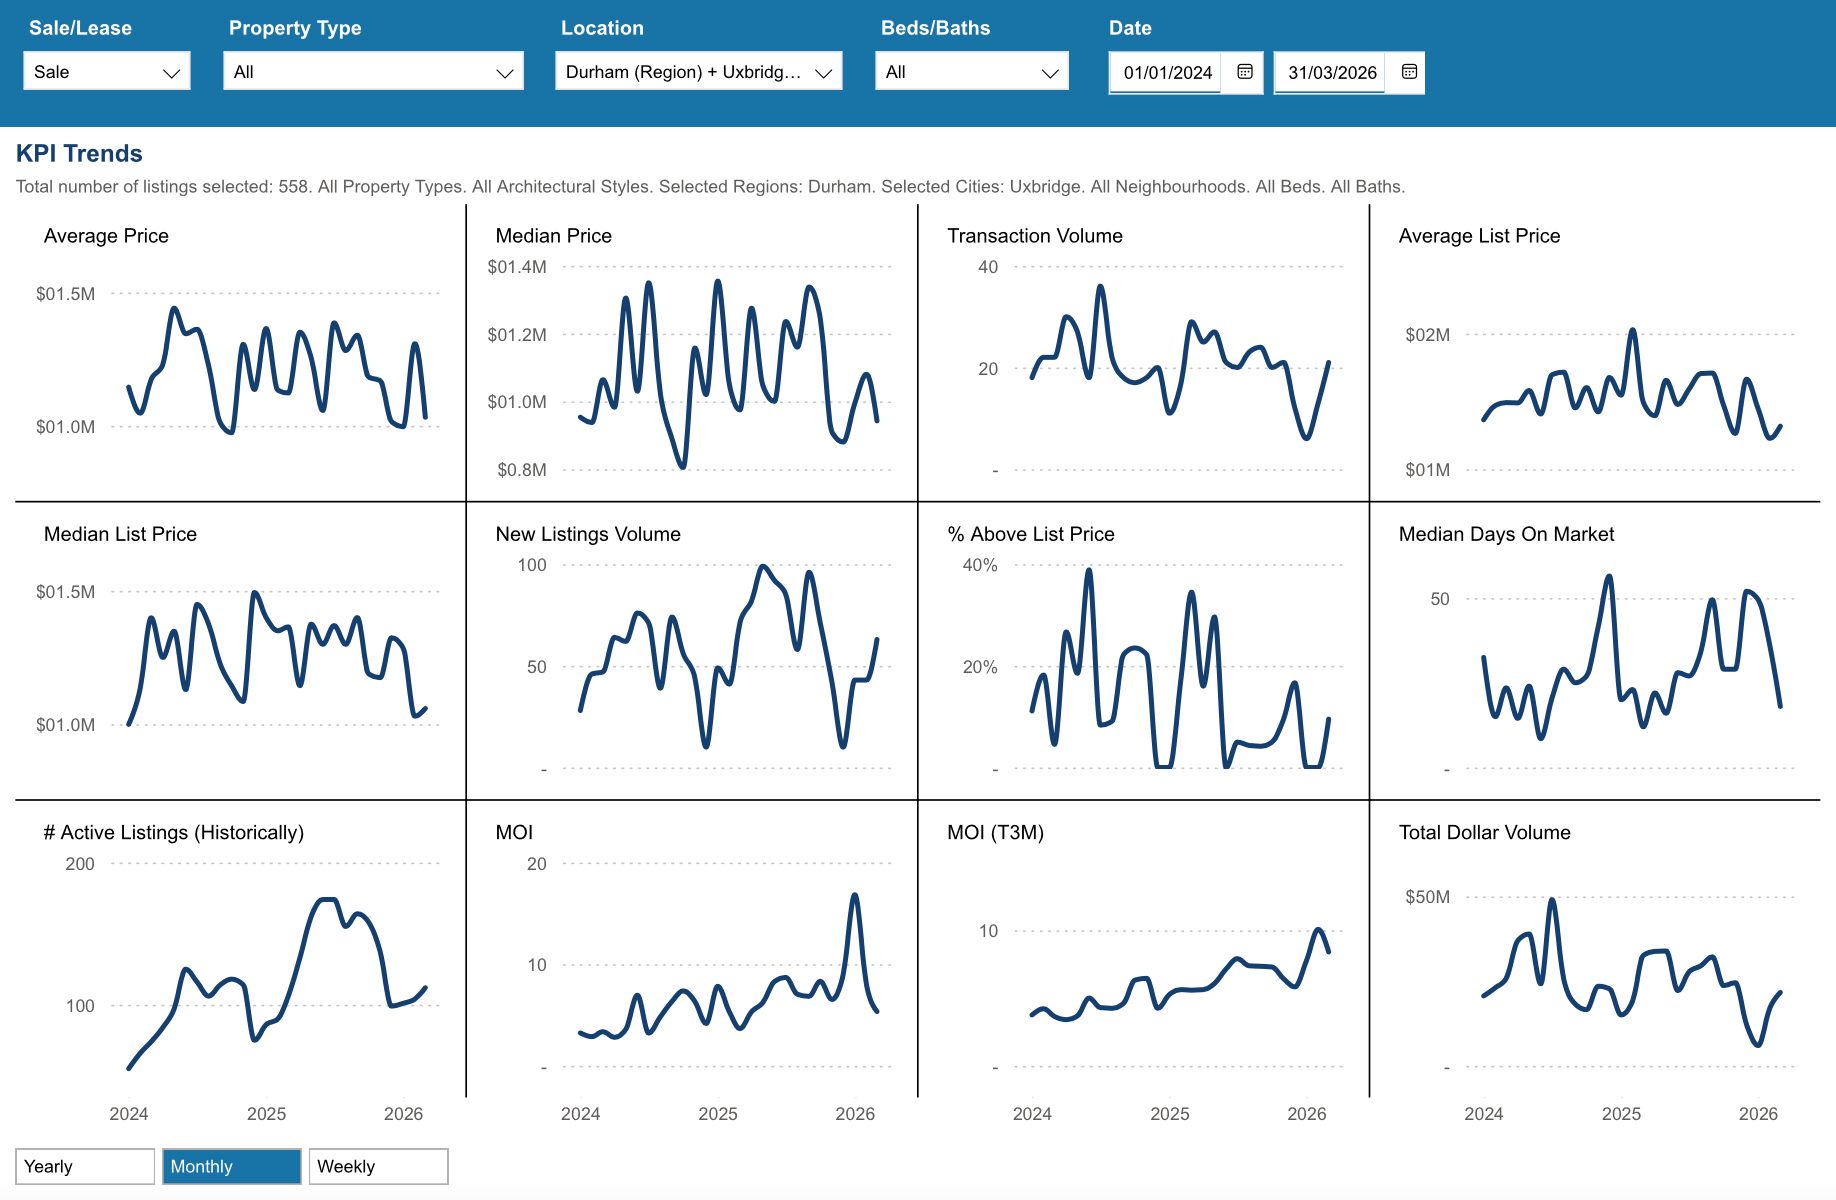
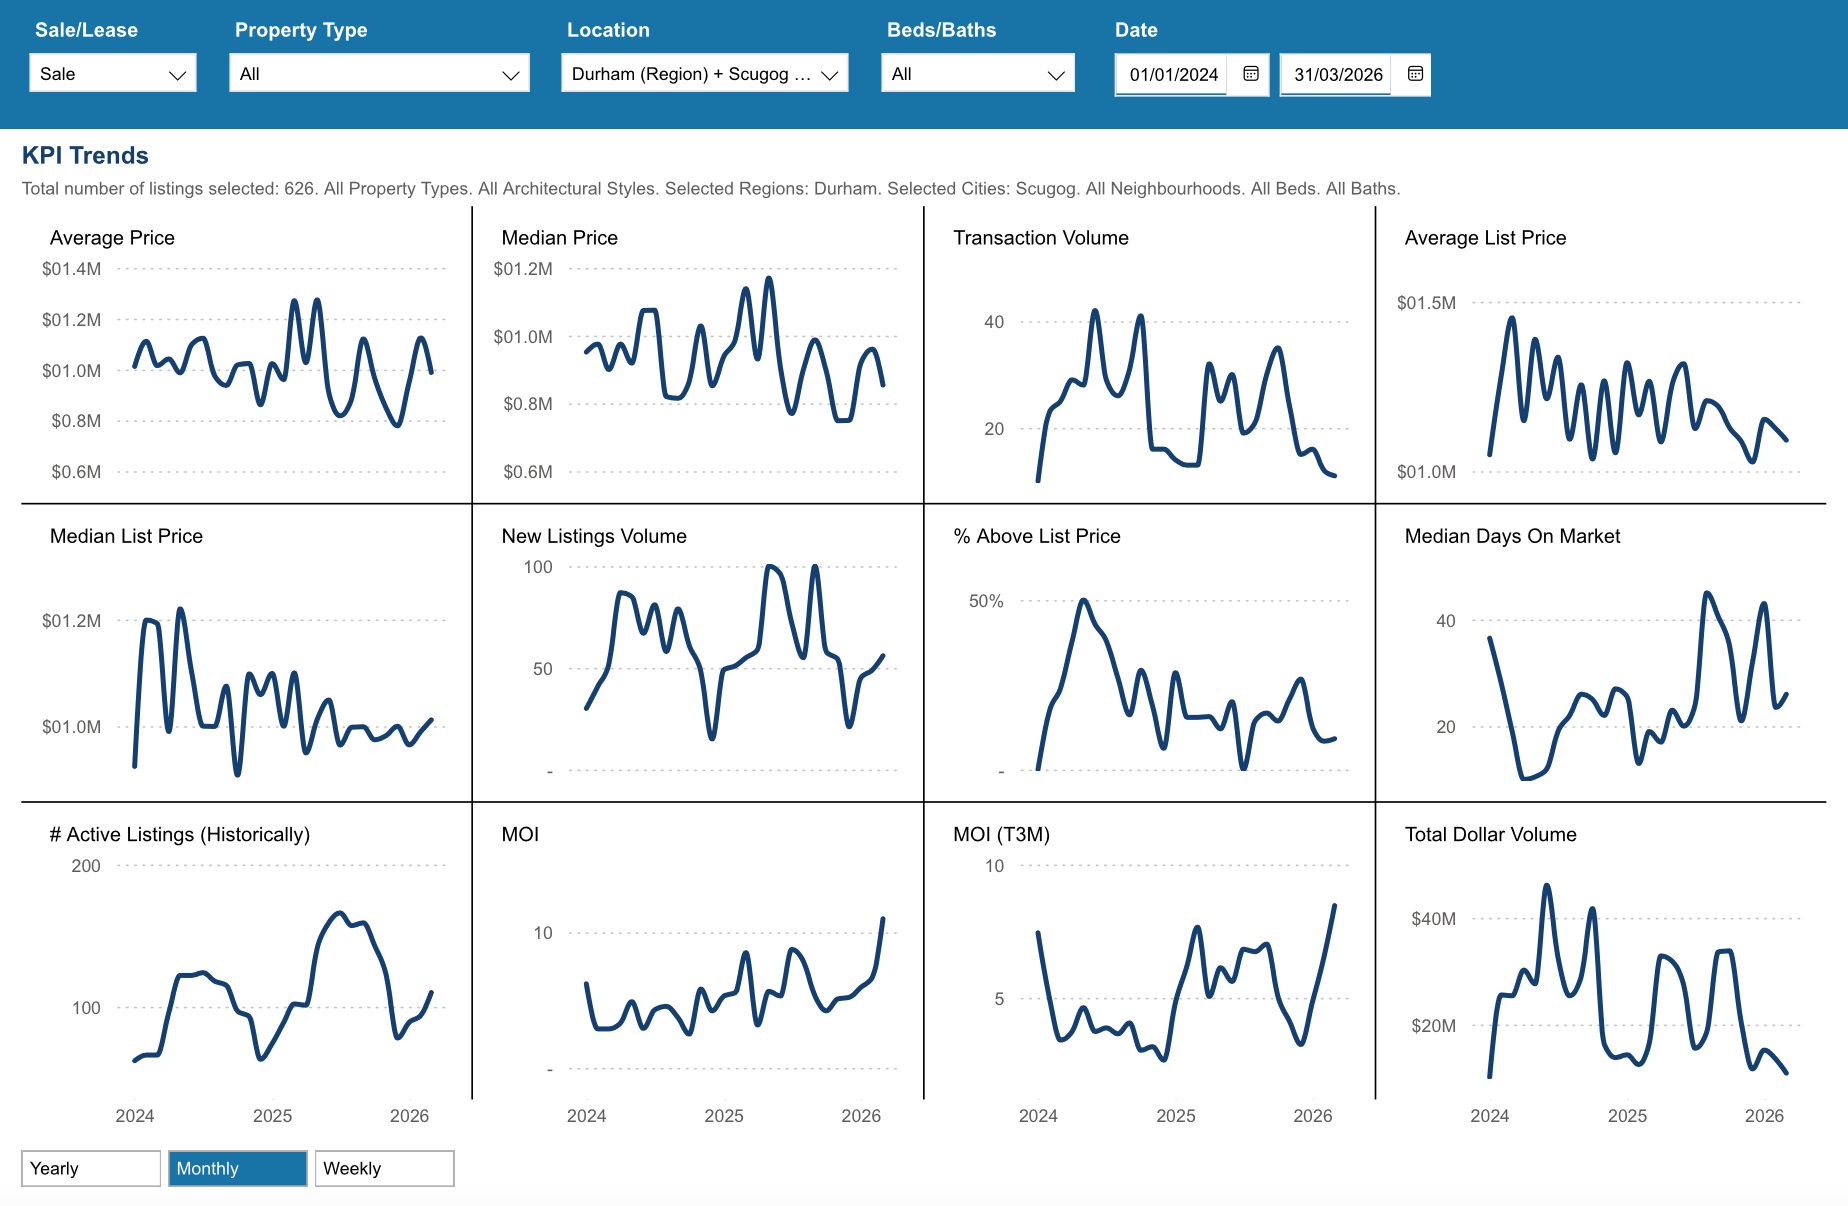
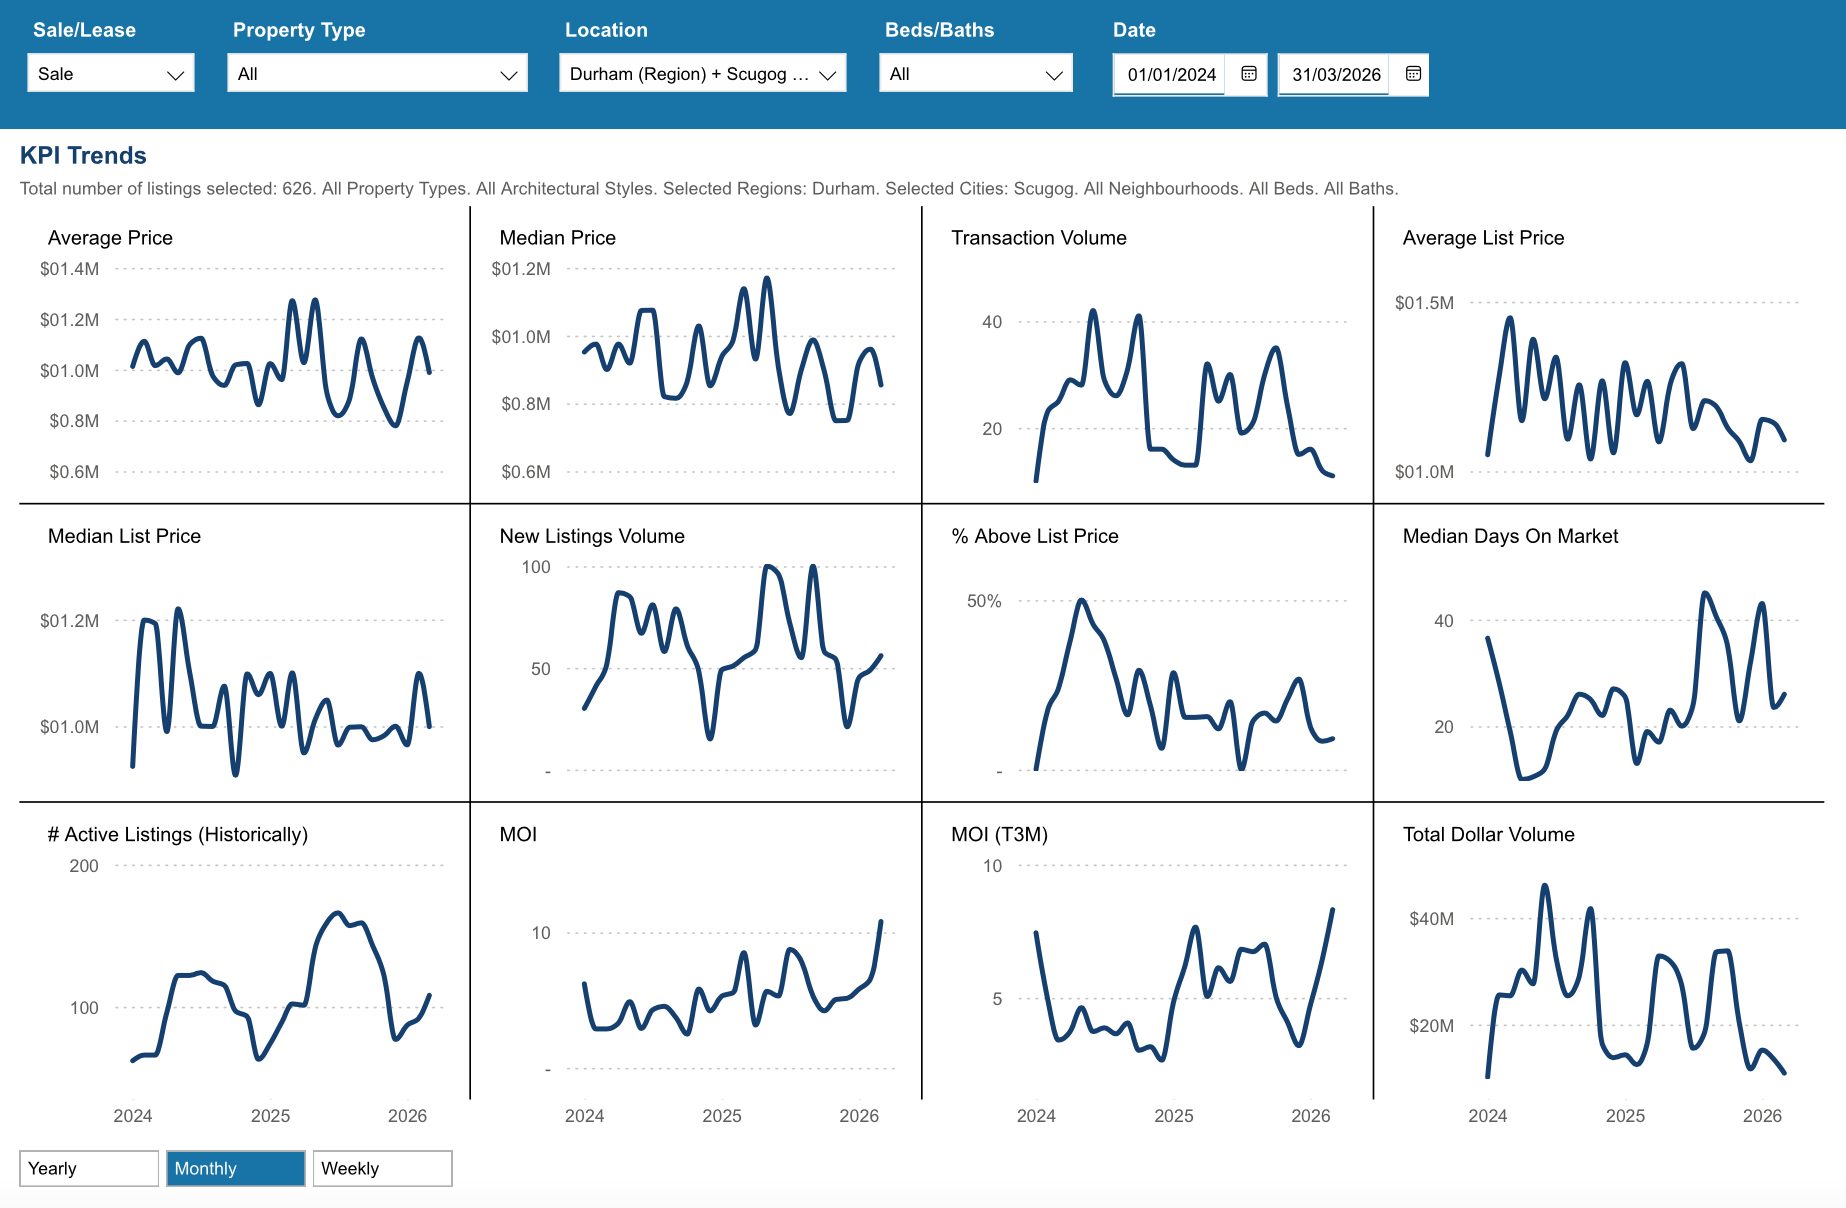
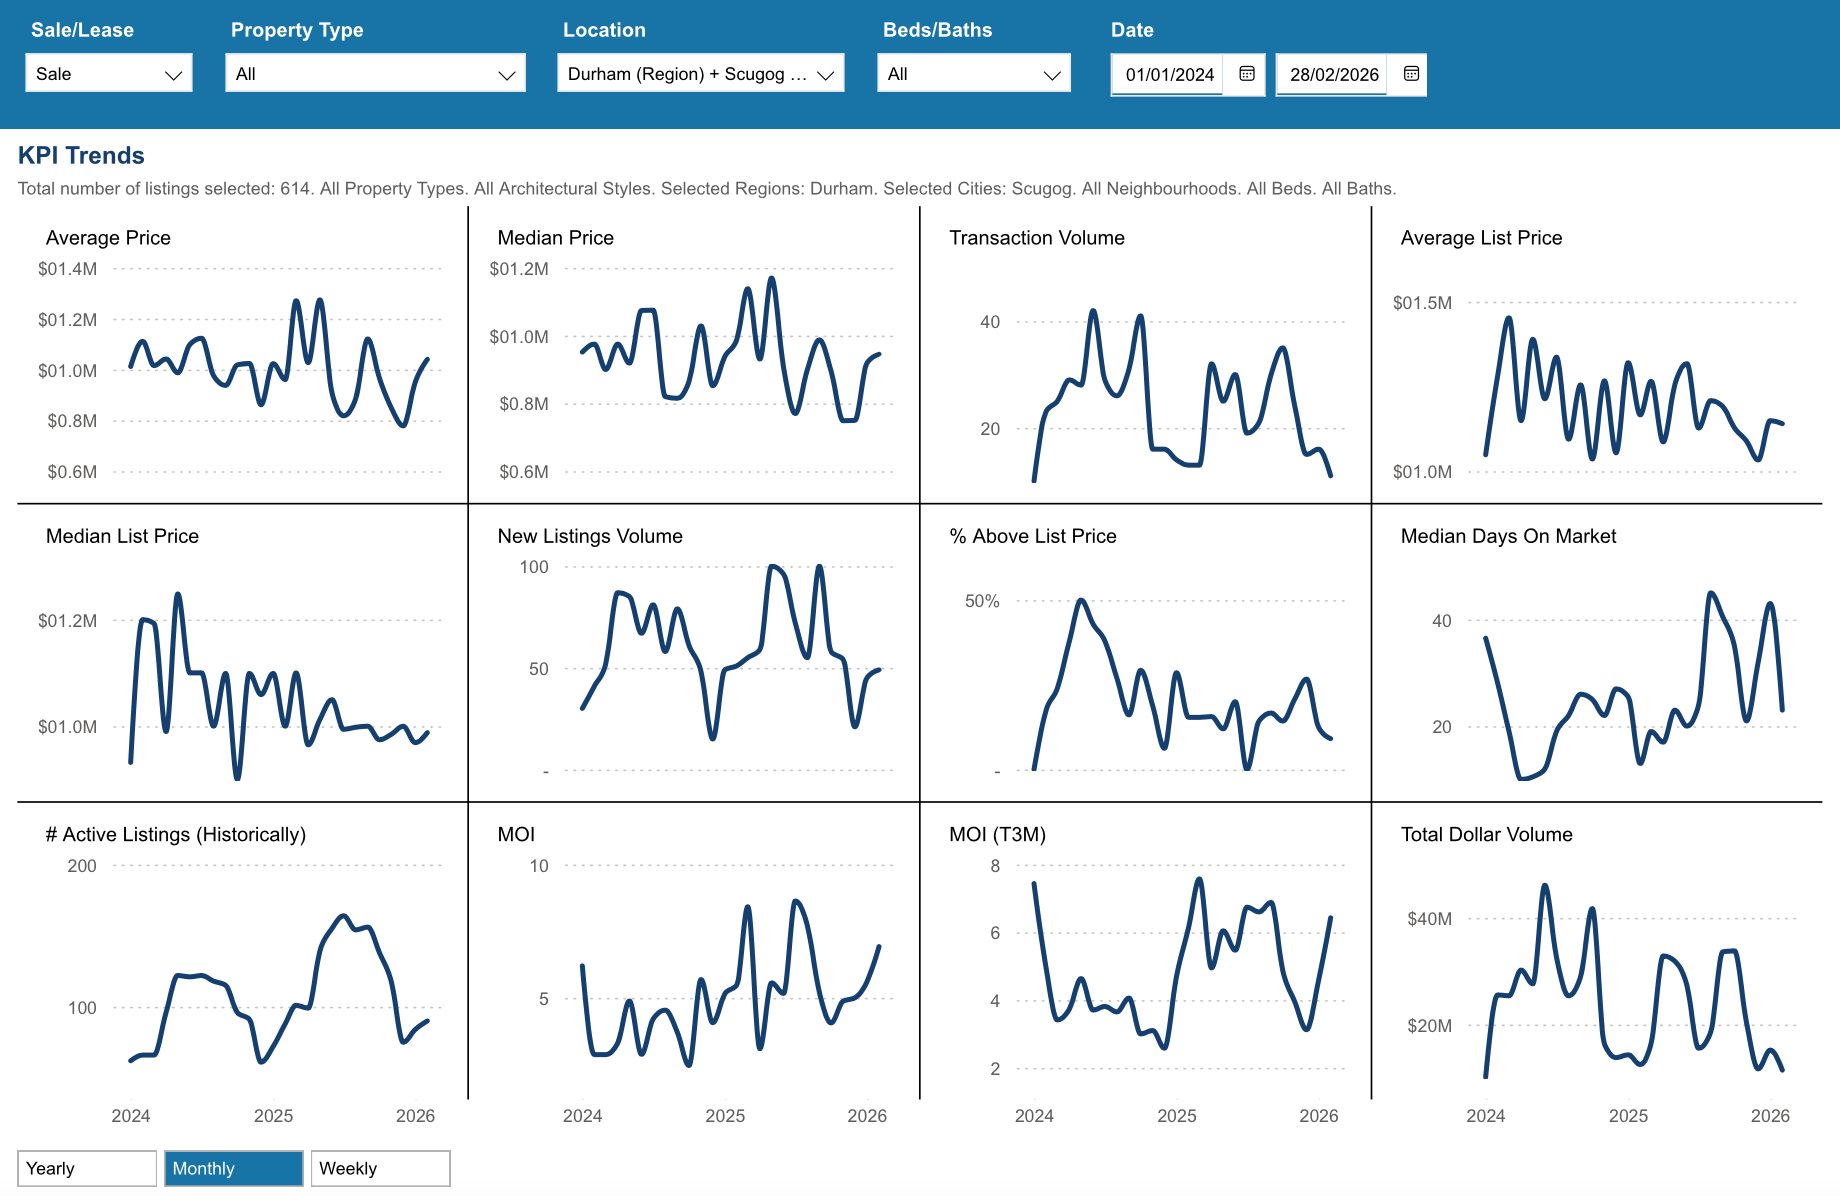
Key Performance Indicators (KPIs) from January 2024 through April 2026 provide a clear snapshot of how the Township of Scugog real estate market has evolved across all property types, architectural styles, and home configurations
WATCH OUR MONDAY MARKET MINUTES
*Information is believed to be accurate at time of posting but is not guaranteed to be correct. Some values may vary slightly based on the exact date and time the reports were generated. Market stats are provided by TRREB (Toronto Regional Real Estate Board) and are based on sales for the month of Attached/Row/Townhouses, Condo Apartments, Condo Townhouses, Detached, Detached with Common Elements, Link Homes and Semi-detached. *Some values may vary slightly based on the exact date and time the reports were generated.
Not intended as a solicitation if your property is already listed by another broker. Affiliated real estate agents are independent contractor sales associates, not employees. ©2021 Coldwell Banker. All Rights Reserved. Coldwell Banker and the Coldwell Banker logos are trademarks of Coldwell Banker Real Estate LLC. The Coldwell Banker® System is comprised of company owned offices which are owned by a subsidiary of Realogy Brokerage Group LLC and franchised offices which are independently owned and operated. The Coldwell Banker System fully supports the principles of the Fair Housing Act and the Equal Opportunity Act.
Click below for more reports
Check out our Uxbridge and Scugog Events Pages to keep up to date on whats going on around town. Click the links or scan the Code with your phone to take you directly there.
UXBRIDGE EVENTS
SCUGOG EVENTS
Brock Housing April 2026

Brock Housing April 2026
Each office is independently owned and operated
![]()
![]()
Housing Market Report for April 2026
Here is the Township of Brock Housing April 2026 report (all housing types), with reports from the Canadian Real Estate Association, and Toronto Regional Real Estate Board included.
This housing report for Durham Region includes the number of new listings, average list price, number of properties sold, average selling price, average days on market and average asking price to selling price ratio for all property types within the Region of Durham.
Scroll to the bottom for links to take you to the housing market reports for Durham Region, Uxbridge and Scugog.
![]()
![]()
From Toronto Regional Real Estate Board
Please note: The PropTx MLS® System, of which TRREB is a part, has added a number of new client boards over the last year. Many of these boards’ Members trade within the Greater Toronto Area and broader Greater Golden Horseshoe regions. As a result, historic data have been updated to reflect the addition of these boards’ listings and transactions. This means historic data have changed relative to previously published static reports. To view updated historic data, click here.
Toronto Regional Real Estate Board – Market Stats At A Glance – April 2026
Read the Toronto Regional Real Estate Board Market Watch Report
![]()
Brock Township Real Estate Market Analysis – April 2026
The Brock Township real estate market experienced a sharp shift in April 2026, with rising prices contrasted by a significant drop in sales activity and a surge in inventory. While average prices increased, the overall market conditions moved deeper into buyer’s market territory, driven by limited transactions and growing supply.
April 2026
March 2026
Average Sale Price Increases – Influenced by One High Sale
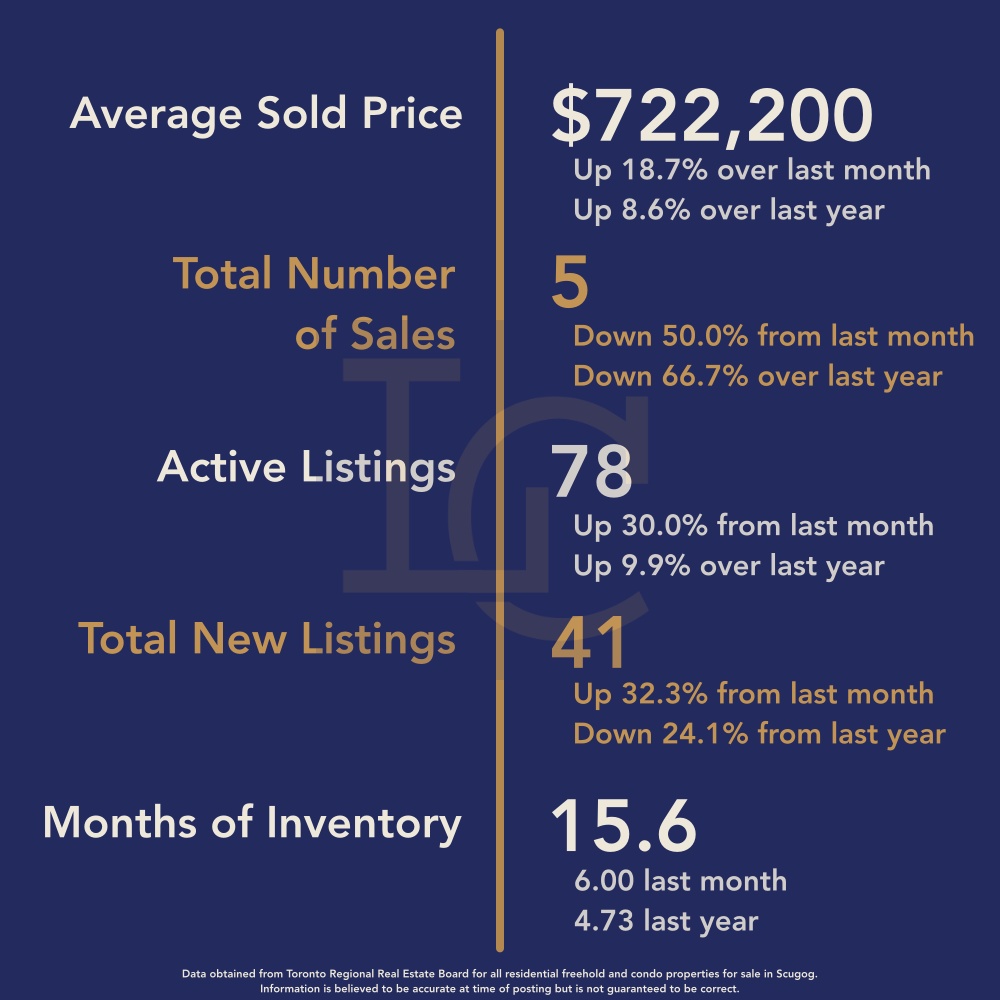
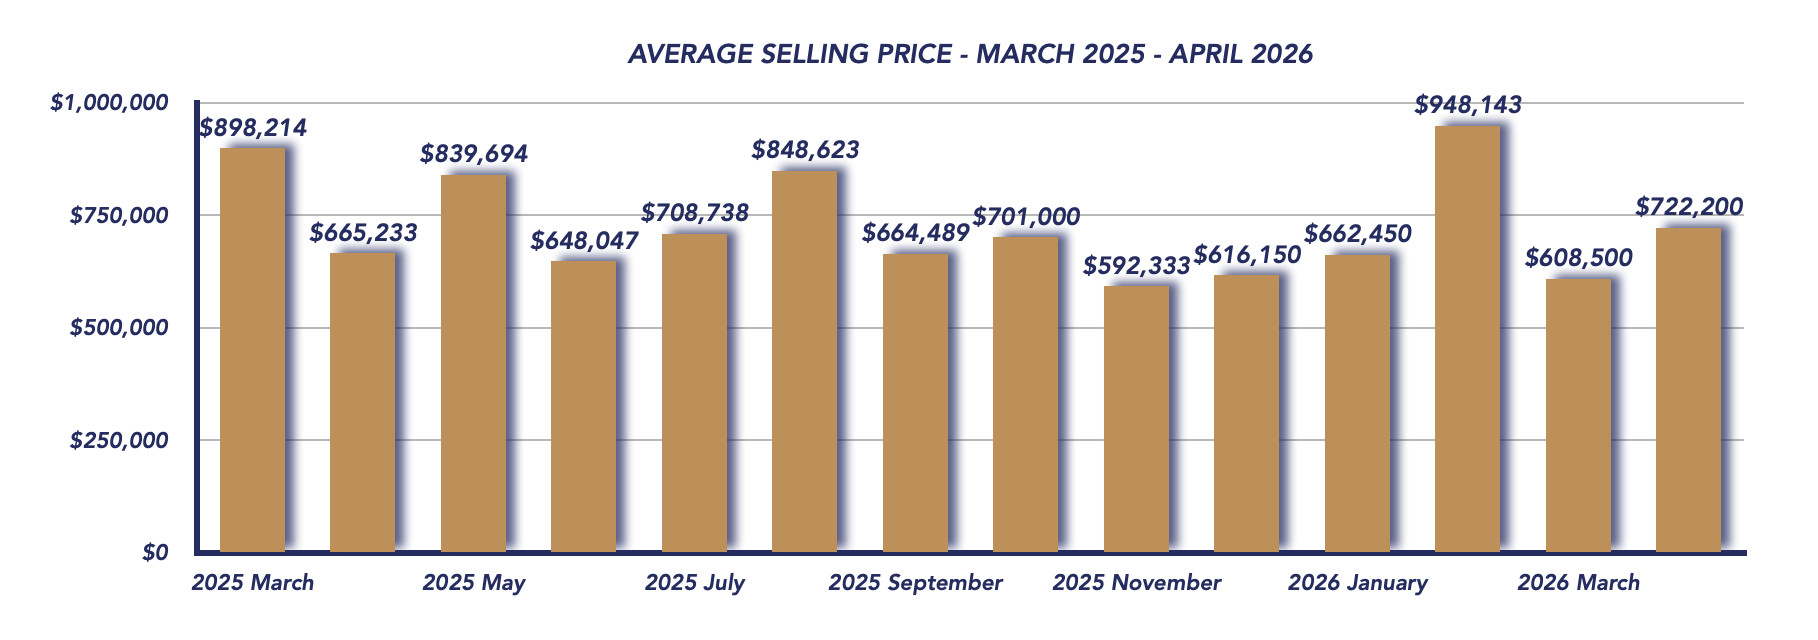
The average sale price in April 2026 was $722,200, representing:
- An 18.7% increase from March 2026 ($608,500)
- An 8.6% increase from April 2025 ($665,233)
However, this increase should be viewed with caution. In March, the highest sale was $770,000, with only two properties selling above $700,000.
In April, one property sold for $1,071,000, while the remaining four properties sold for under $675,000. This single higher-end transaction had a noticeable impact on the monthly average, similar to patterns seen in previous months.
Sales Activity Drops Significantly
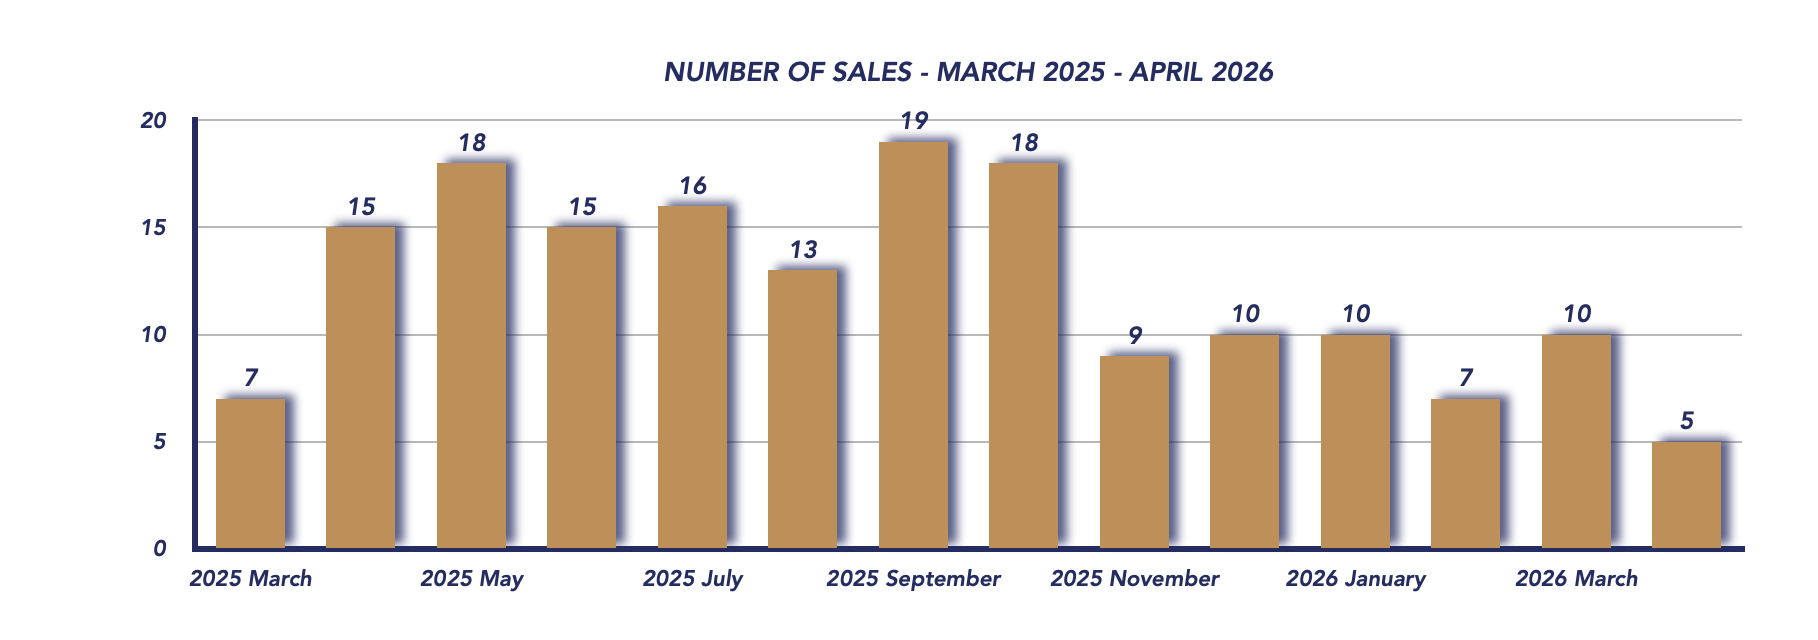
Only 5 homes sold in April 2026, a sharp decline from:
- 10 sales in March 2026, and
- 15 sales in April 2025
This drop in sales is one of the most notable changes this month and reflects either reduced buyer activity or hesitation amid increasing inventory and market uncertainty.
Sale-to-List Price Ratio Strengthens
The sale-to-list price ratio rose slightly to 98%, up from 97% in March and consistent with April 2025.
This suggests that despite fewer transactions, well-priced homes are still attracting strong offers, and serious buyers remain active when value is evident.
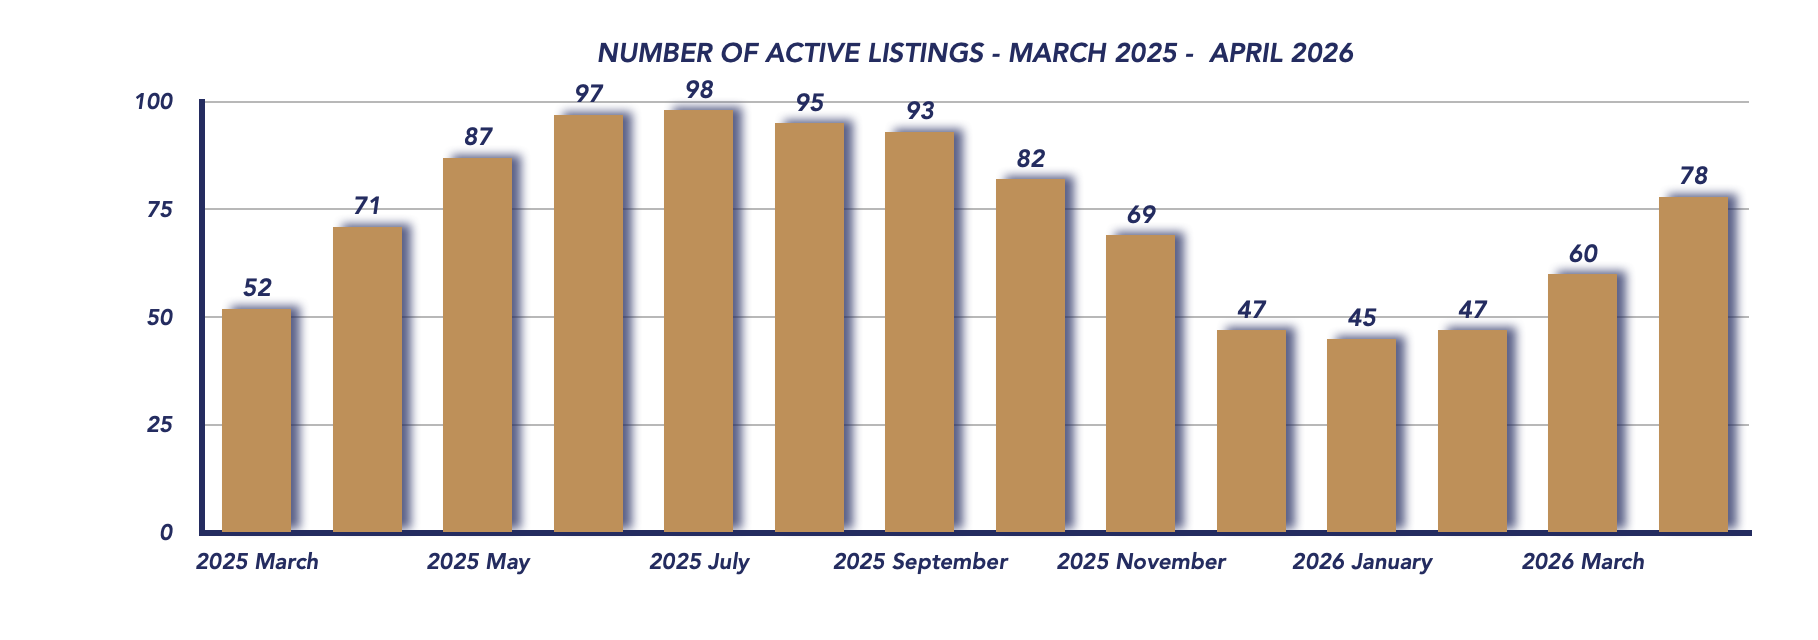
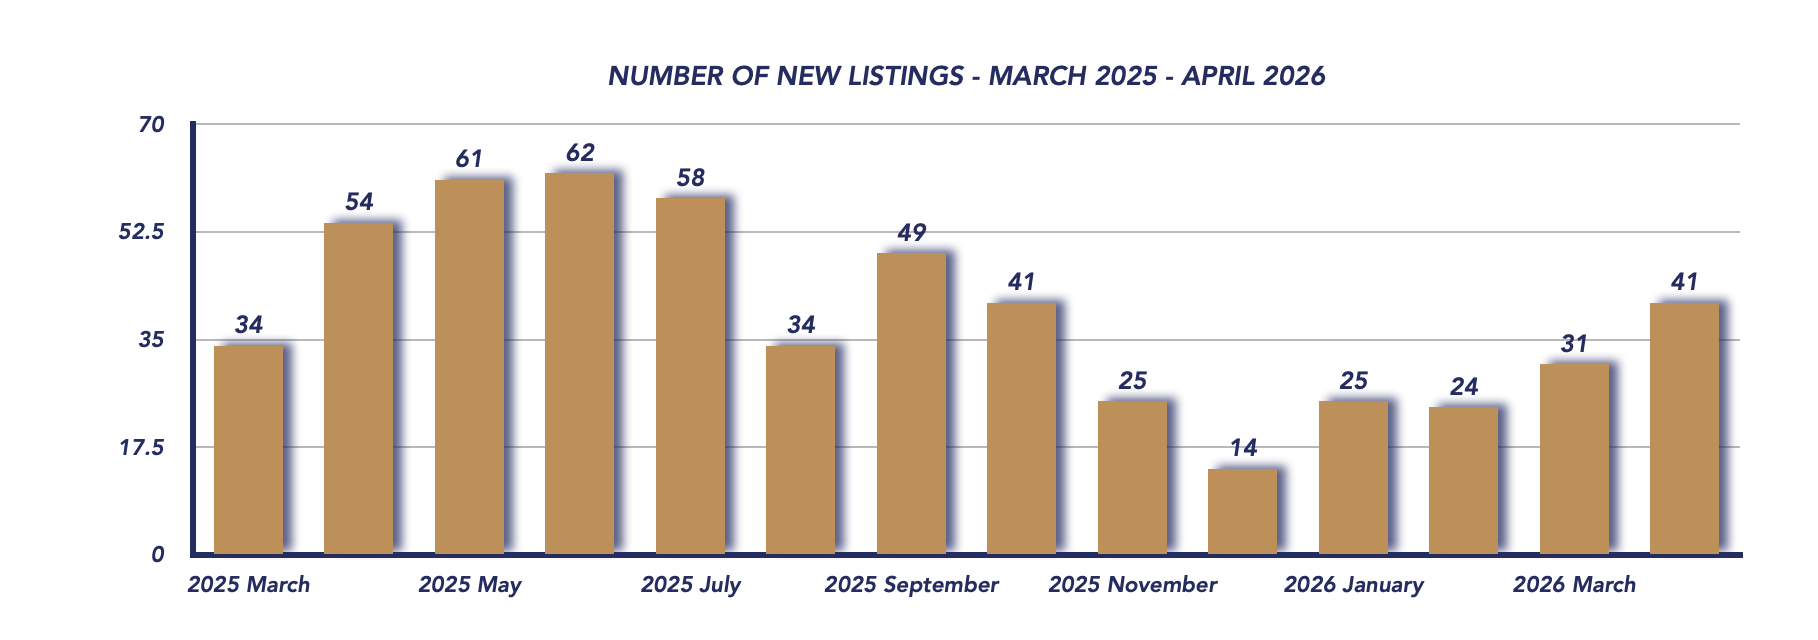
Inventory Surges
Supply increased substantially in April:
- Active listings: 78 (up from 60 in March and 71 last year)
- New listings: 41 (up from 31 last month, though below 54 last year)
The jump in listings, combined with fewer sales, has created a widening gap between supply and demand.
Days on Market & Buyer’s Market Conditions
Homes sold quickly when they did transact, with an average of just 22 days on market, indicating that properly priced homes are still moving efficiently.
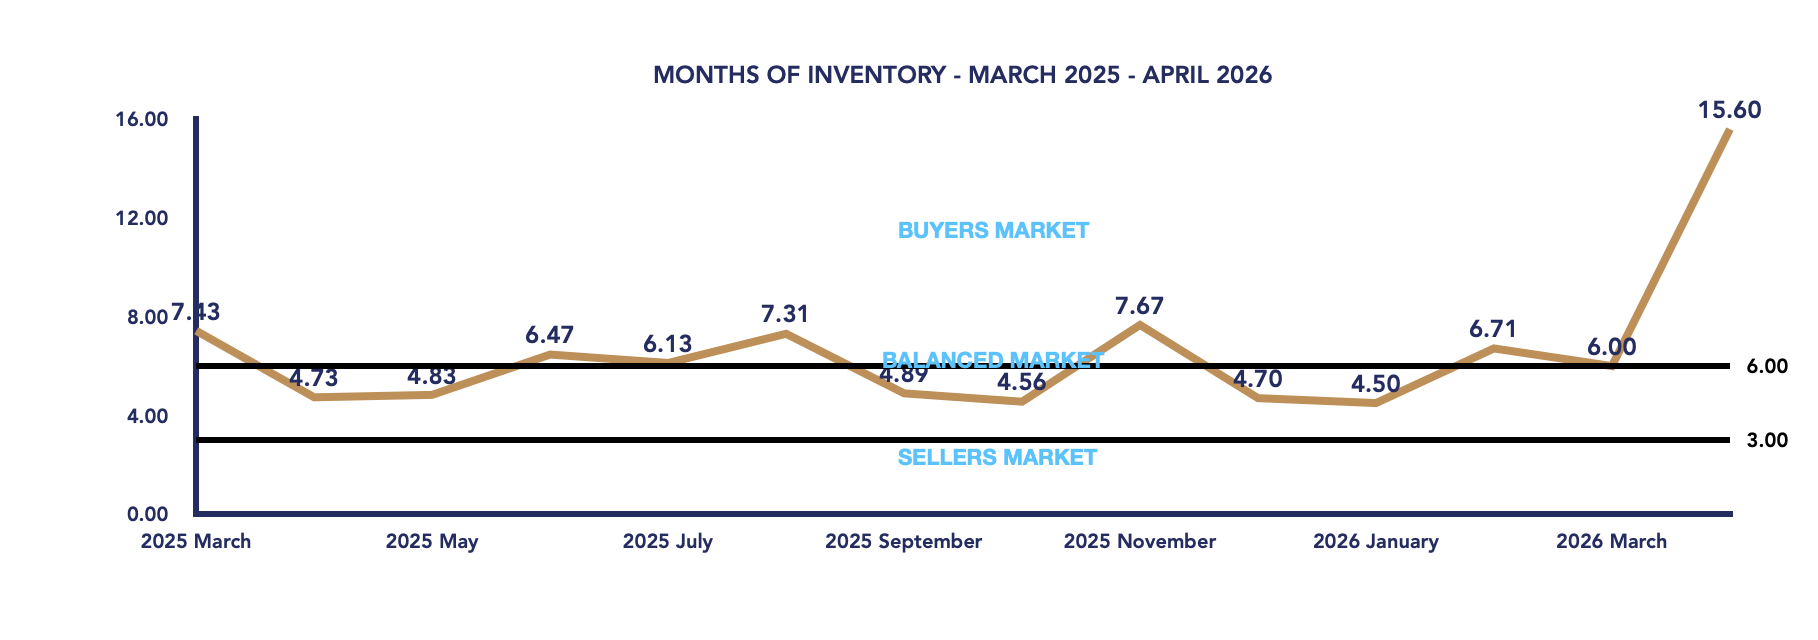
However, the key story lies in months of inventory, which surged to:
- 15.6 months, up dramatically from 6.00 in March
This substantial increase places Brock Township firmly into a deep buyer’s market, where supply significantly outweighs demand and buyers have considerable negotiating power.
Conclusion
April 2026 highlights a market in transition. While average prices rose, largely influenced by a single higher-end sale, the sharp drop in sales and surge in inventory tell a different story—one of slowing demand and increasing supply.
For buyers, this presents a strong opportunity with more choice and leverage than we’ve seen in recent months. For sellers, success will depend on competitive pricing, strong presentation, and patience as the market adjusts.
As we move further into the spring market, the key question will be whether buyer activity increases to absorb the growing inventory, or if these buyer-favourable conditions persist into the summer months.
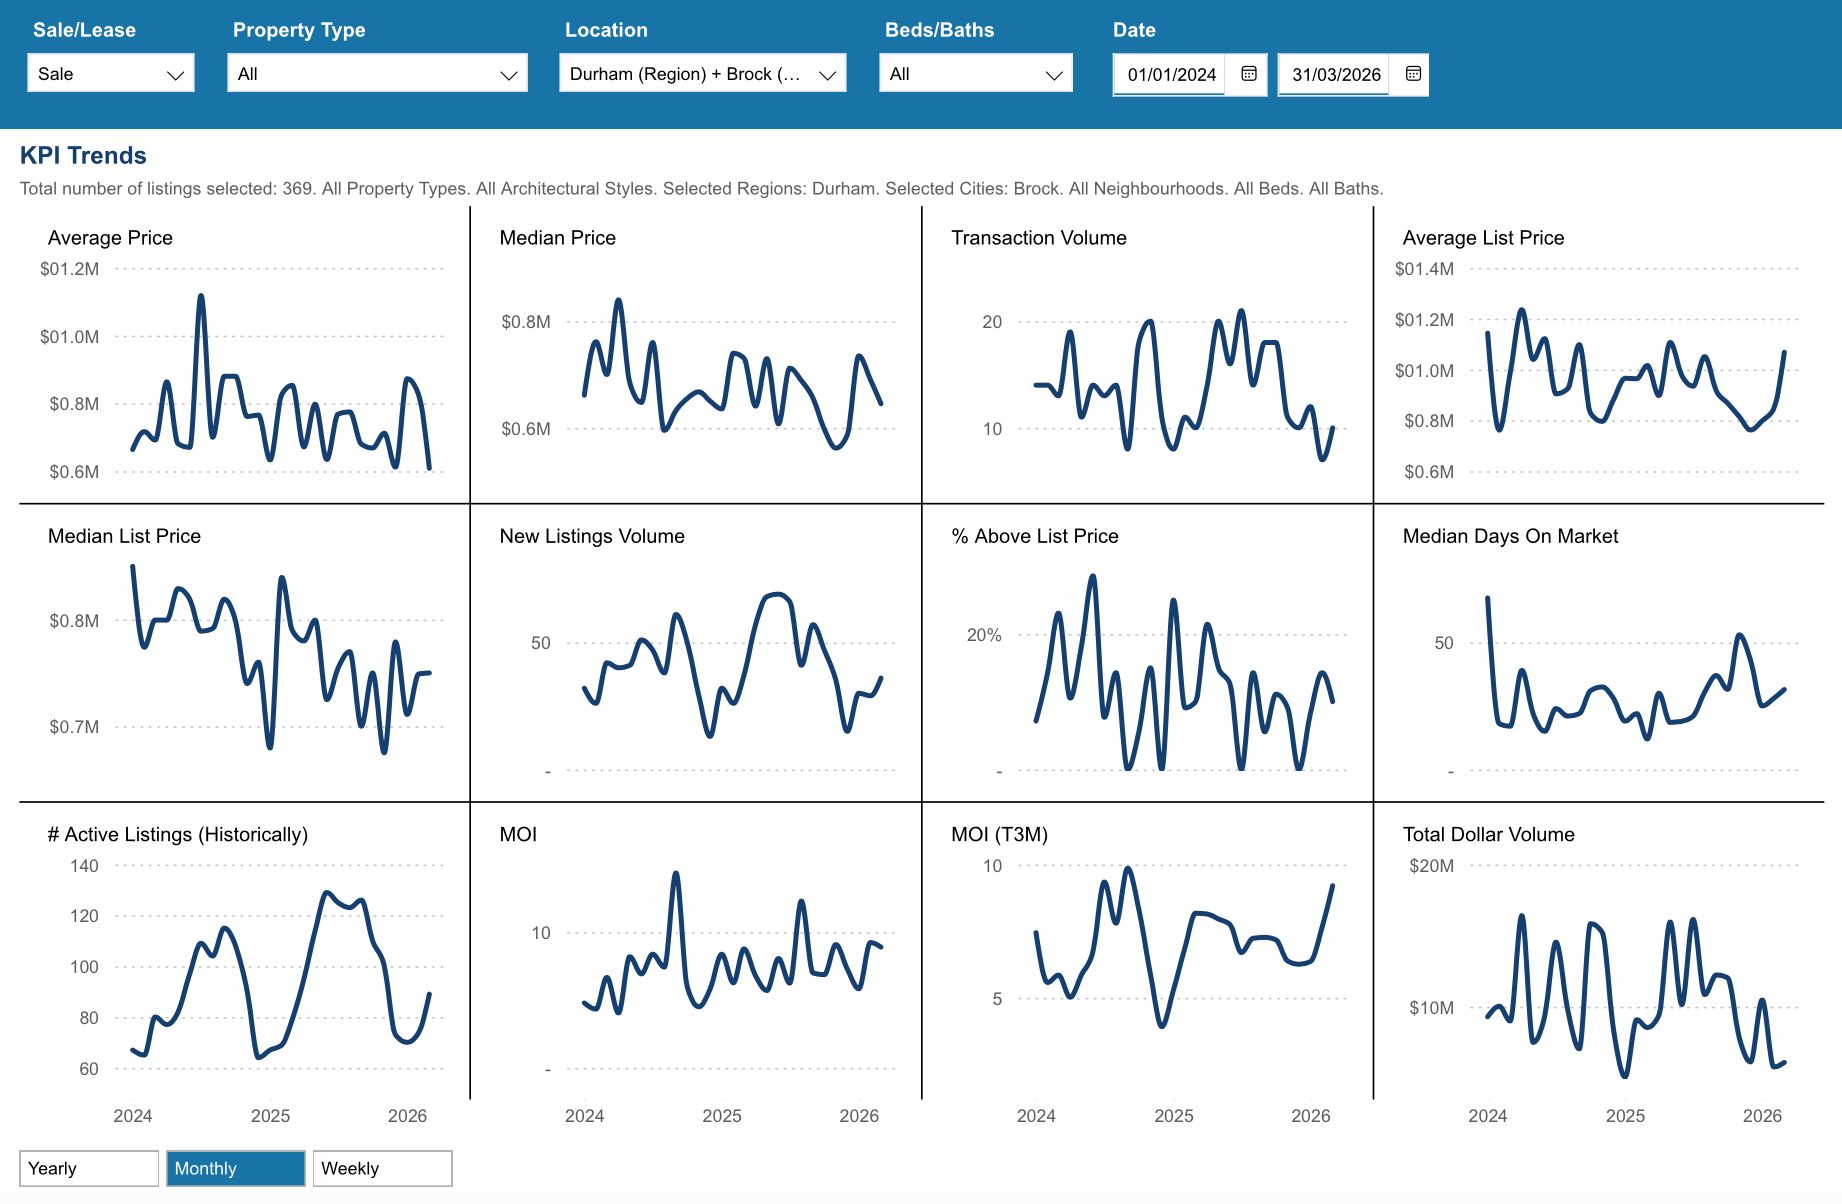
Key Performance Indicators (KPIs) from January 2024 through April 2026 provide a clear snapshot of how the Township of Brock real estate market has evolved across all property types, architectural styles, and home configurations
*Information is believed to be accurate at time of posting but is not guaranteed to be correct. Some values may vary slightly based on the exact date and time the reports were generated. Market stats are provided by TRREB (Toronto Regional Real Estate Board) and are based on sales for the month of Attached/Row/Townhouses, Condo Apartments, Condo Townhouses, Detached, Detached with Common Elements, Link Homes and Semi-detached. *Some values may vary slightly based on the exact date and time the reports were generated.
Not intended as a solicitation if your property is already listed by another broker. Affiliated real estate agents are independent contractor sales associates, not employees. ©2021 Coldwell Banker. All Rights Reserved. Coldwell Banker and the Coldwell Banker logos are trademarks of Coldwell Banker Real Estate LLC. The Coldwell Banker® System is comprised of company owned offices which are owned by a subsidiary of Realogy Brokerage Group LLC and franchised offices which are independently owned and operated. The Coldwell Banker System fully supports the principles of the Fair Housing Act and the Equal Opportunity Act.
Click below for more reports
Check out our Uxbridge and Scugog Events Pages to keep up to date on whats going on around town. Click the links or scan the Code with your phone to take you directly there.
UXBRIDGE EVENTS
SCUGOG EVENTS
Durham Region Housing April 2026

Durham Region Housing April 2026
Each office is independently owned and operated
![]()
![]()
Housing Market Report for April 2026
Here is the Region of Durham Housing April 2026 report (all housing types), with reports from the Canadian Real Estate Association, and Toronto Regional Real Estate Board included.
This housing report for Durham Region includes the number of new listings, average list price, number of properties sold, average selling price, average days on market and average asking price to selling price ratio for all property types within the Region of Durham.
Scroll to the bottom for links to take you to the housing market reports for Uxbridge, Scugog and Brock.
![]()
![]()
From Toronto Regional Real Estate Board
Please note: The PropTx MLS® System, of which TRREB is a part, has added a number of new client boards over the last year. Many of these boards’ Members trade within the Greater Toronto Area and broader Greater Golden Horseshoe regions. As a result, historic data have been updated to reflect the addition of these boards’ listings and transactions. This means historic data have changed relative to previously published static reports. To view updated historic data, click here.
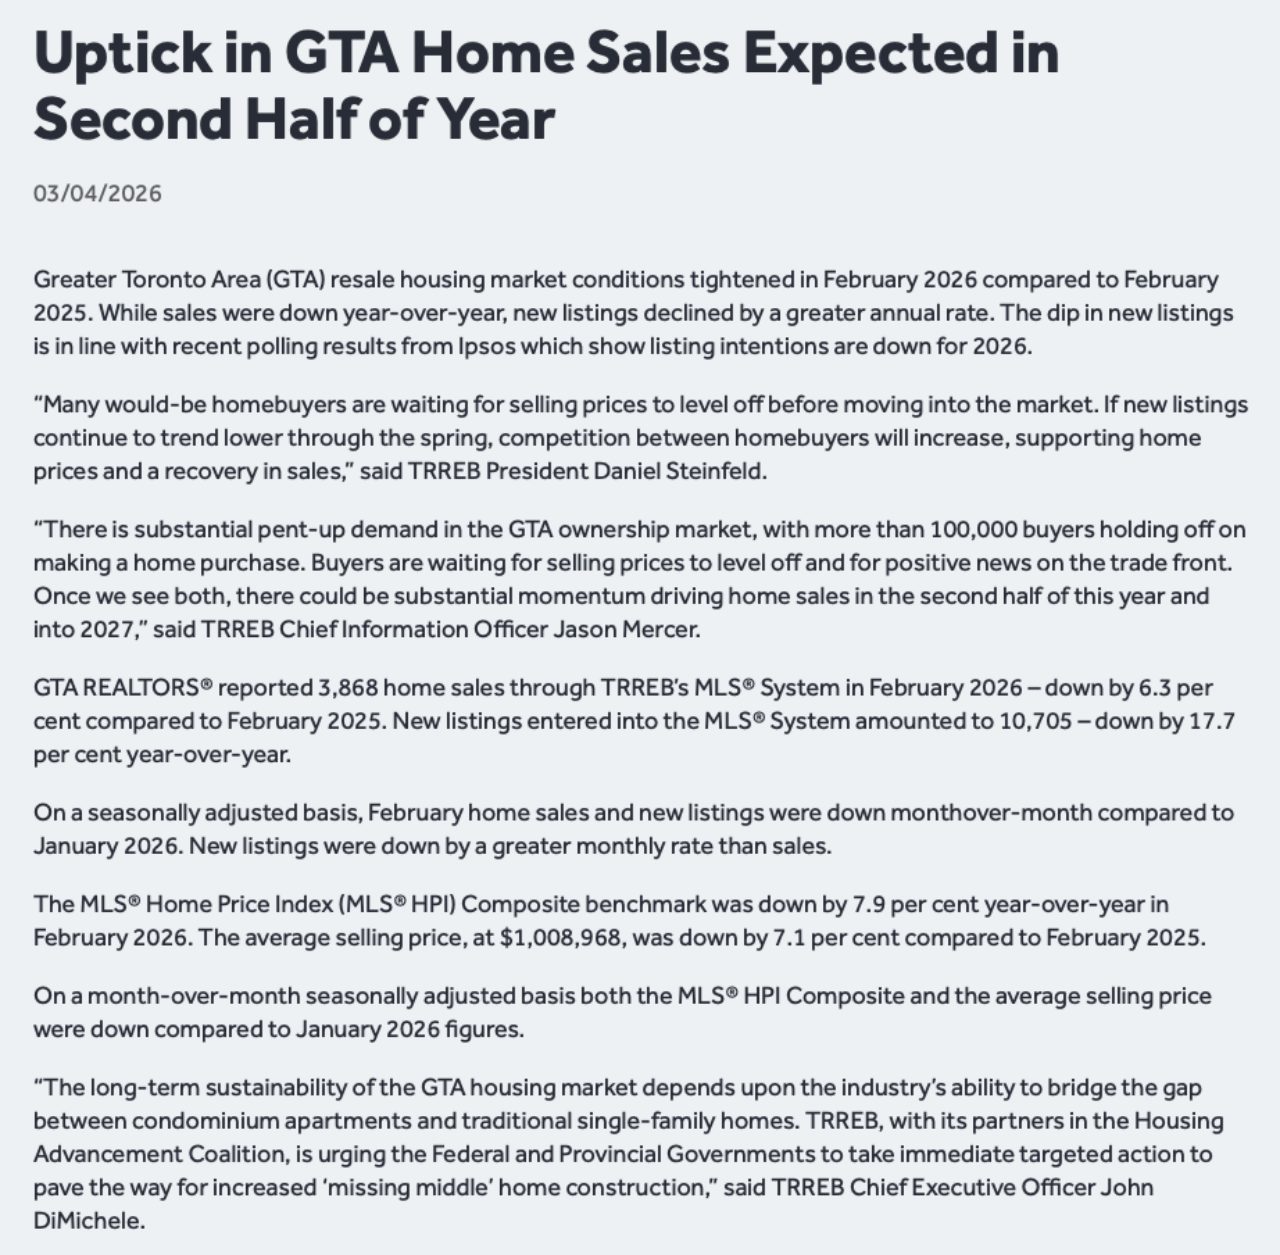
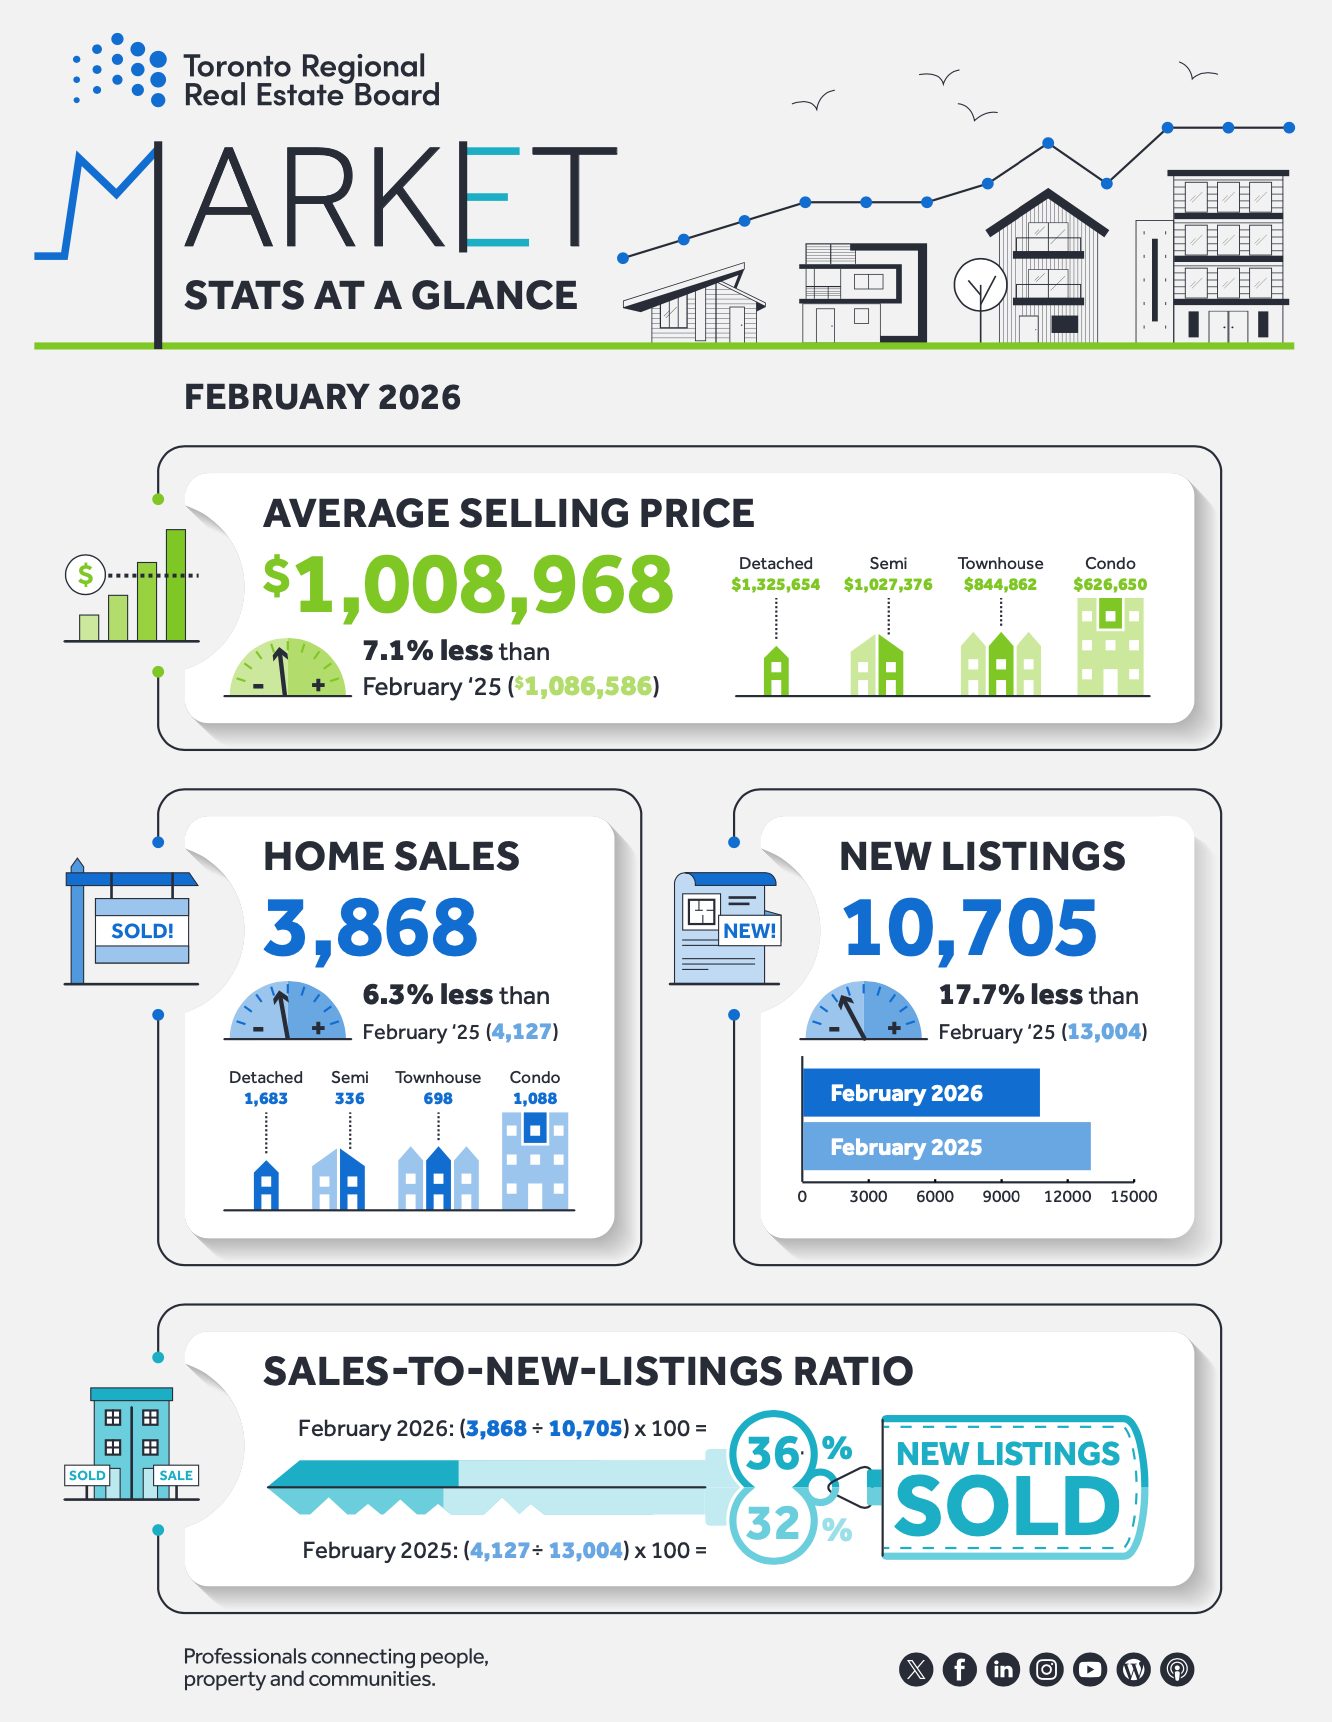
Toronto Regional Real Estate Board – Market Stats At A Glance – April 2026
Read the Toronto Regional Real Estate Board Market Watch Report
![]()
Durham Region Real Estate Market Analysis – April 2026
The Durham Region housing market continued to gain momentum in April 2026, with prices edging higher, sales activity increasing, and homes selling more quickly. At the same time, a rise in new listings helped ease some of the pressure seen in March, nudging the market back toward balanced territory. While year-over-year comparisons remain softer, the overall trend points to a more active and stable spring market.
April 2026
March 2026
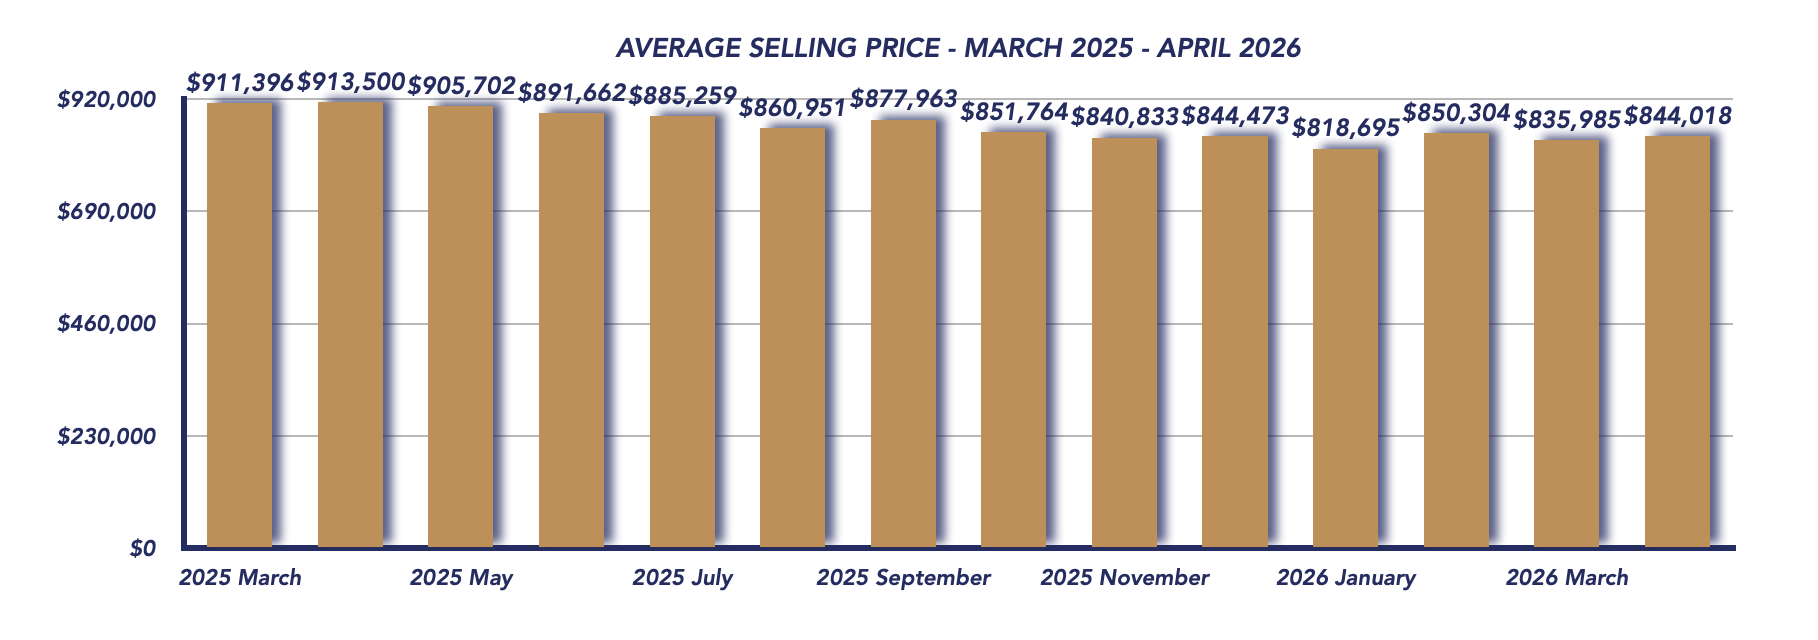
Average Sale Price Sees Modest Increase
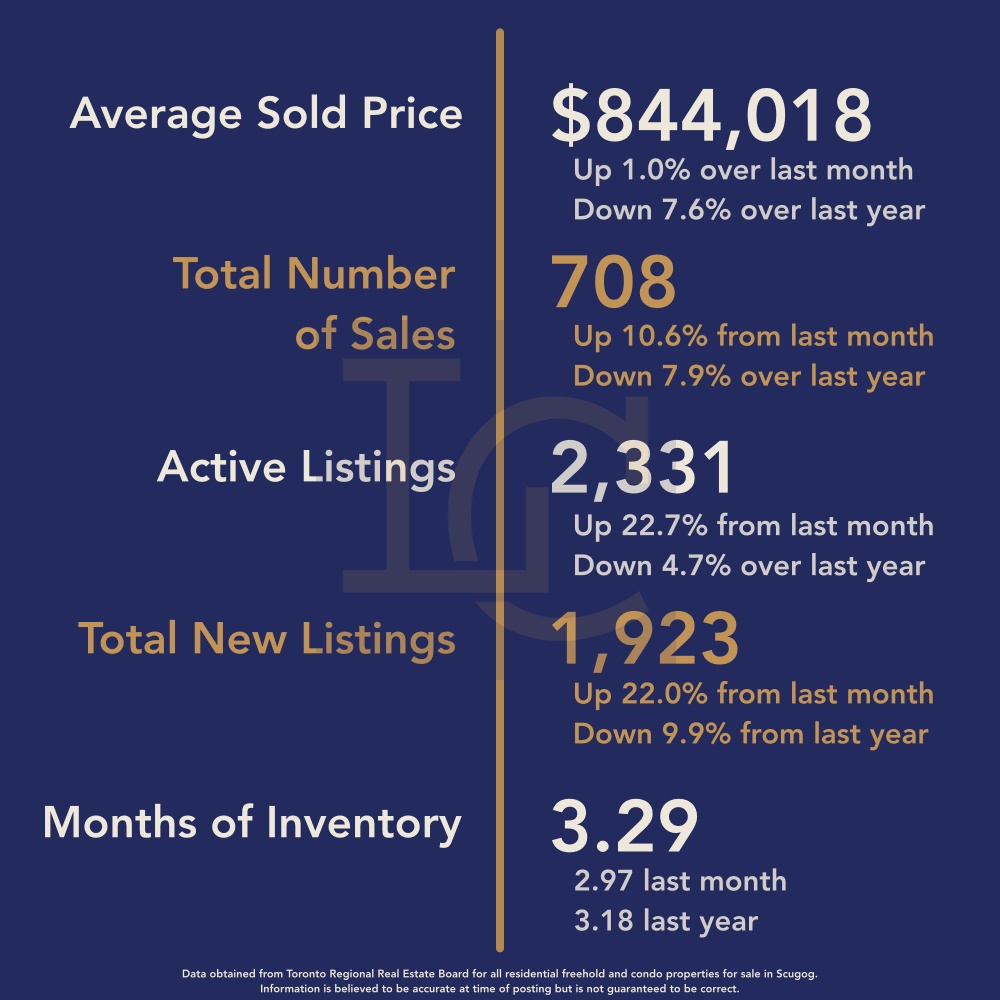
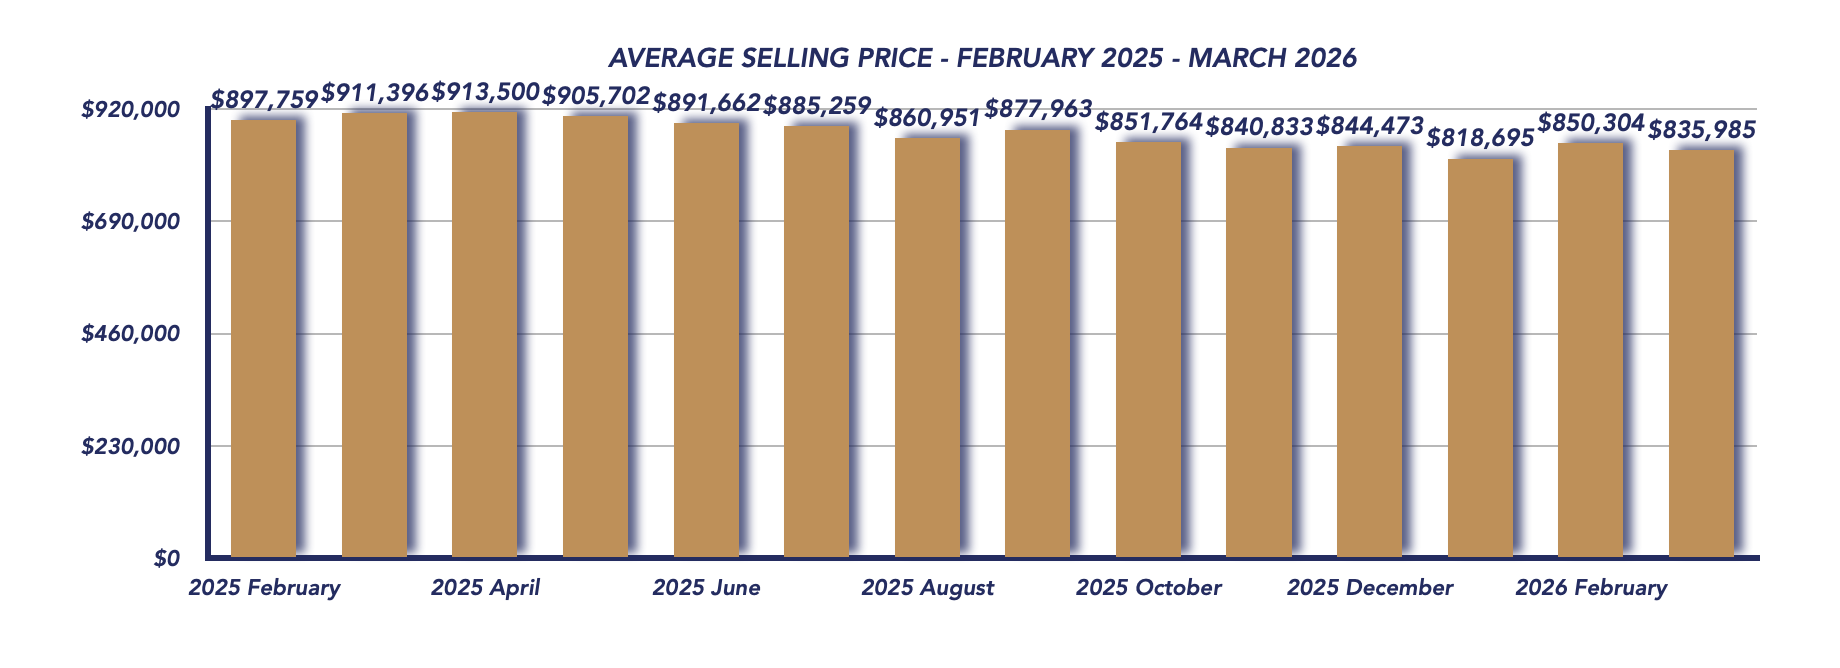
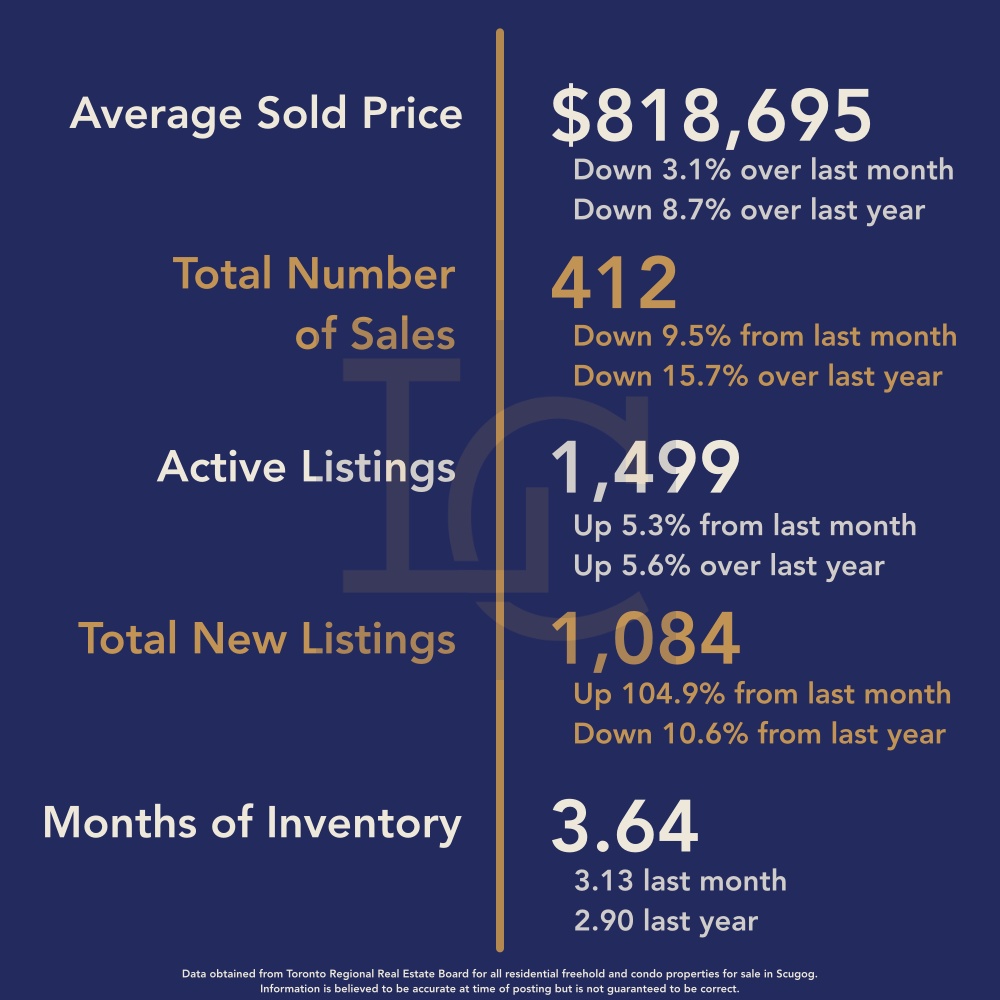
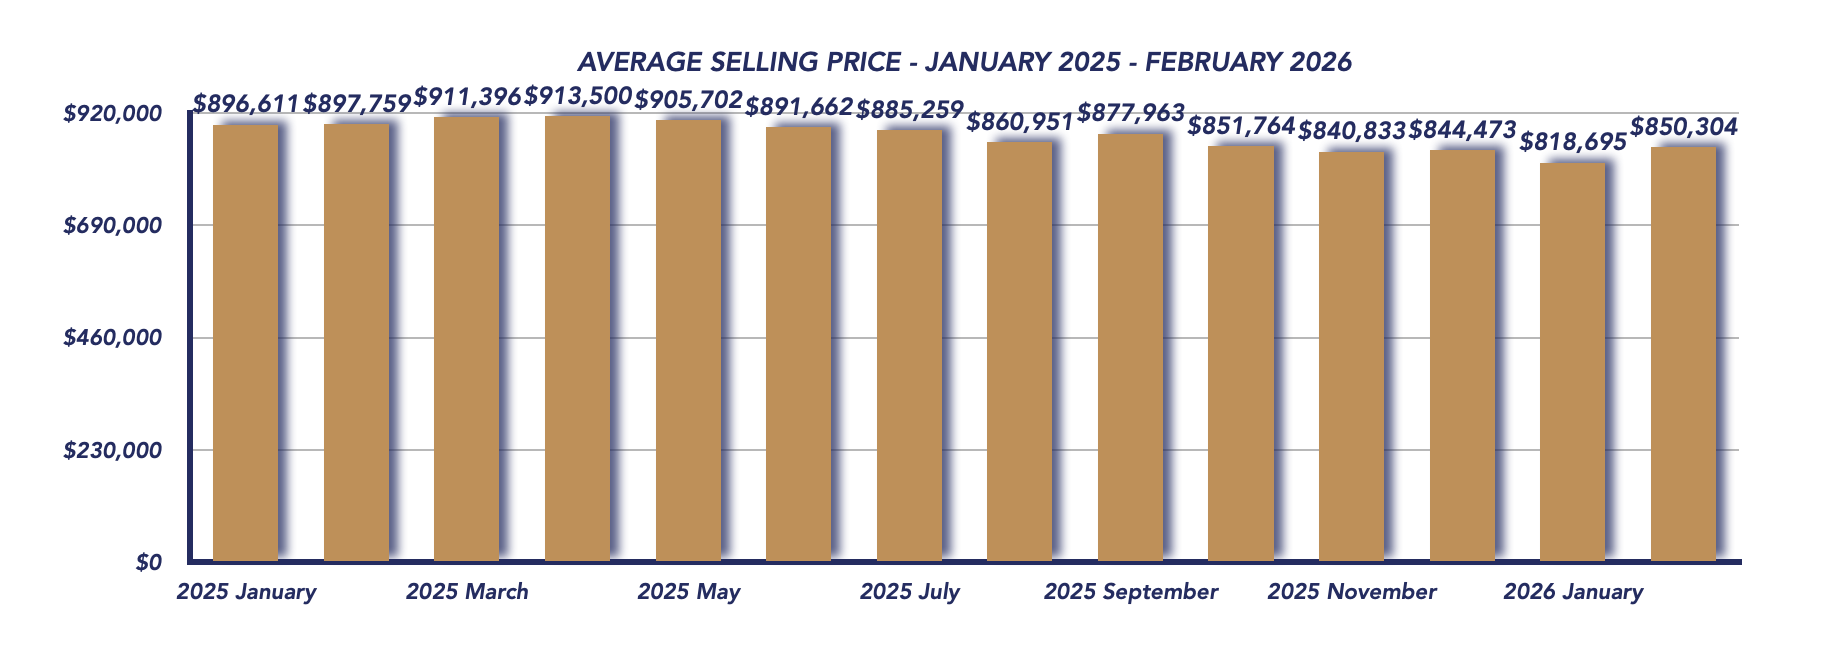
The average sale price in April came in at $844,018, up 1.0% from March’s $835,985, but still 7.6% below April 2025’s $913,500.
This slight month-over-month increase reflects improving buyer activity and seasonal demand, though pricing continues to adjust compared to last year’s higher levels. Overall, prices appear to be stabilizing within a narrower range as the market finds its footing.
Sale-to-List Price Ratio Softens Slightly
The sale-to-list price ratio dipped to 99%, down from 100% in March and 101% last year. While still strong, this small decrease suggests that buyers are regaining a bit of negotiating room as more listings come onto the market.
Homes are still selling close to asking price, but the slight shift indicates a more balanced dynamic between buyers and sellers.
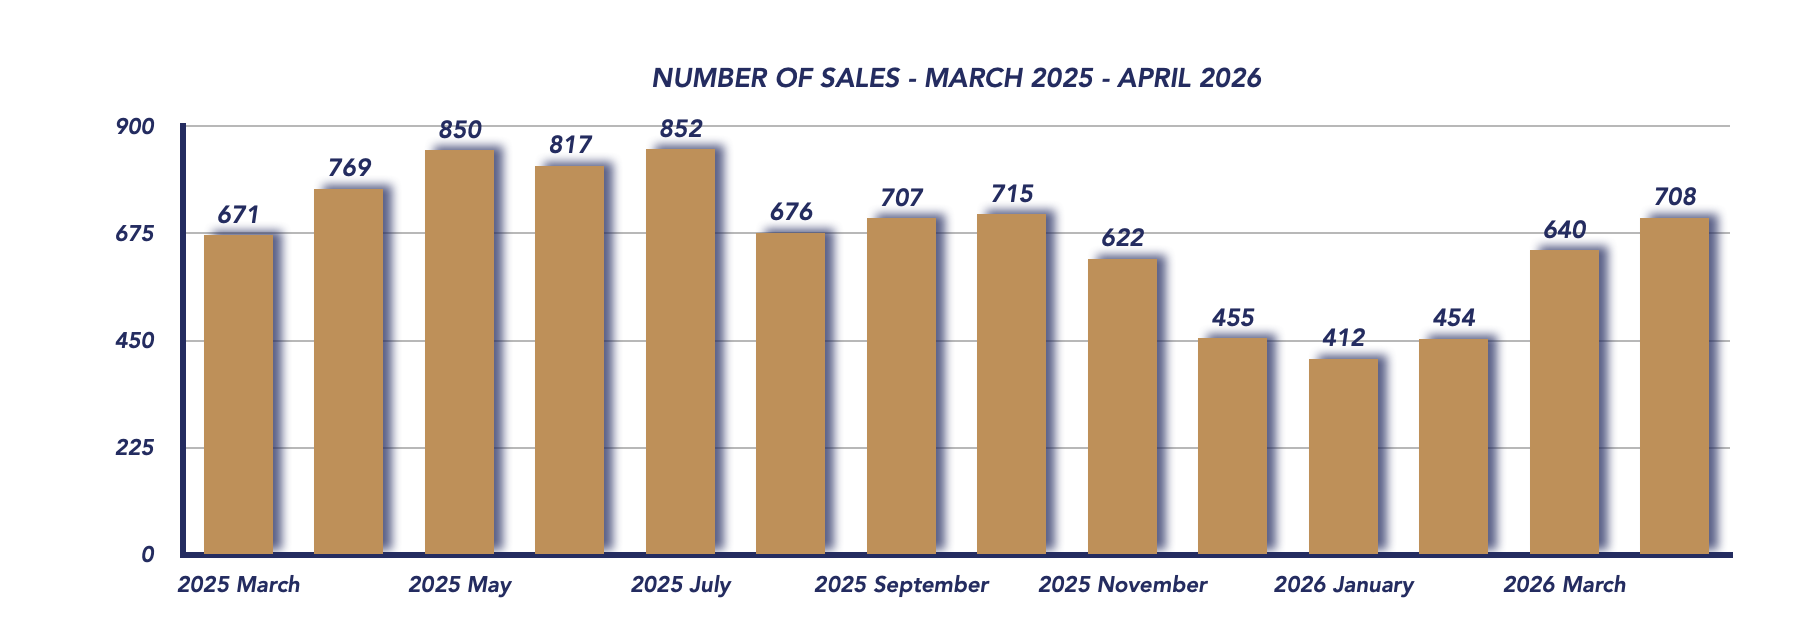
📊 Sales Activity Continues to Build
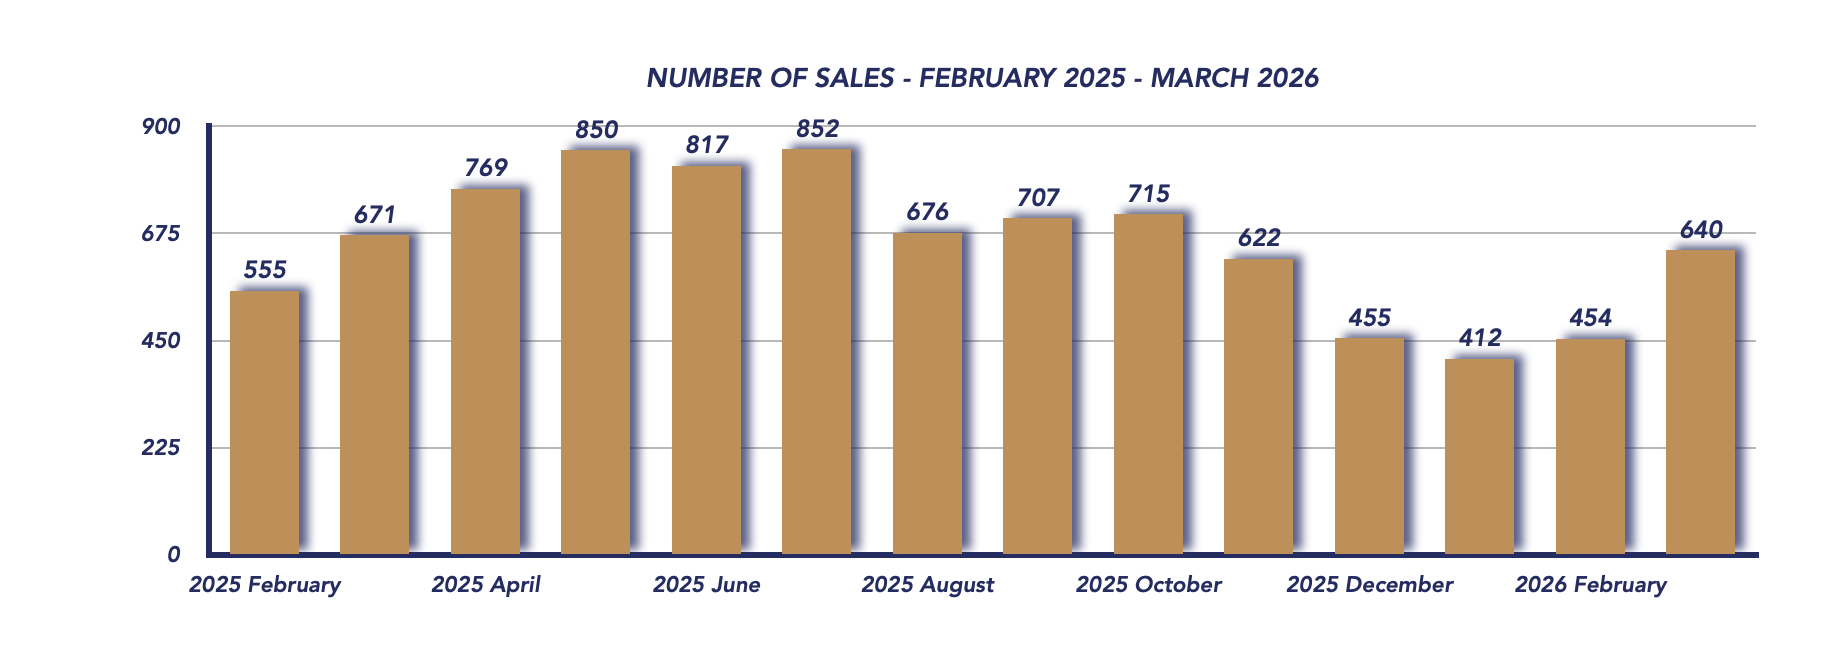
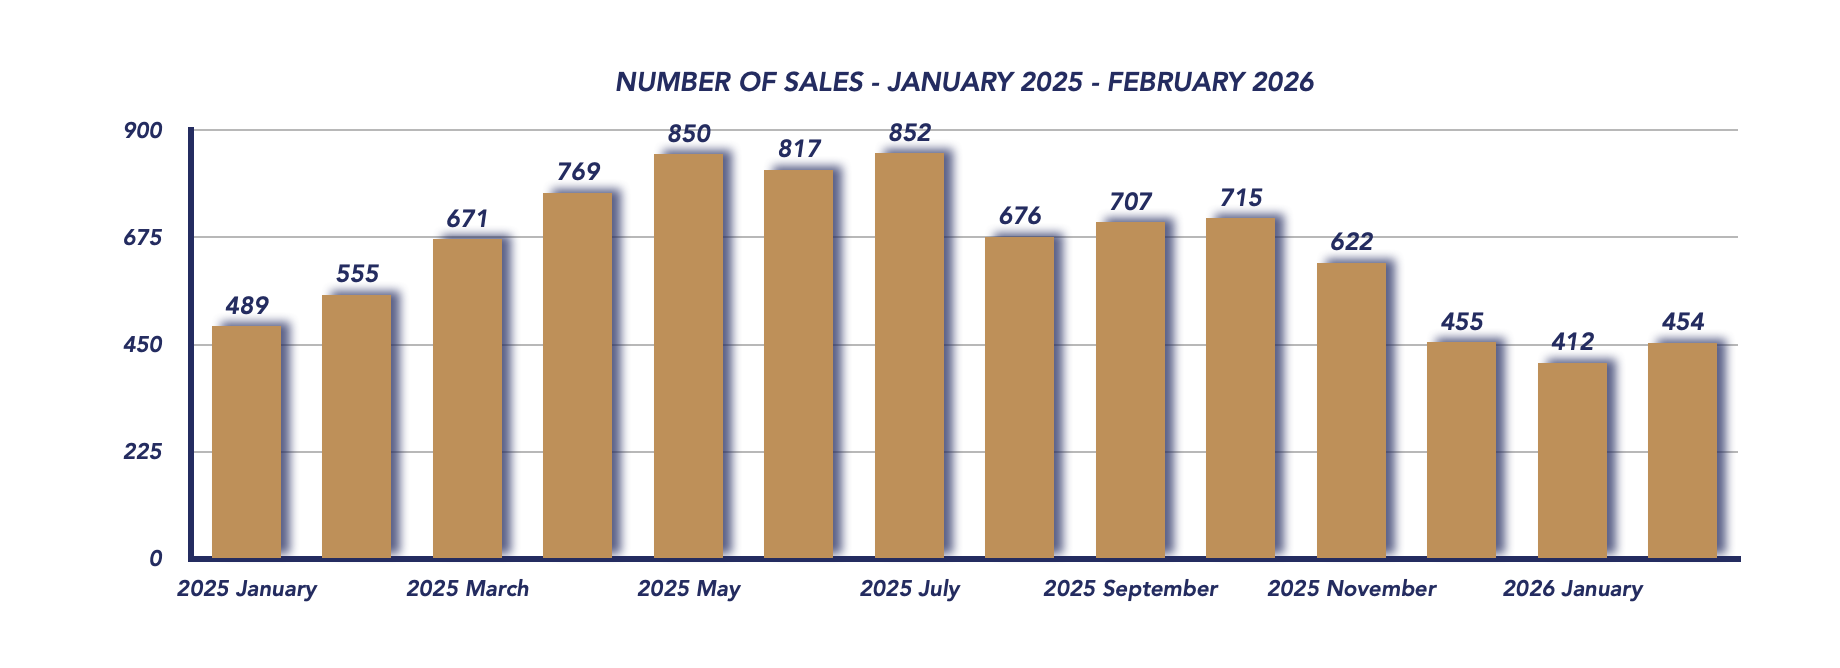
There were 708 sales in April, up from 640 in March, though still below the 769 sales recorded in April 2025.
The month-over-month increase reflects continued spring momentum, with more buyers entering the market. While activity hasn’t yet reached last year’s levels, the gap continues to narrow, signaling improving confidence.
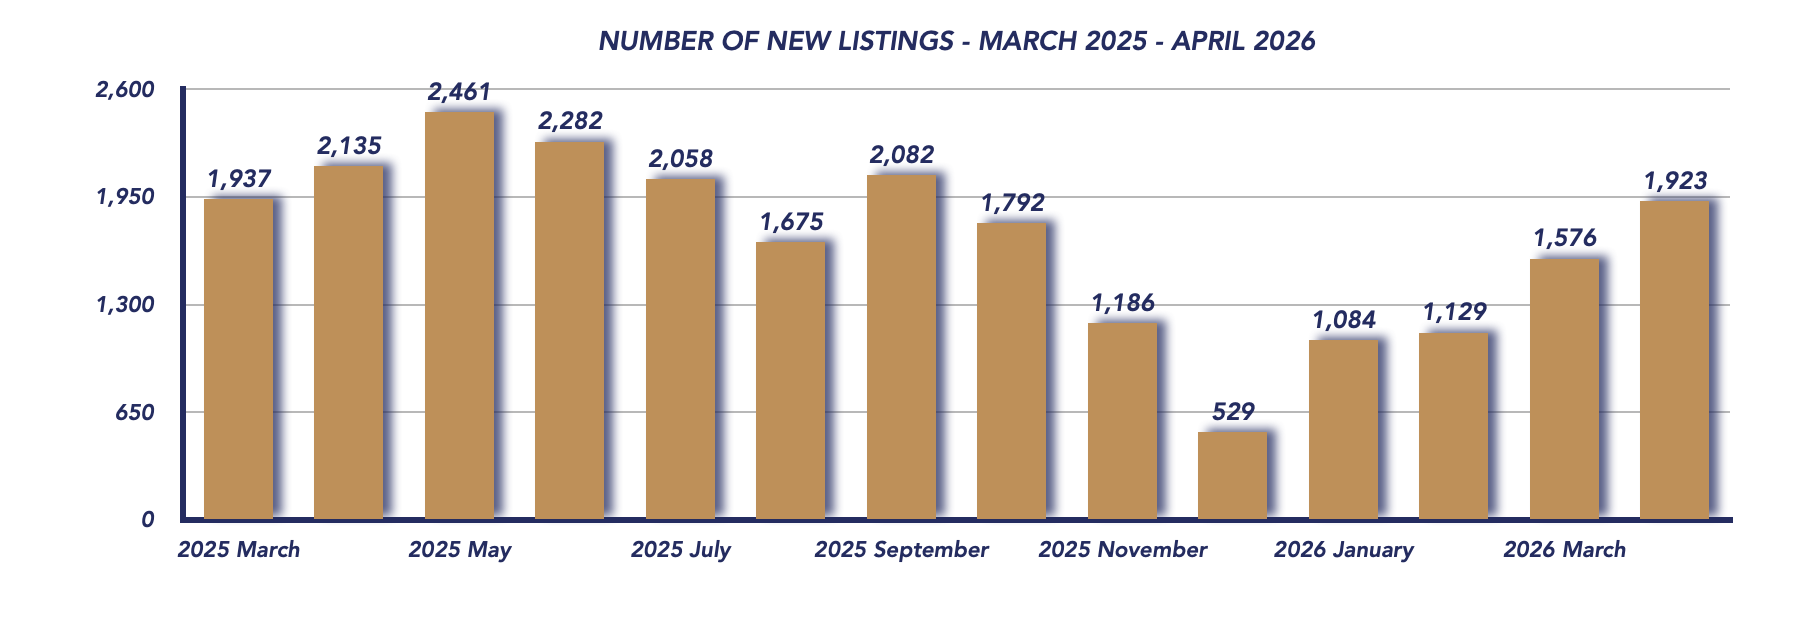
📋 New Listings Increase Significantly
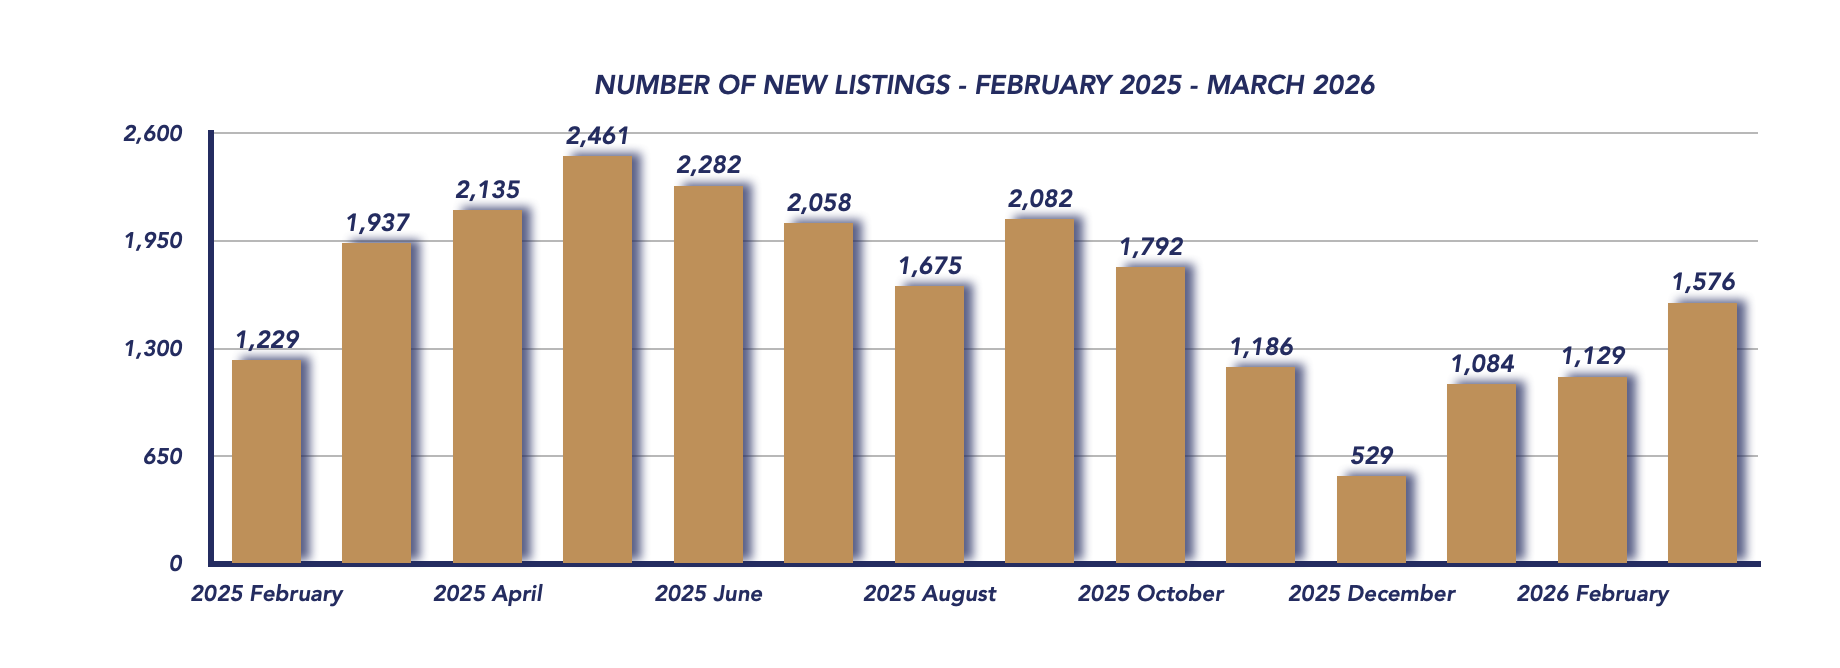
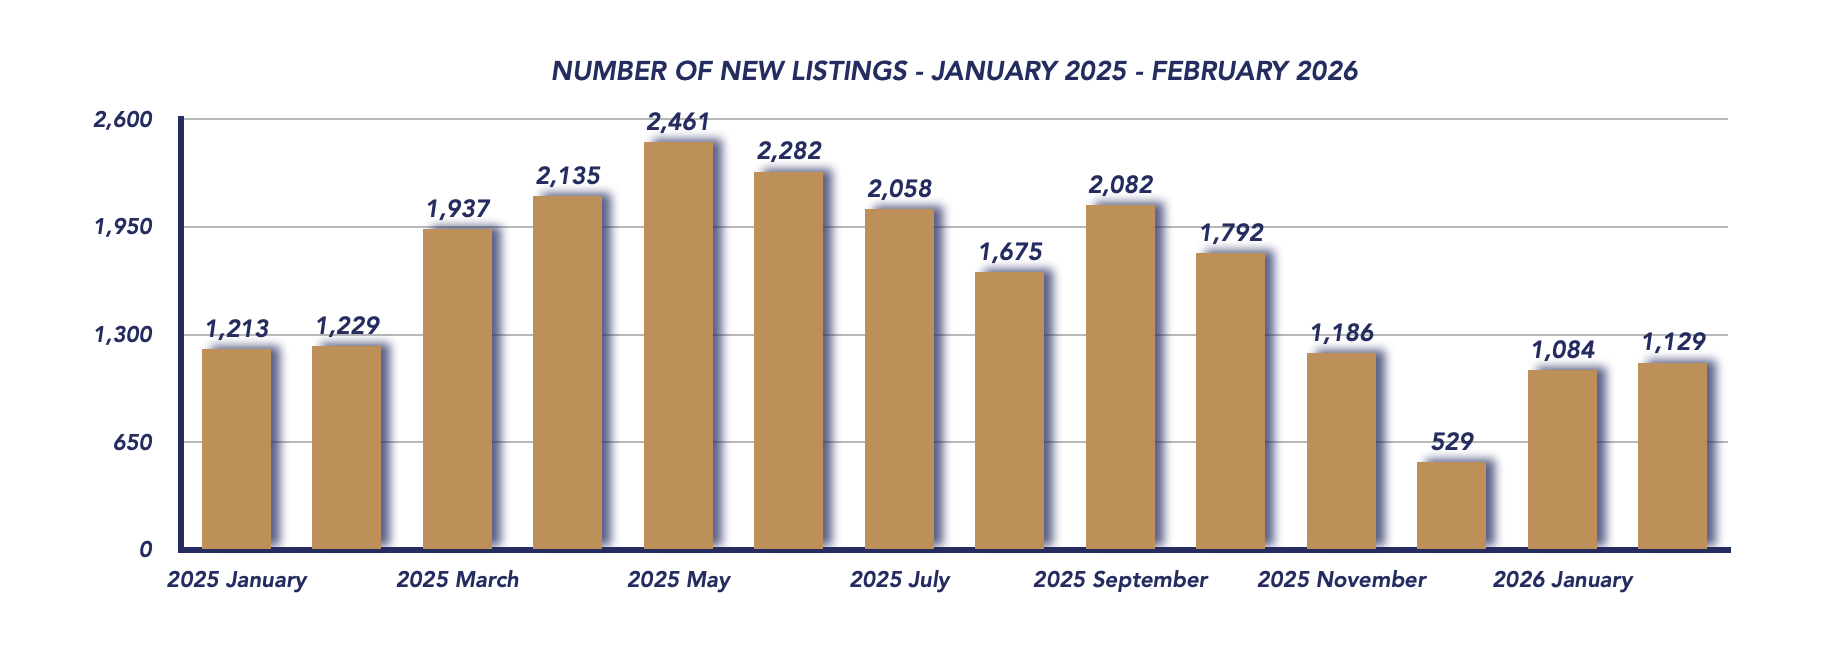
April saw 1,923 new listings, a notable jump from 1,576 in March, though still below 2,135 listings in April 2025.
This increase in supply is typical for the spring market and provides buyers with more choice. The rise in listings is also helping to ease the tighter conditions seen in March, bringing the market closer to balance.
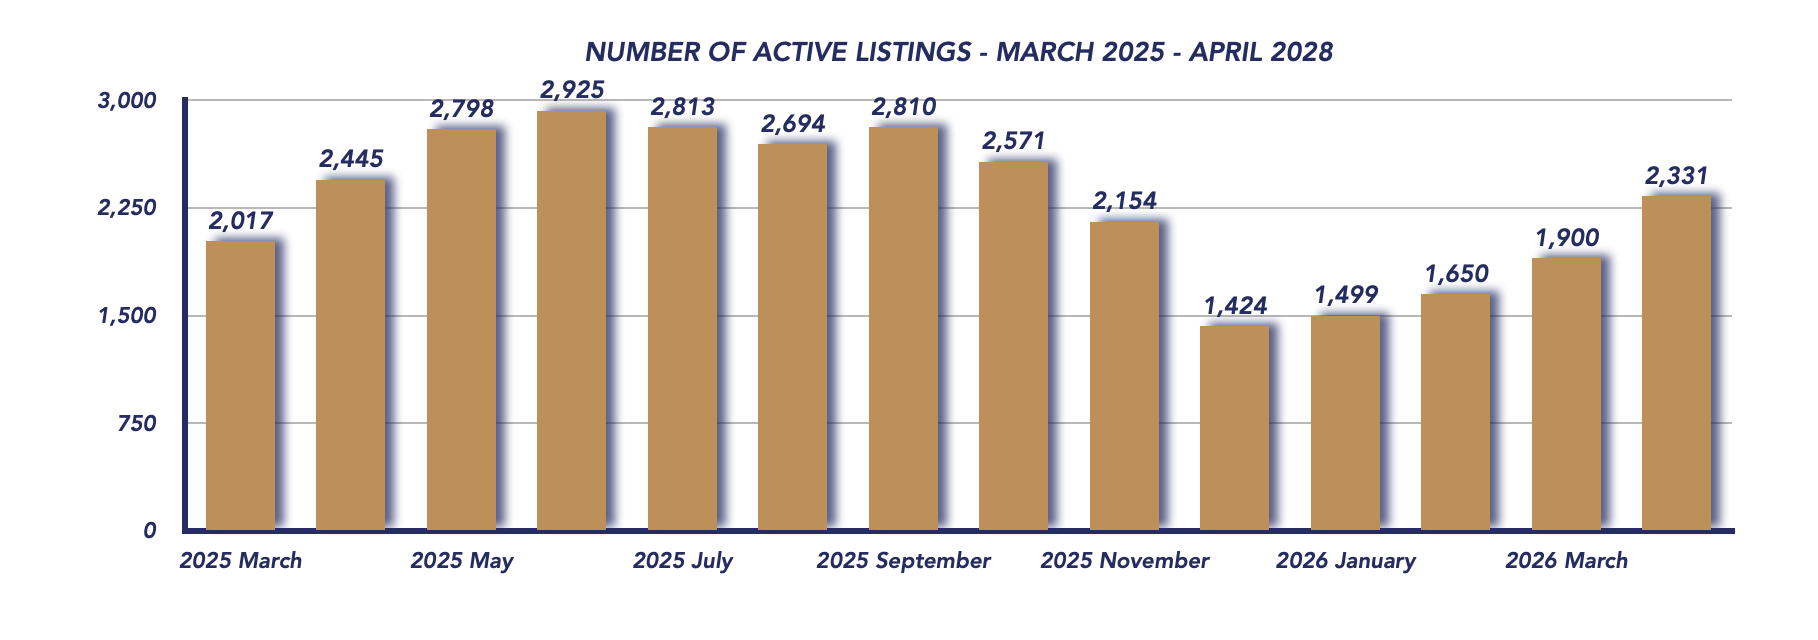
⏳ Homes Selling Faster, Inventory Expands Slightly
The average days on market dropped to 35 days, down from 38 days in March, showing that homes are continuing to sell more quickly as demand remains steady.
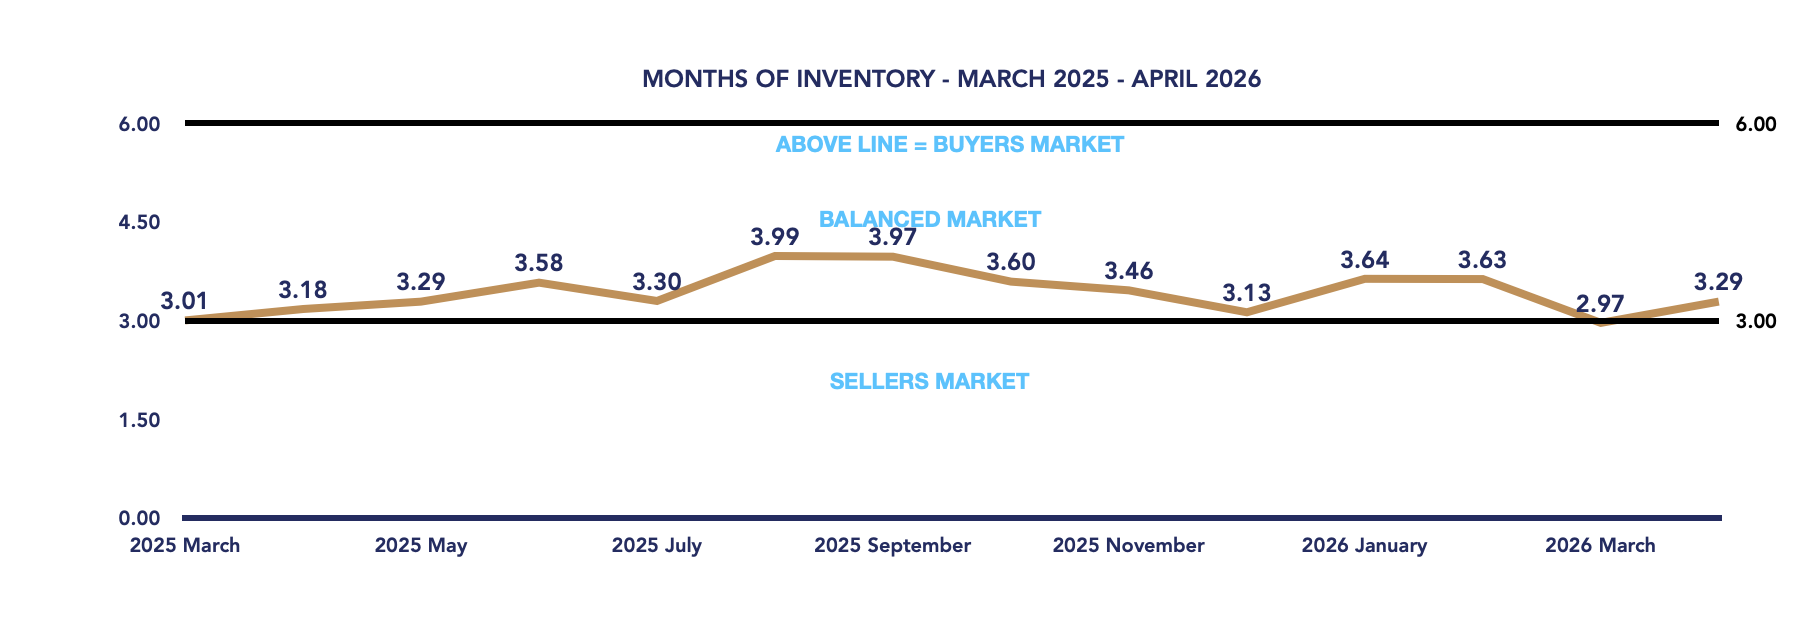
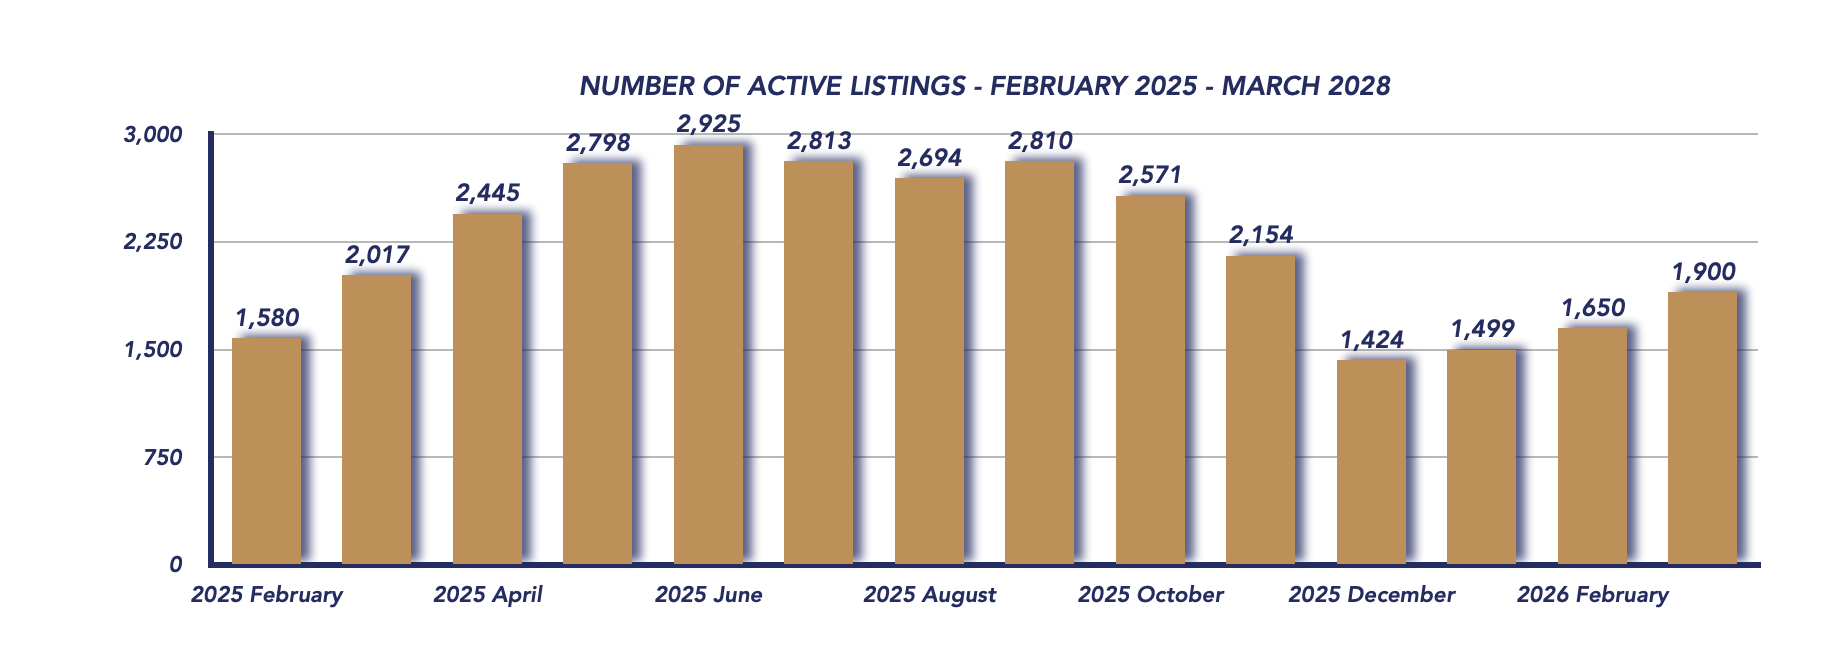
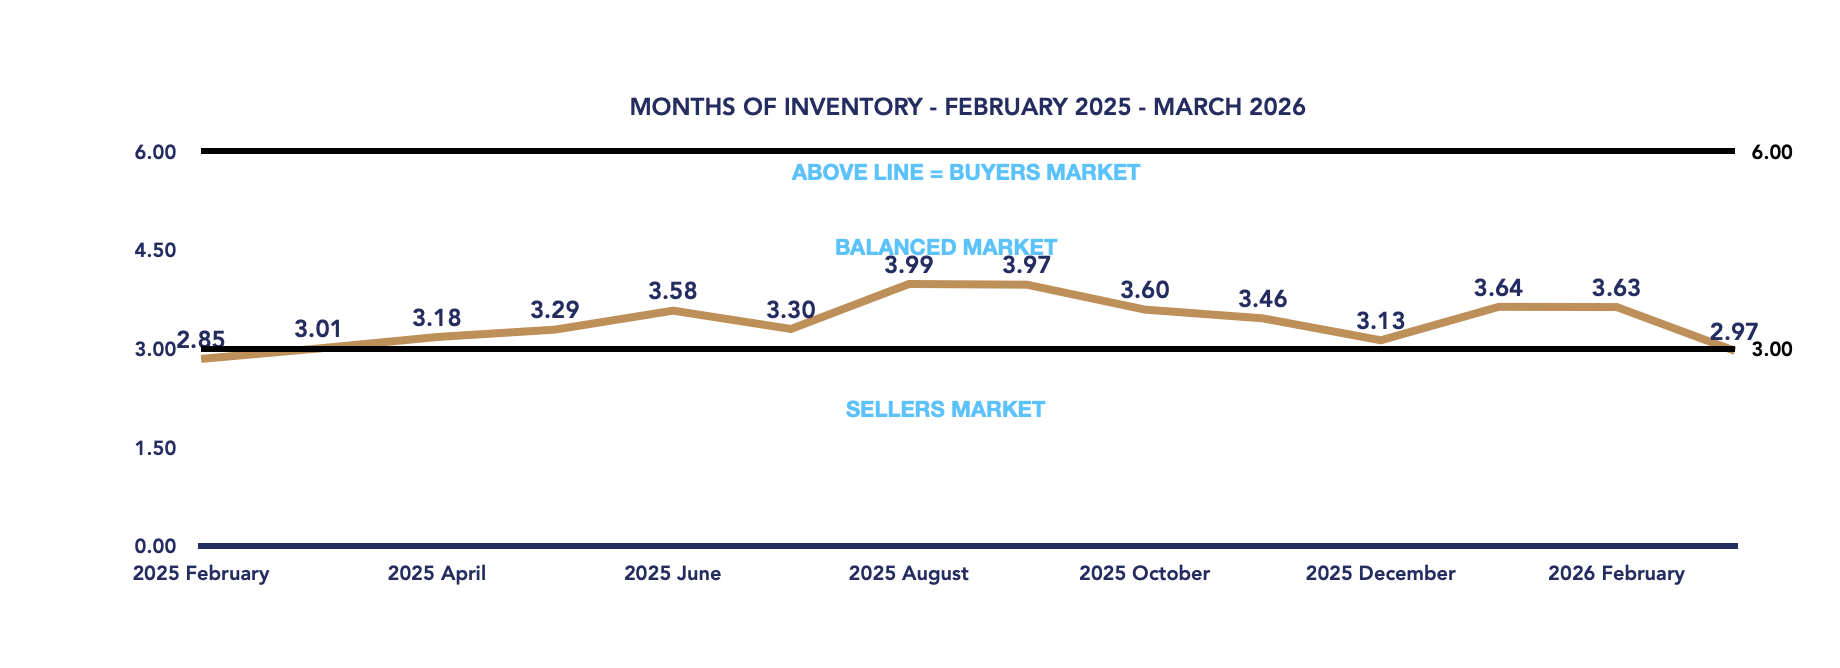
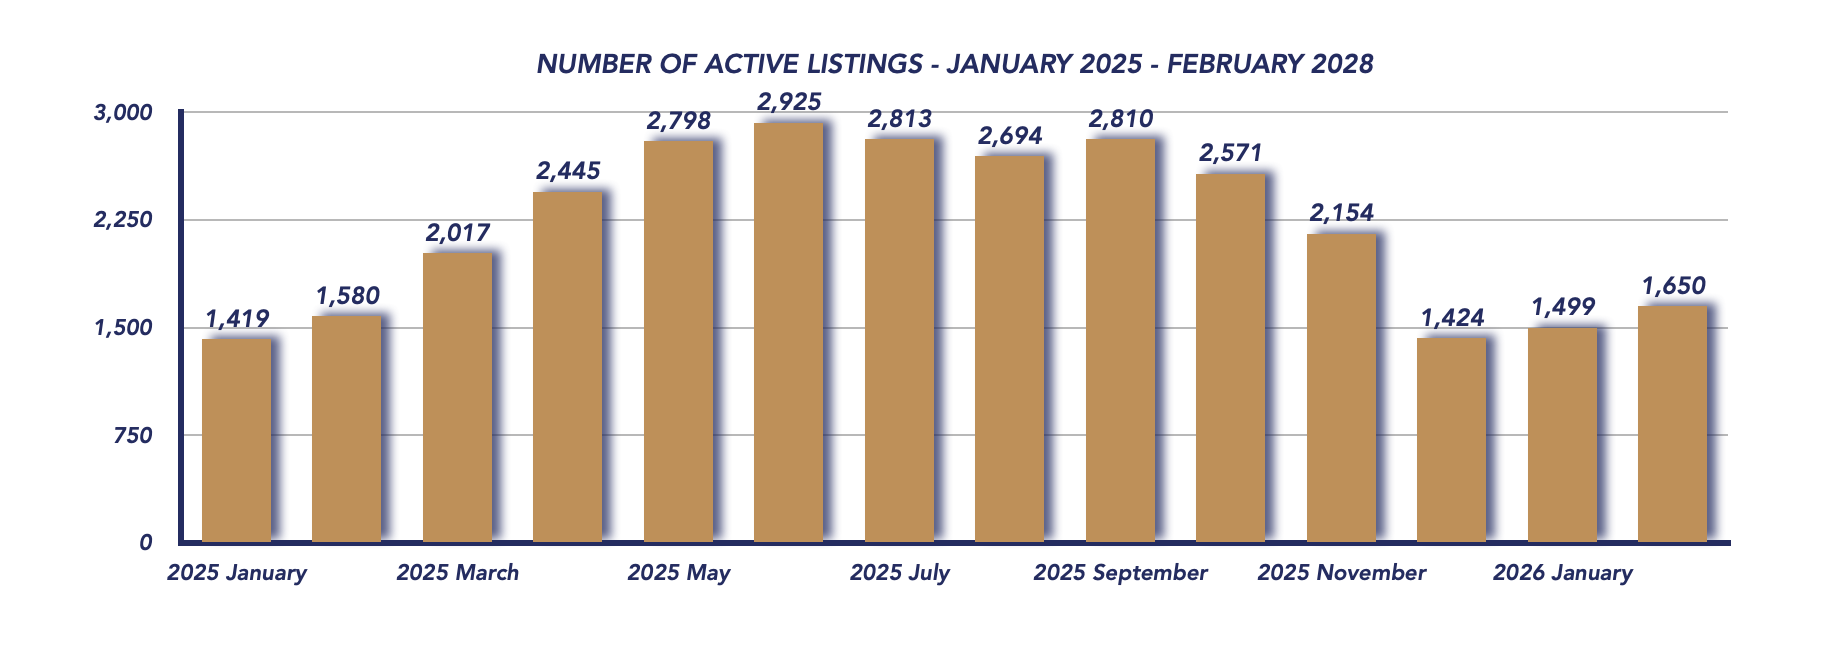
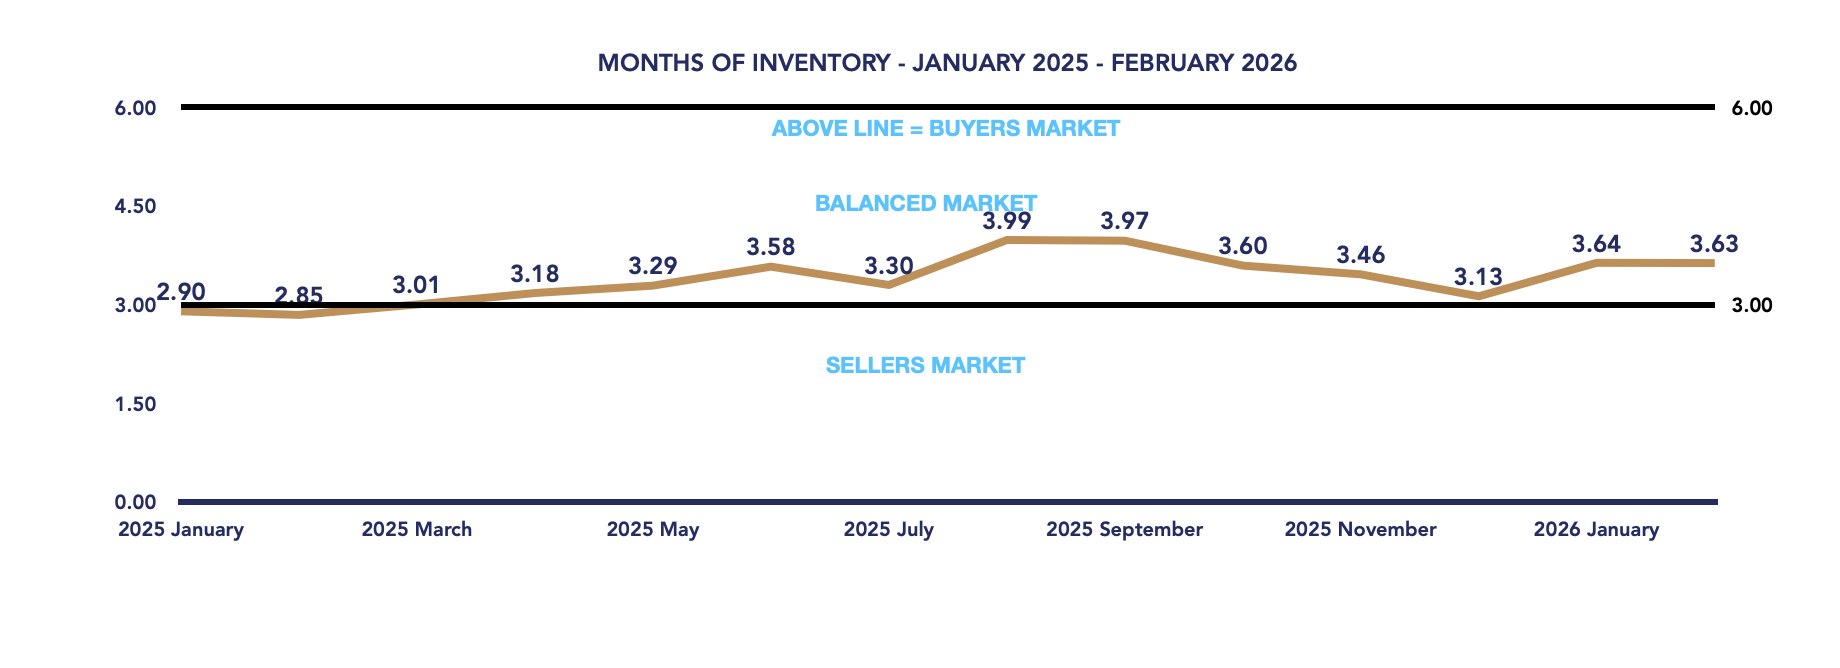
Meanwhile, months of inventory rose to 3.29, up from 2.97, placing Durham just above the line between a seller’s and balanced market. This shift suggests that while demand is still strong, the growing supply is beginning to level the playing field.
Market Outlook
April 2026 reflects a market that is active but stabilizing. Rising sales and faster-moving homes point to healthy demand, while increased listings are helping to keep conditions from tipping too far in favor of sellers.
As we move deeper into the spring market, the key question will be whether inventory continues to grow at a pace that matches buyer demand. If so, Durham Region is likely to remain in balanced territory. If not, we could see renewed upward pressure on pricing and competition.
For now, the market remains well-positioned, offering opportunities for both buyers and sellers who approach it with the right expectations and strategy.
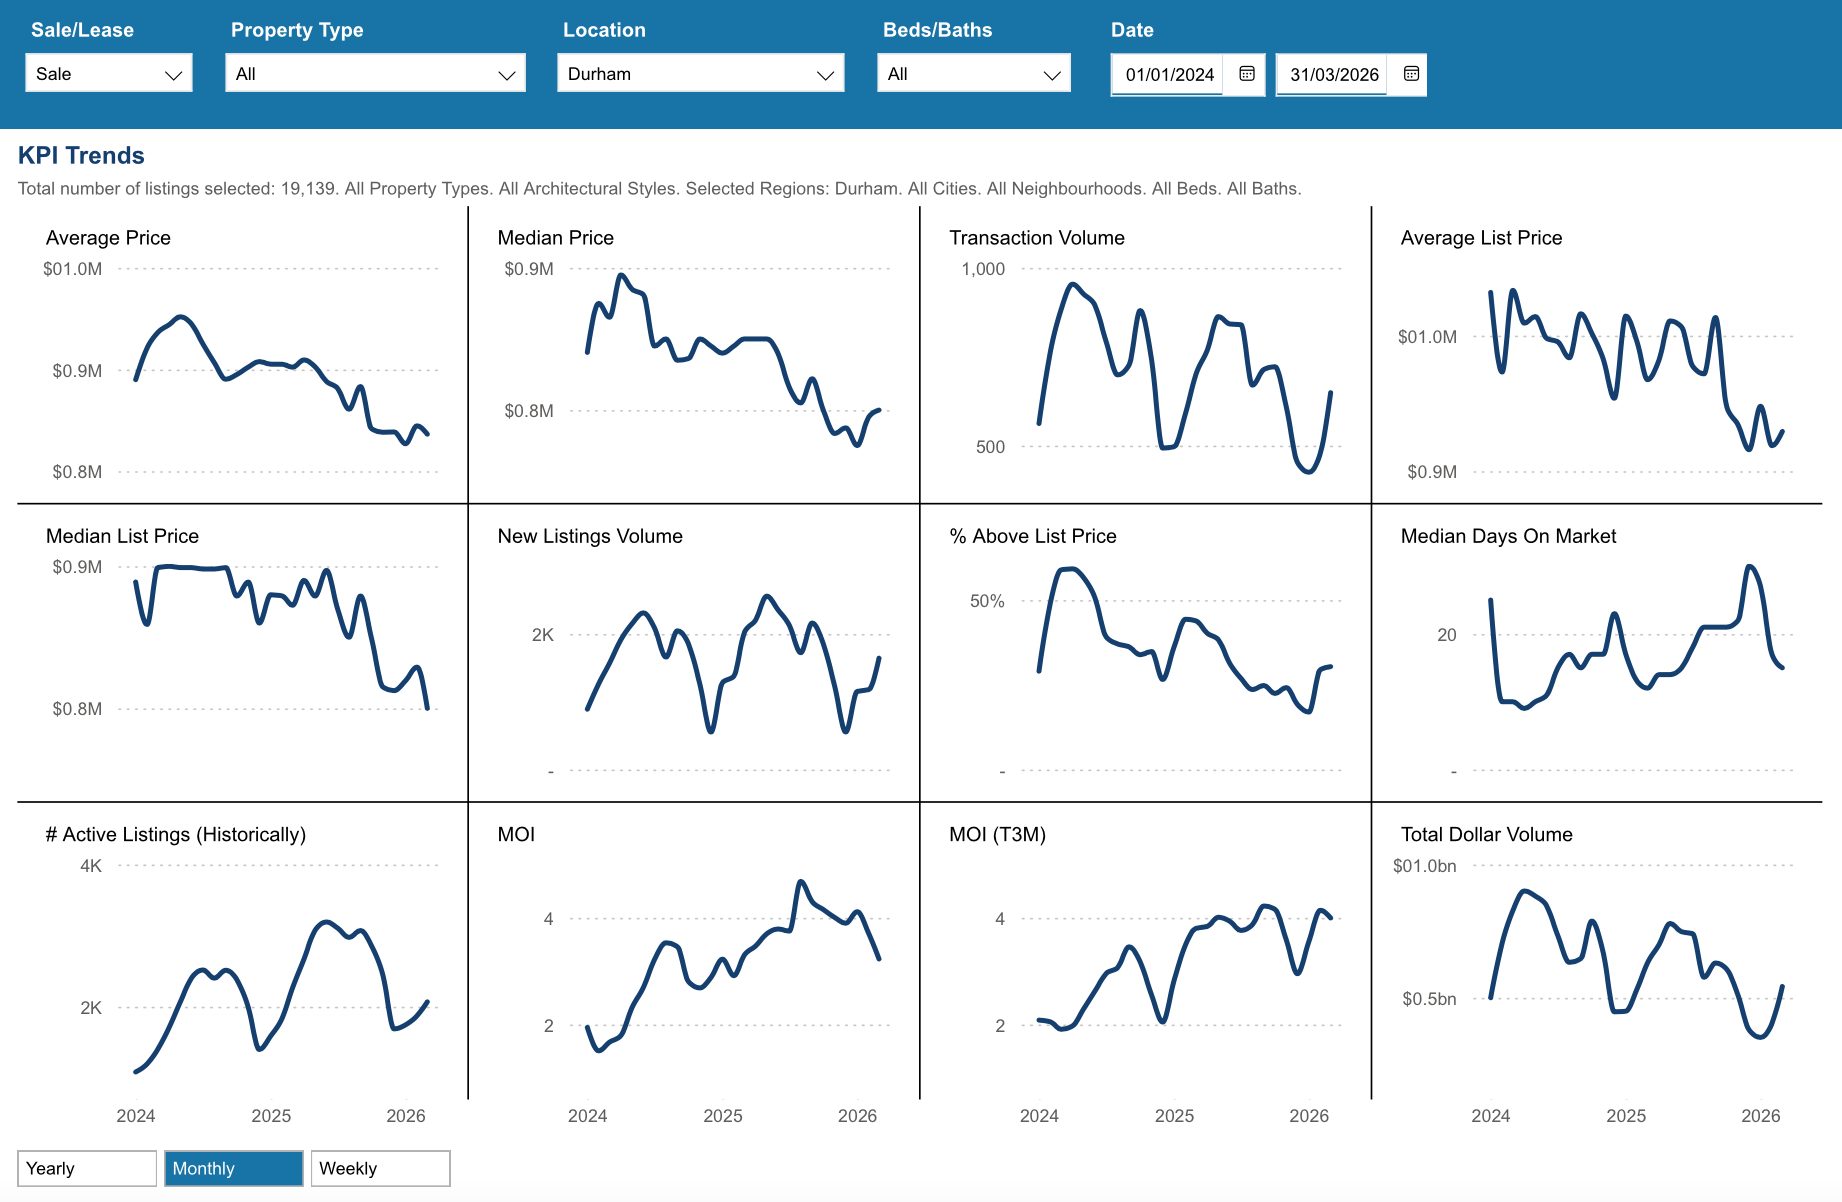
Key Performance Indicators (KPIs) from January 2024 through April 2026 provide a clear snapshot of how the Durham Region real estate market has evolved across all property types, architectural styles, and home configurations

*Information is believed to be accurate at time of posting but is not guaranteed to be correct. Some values may vary slightly based on the exact date and time the reports were generated. Market stats are provided by TRREB (Toronto Regional Real Estate Board) and are based on sales for the month of Attached/Row/Townhouses, Condo Apartments, Condo Townhouses, Detached, Detached with Common Elements, Link Homes and Semi-detached. *Some values may vary slightly based on the exact date and time the reports were generated.
Not intended as a solicitation if your property is already listed by another broker. Affiliated real estate agents are independent contractor sales associates, not employees. ©2021 Coldwell Banker. All Rights Reserved. Coldwell Banker and the Coldwell Banker logos are trademarks of Coldwell Banker Real Estate LLC. The Coldwell Banker® System is comprised of company owned offices which are owned by a subsidiary of Realogy Brokerage Group LLC and franchised offices which are independently owned and operated. The Coldwell Banker System fully supports the principles of the Fair Housing Act and the Equal Opportunity Act.
Click below for more reports
Check out our Uxbridge and Scugog Events Pages to keep up to date on whats going on around town. Click the links or scan the Code with your phone to take you directly there.
UXBRIDGE EVENTS
SCUGOG EVENTS
Uxbridge Housing March 2026

Uxbridge Housing March 2026
Each office is independently owned and operated
![]()
![]()
Housing Market Report for March 2026
Here is the Township of Uxbridge Housing March 2026 report (all housing types), with reports from the Canadian Real Estate Association, and Toronto Regional Real Estate Board included.
This housing report for Durham Region includes the number of new listings, average list price, number of properties sold, average selling price, average days on market and average asking price to selling price ratio for all property types within the Region of Durham.
Scroll to the bottom for links to take you to the housing market reports for Durham Region, Scugog and Brock.
![]()
![]()

From Toronto Regional Real Estate Board
Please note: The PropTx MLS® System, of which TRREB is a part, has added a number of new client boards over the last year. Many of these boards’ Members trade within the Greater Toronto Area and broader Greater Golden Horseshoe regions. As a result, historic data have been updated to reflect the addition of these boards’ listings and transactions. This means historic data have changed relative to previously published static reports. To view updated historic data, click here.
Toronto Regional Real Estate Board – Market Stats At A Glance – March 2026
Read the Toronto Regional Real Estate Board Market Watch Report
![]()
Uxbridge Township Real Estate Market Analysis – March 2026
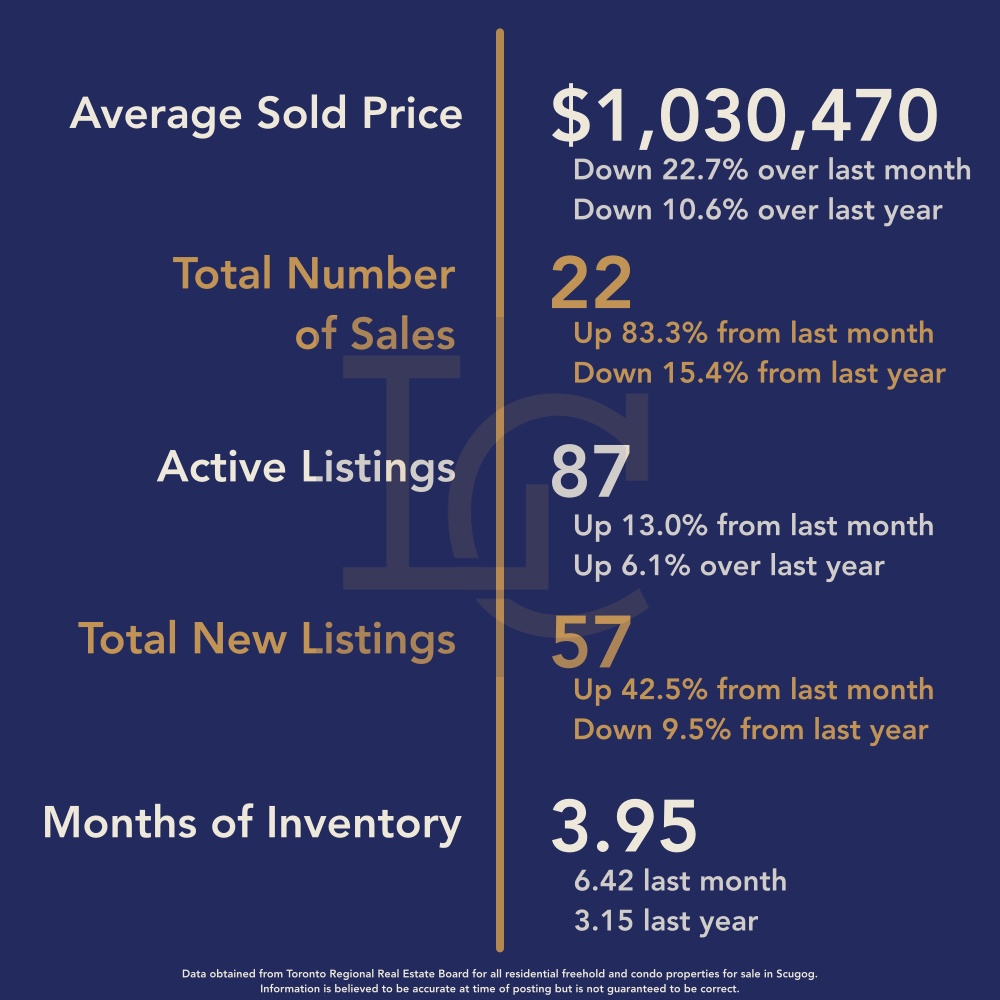
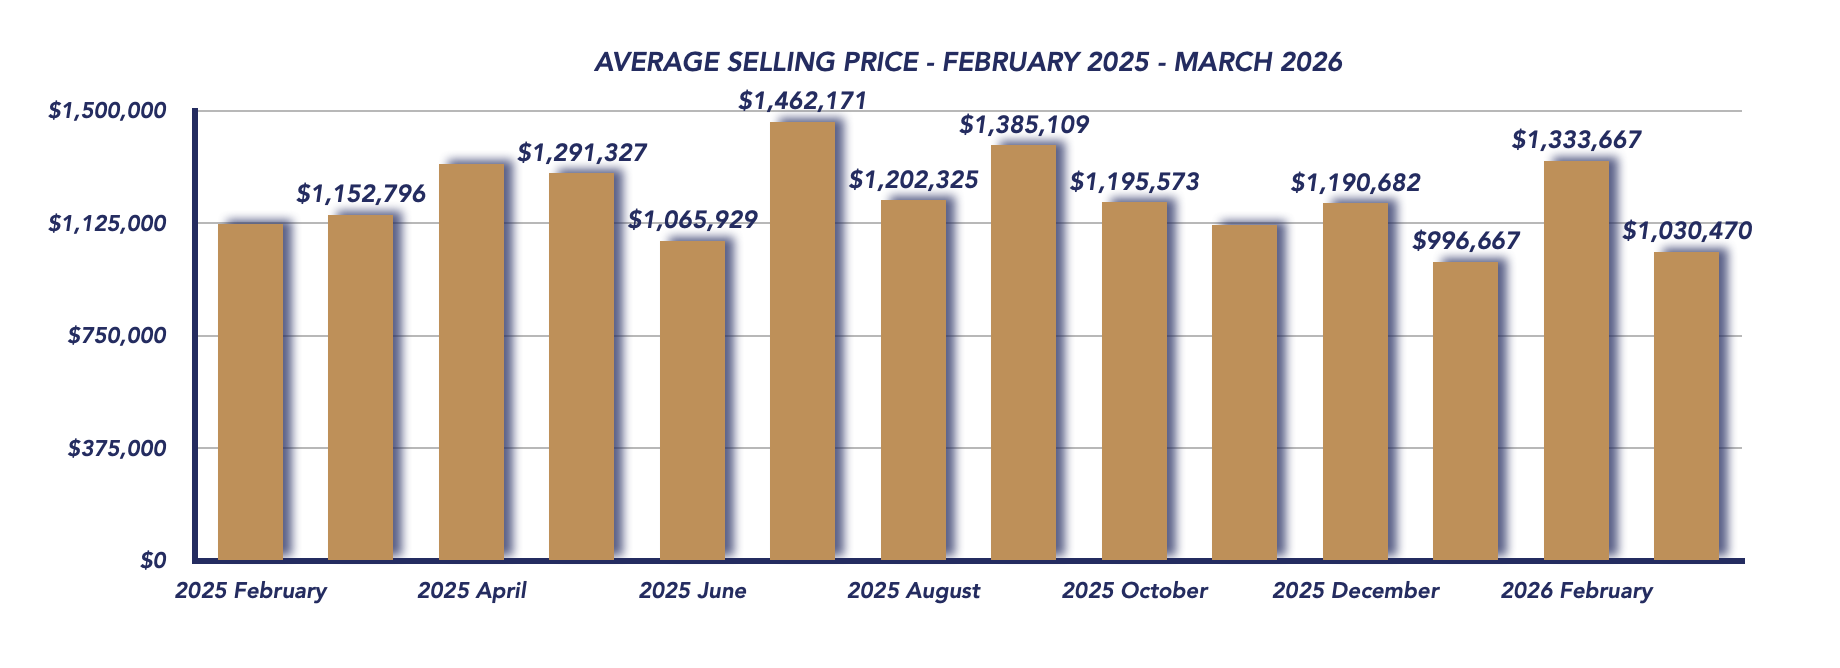
The Uxbridge real estate market saw a notable shift in March 2026, with increased sales activity and improving market balance, despite a sharp drop in the average sale price. The average sale price declined to $1,030,470, representing a 22.7% decrease from February’s $1,333,667 and a 10.6% drop compared to March 2025’s $1,152,796.
March 2026
February 2026
This decline is largely due to a change in the mix of properties sold. In February, the market included several high-end transactions, with multiple homes selling above $1 million, including two properties over $2 million. In contrast, March saw a significant shift toward lower price points, with the highest sale at $1,957,000, only two properties selling between $1 million and $1.5 million, and a substantial 13 properties selling under $1 million. This shift in activity heavily influenced the overall average price.
Sales Activity
Sales activity rebounded strongly, with 22 homes sold in March, up from 12 in February, though slightly below the 26 sales recorded in March 2025. This increase signals that buyer activity is picking up as we enter the spring market, even as buyers focus more on affordability.
Sale-to-List Price Ratio
The sale-to-list price ratio held steady at 96%, unchanged from February. This consistency indicates that homes are still selling close to asking price, provided they are priced appropriately for current market conditions.
Active Listings
Active listings rose to 87, compared to 77 in February and 82 in March 2025. This gradual increase in inventory is typical for the spring season, as more sellers enter the market.
New Listings
There were 57 new listings in March, up from 40 in February, though slightly below the 63 new listings recorded last March. This increase reflects the expected seasonal boost in listing activity, giving buyers more options.
Days on Market
Homes sold in an average of 39 days, a significant improvement from February’s 85 days. This faster pace suggests renewed buyer urgency and stronger engagement as the spring market gains momentum.
Months of Inventory
One of the most important shifts this month is the drop in months of inventory to 3.95, down from 6.42 in February. This brings the market back into balanced territory, where supply and demand are more evenly matched.
Conclusion
March 2026 highlights a market in transition. While the average sale price declined due to a shift toward more affordable homes, sales activity increased, homes sold faster, and inventory levels improved, all pointing to a healthier and more active market.
The return to balanced conditions suggests that both buyers and sellers have opportunities. Buyers still benefit from a range of options and reasonable negotiating power, while sellers can take advantage of renewed demand—especially if they price their homes strategically.
As we move further into the spring market, Uxbridge is showing signs of stabilization, with momentum building and conditions becoming more predictable after a volatile start to the year.
Key Performance Indicators (KPIs) from January 2024 through March 2026 provide a clear snapshot of how the Township of Uxbridge real estate market has evolved across all property types, architectural styles, and home configurations
WATCH OUR MONDAY MARKET MINUTES
*Information is believed to be accurate at time of posting but is not guaranteed to be correct. Some values may vary slightly based on the exact date and time the reports were generated. Market stats are provided by TRREB (Toronto Regional Real Estate Board) and are based on sales for the month of Attached/Row/Townhouses, Condo Apartments, Condo Townhouses, Detached, Detached with Common Elements, Link Homes and Semi-detached. *Some values may vary slightly based on the exact date and time the reports were generated.
Not intended as a solicitation if your property is already listed by another broker. Affiliated real estate agents are independent contractor sales associates, not employees. ©2021 Coldwell Banker. All Rights Reserved. Coldwell Banker and the Coldwell Banker logos are trademarks of Coldwell Banker Real Estate LLC. The Coldwell Banker® System is comprised of company owned offices which are owned by a subsidiary of Realogy Brokerage Group LLC and franchised offices which are independently owned and operated. The Coldwell Banker System fully supports the principles of the Fair Housing Act and the Equal Opportunity Act.
Click below for more reports
Check out our Uxbridge and Scugog Events Pages to keep up to date on whats going on around town. Click the links or scan the Code with your phone to take you directly there.
UXBRIDGE EVENTS
SCUGOG EVENTS
Scugog Housing March 2026

Scugog Housing March 2026
Each office is independently owned and operated
![]()
![]()
Housing Market Report for March 2026
Here is the Township of Scugog Housing March 2026 report (all housing types), with reports from the Canadian Real Estate Association, and Toronto Regional Real Estate Board included.
This housing report for Durham Region includes the number of new listings, average list price, number of properties sold, average selling price, average days on market and average asking price to selling price ratio for all property types within the Region of Durham.
Scroll to the bottom for links to take you to the housing market reports for Durham Region, Uxbridge and Brock.
![]()
![]()
From Toronto Regional Real Estate Board
Please note: The PropTx MLS® System, of which TRREB is a part, has added a number of new client boards over the last year. Many of these boards’ Members trade within the Greater Toronto Area and broader Greater Golden Horseshoe regions. As a result, historic data have been updated to reflect the addition of these boards’ listings and transactions. This means historic data have changed relative to previously published static reports. To view updated historic data, click here.
Toronto Regional Real Estate Board Market Stats at a Glance March 2026
Read the Toronto Regional Real Estate Board Market Watch Report
![]()
Scugog Township Real Estate Market Analysis – March 2026
The Township of Scugog’s real estate market in March 2026 showed modest price growth alongside increasing inventory and steady sales activity. While average prices edged higher month-over-month, the market continues to sit firmly in buyer’s territory due to elevated supply levels and longer selling times.
March 2026
February 2026
Average Sales Price
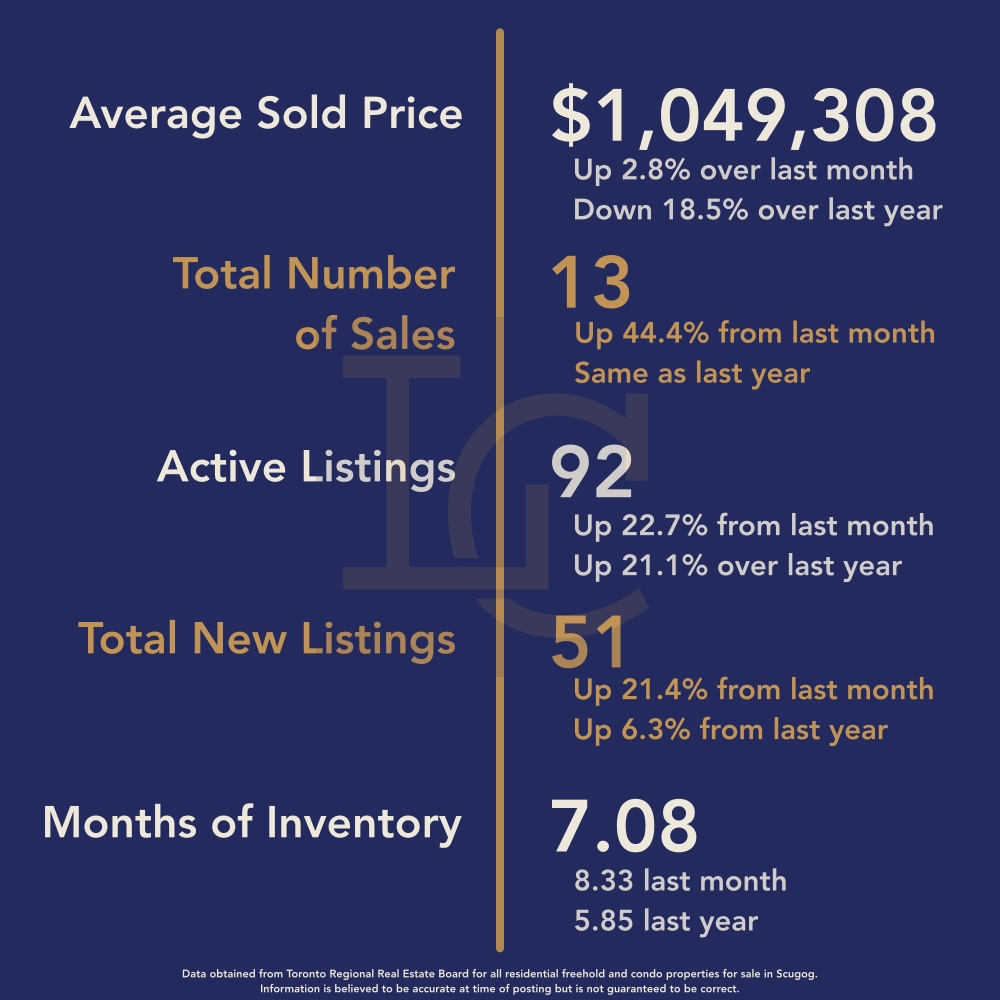
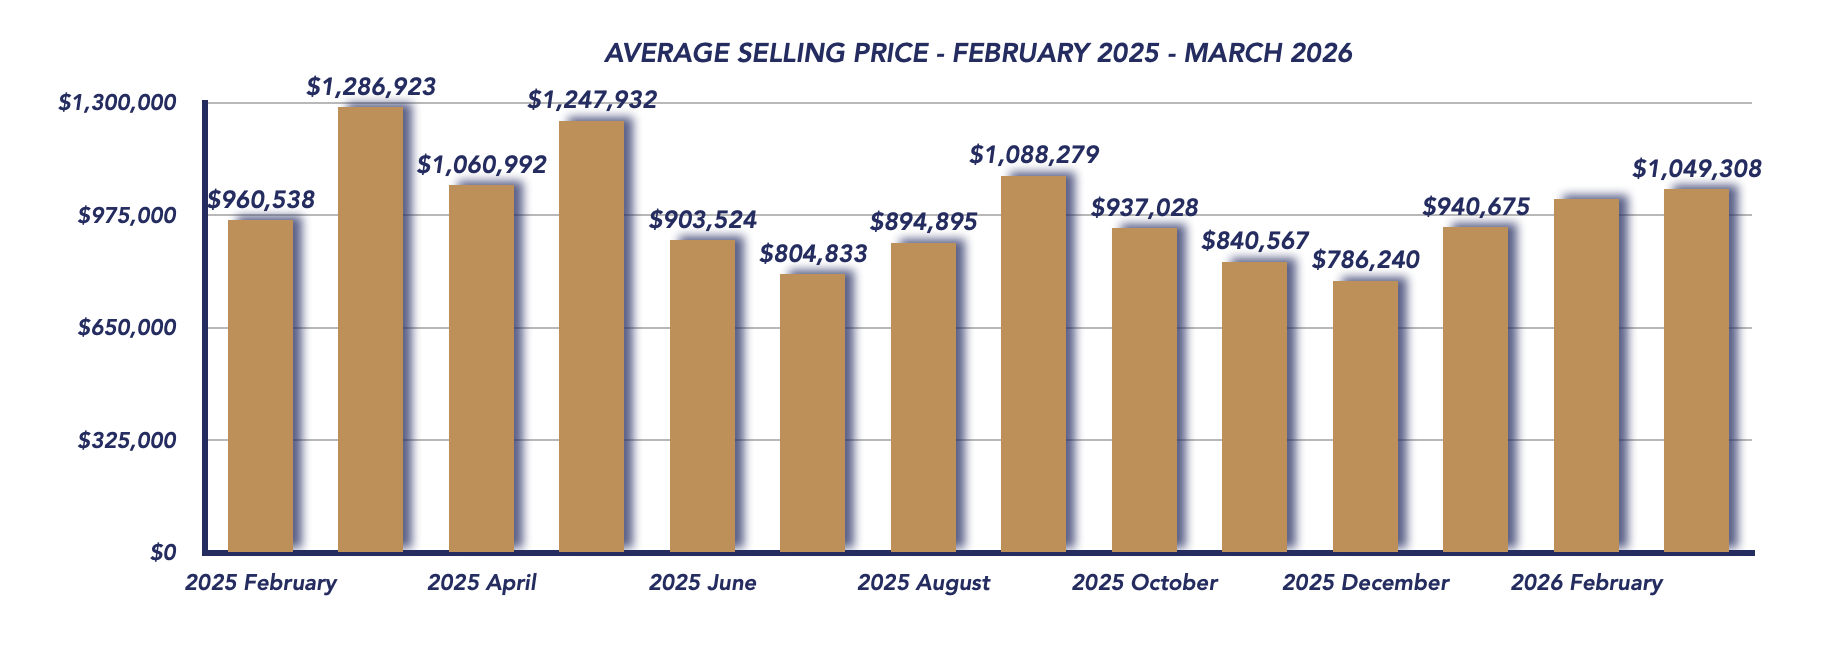
The average sales price for March 2026 came in at $1,049,308, representing a 2.8% increase from February’s $1,020,589, but a significant 18.5% decline year-over-year compared to $1,286,923 in March 2025.
It’s important to highlight how last year’s figures were heavily skewed by a single high-end sale of $3,224,000, which inflated the March 2025 average. In contrast, March 2026 saw a more typical distribution:
- 3 properties sold over $1 million, with the highest at $1,800,000
- The remaining properties sold under $870,000
This more balanced mix of sales provides a clearer picture of true market values, even though averages remain lower compared to last year’s outlier-driven results.
Sales Activity
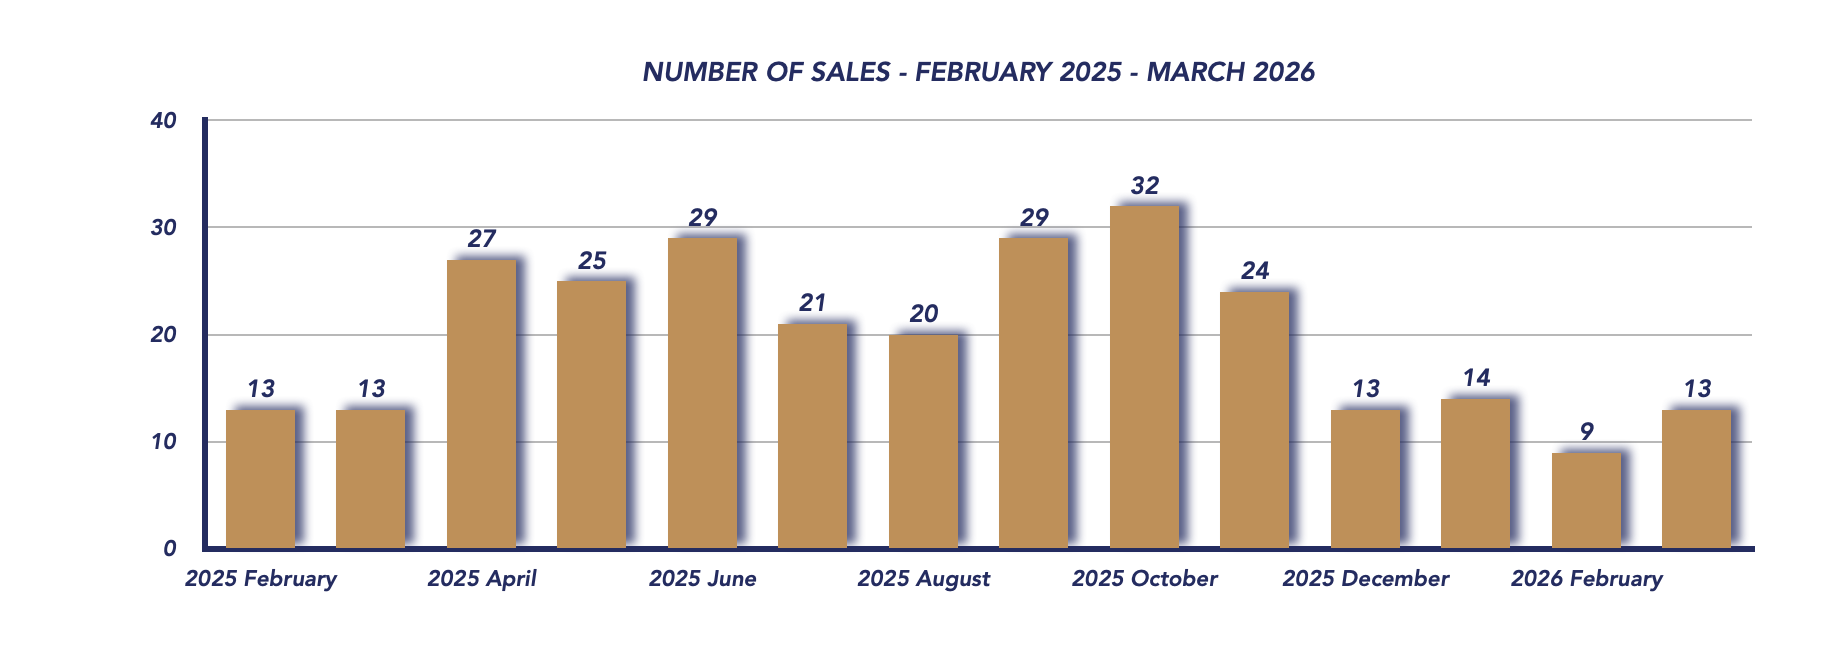
There were 13 total sales in March, up from 9 in February and matching the 13 sales recorded in March 2025. This increase suggests a seasonal pickup in buyer activity as the spring market begins to take shape.
However, the sale-to-list price ratio dropped to 95%, down from 98% last month, indicating that buyers are negotiating more aggressively and sellers are accepting lower offers relative to asking prices.
Listings & Inventory
Inventory levels continued to rise in March:
- Active listings increased to 92, up from 75 in February and 76 last year
- New listings climbed to 51, compared to 42 last month and 48 in March 2025
This steady increase in supply is giving buyers more choice and contributing to the overall cooling of competitive pressures in the market.
The months of inventory dipped slightly to 7.08, down from 8.33 in February, but remains well within buyer’s market territory. This indicates that while sales activity is improving, it is not yet keeping pace with the number of homes available.
Days on Market
Homes in March took an average of 75 days to sell, reflecting a slower pace compared to previous months. This extended timeframe highlights buyer caution and increased selectivity, as well as the impact of higher inventory levels.
Key Takeaways
- Average price rose slightly month-over-month, but remains significantly lower than last year due to prior high-end sales.
- Sales activity improved, signaling the early stages of the spring market.
- Inventory continues to rise, giving buyers more options.
- Sale-to-list ratio dropped to 95%, showing increased negotiation power for buyers.
- Months of inventory remains high at 7.08, keeping Scugog in a buyer’s market.
- Homes are taking longer to sell, reflecting more cautious buyer behaviour.
Market Outlook
March 2026 suggests that Scugog’s market is gaining momentum heading into spring, but still heavily influenced by elevated inventory levels. While prices are stabilizing and sales are picking up, the balance of power remains with buyers for now.
The key trend to watch in the coming months will be whether increased buyer activity can absorb the growing supply. If demand strengthens, Scugog could gradually shift back toward balanced conditions. Until then, buyers benefit from greater choice and negotiating flexibility, while sellers must remain competitive with pricing and presentation to achieve successful outcomes.
Key Performance Indicators (KPIs) from January 2024 through March 2026 provide a clear snapshot of how the Township of Scugog real estate market has evolved across all property types, architectural styles, and home configurations
WATCH OUR MONDAY MARKET MINUTES
*Information is believed to be accurate at time of posting but is not guaranteed to be correct. Some values may vary slightly based on the exact date and time the reports were generated. Market stats are provided by TRREB (Toronto Regional Real Estate Board) and are based on sales for the month of Attached/Row/Townhouses, Condo Apartments, Condo Townhouses, Detached, Detached with Common Elements, Link Homes and Semi-detached. *Some values may vary slightly based on the exact date and time the reports were generated.
Not intended as a solicitation if your property is already listed by another broker. Affiliated real estate agents are independent contractor sales associates, not employees. ©2021 Coldwell Banker. All Rights Reserved. Coldwell Banker and the Coldwell Banker logos are trademarks of Coldwell Banker Real Estate LLC. The Coldwell Banker® System is comprised of company owned offices which are owned by a subsidiary of Realogy Brokerage Group LLC and franchised offices which are independently owned and operated. The Coldwell Banker System fully supports the principles of the Fair Housing Act and the Equal Opportunity Act.
Click below for more reports
Check out our Uxbridge and Scugog Events Pages to keep up to date on whats going on around town. Click the links or scan the Code with your phone to take you directly there.
UXBRIDGE EVENTS
SCUGOG EVENTS
Brock Housing March 2026

Brock Housing March 2026
Each office is independently owned and operated
![]()
![]()
Housing Market Report for March 2026
Here is the Township of Brock Housing March 2026 report (all housing types), with reports from the Canadian Real Estate Association, and Toronto Regional Real Estate Board included.
This housing report for Durham Region includes the number of new listings, average list price, number of properties sold, average selling price, average days on market and average asking price to selling price ratio for all property types within the Region of Durham.
Scroll to the bottom for links to take you to the housing market reports for Durham Region, Uxbridge and Scugog.
![]()
![]()
From Toronto Regional Real Estate Board
Please note: The PropTx MLS® System, of which TRREB is a part, has added a number of new client boards over the last year. Many of these boards’ Members trade within the Greater Toronto Area and broader Greater Golden Horseshoe regions. As a result, historic data have been updated to reflect the addition of these boards’ listings and transactions. This means historic data have changed relative to previously published static reports. To view updated historic data, click here.
Toronto Regional Real Estate Board – Market Stats At A Glance – March 2026
Read the Toronto Regional Real Estate Board Market Watch Report
![]()
Brock Township Real Estate Market Analysis – March 2026
The Brock Township real estate market saw a significant correction in March 2026, with average sale prices dropping sharply following February’s spike. While pricing normalized, sales activity improved and inventory continued to build, keeping the market firmly in buyer’s territory, though showing early signs of stabilization.
March 2026
February 2026
Average Sale Price Corrects After February Spike
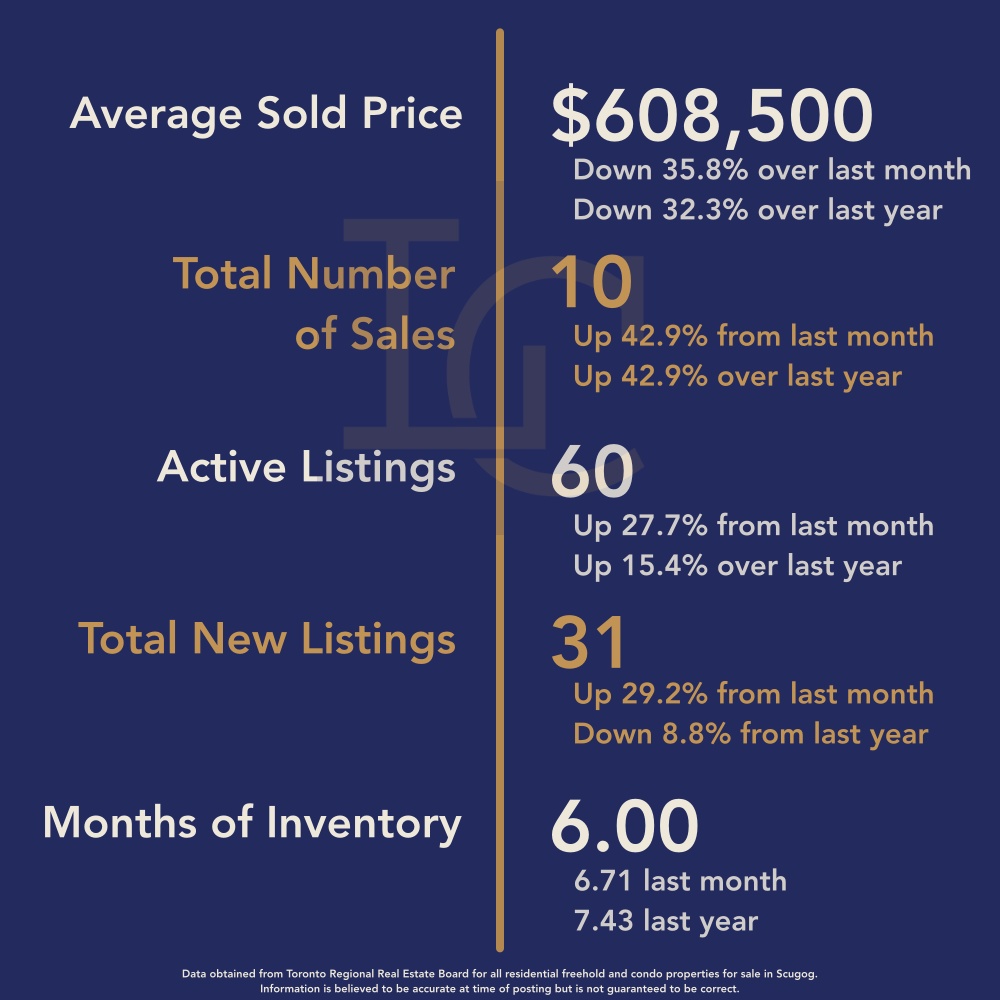
The average sale price in March 2026 was $608,500, representing:
- A 35.8% decrease from February 2026 ($948,143)
- A 32.3% decline from March 2025 ($898,214)
This sharp drop is largely due to the absence of high-value sales. In February, the market was heavily skewed by a $1,775,000 farm sale, which inflated the average.
In contrast, March’s highest sale was $770,000, with only two properties selling above $700,000, providing a much more realistic reflection of typical market pricing in Brock Township.
Sales Activity Rebounds
There were 10 homes sold in March, up from 7 in February 2026 and also higher than the 7 sales recorded in March 2025.
This increase suggests that more buyers re-entered the market as pricing became more accessible, especially after February’s artificially elevated averages.
Sale-to-List Price Ratio Improves
The sale-to-list price ratio rose to 97%, up from 94% in February, though still slightly below 98% from March 2025.
This indicates that while buyers still have negotiating power, sellers are achieving closer to their asking prices—likely due to more realistic pricing strategies.
Inventory Continues to Build
Supply levels increased during the month:
- Active listings: 60 (up from 47 in February and 52 last year)
- New listings: 31 (up from 24 last month, but slightly below 34 last year)
The rise in inventory is giving buyers more options and contributing to ongoing buyer-friendly conditions.
Days on Market & Buyer’s Market Conditions
Homes spent an average of 92 days on the market, reflecting slower absorption rates and more cautious buyer behaviour.
Months of inventory dipped slightly to 6.00, down from 6.71 in February, but still keeps Brock Township just within buyer’s market territory. This suggests that while conditions are still favouring buyers, the gap between supply and demand is beginning to narrow slightly.
Key Performance Indicators (KPIs) from January 2024 through March 2025 provide a clear snapshot of how the Township of Brock real estate market has evolved across all property types, architectural styles, and home configurations
*Information is believed to be accurate at time of posting but is not guaranteed to be correct. Some values may vary slightly based on the exact date and time the reports were generated. Market stats are provided by TRREB (Toronto Regional Real Estate Board) and are based on sales for the month of Attached/Row/Townhouses, Condo Apartments, Condo Townhouses, Detached, Detached with Common Elements, Link Homes and Semi-detached. *Some values may vary slightly based on the exact date and time the reports were generated.
Not intended as a solicitation if your property is already listed by another broker. Affiliated real estate agents are independent contractor sales associates, not employees. ©2021 Coldwell Banker. All Rights Reserved. Coldwell Banker and the Coldwell Banker logos are trademarks of Coldwell Banker Real Estate LLC. The Coldwell Banker® System is comprised of company owned offices which are owned by a subsidiary of Realogy Brokerage Group LLC and franchised offices which are independently owned and operated. The Coldwell Banker System fully supports the principles of the Fair Housing Act and the Equal Opportunity Act.
Click below for more reports
Check out our Uxbridge and Scugog Events Pages to keep up to date on whats going on around town. Click the links or scan the Code with your phone to take you directly there.
UXBRIDGE EVENTS
SCUGOG EVENTS
Durham Region Housing March 2026

Durham Region Housing March 2026
Each office is independently owned and operated
![]()
![]()
Housing Market Report for March 2026
Here is the Region of Durham Housing March 2026 report (all housing types), with reports from the Canadian Real Estate Association, and Toronto Regional Real Estate Board included.
This housing report for Durham Region includes the number of new listings, average list price, number of properties sold, average selling price, average days on market and average asking price to selling price ratio for all property types within the Region of Durham.
Scroll to the bottom for links to take you to the housing market reports for Uxbridge, Scugog and Brock.
![]()
![]()
From Toronto Regional Real Estate Board
Please note: The PropTx MLS® System, of which TRREB is a part, has added a number of new client boards over the last year. Many of these boards’ Members trade within the Greater Toronto Area and broader Greater Golden Horseshoe regions. As a result, historic data have been updated to reflect the addition of these boards’ listings and transactions. This means historic data have changed relative to previously published static reports. To view updated historic data, click here.
Toronto Regional Real Estate Board – Market Stats At A Glance – March 2026
Read the Toronto Regional Real Estate Board Market Watch Report
![]()
Durham Region Real Estate Market Analysis – March 2026
The Durham Region housing market picked up pace in March 2026, with a notable increase in sales activity, faster-moving homes, and tightening inventory levels. While prices softened slightly month-over-month and remain below last year’s levels, the overall trend points to a market gaining momentum as we move deeper into the spring season.
March 2026
February 2026
Average Sale Price Dips Slightly
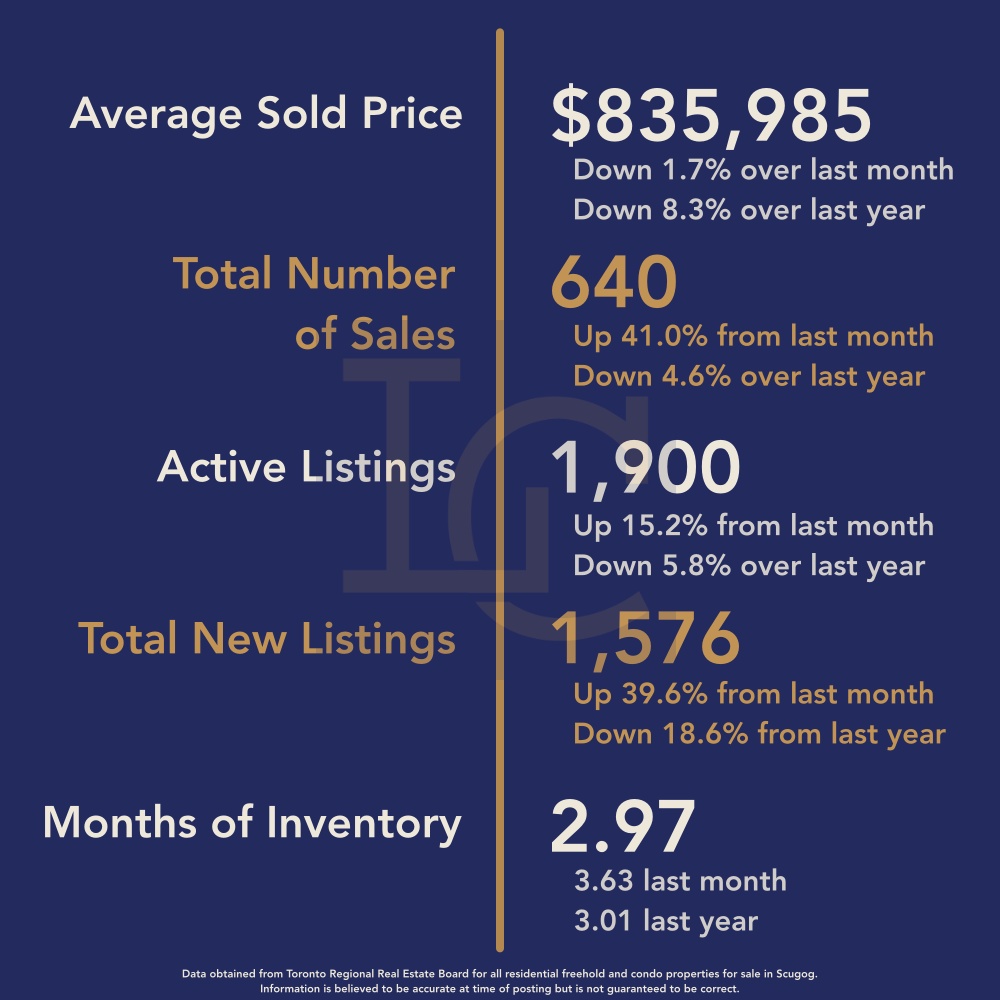
The average sale price in March came in at $835,985, down 1.7% from February’s $850,304 and 8.3% lower than March 2025’s $911,396.
While the monthly dip may seem counter to typical spring trends, it highlights continued affordability pressures and a more cautious buyer pool. That said, pricing remains relatively stable within a narrower range compared to the sharper fluctuations seen in previous years.
📈 Sale-to-List Price Ratio Returns to 100%
The sale-to-list price ratio rose to 100%, up from 98% in February, showing that well-priced homes are once again selling at full asking price on average.
Although still below the 101% seen last year, this increase signals strengthening demand and a more competitive environment as buyers re-enter the market ahead of peak spring activity.
📊 Sales Activity Jumps Month-Over-Month
Durham Region recorded 640 sales in March, a significant increase from 454 in February, though still slightly below the 671 sales reported in March 2025.
This sharp month-over-month gain reflects the typical spring surge in activity, as both buyers and sellers become more active. The year-over-year gap continues to narrow, suggesting improving market confidence.
📋 New Listings Rise with Spring Market
There were 1,576 new listings in March, up from 1,129 in February, as more sellers entered the market. However, this remains below the 1,937 listings recorded in March 2025, indicating a more cautious approach from homeowners compared to last year’s spring market.
The increase in listings is providing buyers with more choice, but not enough to significantly shift the balance of supply.
⏳ Homes Selling Faster, Inventory Tightens
The average days on market dropped to 38 days, down from 41 days in February, showing that homes are selling more quickly as demand picks up.
At the same time, months of inventory fell to 2.97, down from 3.63, placing the market right on the line between balanced and seller’s market territory. This tightening suggests that demand is beginning to outpace supply, especially for well-priced and well-presented homes.
Market Outlook
March 2026 marks a clear shift toward a more active spring market in Durham Region. While prices remain lower than last year, rising sales, improving sale-to-list ratios, and tightening inventory all point to increasing competition.
If these trends continue, we could see further upward pressure on pricing and a move toward stronger seller conditions in the coming months. However, much will depend on how quickly new listings enter the market and whether buyer demand continues to strengthen.
For now, Durham sits at a critical tipping point—transitioning from a balanced market toward a more competitive spring environment.
Key Performance Indicators (KPIs) from January 2024 through March 2026 provide a clear snapshot of how the Durham Region real estate market has evolved across all property types, architectural styles, and home configurations
*Information is believed to be accurate at time of posting but is not guaranteed to be correct. Some values may vary slightly based on the exact date and time the reports were generated. Market stats are provided by TRREB (Toronto Regional Real Estate Board) and are based on sales for the month of Attached/Row/Townhouses, Condo Apartments, Condo Townhouses, Detached, Detached with Common Elements, Link Homes and Semi-detached. *Some values may vary slightly based on the exact date and time the reports were generated.
Not intended as a solicitation if your property is already listed by another broker. Affiliated real estate agents are independent contractor sales associates, not employees. ©2021 Coldwell Banker. All Rights Reserved. Coldwell Banker and the Coldwell Banker logos are trademarks of Coldwell Banker Real Estate LLC. The Coldwell Banker® System is comprised of company owned offices which are owned by a subsidiary of Realogy Brokerage Group LLC and franchised offices which are independently owned and operated. The Coldwell Banker System fully supports the principles of the Fair Housing Act and the Equal Opportunity Act.
Click below for more reports
Check out our Uxbridge and Scugog Events Pages to keep up to date on whats going on around town. Click the links or scan the Code with your phone to take you directly there.
UXBRIDGE EVENTS
SCUGOG EVENTS
Uxbridge Housing February 2026

Uxbridge Housing February 2026
Each office is independently owned and operated
![]()
![]()
Housing Market Report for February 2026
Here is the Township of Uxbridge Housing February 2026 report (all housing types), with reports from the Canadian Real Estate Association, and Toronto Regional Real Estate Board included.
This housing report for Durham Region includes the number of new listings, average list price, number of properties sold, average selling price, average days on market and average asking price to selling price ratio for all property types within the Region of Durham.
Scroll to the bottom for links to take you to the housing market reports for Durham Region, Scugog and Brock.
![]()
![]()
From Toronto Regional Real Estate Board
Please note: The PropTx MLS® System, of which TRREB is a part, has added a number of new client boards over the last year. Many of these boards’ Members trade within the Greater Toronto Area and broader Greater Golden Horseshoe regions. As a result, historic data have been updated to reflect the addition of these boards’ listings and transactions. This means historic data have changed relative to previously published static reports. To view updated historic data, click here.
Toronto Regional Real Estate Board – Market Stats At A Glance – February 2026
Read the Toronto Regional Real Estate Board Market Watch Report
![]()
Uxbridge Township Real Estate Market Analysis – February 2026
The Uxbridge real estate market showed signs of renewed momentum in February 2026, with both sales activity and average home prices rebounding significantly from the slow start seen in January. The average sale price climbed to $1,333,667, representing a 33.8% increase from January’s $996,667 and an 18.7% rise compared to February 2025’s $1,123,318.
February 2026

January 2026
This sharp increase in average price is largely due to the mix of properties sold during the month. In January, only three homes sold for over $1 million, with two condominium sales under $800,000 pulling the average downward. February, however, saw a much stronger showing in the upper price ranges. Six properties sold between $1 million and $1.5 million, while two high-end properties sold for $2,375,000 and $2,975,000, pushing the overall average significantly higher.
Sales Activity
Sales activity improved as well, with 12 homes sold in February, doubling the 6 sales recorded in January and slightly exceeding the 11 sales reported in February 2025. This increase suggests that buyer activity is beginning to pick up as the market moves toward the traditionally busier spring season.
Sale-to-List Price Ratio
The sale-to-list price ratio rose to 96%, up from 94% in January. This improvement indicates that buyers and sellers are finding closer agreement on pricing, and well-priced properties are continuing to attract competitive offers.
Active Listings
Active listings increased to 77, compared to 67 in January and 72 in February 2025. While inventory has grown slightly, the rise is modest and reflects a gradual return of sellers to the market rather than a surge in supply.
New Listings
There were 40 new listings in February, unchanged from January’s total and slightly above the 35 new listings recorded in February last year. This steady level of new inventory suggests that sellers are re-entering the market at a measured pace.
Days on Market
Homes spent an average of 85 days on the market, a slight improvement from the slower winter pace but still reflective of more cautious buyer decision-making compared to the fast-moving markets seen in previous years.
Months of Inventory
One of the most notable changes this month is the drop in months of inventory to 6.42, down significantly from 11.17 in January. While this improvement reflects the increase in sales activity, the market still sits within buyer’s market territory, meaning buyers continue to enjoy a greater selection of homes and stronger negotiating power.
Conclusion
February 2026 marked a strong rebound for the Uxbridge housing market, with higher sales, rising prices, and a significant reduction in months of inventory. Much of the price increase can be attributed to the return of higher-value transactions, which shifted the average upward compared to January’s lower-priced sales mix.
While the market remains technically in buyer’s territory, the improved sales activity and stabilizing inventory levels suggest the market is beginning to regain momentum heading toward the spring market. Buyers may still benefit from negotiating room and a healthy selection of properties, while sellers who price their homes strategically may find renewed interest as market activity continues to build.
Key Performance Indicators (KPIs) from January 2024 through February 2026 provide a clear snapshot of how the Township of Uxbridge real estate market has evolved across all property types, architectural styles, and home configurations
WATCH OUR MONDAY MARKET MINUTES
*Information is believed to be accurate at time of posting but is not guaranteed to be correct. Some values may vary slightly based on the exact date and time the reports were generated. Market stats are provided by TRREB (Toronto Regional Real Estate Board) and are based on sales for the month of Attached/Row/Townhouses, Condo Apartments, Condo Townhouses, Detached, Detached with Common Elements, Link Homes and Semi-detached. *Some values may vary slightly based on the exact date and time the reports were generated.
Not intended as a solicitation if your property is already listed by another broker. Affiliated real estate agents are independent contractor sales associates, not employees. ©2021 Coldwell Banker. All Rights Reserved. Coldwell Banker and the Coldwell Banker logos are trademarks of Coldwell Banker Real Estate LLC. The Coldwell Banker® System is comprised of company owned offices which are owned by a subsidiary of Realogy Brokerage Group LLC and franchised offices which are independently owned and operated. The Coldwell Banker System fully supports the principles of the Fair Housing Act and the Equal Opportunity Act.
Click below for more reports
Check out our Uxbridge and Scugog Events Pages to keep up to date on whats going on around town. Click the links or scan the Code with your phone to take you directly there.
UXBRIDGE EVENTS
SCUGOG EVENTS
Scugog Housing February 2026

Scugog Housing February 2026
Each office is independently owned and operated
![]()
![]()
Housing Market Report for February 2026
Here is the Township of Scugog Housing February 2026 report (all housing types), with reports from the Canadian Real Estate Association, and Toronto Regional Real Estate Board included.
This housing report for Durham Region includes the number of new listings, average list price, number of properties sold, average selling price, average days on market and average asking price to selling price ratio for all property types within the Region of Durham.
Scroll to the bottom for links to take you to the housing market reports for Durham Region, Uxbridge and Brock.
![]()
![]()
From Toronto Regional Real Estate Board
Please note: The PropTx MLS® System, of which TRREB is a part, has added a number of new client boards over the last year. Many of these boards’ Members trade within the Greater Toronto Area and broader Greater Golden Horseshoe regions. As a result, historic data have been updated to reflect the addition of these boards’ listings and transactions. This means historic data have changed relative to previously published static reports. To view updated historic data, click here.
Toronto Regional Real Estate Board – Market Stats At A Glance – February 2026
Read the Toronto Regional Real Estate Board Market Watch Report
![]()
Scugog Township Real Estate Market Analysis – February 2026
The Township of Scugog’s housing market saw rising prices in February 2026, though overall activity slowed compared to the previous month. A small number of higher-end transactions helped push the average sale price above the $1 million mark, while a drop in sales combined with rising inventory shifted the market toward buyer-favorable conditions.
February 2026
January 2026
Average Sales Price
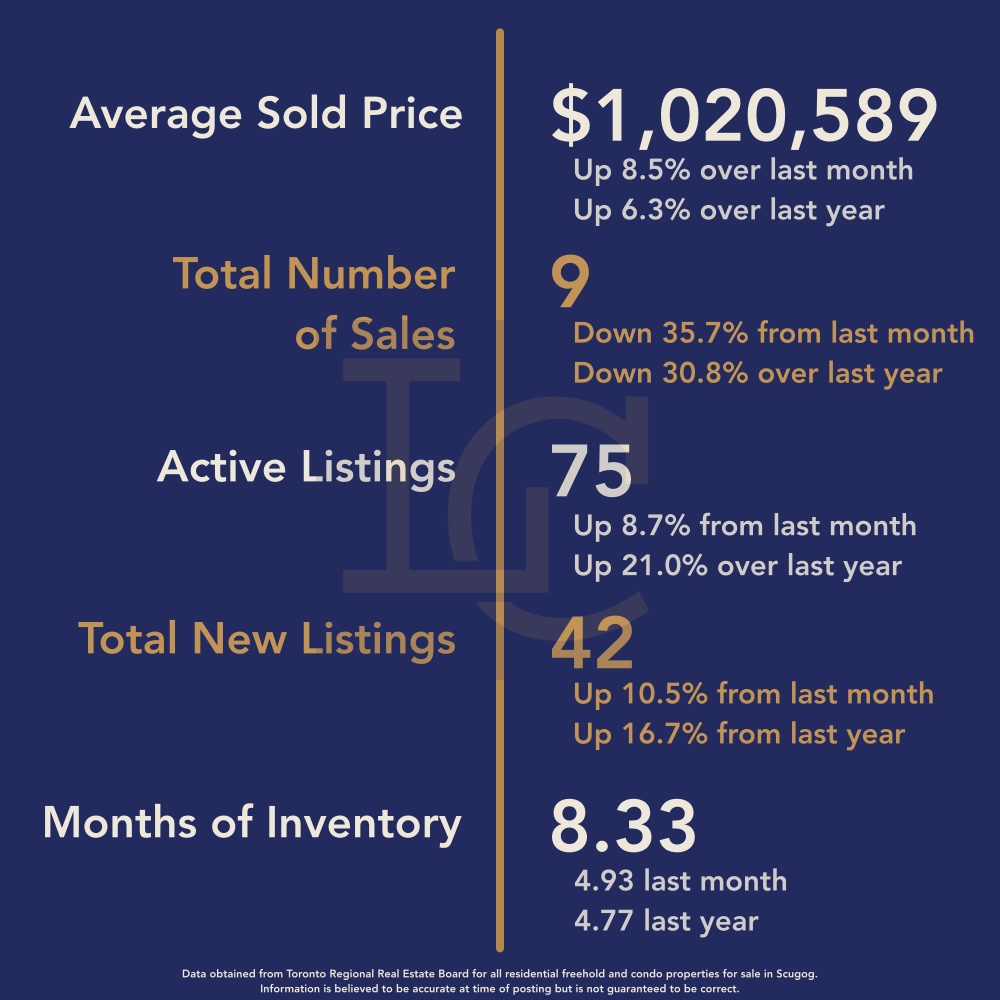
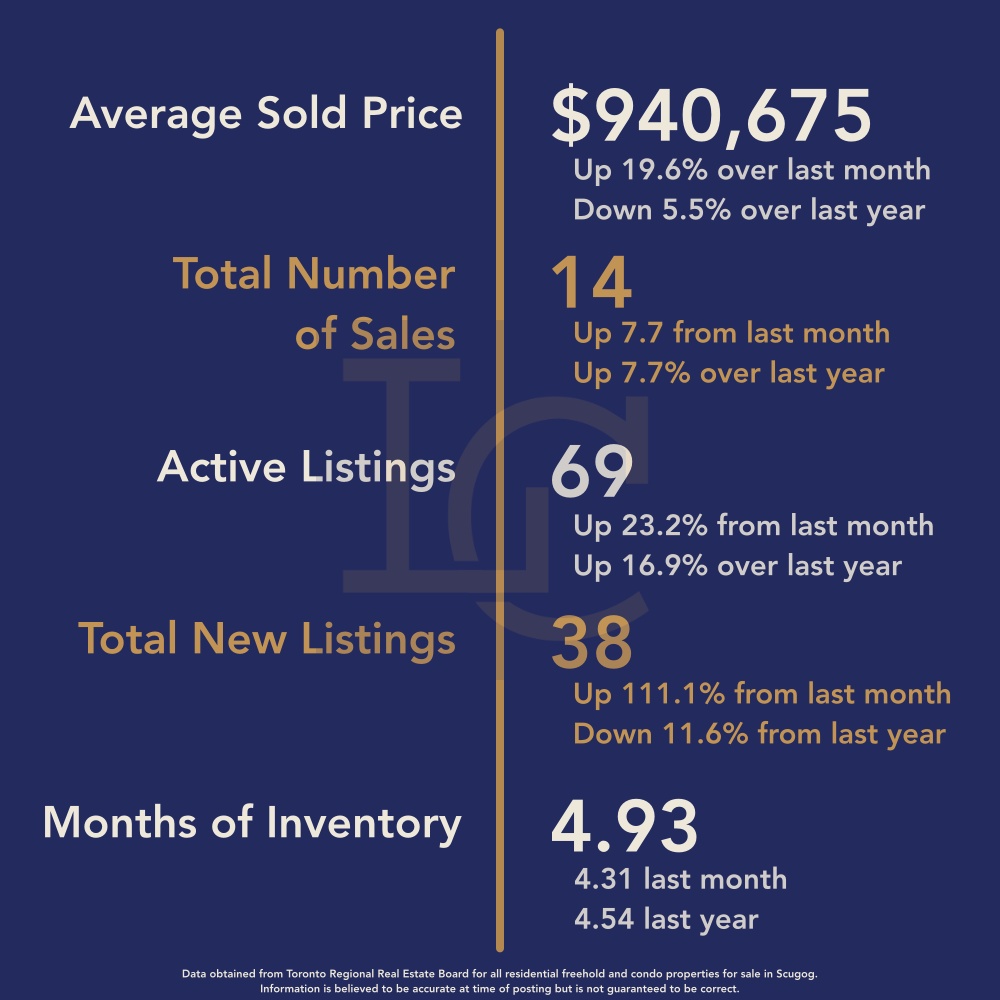
The average sales price in February 2026 reached $1,020,589, representing an 8.5% increase from January’s $940,675 and a 6.3% rise year-over-year compared to $960,538 in February 2025.
However, it’s important to note that the monthly average was influenced by several luxury transactions. Of the 11 properties sold in February, two sold for over $1.5 million, including one at $1,750,000. By comparison, January’s highest sale was $1,320,000, and 11 of the 16 homes sold that month were under $1 million.
These higher-end February sales significantly lifted the monthly average, demonstrating how shifts in the mix of properties sold can influence overall price statistics in a smaller market like Scugog.
Sales Activity
February saw 9 total sales, down from 14 in January and 13 sales in February 2025. This decrease in transaction volume suggests a slower pace of buyer activity compared to the start of the year.
Despite fewer sales, the sale-to-list price ratio improved to 98%, up from 97% in January. This indicates that properties which did sell were priced competitively and attracted strong offers relative to their asking prices.
Listings & Inventory
Housing supply continued to grow in February:
-
Active listings rose to 75, compared to 69 in January and 62 in February 2025.
-
New listings increased to 42, up from 38 last month and 36 last year.
The steady rise in both active and new listings provided buyers with more options, which contributed to the shift in market conditions.
As a result, the months of inventory climbed to 8.33, up sharply from 4.93 in January. This increase pushed the market into buyer’s market territory, where supply outpaces demand and buyers typically gain stronger negotiating power.
Days on Market
Homes sold relatively quickly in February, averaging 40 days on market. This suggests that while overall sales volume was lower, well-priced properties were still able to attract buyers within a reasonable timeframe.
Key Takeaways
-
Average prices rose above $1 million, largely influenced by two luxury home sales.
-
Sales volume declined, reflecting slower buyer activity compared to January.
-
Inventory continued to rise, with more homes available for buyers.
-
Months of inventory increased to 8.33, shifting the market into buyer’s market territory.
-
Sale-to-list ratios improved, indicating competitive offers on desirable properties.
Market Outlook
February’s data suggests that while higher-end sales lifted prices, the broader market is experiencing slower demand relative to available supply. With inventory rising and sales slowing, buyers may find increased opportunities and negotiating power in the months ahead.
As Scugog moves closer to the spring market, the key factor to watch will be whether buyer activity picks up to absorb the growing inventory. If demand strengthens, the market could quickly shift back toward balanced conditions as we move into the traditionally busier real estate season.
Key Performance Indicators (KPIs) from January 2024 through February 2026 provide a clear snapshot of how the Township of Scugog real estate market has evolved across all property types, architectural styles, and home configurations
WATCH OUR MONDAY MARKET MINUTES
*Information is believed to be accurate at time of posting but is not guaranteed to be correct. Some values may vary slightly based on the exact date and time the reports were generated. Market stats are provided by TRREB (Toronto Regional Real Estate Board) and are based on sales for the month of Attached/Row/Townhouses, Condo Apartments, Condo Townhouses, Detached, Detached with Common Elements, Link Homes and Semi-detached. *Some values may vary slightly based on the exact date and time the reports were generated.
Not intended as a solicitation if your property is already listed by another broker. Affiliated real estate agents are independent contractor sales associates, not employees. ©2021 Coldwell Banker. All Rights Reserved. Coldwell Banker and the Coldwell Banker logos are trademarks of Coldwell Banker Real Estate LLC. The Coldwell Banker® System is comprised of company owned offices which are owned by a subsidiary of Realogy Brokerage Group LLC and franchised offices which are independently owned and operated. The Coldwell Banker System fully supports the principles of the Fair Housing Act and the Equal Opportunity Act.
Click below for more reports
Check out our Uxbridge and Scugog Events Pages to keep up to date on whats going on around town. Click the links or scan the Code with your phone to take you directly there.
UXBRIDGE EVENTS
SCUGOG EVENTS
Brock Housing February 2026

Brock Housing February 2026
Each office is independently owned and operated
![]()
![]()
Housing Market Report for February 2026
Here is the Township of Brock Housing February 2026 report (all housing types), with reports from the Canadian Real Estate Association, and Toronto Regional Real Estate Board included.
This housing report for Durham Region includes the number of new listings, average list price, number of properties sold, average selling price, average days on market and average asking price to selling price ratio for all property types within the Region of Durham.
Scroll to the bottom for links to take you to the housing market reports for Durham Region, Uxbridge and Scugog.
![]()
![]()
From Toronto Regional Real Estate Board
Please note: The PropTx MLS® System, of which TRREB is a part, has added a number of new client boards over the last year. Many of these boards’ Members trade within the Greater Toronto Area and broader Greater Golden Horseshoe regions. As a result, historic data have been updated to reflect the addition of these boards’ listings and transactions. This means historic data have changed relative to previously published static reports. To view updated historic data, click here.
Market Stats at a Glance – Toronto Regional Real Estate Board February 2026
Read the Toronto Regional Real Estate Board Market Watch Report
![]()
Brock Township Real Estate Market Analysis – February 2026
The Brock Township real estate market saw a notable jump in average sale price in February 2026, though the increase was largely influenced by a single high-value farm sale. At the same time, sales activity slowed and inventory levels increased, pushing the market back into buyer’s market territory.
February 2026
January 2026
Average Sale Price Surges Due to Farm Sale
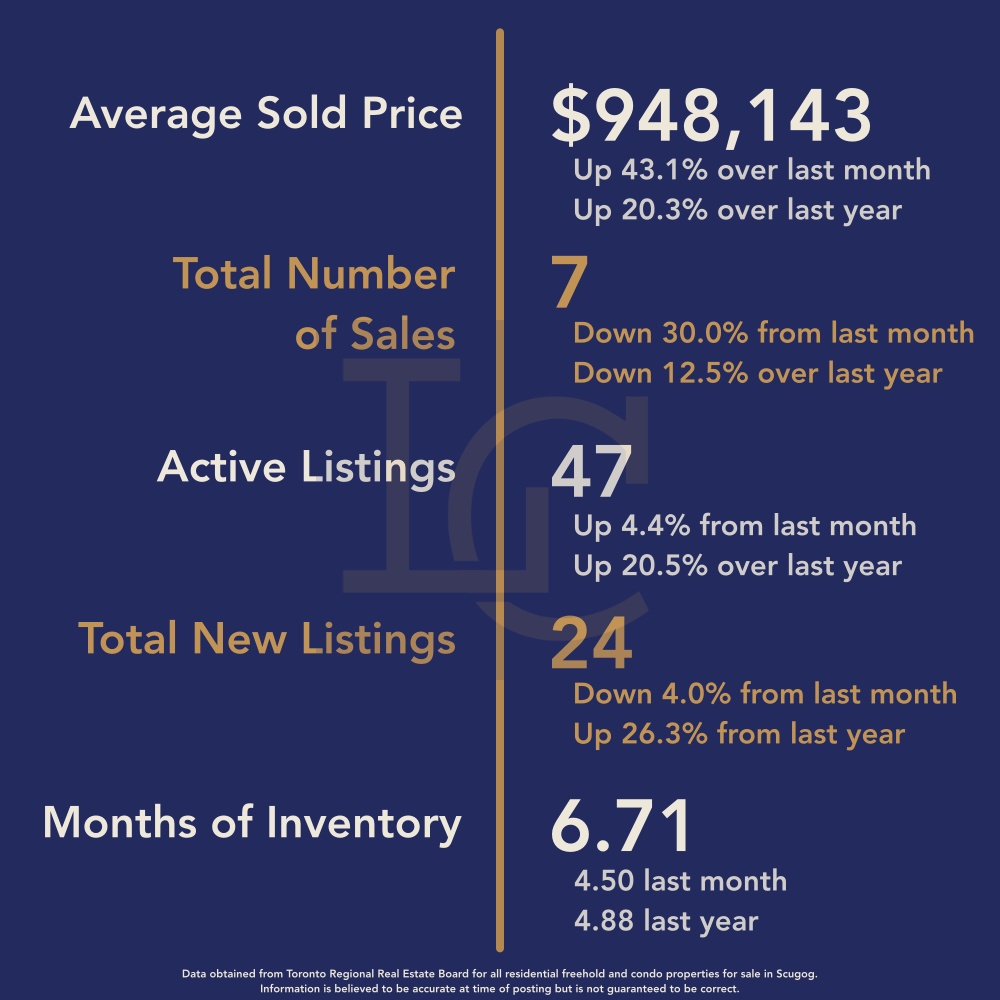
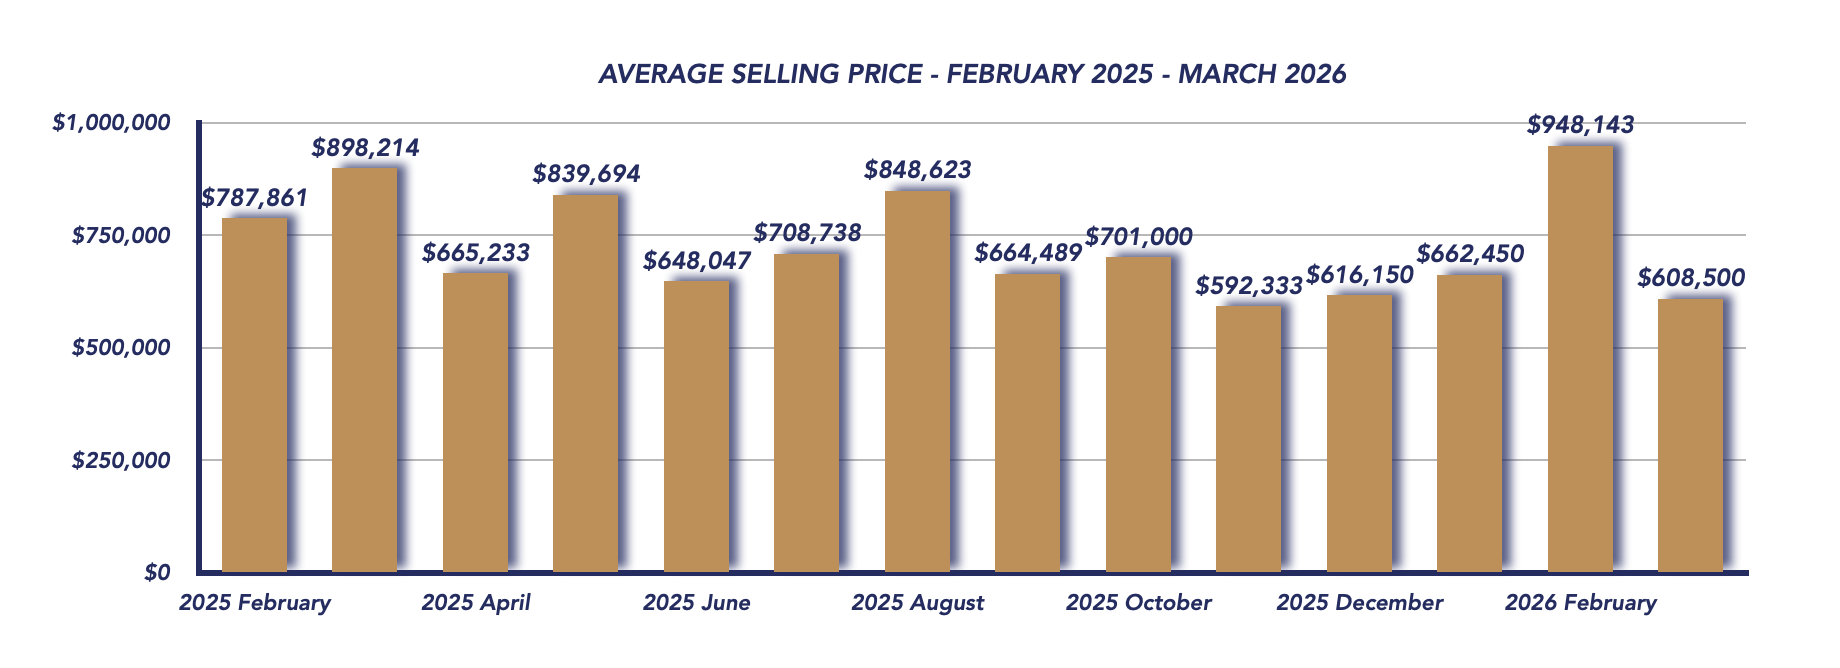
The average sale price in February 2026 reached $948,143, representing:
-
A 43.1% increase from January 2026 ($662,450)
-
A 20.3% increase from February 2025 ($787,861)
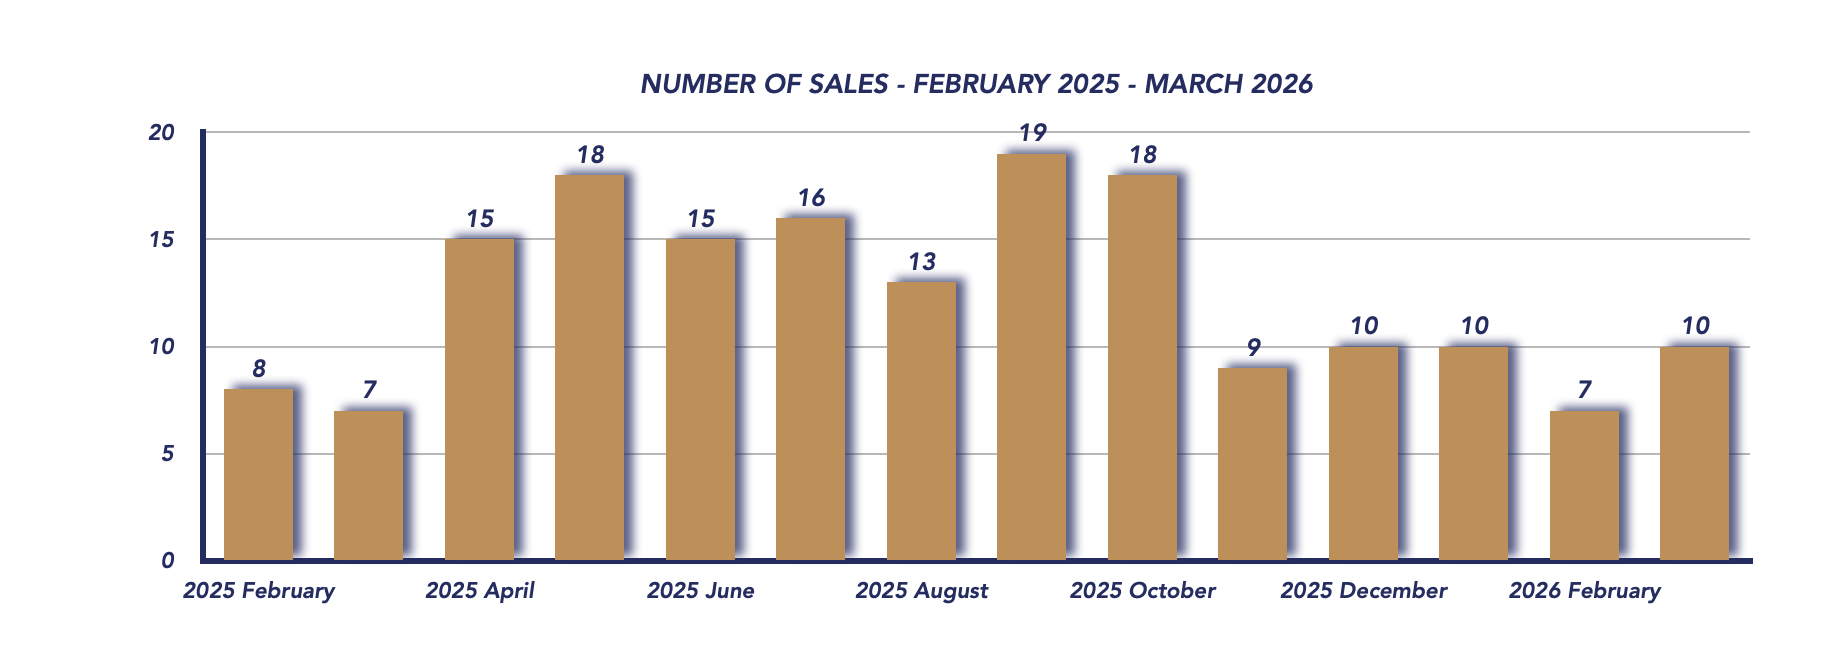
However, it’s important to view this figure in context. Of the 7 properties sold in February, one farm property sold for $1,775,000, significantly elevating the monthly average. The remaining six properties all sold for under $810,000, indicating that most of the market activity continues to occur in the mid-range price segments typical for Brock Township.
Sales Activity Slows
There were 7 homes sold in February, down from 10 sales in January 2026 and slightly below the 8 sales recorded in February 2025.
While February can often be a transitional month leading into the spring market, the lower number of transactions suggests buyers may still be taking a cautious approach while waiting for more listings to appear.
Sale-to-List Price Ratio Declines
The sale-to-list price ratio dropped to 94%, compared to:
-
98% in January 2026
-
95% in February 2025
This indicates that buyers are negotiating more aggressively and sellers may be adjusting expectations to meet current market conditions.
Inventory Levels Begin to Climb
Inventory increased slightly during the month:
-
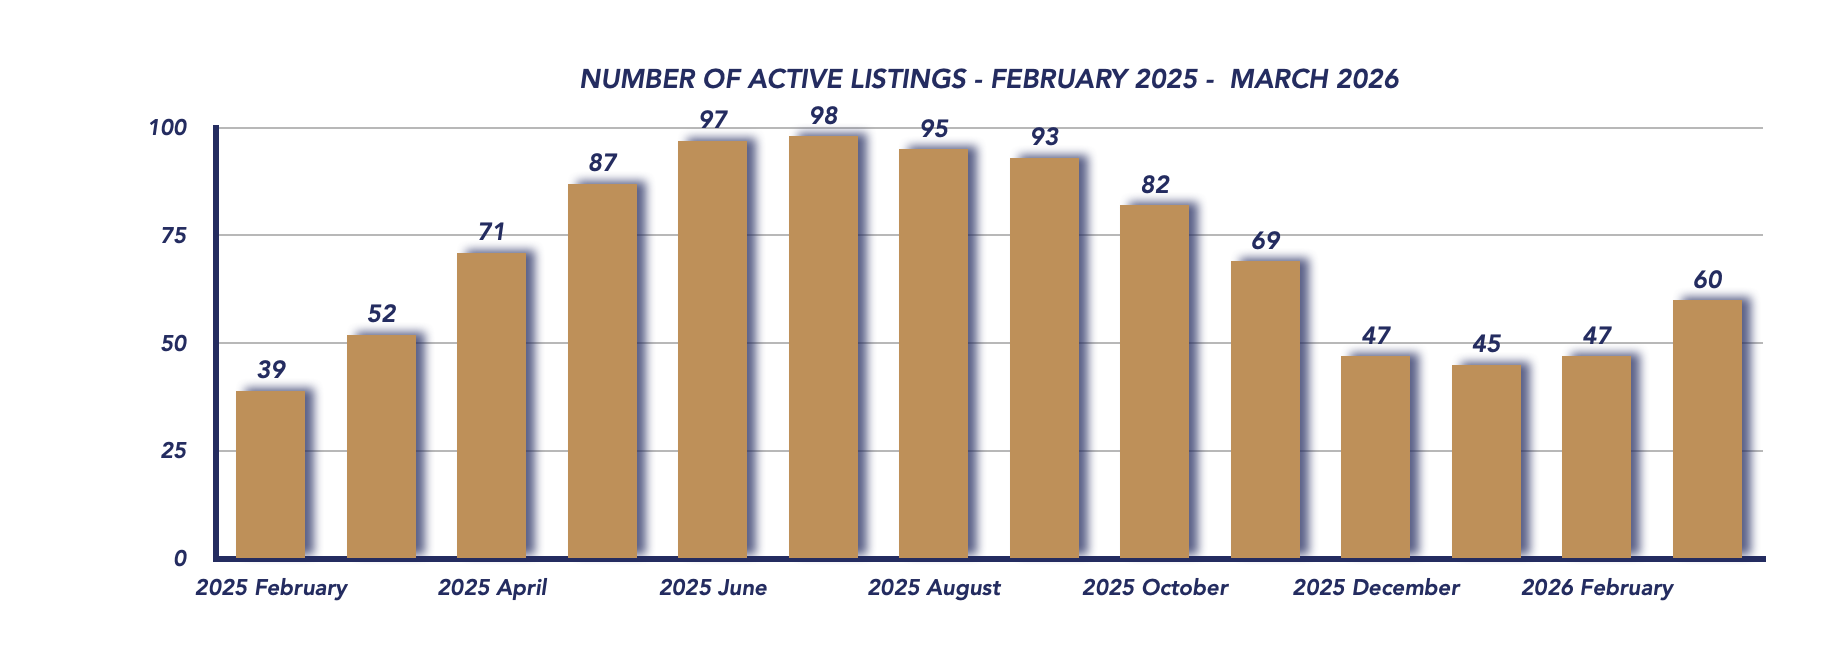
Active listings: 47 (up from 45 in January and 39 last year)
-
New listings: 24 (similar to 25 in January, and higher than 19 last year)
The steady increase in available homes is providing buyers with more choice as we move closer to the spring market.
Days on Market & Market Conditions
Homes spent an average of 115 days on the market, though this figure is somewhat skewed by the farm sale, which took longer to complete. Excluding that transaction would likely bring the average closer to typical levels for the area.
More notably, months of inventory rose to 6.71, up from 4.50 in January, shifting Brock Township back into buyer’s market territory. This suggests supply is beginning to outpace demand, giving buyers increased negotiating power.
Conclusion
February 2026 presented a mixed picture for the Brock Township housing market. While the headline average price surged, much of that increase was driven by a single high-value property. At the same time, sales activity slowed and inventory levels rose, pushing the market toward conditions that favour buyers.
As we move toward the spring market, the key factor to watch will be whether sales activity picks up to match the growing inventory levels. If demand strengthens, the market could quickly return to balanced conditions.
Key Performance Indicators (KPIs) from January 2024 through February 2026 provide a clear snapshot of how the Township of Brock real estate market has evolved across all property types, architectural styles, and home configurations

*Information is believed to be accurate at time of posting but is not guaranteed to be correct. Some values may vary slightly based on the exact date and time the reports were generated. Market stats are provided by TRREB (Toronto Regional Real Estate Board) and are based on sales for the month of Attached/Row/Townhouses, Condo Apartments, Condo Townhouses, Detached, Detached with Common Elements, Link Homes and Semi-detached. *Some values may vary slightly based on the exact date and time the reports were generated.
Not intended as a solicitation if your property is already listed by another broker. Affiliated real estate agents are independent contractor sales associates, not employees. ©2021 Coldwell Banker. All Rights Reserved. Coldwell Banker and the Coldwell Banker logos are trademarks of Coldwell Banker Real Estate LLC. The Coldwell Banker® System is comprised of company owned offices which are owned by a subsidiary of Realogy Brokerage Group LLC and franchised offices which are independently owned and operated. The Coldwell Banker System fully supports the principles of the Fair Housing Act and the Equal Opportunity Act.
Click below for more reports
Check out our Uxbridge and Scugog Events Pages to keep up to date on whats going on around town. Click the links or scan the Code with your phone to take you directly there.
UXBRIDGE EVENTS
SCUGOG EVENTS
Durham Region Housing February 2026

Durham Region Housing February 2026
Each office is independently owned and operated
![]()
![]()
Housing Market Report for February 2026
Here is the Region of Durham Housing February 2026 report (all housing types), with reports from the Canadian Real Estate Association, and Toronto Regional Real Estate Board included.
This housing report for Durham Region includes the number of new listings, average list price, number of properties sold, average selling price, average days on market and average asking price to selling price ratio for all property types within the Region of Durham.
Scroll to the bottom for links to take you to the housing market reports for Uxbridge, Scugog and Brock.
![]()
![]()
From Toronto Regional Real Estate Board
Please note: The PropTx MLS® System, of which TRREB is a part, has added a number of new client boards over the last year. Many of these boards’ Members trade within the Greater Toronto Area and broader Greater Golden Horseshoe regions. As a result, historic data have been updated to reflect the addition of these boards’ listings and transactions. This means historic data have changed relative to previously published static reports. To view updated historic data, click here.
Toronto Regional Real Estate Board – Market Stats At A Glance – February 2026
Read the Toronto Regional Real Estate Board Market Watch Report
![]()
Durham Region Real Estate Market Analysis – February 2026
The Durham Region housing market showed early signs of seasonal momentum in February 2026, with home prices rebounding month-over-month, sales activity increasing slightly, and market conditions continuing to hold steady in balanced territory. While year-over-year figures remain softer, the month’s data suggests the market may be gradually warming as we approach the spring real estate season.
February 2026
January 2026
Average Sale Price Rebounds Month-Over-Month
The average sale price in February came in at $850,304, representing a 3.9% increase from January’s $818,695. Despite the monthly rebound, prices were still 5.3% lower than February 2025, when the average sale price was $897,759.
This month-over-month increase is typical as activity begins to pick up after the slower winter months. Buyers who delayed decisions in January often re-enter the market in February, contributing to upward pressure on prices.
Sales Activity Edges Higher
Durham Region recorded 454 sales in February, up from 412 transactions in January, but still below the 555 sales reported in February 2025.
The modest monthly increase aligns with the gradual buildup toward the spring market. While sales remain lower compared to last year, the improvement from January suggests that buyer confidence is slowly returning.
Sale-to-List Price Ratio Improves
The sale-to-list price ratio rose to 99%, up from 98% in January, indicating that buyers are once again paying closer to asking price for well-priced homes. However, the ratio remains below February 2025’s 101%, showing that while demand is strengthening slightly, the market is still less competitive than it was a year ago.
This suggests that buyers continue to have some negotiating room, particularly on properties that are priced aggressively or have been on the market longer.
New Listings Rise Slightly
There were 1,129 new listings in February, a slight increase from 1,084 in January, but still below the 1,229 new listings recorded last February.
The small uptick in new inventory reflects sellers preparing for the spring market, though many may still be waiting for stronger conditions before listing their homes. This cautious approach continues to keep supply from growing too quickly.
Homes Selling Faster Than in January
The average days on market dropped to 41 days, down significantly from 59 days in January. This improvement suggests buyers are becoming more active and decisive as the market begins to pick up momentum.
Meanwhile, months of inventory held steady at 3.63, nearly unchanged from 3.64 in January, keeping Durham Region firmly in balanced market territory. In this environment, neither buyers nor sellers hold a strong advantage, and successful transactions depend on accurate pricing and realistic expectations.
Market Outlook
February’s numbers suggest that the Durham Region real estate market is beginning to transition out of its winter lull. While prices and sales remain lower than last year, the month-over-month improvements in pricing, activity, and days on market point toward a gradual recovery as we approach the traditionally busy spring season.
If listing activity increases in the coming months, buyers could see more choice in the market. At the same time, continued demand could help stabilize pricing as the market moves further into 2026.
For now, Durham continues to operate in a stable, balanced environment, offering opportunities for both buyers and sellers who approach the market with the right strategy.
Key Performance Indicators (KPIs) from January 2024 through February 2026 provide a clear snapshot of how the Durham Region real estate market has evolved across all property types, architectural styles, and home configurations

*Information is believed to be accurate at time of posting but is not guaranteed to be correct. Some values may vary slightly based on the exact date and time the reports were generated. Market stats are provided by TRREB (Toronto Regional Real Estate Board) and are based on sales for the month of Attached/Row/Townhouses, Condo Apartments, Condo Townhouses, Detached, Detached with Common Elements, Link Homes and Semi-detached. *Some values may vary slightly based on the exact date and time the reports were generated.
Not intended as a solicitation if your property is already listed by another broker. Affiliated real estate agents are independent contractor sales associates, not employees. ©2021 Coldwell Banker. All Rights Reserved. Coldwell Banker and the Coldwell Banker logos are trademarks of Coldwell Banker Real Estate LLC. The Coldwell Banker® System is comprised of company owned offices which are owned by a subsidiary of Realogy Brokerage Group LLC and franchised offices which are independently owned and operated. The Coldwell Banker System fully supports the principles of the Fair Housing Act and the Equal Opportunity Act.
Click below for more reports
Check out our Uxbridge and Scugog Events Pages to keep up to date on whats going on around town. Click the links or scan the Code with your phone to take you directly there.
UXBRIDGE EVENTS
SCUGOG EVENTS
Uxbridge Housing January 2026

Uxbridge Housing January 2026
Each office is independently owned and operated
![]()
![]()
Housing Market Report for January 2026
Here is the Township of Uxbridge Housing January 2026 report (all housing types), with reports from the Canadian Real Estate Association, and Toronto Regional Real Estate Board included.
This housing report for Durham Region includes the number of new listings, average list price, number of properties sold, average selling price, average days on market and average asking price to selling price ratio for all property types within the Region of Durham.
Scroll to the bottom for links to take you to the housing market reports for Durham Region, Scugog and Brock.
![]()
![]()
From Toronto Regional Real Estate Board
Please note: The PropTx MLS® System, of which TRREB is a part, has added a number of new client boards over the last year. Many of these boards’ Members trade within the Greater Toronto Area and broader Greater Golden Horseshoe regions. As a result, historic data have been updated to reflect the addition of these boards’ listings and transactions. This means historic data have changed relative to previously published static reports. To view updated historic data, click here.
Toronto Regional Real Estate Board – Market Stats At A Glance – January 2026
Read the Toronto Regional Real Estate Board Market Watch Report
![]()
Uxbridge Township Real Estate Market Analysis – January 2026
The Uxbridge housing market began the new year with a noticeable slowdown, reflecting typical seasonal trends combined with softer price performance. The average sale price in January was $996,667, representing a 16.3% decrease from December’s $1,190,682 and a significant 27% decline compared to January 2024’s $1,365,264.
January 2026
December 2025
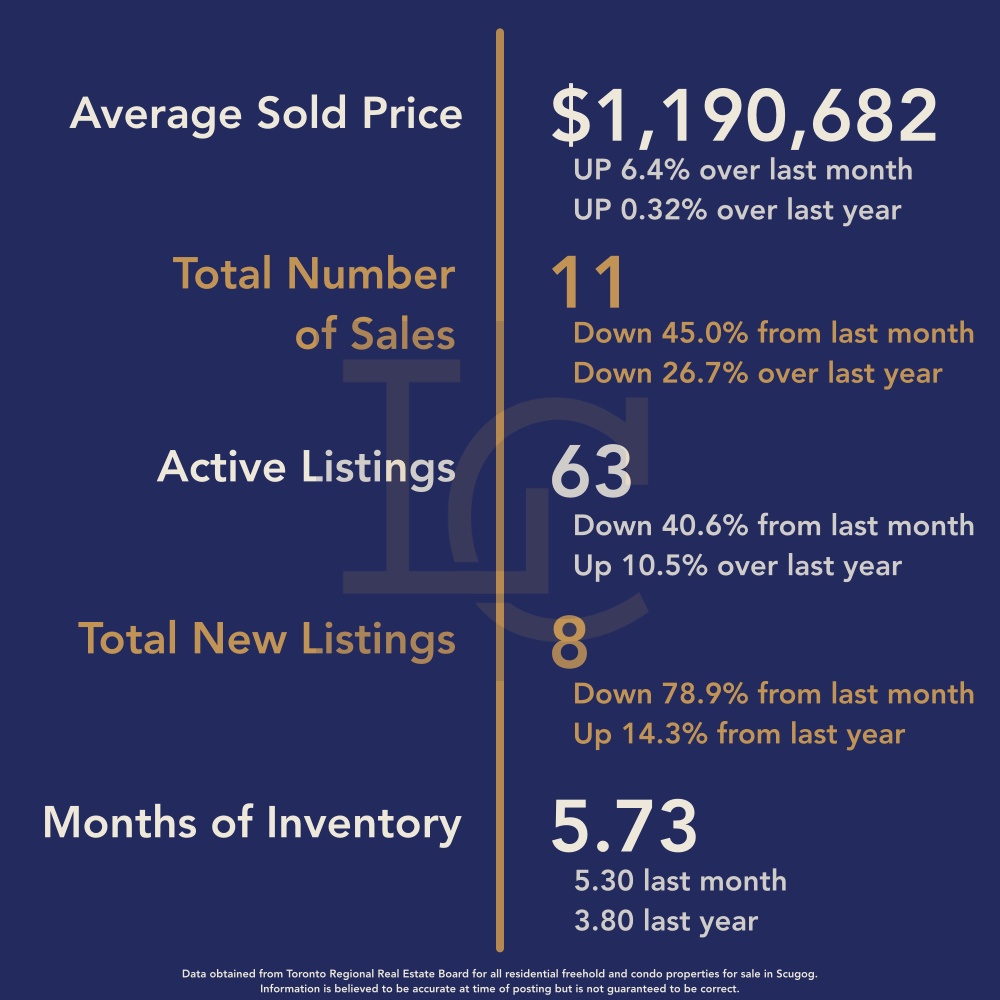
This sharp drop in average price is largely influenced by the type of properties sold during the month. In December, the market included one sale over $2 million and five between $1–$2 million, helping to support higher averages. In contrast, January saw only three properties sell above $1 million, with the highest sale reaching $1,390,000, and two condominium sales under $800,000, which pulled the overall average lower. With just six total sales, even a small shift in price mix significantly impacts the monthly average.
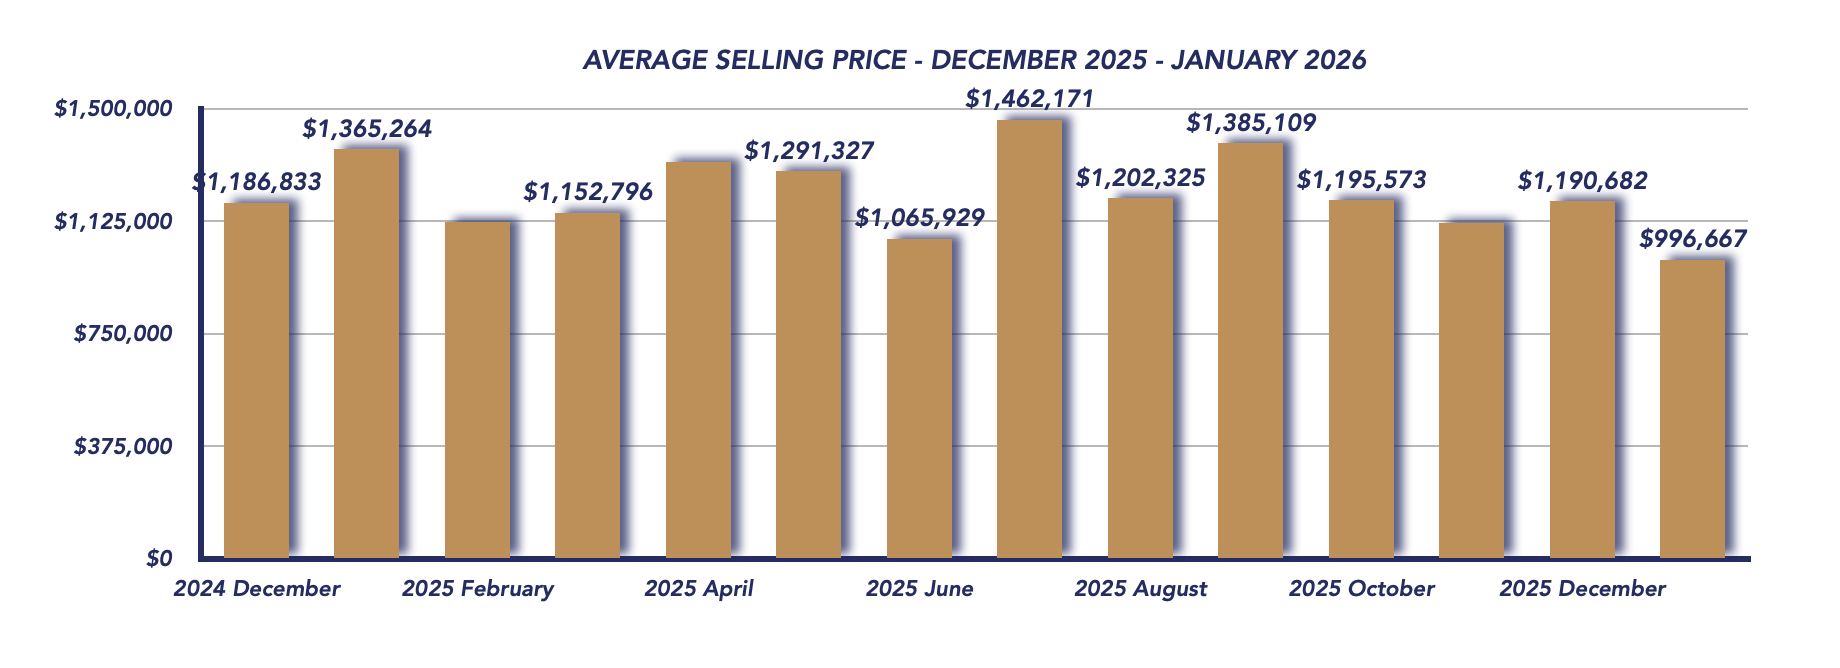
Sales Activity
Total sales fell to just 6 transactions, down from 11 in December and 11 in January 2024. This represents a sharp decline in activity and highlights the slower pace typical of early winter markets. However, this drop is more pronounced than usual and signals a cautious start to the year for buyers.
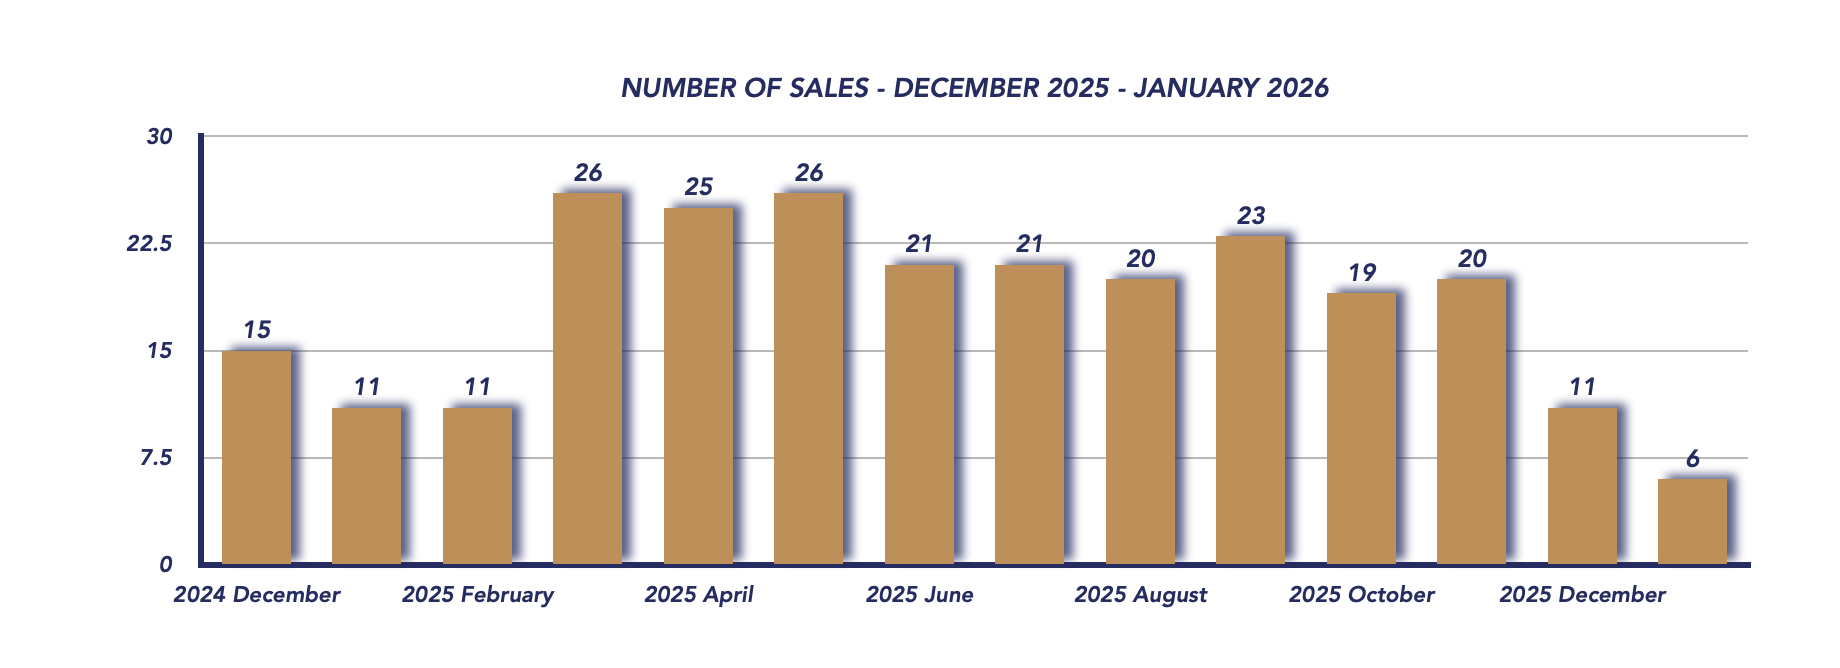
Sale-to-List Price Ratio
The sale-to-list price ratio edged up to 94%, compared to 93% in December. While still below fall levels, this slight improvement suggests that sellers who priced appropriately were able to secure competitive offers despite reduced demand.
Active Listings
Inventory remained relatively stable with 67 active listings, slightly up from 63 in December and 64 last January. While supply hasn’t surged dramatically, the significant drop in sales activity has increased overall market balance in favour of buyers.
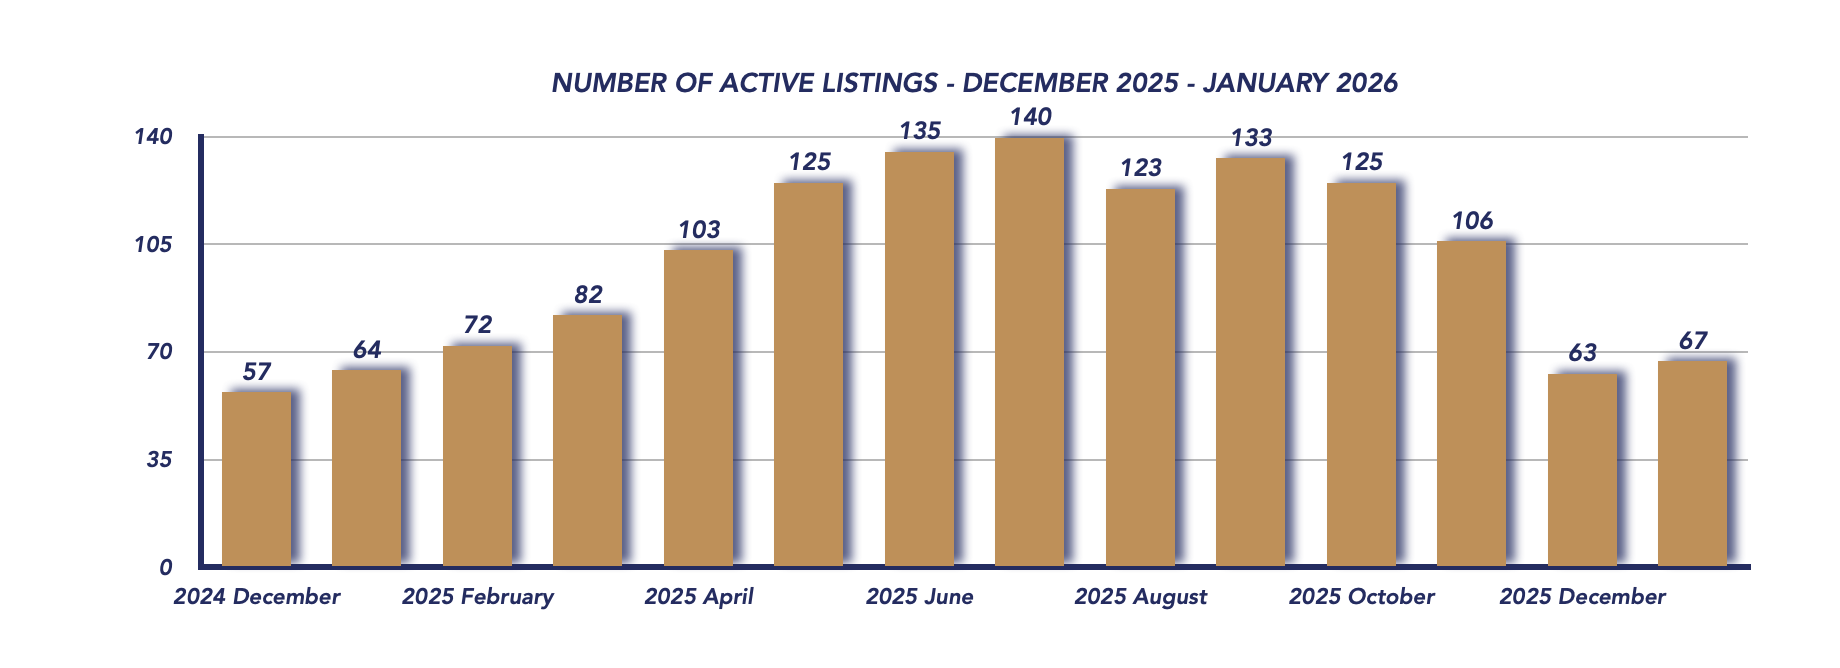
New Listings
There were 40 new listings in January, a sharp increase from 8 in December and similar to the 42 new listings recorded in January 2024. This jump is typical for the new year, as many sellers who removed their properties during the holidays reintroduce them to the market in January.
The combination of returning listings and slower buyer activity has contributed to a growing supply-demand imbalance.
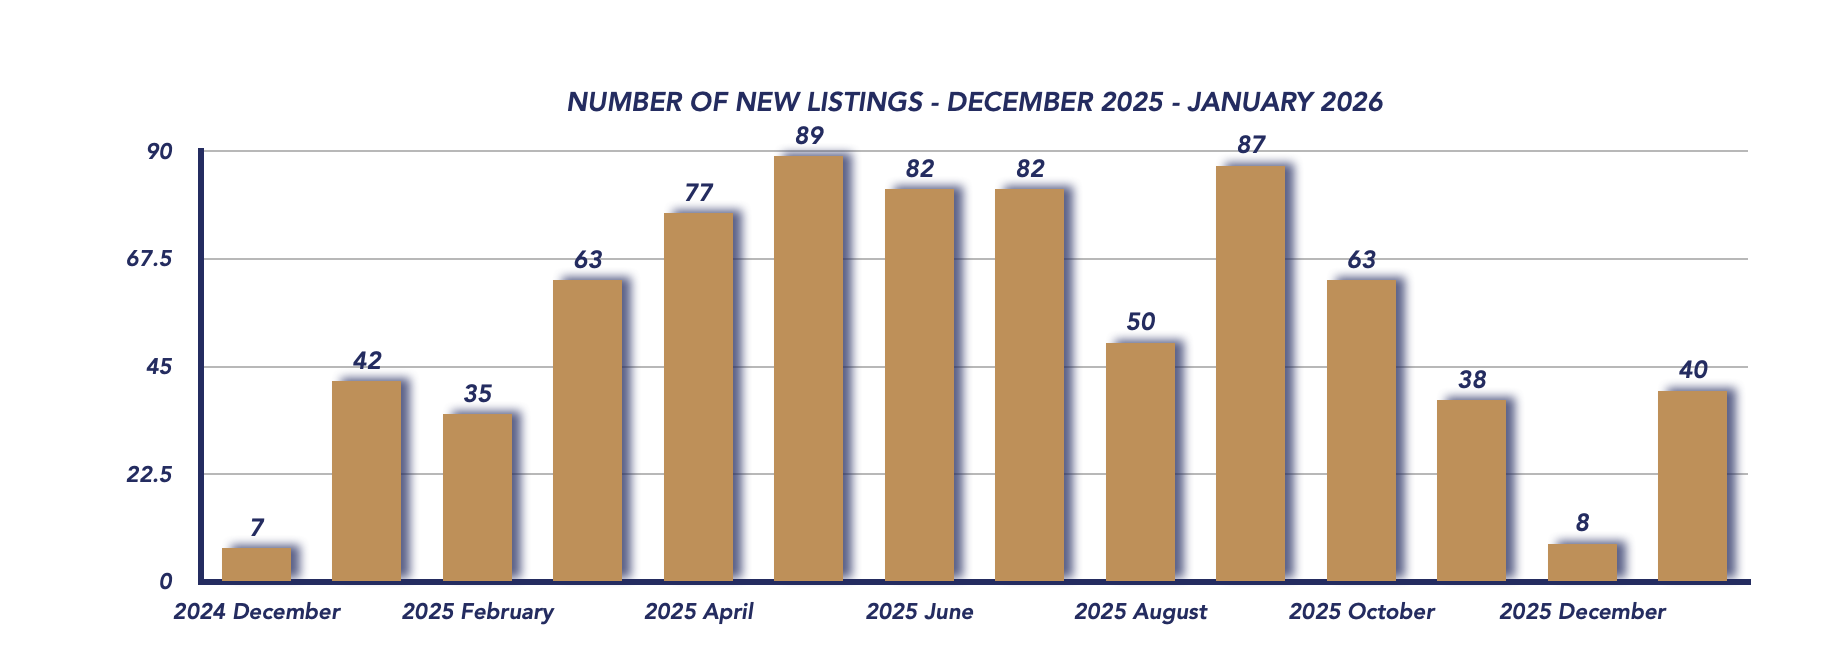
Days on Market
Homes took an average of 91 days to sell, down from 129 days in December’s reported year-end figure reset, but still reflecting slower winter market conditions. Buyers are taking their time, and negotiations remain more deliberate.
Months of Inventory
The most significant shift this month is reflected in months of inventory, which jumped to 11.17, up from 5.73 in December. This dramatic increase pushes Uxbridge firmly into buyer’s market territory, indicating that at the current pace of sales, it would take over 11 months to clear existing inventory.
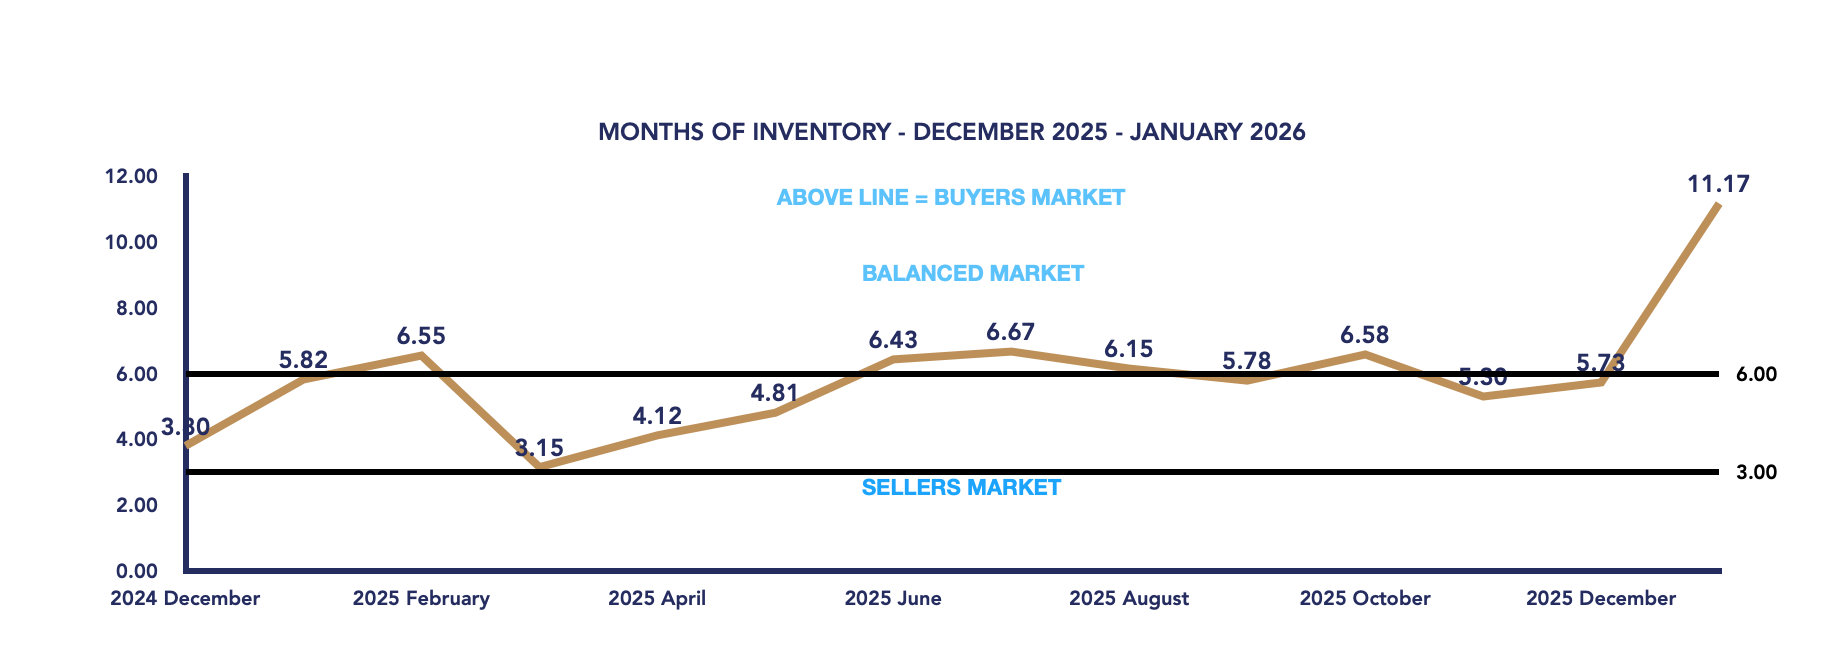
Conclusion
January 2026 marks a slow and buyer-favourable start to the year for Uxbridge real estate. Lower sales volume, softer pricing, and rising months of inventory highlight a market adjusting to seasonal realities and cautious buyer sentiment.
However, January trends often set the tone only temporarily. As we move toward the spring market, increased activity could rebalance conditions. For now, buyers benefit from more negotiating power and greater selection, while sellers must focus on competitive pricing and strong presentation to stand out in a more competitive environment.
If you’re considering buying or selling in 2026, early preparation and strategy will be key in navigating this shifting market landscape.
Key Performance Indicators (KPIs) from January 2024 through January 2026 provide a clear snapshot of how the Township of Uxbridge real estate market has evolved across all property types, architectural styles, and home configurations
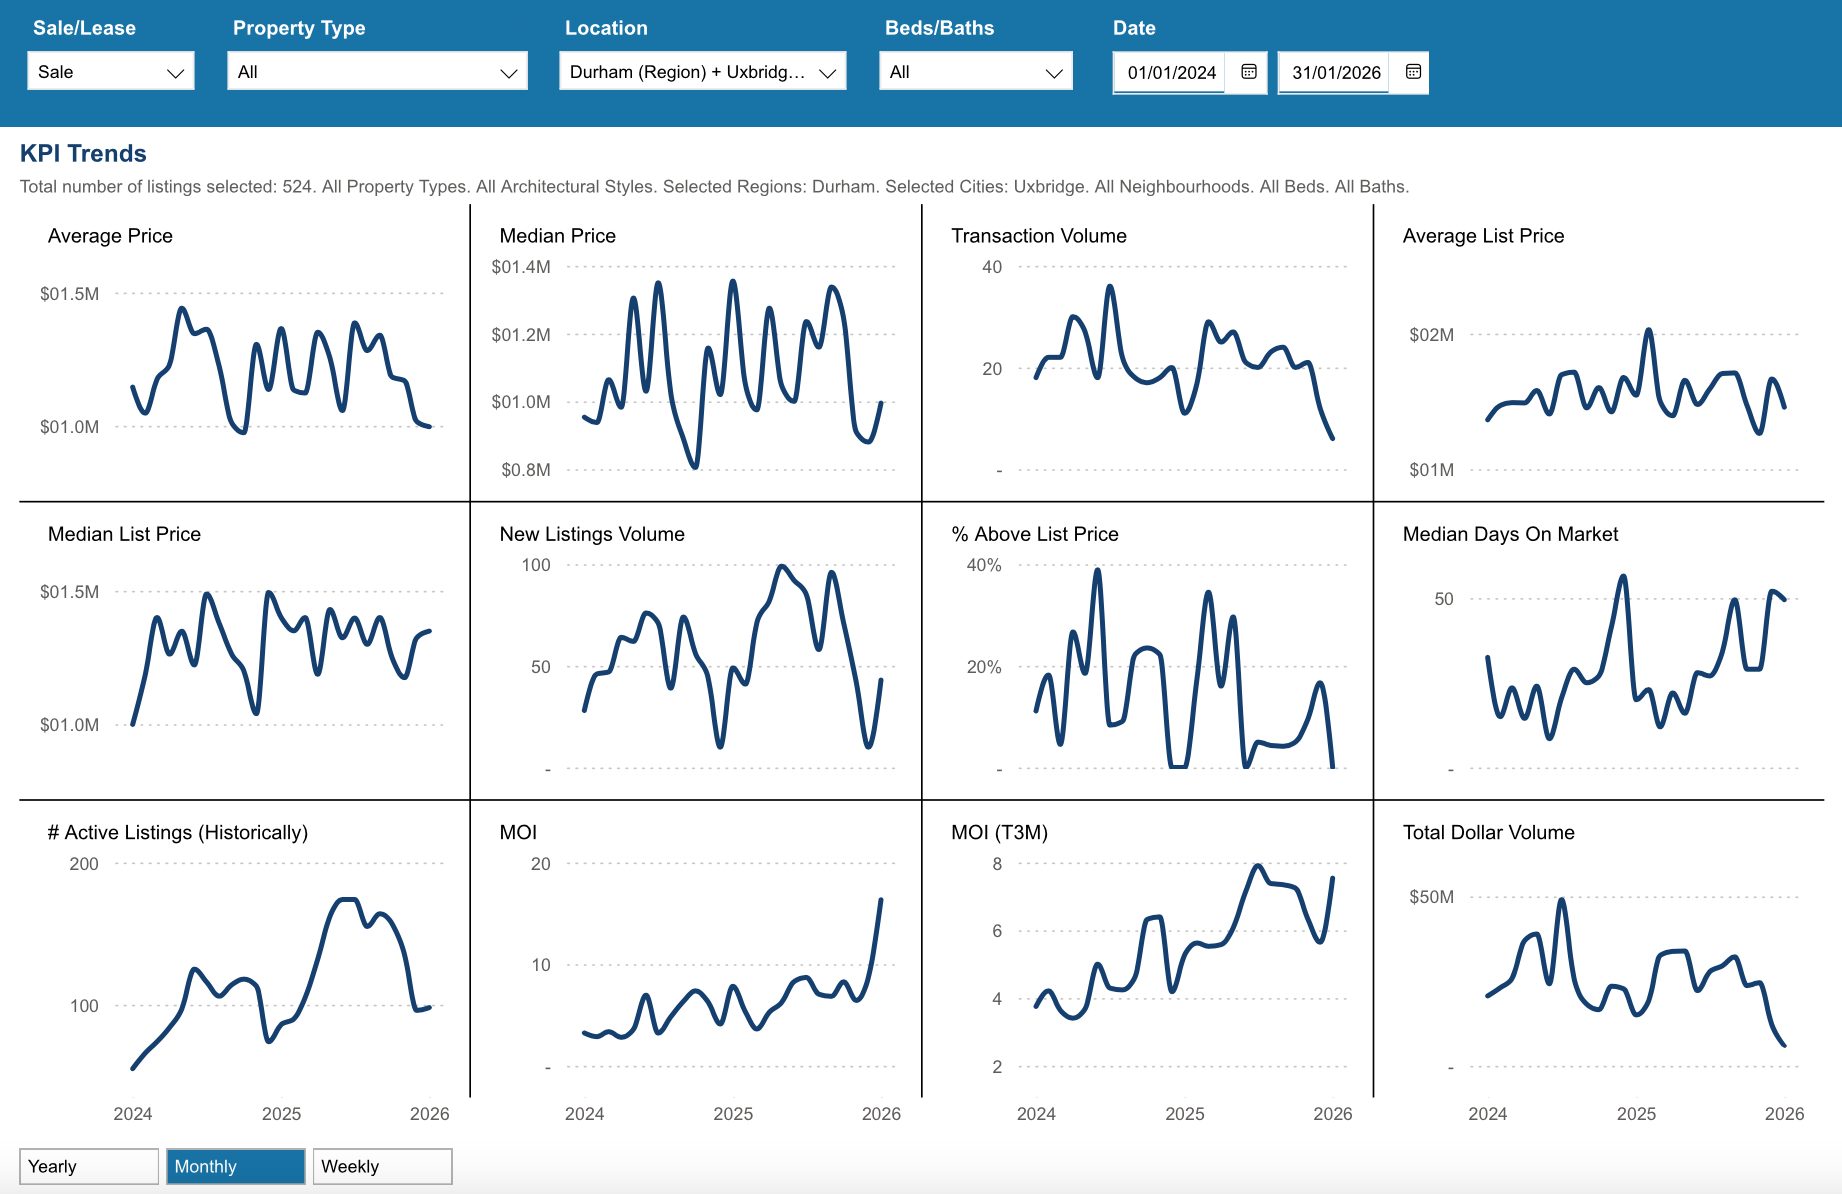
WATCH OUR MONDAY MARKET MINUTES
*Information is believed to be accurate at time of posting but is not guaranteed to be correct. Some values may vary slightly based on the exact date and time the reports were generated. Market stats are provided by TRREB (Toronto Regional Real Estate Board) and are based on sales for the month of Attached/Row/Townhouses, Condo Apartments, Condo Townhouses, Detached, Detached with Common Elements, Link Homes and Semi-detached. *Some values may vary slightly based on the exact date and time the reports were generated.
Not intended as a solicitation if your property is already listed by another broker. Affiliated real estate agents are independent contractor sales associates, not employees. ©2021 Coldwell Banker. All Rights Reserved. Coldwell Banker and the Coldwell Banker logos are trademarks of Coldwell Banker Real Estate LLC. The Coldwell Banker® System is comprised of company owned offices which are owned by a subsidiary of Realogy Brokerage Group LLC and franchised offices which are independently owned and operated. The Coldwell Banker System fully supports the principles of the Fair Housing Act and the Equal Opportunity Act.
Click below for more reports
Check out our Uxbridge and Scugog Events Pages to keep up to date on whats going on around town. Click the links or scan the Code with your phone to take you directly there.
UXBRIDGE EVENTS
SCUGOG EVENTS
Scugog Housing January 2026

Scugog Housing January 2026
Each office is independently owned and operated
![]()
![]()
Housing Market Report for January 2026
Here is the Township of Scugog Housing January 2026 report (all housing types), with reports from the Canadian Real Estate Association, and Toronto Regional Real Estate Board included.
This housing report for Durham Region includes the number of new listings, average list price, number of properties sold, average selling price, average days on market and average asking price to selling price ratio for all property types within the Region of Durham.
Scroll to the bottom for links to take you to the housing market reports for Durham Region, Uxbridge and Brock.
![]()
![]()
Please note: The PropTx MLS® System, of which TRREB is a part, has added a number of new client boards over the last year. Many of these boards’ Members trade within the Greater Toronto Area and broader Greater Golden Horseshoe regions. As a result, historic data have been updated to reflect the addition of these boards’ listings and transactions. This means historic data have changed relative to previously published static reports. To view updated historic data, click here.
Toronto Regional Real Estate Board – Market Stats At A Glance – January 2026
Read the Toronto Regional Real Estate Board Market Watch Report
![]()
Scugog Township Real Estate Market Analysis – January 2026
The Township of Scugog’s housing market kicked off 2026 with renewed price strength and a noticeable increase in listing activity. While sales volume remained steady, shifts in the mix of properties sold and rising inventory levels shaped a market that continues to sit comfortably in balanced territory.
January 2026
December 2025
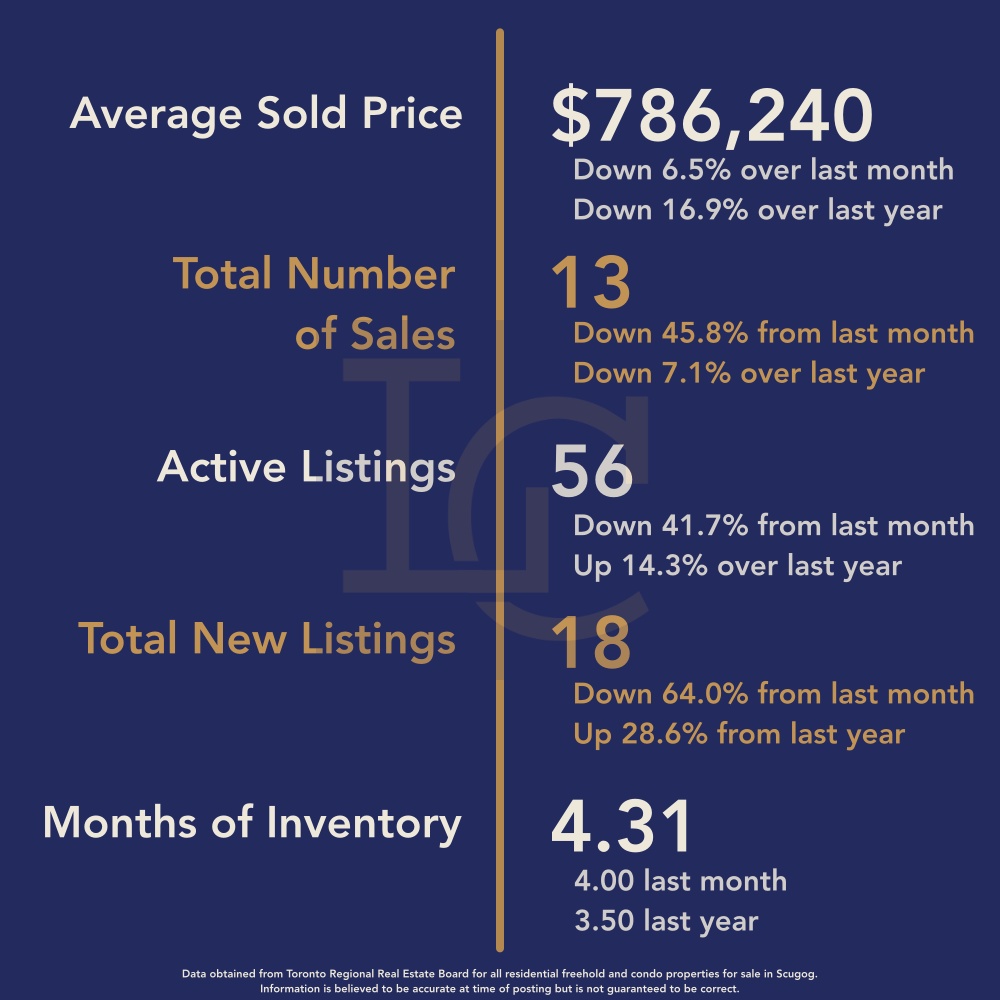
Average Sales Price
The average sales price in January 2026 rose to $940,675, marking a strong 19.6% increase from December’s $786,240, but still sitting 5.5% below January 2025’s $995,923.
December’s average was weighed down by fewer higher-end transactions, with only one property selling over $1 million. January told a different story:
-
5 properties sold between $1 million and $1.3 million
-
5 properties sold between $900,000 and $1 million
-
3 properties sold under $800,000
This stronger representation in the upper price ranges helped lift the monthly average significantly. The rebound highlights how sensitive Scugog’s averages can be to changes in the luxury and mid-range segments.
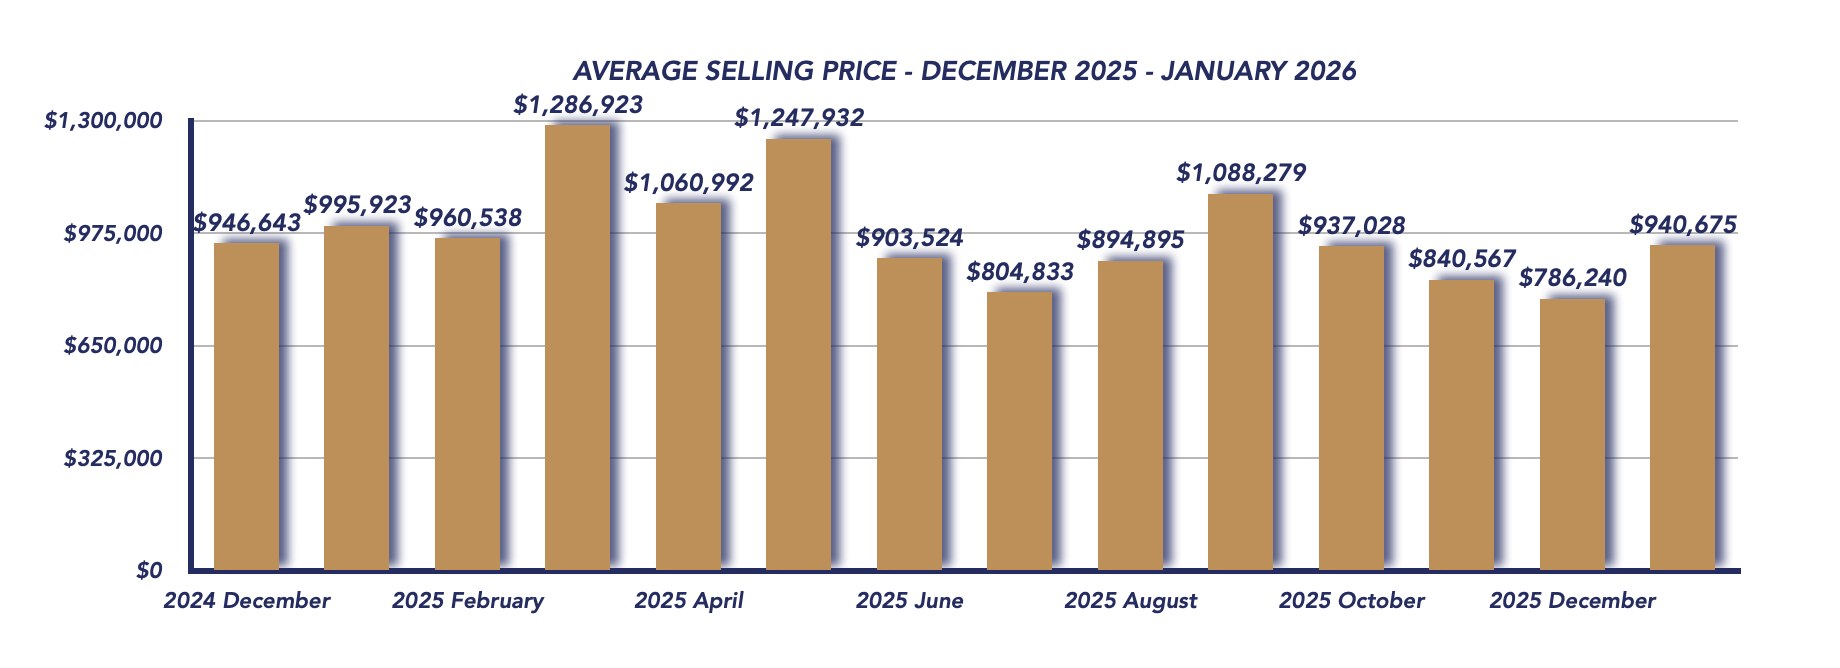
Sales Activity
A total of 14 homes sold in January, slightly above 13 in December and just ahead of 13 sales in January 2025. While sales remain modest compared to peak seasons, the consistency suggests steady buyer engagement to start the year.
The sale-to-list price ratio increased to 97%, up from 95% in December, indicating sellers regained some leverage and buyers were willing to move closer to asking prices.
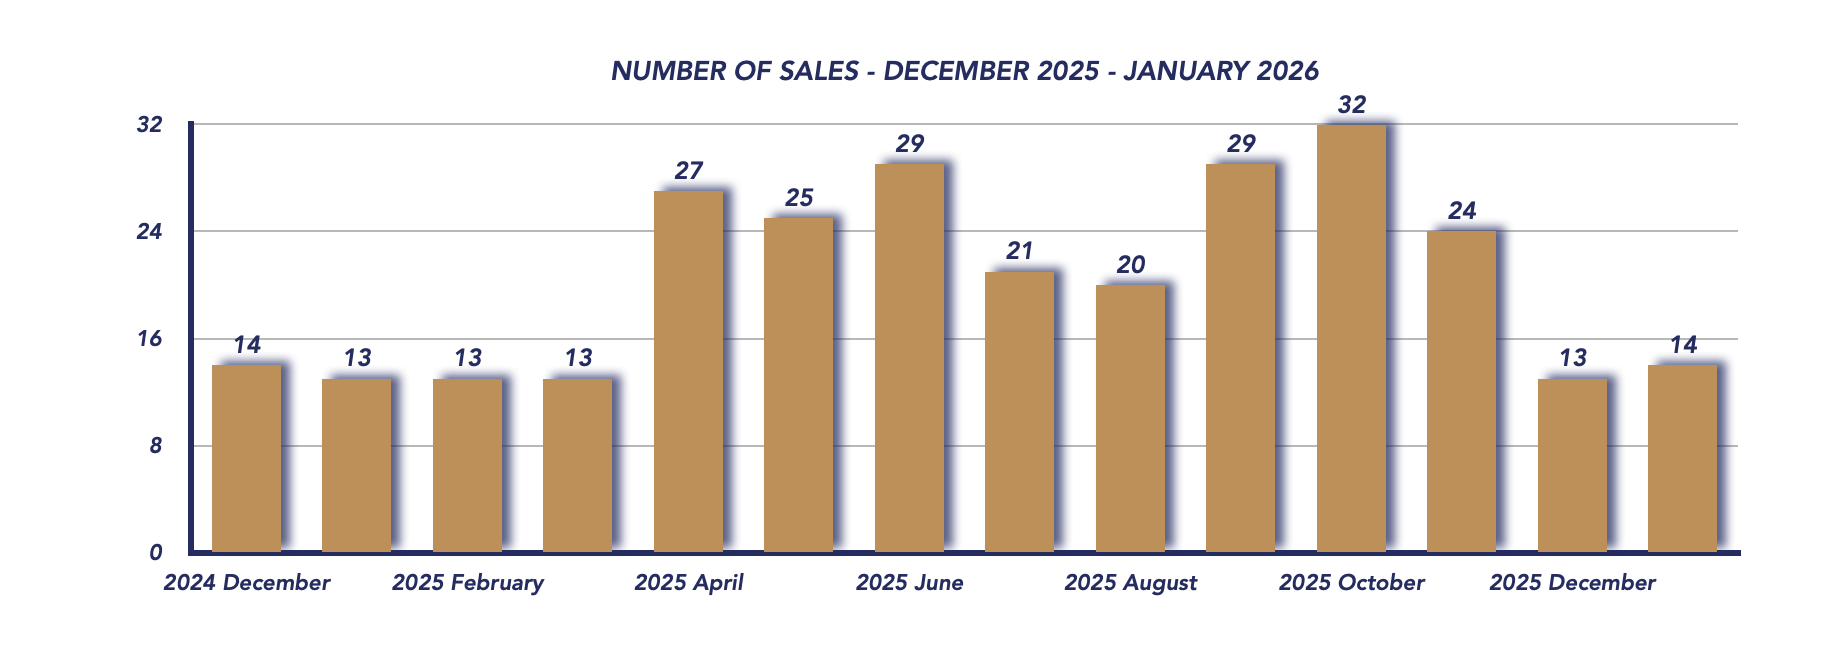
Listings & Inventory
January typically brings a seasonal increase in new listings, as properties that were taken off the market during the holidays are reintroduced — and this year followed that pattern.
-
New listings jumped to 38, up from 18 in December, though slightly below 43 in January 2025.
-
Active listings increased to 69, compared to 56 last month and 59 last year.
The rise in available inventory gives buyers more choice early in the year, setting the stage for a competitive spring market.
The months of inventory climbed to 4.93, up from 4.31 in December, but still firmly within balanced market territory. This indicates neither buyers nor sellers hold a decisive advantage.
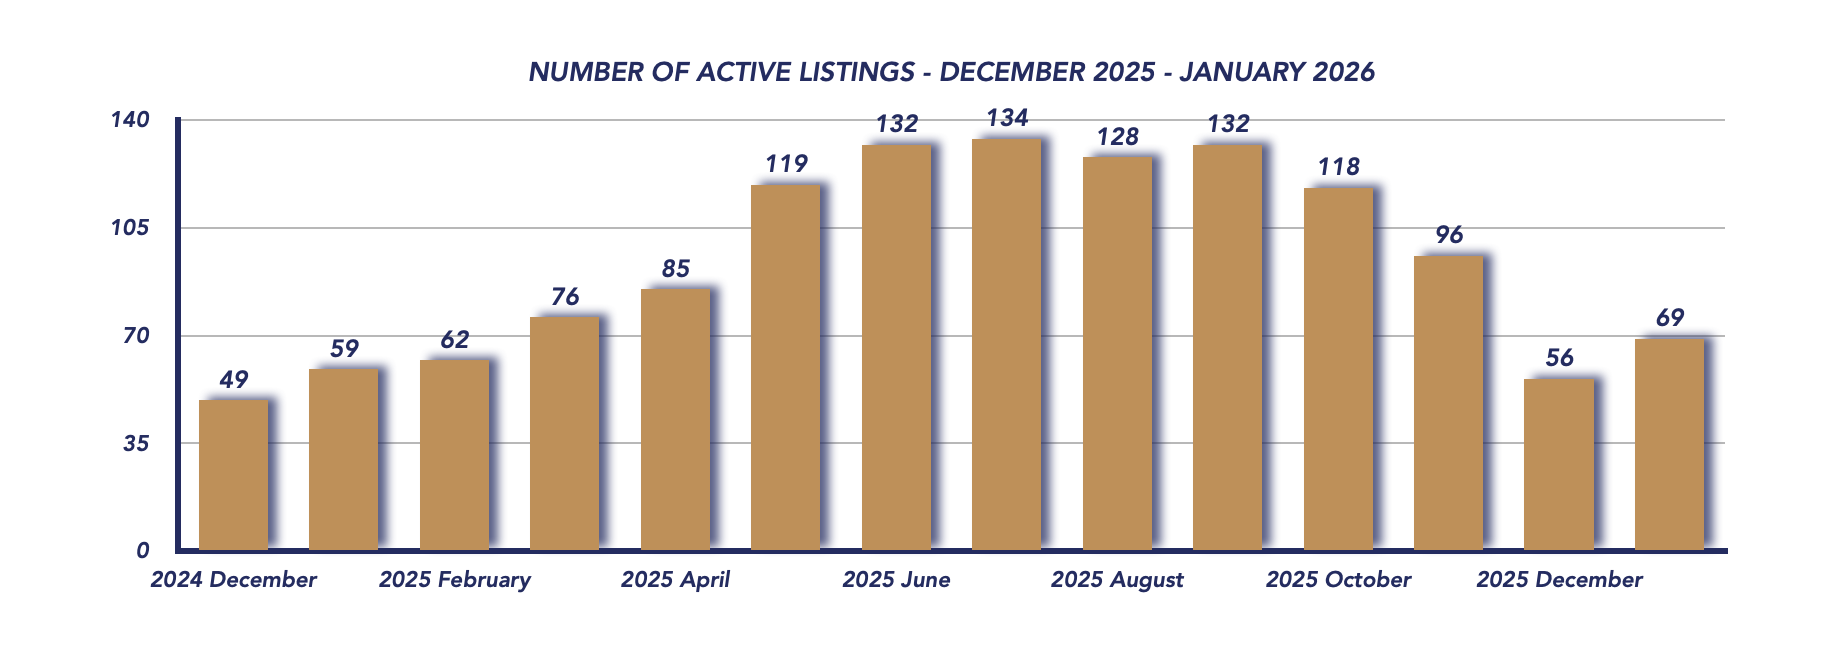
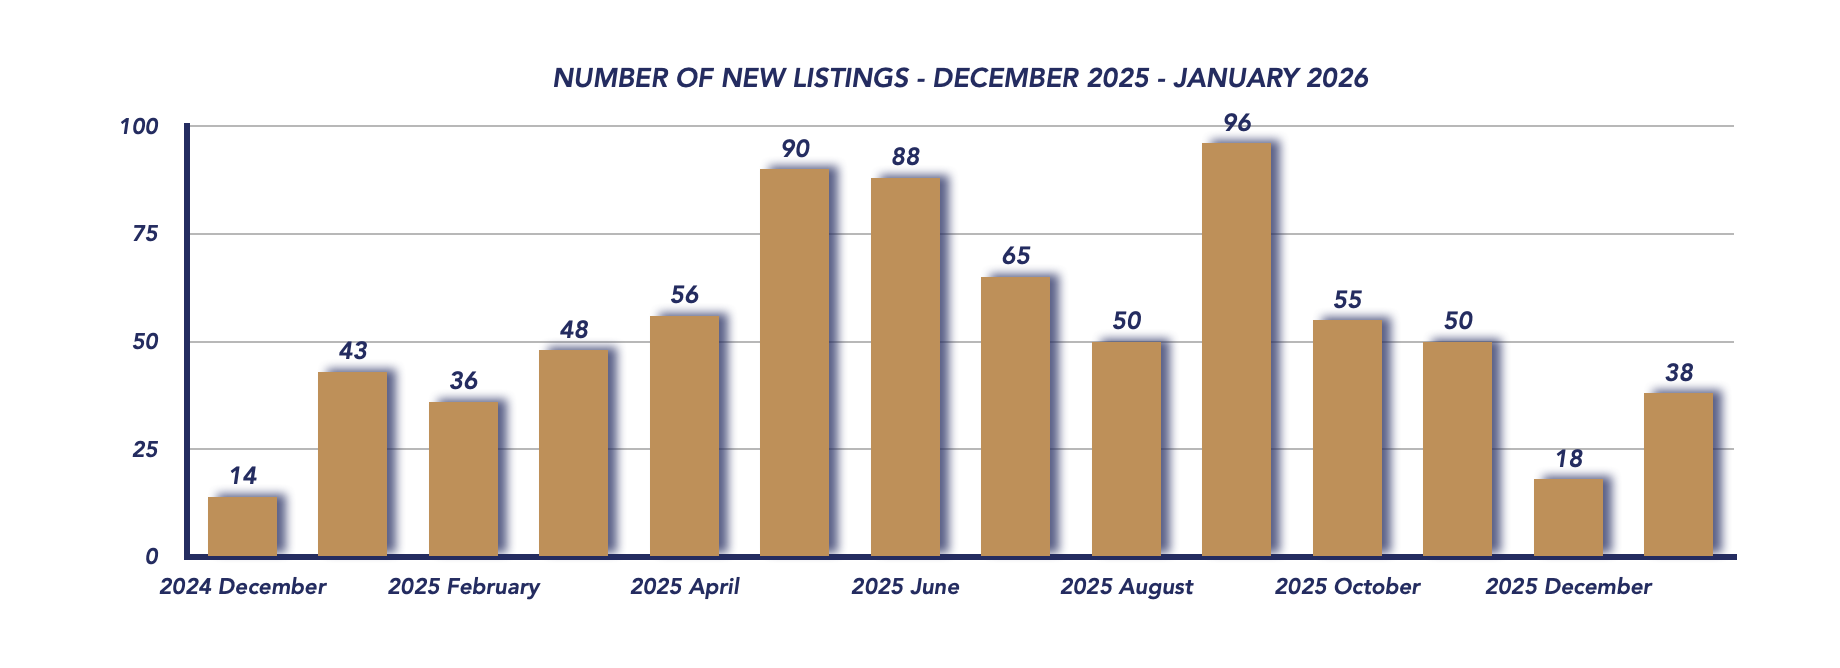
Days on Market
Homes in January took an average of 85 days to sell, compared to 51 days in December. This jump reflects carryover listings from late fall and winter, as well as the slower pace typical of early-year markets. Buyers remain active but deliberate, taking time to evaluate options.
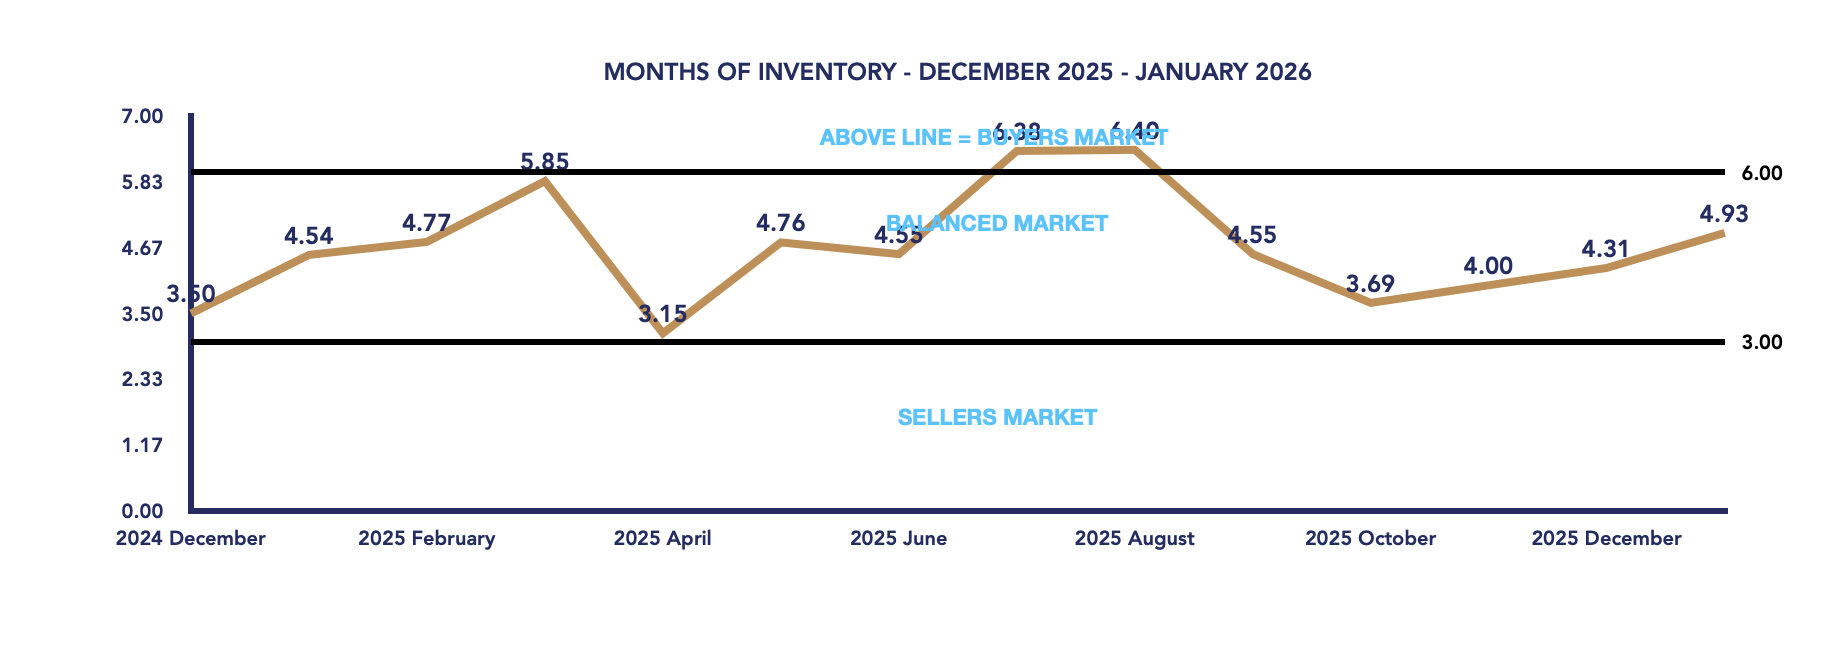
Key Takeaways
-
Average price rebounded 19.6% month-over-month, driven by stronger upper-end sales.
-
Year-over-year pricing remains slightly lower, reflecting continued normalization.
-
Sales volume remained steady, consistent with January seasonal trends.
-
New listings increased, as expected at the start of the year.
-
Inventory rose but remains balanced, providing opportunities for both buyers and sellers.
-
Days on market increased, reflecting a slower winter pace.
Outlook for Early 2026
January’s numbers suggest Scugog is entering 2026 on stable footing. Price recovery, steady sales, and increased listing activity all point toward a market preparing for the traditional spring ramp-up.
Buyers currently benefit from expanded inventory and negotiating room, while sellers can take confidence in stronger price performance compared to December. If listing activity continues to rise and buyer demand strengthens, Scugog could see a more competitive environment develop as we move into the spring market.
Key Performance Indicators (KPIs) from January 2024 through January 2026 provide a clear snapshot of how the Township of Scugog real estate market has evolved across all property types, architectural styles, and home configurations
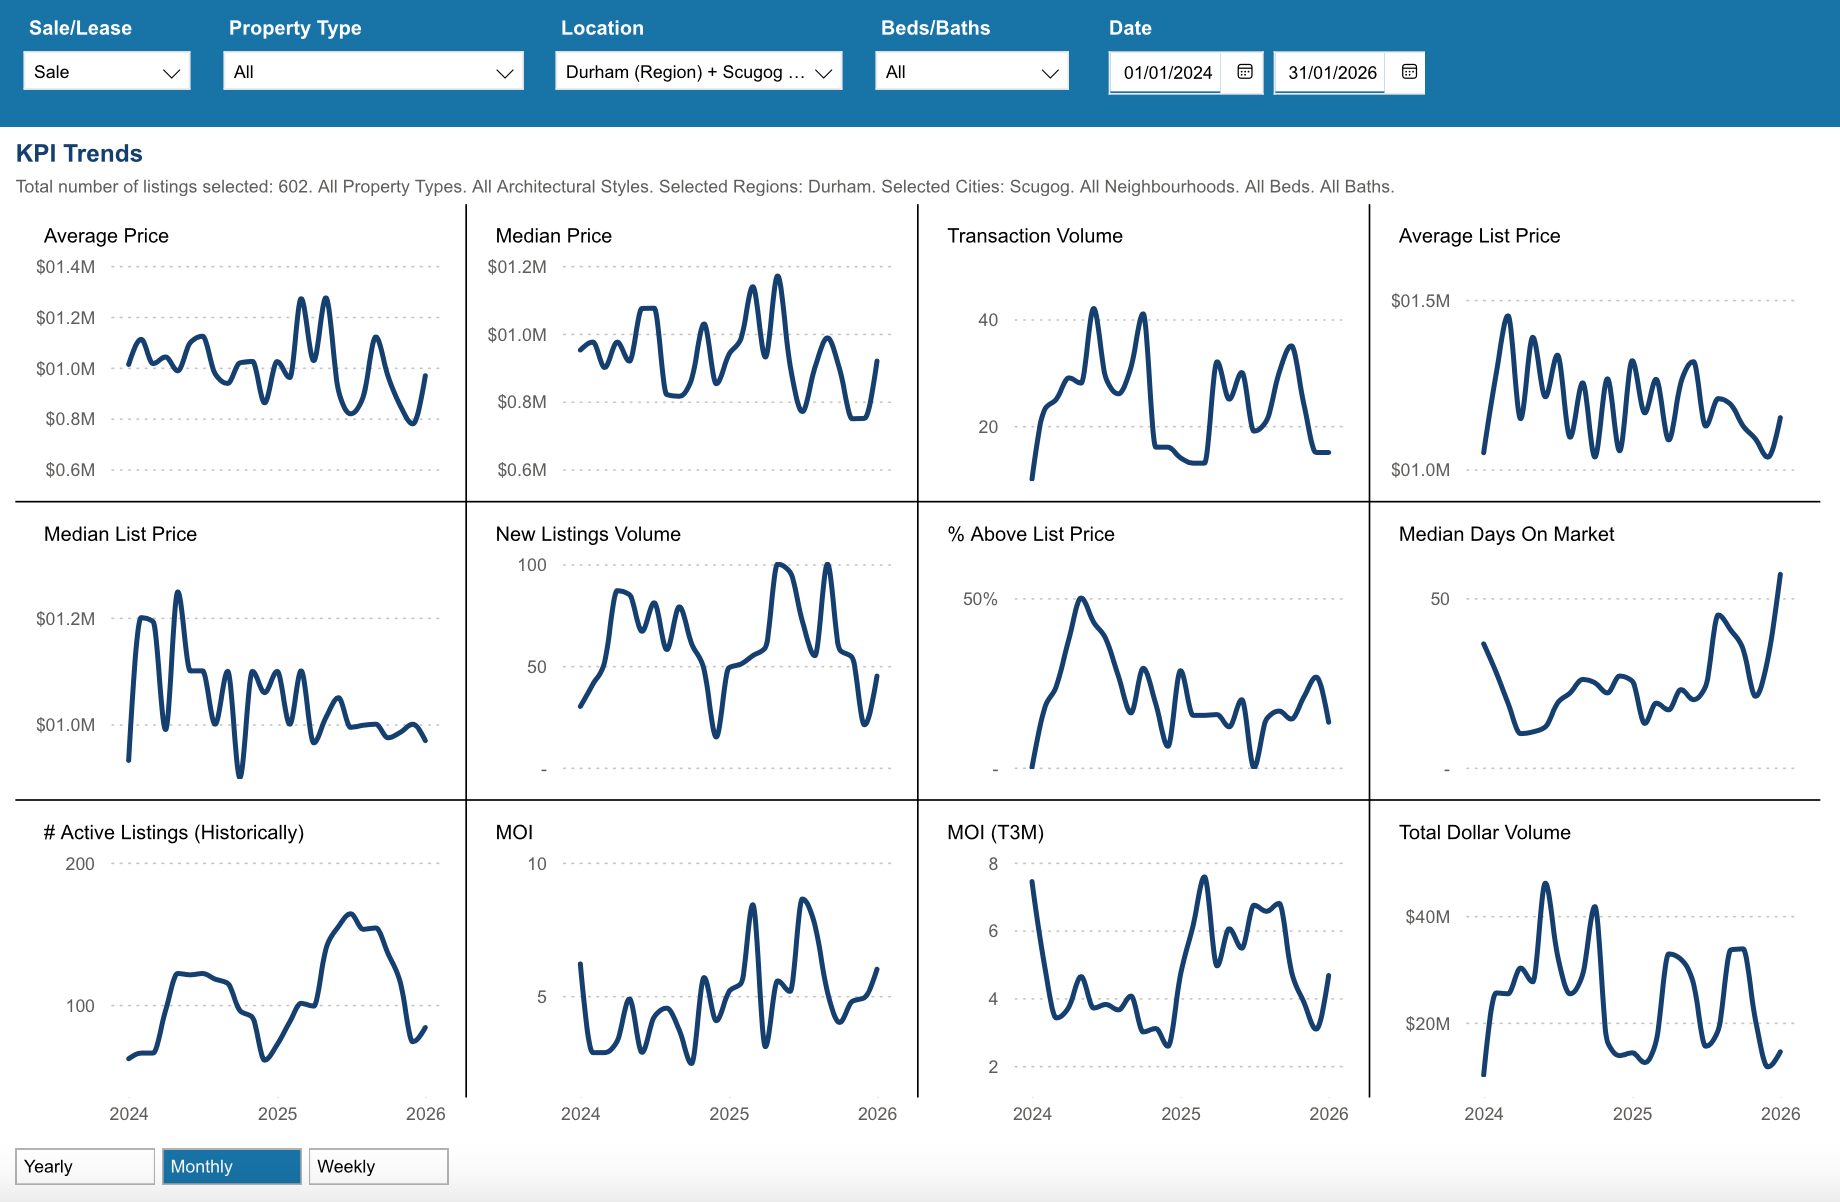
WATCH OUR MONDAY MARKET MINUTES
*Information is believed to be accurate at time of posting but is not guaranteed to be correct. Some values may vary slightly based on the exact date and time the reports were generated. Market stats are provided by TRREB (Toronto Regional Real Estate Board) and are based on sales for the month of Attached/Row/Townhouses, Condo Apartments, Condo Townhouses, Detached, Detached with Common Elements, Link Homes and Semi-detached. *Some values may vary slightly based on the exact date and time the reports were generated.
Not intended as a solicitation if your property is already listed by another broker. Affiliated real estate agents are independent contractor sales associates, not employees. ©2021 Coldwell Banker. All Rights Reserved. Coldwell Banker and the Coldwell Banker logos are trademarks of Coldwell Banker Real Estate LLC. The Coldwell Banker® System is comprised of company owned offices which are owned by a subsidiary of Realogy Brokerage Group LLC and franchised offices which are independently owned and operated. The Coldwell Banker System fully supports the principles of the Fair Housing Act and the Equal Opportunity Act.
Click below for more reports
Check out our Uxbridge and Scugog Events Pages to keep up to date on whats going on around town. Click the links or scan the Code with your phone to take you directly there.
UXBRIDGE EVENTS
SCUGOG EVENTS
Brock Housing January 2026

Brock Housing January 2026
Each office is independently owned and operated
![]()
![]()
Housing Market Report for January 2026
Here is the Township of Brock Housing January 2026 report (all housing types), with reports from the Canadian Real Estate Association, and Toronto Regional Real Estate Board included.
This housing report for Durham Region includes the number of new listings, average list price, number of properties sold, average selling price, average days on market and average asking price to selling price ratio for all property types within the Region of Durham.
Scroll to the bottom for links to take you to the housing market reports for Durham Region, Uxbridge and Scugog.
![]()
![]()
From Toronto Regional Real Estate Board
Please note: The PropTx MLS® System, of which TRREB is a part, has added a number of new client boards over the last year. Many of these boards’ Members trade within the Greater Toronto Area and broader Greater Golden Horseshoe regions. As a result, historic data have been updated to reflect the addition of these boards’ listings and transactions. This means historic data have changed relative to previously published static reports. To view updated historic data, click here.
Toronto Regional Real Estate Board – Market Stats At A Glance – January 2026
Read the Toronto Regional Real Estate Board Market Watch Report
![]()
Brock Township Real Estate Market Analysis – January 2026
The Brock Township real estate market began 2026 with steady momentum, showing modest price growth, stable sales activity, and balanced inventory conditions. January’s data reflects a market that continues to normalize after the fluctuations seen throughout 2025, with both buyers and sellers entering the new year on relatively even footing.
January 2026
December 2025
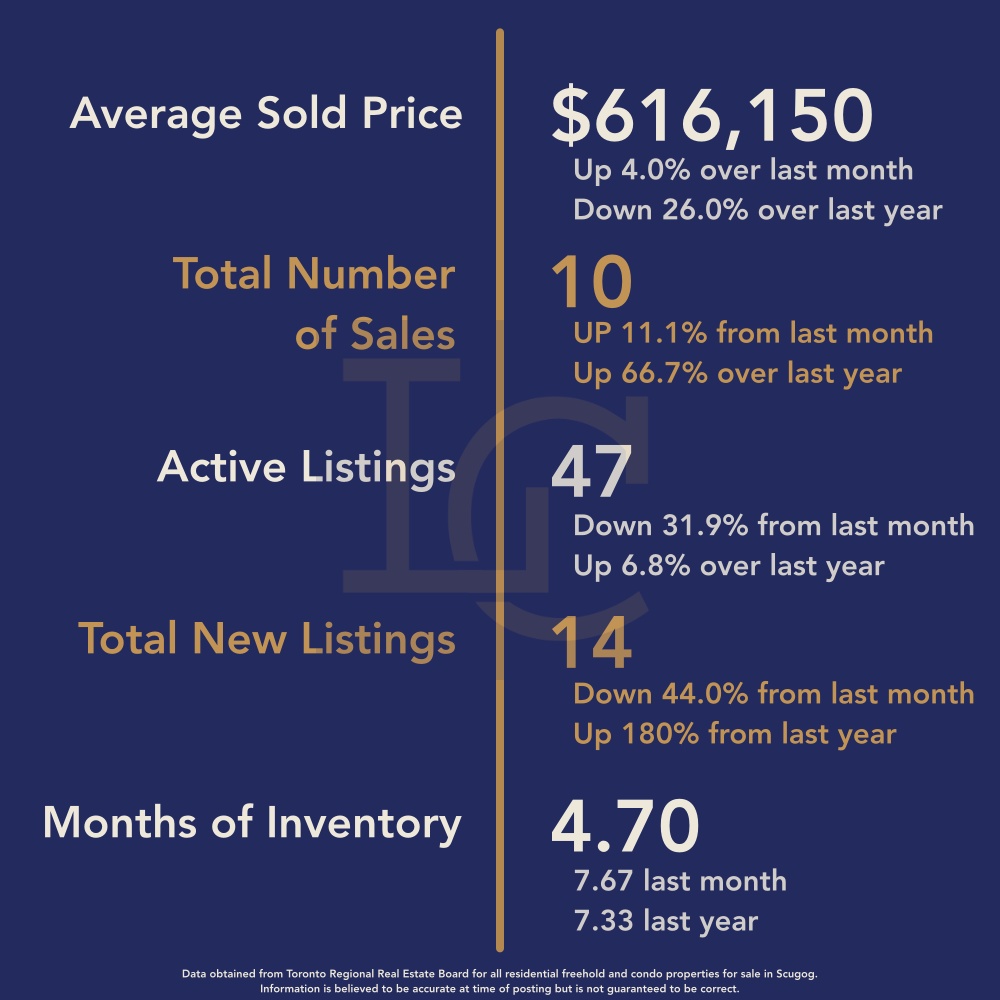
Average Sale Price Shows Modest Growth
The average sale price in January 2026 was $662,450, representing:
-
A 7.5% increase from December 2025 ($616,150)
-
A 1.9% increase from January 2025 ($650,444)
This steady month-over-month and year-over-year growth suggests improving confidence as the market transitions into a new year. Unlike some of the volatility seen in 2025, January’s pricing appears more stable and reflective of typical mid-range activity rather than being influenced by high-end outliers.
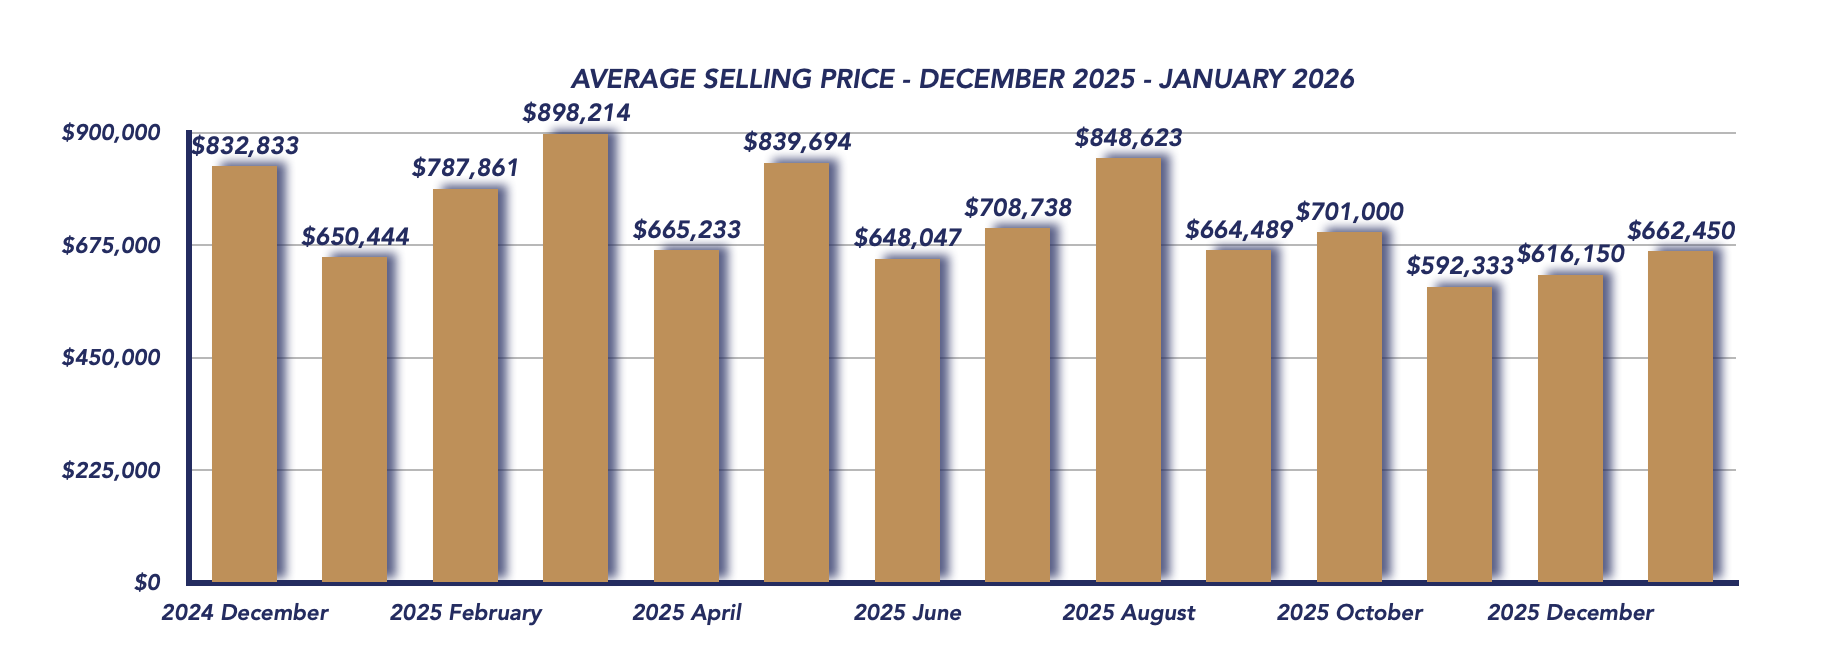
Sales Activity Remains Consistent
There were 10 total sales in January 2026, unchanged from December 2025 (10 sales) and slightly ahead of 9 sales in January 2025.
January is traditionally a quieter month for real estate, so stable sales volume indicates consistent demand despite seasonal slowdowns. Buyers appear active and engaged early in the year.
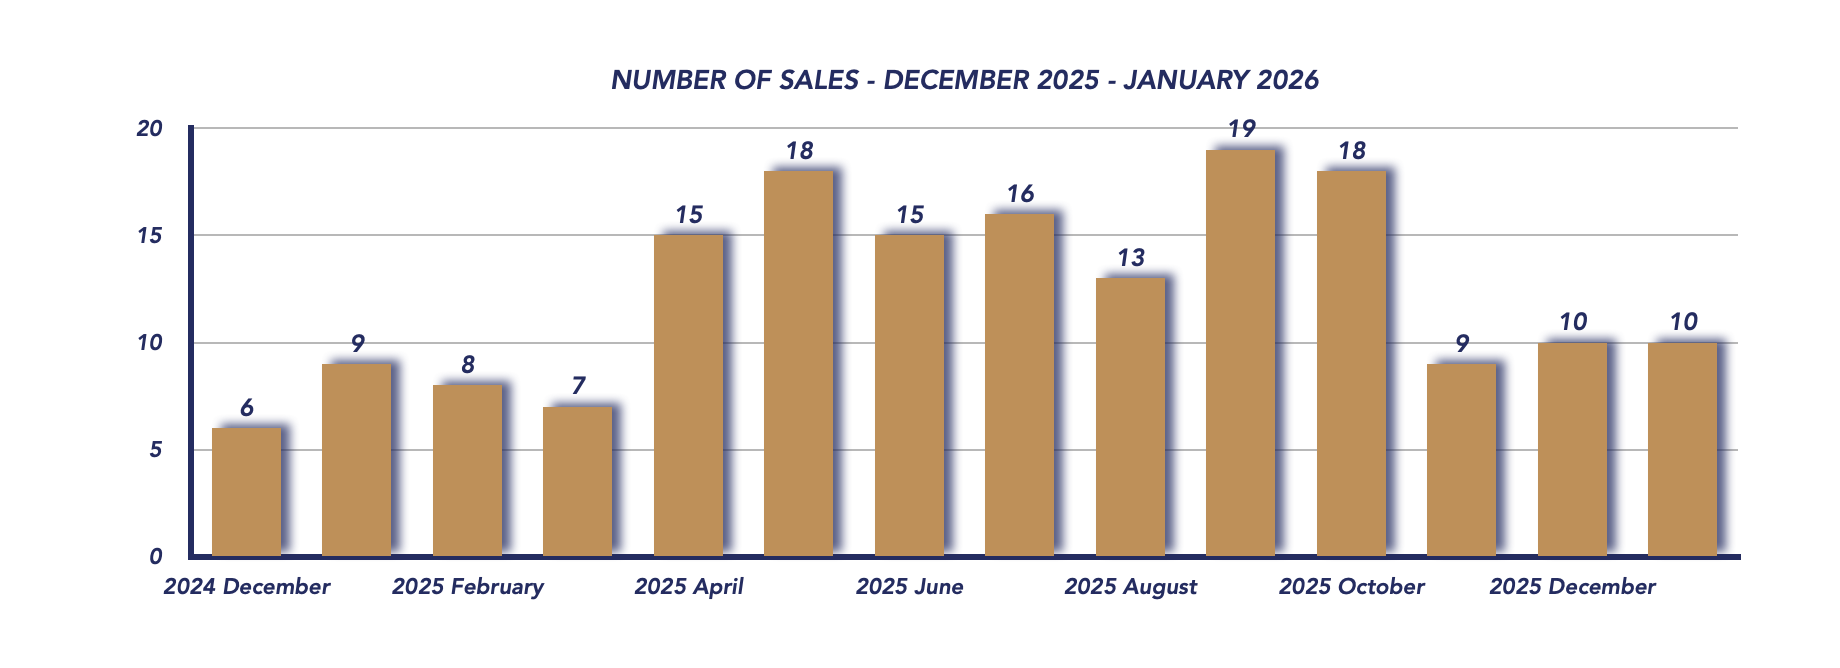
Sale-to-List Ratio Strengthens
The sale-to-list price ratio rose to 98%, up from 93% in December, though slightly below 99% recorded in January 2025.
This improvement suggests sellers are once again achieving close to their asking prices, signalling competitive conditions for well-priced homes. Buyers are active but still price-sensitive, and accurate pricing remains key.
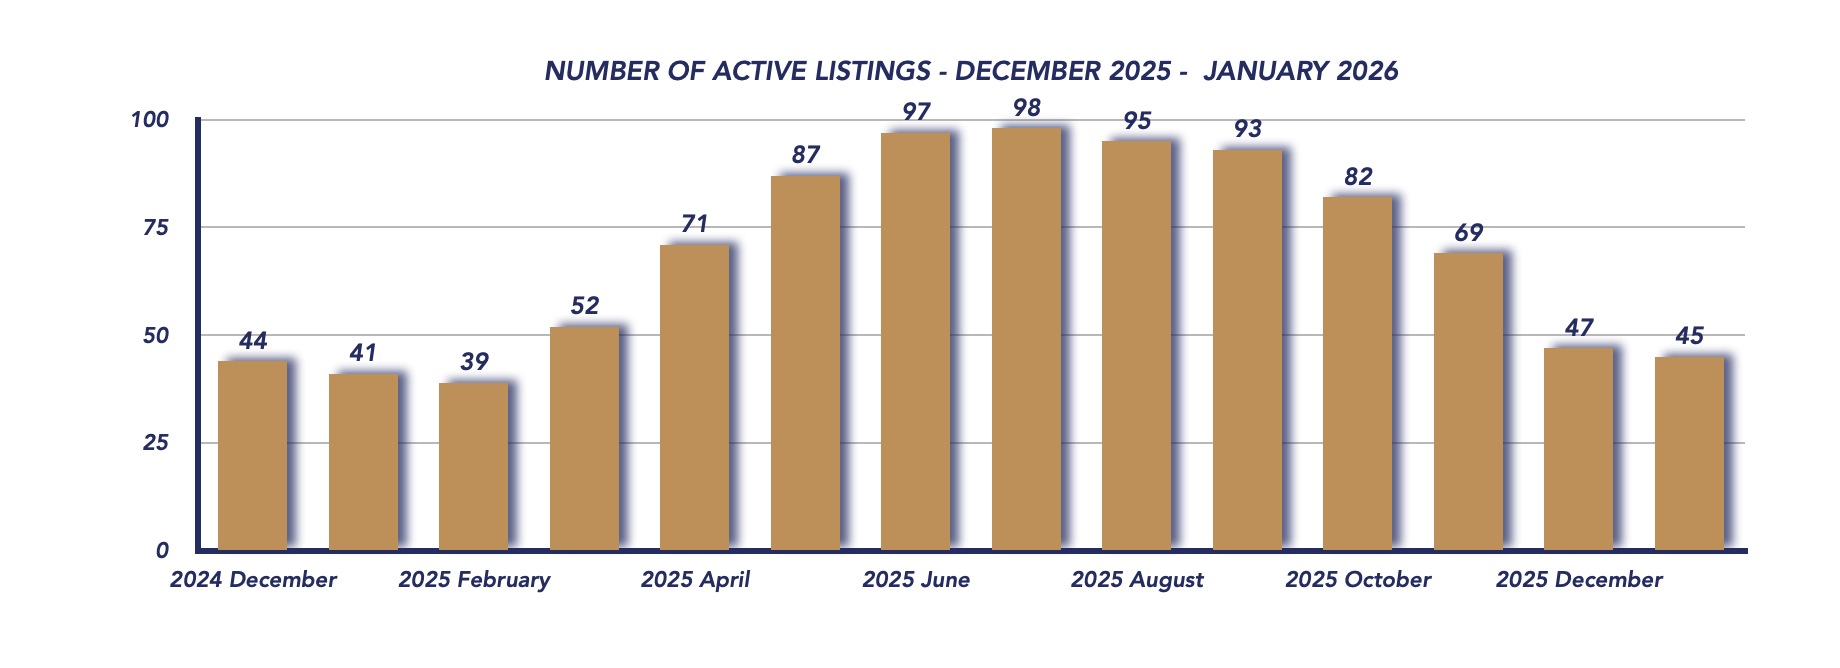
Inventory Remains Tight but Balanced
Inventory levels held steady:
-
Active listings: 45 (down slightly from 47 in December, up from 41 last year)
-
New listings: 25 (up from 14 in December, and slightly higher than 24 last year)
It is typical to see an increase in new listings in January, as properties temporarily withdrawn during the holiday season return to the market. This seasonal pattern helps explain the rebound in new inventory.
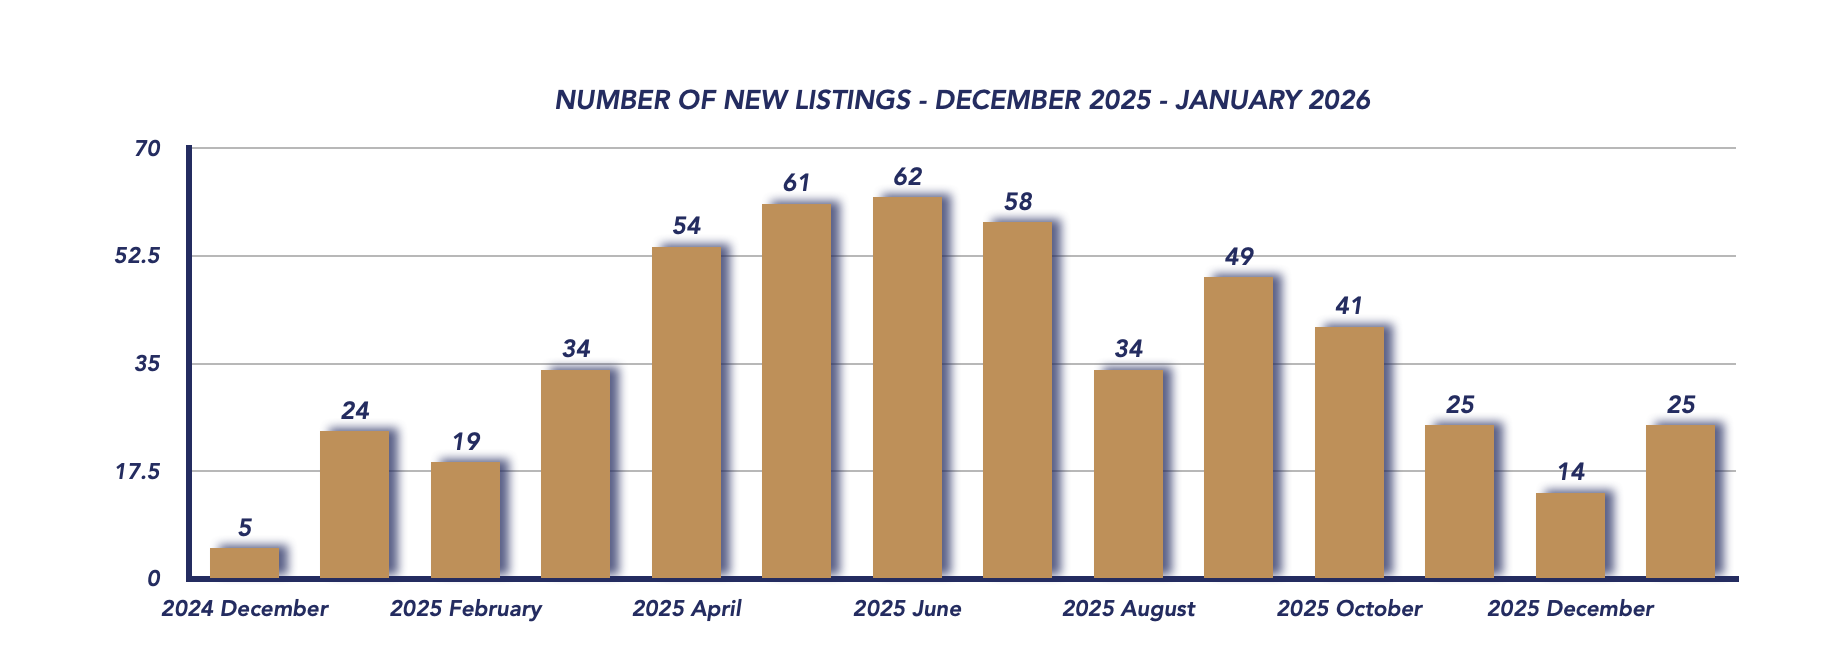
Days on Market & Market Balance
Homes sold in an average of 41 days, reflecting a healthy pace for this time of year.
Months of inventory declined slightly to 4.50, down from 4.70 in December, keeping Brock Township firmly within balanced market territory. This level of supply indicates that neither buyers nor sellers currently hold a significant advantage.
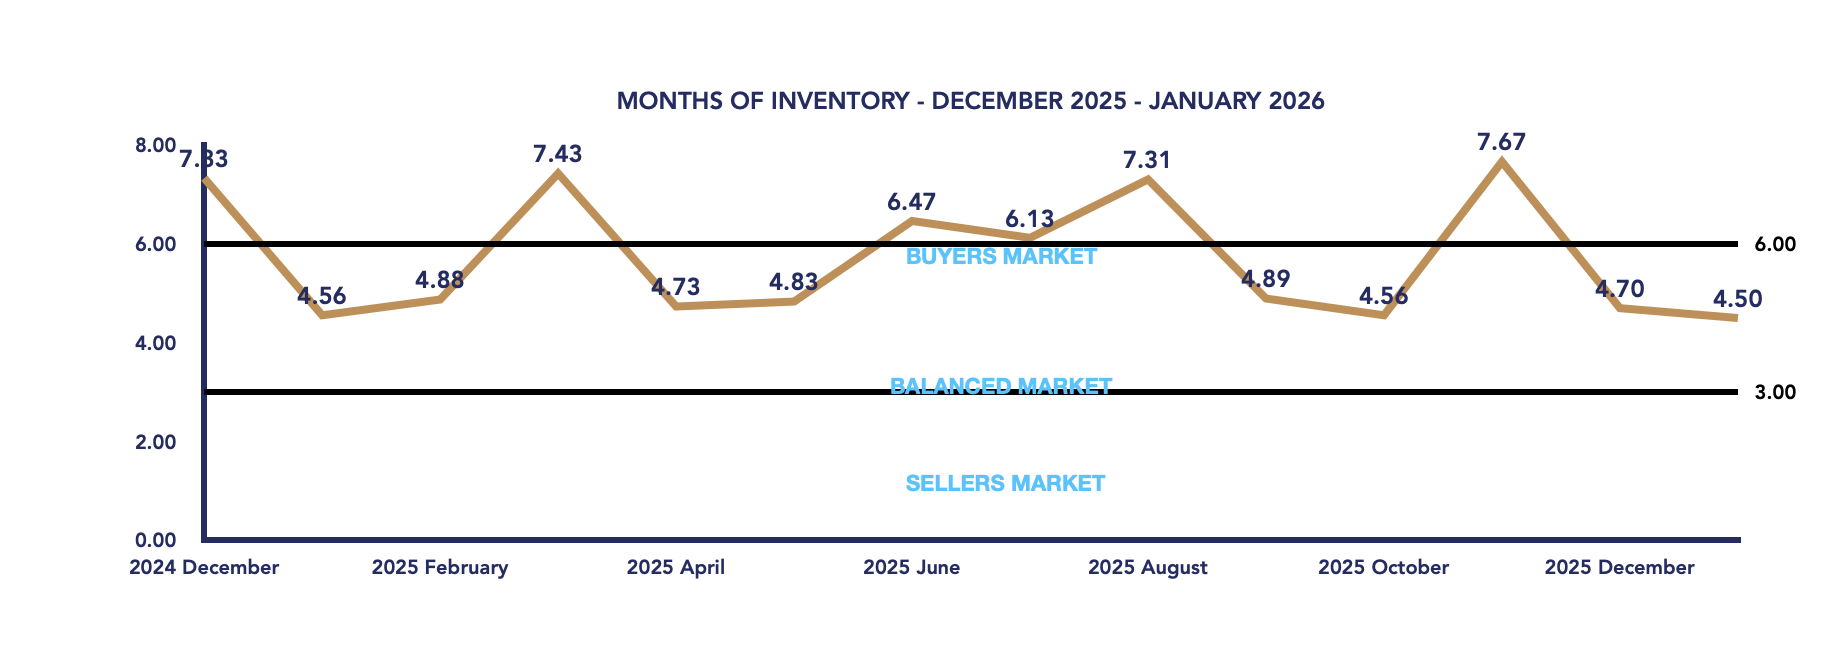
Conclusion
January 2026 signals a stable and measured start to the year for the Brock Township housing market. Prices are edging upward, sales remain steady, and inventory levels continue to support balanced conditions.
For buyers, this means reasonable selection and fair negotiation opportunities. For sellers, it’s an encouraging sign that competitively priced homes are attracting strong offers. As we move toward the spring market, increased activity is likely, particularly if inventory levels remain controlled and buyer confidence continues to build.
Key Performance Indicators (KPIs) from January 2024 through January 2026 provide a clear snapshot of how the Township of Brock real estate market has evolved across all property types, architectural styles, and home configurations

*Information is believed to be accurate at time of posting but is not guaranteed to be correct. Some values may vary slightly based on the exact date and time the reports were generated. Market stats are provided by TRREB (Toronto Regional Real Estate Board) and are based on sales for the month of Attached/Row/Townhouses, Condo Apartments, Condo Townhouses, Detached, Detached with Common Elements, Link Homes and Semi-detached. *Some values may vary slightly based on the exact date and time the reports were generated.
Not intended as a solicitation if your property is already listed by another broker. Affiliated real estate agents are independent contractor sales associates, not employees. ©2021 Coldwell Banker. All Rights Reserved. Coldwell Banker and the Coldwell Banker logos are trademarks of Coldwell Banker Real Estate LLC. The Coldwell Banker® System is comprised of company owned offices which are owned by a subsidiary of Realogy Brokerage Group LLC and franchised offices which are independently owned and operated. The Coldwell Banker System fully supports the principles of the Fair Housing Act and the Equal Opportunity Act.
Click below for more reports
Check out our Uxbridge and Scugog Events Pages to keep up to date on whats going on around town. Click the links or scan the Code with your phone to take you directly there.
UXBRIDGE EVENTS
SCUGOG EVENTS
Durham Region Housing January 2026

Durham Region Housing January 2026
Each office is independently owned and operated
![]()
![]()
Housing Market Report for January 2026
Here is the Region of Durham Housing January 2026 report (all housing types), with reports from the Canadian Real Estate Association, and Toronto Regional Real Estate Board included.
This housing report for Durham Region includes the number of new listings, average list price, number of properties sold, average selling price, average days on market and average asking price to selling price ratio for all property types within the Region of Durham.
Scroll to the bottom for links to take you to the housing market reports for Uxbridge, Scugog and Brock.
![]()
![]()
From Toronto Regional Real Estate Board
Please note: The PropTx MLS® System, of which TRREB is a part, has added a number of new client boards over the last year. Many of these boards’ Members trade within the Greater Toronto Area and broader Greater Golden Horseshoe regions. As a result, historic data have been updated to reflect the addition of these boards’ listings and transactions. This means historic data have changed relative to previously published static reports. To view updated historic data, click here.
Toronto Regional Real Estate Board – Market Stats At A Glance – January 2026
Read the Toronto Regional Real Estate Board Market Watch Report
![]()
Durham Region Real Estate Market Analysis – January 2026
The Durham Region housing market opened 2026 with a slower start, as prices eased, sales dipped, and inventory levels rose modestly. While January is historically one of the quieter months in real estate, this year’s data reflects a market continuing its transition into balanced territory—offering both buyers and sellers clearer expectations and more measured conditions.
January 2026
December 2025
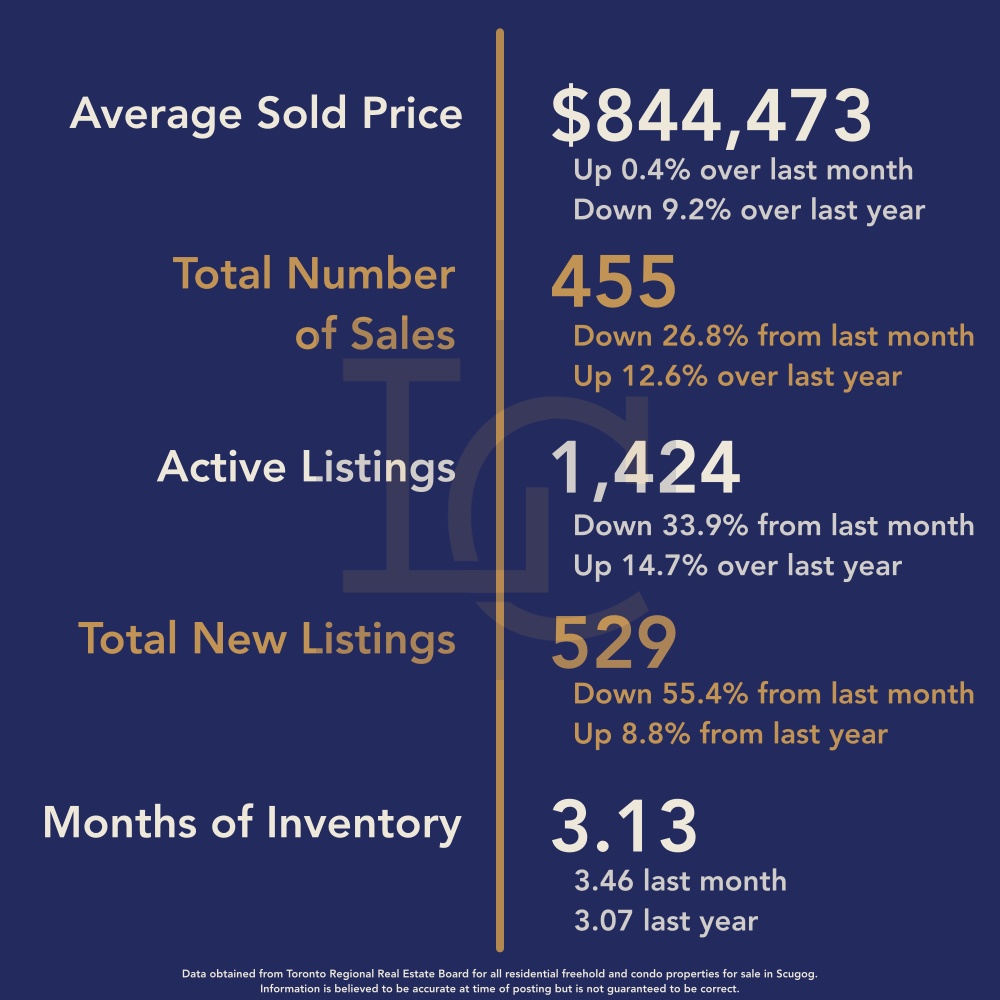
Average Sale Price Declines to Start the Year
The average sale price in January 2026 came in at $818,695, representing a 3.1% decrease from December’s $844,473 and an 8.7% drop compared to January 2025’s $896,611.
Seasonality plays a significant role in January pricing. Fewer transactions and cautious buyer activity often put downward pressure on average values at the start of the year. That said, this adjustment appears to be part of a broader normalization trend rather than a sharp correction. Prices continue to reflect a market that has shifted from peak conditions into a more sustainable range.
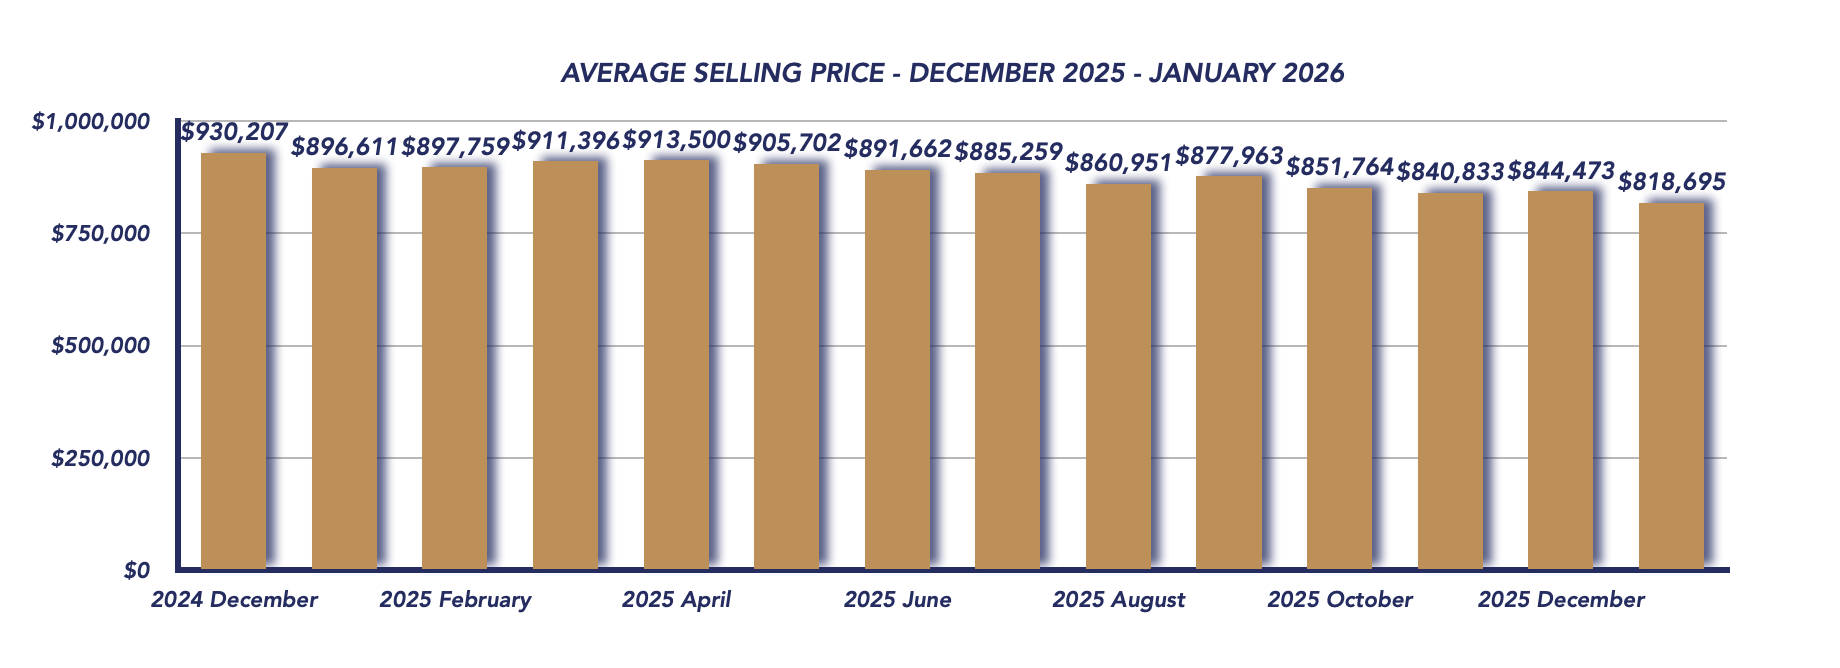
Sale-to-List Price Ratio Holds at 98%
The sale-to-list price ratio remained steady at 98%, unchanged from December but down from 100% in January 2025. This indicates that while buyers are negotiating slightly more than they were a year ago, sellers who price appropriately are still achieving close to asking price.
Balanced markets typically see ratios between 97% and 99%, and January’s figure reinforces that Durham remains in that range.
Sales Activity Slows Seasonally
There were 412 total sales in January, down from 455 in December and below the 489 sales recorded in January 2025. The slowdown is consistent with typical seasonal patterns, as many buyers and sellers wait until later in the winter or early spring to make a move.
Despite the year-over-year dip, the decline is moderate and aligns with broader cooling trends seen throughout 2025.
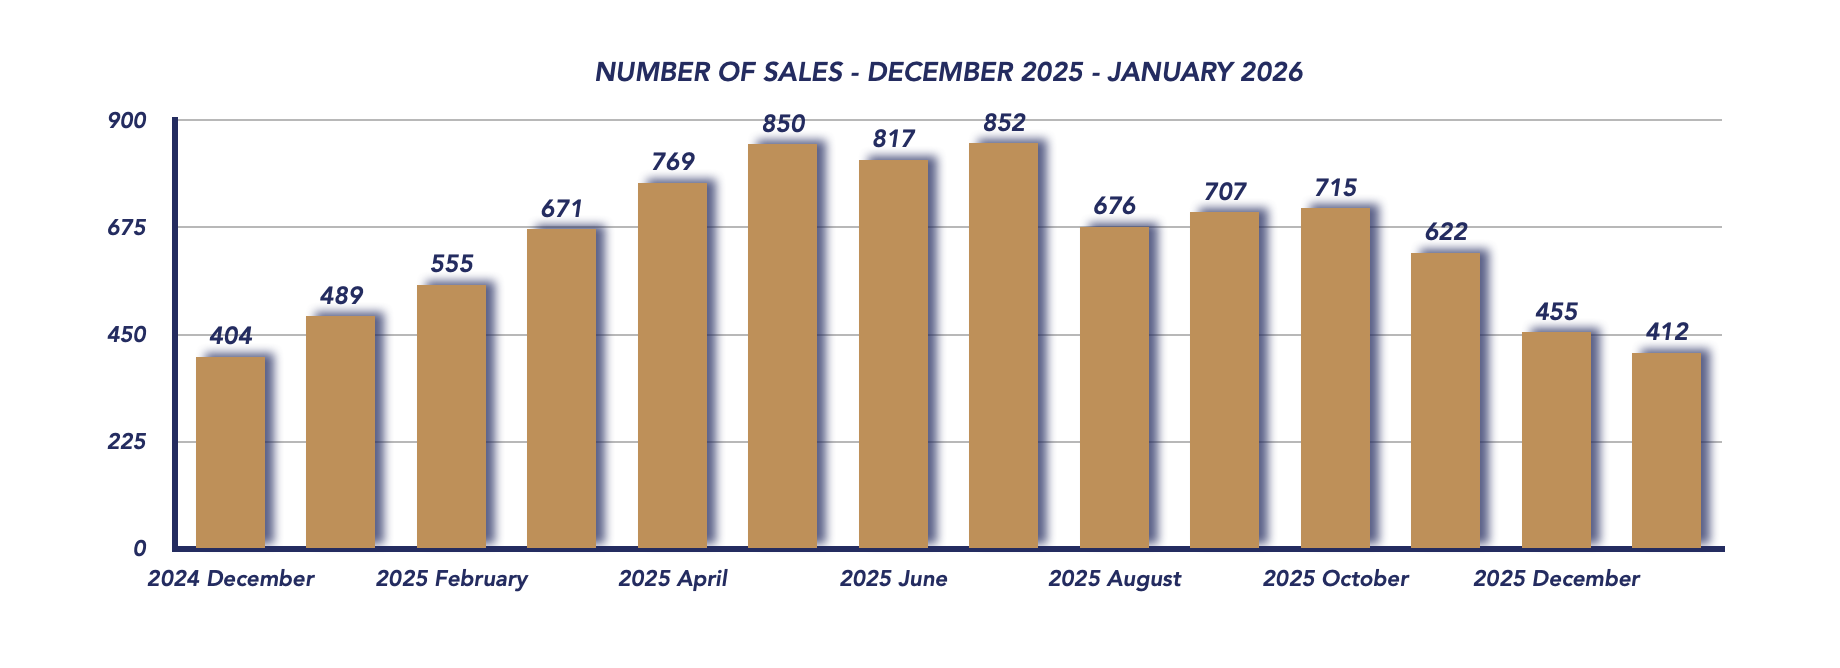
New Listings Surge as the Market Resets
One of the more notable shifts in January was the increase in new listings.
1,084 new properties hit the market, up significantly from 529 in December, though slightly below 1,213 listings in January 2025.
It’s important to note that January historically sees a wave of properties that were listed late in the previous year, terminated in December, and then reintroduced to the market in the new year. This seasonal relaunch effect contributes to the spike in listing activity and often gives buyers a refreshed selection to start the year.
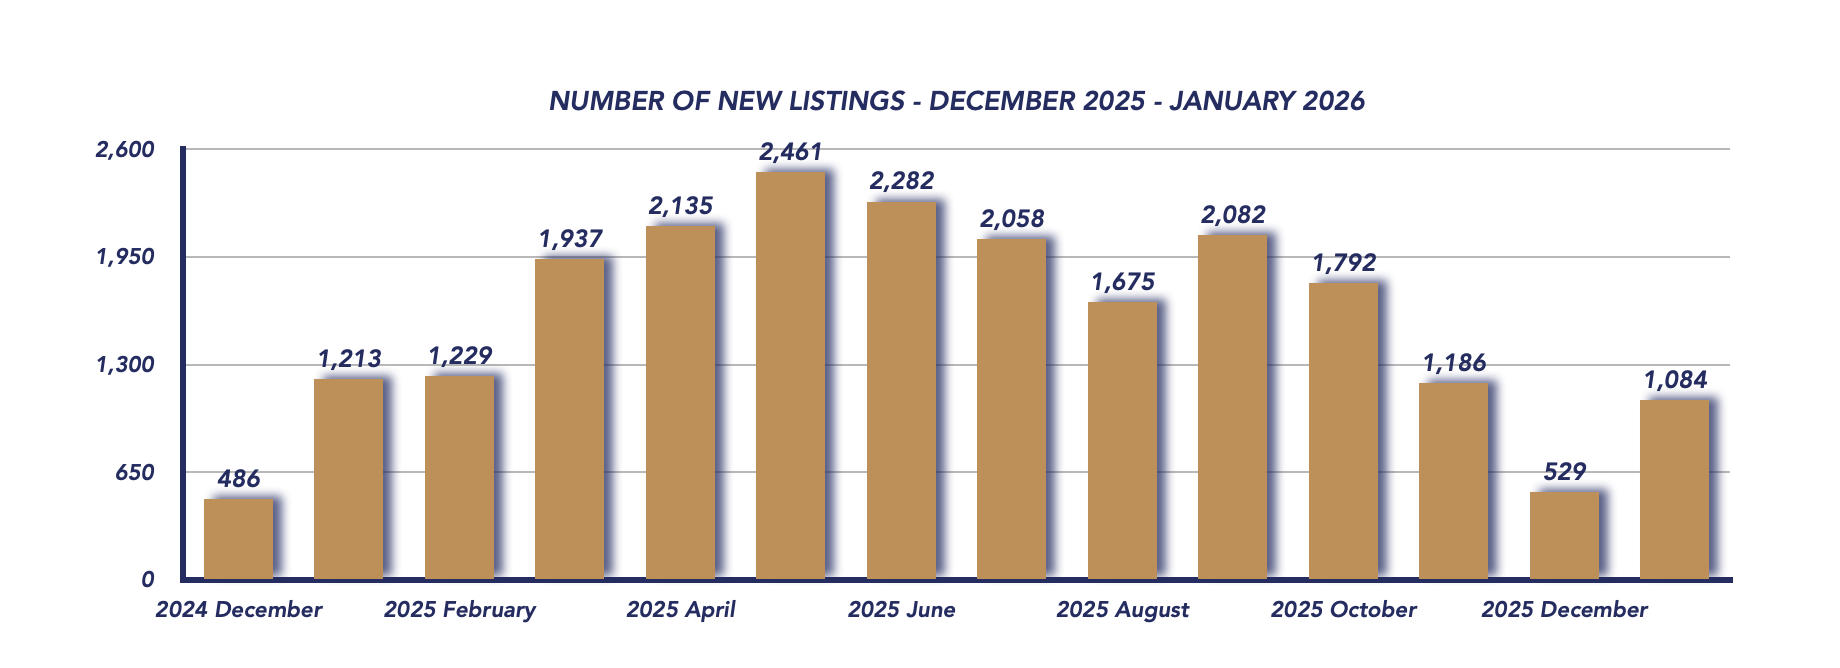
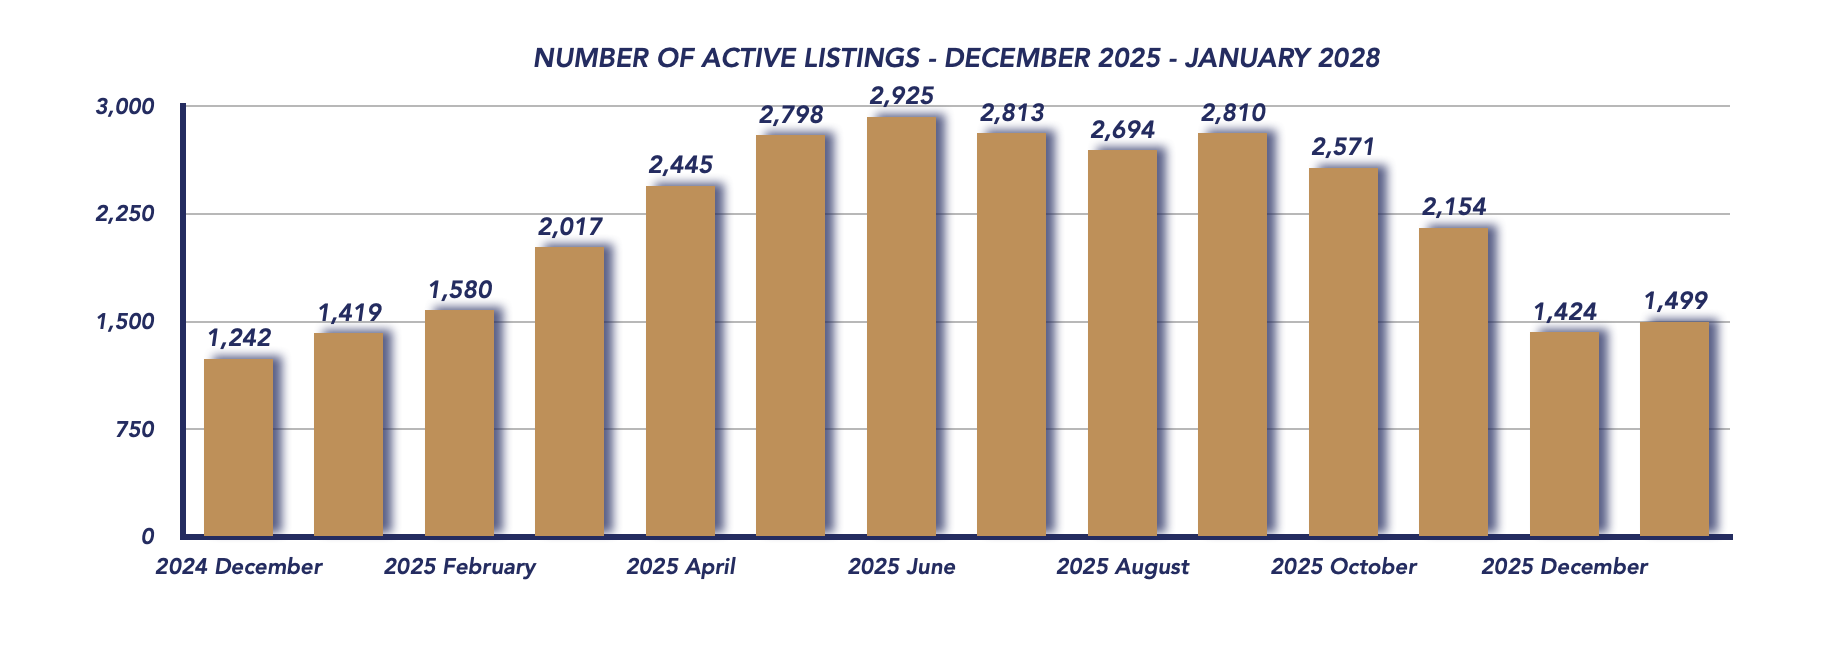
Days on Market and Inventory Rise
Homes spent an average of 59 days on market in January, only slightly below December’s 60 days, indicating that buyers are continuing to take their time before committing.
Meanwhile, months of inventory rose to 3.64, up from 3.13 in December. This increase reflects both the rise in listings and slower sales activity. However, Durham remains comfortably within balanced market territory, where supply and demand are relatively aligned.
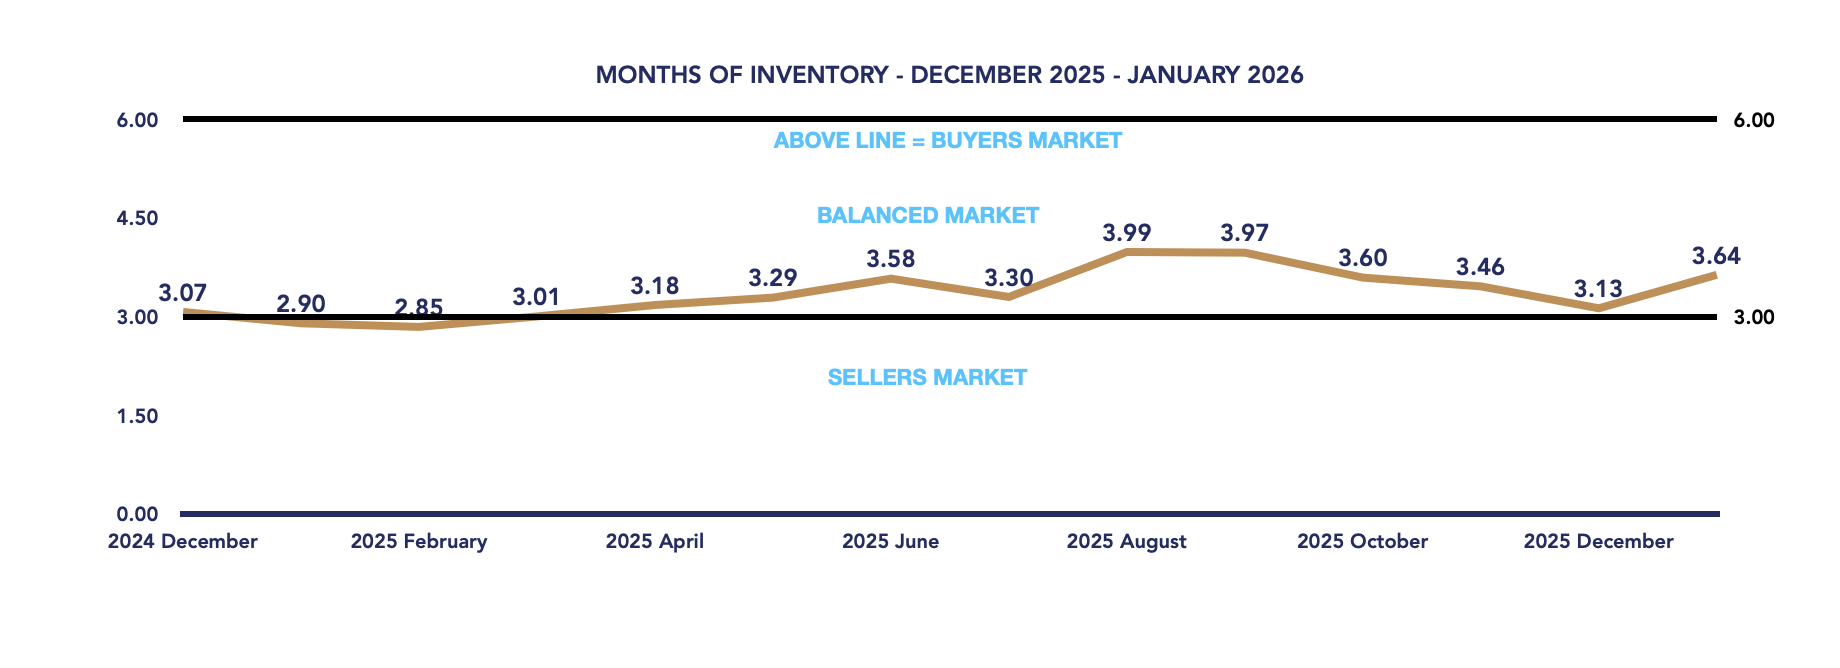
What This Means Moving Forward
January 2026 reinforces that Durham Region has moved into a stable and balanced phase of the market cycle. Prices have adjusted year-over-year, inventory is rebuilding gradually, and buyers have more breathing room than in previous high-pressure markets.
As we move toward the spring market, the key factors to watch will be:
-
Whether buyer activity strengthens with improving weather
-
How inventory levels trend once the initial January relistings settle
-
Broader economic influences, including interest rates and consumer confidence
For now, Durham’s market is not overheating, nor is it oversupplied—it is operating in a controlled and sustainable environment.
Key Performance Indicators (KPIs) from January 2024 through January 2026 provide a clear snapshot of how the Durham Region real estate market has evolved across all property types, architectural styles, and home configurations
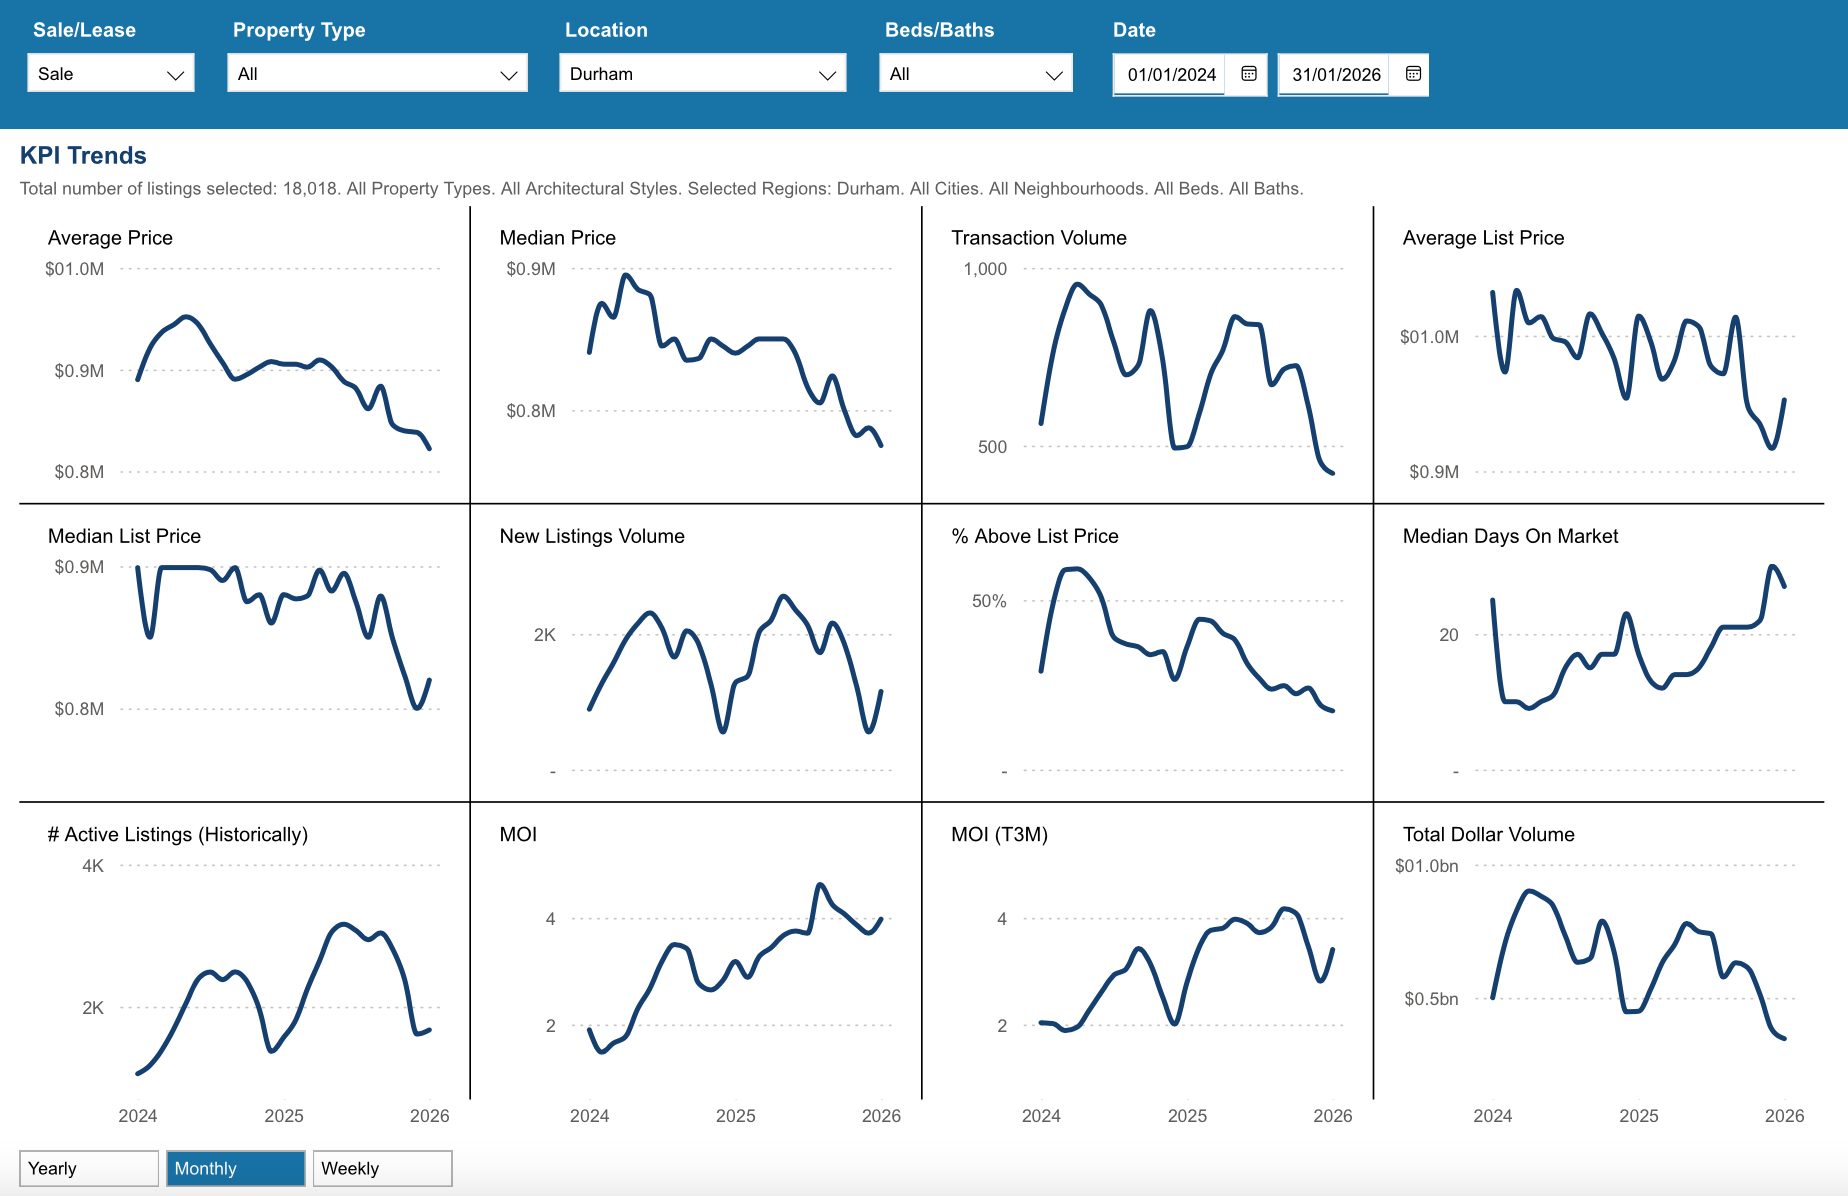
*Information is believed to be accurate at time of posting but is not guaranteed to be correct. Some values may vary slightly based on the exact date and time the reports were generated. Market stats are provided by TRREB (Toronto Regional Real Estate Board) and are based on sales for the month of Attached/Row/Townhouses, Condo Apartments, Condo Townhouses, Detached, Detached with Common Elements, Link Homes and Semi-detached. *Some values may vary slightly based on the exact date and time the reports were generated.
Not intended as a solicitation if your property is already listed by another broker. Affiliated real estate agents are independent contractor sales associates, not employees. ©2021 Coldwell Banker. All Rights Reserved. Coldwell Banker and the Coldwell Banker logos are trademarks of Coldwell Banker Real Estate LLC. The Coldwell Banker® System is comprised of company owned offices which are owned by a subsidiary of Realogy Brokerage Group LLC and franchised offices which are independently owned and operated. The Coldwell Banker System fully supports the principles of the Fair Housing Act and the Equal Opportunity Act.
Click below for more reports
Check out our Uxbridge and Scugog Events Pages to keep up to date on whats going on around town. Click the links or scan the Code with your phone to take you directly there.
UXBRIDGE EVENTS
SCUGOG EVENTS
Uxbridge Housing December 2025

Uxbridge Housing December 2025
Each office is independently owned and operated
![]()

![]()
Housing Market Report for December 2025
Here is the Township of Uxbridge Housing December 2025 report (all housing types), with reports from the Canadian Real Estate Association, and Toronto Regional Real Estate Board included.
This housing report for Durham Region includes the number of new listings, average list price, number of properties sold, average selling price, average days on market and average asking price to selling price ratio for all property types within the Region of Durham.
Scroll to the bottom for links to take you to the housing market reports for Durham Region, Scugog and Brock.
![]()
![]()
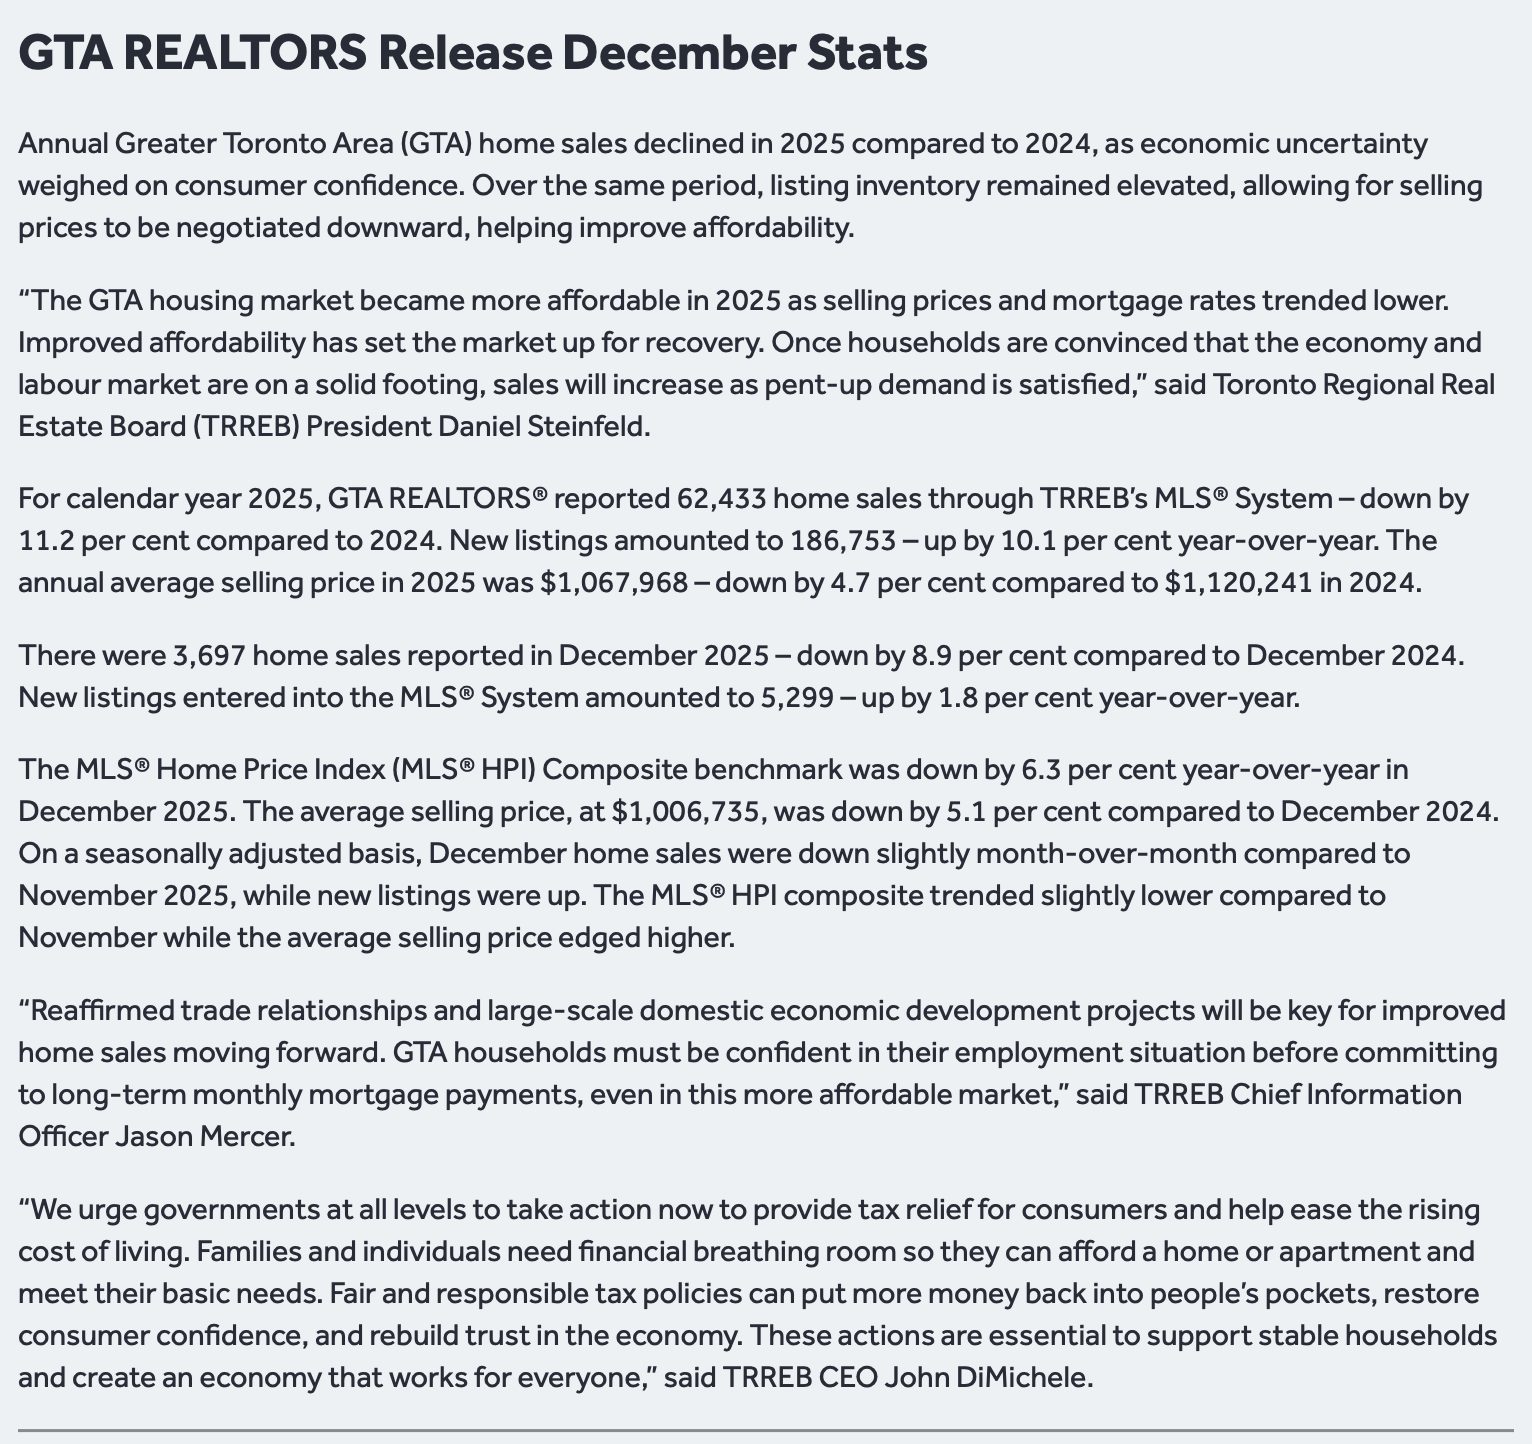
From Toronto Regional Real Estate Board
Please note: The PropTx MLS® System, of which TRREB is a part, has added a number of new client boards over the last year. Many of these boards’ Members trade within the Greater Toronto Area and broader Greater Golden Horseshoe regions. As a result, historic data have been updated to reflect the addition of these boards’ listings and transactions. This means historic data have changed relative to previously published static reports. To view updated historic data, click here.
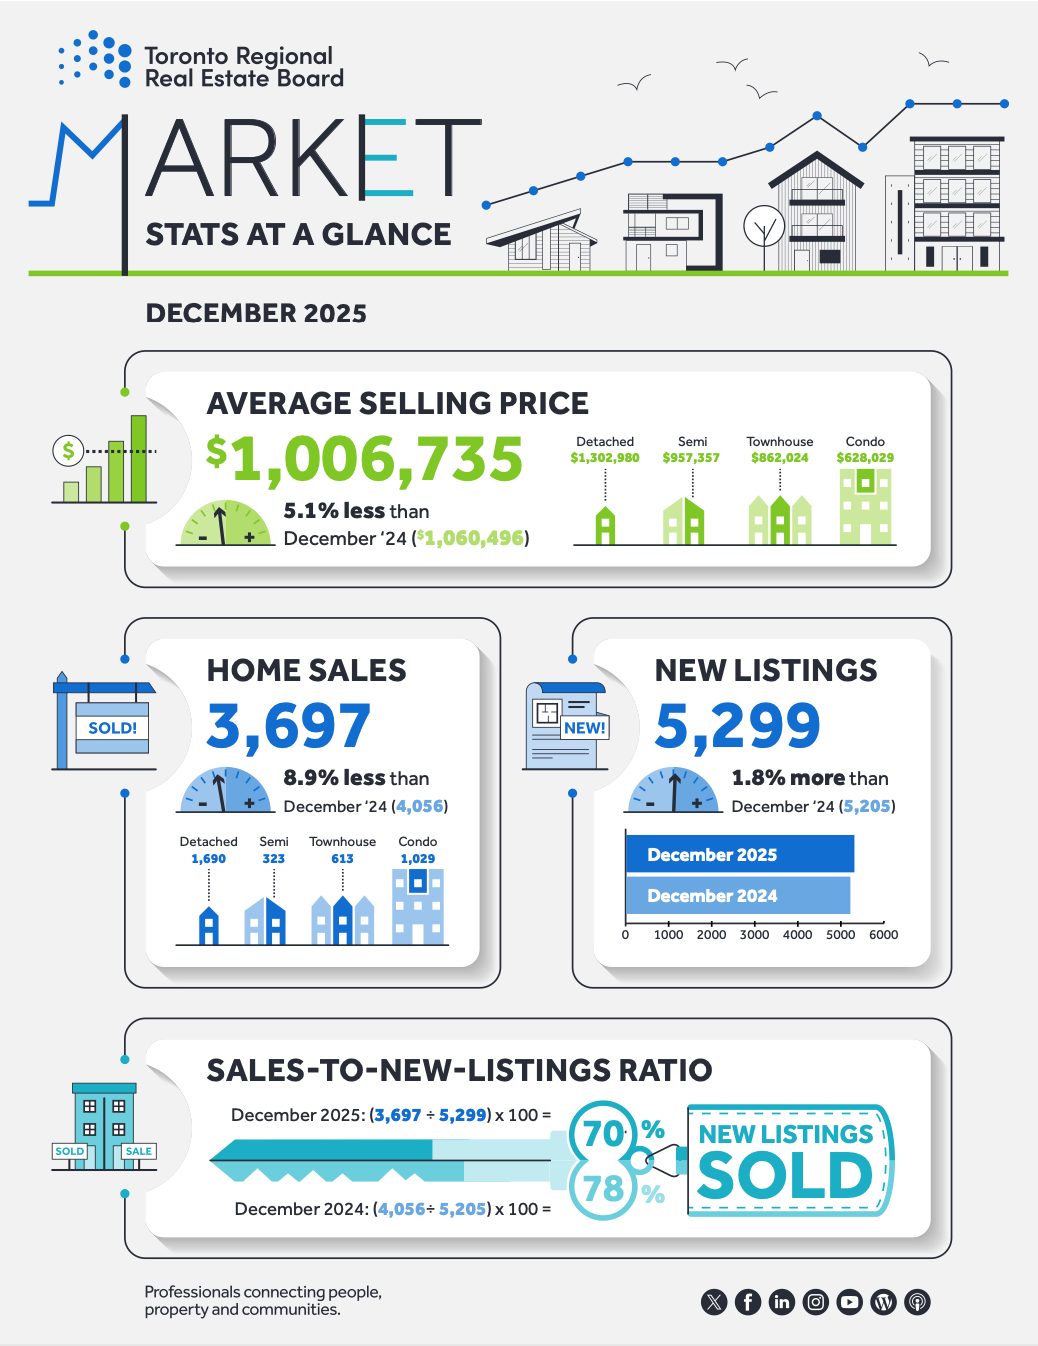
Toronto Regional Real Estate Board – Market Stats At A Glance – December 2025
Read the Toronto Regional Real Estate Board Market Watch Report
![]()
Uxbridge Township Real Estate Market Analysis – December 2025
The Uxbridge real estate market closed out December 2025 with signs of seasonal slowdown, balanced by modest price stability. The average sale price rose to $1,190,682, reflecting a 6.4% increase from November’s $1,118,650 and a marginal 0.32% gain year-over-year compared to December 2024’s $1,186,833.
December 2025
November 2025

While the month-over-month increase is notable, it’s important to view December’s figures within the context of reduced activity typical of the holiday season.In December, one property sold for over $2 million, five sold between $1 million and $2 million, and four properties sold under $700,000. By comparison, November saw three sales over $2 million, alongside a much larger number of lower-priced transactions. This shift in sales composition helped lift the average price despite significantly fewer overall sales.
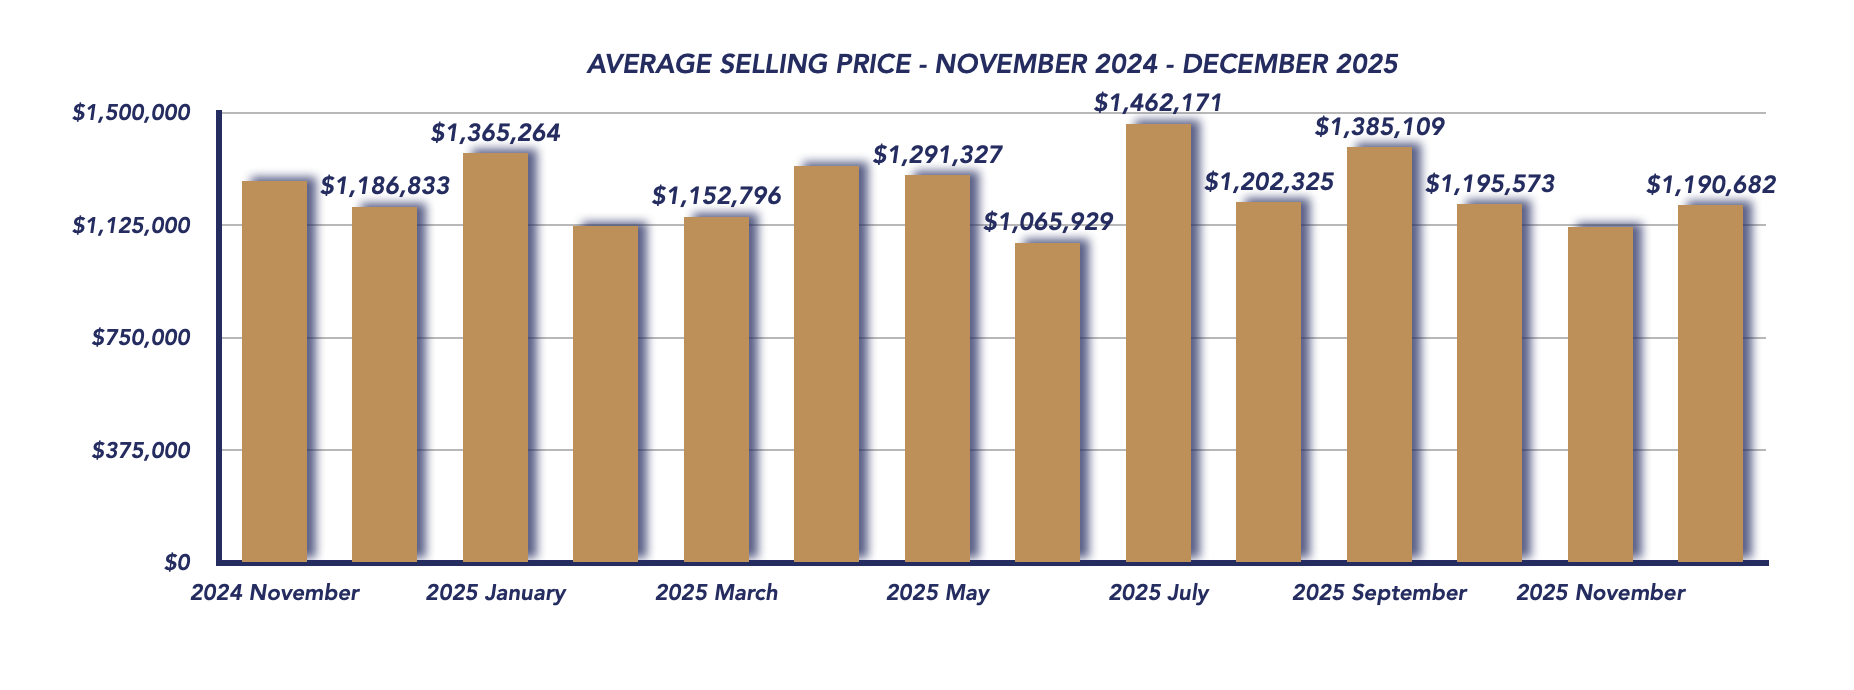
Sales Activity
Total sales fell to 11 in December, down sharply from 20 in November and below the 15 sales recorded in December 2024. This decline aligns with normal seasonal patterns, as many buyers and sellers pause activity during the holidays.
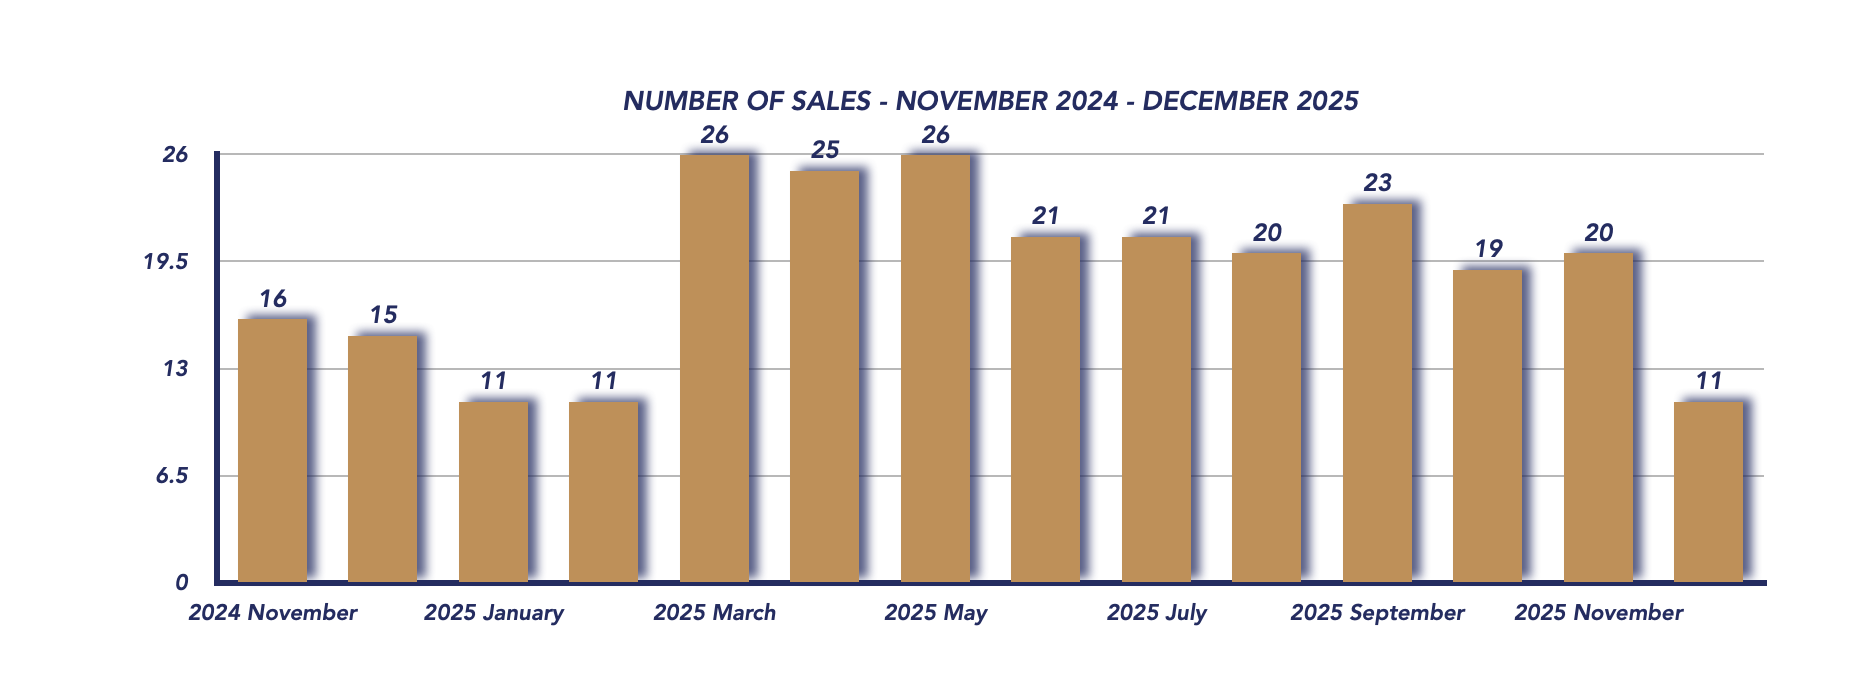
Sale-to-List Price Ratio
The sale-to-list price ratio dropped to 93%, down from 97% in November, signaling increased negotiation and pricing flexibility. With fewer buyers active in the market, sellers faced more pressure to adjust expectations to secure a sale.
Active Listings
Active listings declined significantly to 63, compared to 106 in November, and remained slightly above last December’s 57 listings. This sharp reduction reflects both fewer new listings and some existing inventory being withdrawn from the market during the winter months.
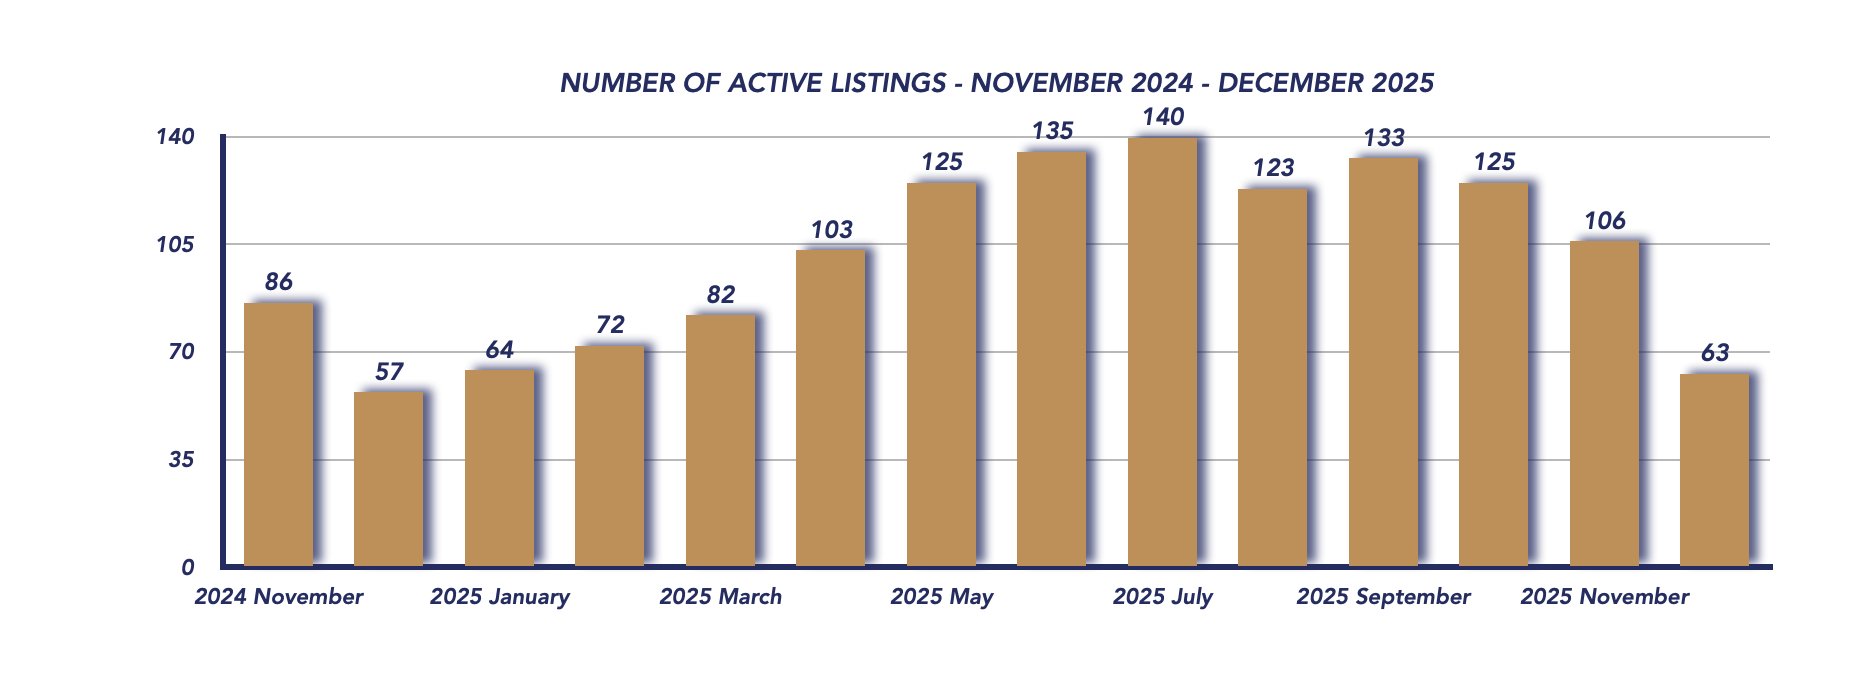
New Listings
New supply slowed to a near standstill, with just 8 new listings in December, compared to 38 in November and 7 in December 2024. This pullback is typical for the season and contributes to stabilizing inventory levels despite weaker sales.
Days on Market
Properties took an average of 129 days to sell, a substantial increase from 68 days in November. This reflects the slower pace of buyer activity and extended decision-making timelines common at year-end.
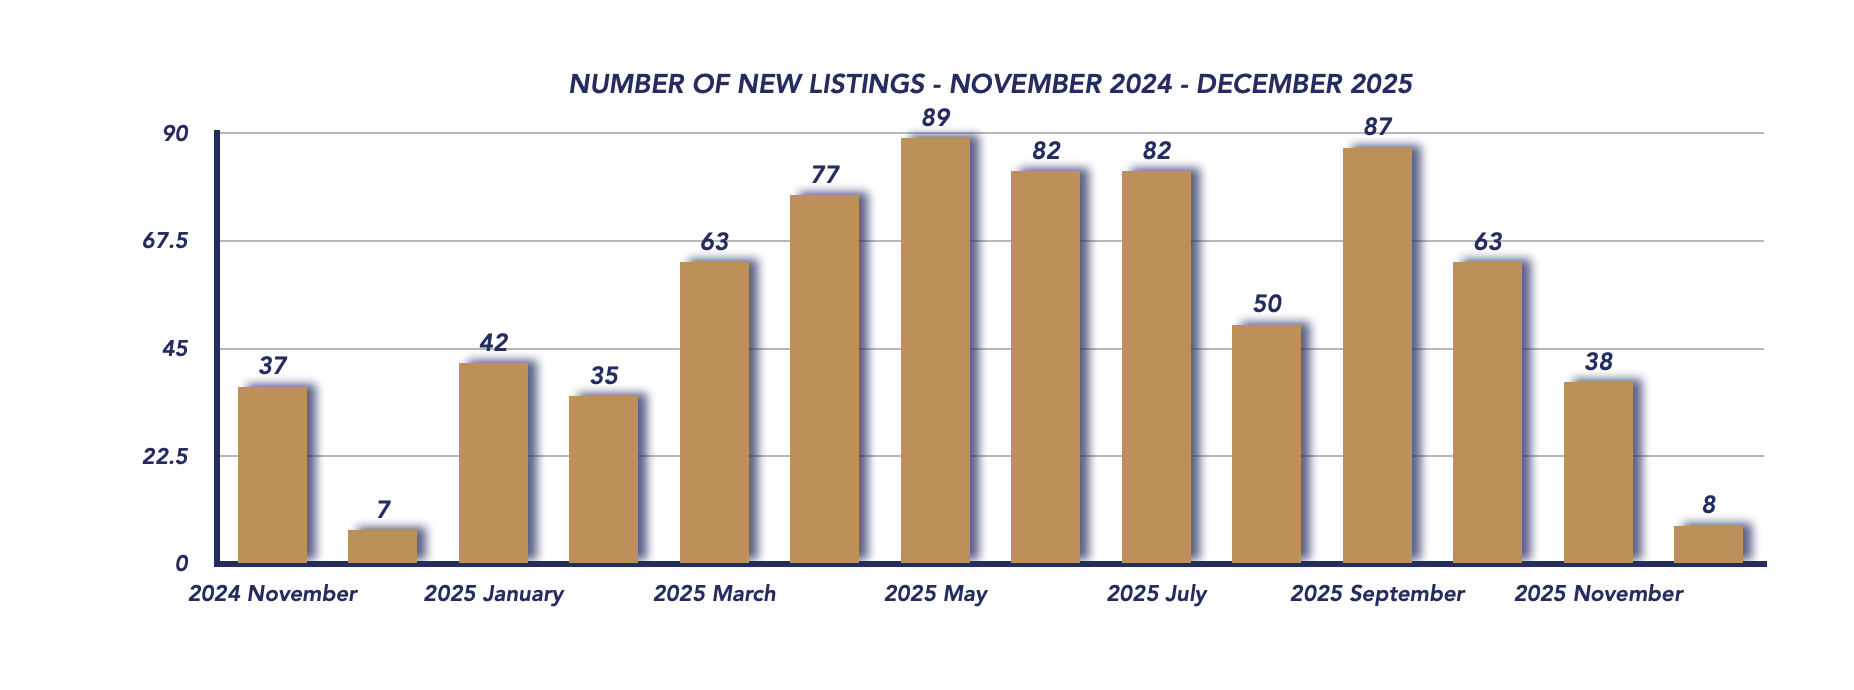
Months of Inventory
Months of inventory rose slightly to 5.73, up from 5.30 in November, placing the market at the upper edge of balanced territory. While demand softened, the simultaneous drop in new listings helped prevent a deeper move into buyer’s market conditions.

Conclusion
December 2025 marked a calm and seasonal close to the year for the Uxbridge housing market. Prices remained relatively stable, inventory tightened, and activity slowed—patterns consistent with year-end trends rather than market weakness.
As the market transitions into early 2026, the balanced inventory levels suggest a stable foundation. Buyers can expect less competition but slower processes, while sellers who price realistically may find motivated buyers once seasonal activity begins to return in the new year.
✅ Year-End Summary – Uxbridge Housing Market 2025
As 2025 comes to a close, the Uxbridge real estate market finishes the year in balanced territory, marked by fluctuating prices driven largely by the mix of homes sold rather than a dramatic shift in overall demand. While the year saw periods of buyer-favourable conditions and inventory growth, price stability toward the end of the year reflects a market finding its footing. Seasonal slowdowns in late fall and winter reduced sales volume, but inventory also tightened, preventing sharper price declines. Overall, 2025 was a year of normalization, where informed pricing, patience, and strategy proved essential for both buyers and sellers.
Key Performance Indicators (KPIs) from January 2024 through December 2025 provide a clear snapshot of how the Township of Uxbridge real estate market has evolved across all property types, architectural styles, and home configurations
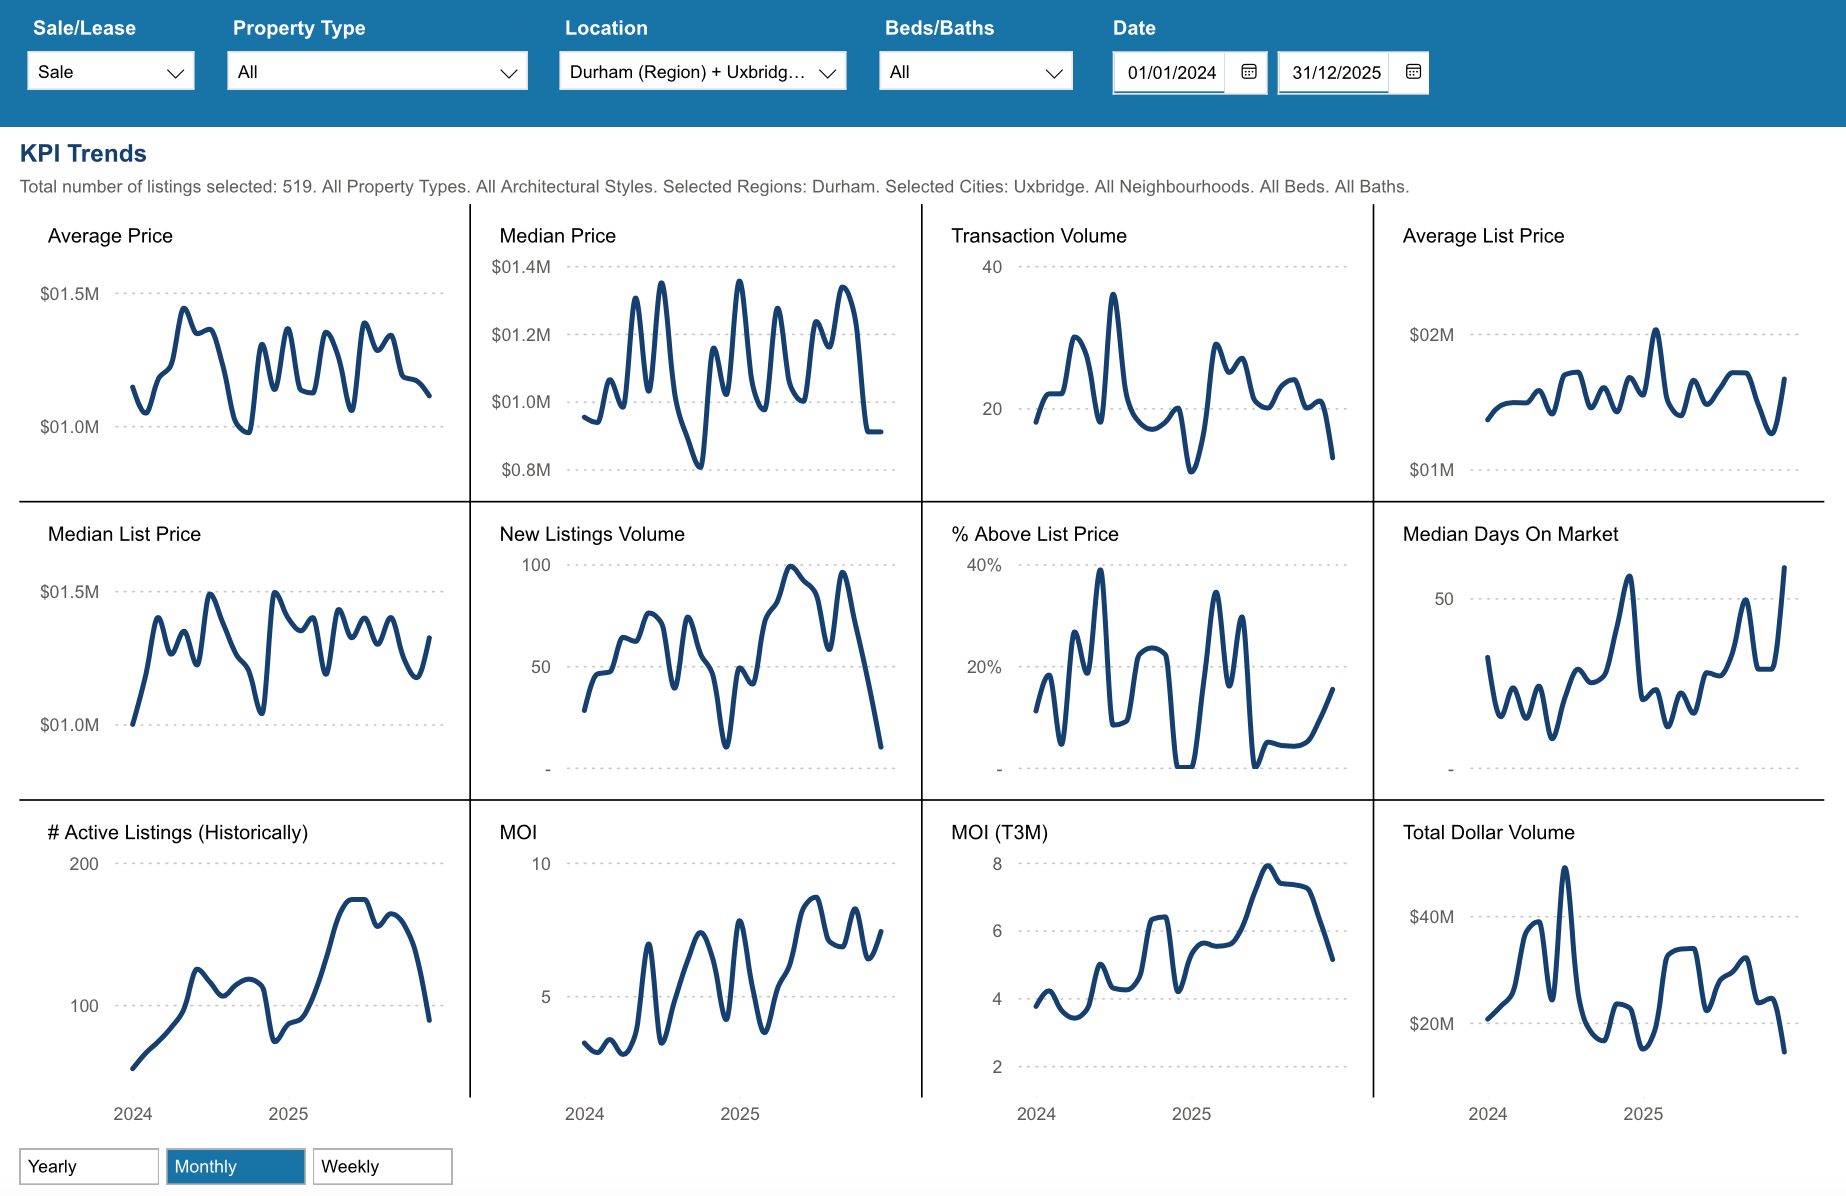
WATCH OUR MONDAY MARKET MINUTES
*Information is believed to be accurate at time of posting but is not guaranteed to be correct. Some values may vary slightly based on the exact date and time the reports were generated. Market stats are provided by TRREB (Toronto Regional Real Estate Board) and are based on sales for the month of Attached/Row/Townhouses, Condo Apartments, Condo Townhouses, Detached, Detached with Common Elements, Link Homes and Semi-detached. *Some values may vary slightly based on the exact date and time the reports were generated.
Not intended as a solicitation if your property is already listed by another broker. Affiliated real estate agents are independent contractor sales associates, not employees. ©2021 Coldwell Banker. All Rights Reserved. Coldwell Banker and the Coldwell Banker logos are trademarks of Coldwell Banker Real Estate LLC. The Coldwell Banker® System is comprised of company owned offices which are owned by a subsidiary of Realogy Brokerage Group LLC and franchised offices which are independently owned and operated. The Coldwell Banker System fully supports the principles of the Fair Housing Act and the Equal Opportunity Act.
Click below for more reports
Check out our Uxbridge and Scugog Events Pages to keep up to date on whats going on around town. Click the links or scan the Code with your phone to take you directly there.
UXBRIDGE EVENTS
SCUGOG EVENTS
Scugog Housing December 2025

Scugog Housing December 2025
Each office is independently owned and operated
![]()
![]()
Housing Market Report for December 2025
Here is the Township of Scugog Housing December 2025 report (all housing types), with reports from the Canadian Real Estate Association, and Toronto Regional Real Estate Board included.
This housing report for Durham Region includes the number of new listings, average list price, number of properties sold, average selling price, average days on market and average asking price to selling price ratio for all property types within the Region of Durham.
Scroll to the bottom for links to take you to the housing market reports for Durham Region, Uxbridge and Brock.
![]()
![]()
From Toronto Regional Real Estate Board
Please note: The PropTx MLS® System, of which TRREB is a part, has added a number of new client boards over the last year. Many of these boards’ Members trade within the Greater Toronto Area and broader Greater Golden Horseshoe regions. As a result, historic data have been updated to reflect the addition of these boards’ listings and transactions. This means historic data have changed relative to previously published static reports. To view updated historic data, click here.
Toronto Regional Real Estate Board – Market Stats At A Glance – December 2025
Read the Toronto Regional Real Estate Board Market Watch Report
![]()
Scugog Township Real Estate Market Analysis – December 2025
The Township of Scugog’s real estate market closed out 2025 with a typical seasonal slowdown in December. Sales volume softened, prices trended lower, and inventory tightened as fewer sellers listed homes during the holiday period. Despite these shifts, overall market conditions remained balanced, reflecting a stable foundation heading into the new year.
December 2025
November 2025
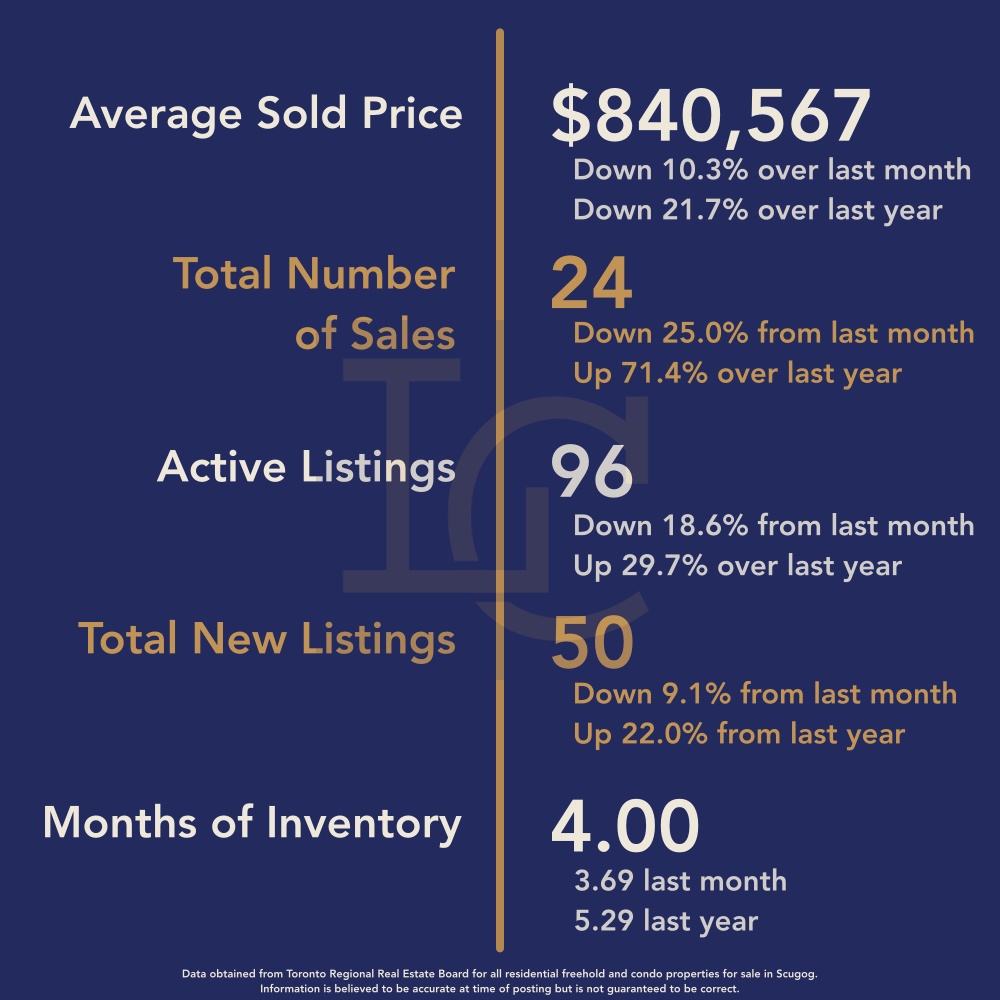
Average Sales Price
The average sales price in December 2025 came in at $786,240, representing a 6.5% decline from November ($840,567) and a 16.9% drop year-over-year compared to $946,643 in December 2024.
The lower average was heavily influenced by the mix of homes sold. In December:
-
Only one property sold over $1 million
-
One property sold under $500,000
-
Seven properties sold between $500,000 and $800,000
By comparison, December 2024 saw four homes sell over $1 million, which helped support higher averages last year. November 2025 also had more mid-range activity, with three sales under $500,000 and 11 between $500,000 and $800,000. The reduced number of higher-end transactions in December naturally pulled the average price lower.
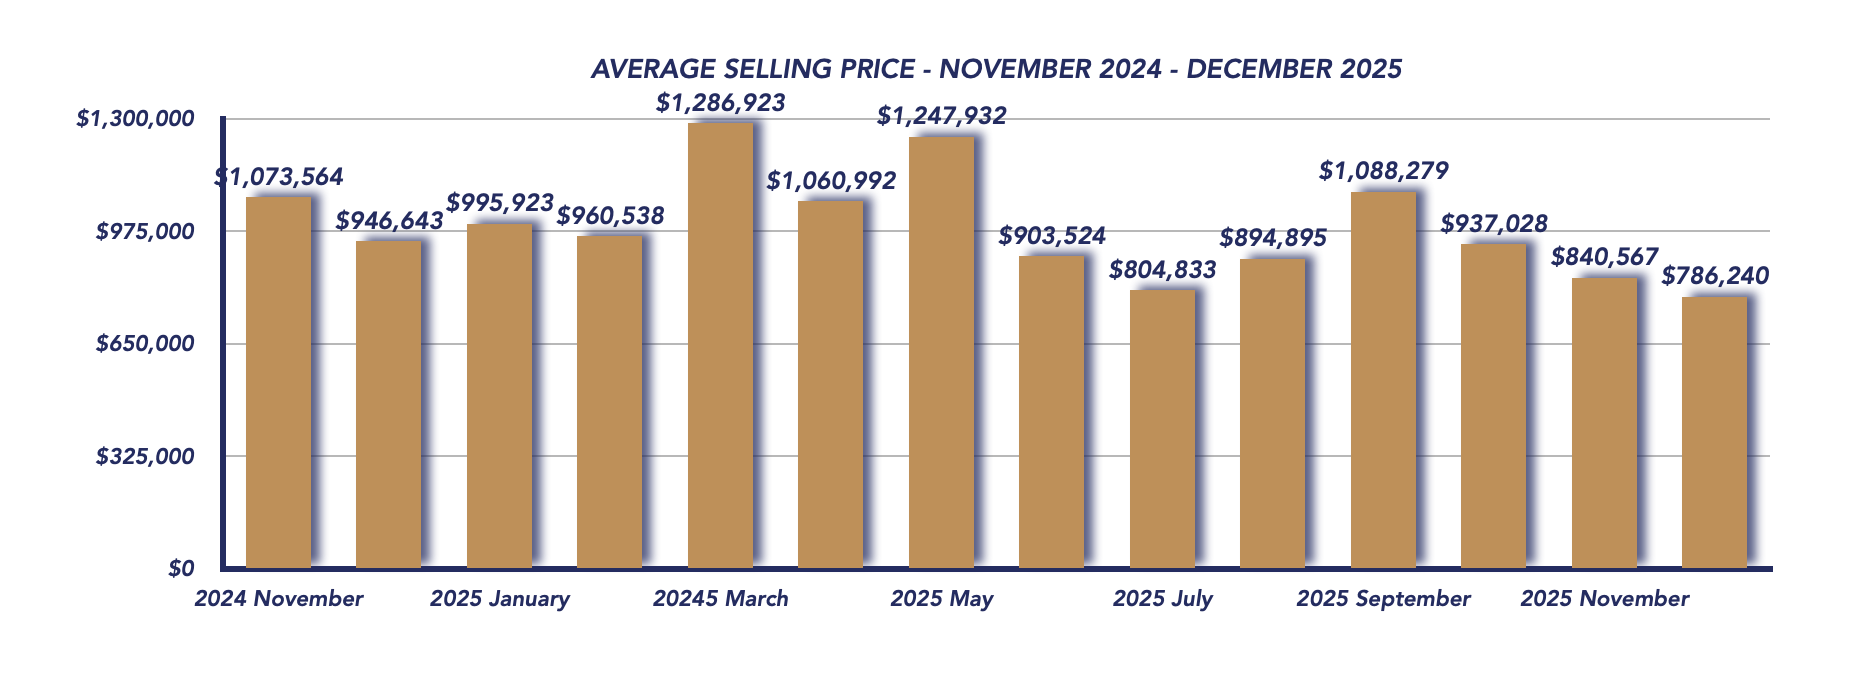
Sales Activity
A total of 13 homes sold in December, down sharply from 24 in November, but nearly identical to 14 sales in December 2024. This decline aligns with normal holiday-season behavior, as both buyers and sellers step back from the market toward year-end.
The sale-to-list price ratio eased to 95%, down from 97% last month, indicating slightly more negotiation and price flexibility for buyers during this slower period.
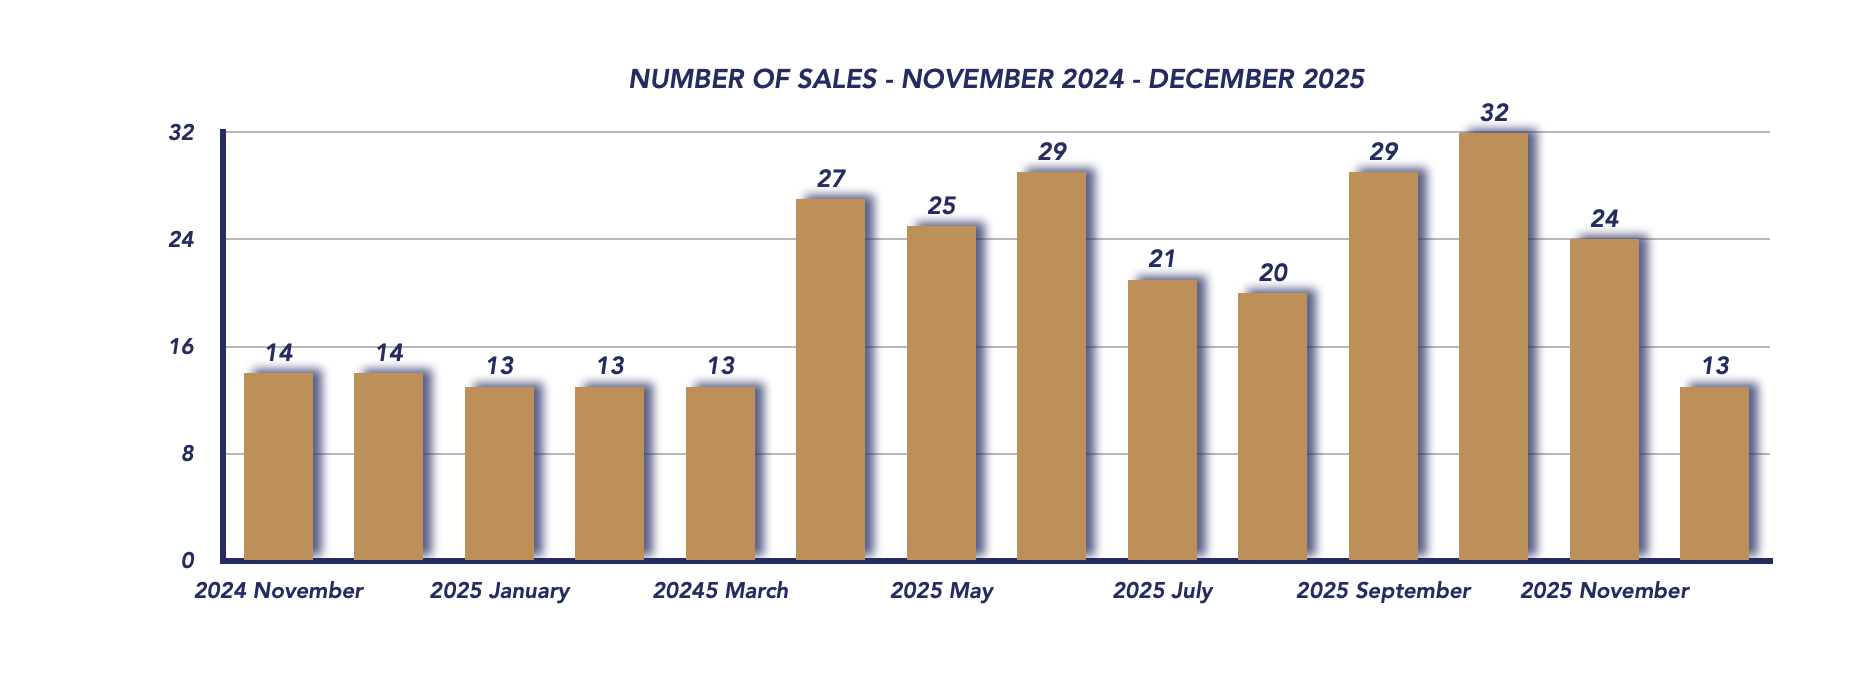
Listings & Inventory
Inventory levels dropped notably as fewer new listings came to market:
-
Active listings fell to 56, down from 96 in November, though slightly above the 49 active listings seen in December 2024.
-
New listings declined to 18, compared to 50 last month, but still ahead of the 14 new listings recorded last December.
This pullback in supply is typical for December, as many sellers choose to wait until the spring market to list.
The months of inventory rose modestly to 4.31, up from 4.00 in November, keeping Scugog firmly in balanced market territory.
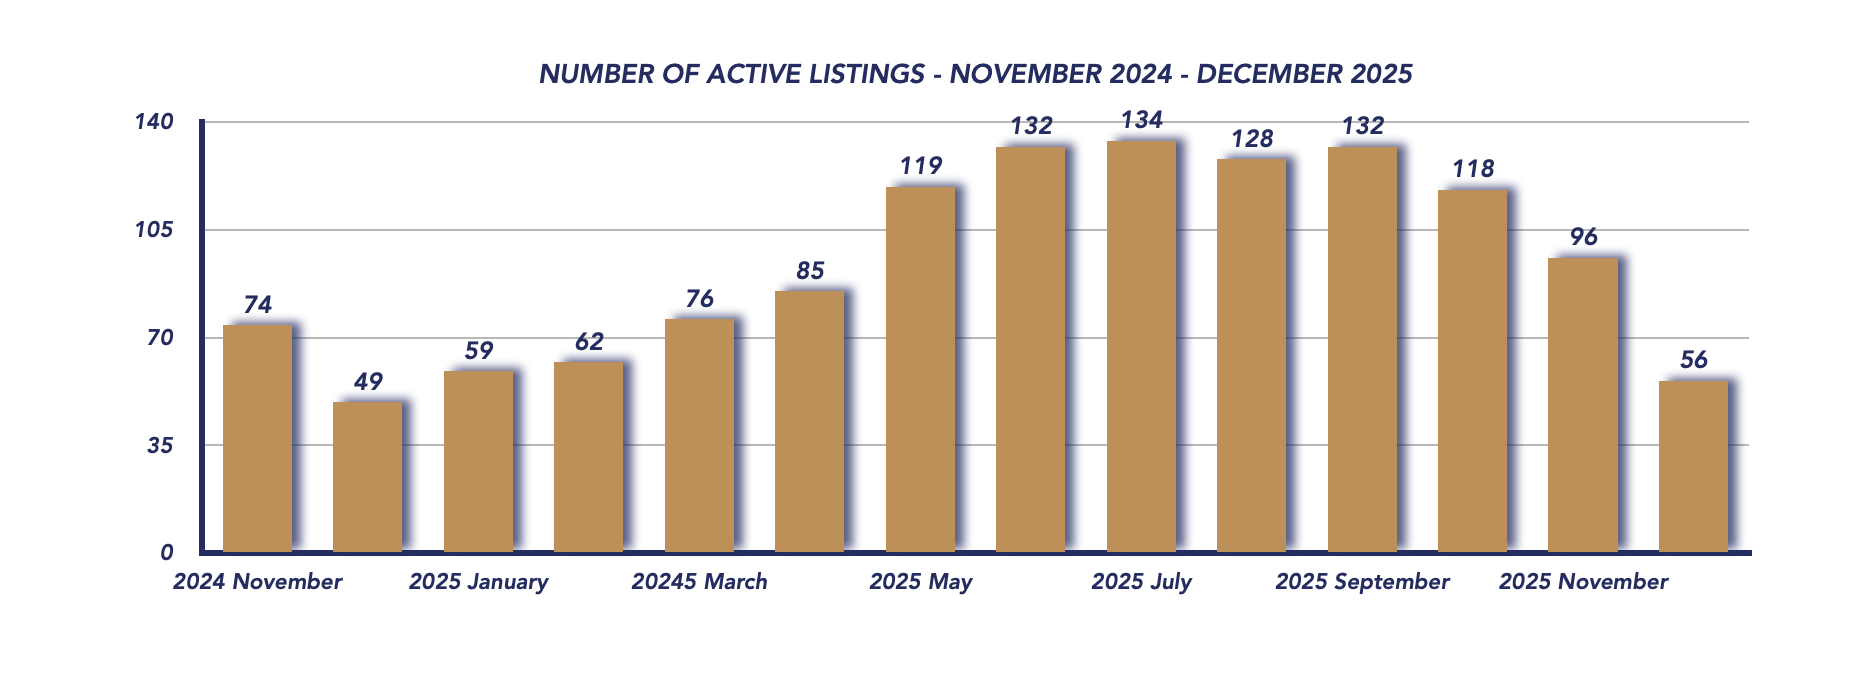
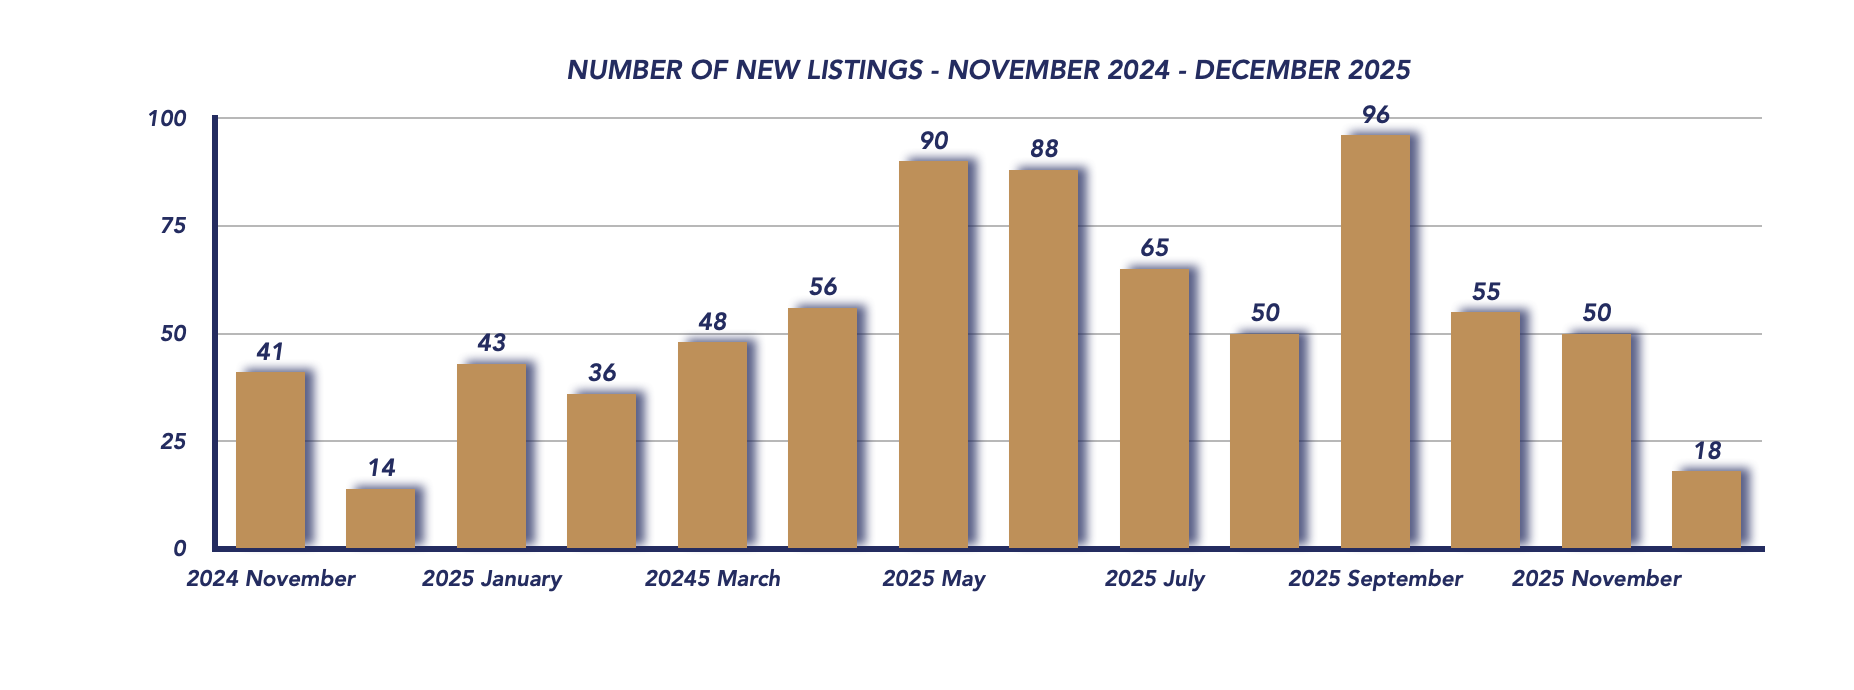
Days on Market
Homes continued to sell at a steady pace, averaging 51 days on market, slightly faster than 53 days in November. This suggests that motivated buyers were still active and able to transact efficiently despite the seasonal slowdown.
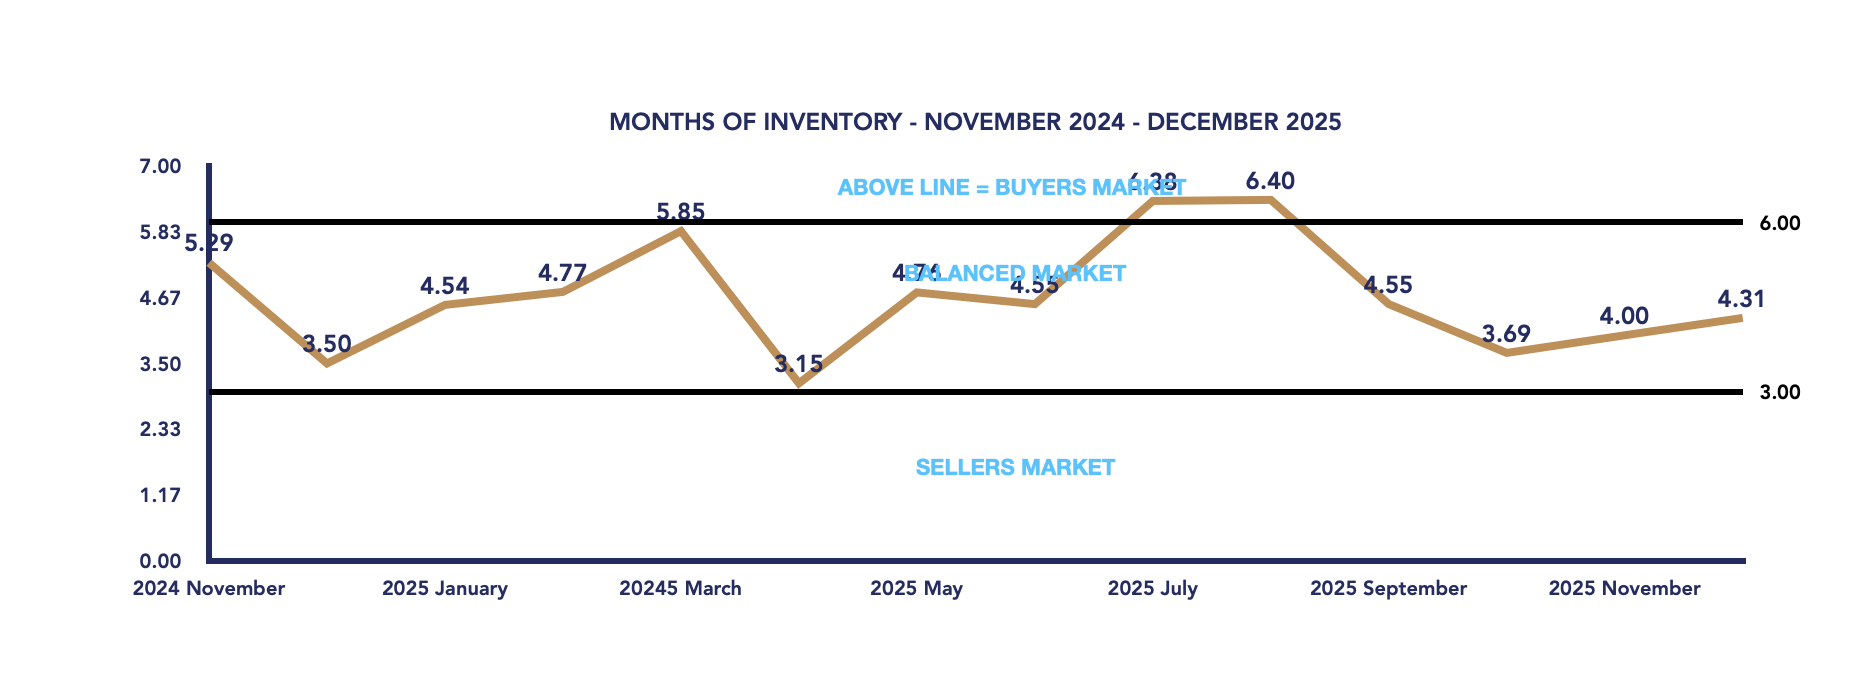
Key Takeaways
-
Average prices declined month-over-month and year-over-year, largely due to fewer high-end sales.
-
Sales volume dropped sharply, reflecting typical December seasonality.
-
Inventory tightened significantly, with far fewer new listings entering the market.
-
Sale-to-list ratios softened, giving buyers modest negotiating leverage.
-
Balanced market conditions remained intact, heading into 2026.
As Scugog moves into early 2026, the December data highlights a market that slowed for the holidays but remained fundamentally stable. Buyers may find opportunities during the quieter winter months, while sellers preparing for the spring market will want to watch inventory levels and pricing trends closely as activity begins to ramp up again in the new year.
✅ Year-End Market Summary (2025)
As 2025 comes to a close, the Scugog real estate market reflects a year of adjustment and normalization following the volatility of previous years. Prices trended lower in the second half of the year, largely influenced by fewer luxury sales and a higher concentration of mid-range and entry-level transactions. Despite these shifts, overall market conditions remained balanced, with steady absorption, reasonable selling timelines, and consistent buyer engagement. Inventory fluctuated throughout the year but settled at healthy levels by December, positioning Scugog well for a potentially active spring market in 2026. Both buyers and sellers enter the new year with clearer pricing expectations and a more stable market foundation.
Key Performance Indicators (KPIs) from January 2024 through November 2025 provide a clear snapshot of how the Township of Scugog real estate market has evolved across all property types, architectural styles, and home configurations
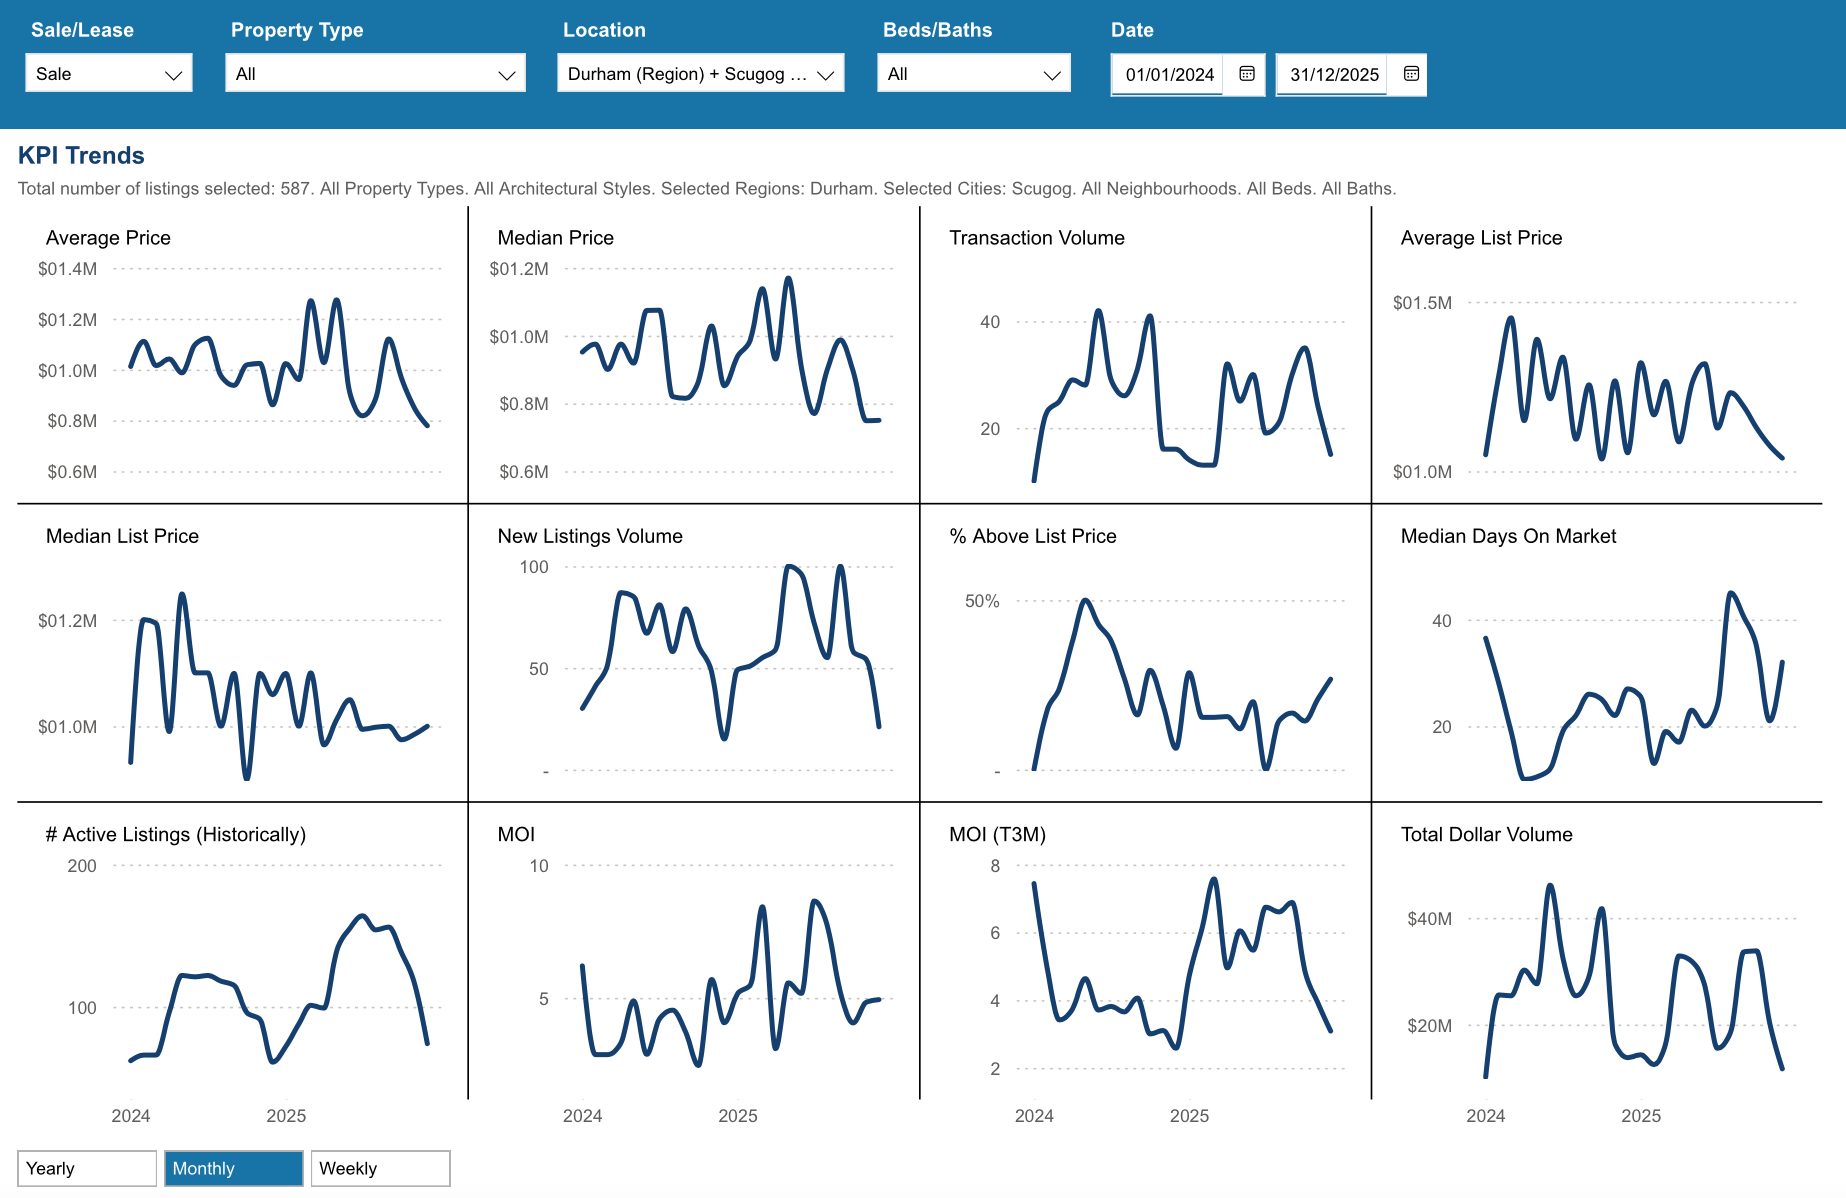
WATCH OUR MONDAY MARKET MINUTES
*Information is believed to be accurate at time of posting but is not guaranteed to be correct. Some values may vary slightly based on the exact date and time the reports were generated. Market stats are provided by TRREB (Toronto Regional Real Estate Board) and are based on sales for the month of Attached/Row/Townhouses, Condo Apartments, Condo Townhouses, Detached, Detached with Common Elements, Link Homes and Semi-detached. *Some values may vary slightly based on the exact date and time the reports were generated.
Not intended as a solicitation if your property is already listed by another broker. Affiliated real estate agents are independent contractor sales associates, not employees. ©2021 Coldwell Banker. All Rights Reserved. Coldwell Banker and the Coldwell Banker logos are trademarks of Coldwell Banker Real Estate LLC. The Coldwell Banker® System is comprised of company owned offices which are owned by a subsidiary of Realogy Brokerage Group LLC and franchised offices which are independently owned and operated. The Coldwell Banker System fully supports the principles of the Fair Housing Act and the Equal Opportunity Act.
Click below for more reports
Check out our Uxbridge and Scugog Events Pages to keep up to date on whats going on around town. Click the links or scan the Code with your phone to take you directly there.
UXBRIDGE EVENTS
SCUGOG EVENTS
Brock Housing December 2025

Brock Housing December 2025
Each office is independently owned and operated
![]()
![]()
Housing Market Report for December 2025
Here is the Township of Brock Housing December 2025 report (all housing types), with reports from the Canadian Real Estate Association, and Toronto Regional Real Estate Board included.
This housing report for Durham Region includes the number of new listings, average list price, number of properties sold, average selling price, average days on market and average asking price to selling price ratio for all property types within the Region of Durham.
Scroll to the bottom for links to take you to the housing market reports for Durham Region, Uxbridge and Scugog.
![]()
![]()
From Toronto Regional Real Estate Board
Please note: The PropTx MLS® System, of which TRREB is a part, has added a number of new client boards over the last year. Many of these boards’ Members trade within the Greater Toronto Area and broader Greater Golden Horseshoe regions. As a result, historic data have been updated to reflect the addition of these boards’ listings and transactions. This means historic data have changed relative to previously published static reports. To view updated historic data, click here.
Toronto Regional Real Estate Board – Market Stats At A Glance – December 2025
Read the Toronto Regional Real Estate Board Market Watch Report
![]()
Brock Township Real Estate Market Analysis – December 2025
The Brock Township real estate market closed out 2025 with signs of stabilization, as pricing edged higher from November and inventory levels tightened. While average sale prices remained well below last year’s levels, December data suggests the market is beginning to rebalance after several months in buyer-favoured territory.
December 2025
November 2025
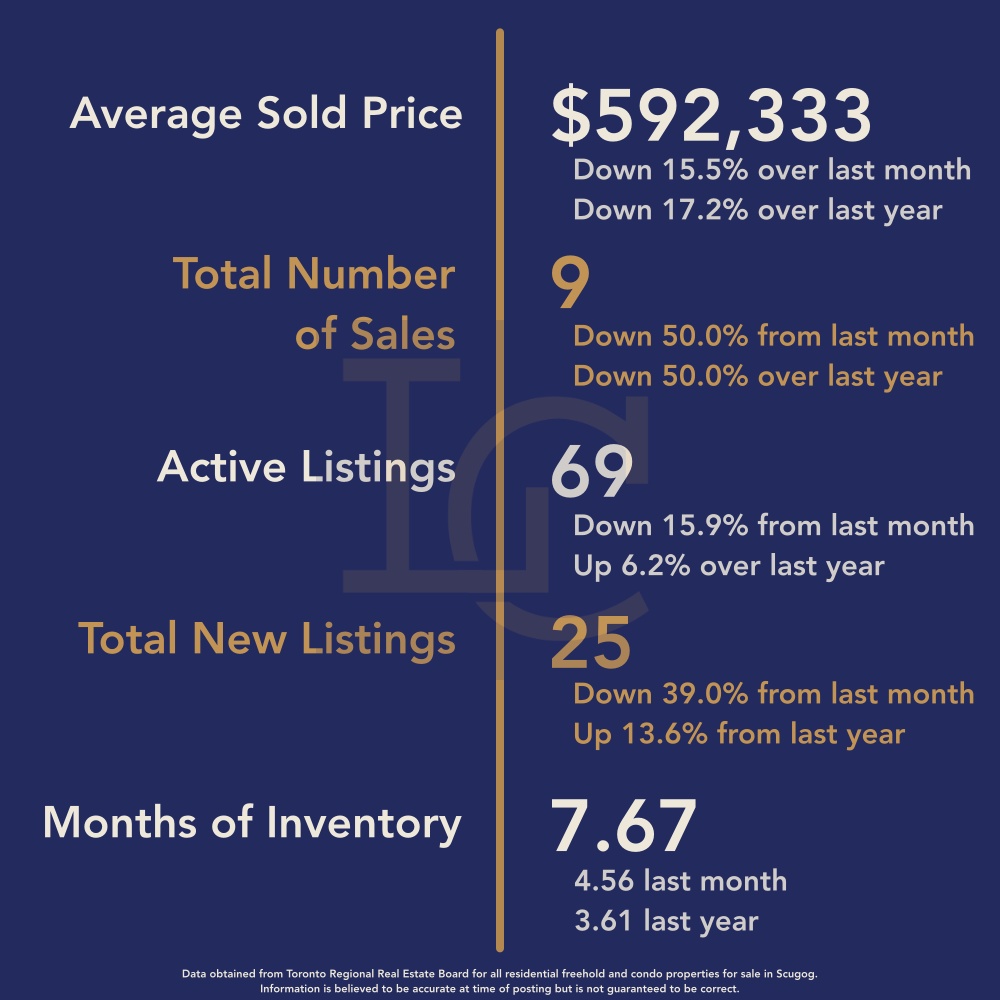
Average Sale Price Improves Month-Over-Month but Remains Well Below Last Year
The average sale price in December 2025 was $616,150, representing a:
-
4.0% increase from November 2025 ($592,333), and
-
26.0% decrease from December 2024 ($832,833).
The year-over-year decline is largely explained by the absence of luxury sales. In December 2024, two properties sold in the $1–$2 million range, which significantly elevated last year’s average.
By contrast, December 2025’s highest sale was $820,000, with two properties selling for under $500,000, keeping the average price much more reflective of the Township’s core market.
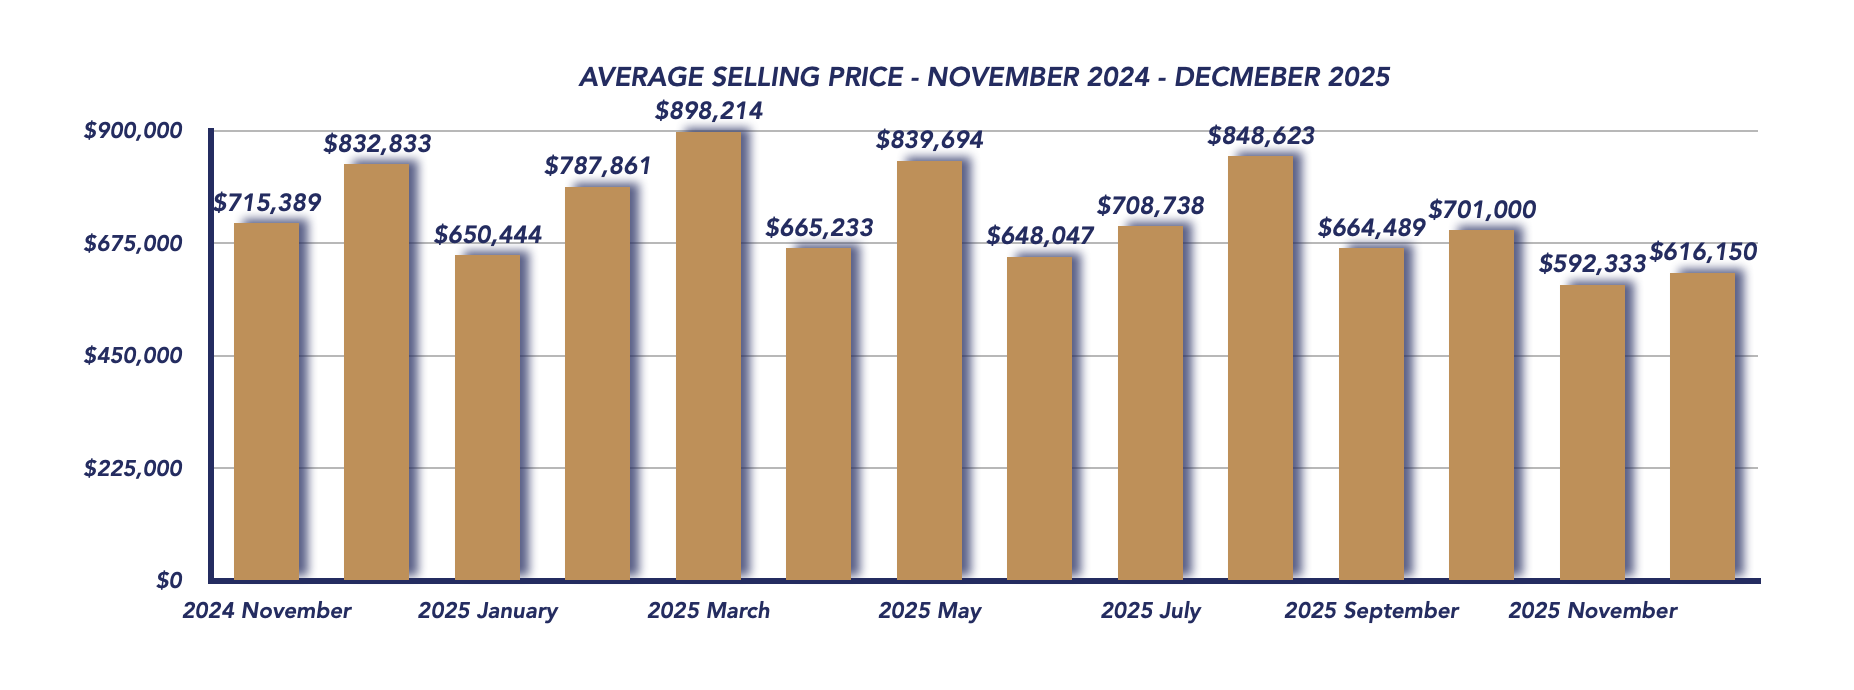
Sales Activity Picks Up Slightly
A total of 10 properties sold in December, up from 9 sales in November, and notably higher than the 6 sales recorded in December 2024.
While activity remains modest—as expected for the holiday season—the increase suggests steady buyer interest, particularly at more affordable price points.
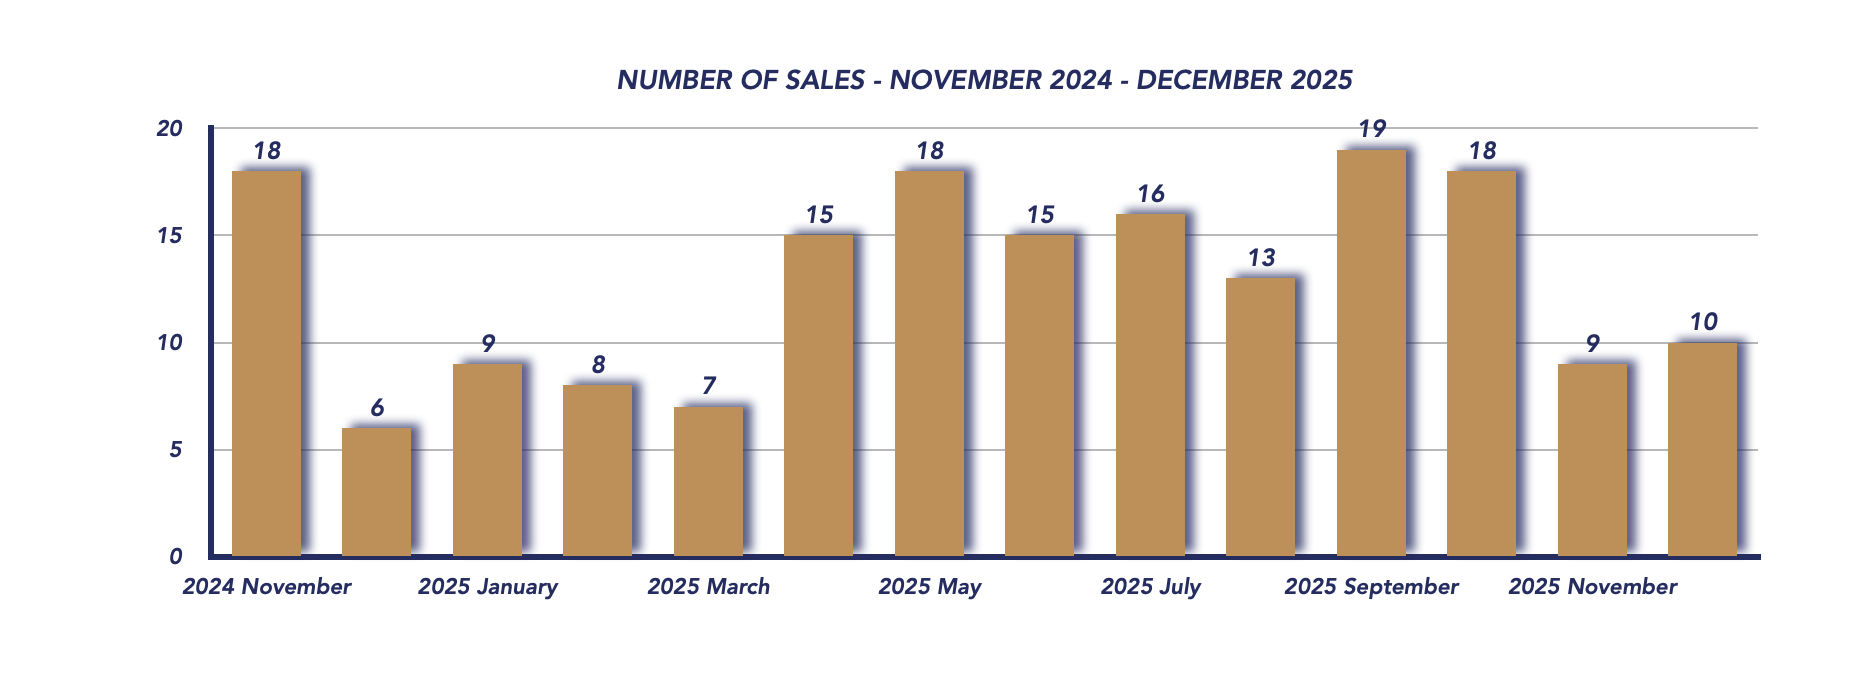
Sale-to-List Price Ratio Softens
The sale-to-list price ratio fell to 93%, down from 98% in November and below 96% recorded in December 2024.
This decline indicates that buyers maintained negotiating leverage in December, and sellers were more willing to adjust pricing to secure deals before year-end.
Inventory Tightens Significantly
Supply levels declined sharply as the year wrapped up:
-
Active listings: 47 (down from 69 in November, slightly above 44 last year)
-
New listings: 14 (down from 25 last month, but higher than just 5 last year)
The reduction in listings reflects seasonal slowdown, but also contributed to improved balance between supply and demand.
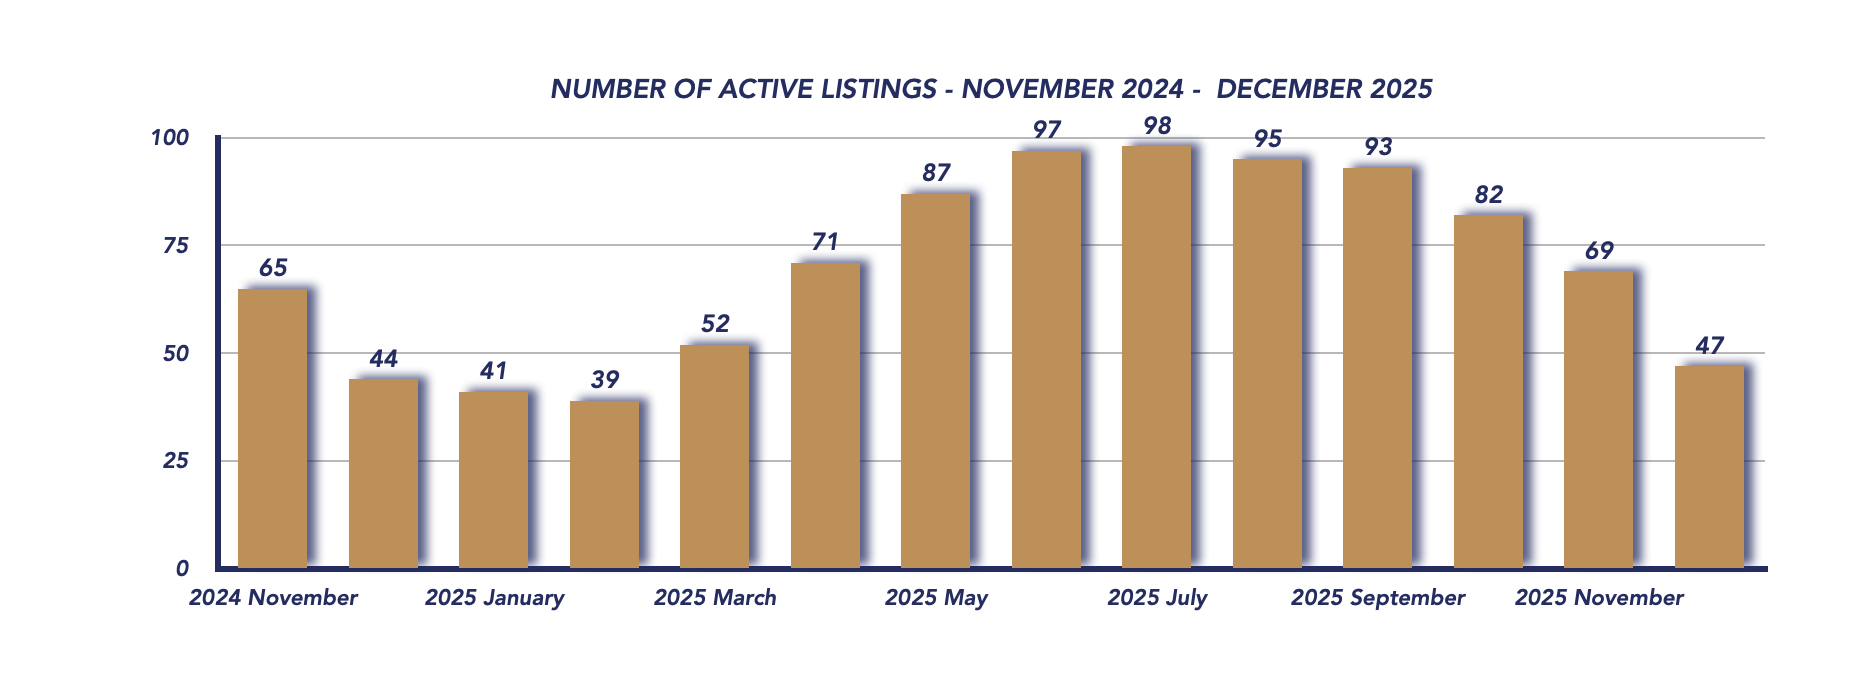
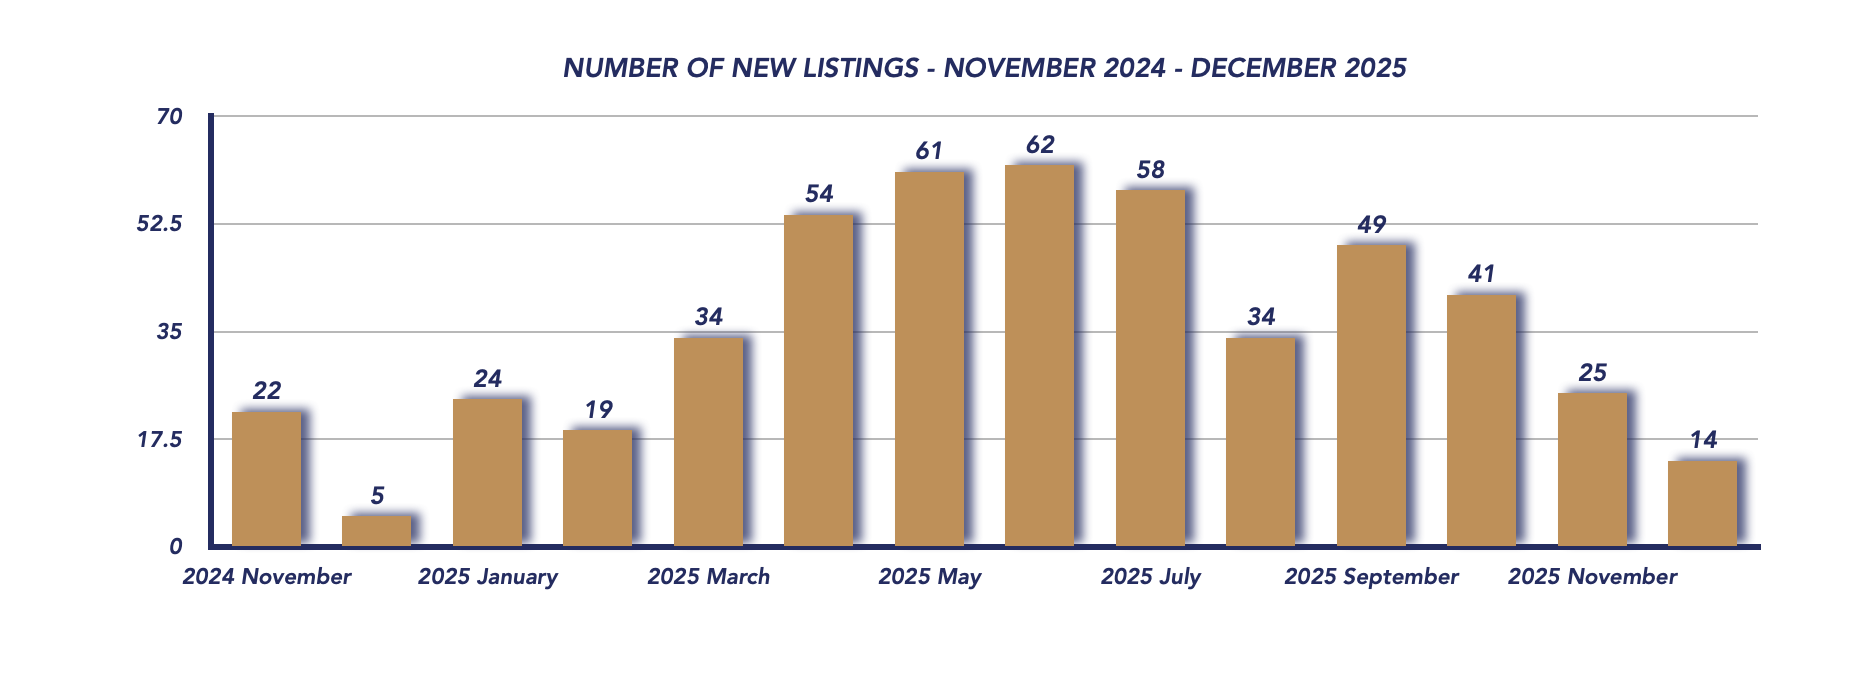
Days on Market & Market Balance
Homes spent an average of 97 days on the market, highlighting slower transaction timelines and cautious buyer decision-making.
However, months of inventory dropped to 4.70, down from 7.67 in November, officially shifting the market back into balanced territory. This change suggests that reduced supply, rather than increased demand, is helping stabilize conditions.
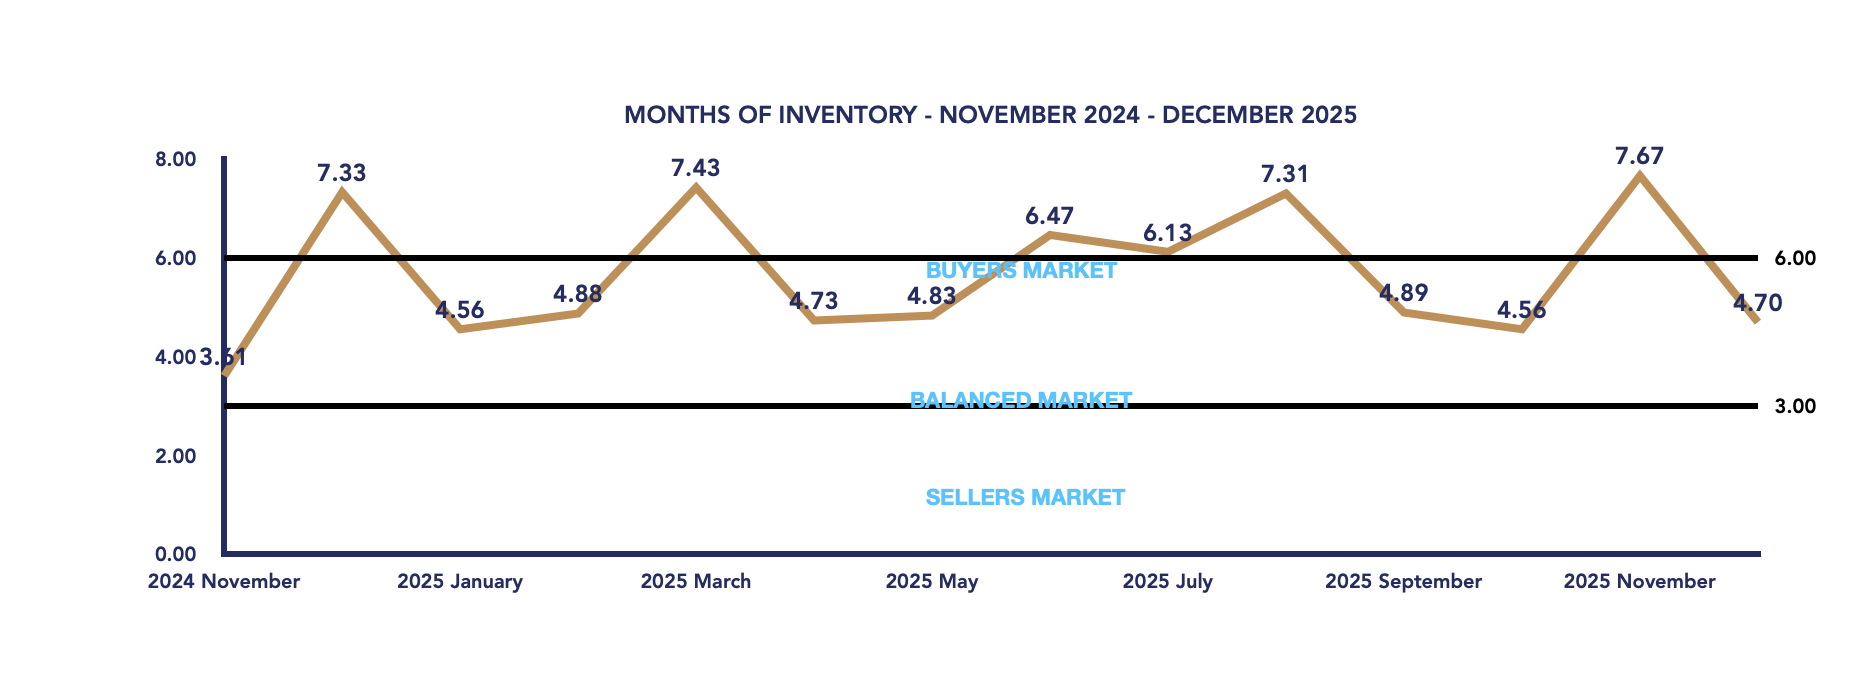
Conclusion
December 2025 marked a transition month for the Brock Township real estate market. While prices remained significantly lower than last year due to the absence of high-end sales, the modest price rebound from November, rising sales, and declining inventory all point to a market finding its footing.
As Brock Township enters 2026, buyers will continue to benefit from reasonable pricing and negotiating room, while sellers may see improved conditions if inventory remains constrained. Much will depend on how early-year listings and buyer confidence shape the spring market ahead.
✅ Year-End Summary (2025 Overview)
As 2025 comes to a close, the Brock Township real estate market reflects a year of adjustment and normalization. After periods of price volatility driven by high-end sales earlier in the year, the market gradually shifted toward more realistic pricing and balanced conditions. Sales activity remained steady overall, while inventory levels fluctuated between buyer-favoured and balanced territory. By year-end, reduced listings helped stabilize the market, setting the stage for a more measured and sustainable start to 2026. Buyers benefited from increased negotiating power through much of the year, while sellers who priced accurately continued to achieve successful results.
Key Performance Indicators (KPIs) from January 2024 through December 2025 provide a clear snapshot of how the Township of Brock real estate market has evolved across all property types, architectural styles, and home configurations
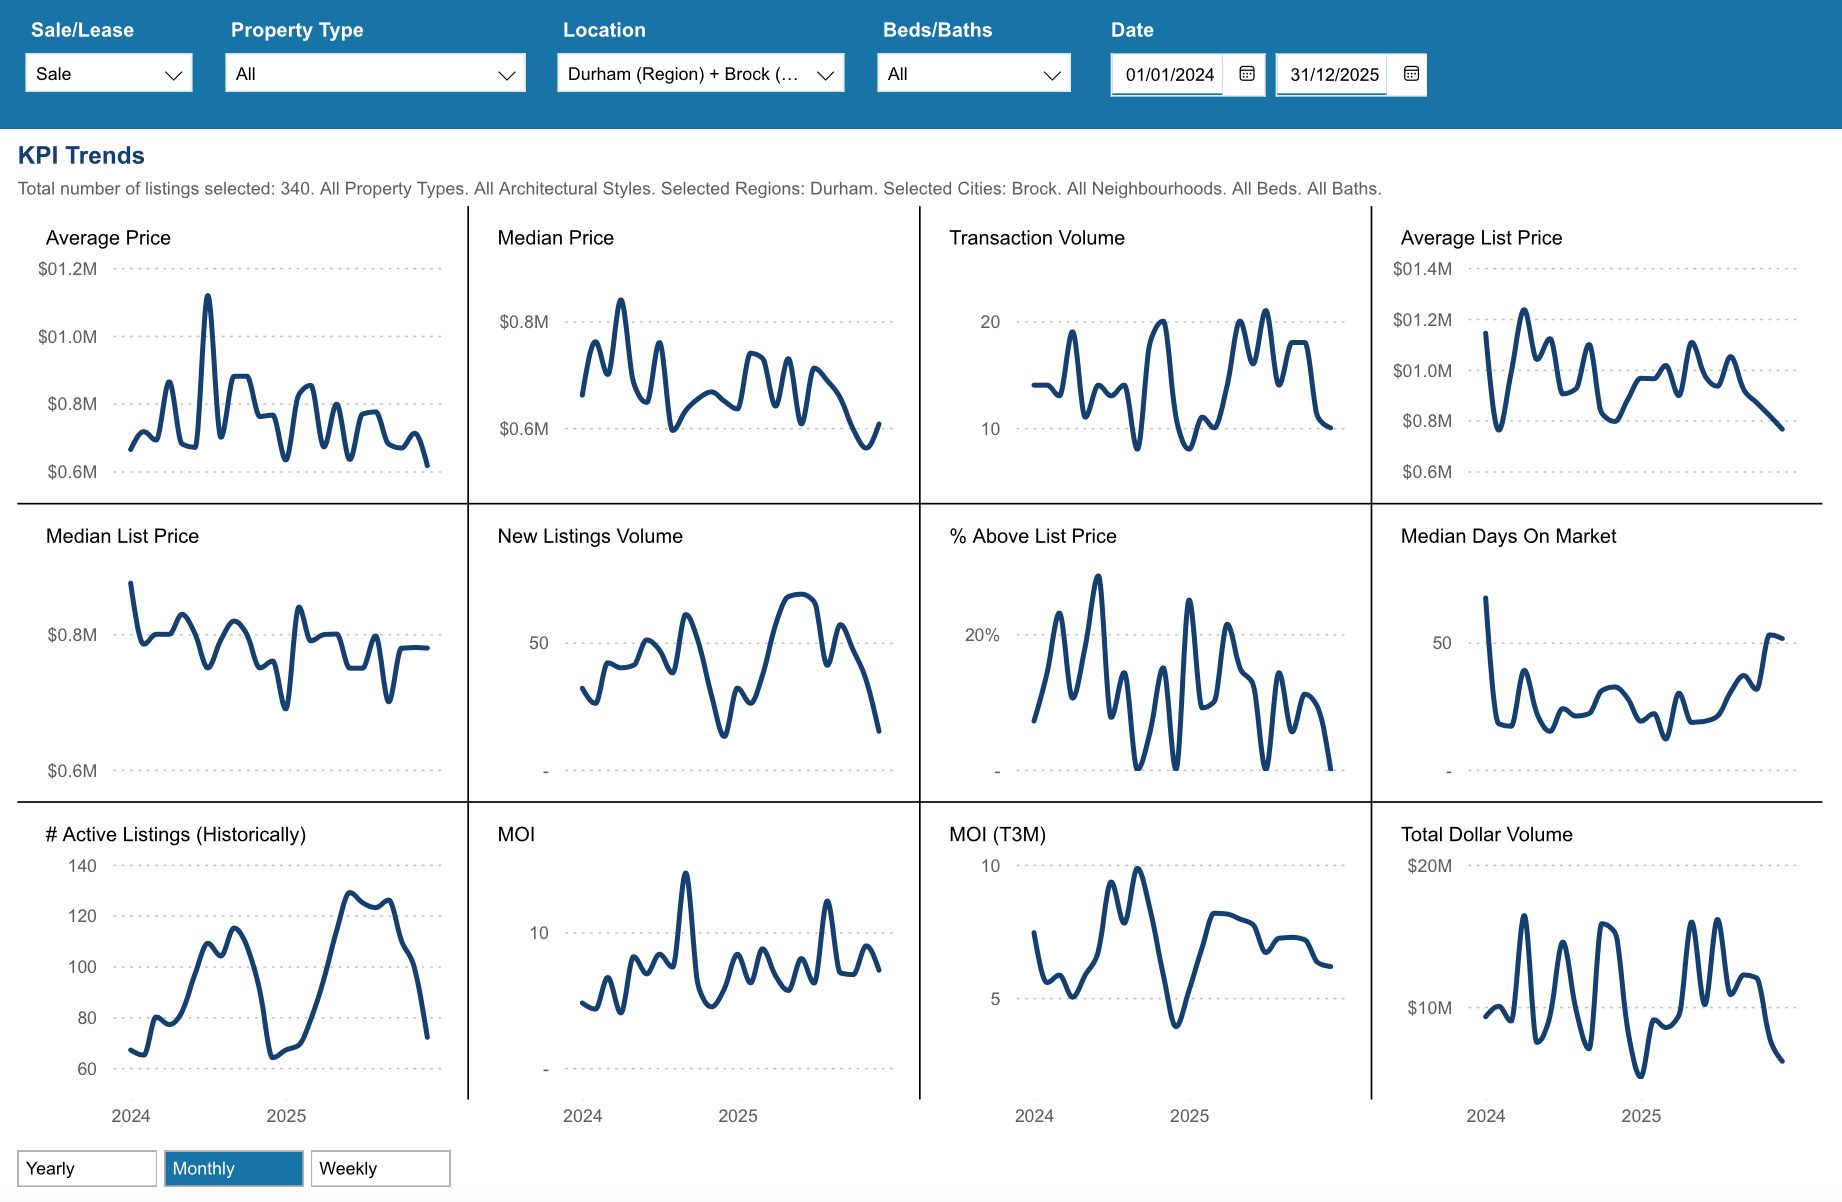
*Information is believed to be accurate at time of posting but is not guaranteed to be correct. Some values may vary slightly based on the exact date and time the reports were generated. Market stats are provided by TRREB (Toronto Regional Real Estate Board) and are based on sales for the month of Attached/Row/Townhouses, Condo Apartments, Condo Townhouses, Detached, Detached with Common Elements, Link Homes and Semi-detached. *Some values may vary slightly based on the exact date and time the reports were generated.
Not intended as a solicitation if your property is already listed by another broker. Affiliated real estate agents are independent contractor sales associates, not employees. ©2021 Coldwell Banker. All Rights Reserved. Coldwell Banker and the Coldwell Banker logos are trademarks of Coldwell Banker Real Estate LLC. The Coldwell Banker® System is comprised of company owned offices which are owned by a subsidiary of Realogy Brokerage Group LLC and franchised offices which are independently owned and operated. The Coldwell Banker System fully supports the principles of the Fair Housing Act and the Equal Opportunity Act.
Click below for more reports
Check out our Uxbridge and Scugog Events Pages to keep up to date on whats going on around town. Click the links or scan the Code with your phone to take you directly there.
UXBRIDGE EVENTS
SCUGOG EVENTS
Durham Region Housing December 2025

Durham Region Housing December 2025
Each office is independently owned and operated
![]()
![]()
Housing Market Report for December 2025
Here is the Region of Durham Housing December 2025 report (all housing types), with reports from the Canadian Real Estate Association, and Toronto Regional Real Estate Board included.
This housing report for Durham Region includes the number of new listings, average list price, number of properties sold, average selling price, average days on market and average asking price to selling price ratio for all property types within the Region of Durham.
Scroll to the bottom for links to take you to the housing market reports for Uxbridge, Scugog and Brock.
![]()
![]()
From Toronto Regional Real Estate Board
Please note: The PropTx MLS® System, of which TRREB is a part, has added a number of new client boards over the last year. Many of these boards’ Members trade within the Greater Toronto Area and broader Greater Golden Horseshoe regions. As a result, historic data have been updated to reflect the addition of these boards’ listings and transactions. This means historic data have changed relative to previously published static reports. To view updated historic data, click here.
Toronto Regional Real Estate Board – Market Stats At A Glance – December 2025
Read the Toronto Regional Real Estate Board Market Watch Report
![]()
Durham Region Real Estate Market Analysis – December 2025
The Durham Region housing market closed out 2025 with a familiar seasonal slowdown in December, marked by fewer sales, reduced new listings, and longer selling times. While prices remained under pressure compared to last year, month-over-month values edged slightly higher, and inventory tightened enough to keep the market firmly in balanced territory—setting the stage for a potentially more active start to 2026.
December 2025
November 2025
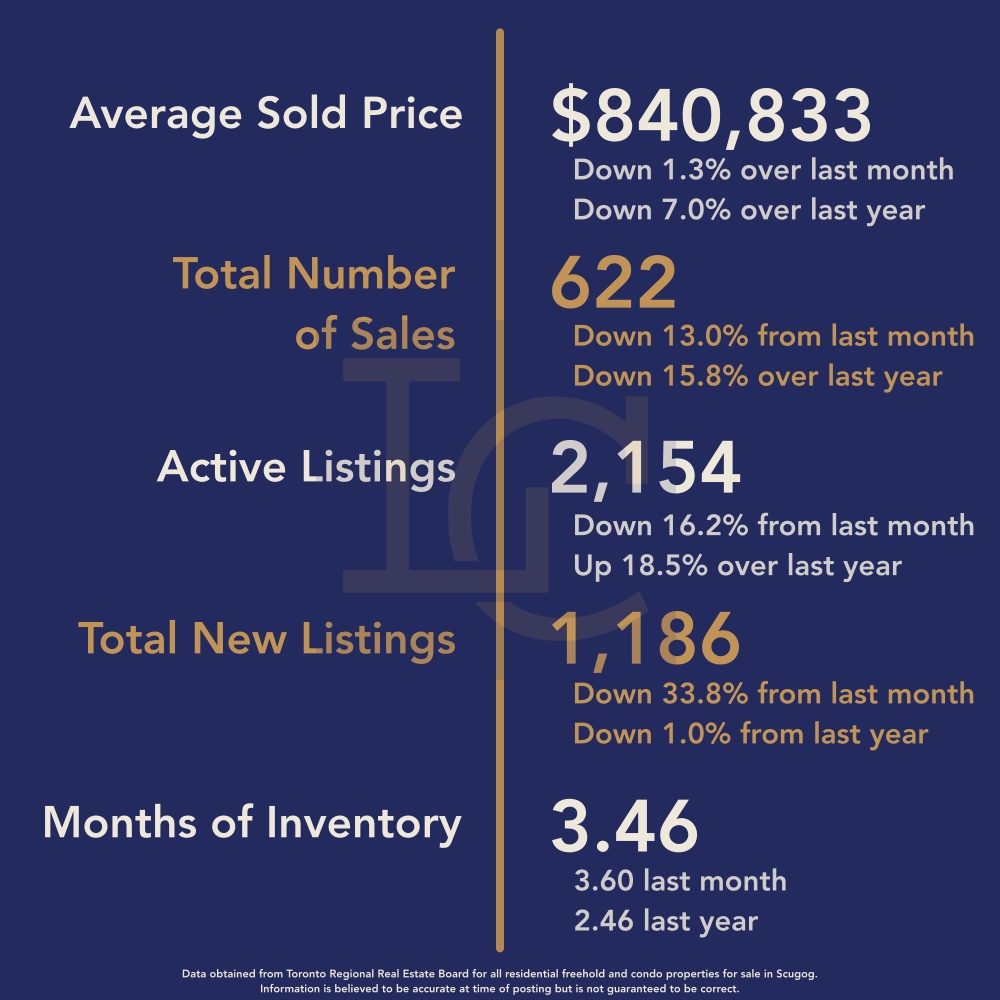
.
Average Sale Price Edges Up Month-Over-Month
The average sale price in December came in at $844,473, up 0.4% from November’s $840,833, though still 9.2% lower than December 2024’s $930,207.
This modest monthly increase suggests that prices may be beginning to stabilize, even as overall activity slows during the holiday season. With fewer transactions taking place, pricing tends to reflect only the most motivated buyers and sellers, which can help limit sharper swings.
.
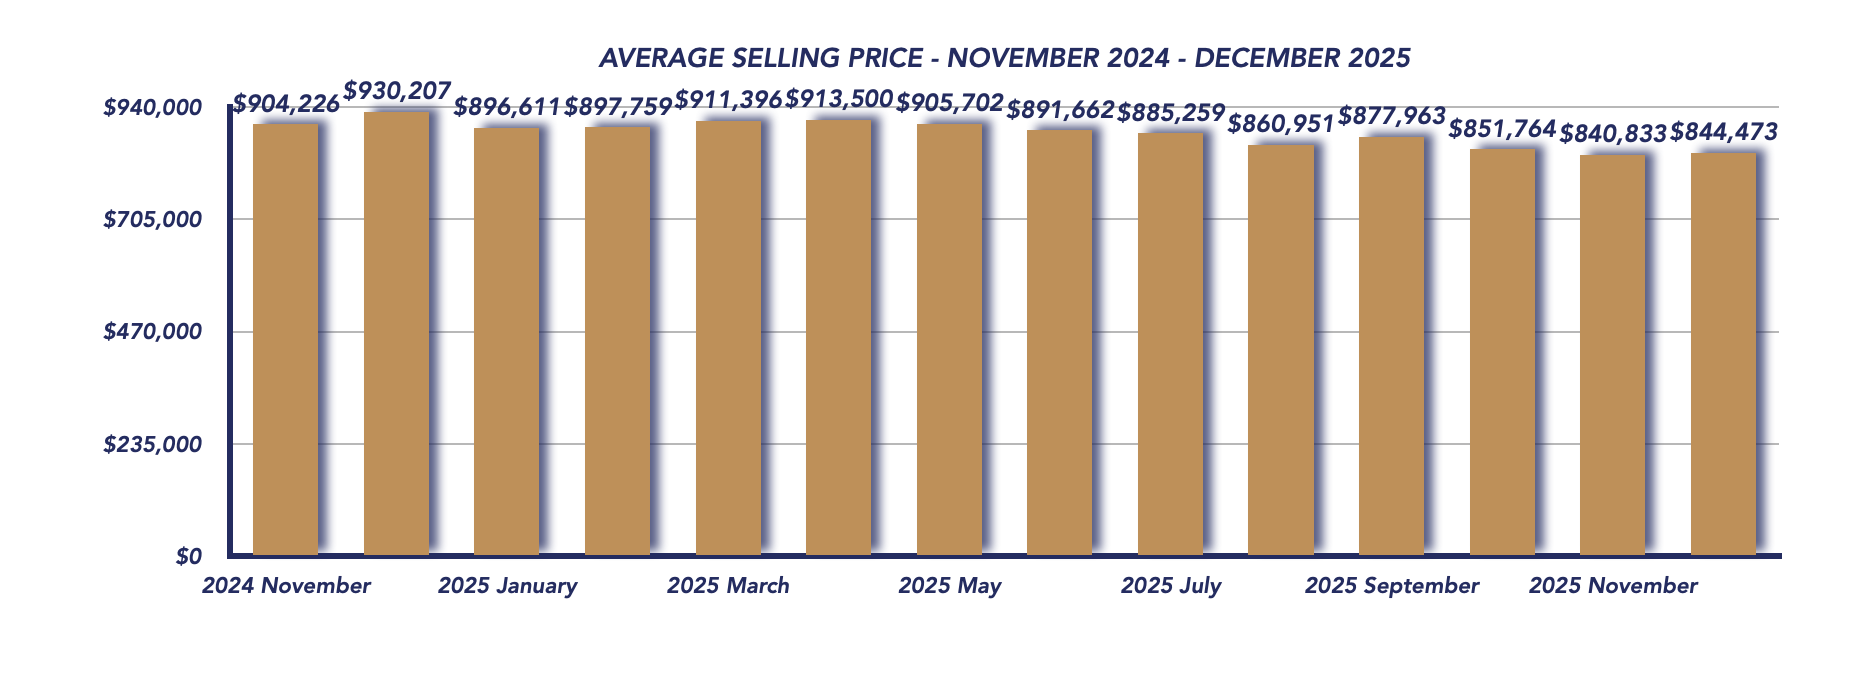
Sale-to-List Price Ratio Holds at 98%
The sale-to-list price ratio remained unchanged at 98%, consistent with November but down from 100% last year. This continues to signal a market where buyers have negotiating power, while sellers who price realistically can still achieve close-to-asking-price results.
Sales Slow Seasonally but Improve Year-Over-Year
Durham recorded 455 sales in December, down from 622 in November, in line with the typical holiday slowdown. Notably, sales were higher than December 2024’s 404 transactions, pointing to underlying demand that may carry into the new year once seasonal constraints ease.
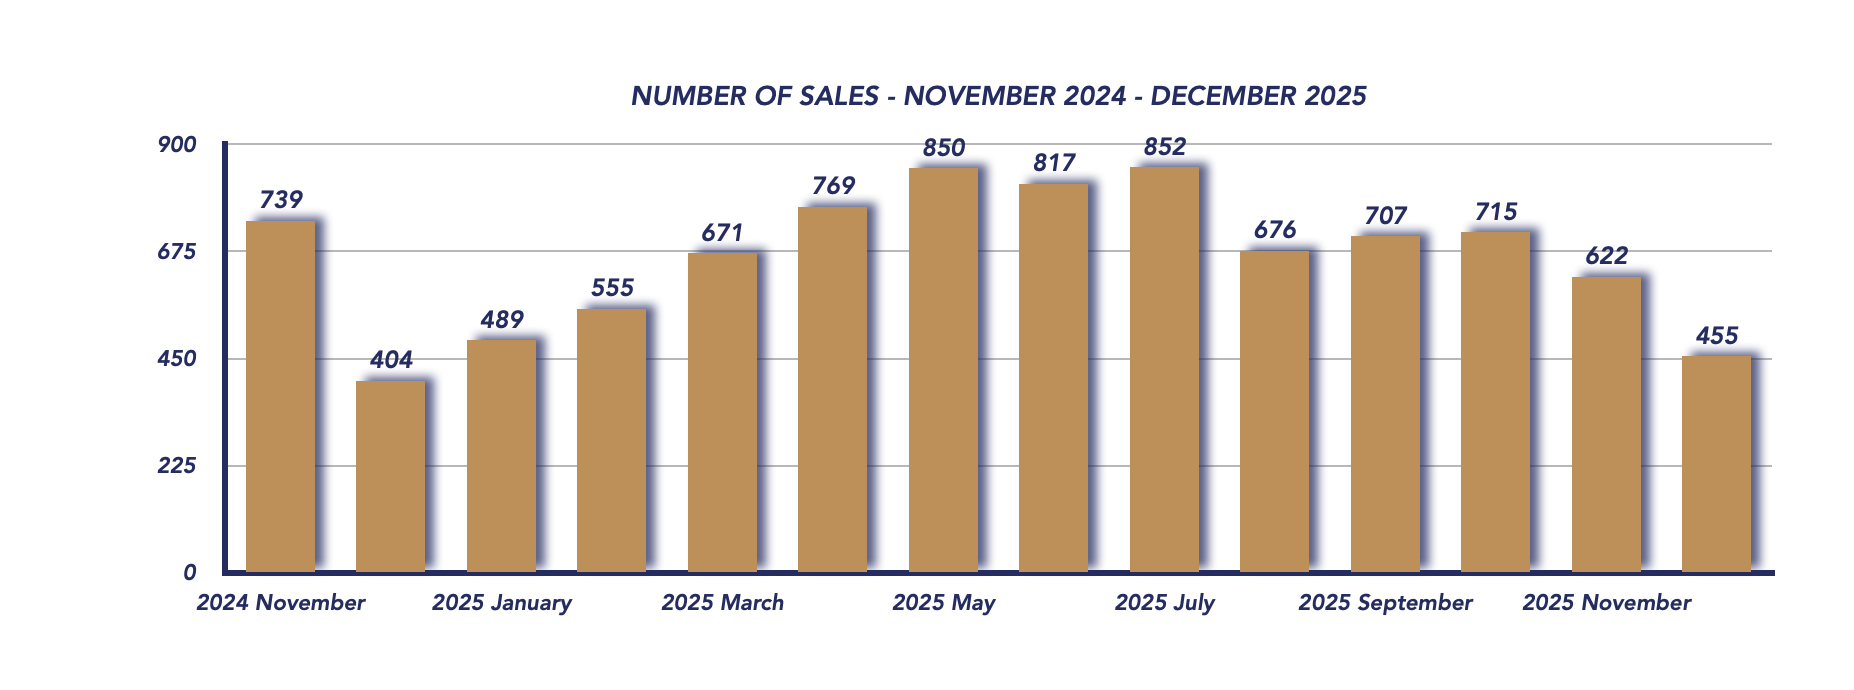
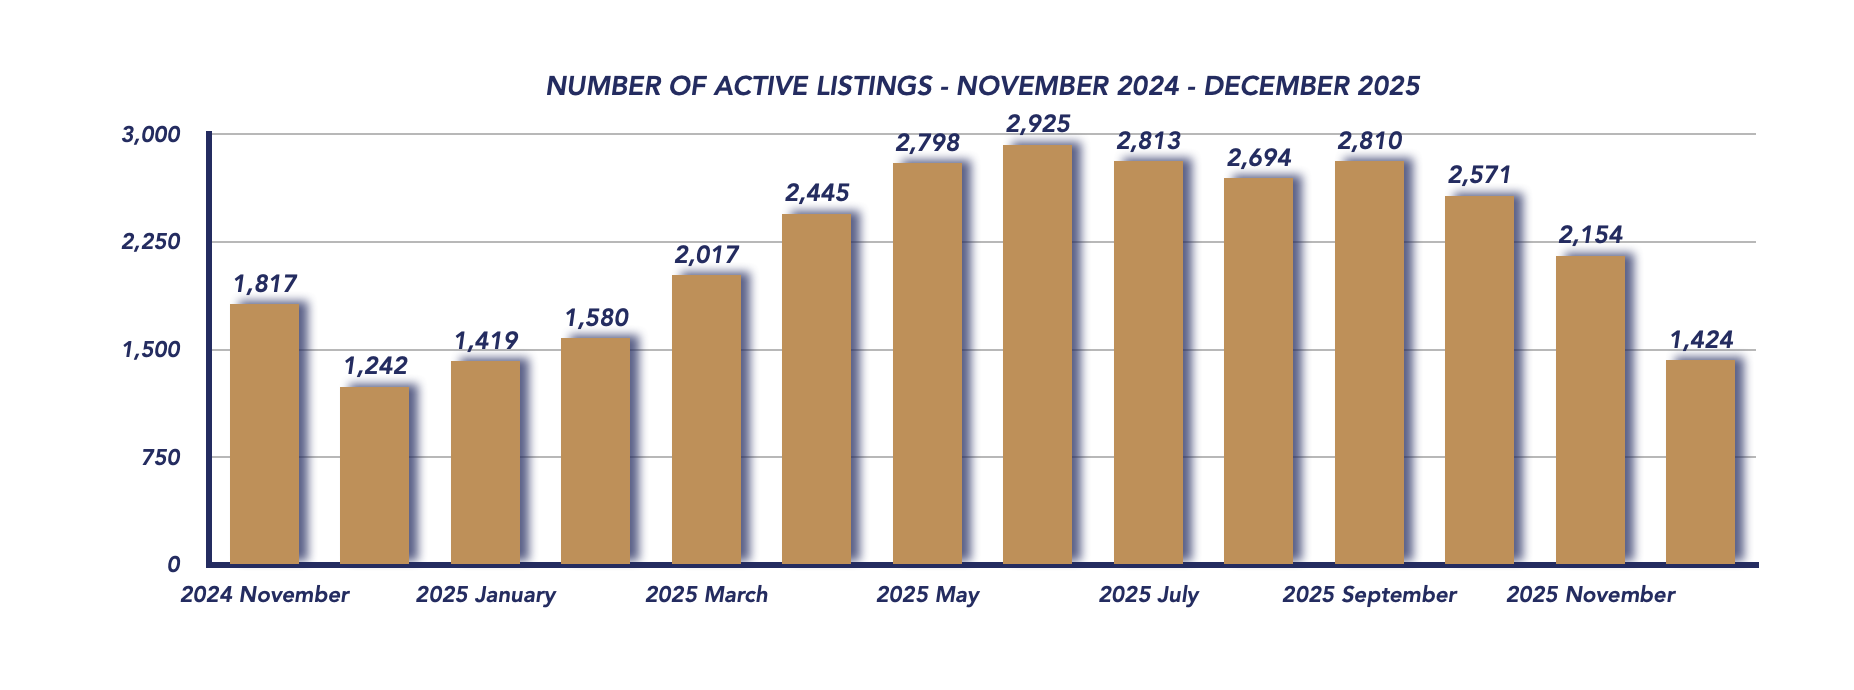
New Listings Pull Back Sharply
New listings dropped to 529, down significantly from 1,186 in November, and slightly above 486 listings last December. This sharp decline reflects many sellers opting to wait for the spring market, which helped prevent inventory from building excessively at year-end.
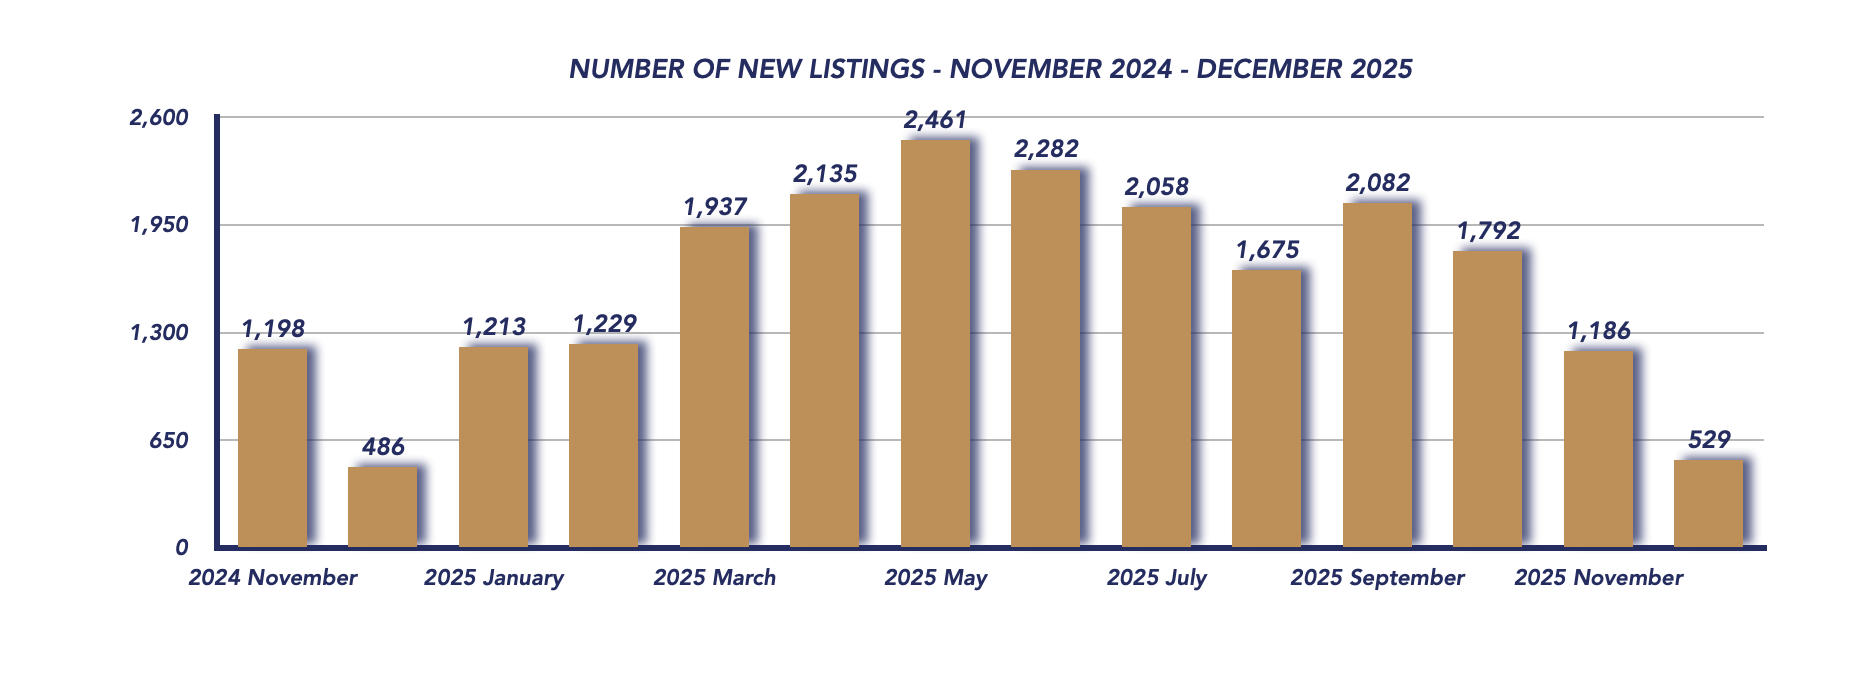
Homes Take Longer to Sell as Inventory Tightens
The average days on market rose to 60 days, up from 51 in November, showing buyers are taking more time to make decisions. Despite slower sales, months of inventory dipped to 3.13, down from 3.46, keeping Durham just inside balanced market territory.
The tightening in inventory is largely the result of fewer new listings rather than an increase in buyer activity.
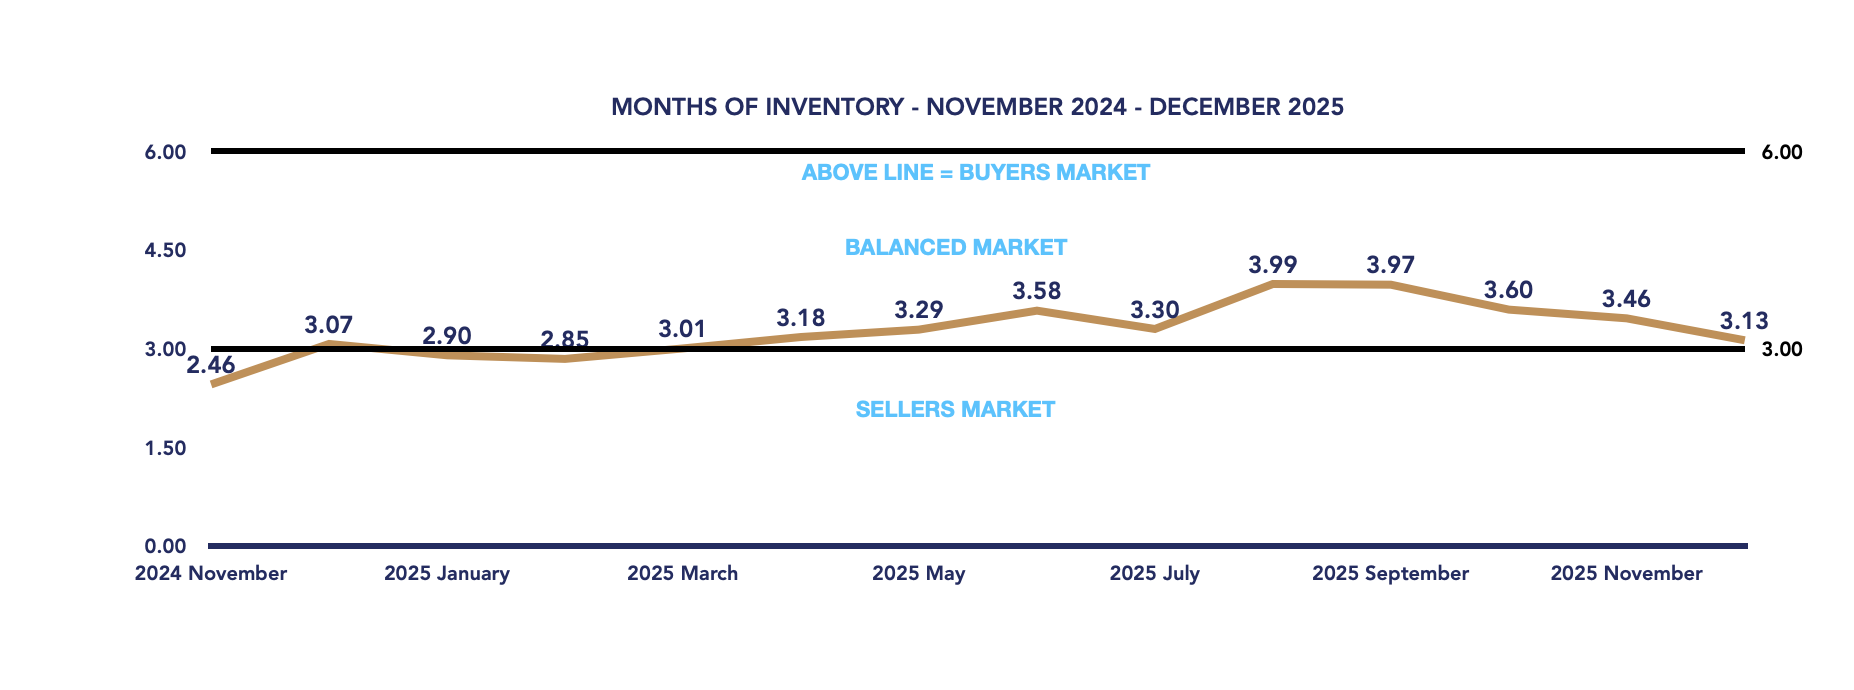
Conclusion
December 2025 closed out the year with predictable seasonal softness, but without signs of instability. Prices edged slightly higher month-over-month, inventory tightened, and year-over-year sales improved modestly.
As Durham Region heads into 2026, the market appears to be resetting rather than retreating. Buyers may continue to benefit from balanced conditions and negotiation opportunities, while sellers who prepare early and price strategically could be well-positioned as activity begins to build in the months ahead.
Year-End Summary (December 2025)
As 2025 comes to a close, the Durham Region real estate market has clearly transitioned into a more balanced and sustainable environment. While prices finished the year lower than 2024, month-over-month stability, tightening inventory, and a modest improvement in year-over-year December sales suggest that the market is resetting rather than declining. Buyers and sellers alike are entering 2026 with more predictable conditions, realistic pricing expectations, and renewed focus on strategy over urgency.
Key Performance Indicators (KPIs) from January 2024 through December 2025 provide a clear snapshot of how the Durham Region real estate market has evolved across all property types, architectural styles, and home configurations
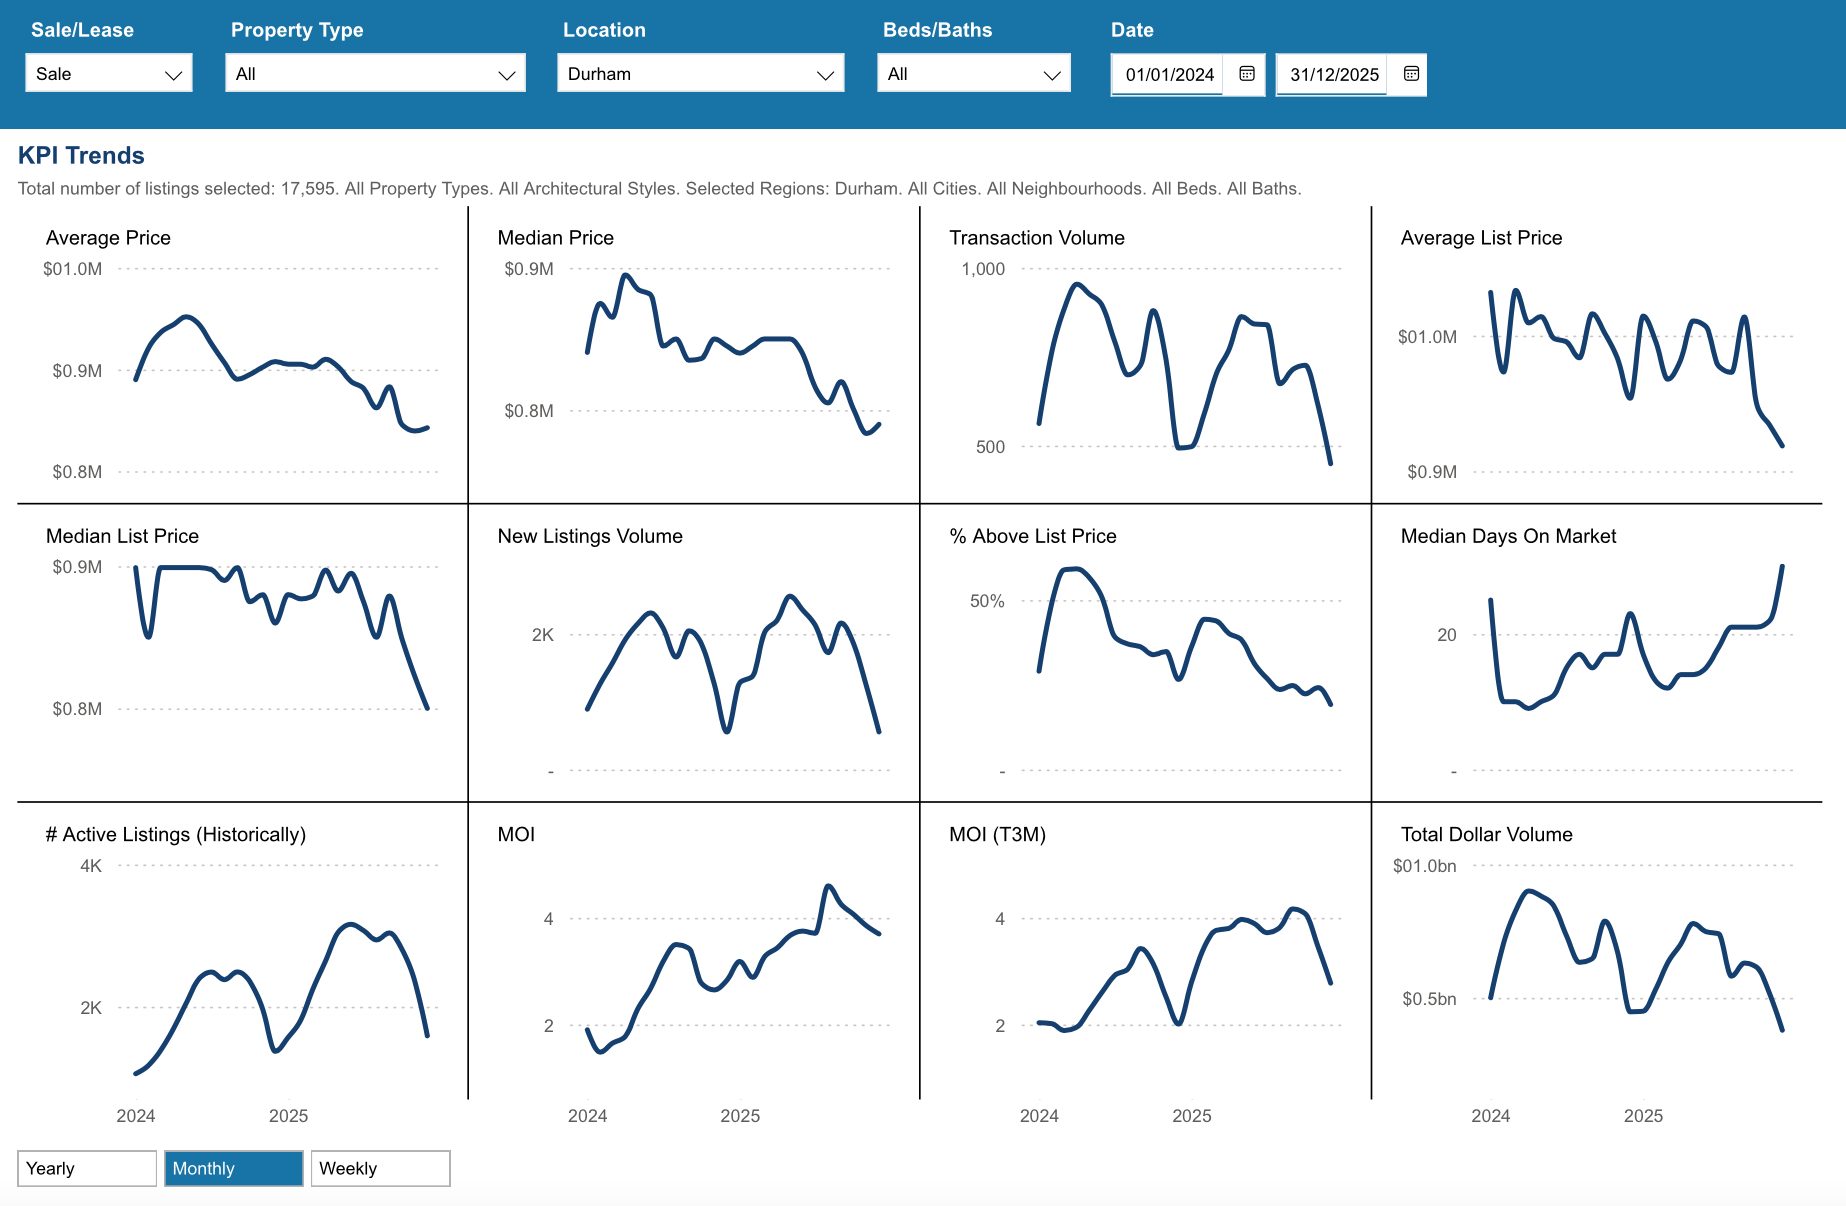
*Information is believed to be accurate at time of posting but is not guaranteed to be correct. Some values may vary slightly based on the exact date and time the reports were generated. Market stats are provided by TRREB (Toronto Regional Real Estate Board) and are based on sales for the month of Attached/Row/Townhouses, Condo Apartments, Condo Townhouses, Detached, Detached with Common Elements, Link Homes and Semi-detached. *Some values may vary slightly based on the exact date and time the reports were generated.
Not intended as a solicitation if your property is already listed by another broker. Affiliated real estate agents are independent contractor sales associates, not employees. ©2021 Coldwell Banker. All Rights Reserved. Coldwell Banker and the Coldwell Banker logos are trademarks of Coldwell Banker Real Estate LLC. The Coldwell Banker® System is comprised of company owned offices which are owned by a subsidiary of Realogy Brokerage Group LLC and franchised offices which are independently owned and operated. The Coldwell Banker System fully supports the principles of the Fair Housing Act and the Equal Opportunity Act.
Click below for more reports
Check out our Uxbridge and Scugog Events Pages to keep up to date on whats going on around town. Click the links or scan the Code with your phone to take you directly there.
UXBRIDGE EVENTS
SCUGOG EVENTS


