Facebook
 X
X
 Pinterest
 Copy Link
Durham Region Housing July 2024
![]()
![]()
Housing Market Report for July 2024
Here is the Region of Durham Housing July 2024 report (all housing types), with reports from the Canadian Real Estate Association, and Toronto Regional Real Estate Board included.
This housing report for Durham Region includes the number of new listings, average list price, number of properties sold, average selling price, average days on market and average asking price to selling price ratio for all property types within the Region of Durham.
Scroll to the bottom for links to take you to the housing market reports for Uxbridge, Scugog and Brock.
![]()
![]()
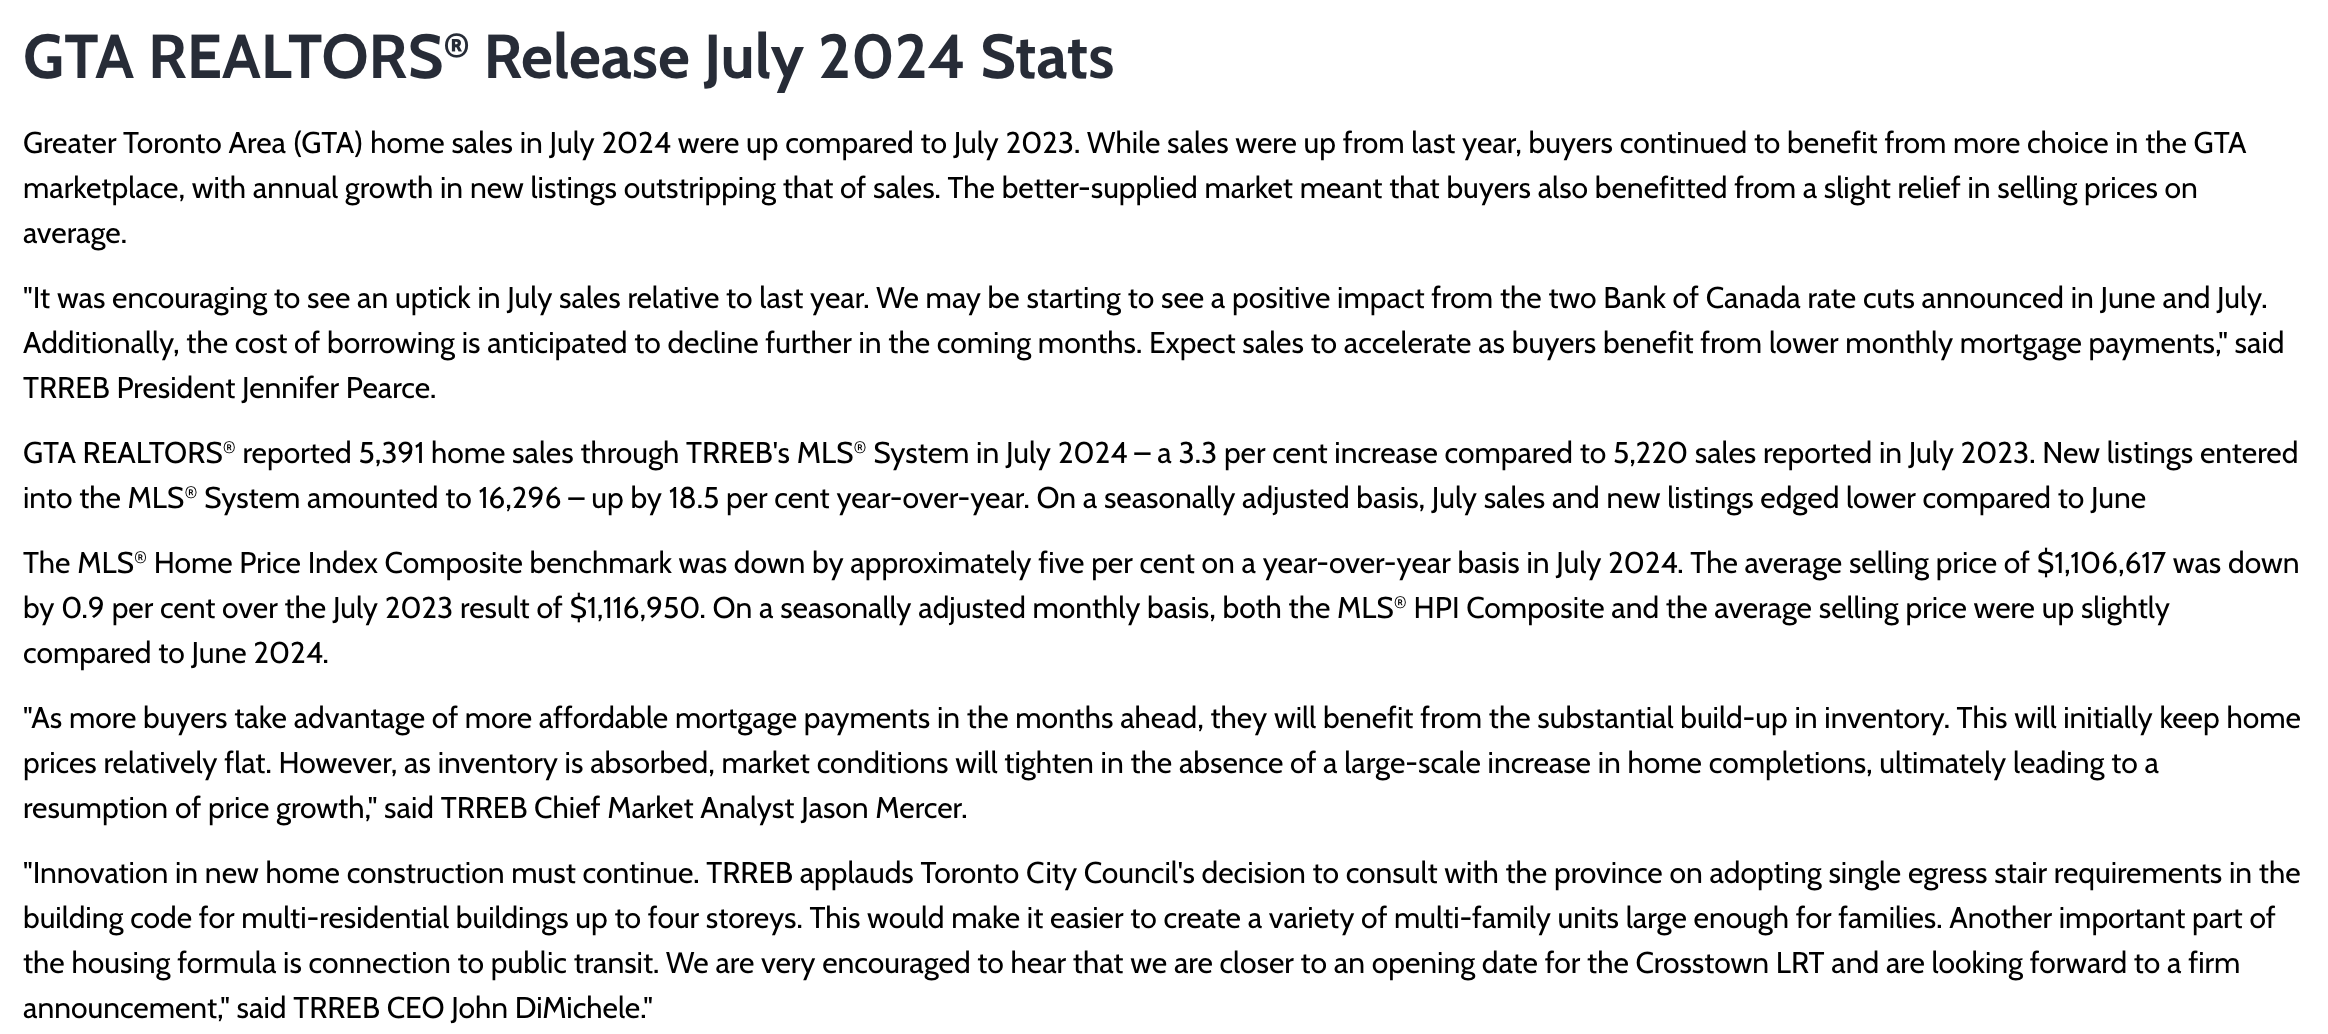
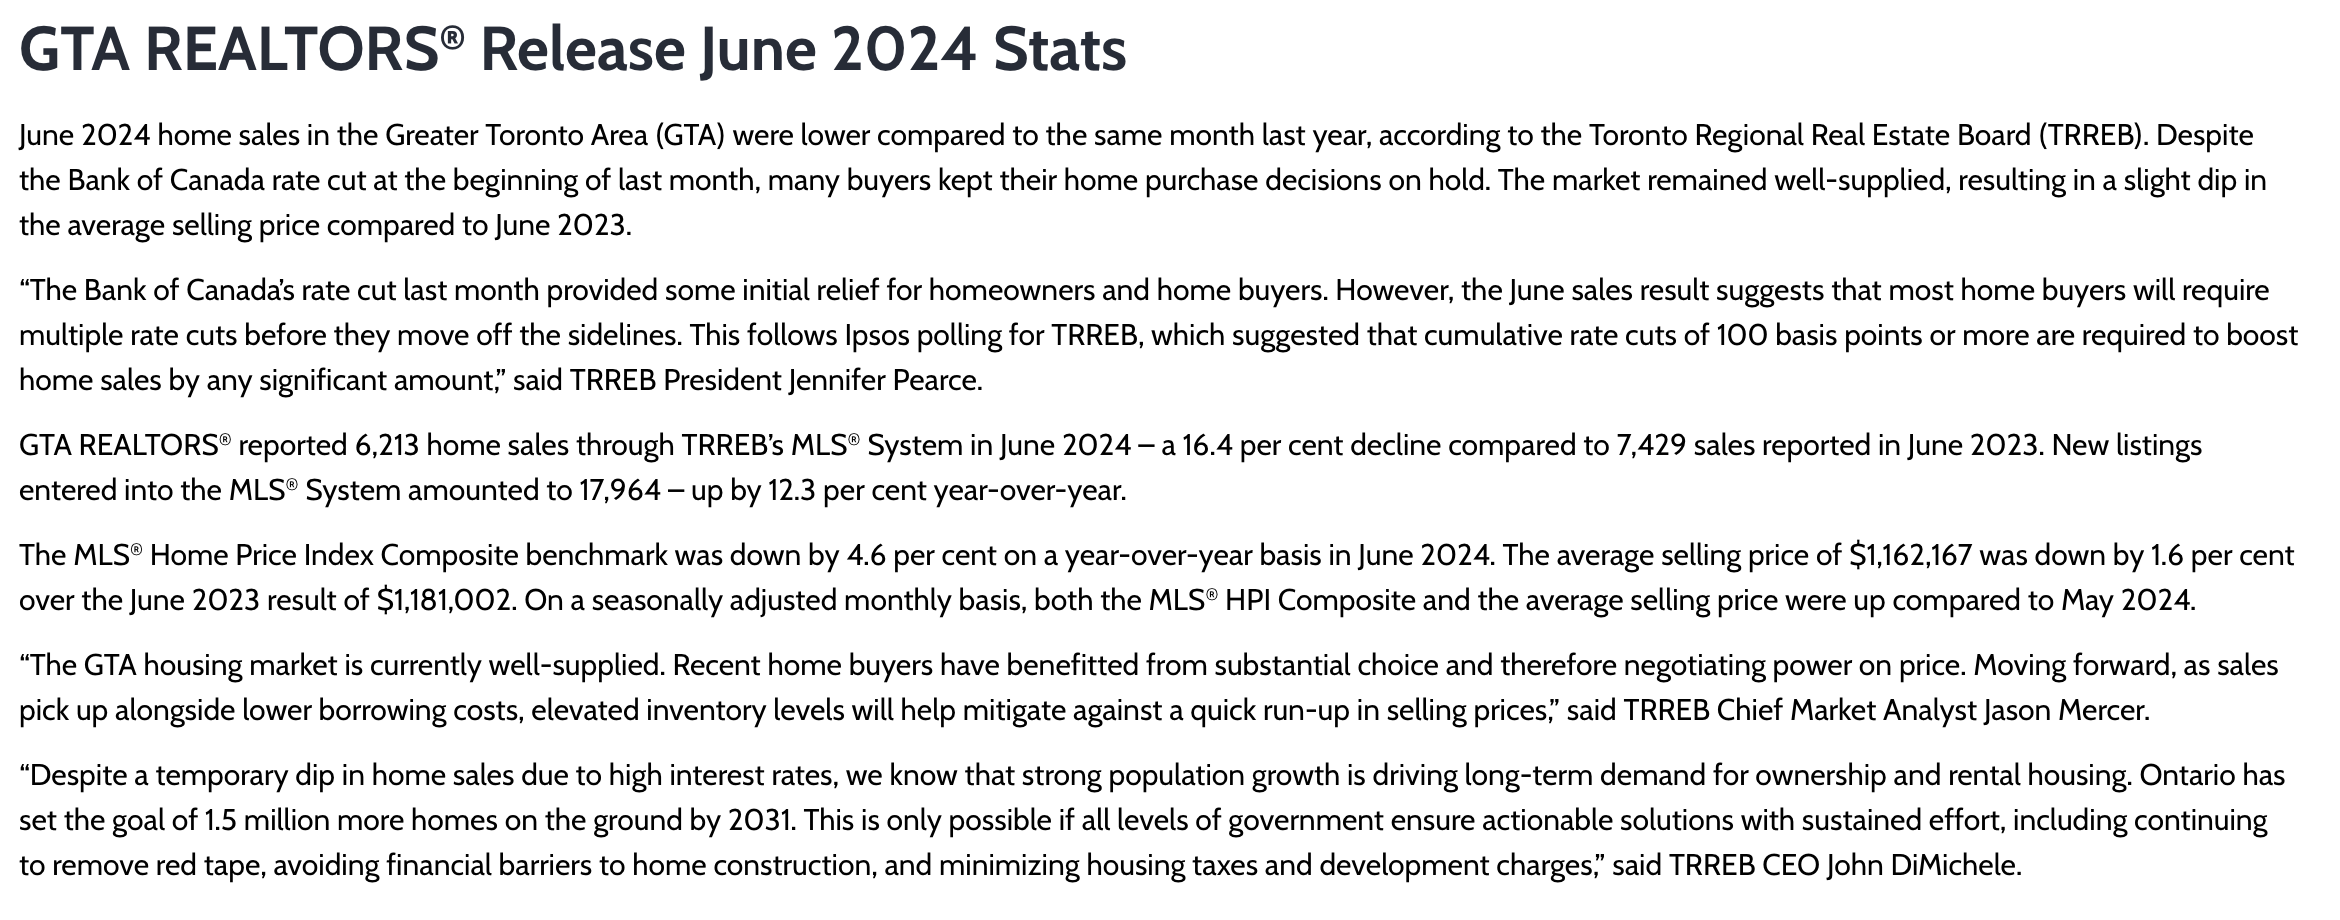
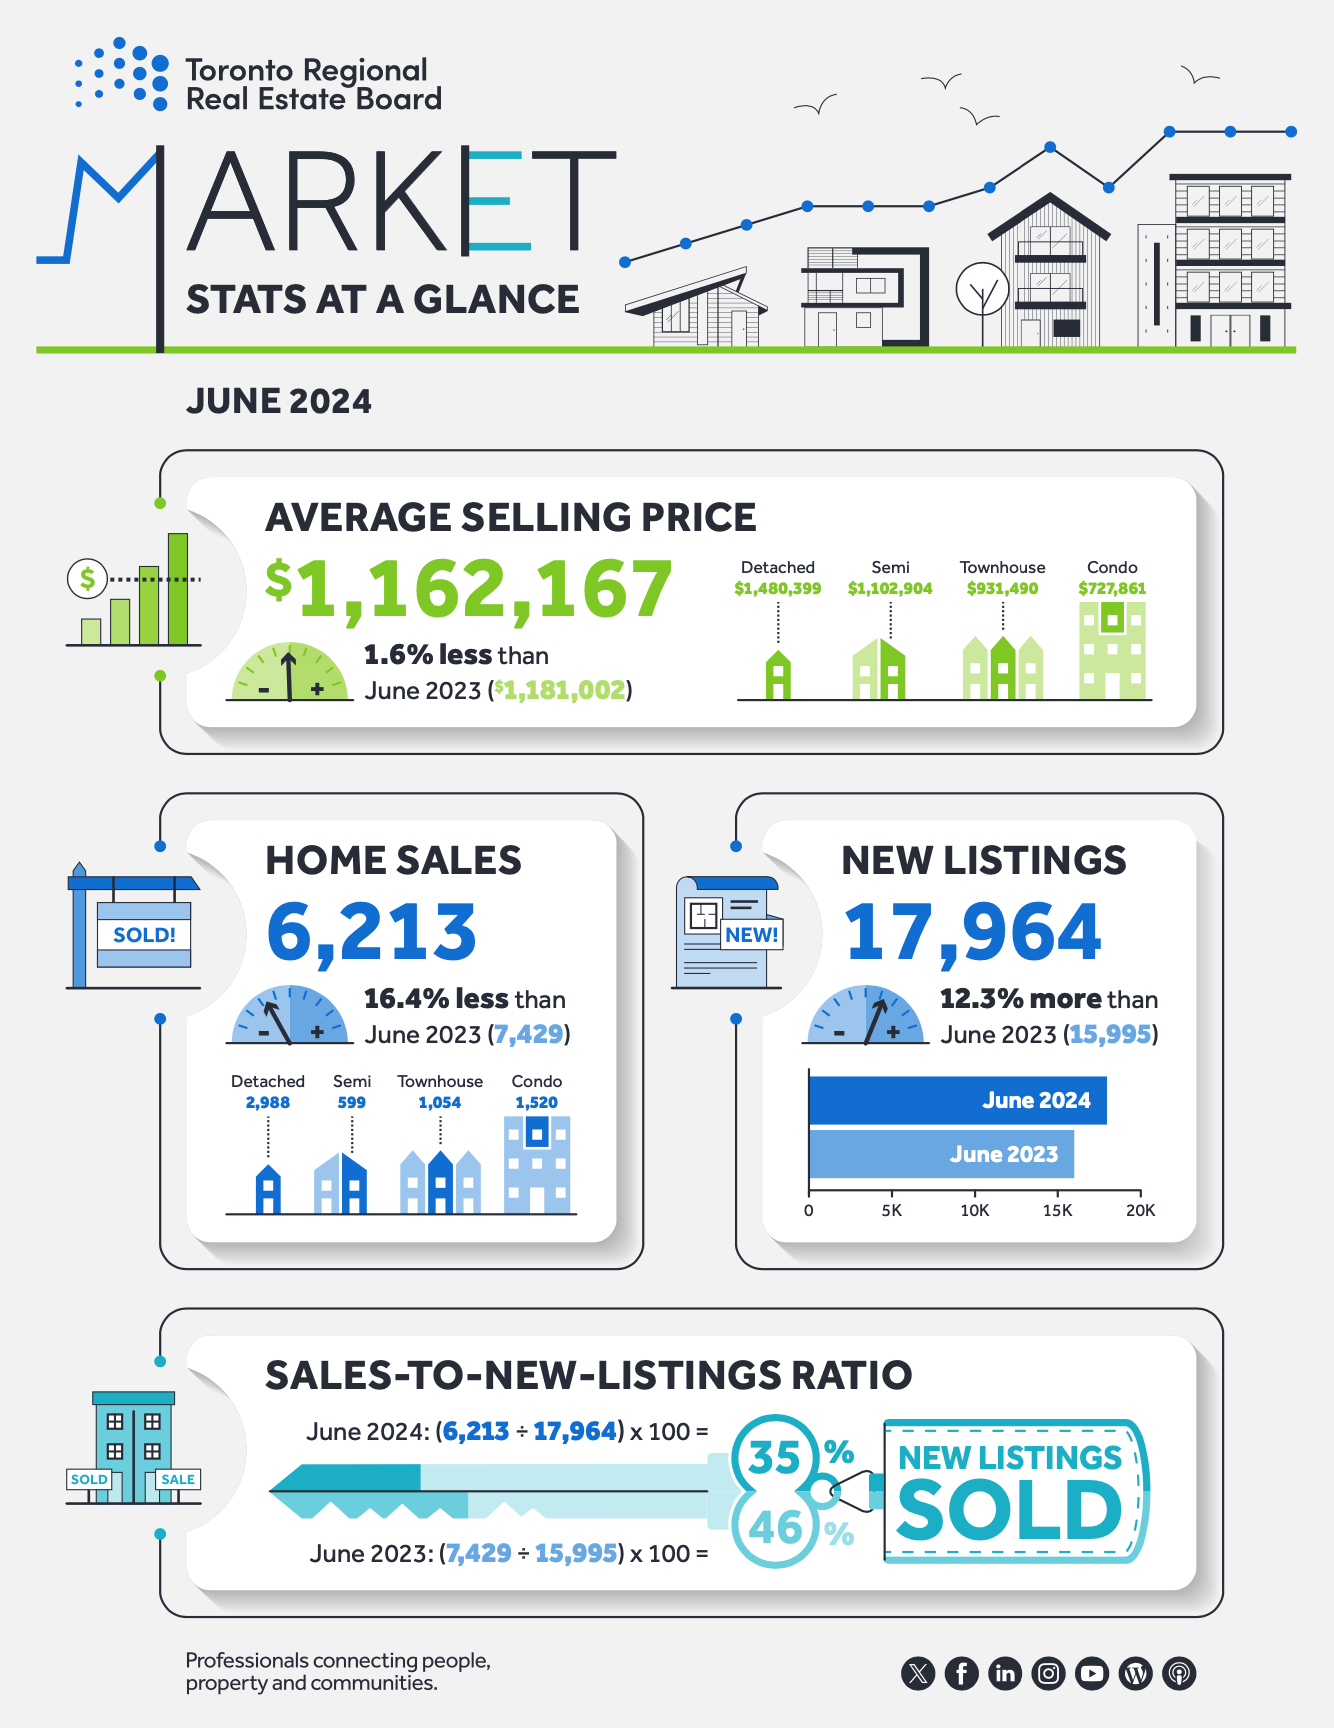
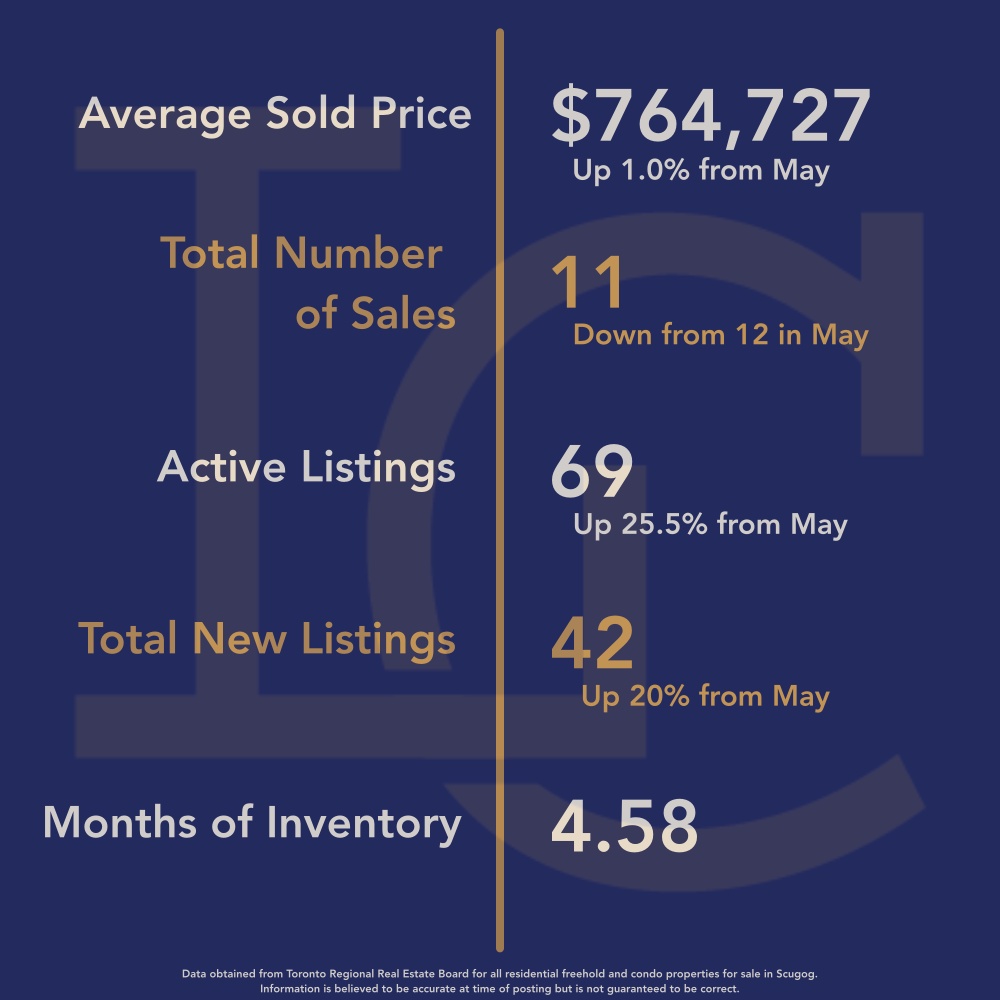
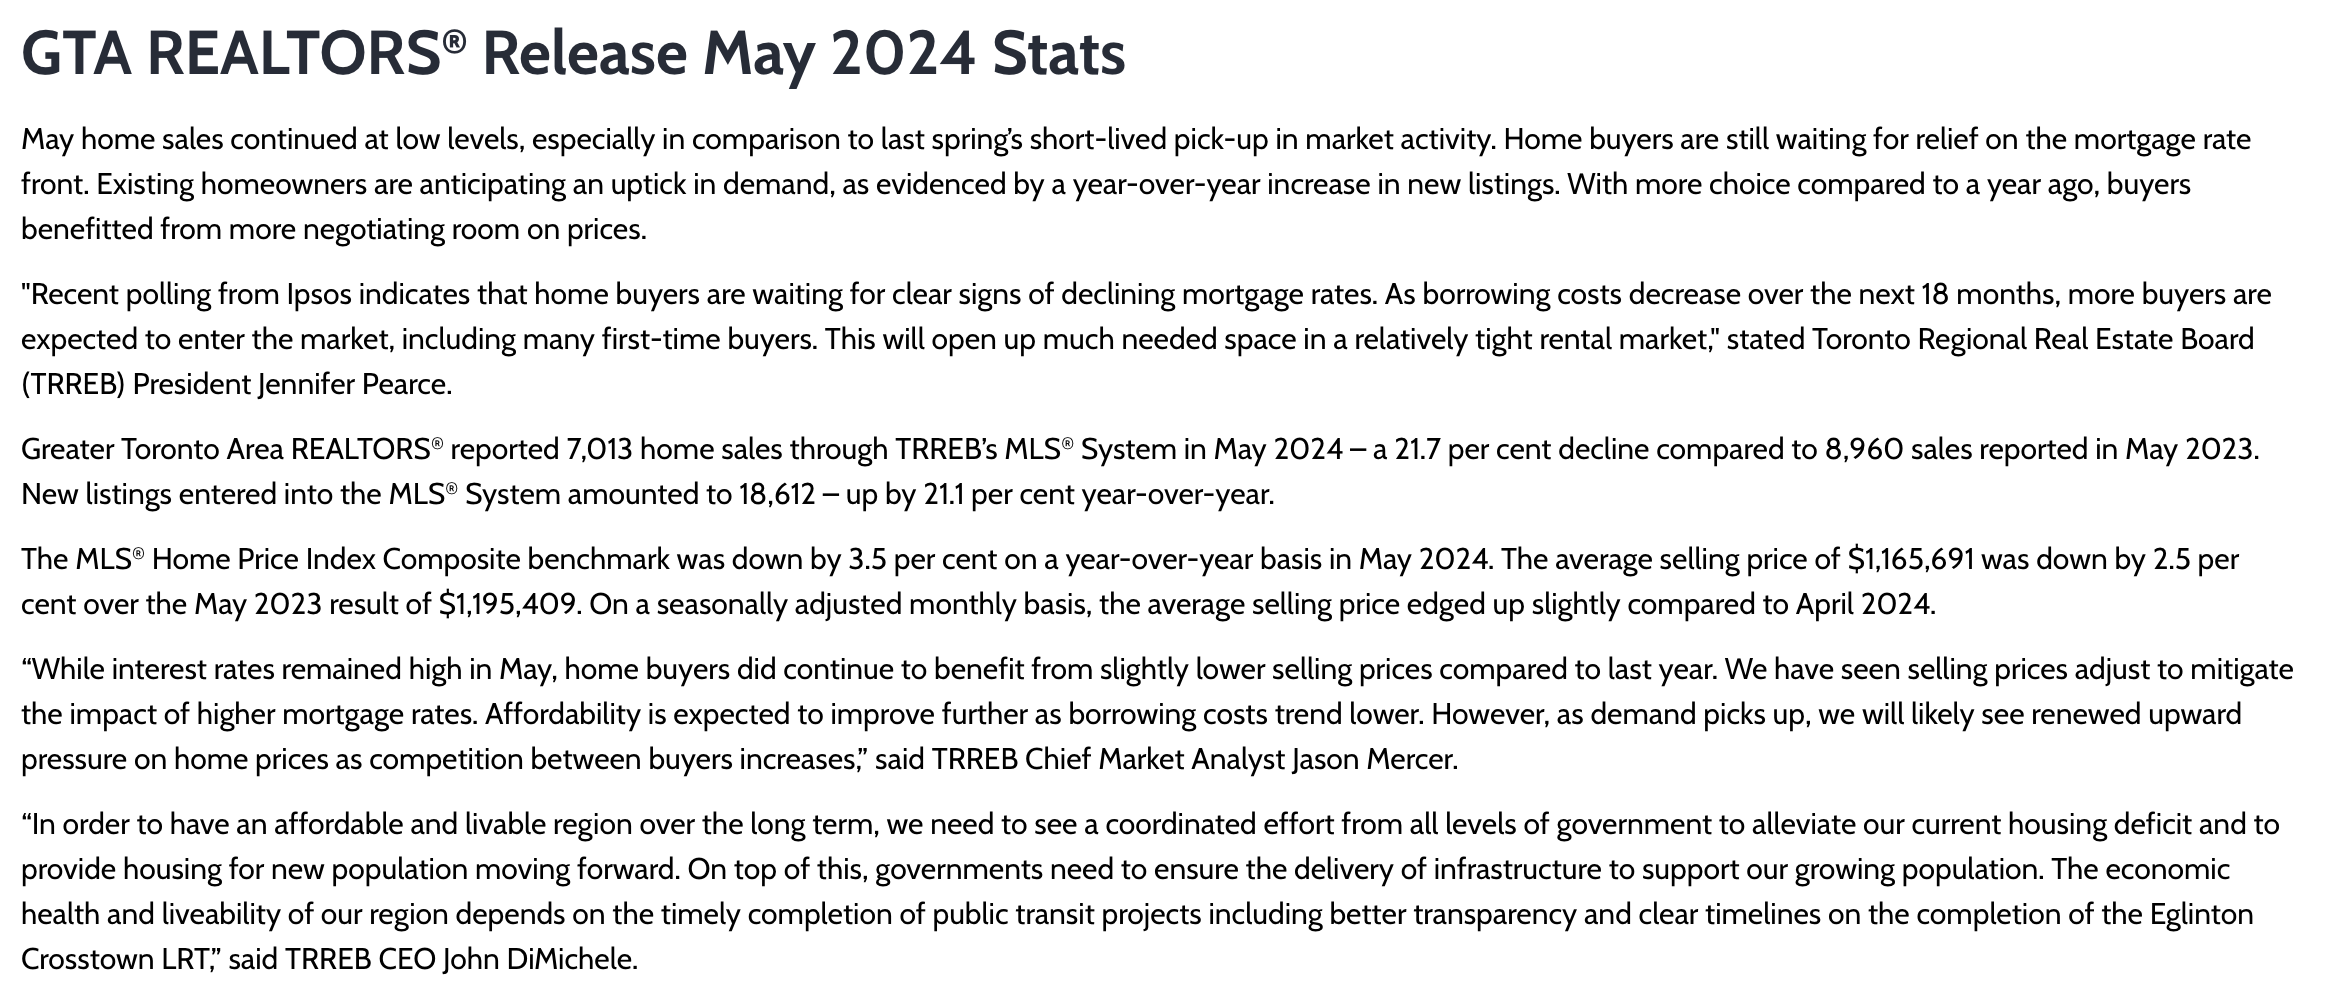
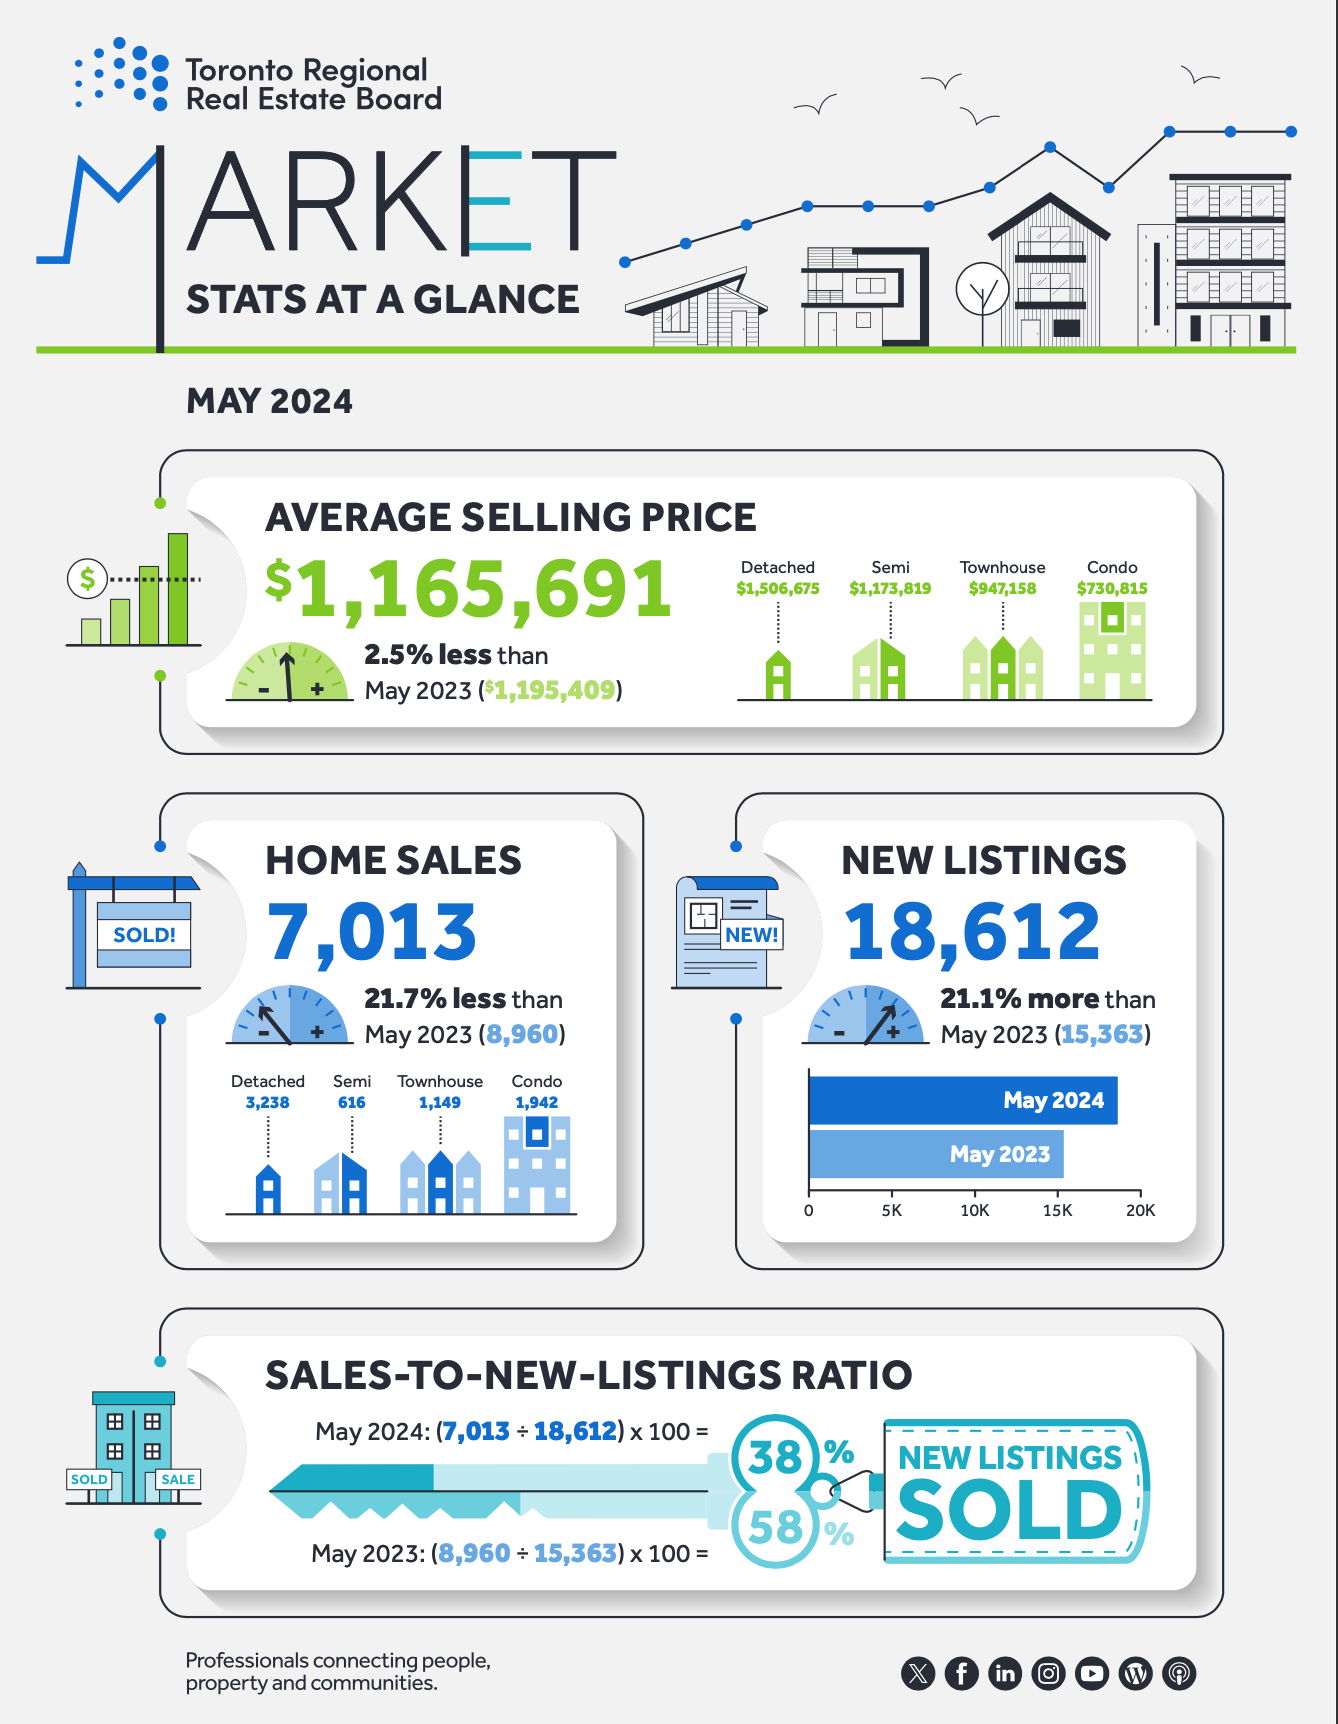
From Toronto Regional Real Estate Board
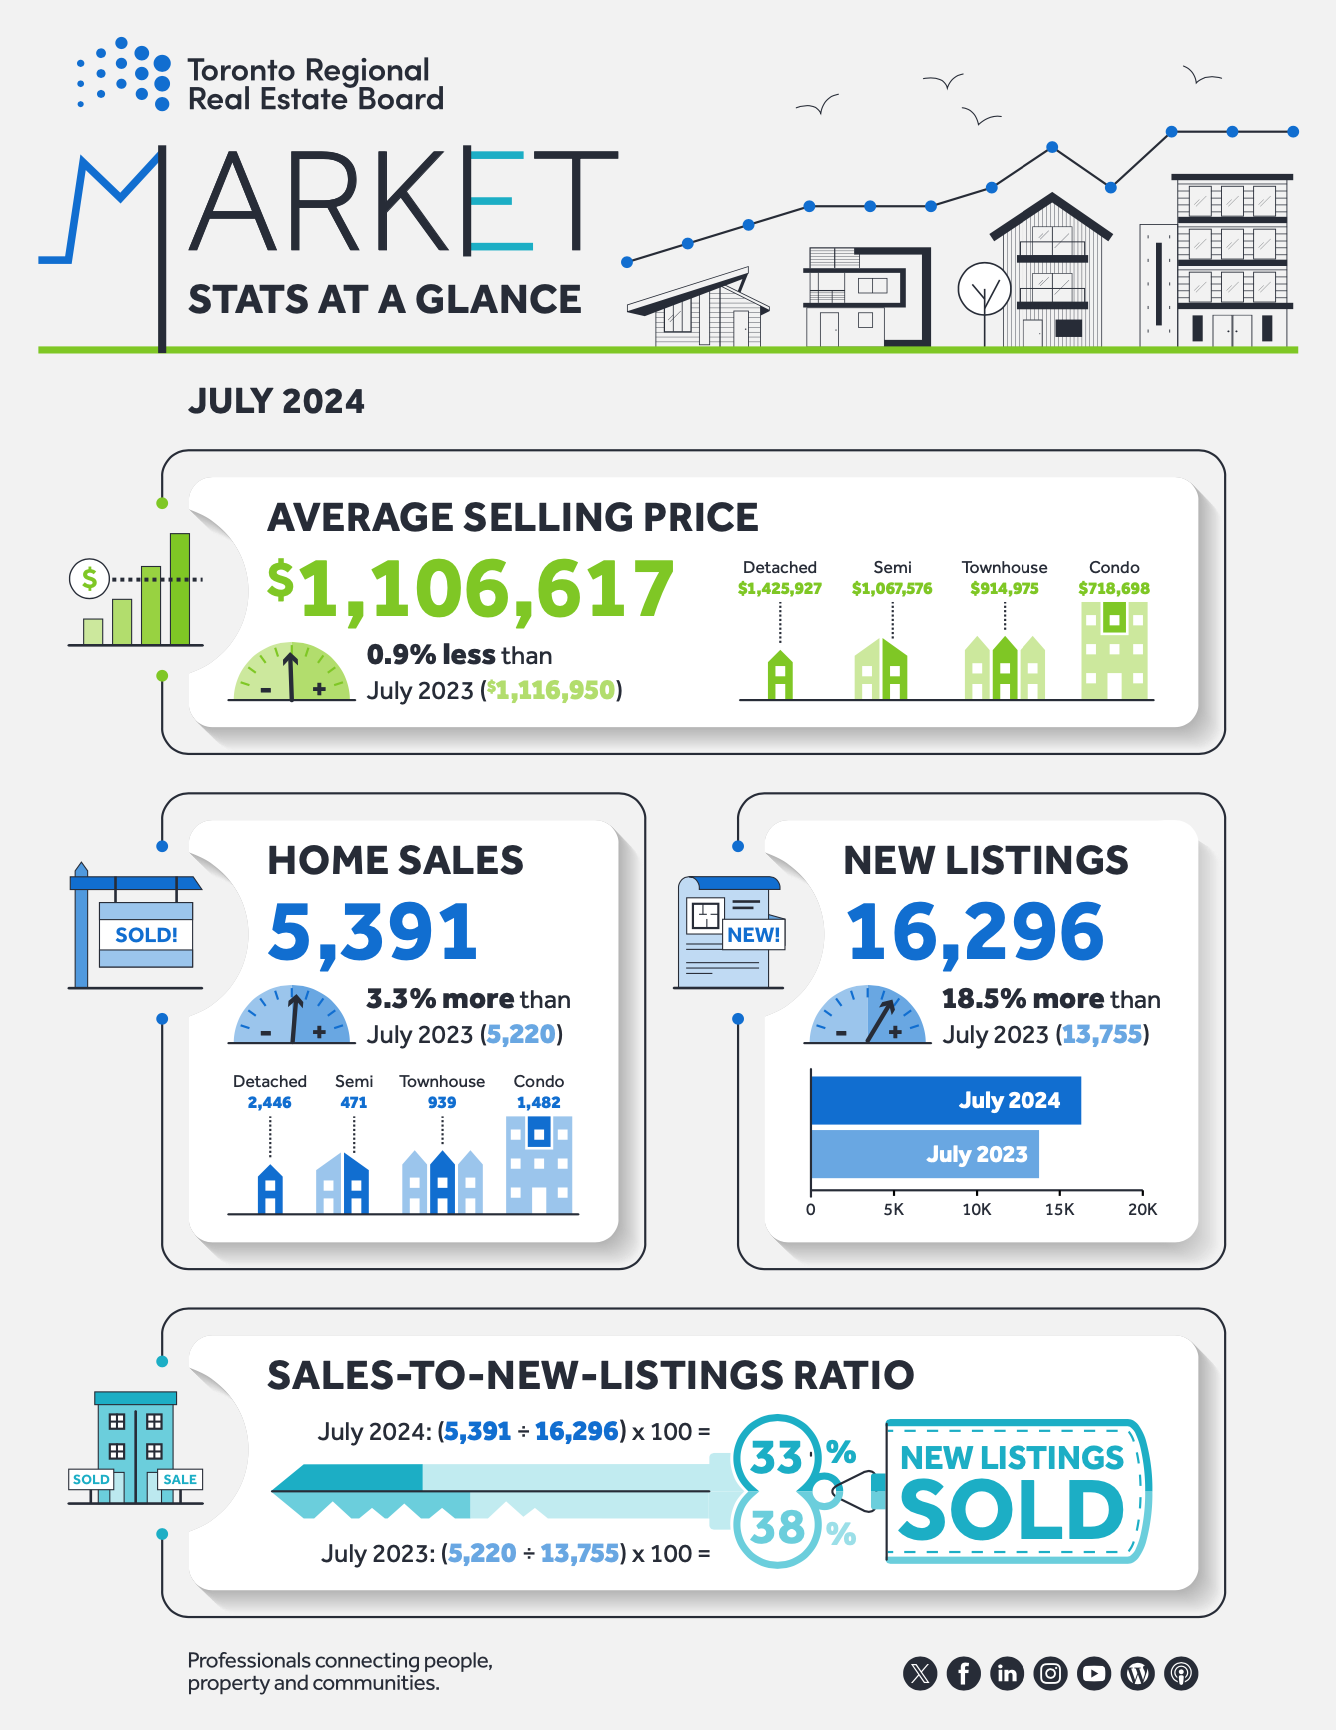
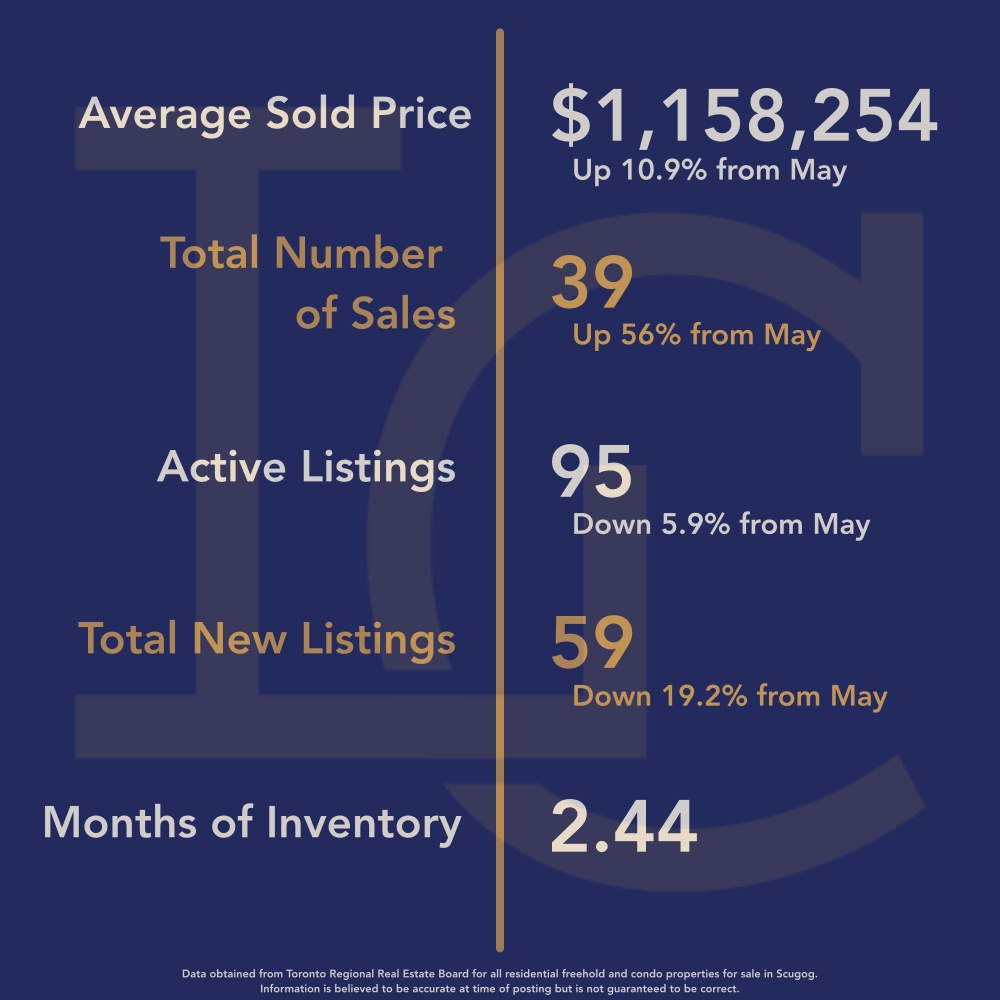
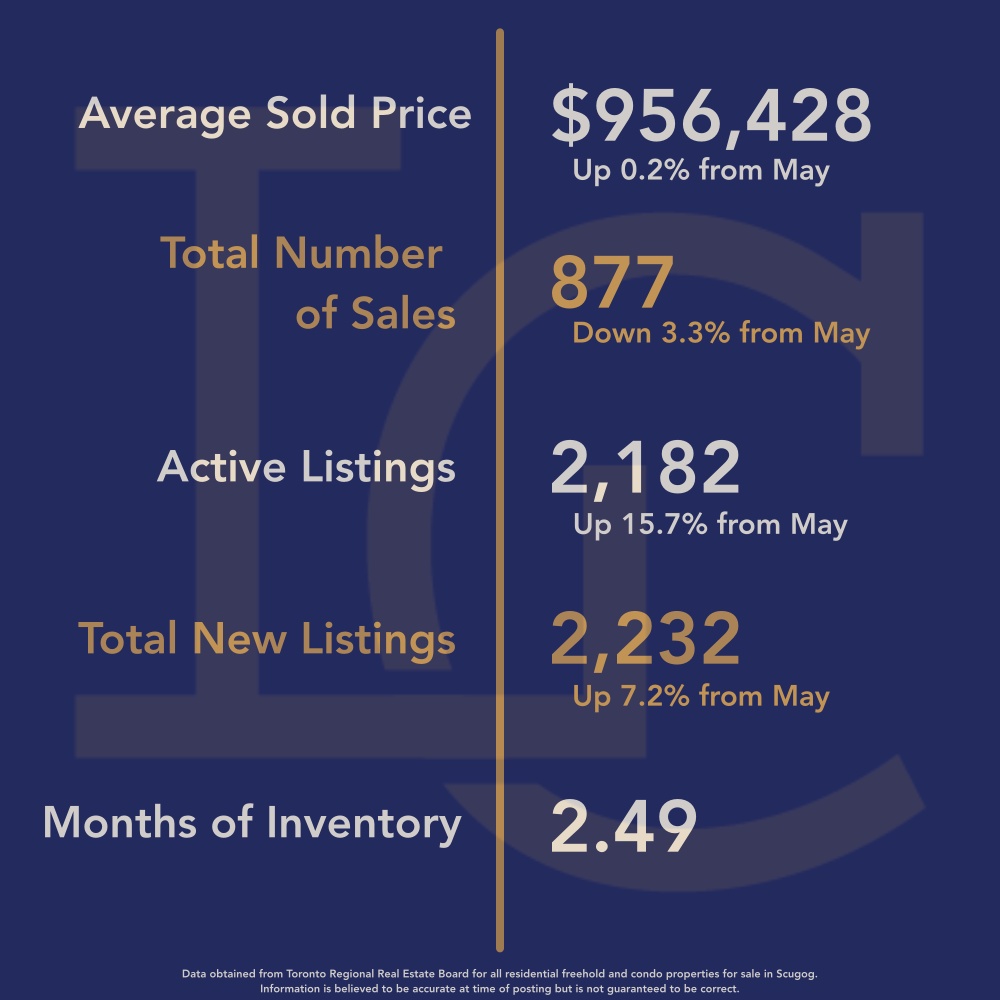
Toronto Regional Real Estate Board – Market Stats At A Glance – July 2024
Read the Toronto Regional Real Estate Board Market Watch Report
![]()
Durham Region Full Report
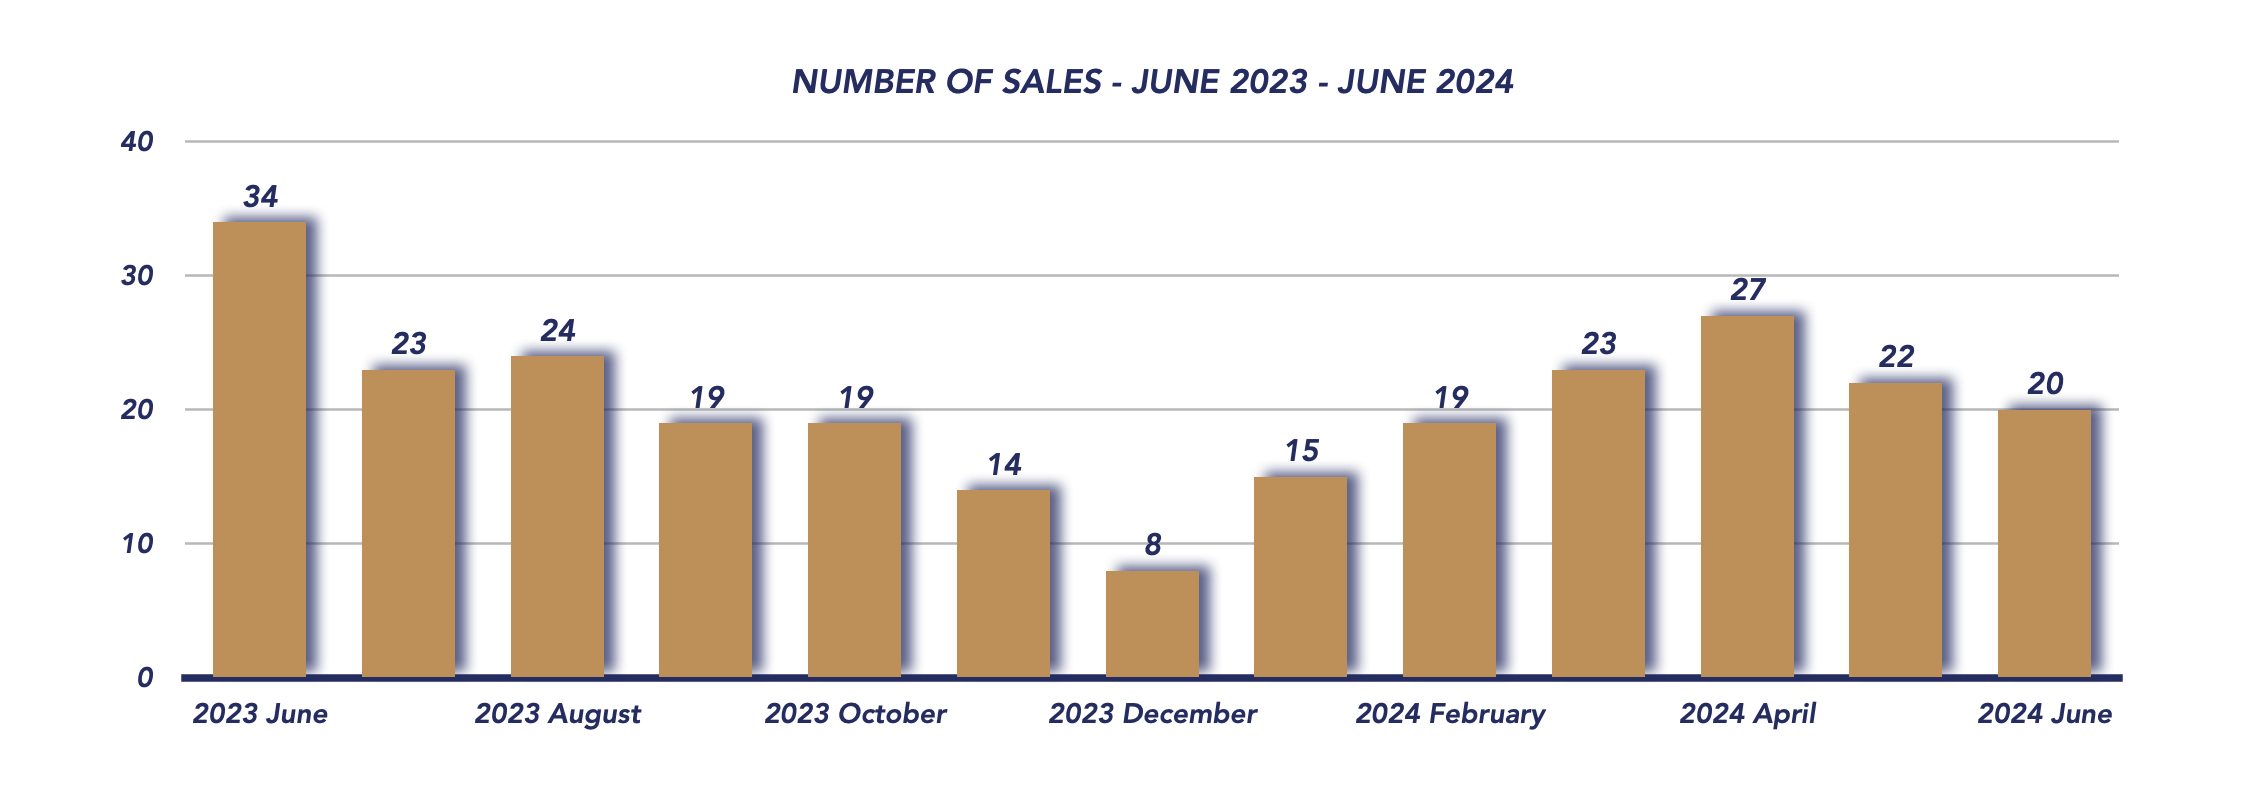
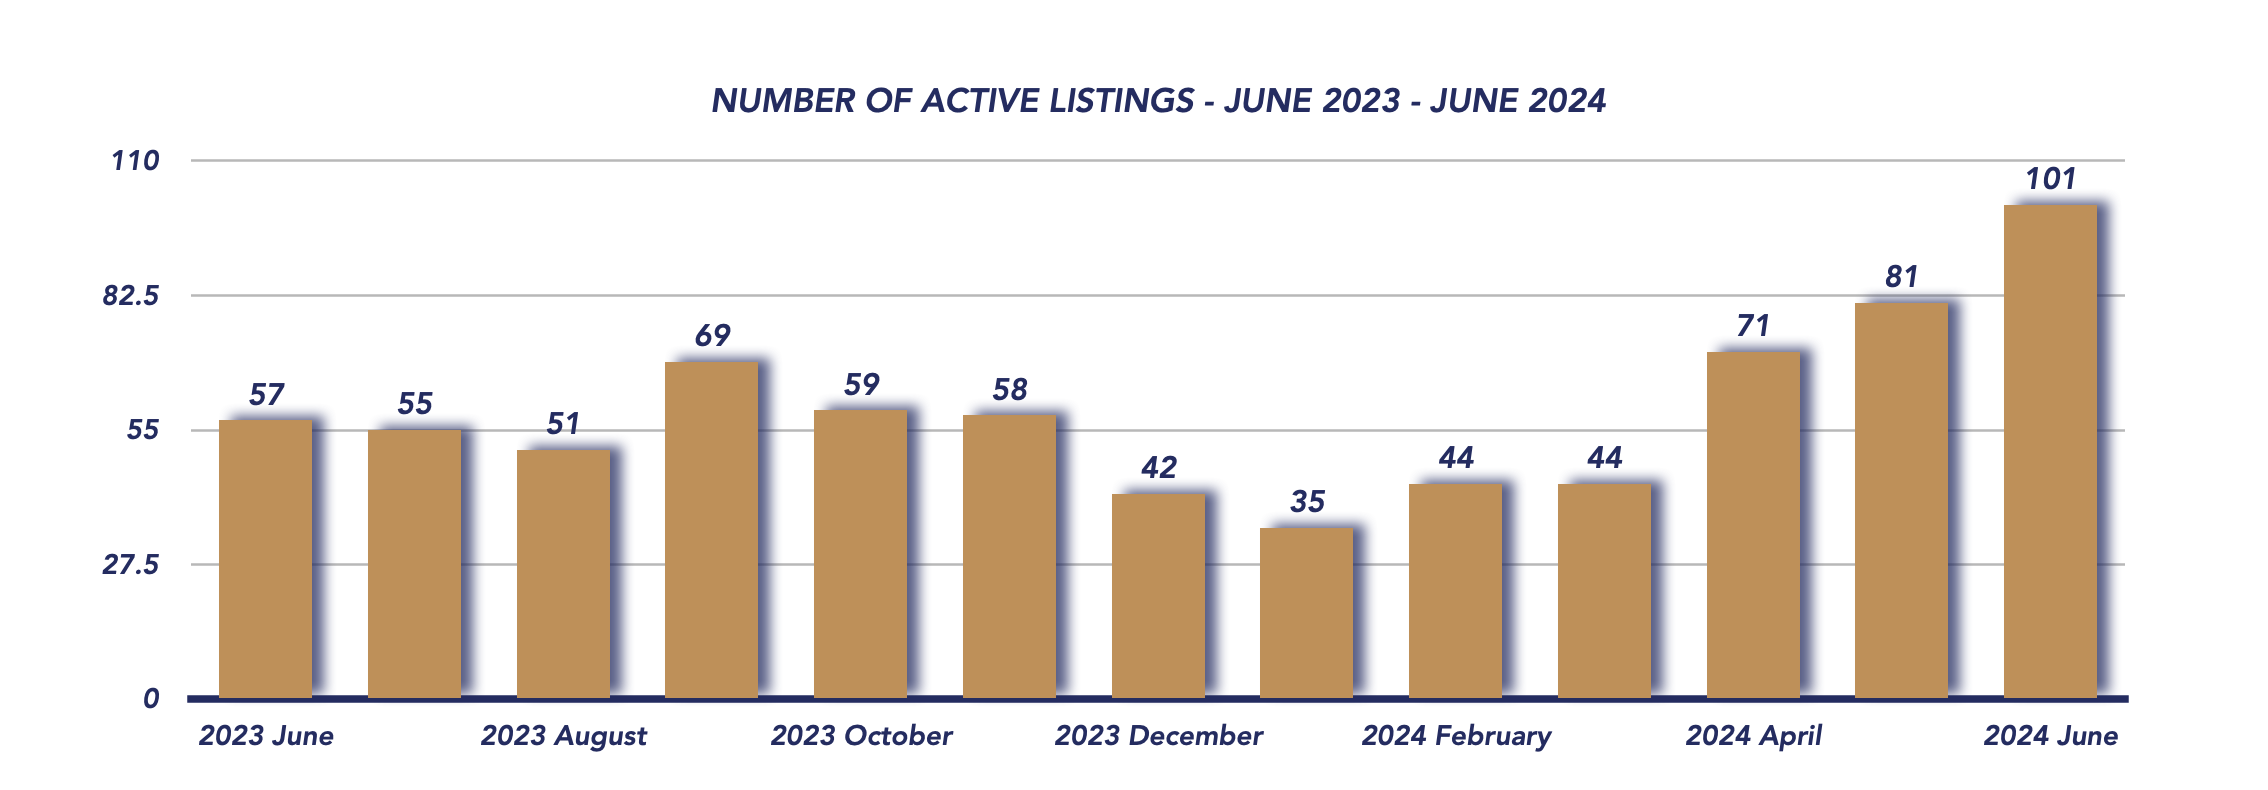
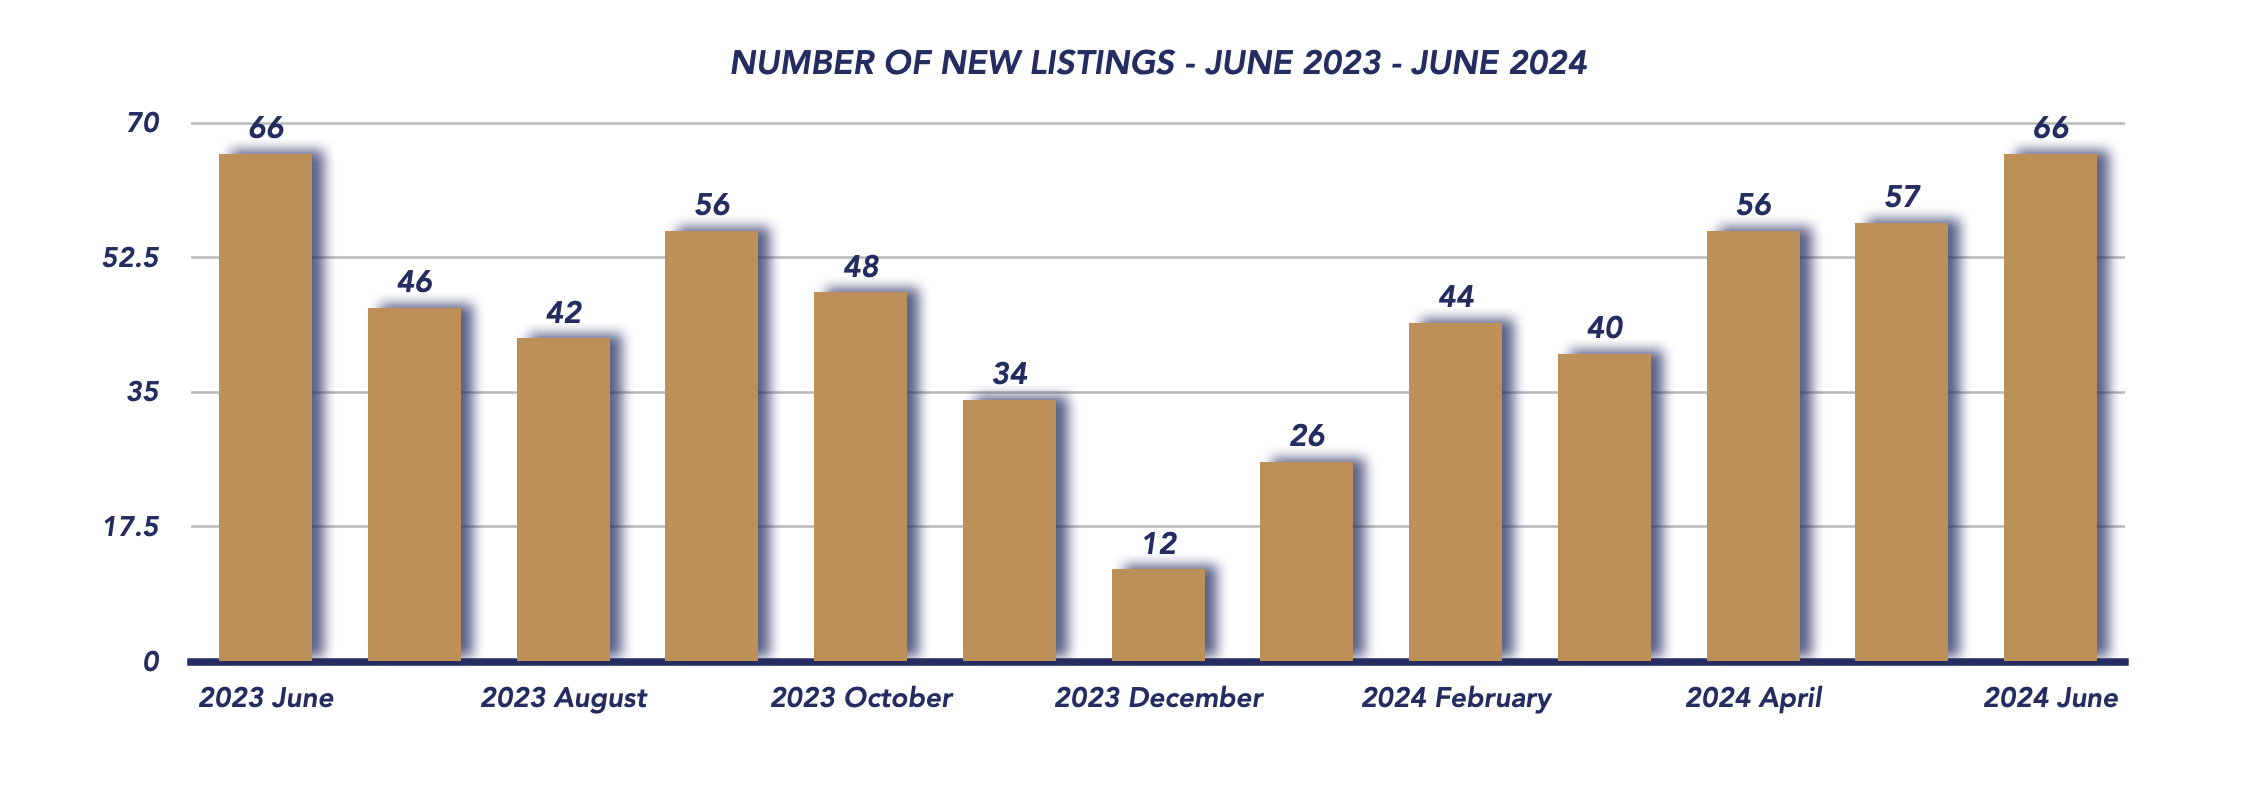
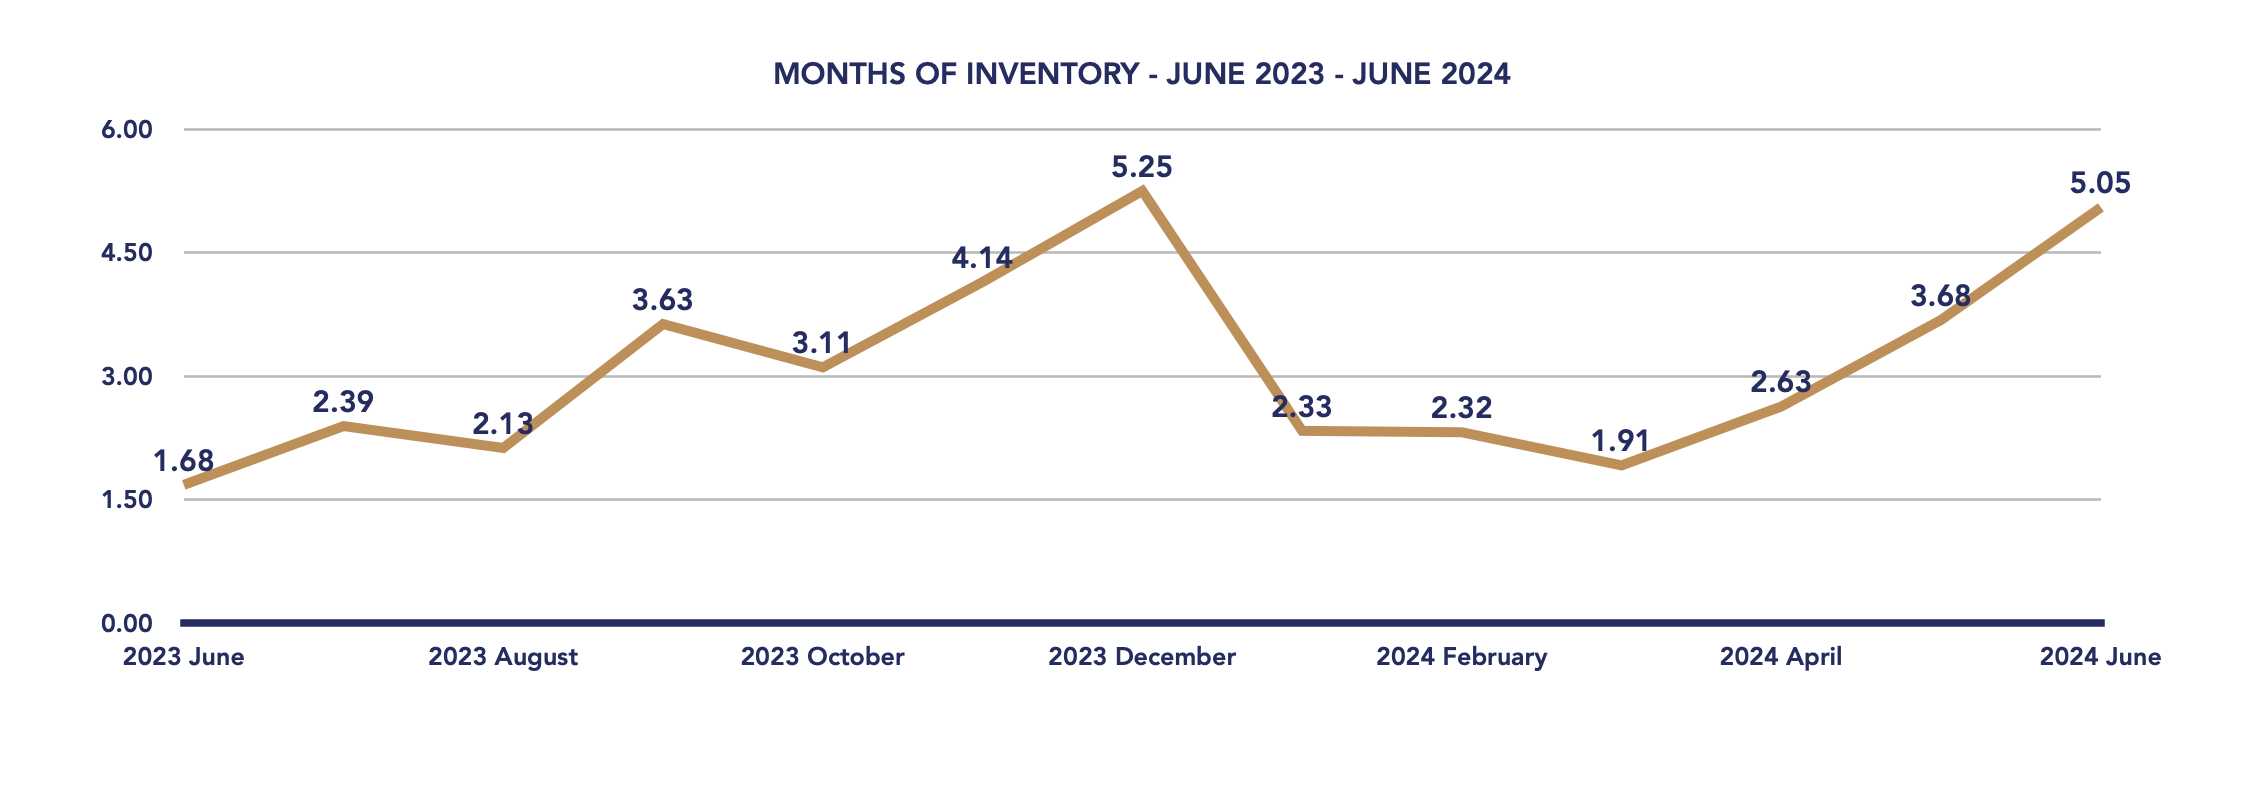
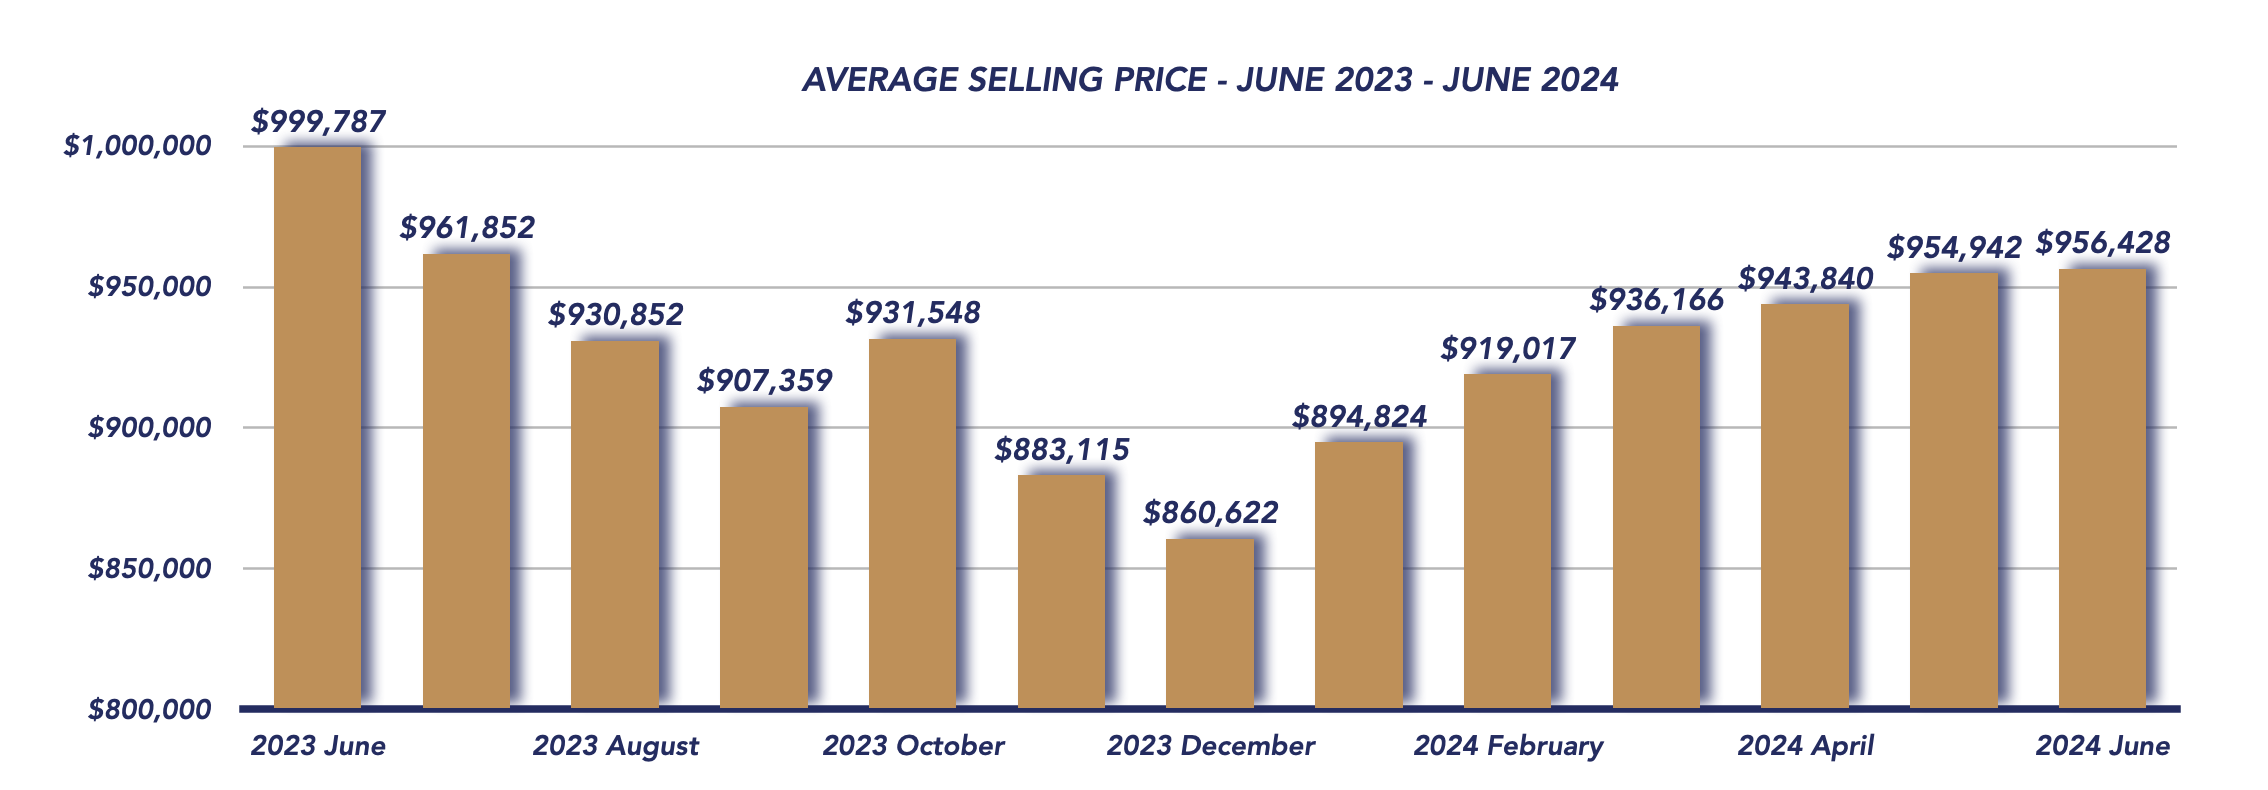
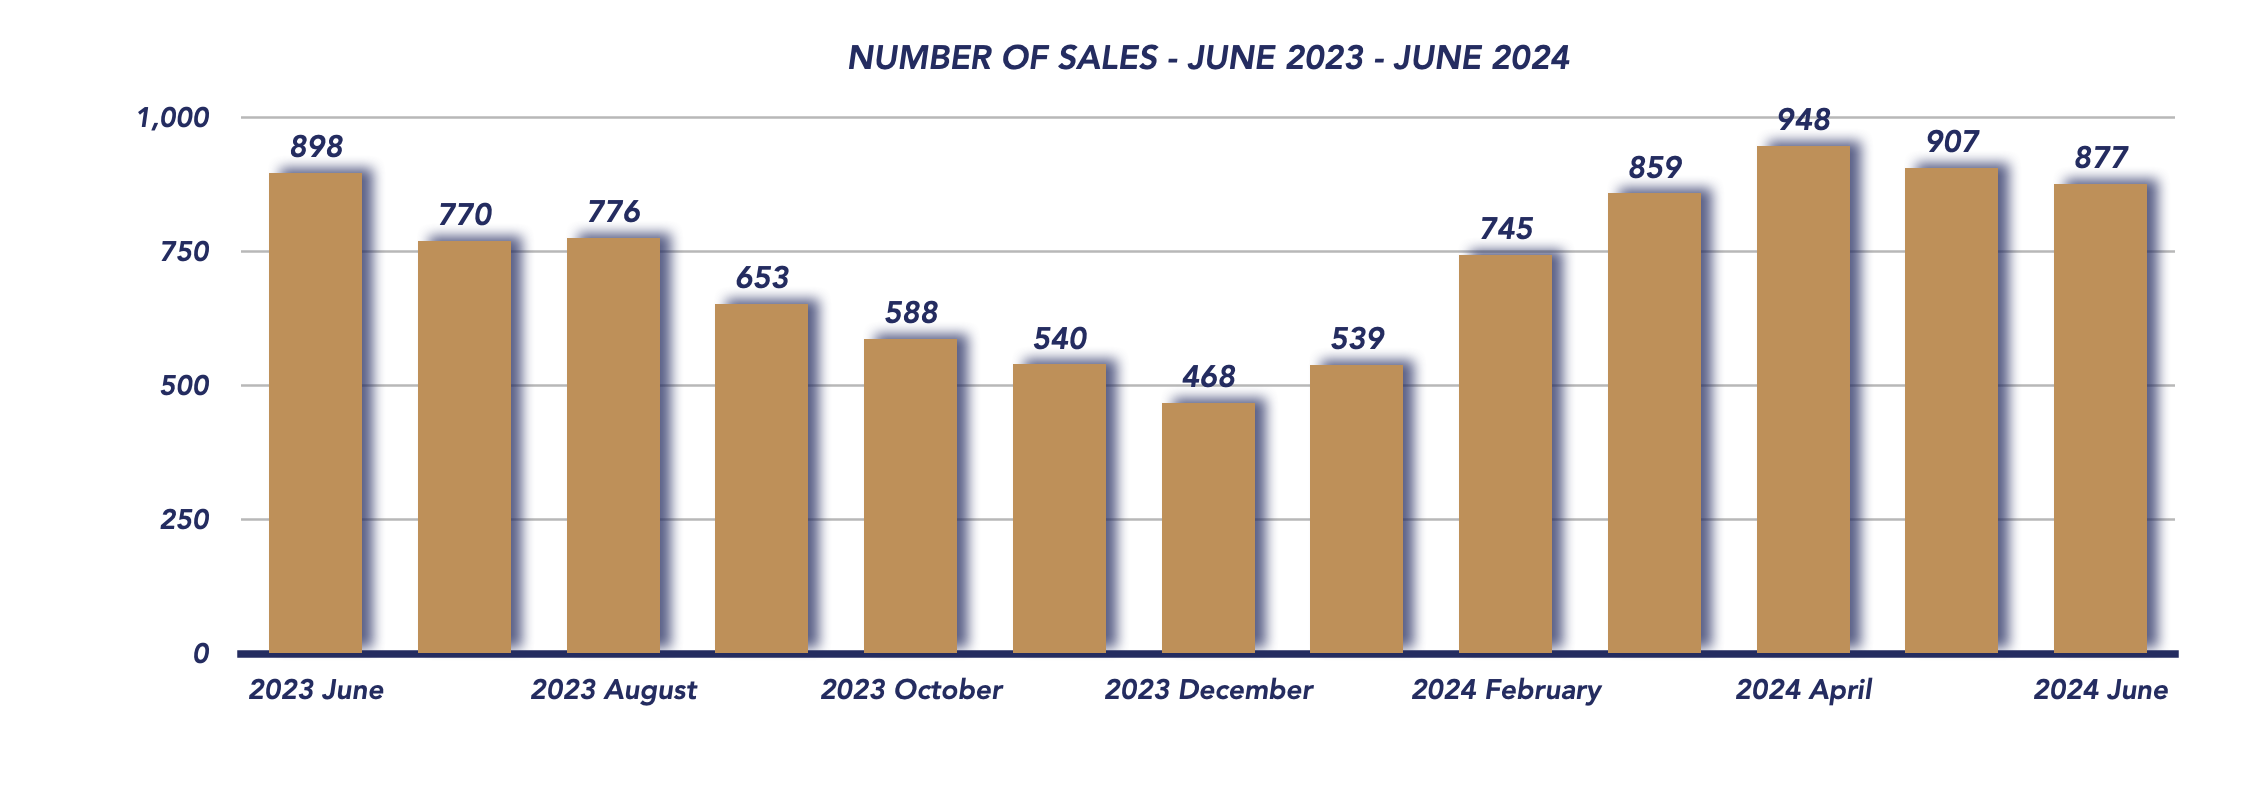
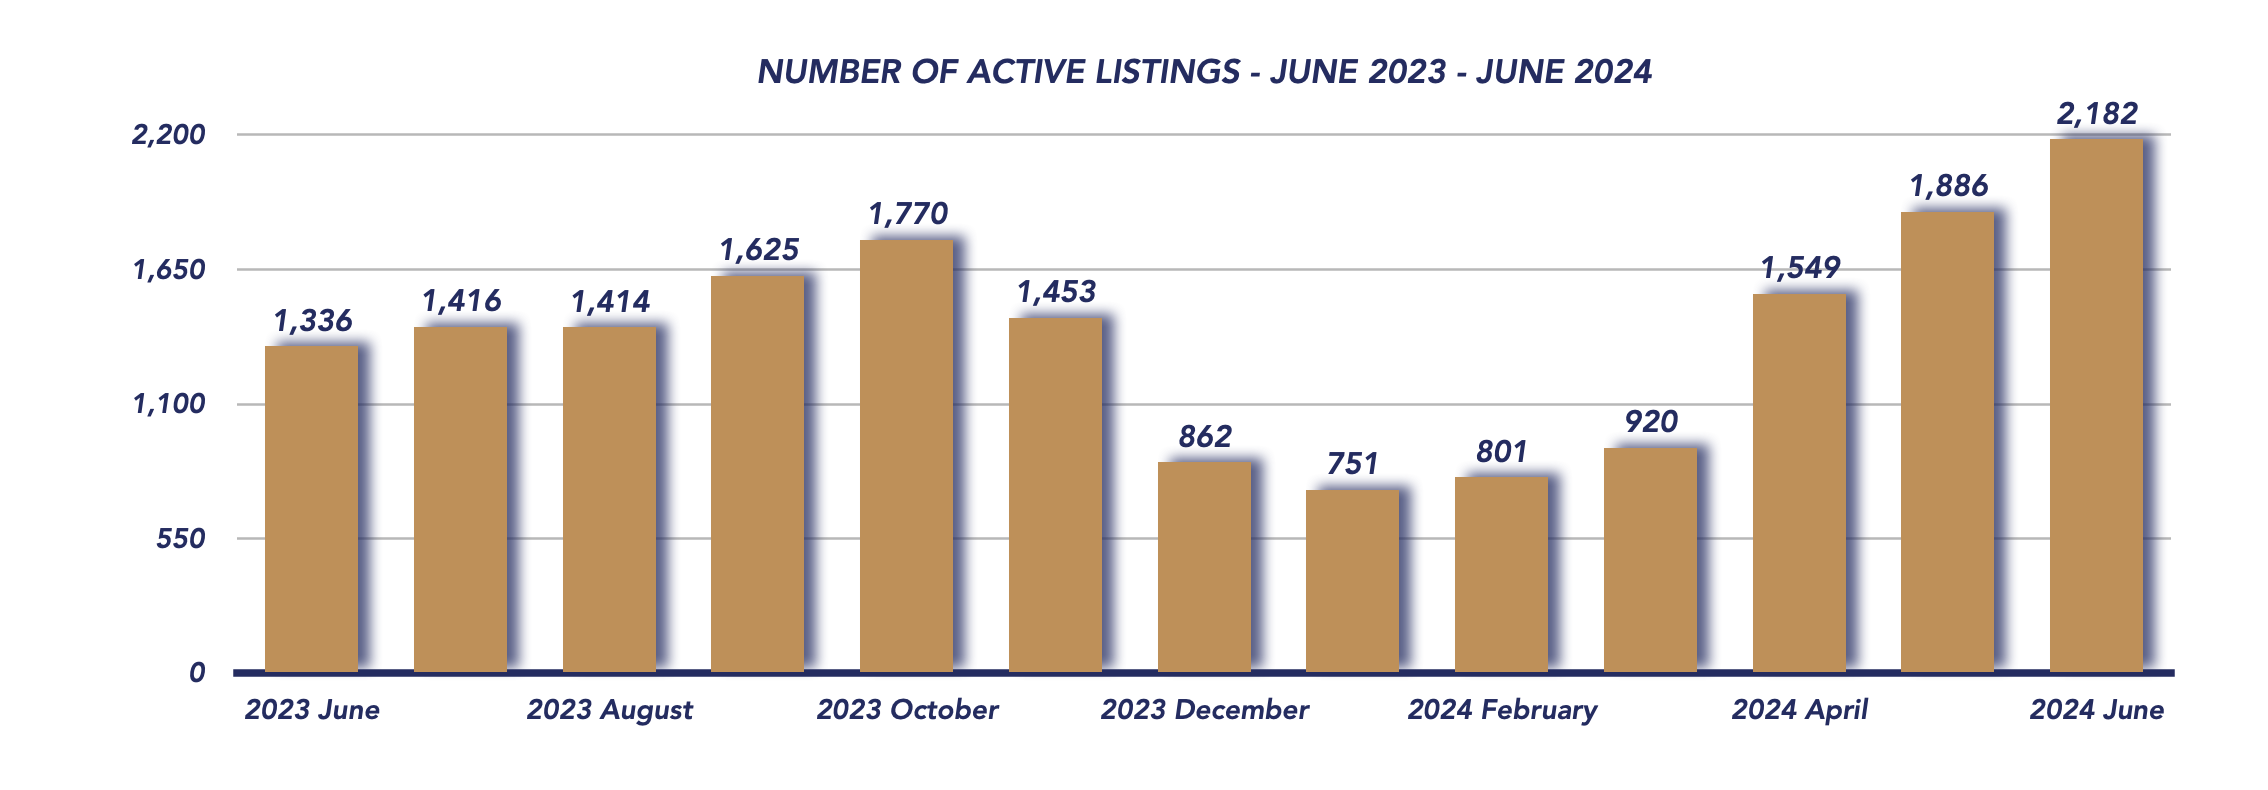
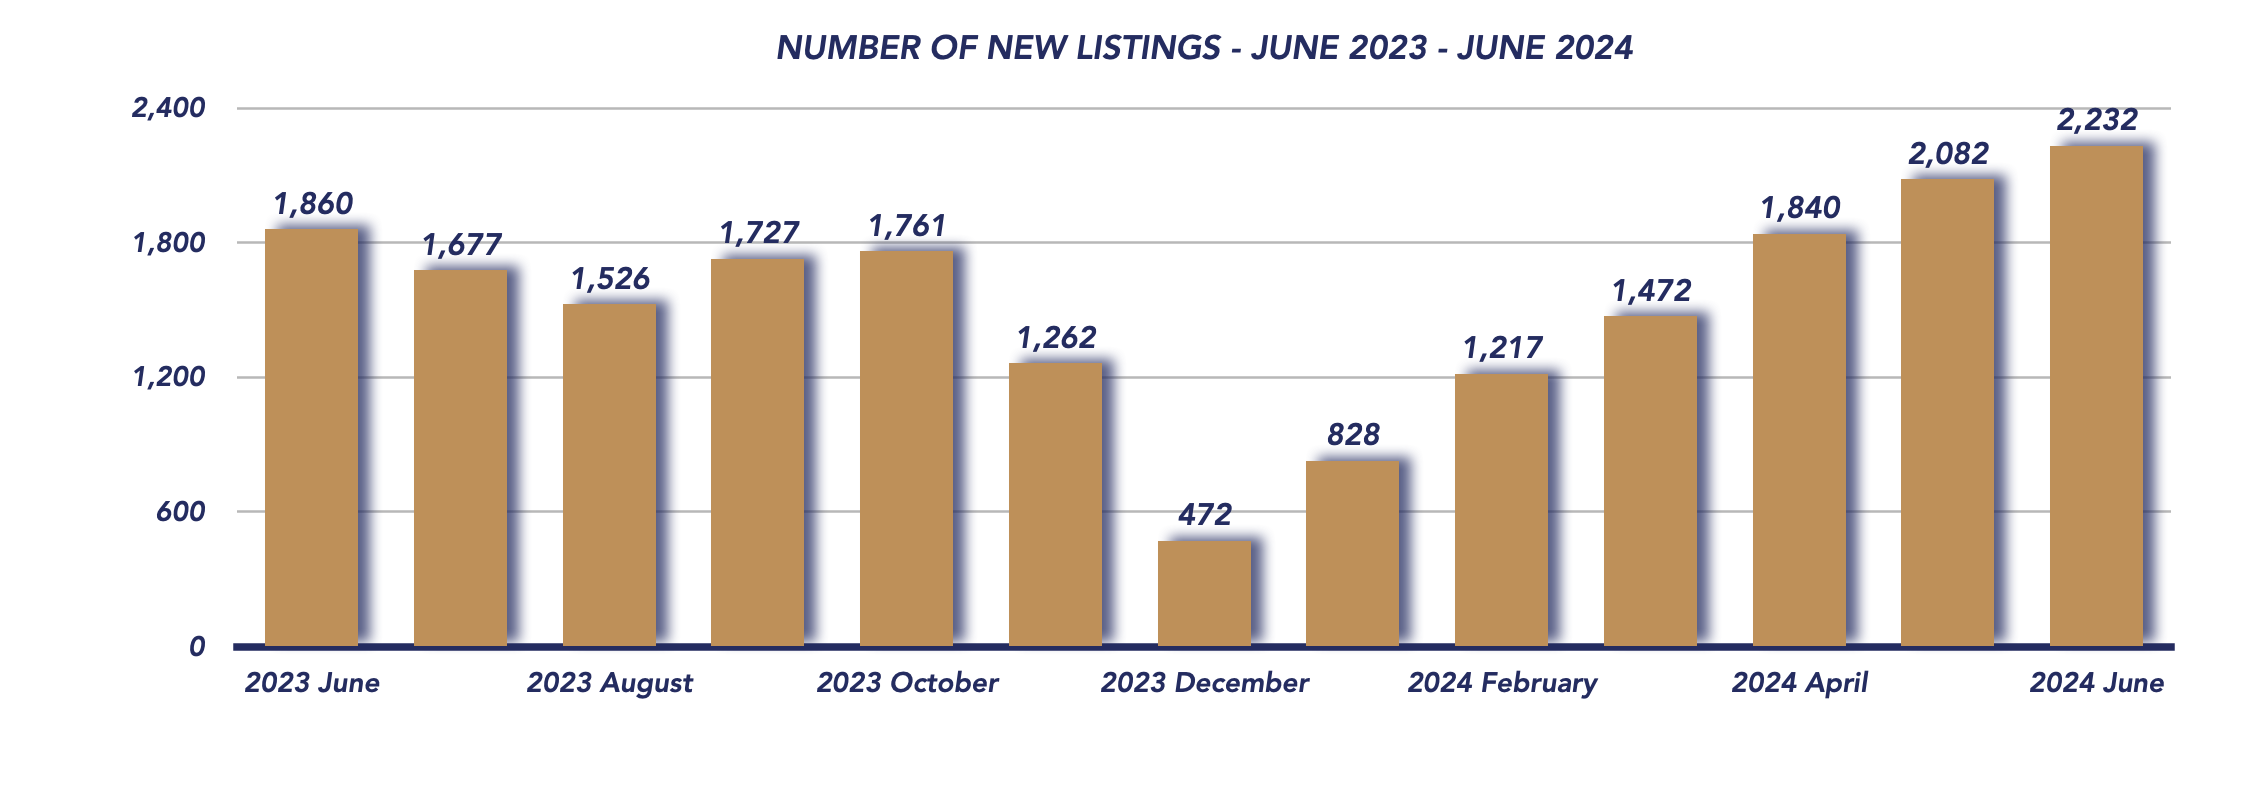
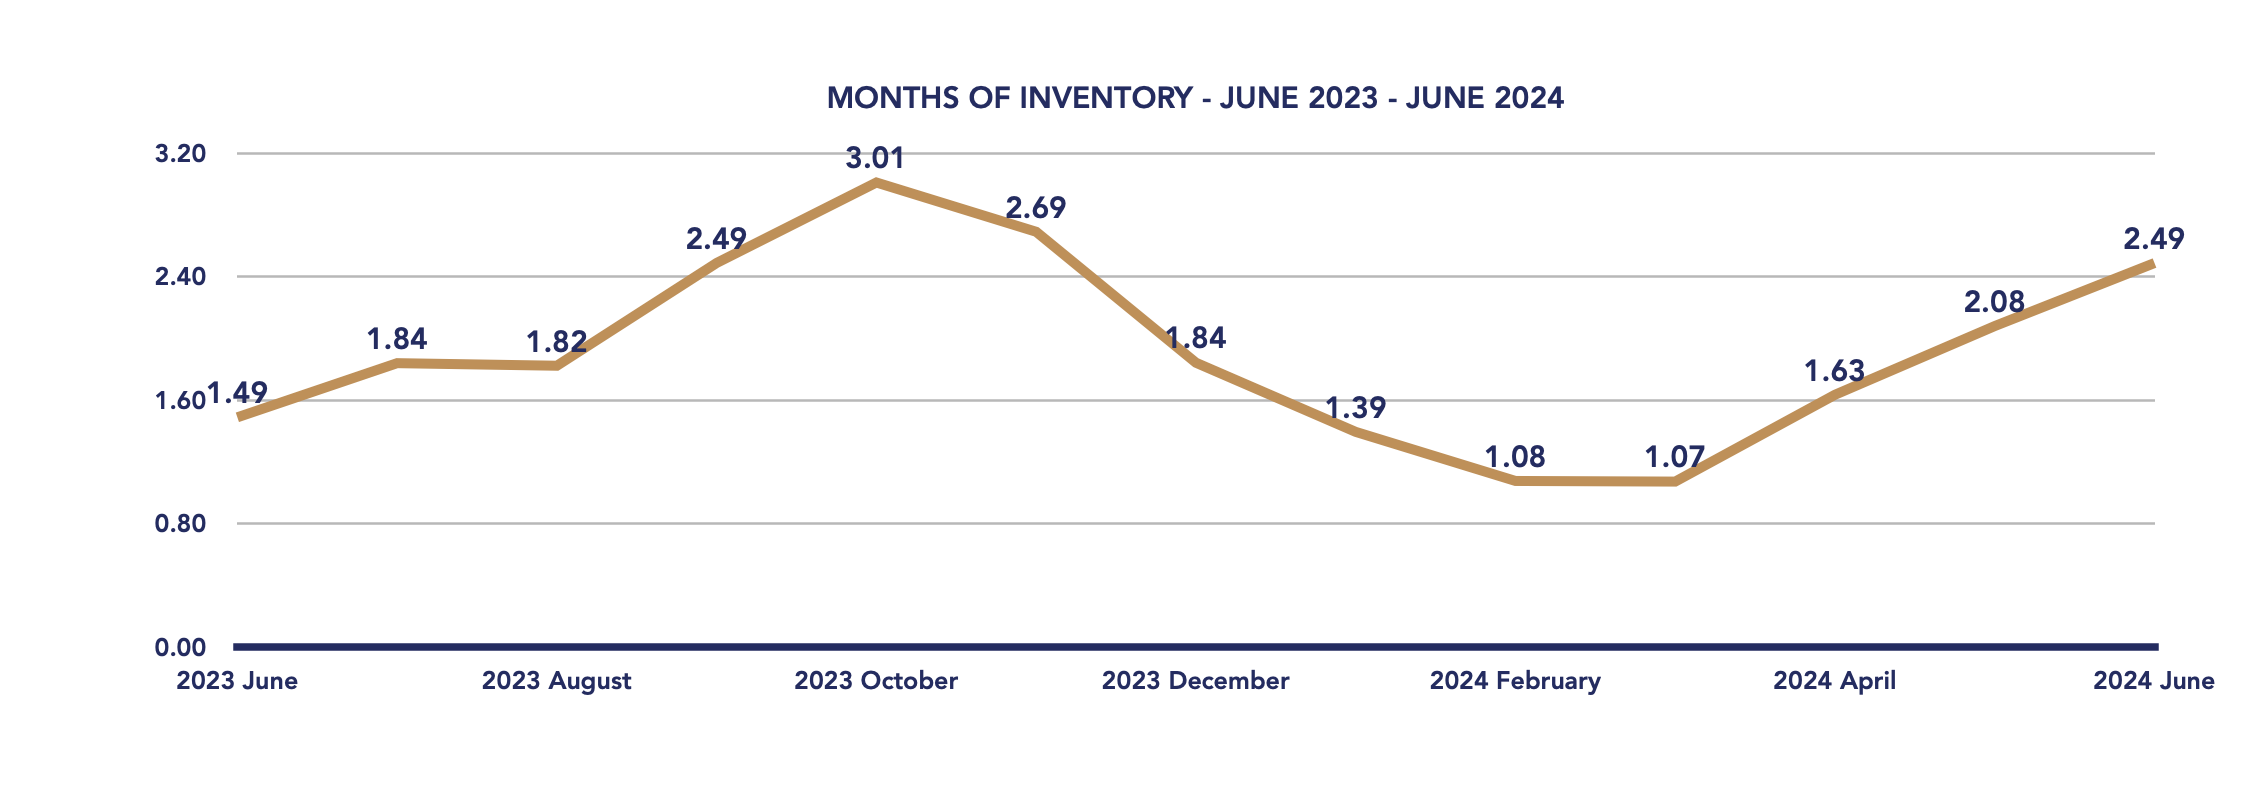
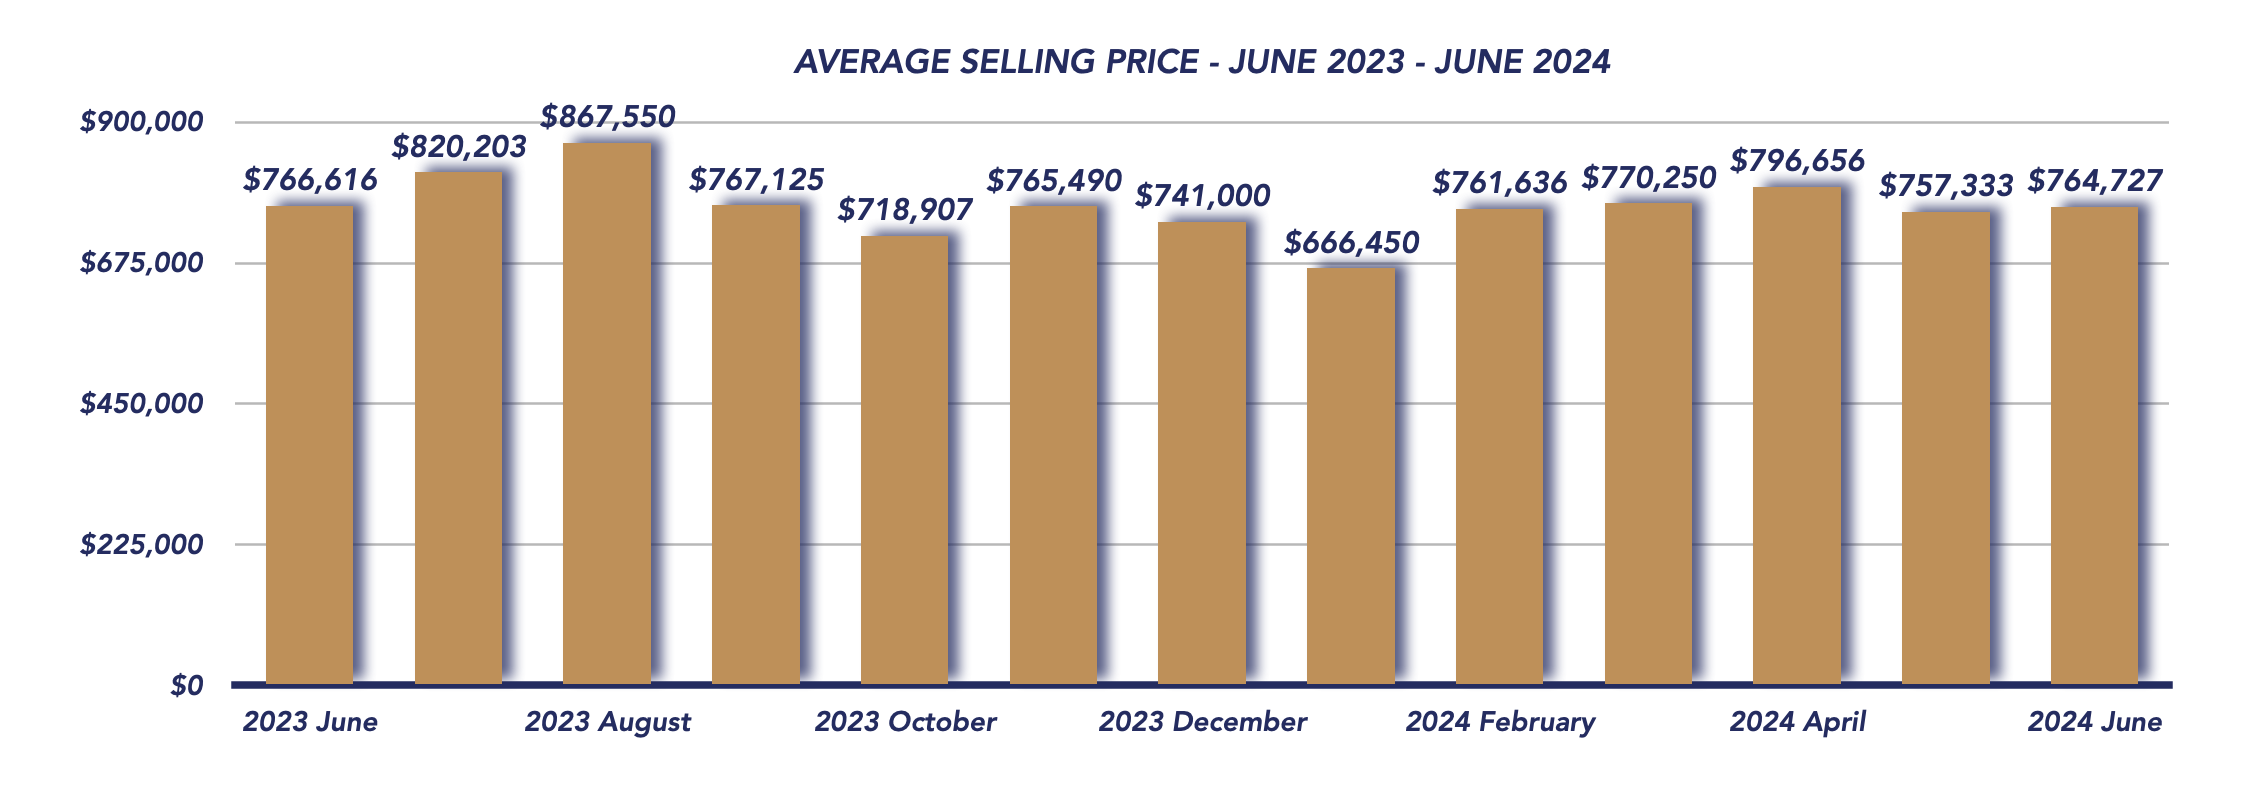
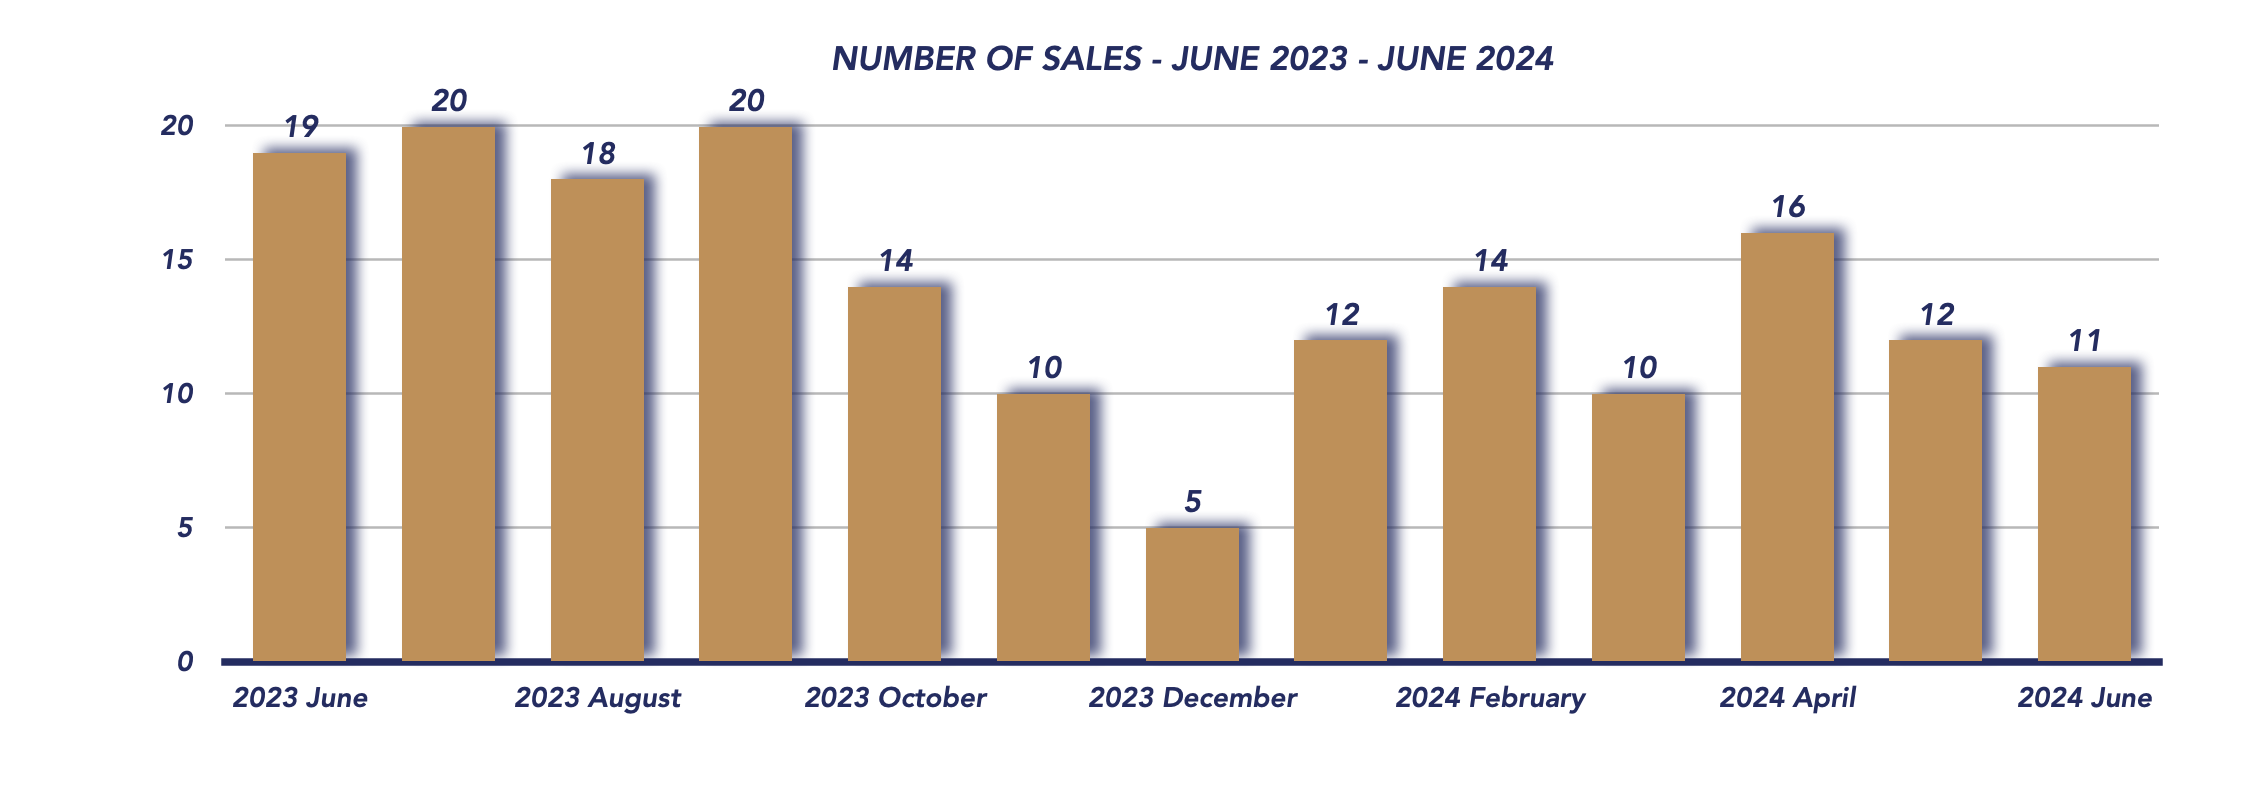
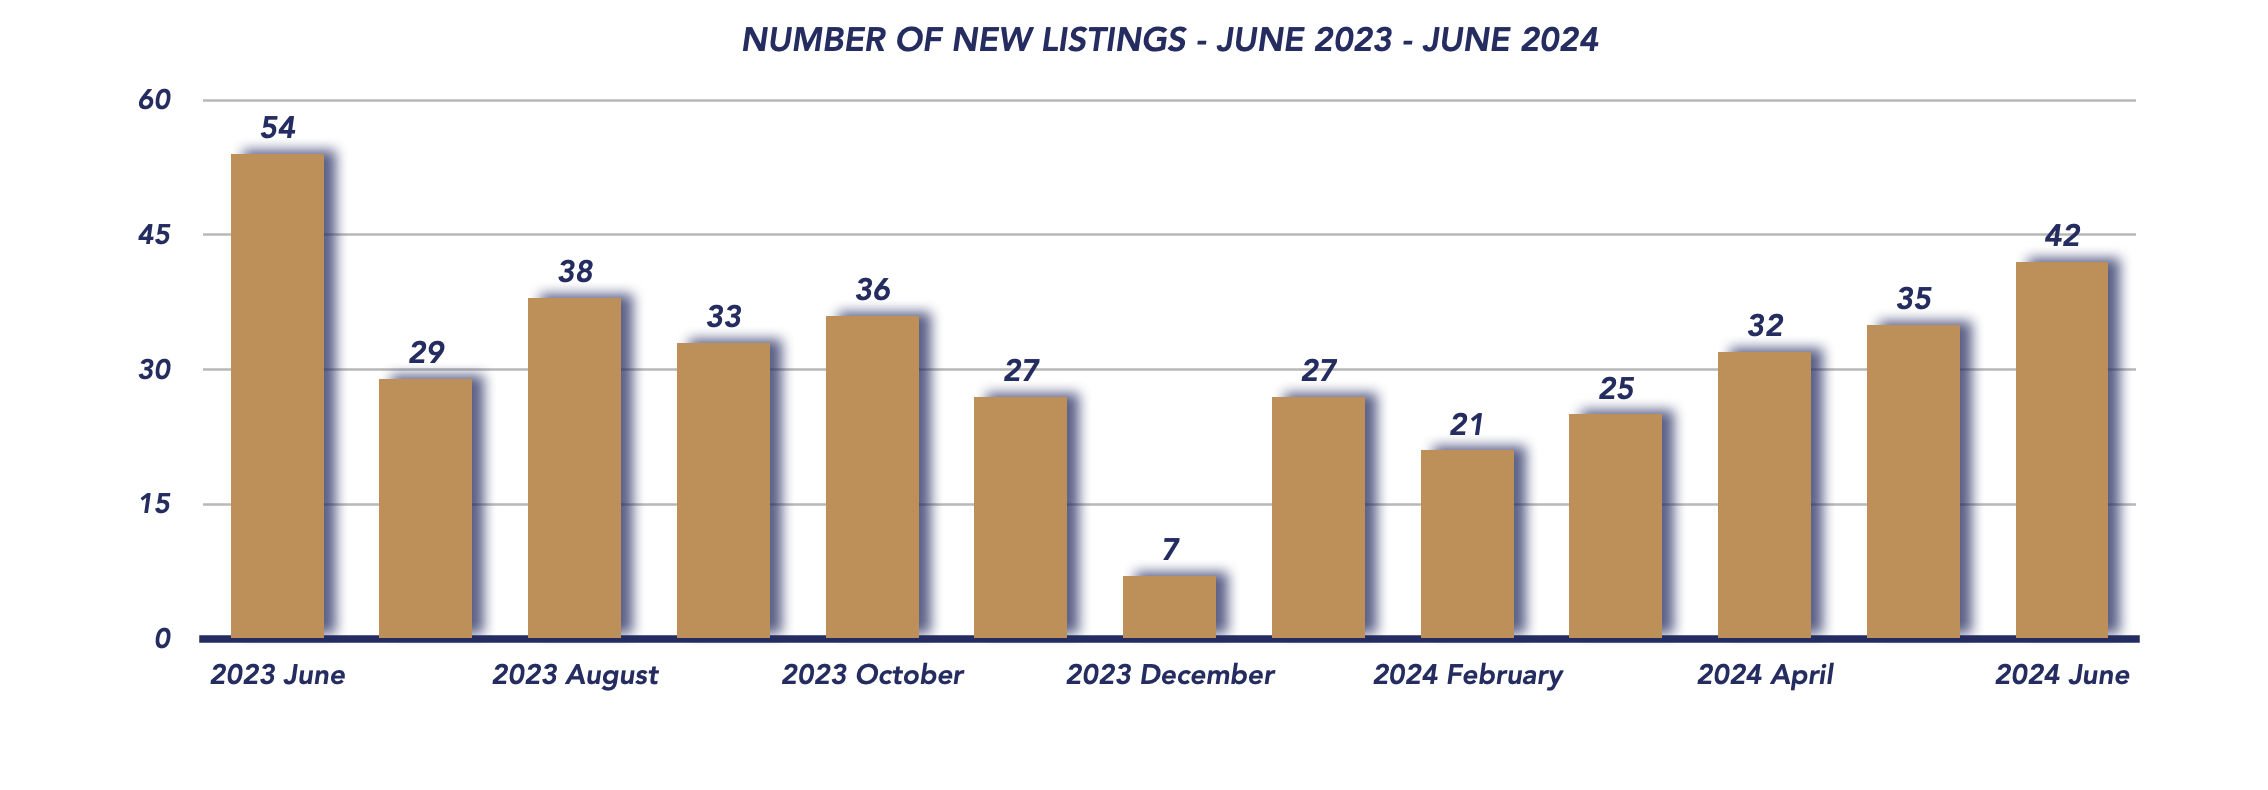
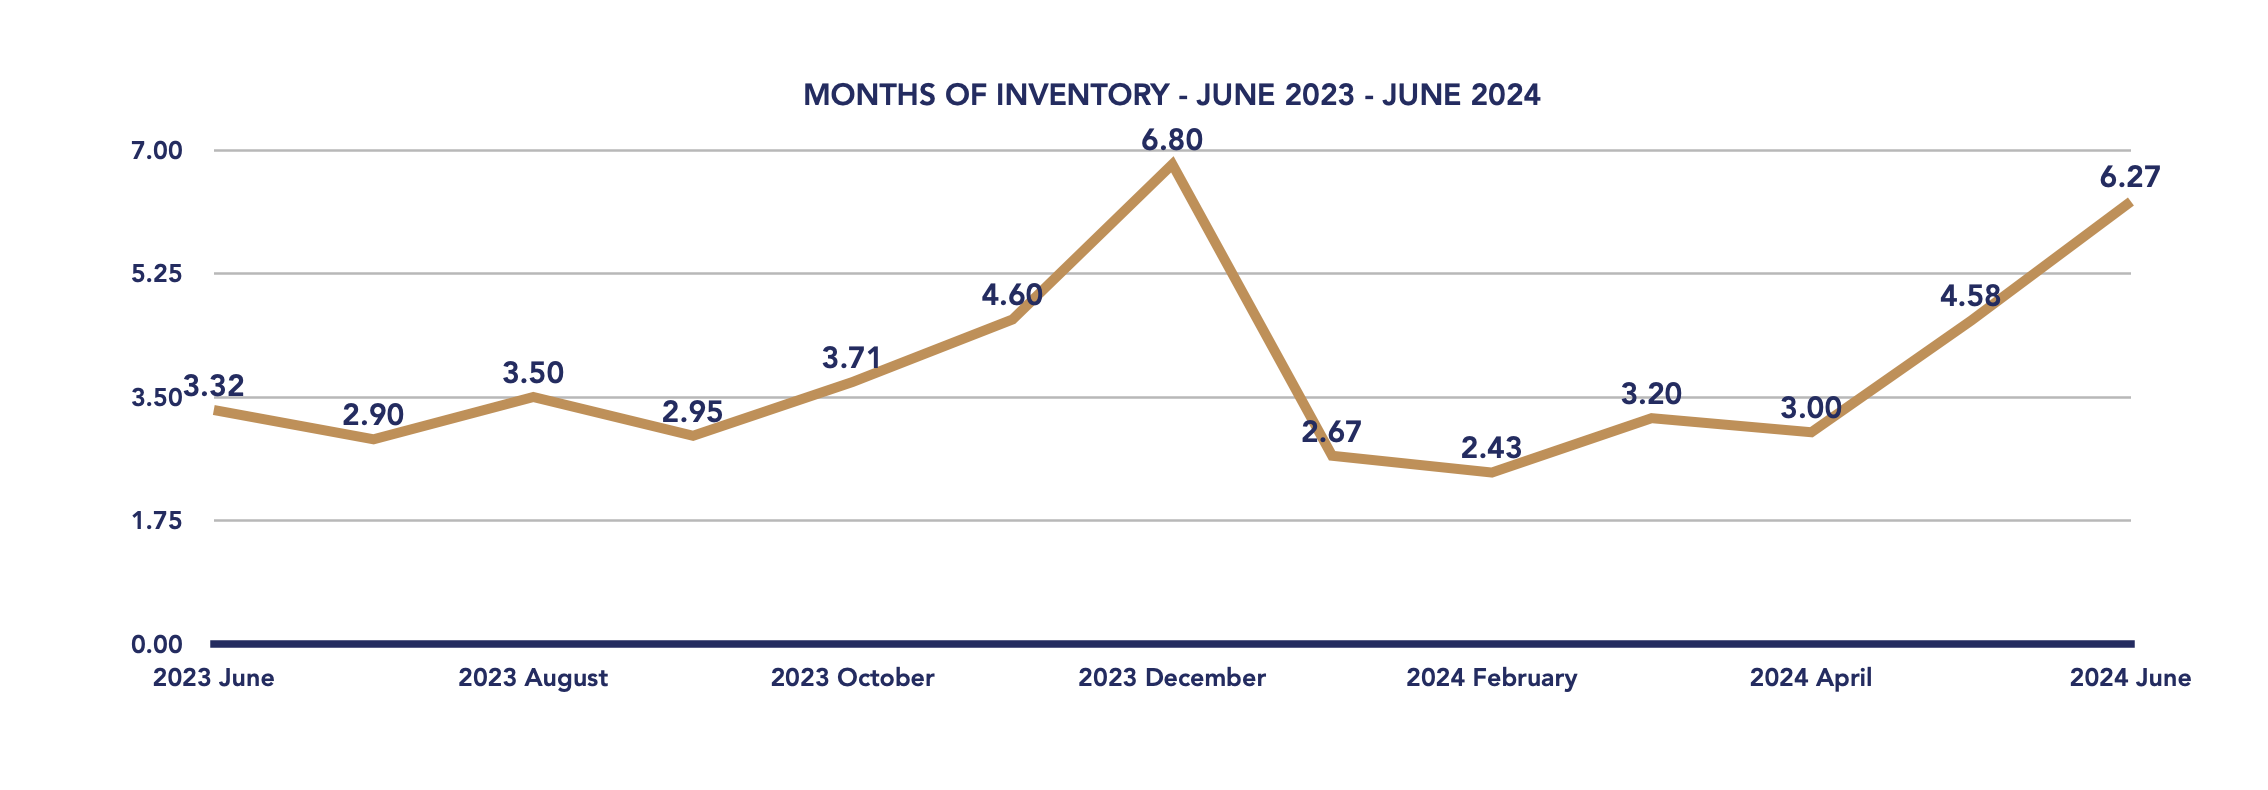
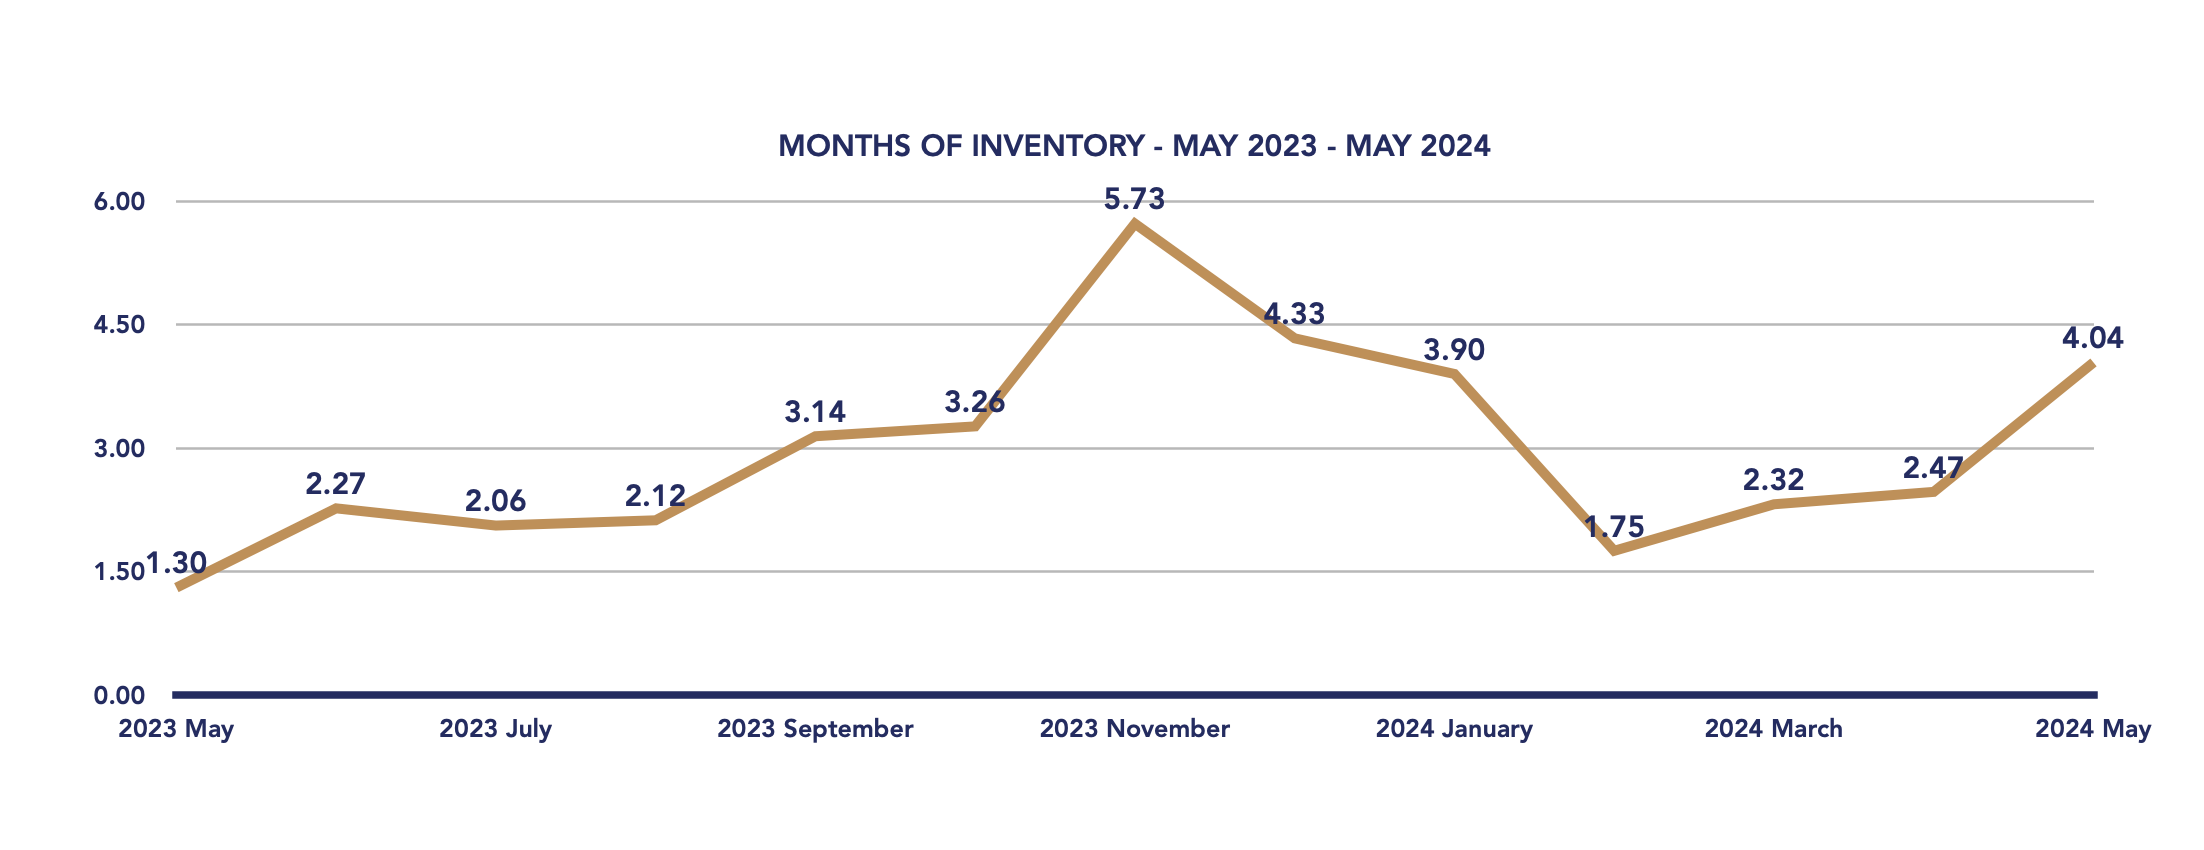
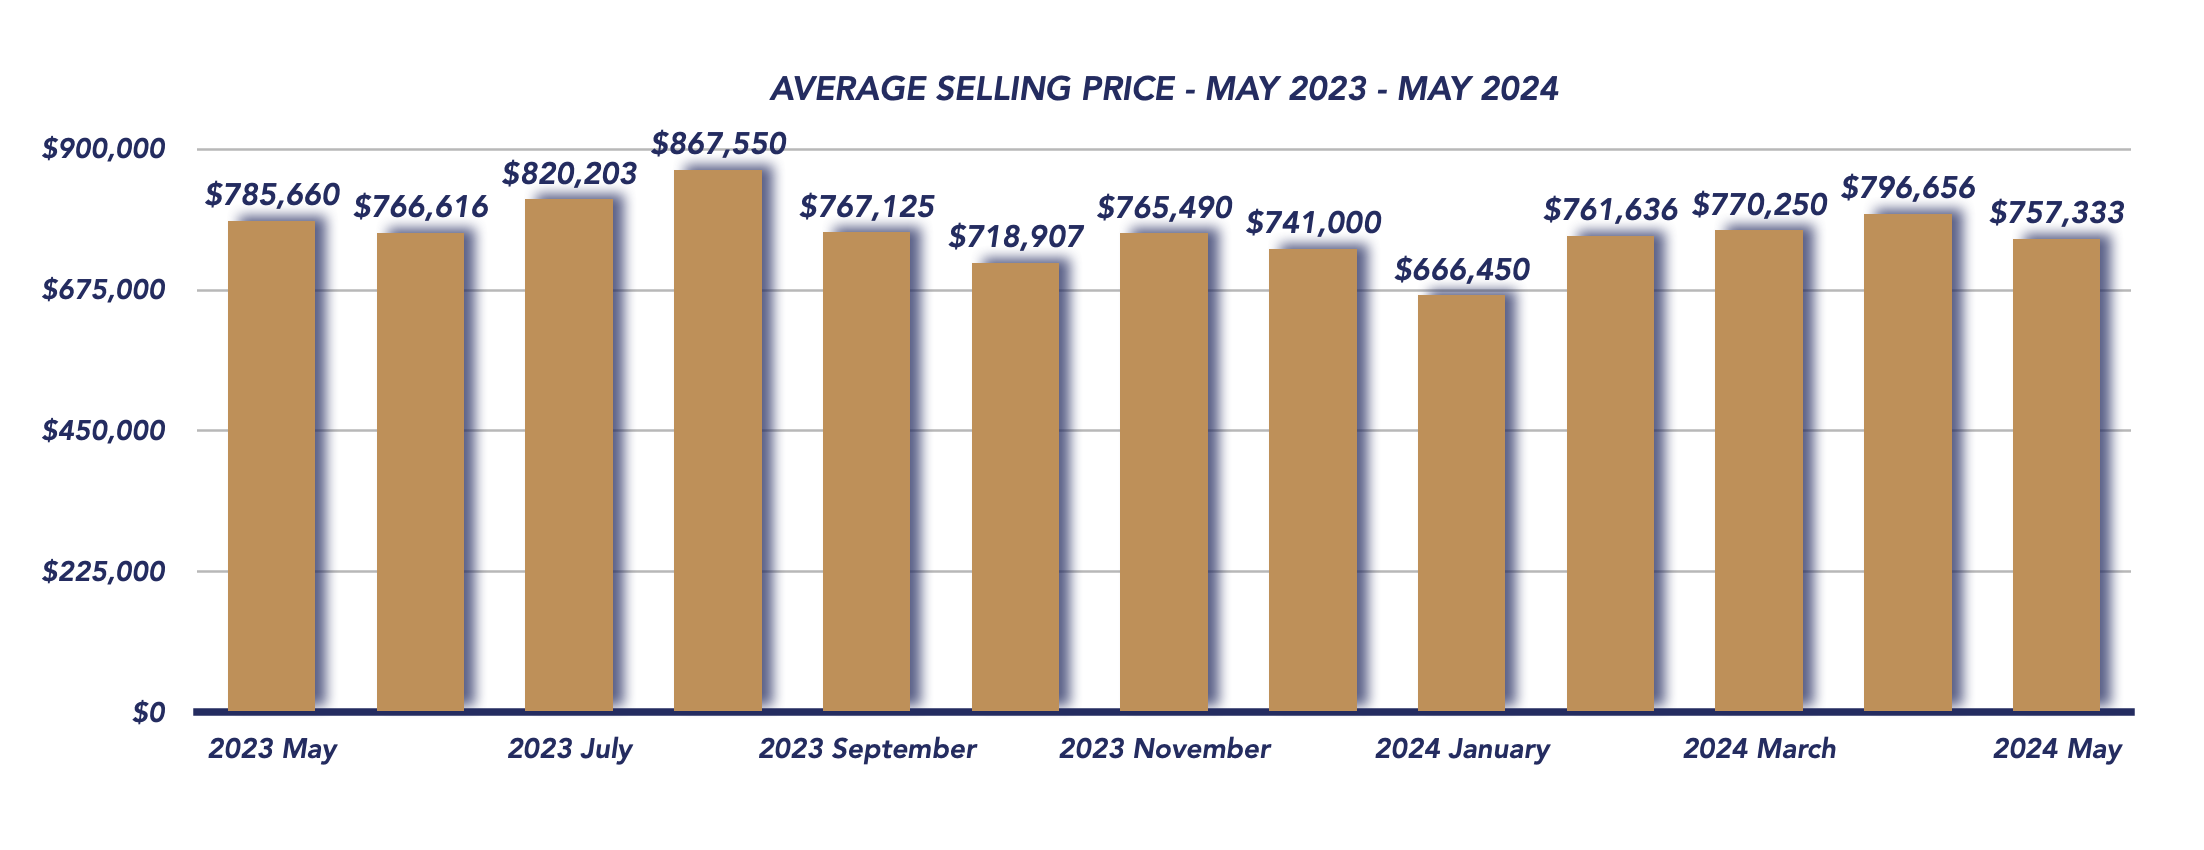
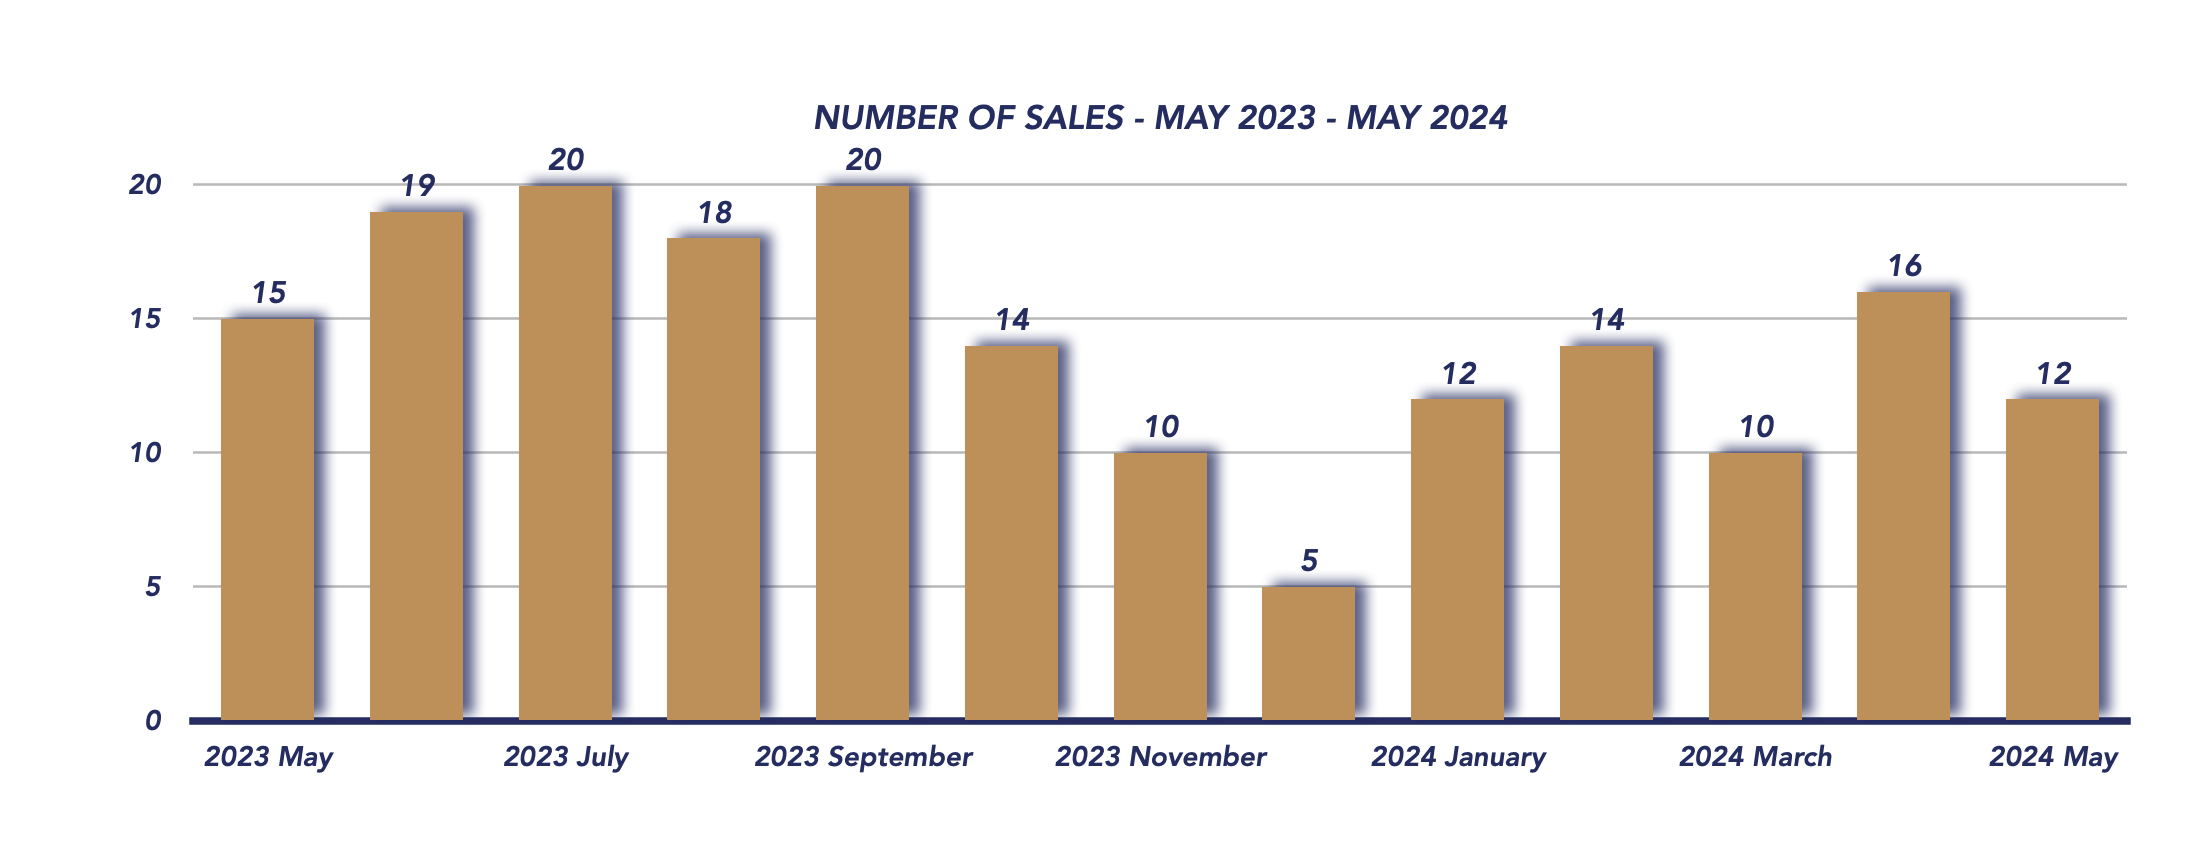
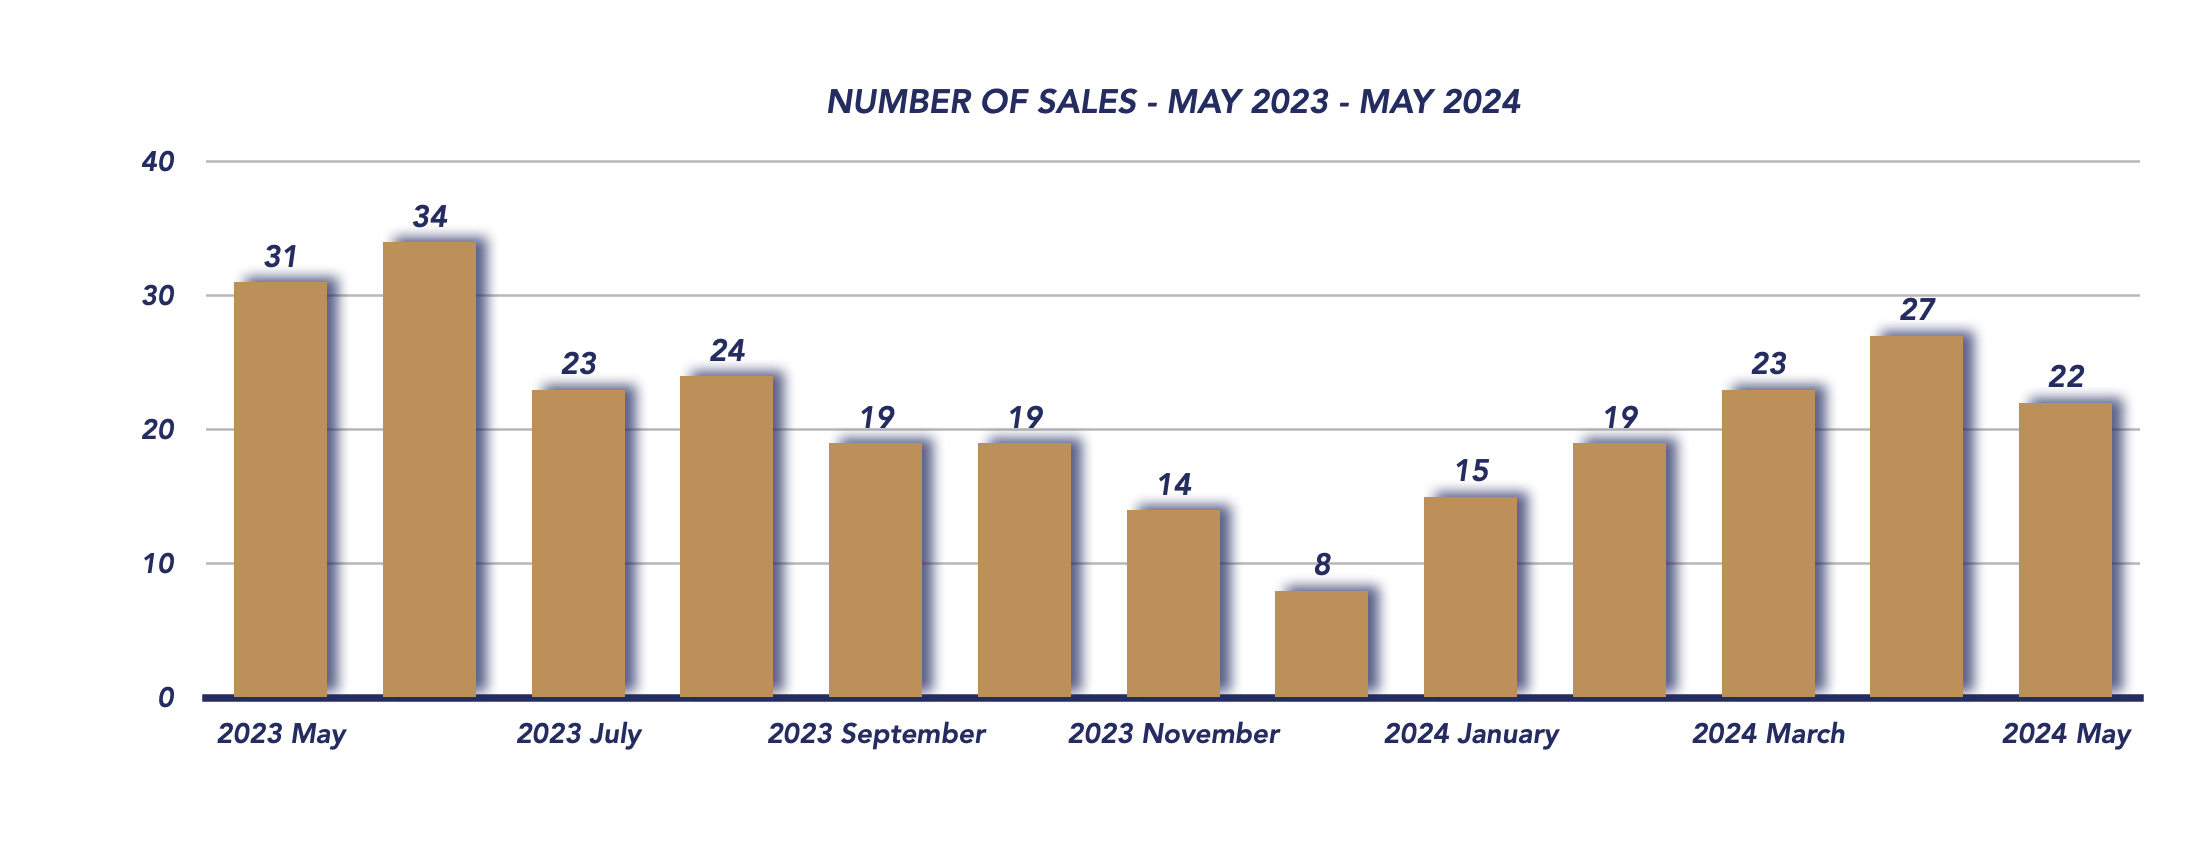
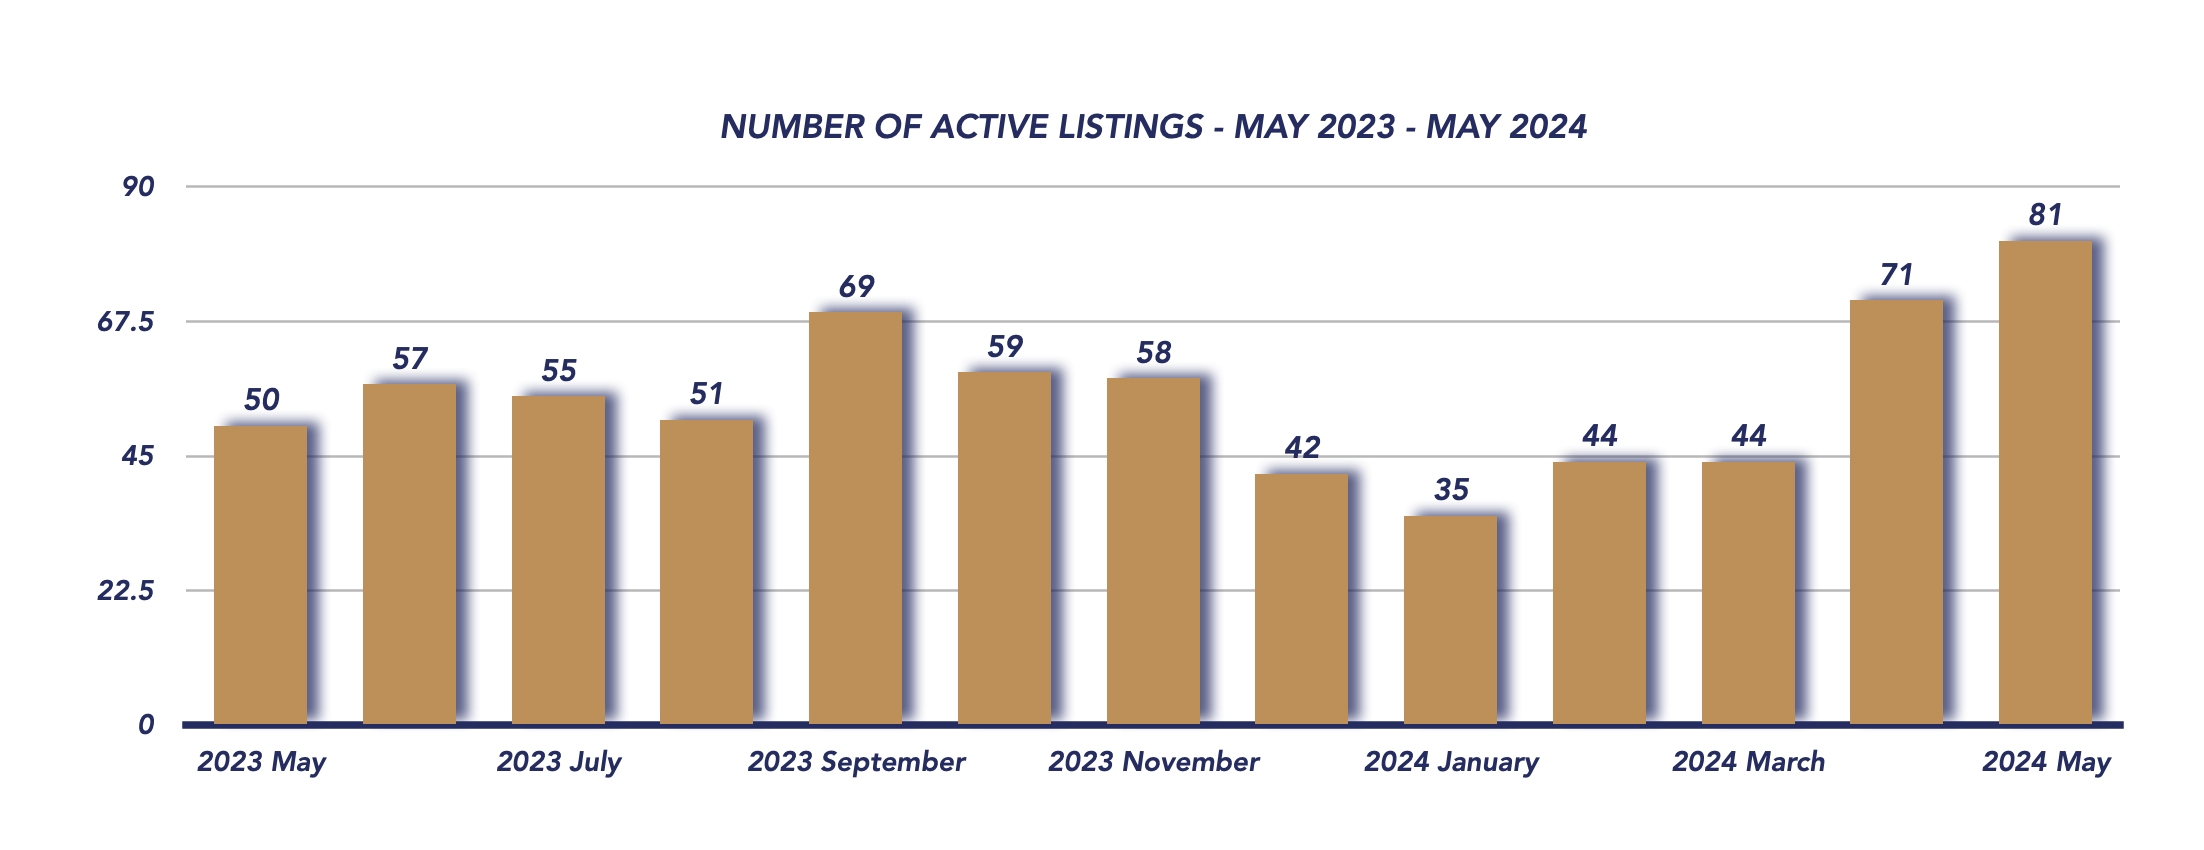
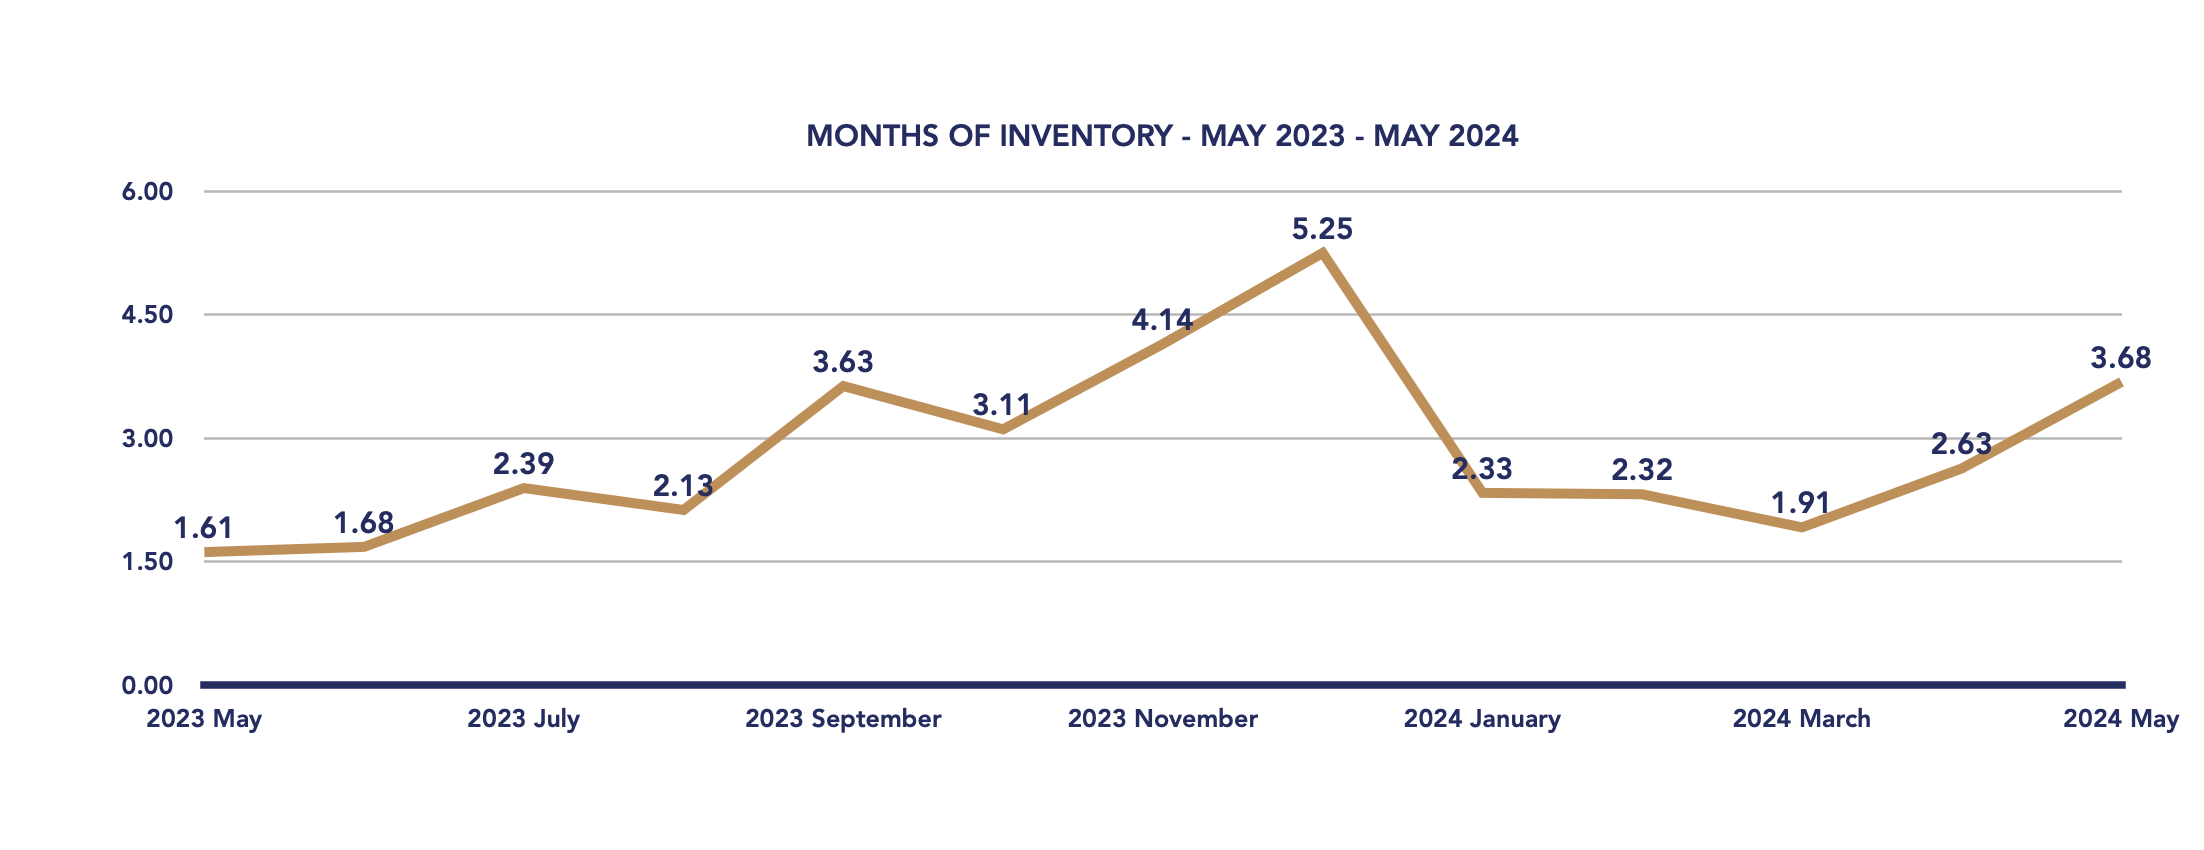
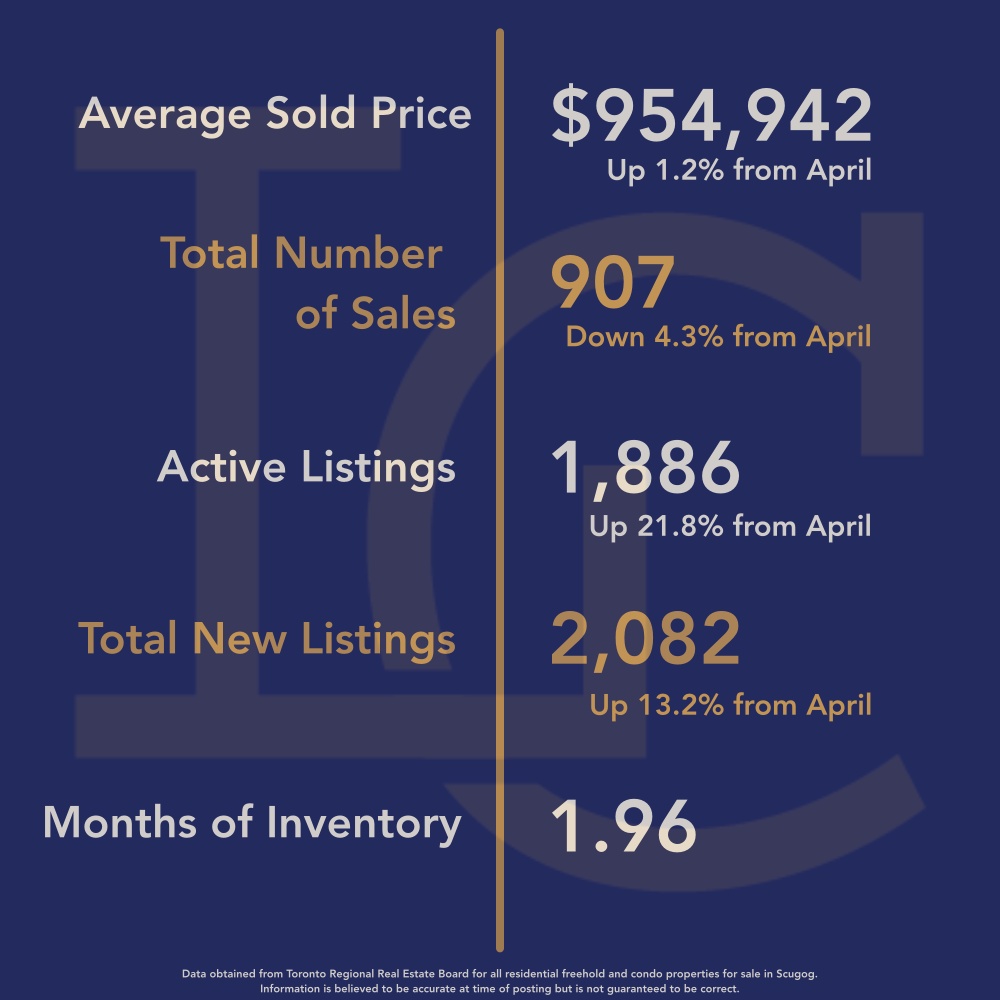
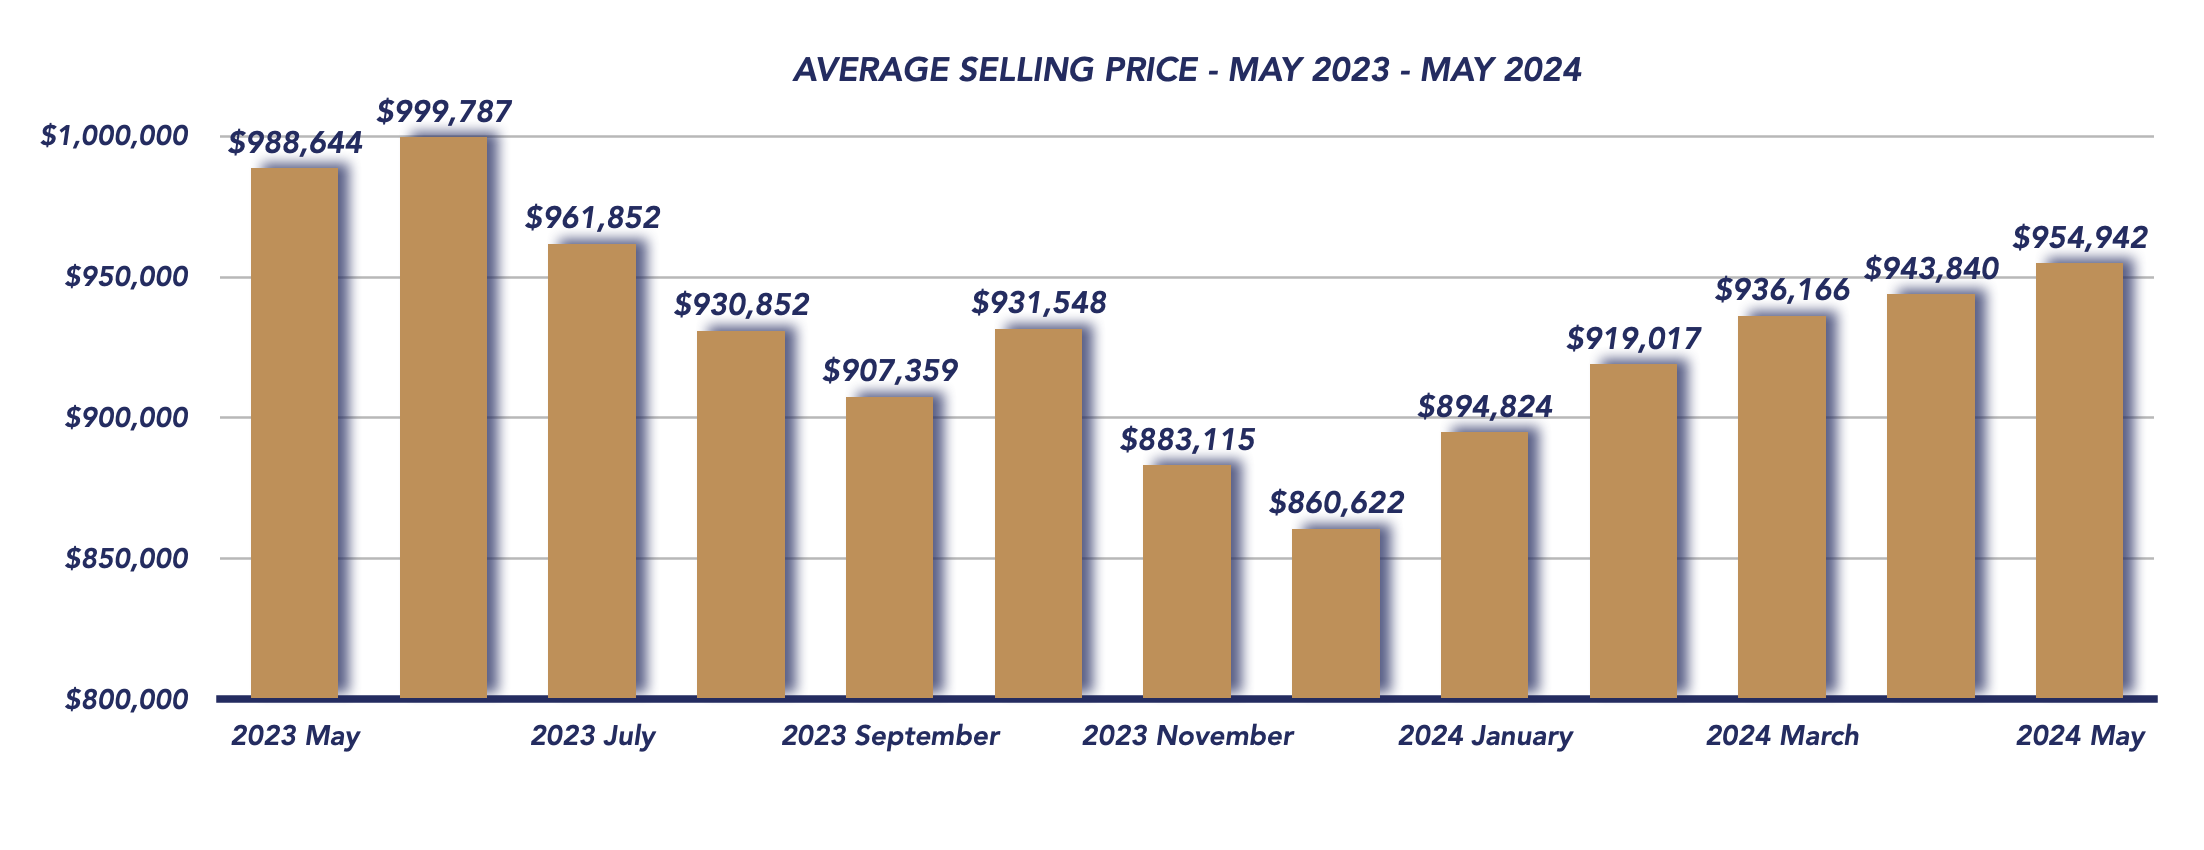
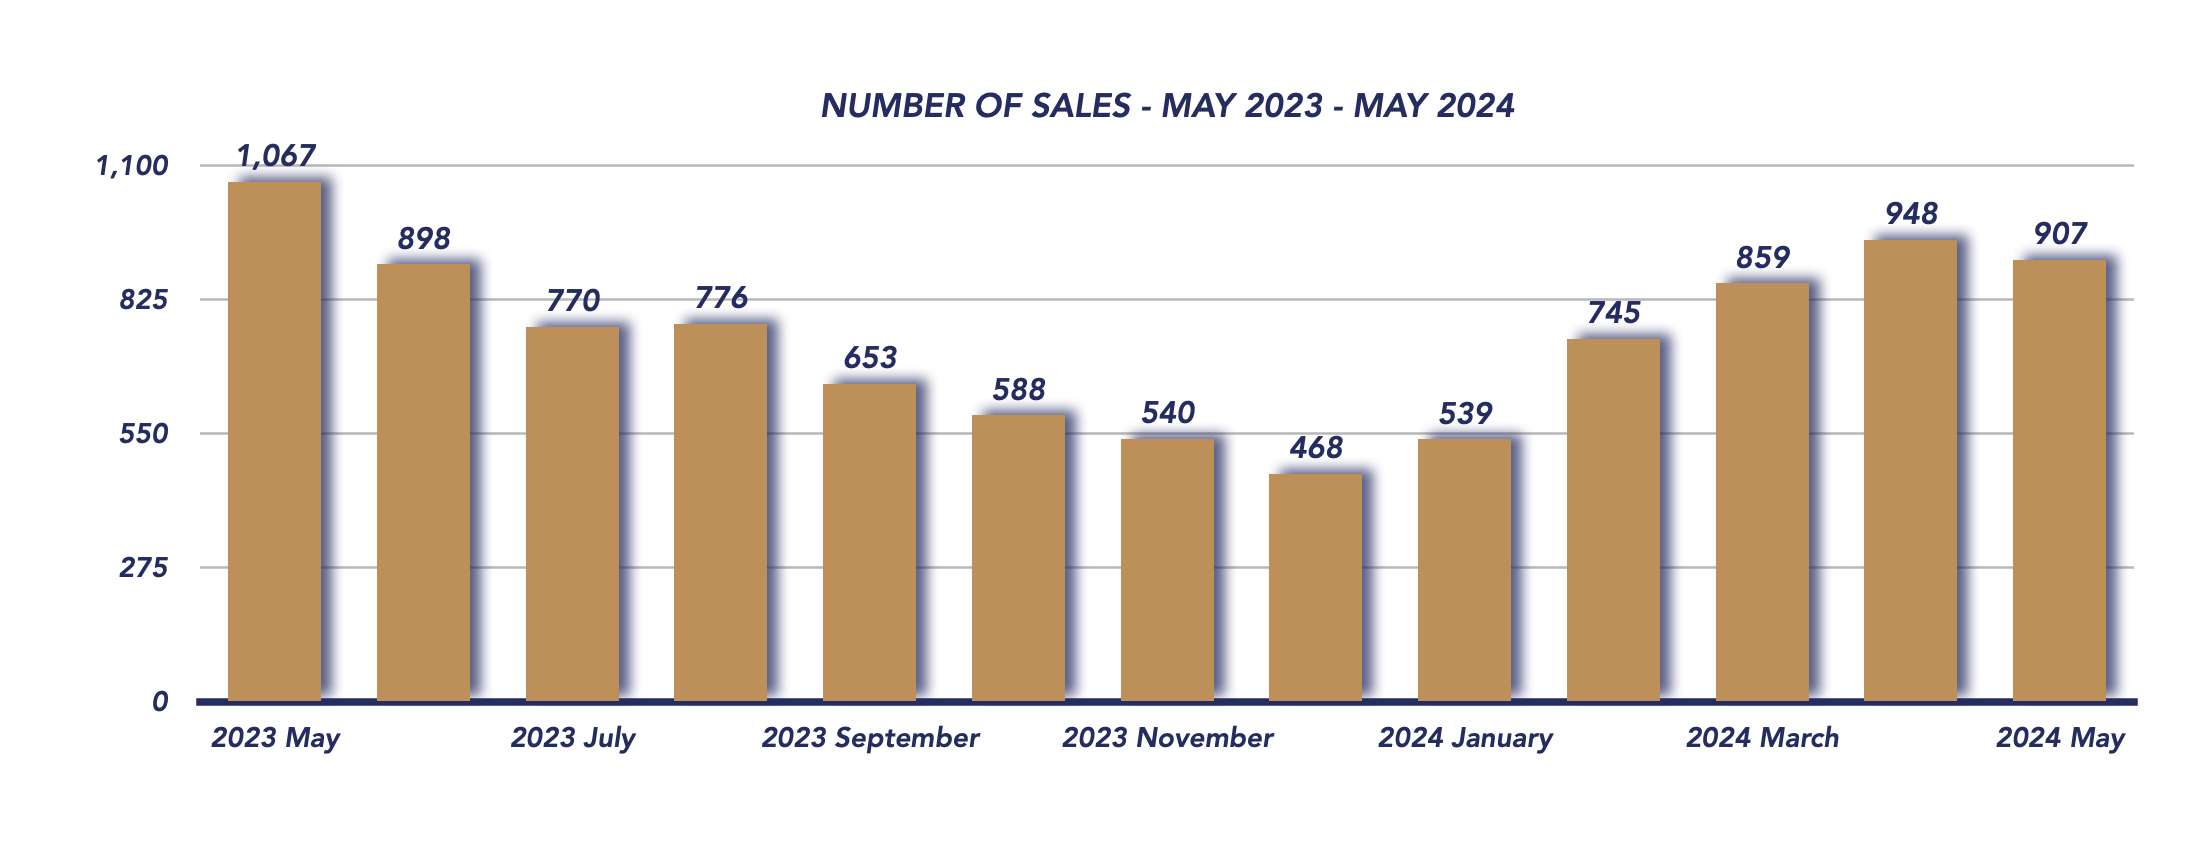
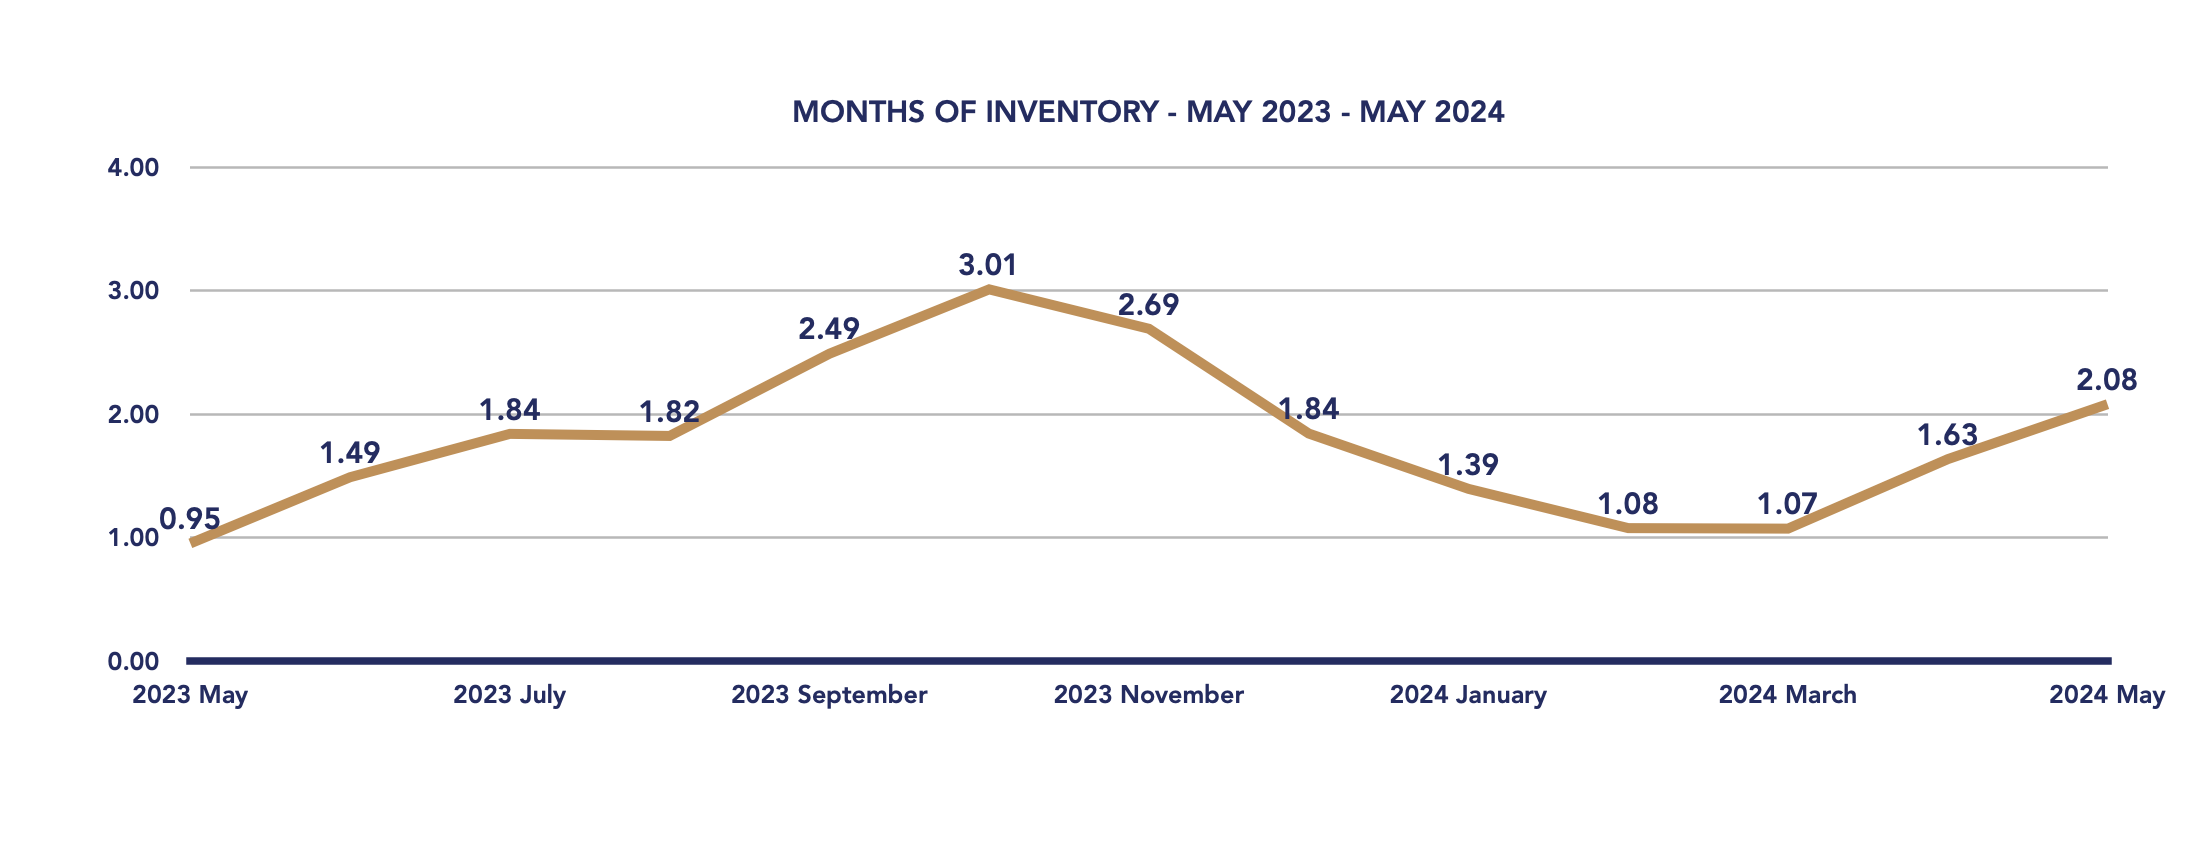
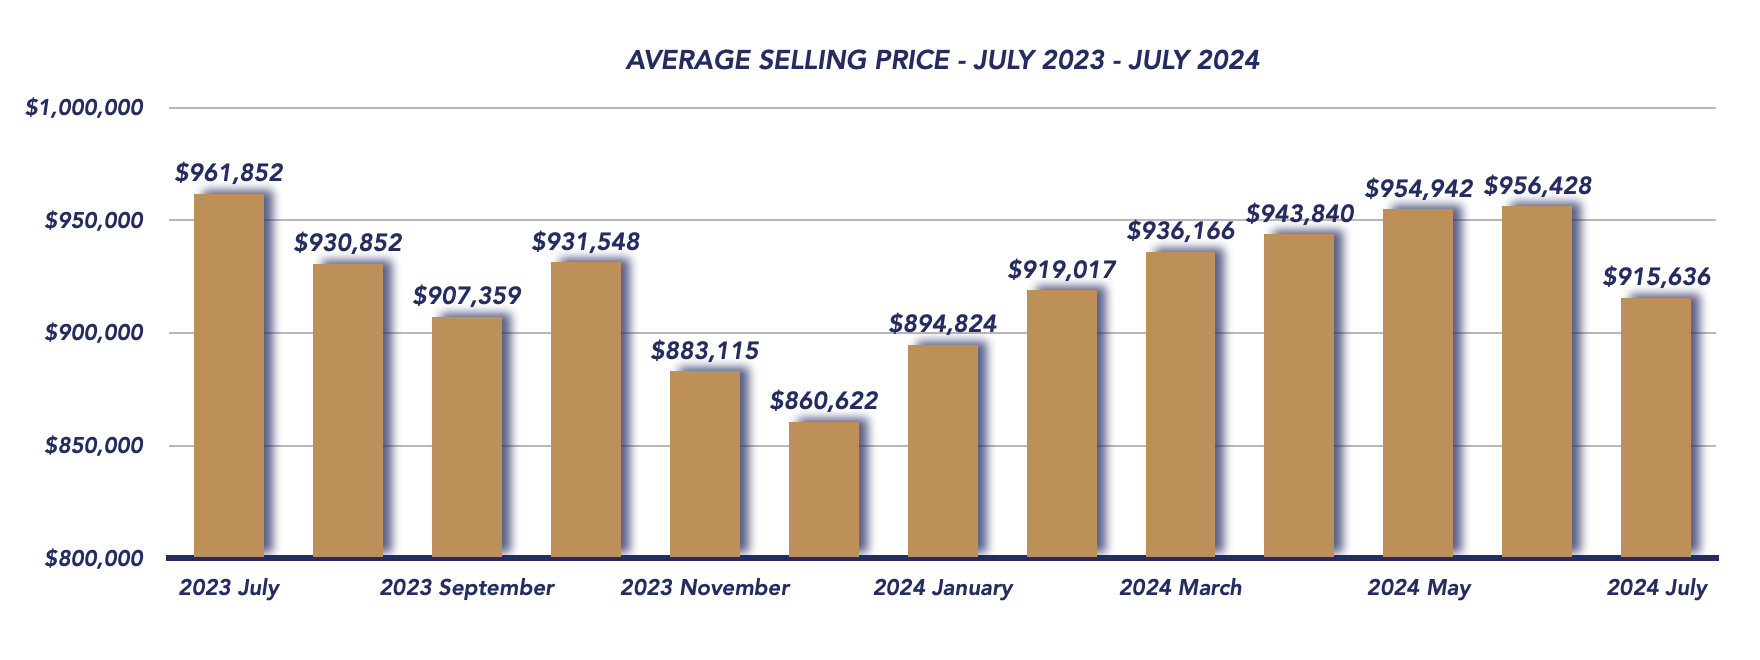
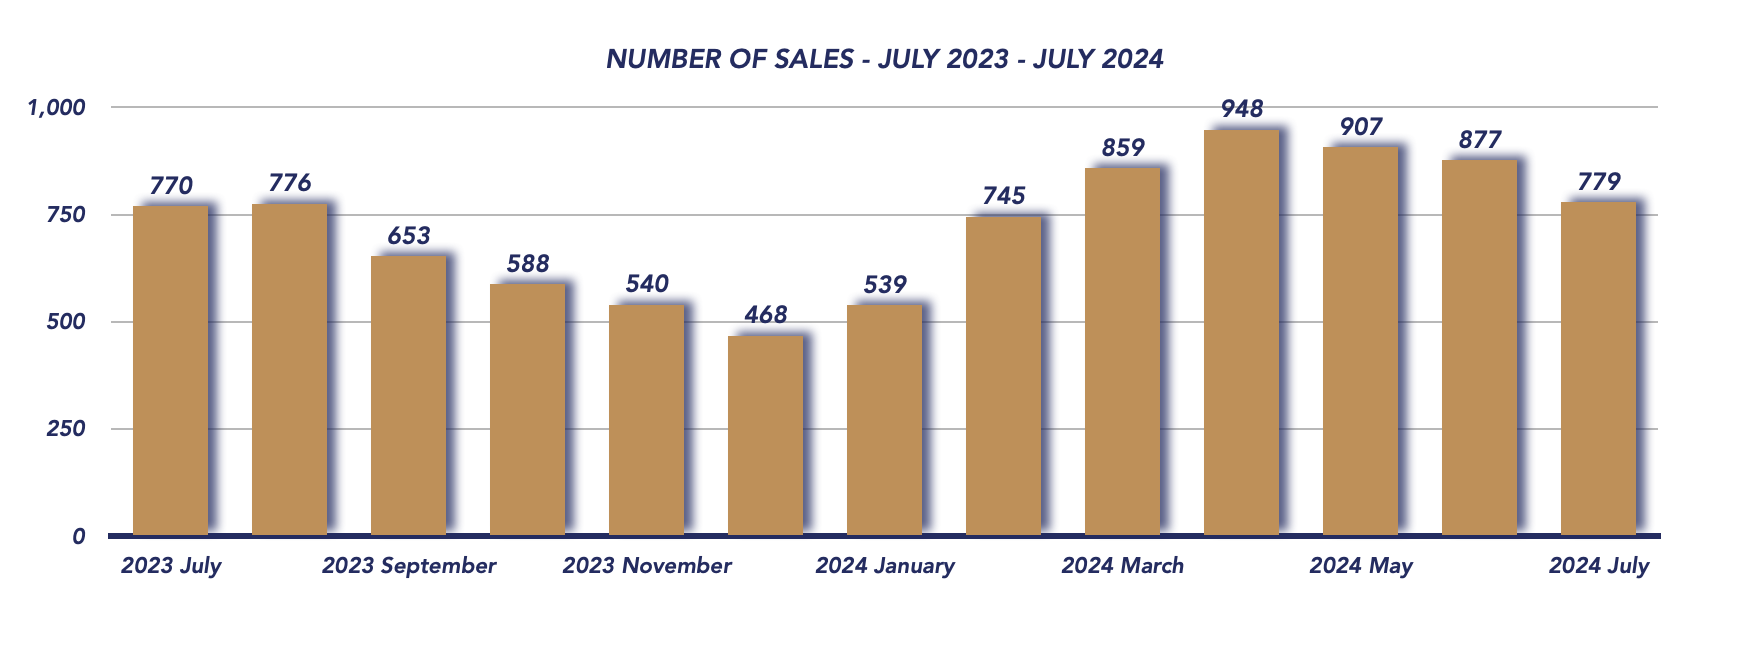
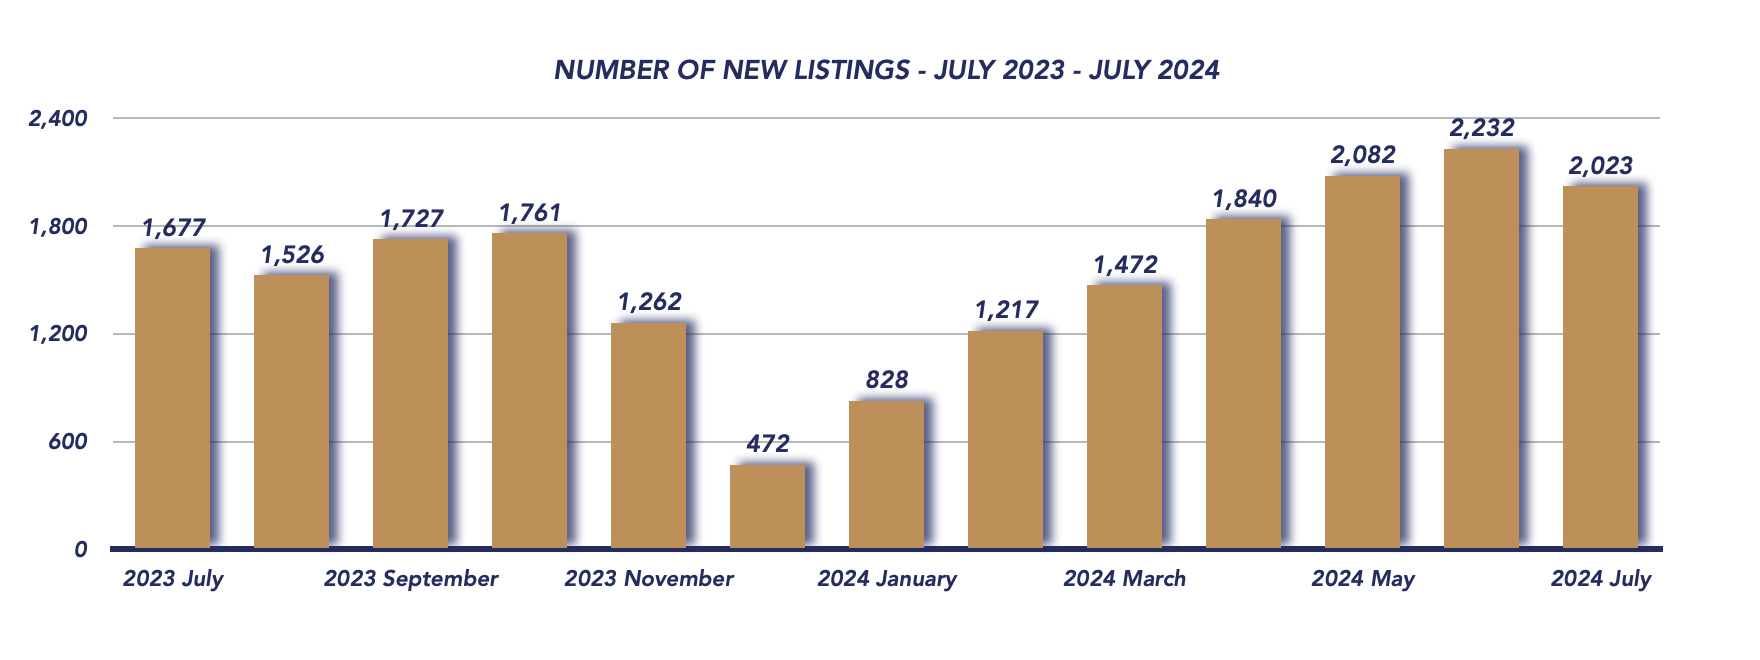
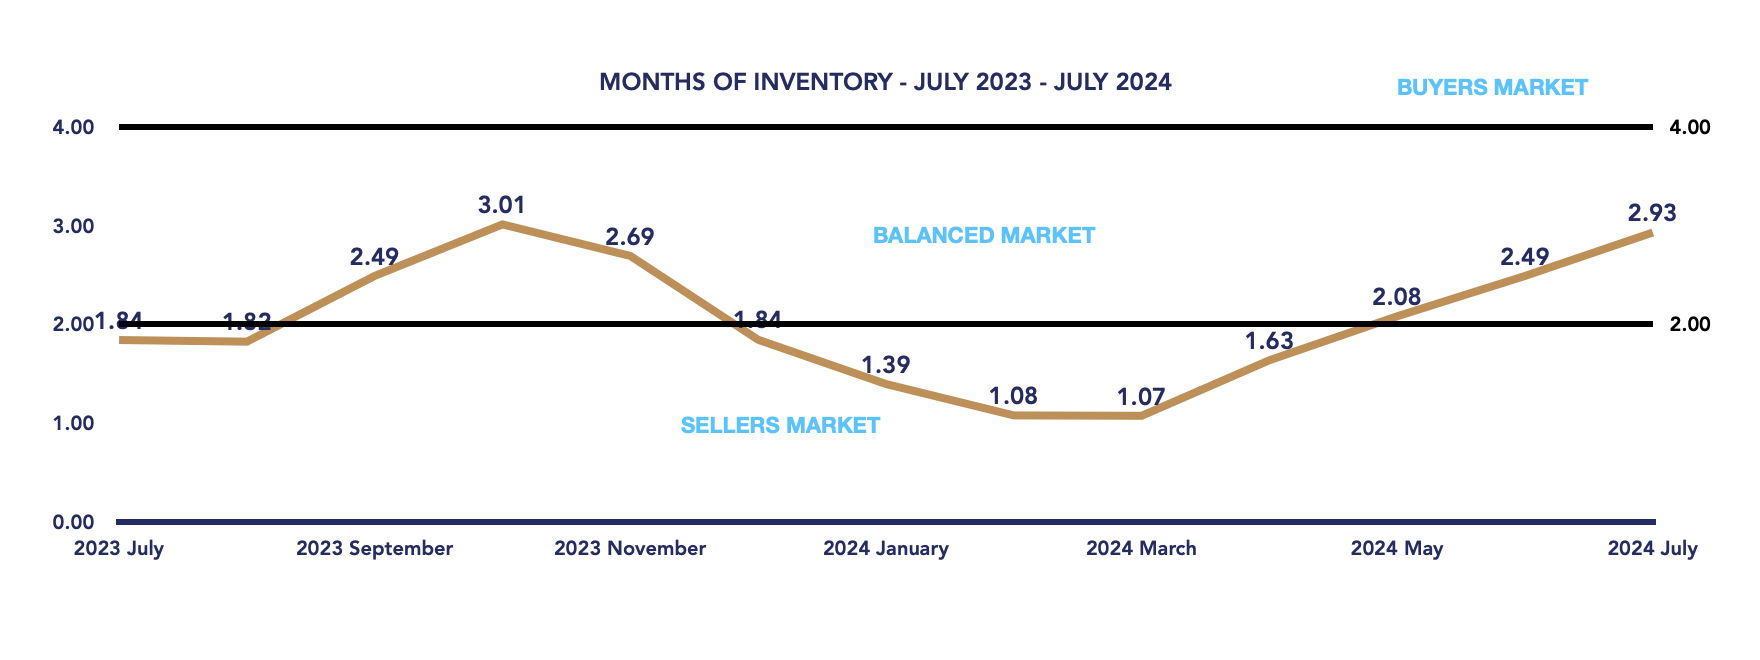
In July 2024, the real estate market in Durham Region saw a slight cooling compared to the previous month. The average sales price decreased to $915,636, down from $956,428 in June 2024 and $961,852 in July 2023. Despite the drop in average prices, total sales for the month were 779, which is a small decline from June’s 877 but slightly higher than the 770 sales recorded in July 2023. New listings also dropped to 2,023 from 2,232 in June, yet they remained above the 1,677 new listings from the previous year. The months of inventory rose slightly to 2.93, indicating that the market remains balanced.
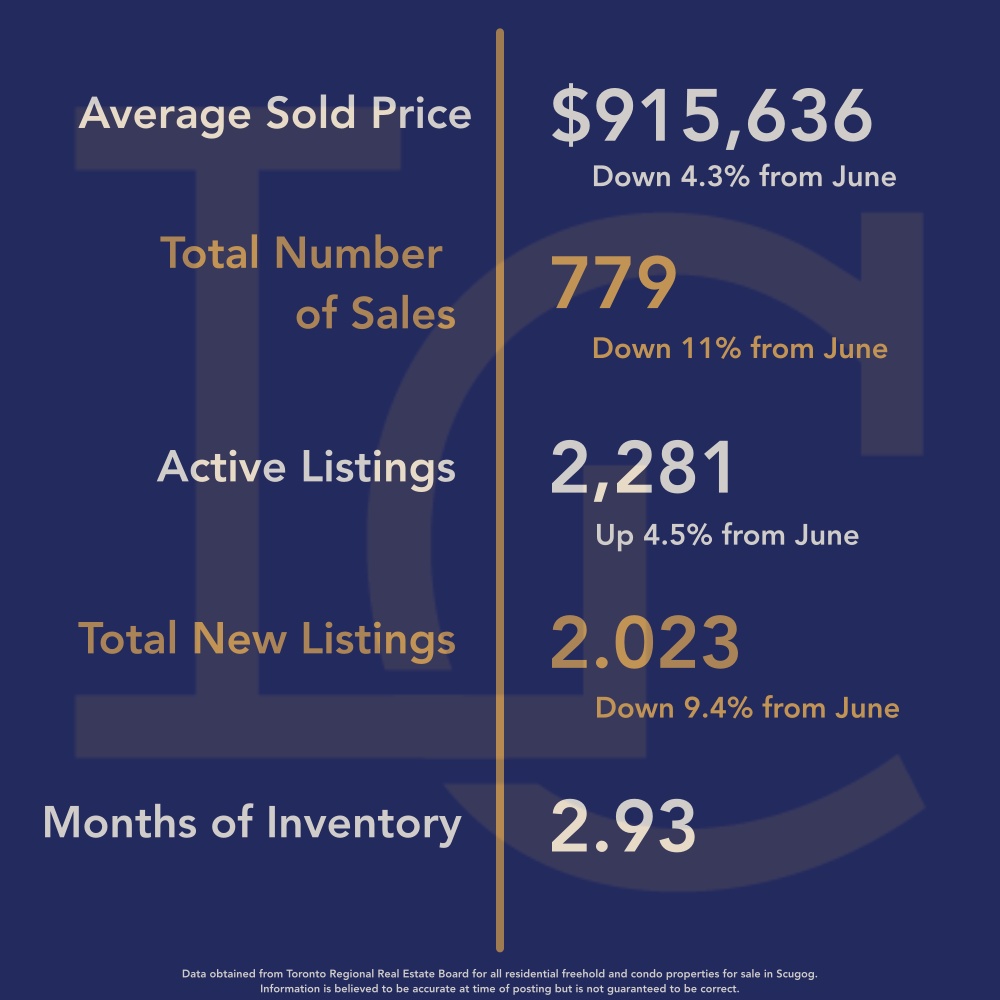
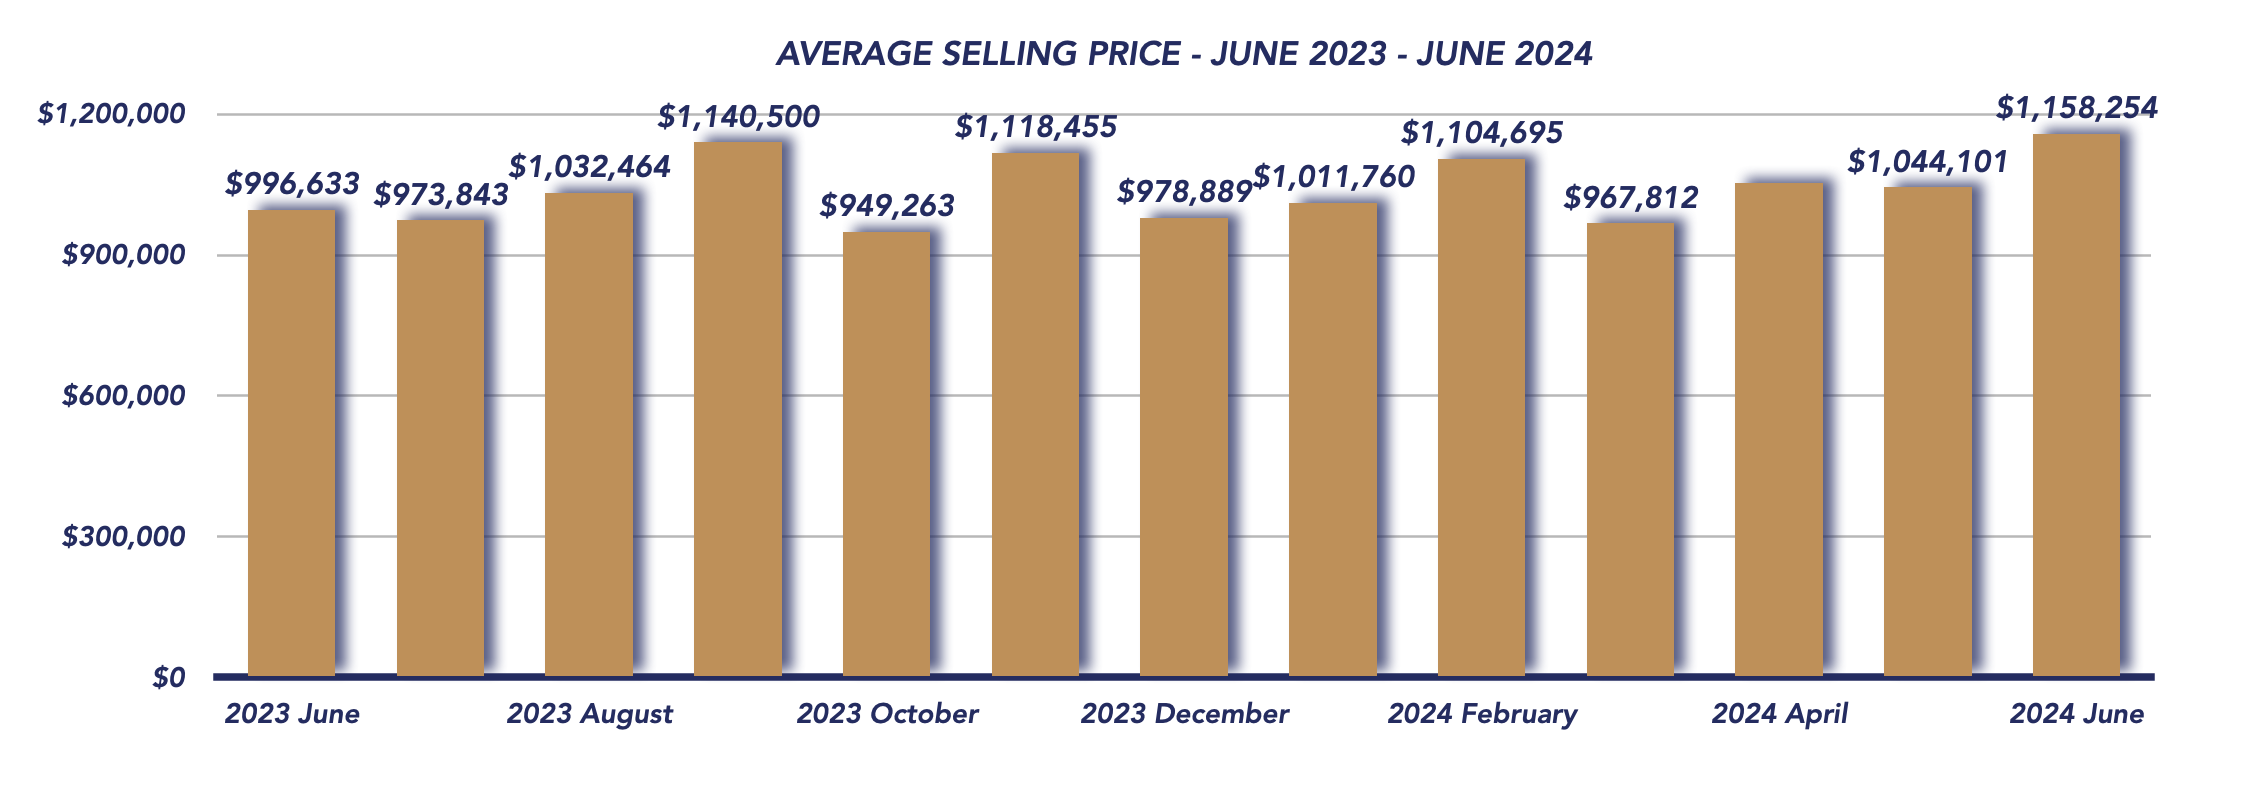
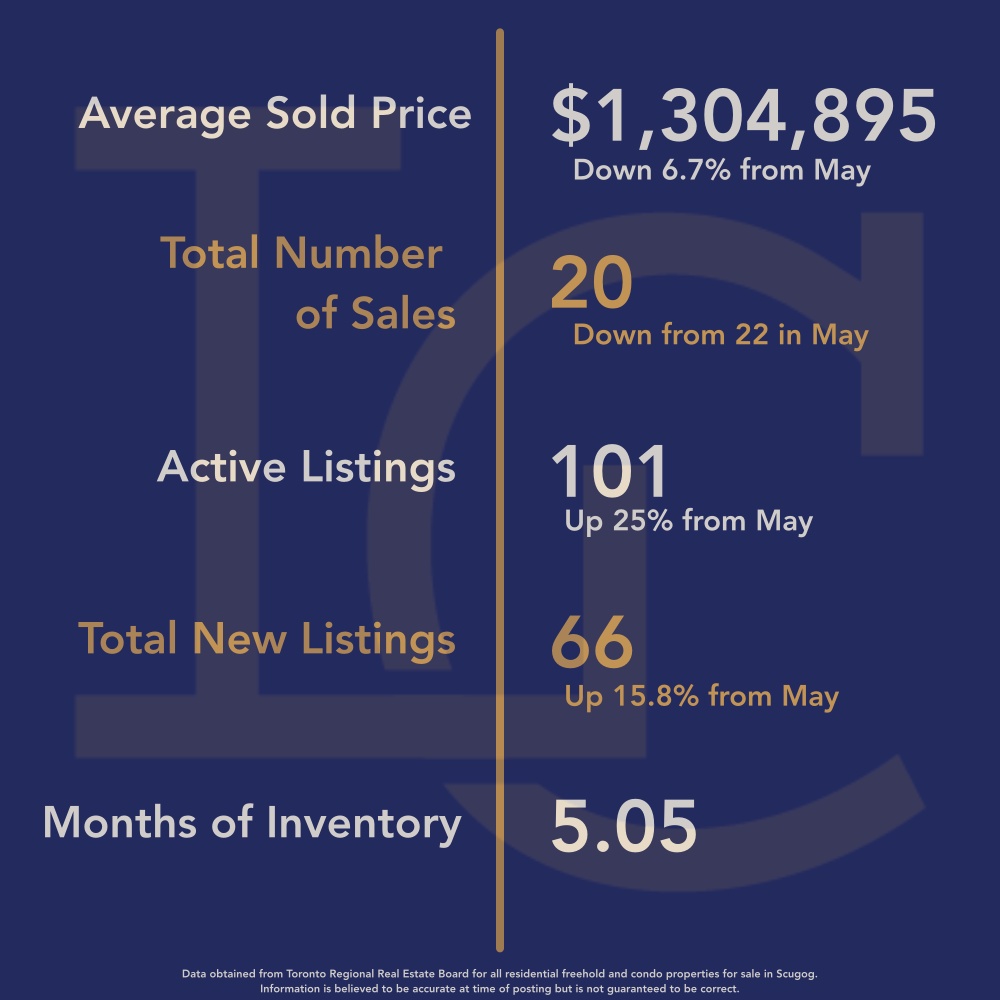
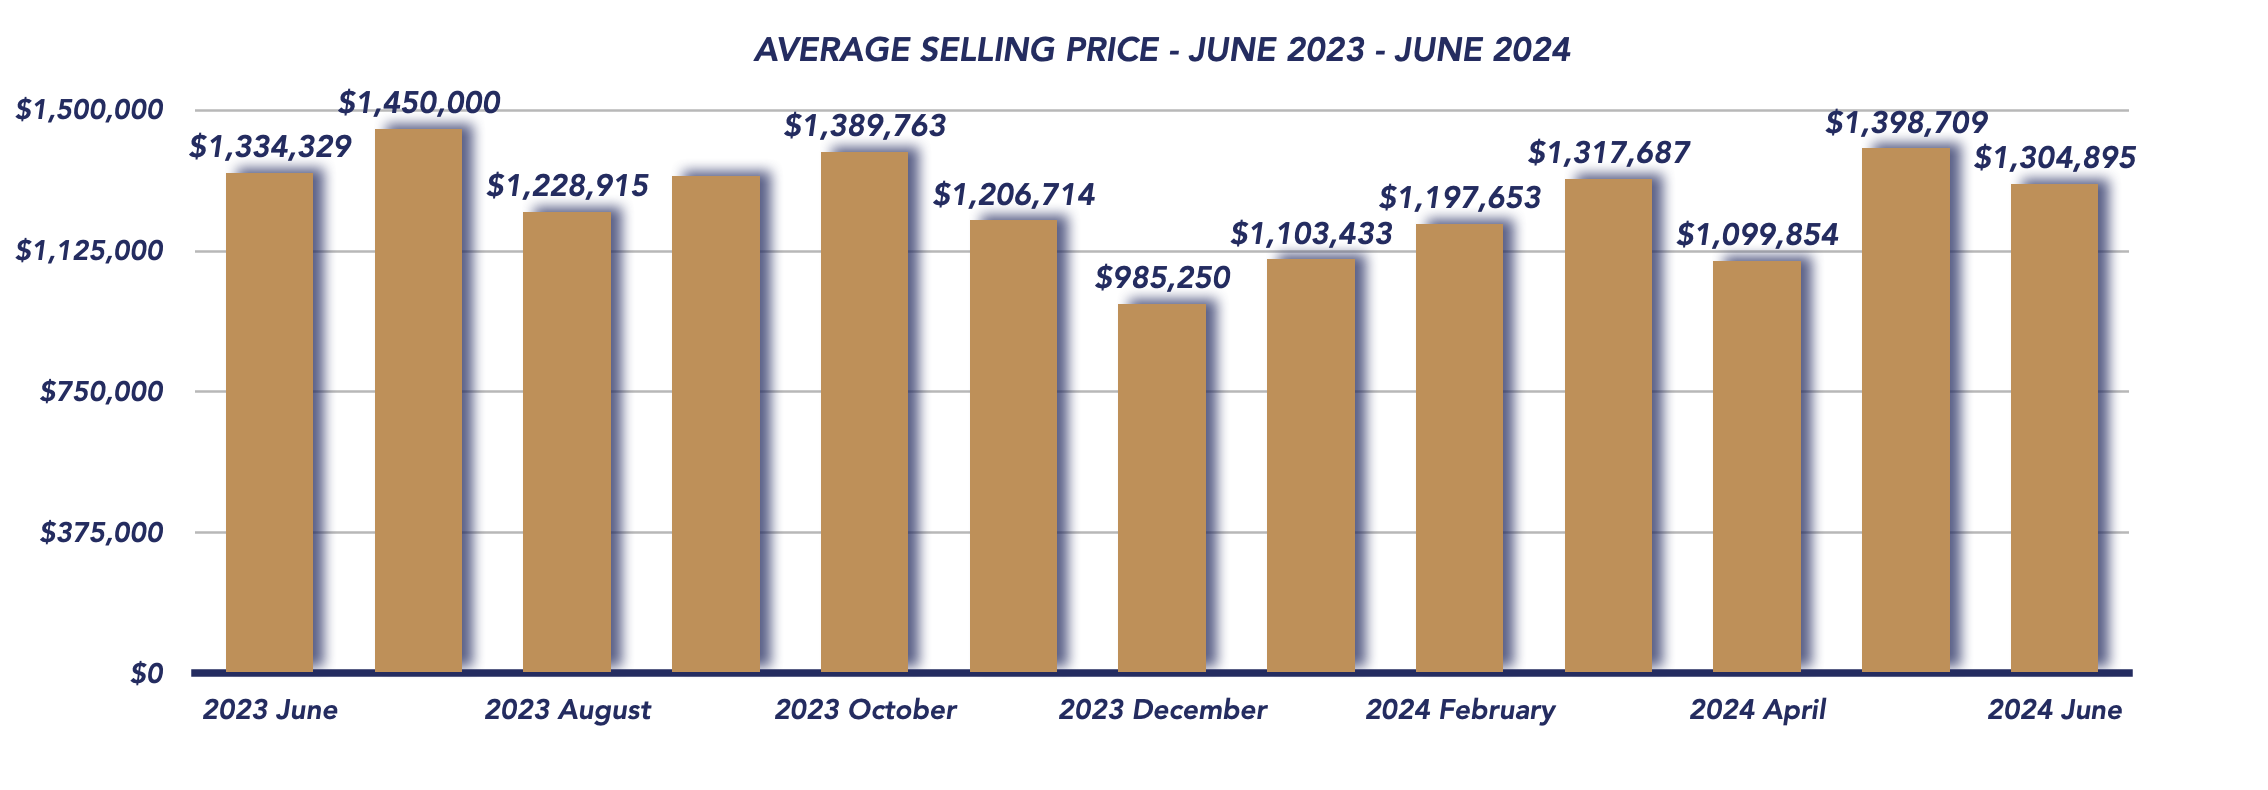
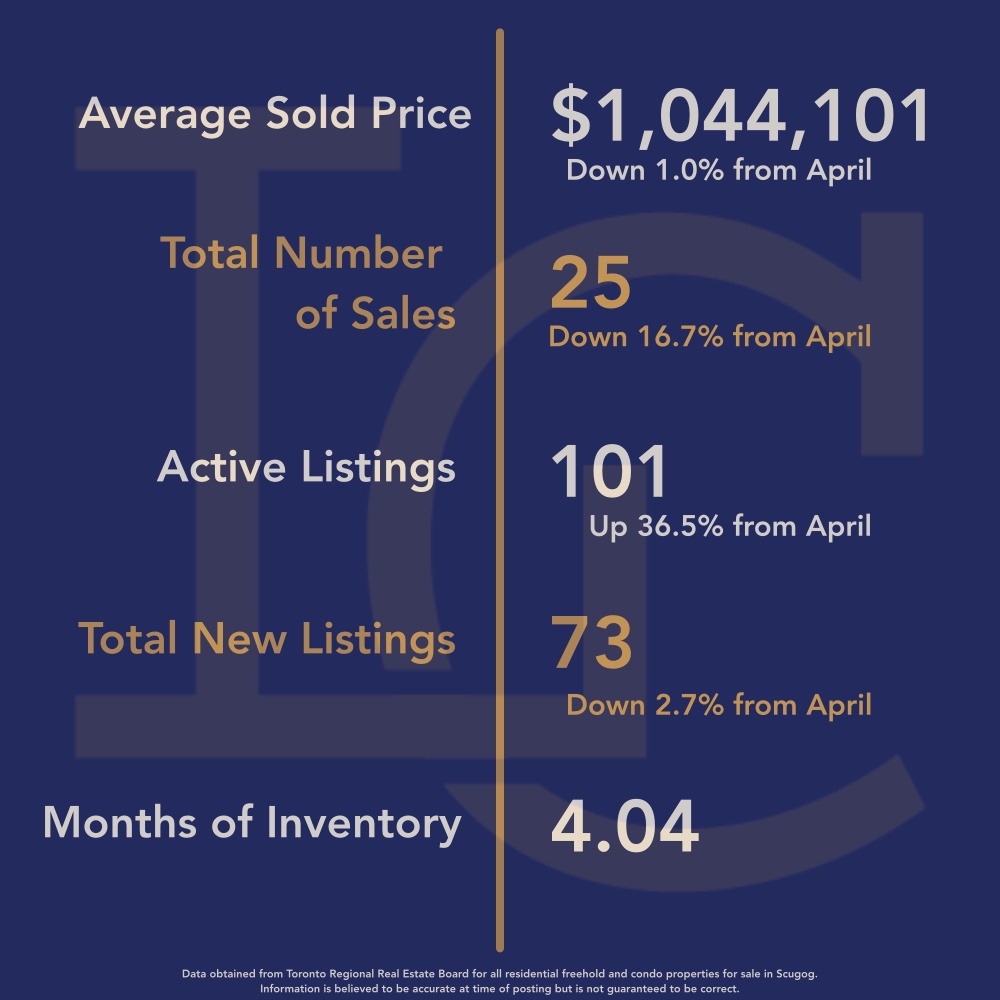
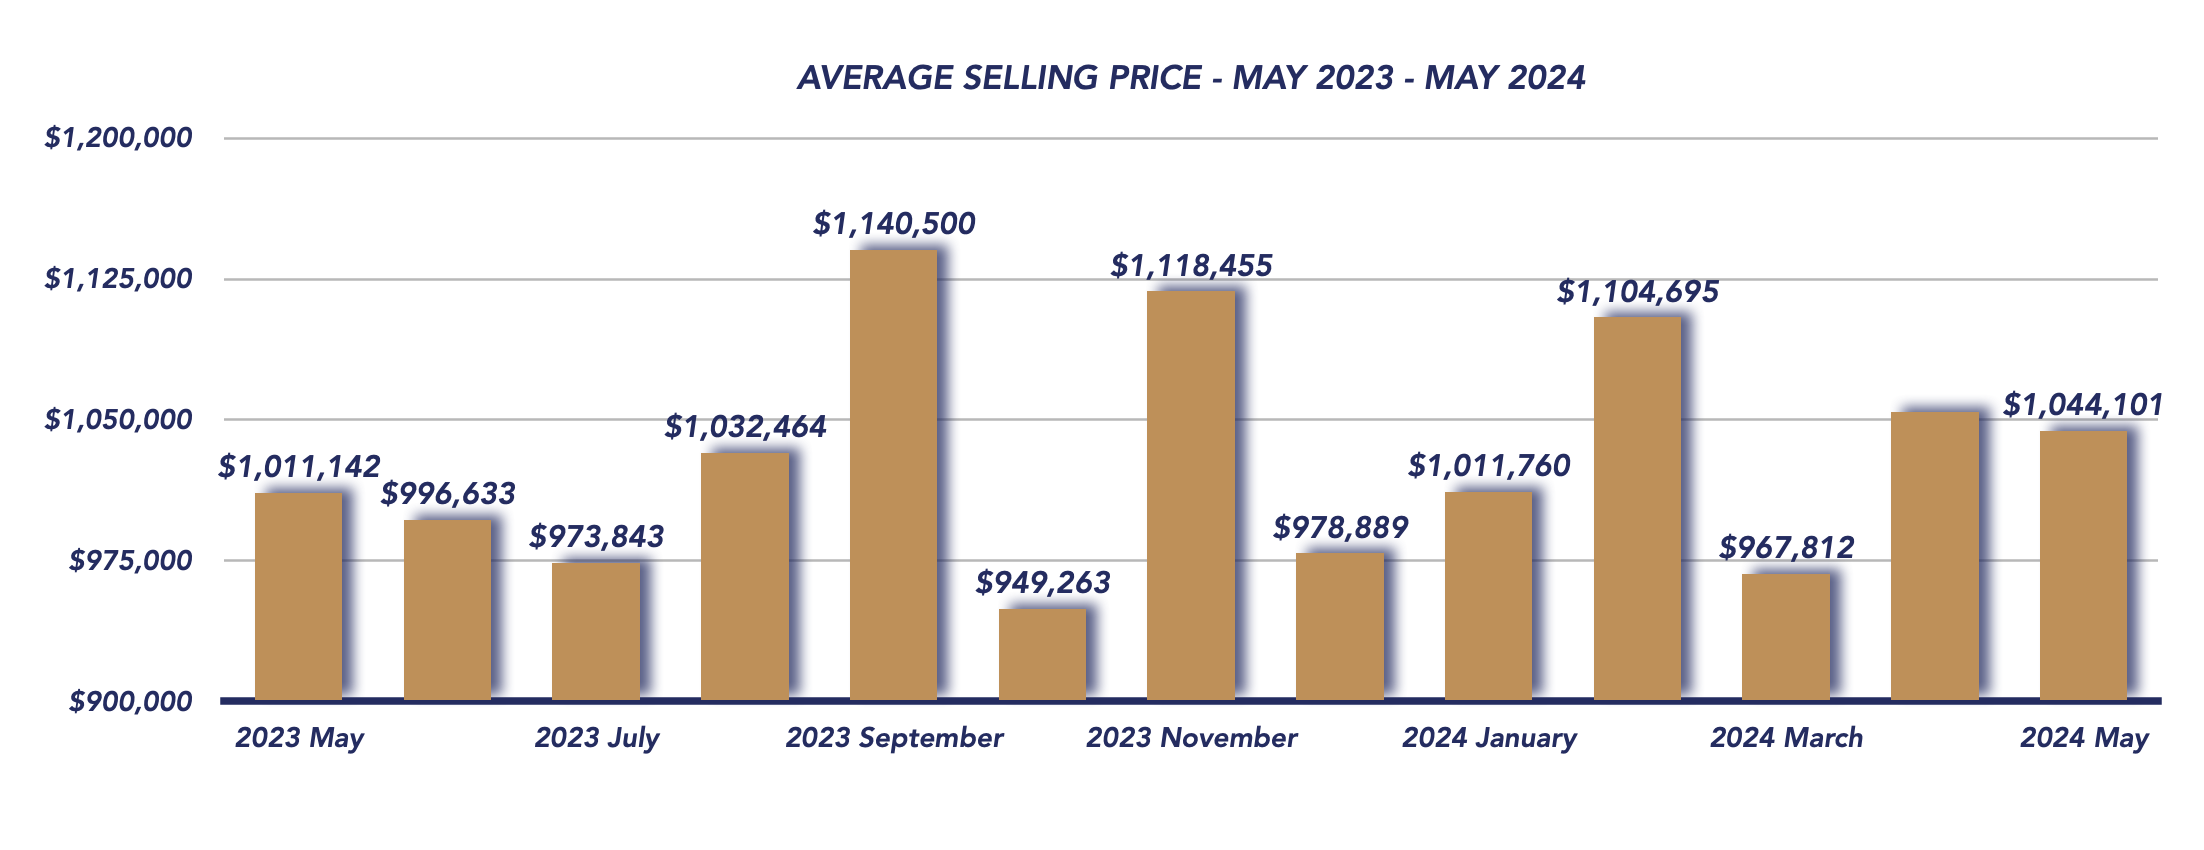
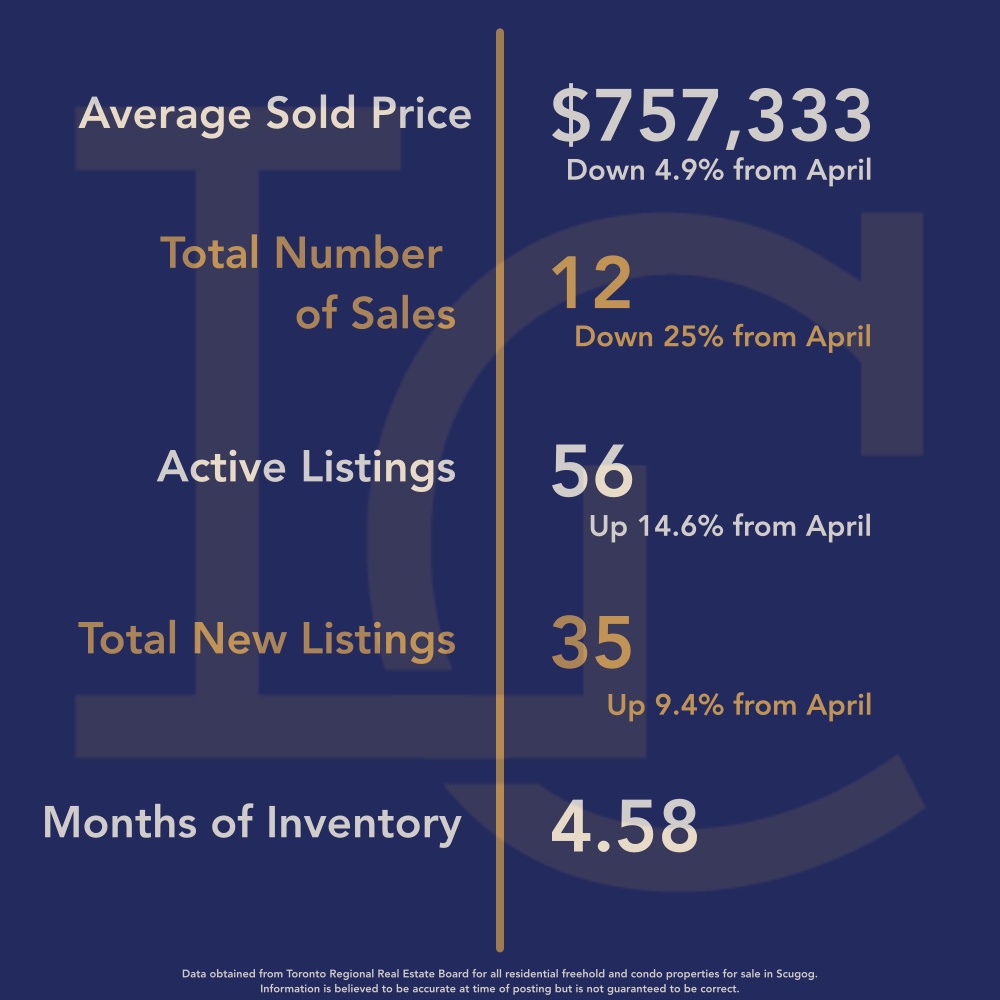
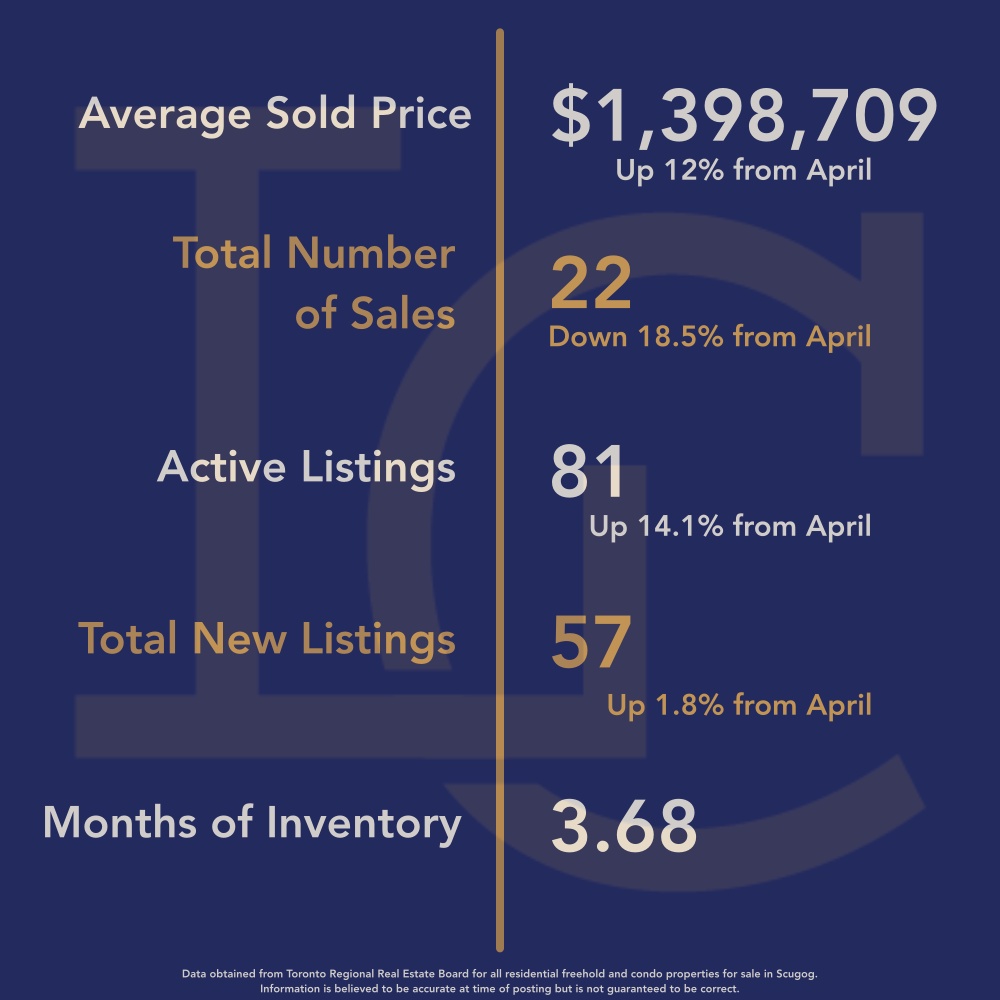
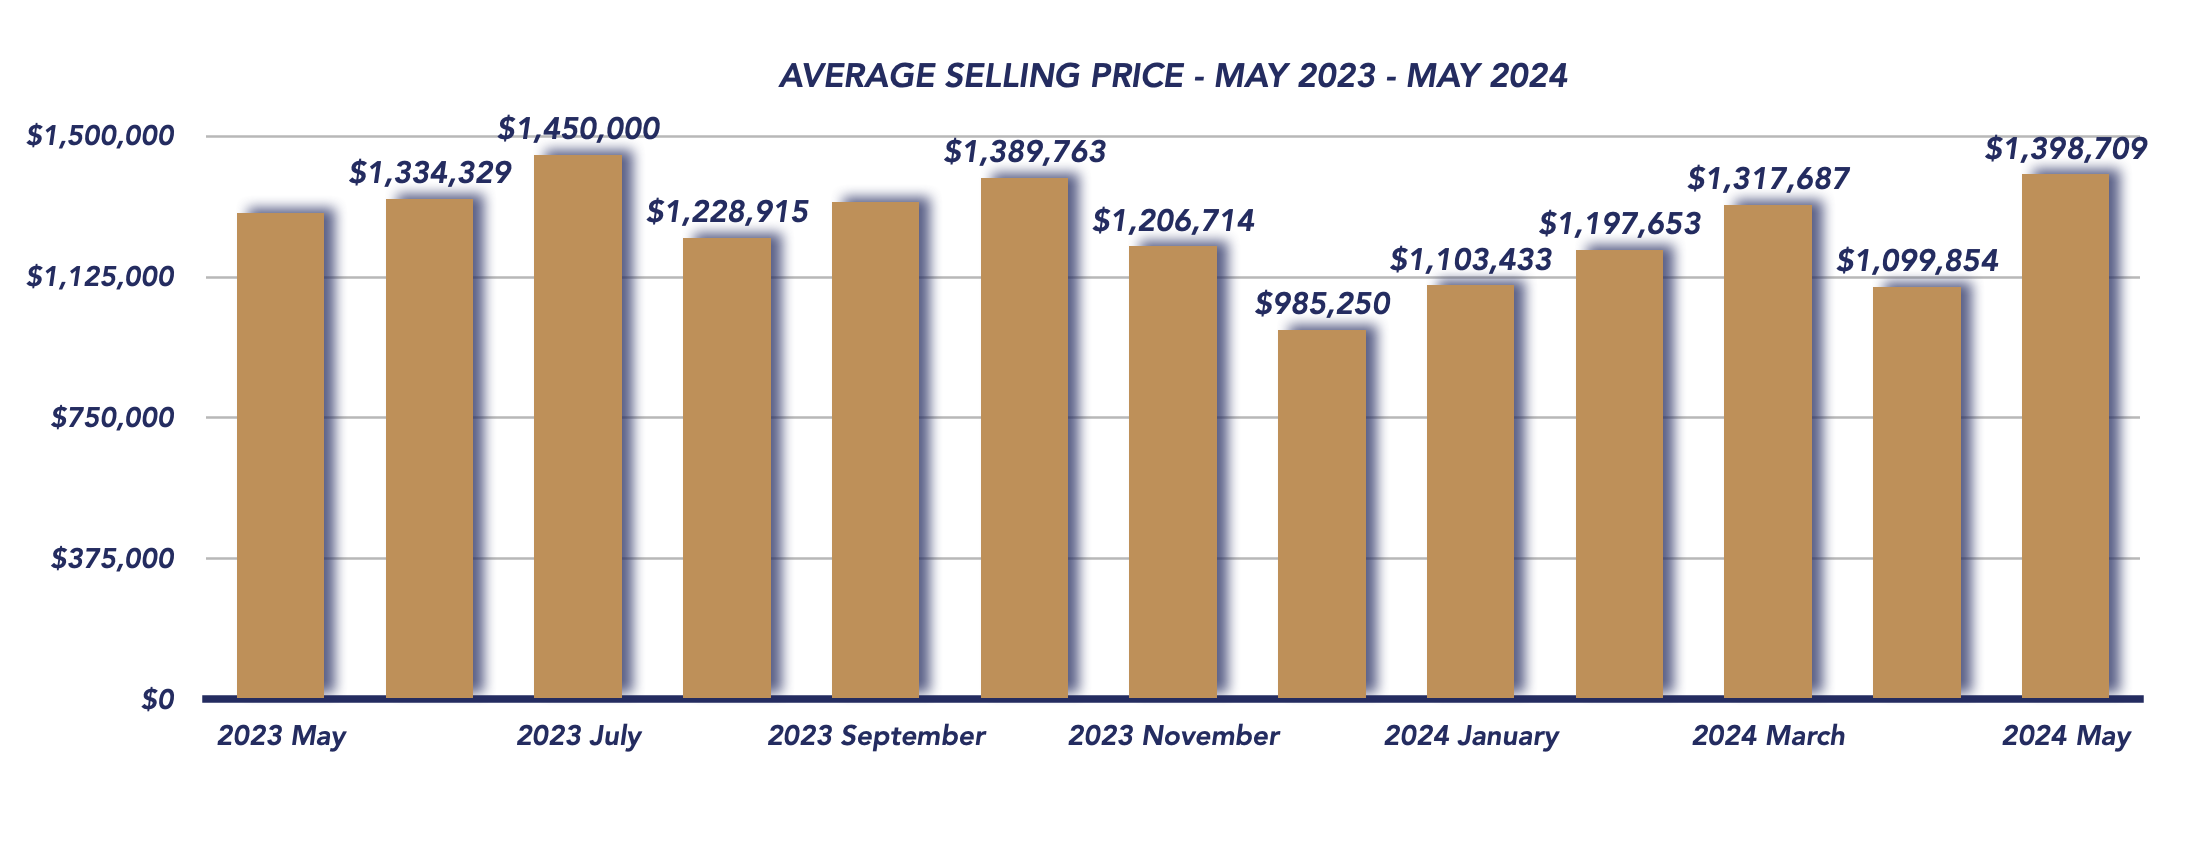
Average Sold Price
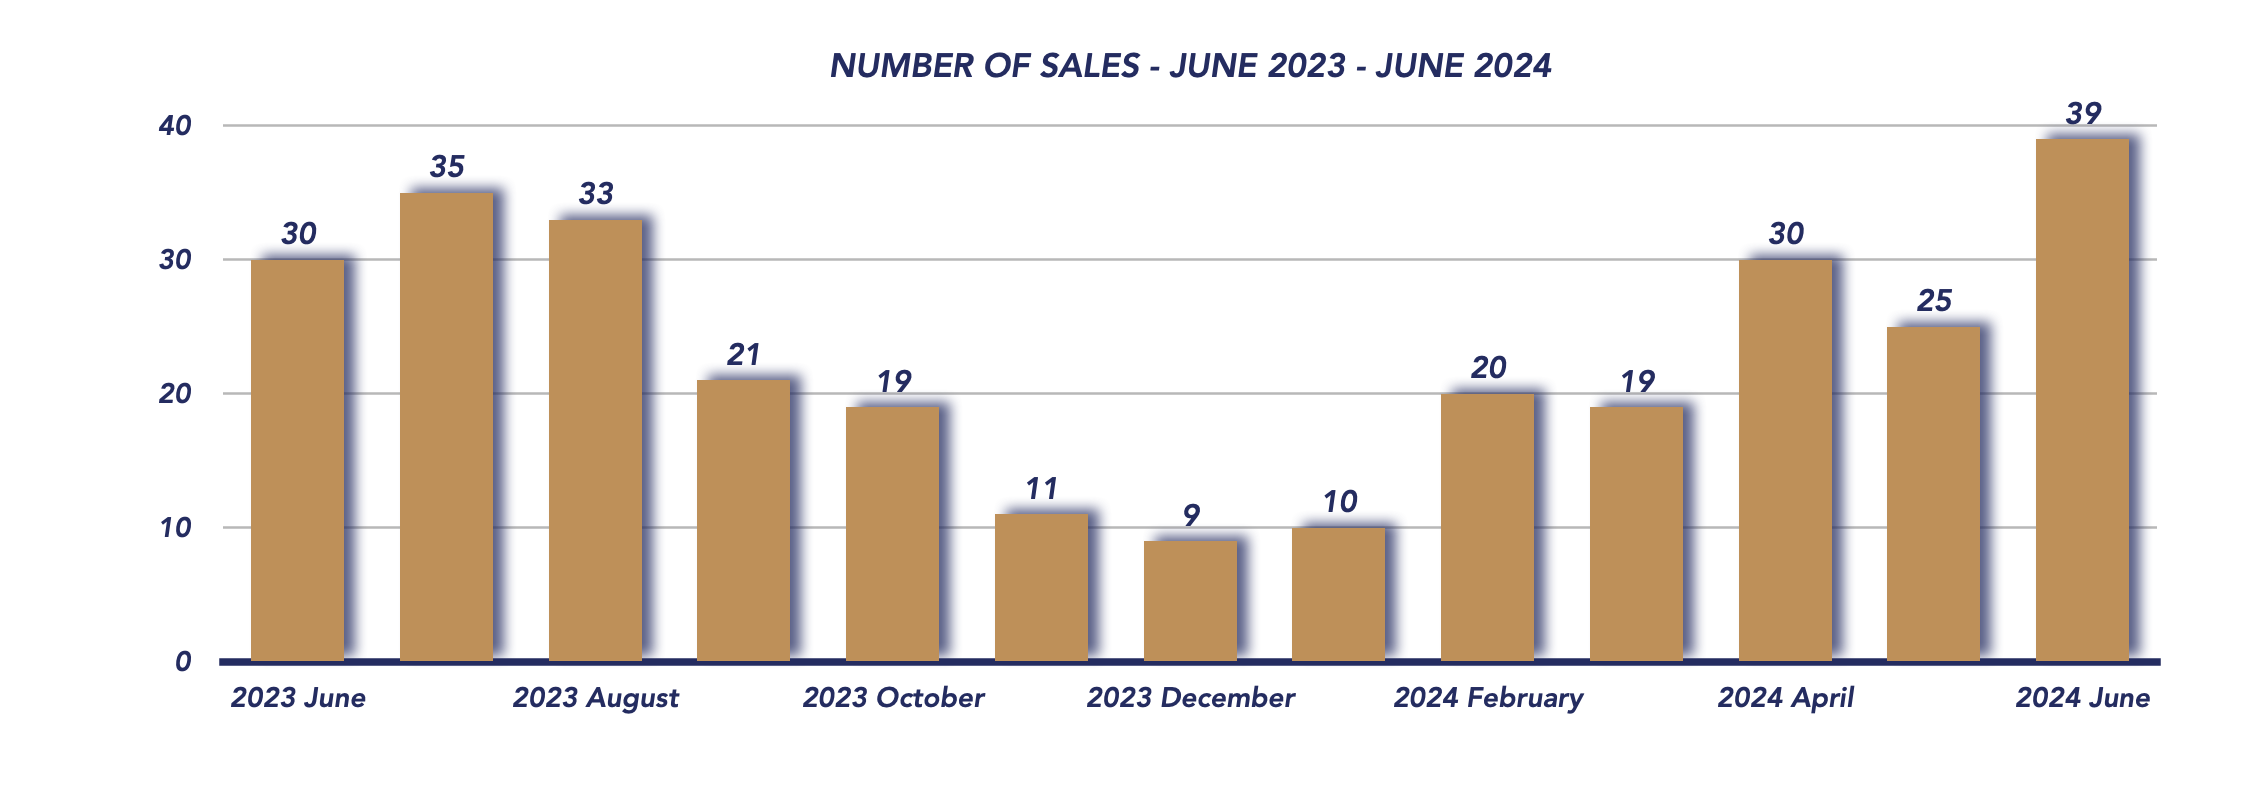
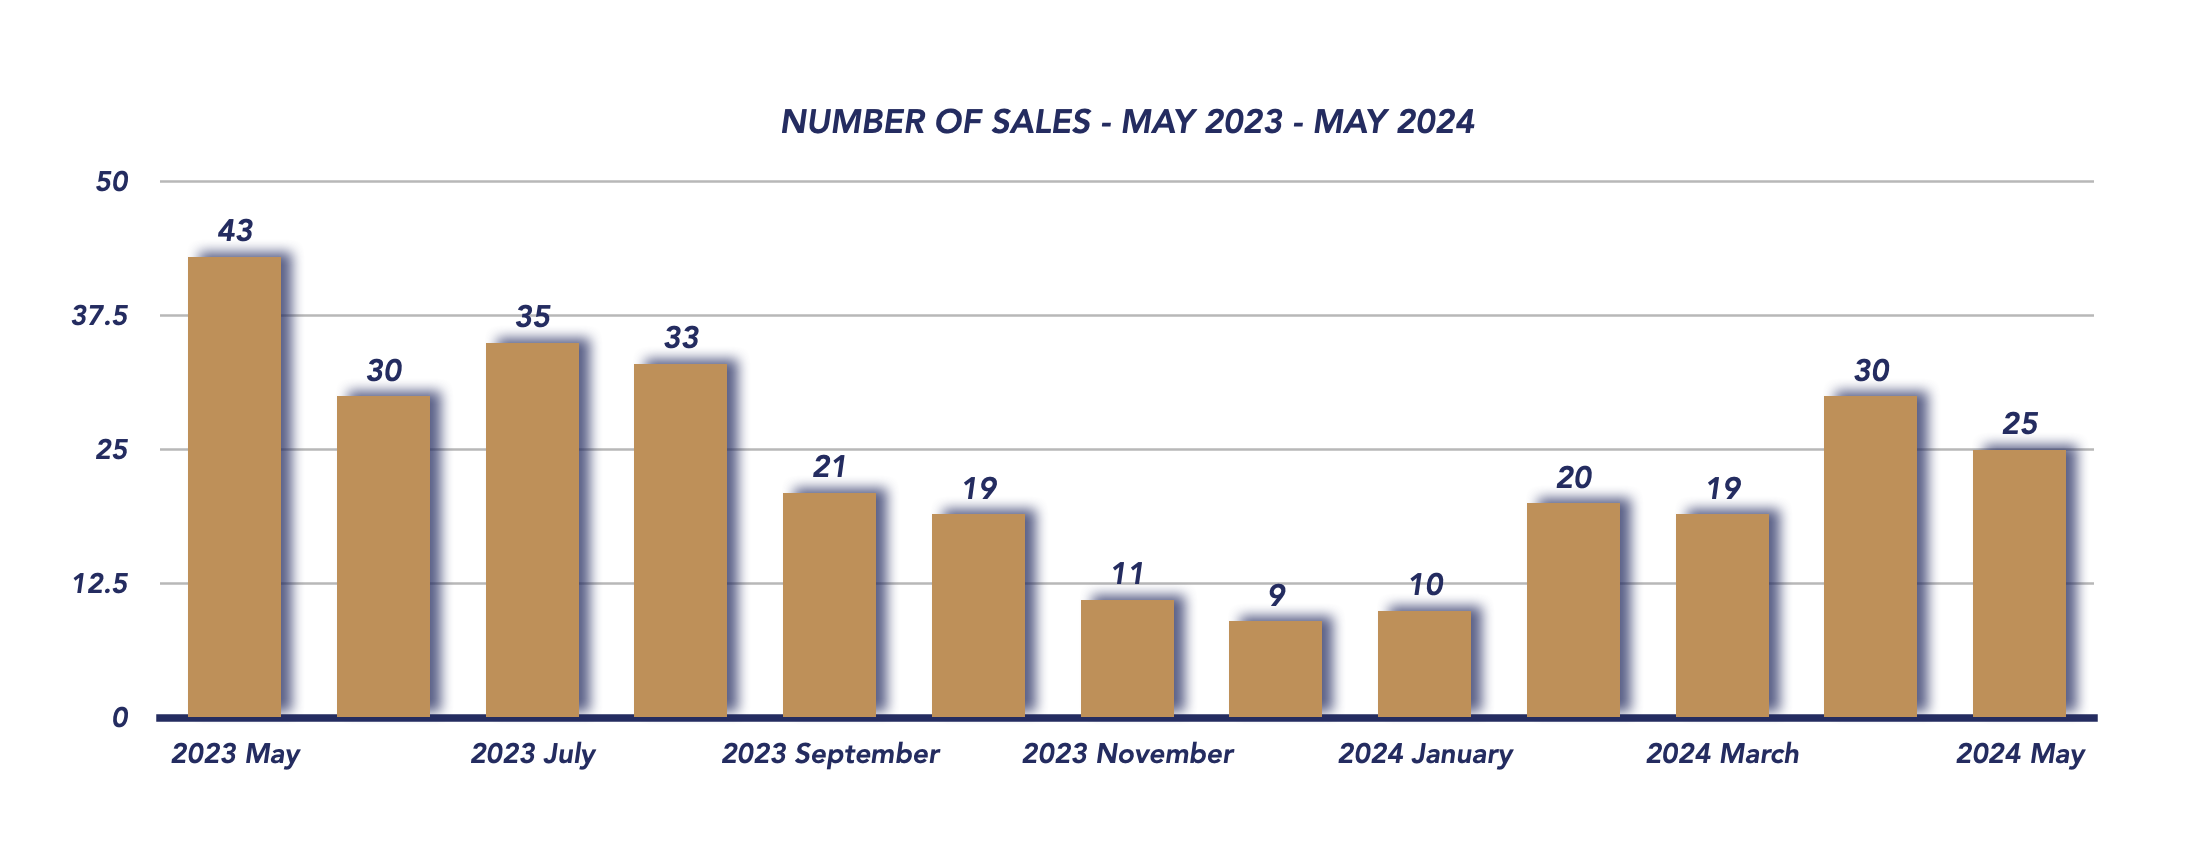
Number of Properties Sold
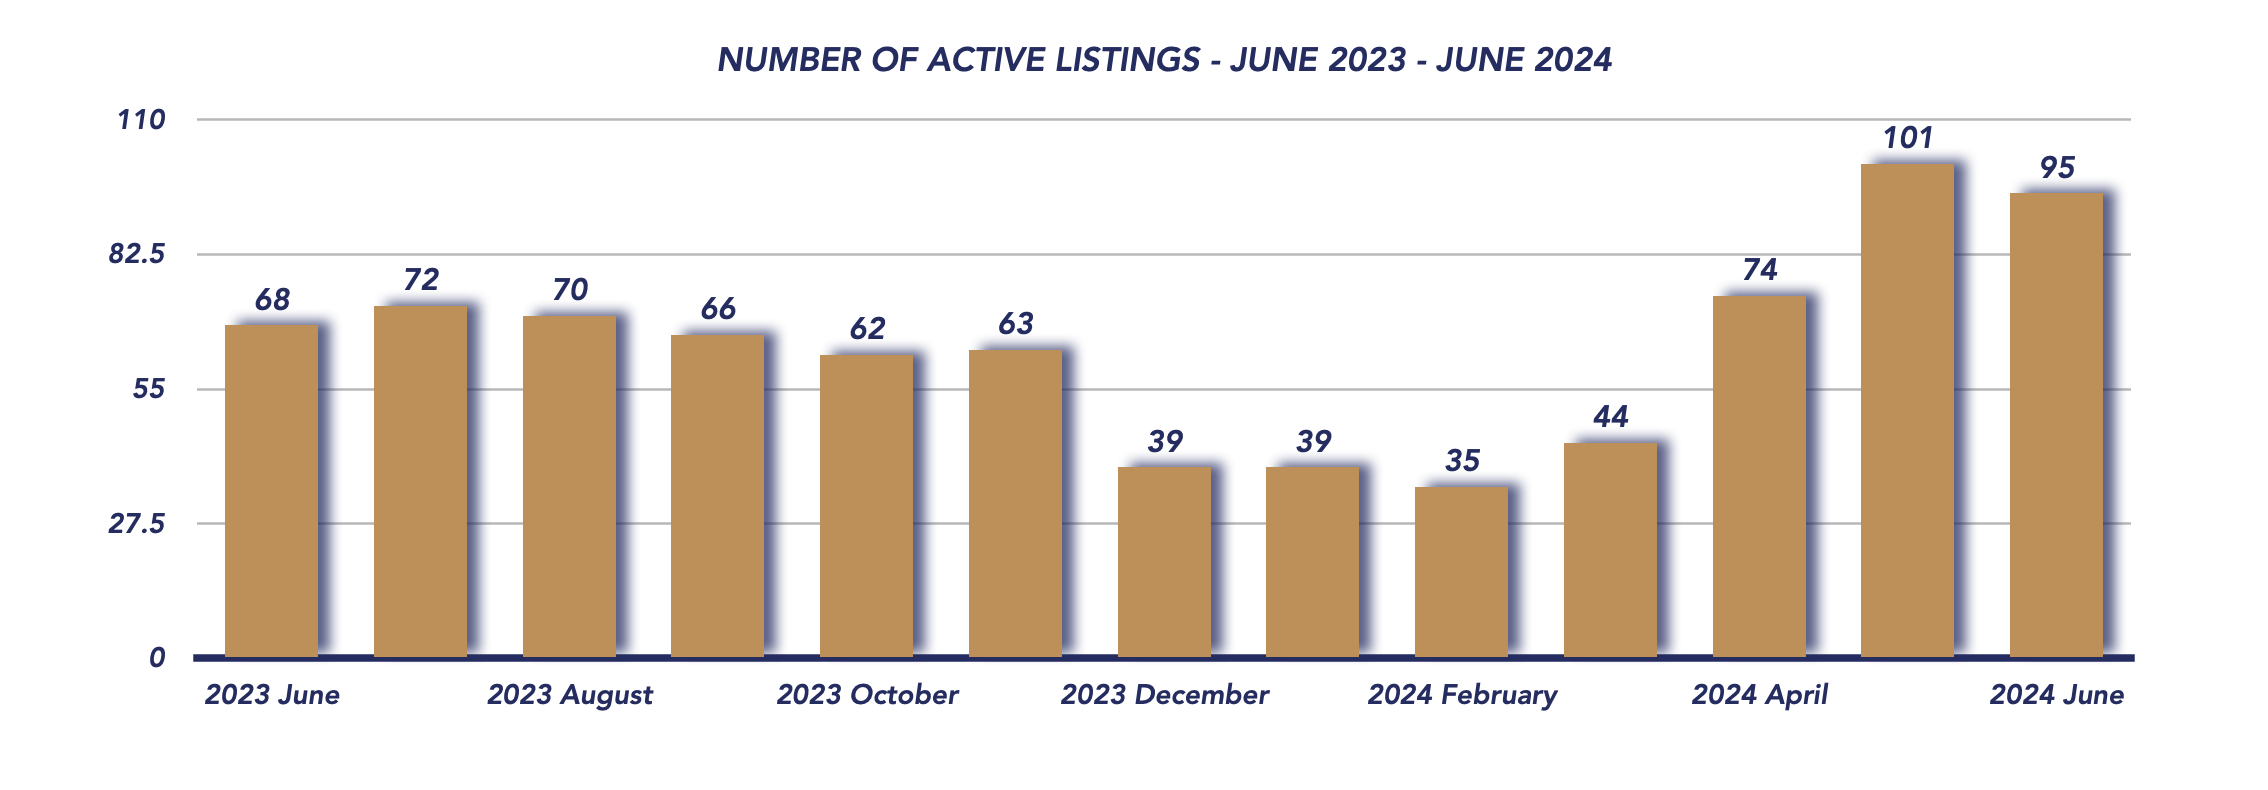
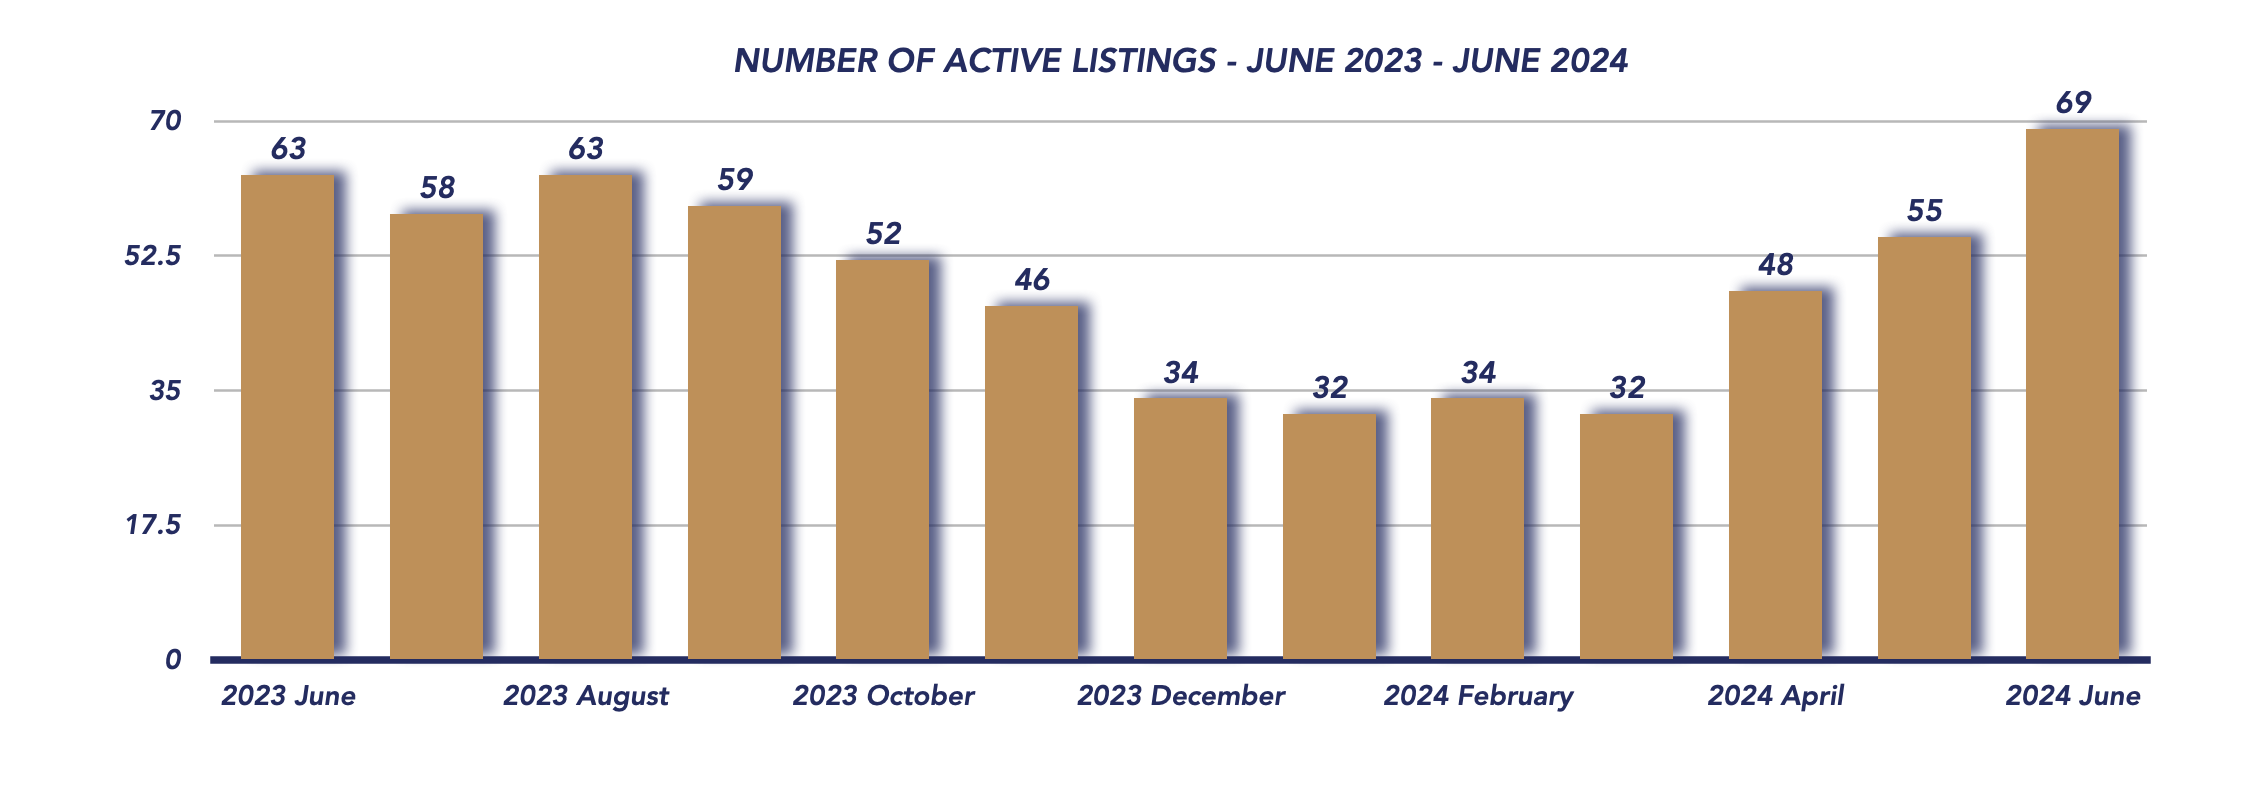
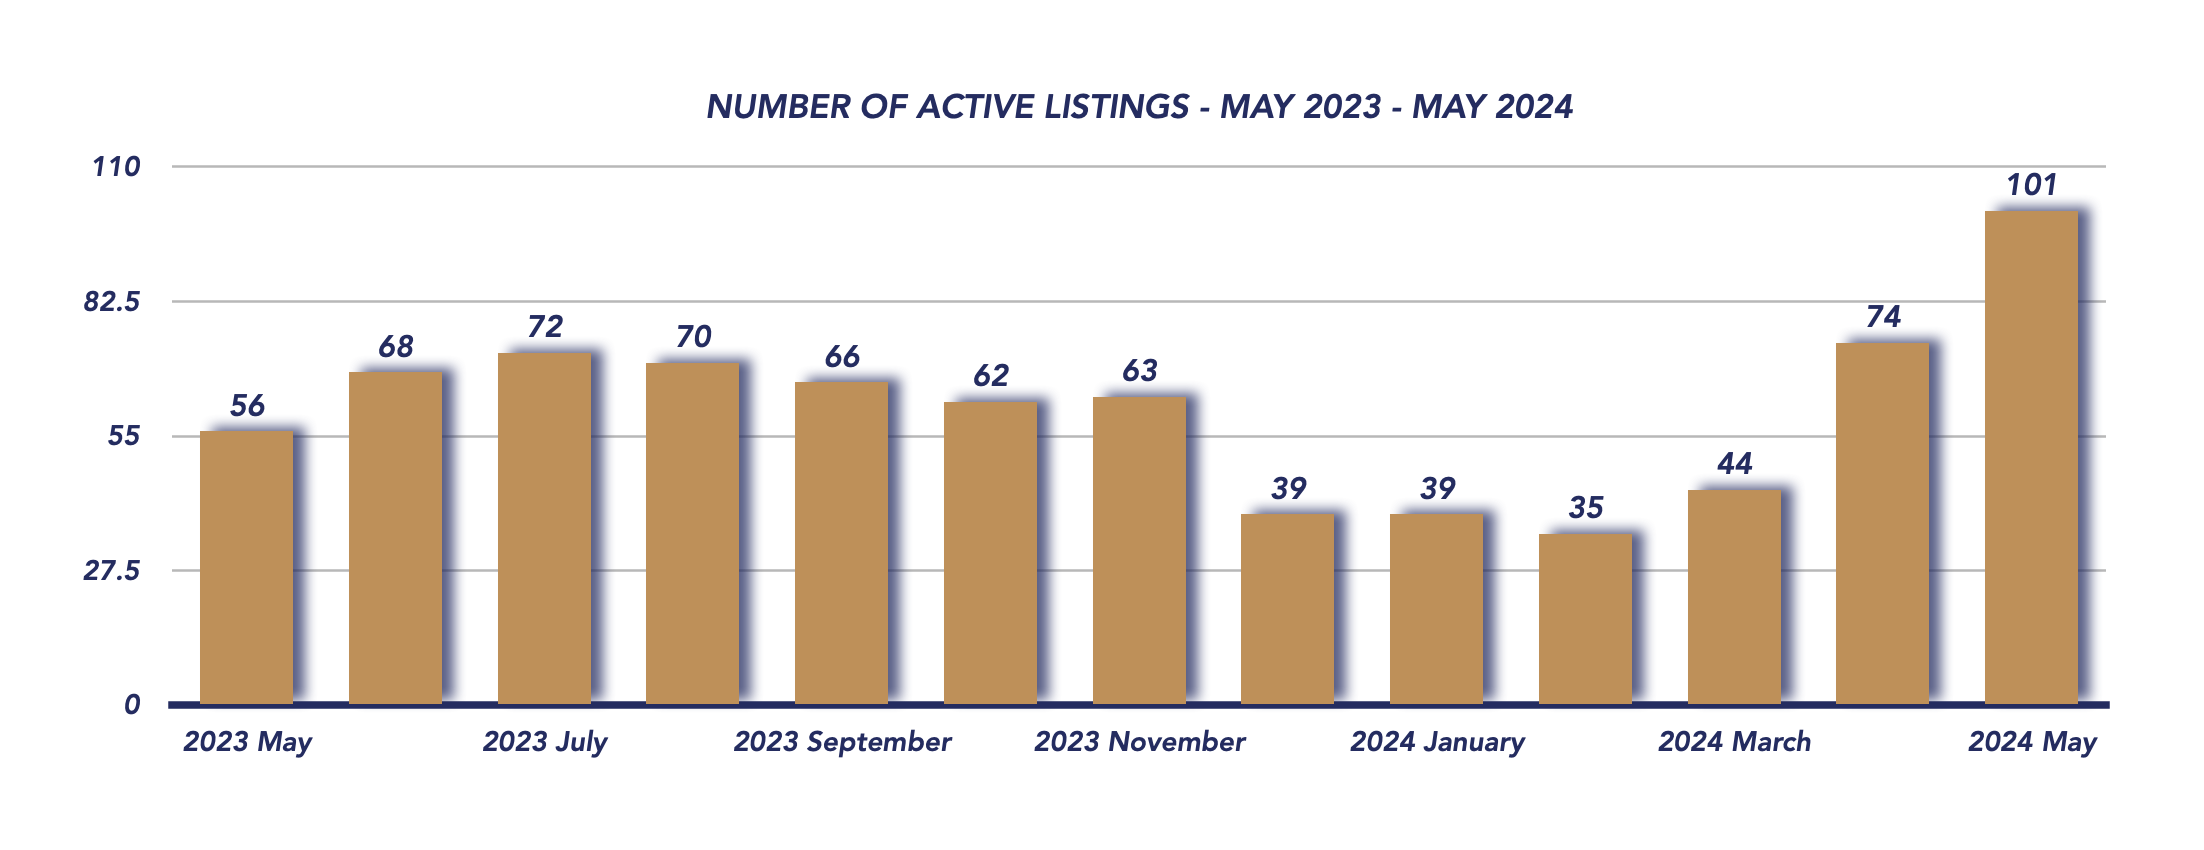
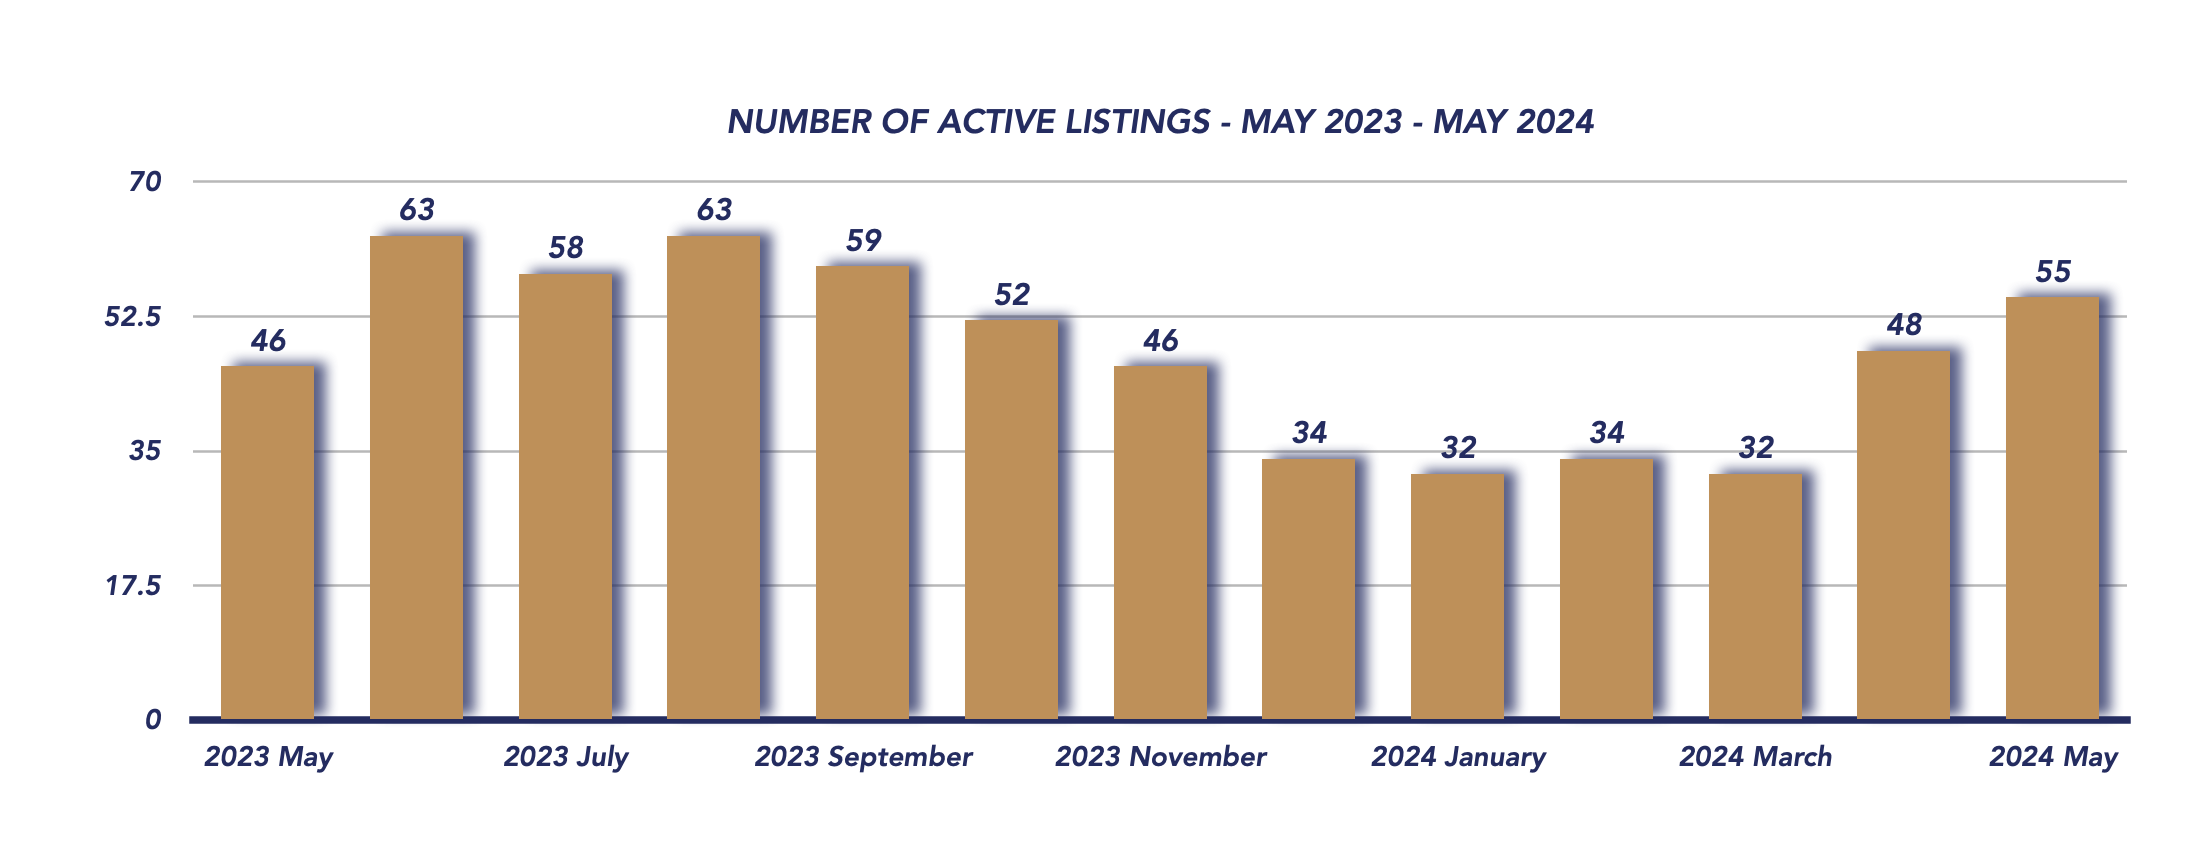
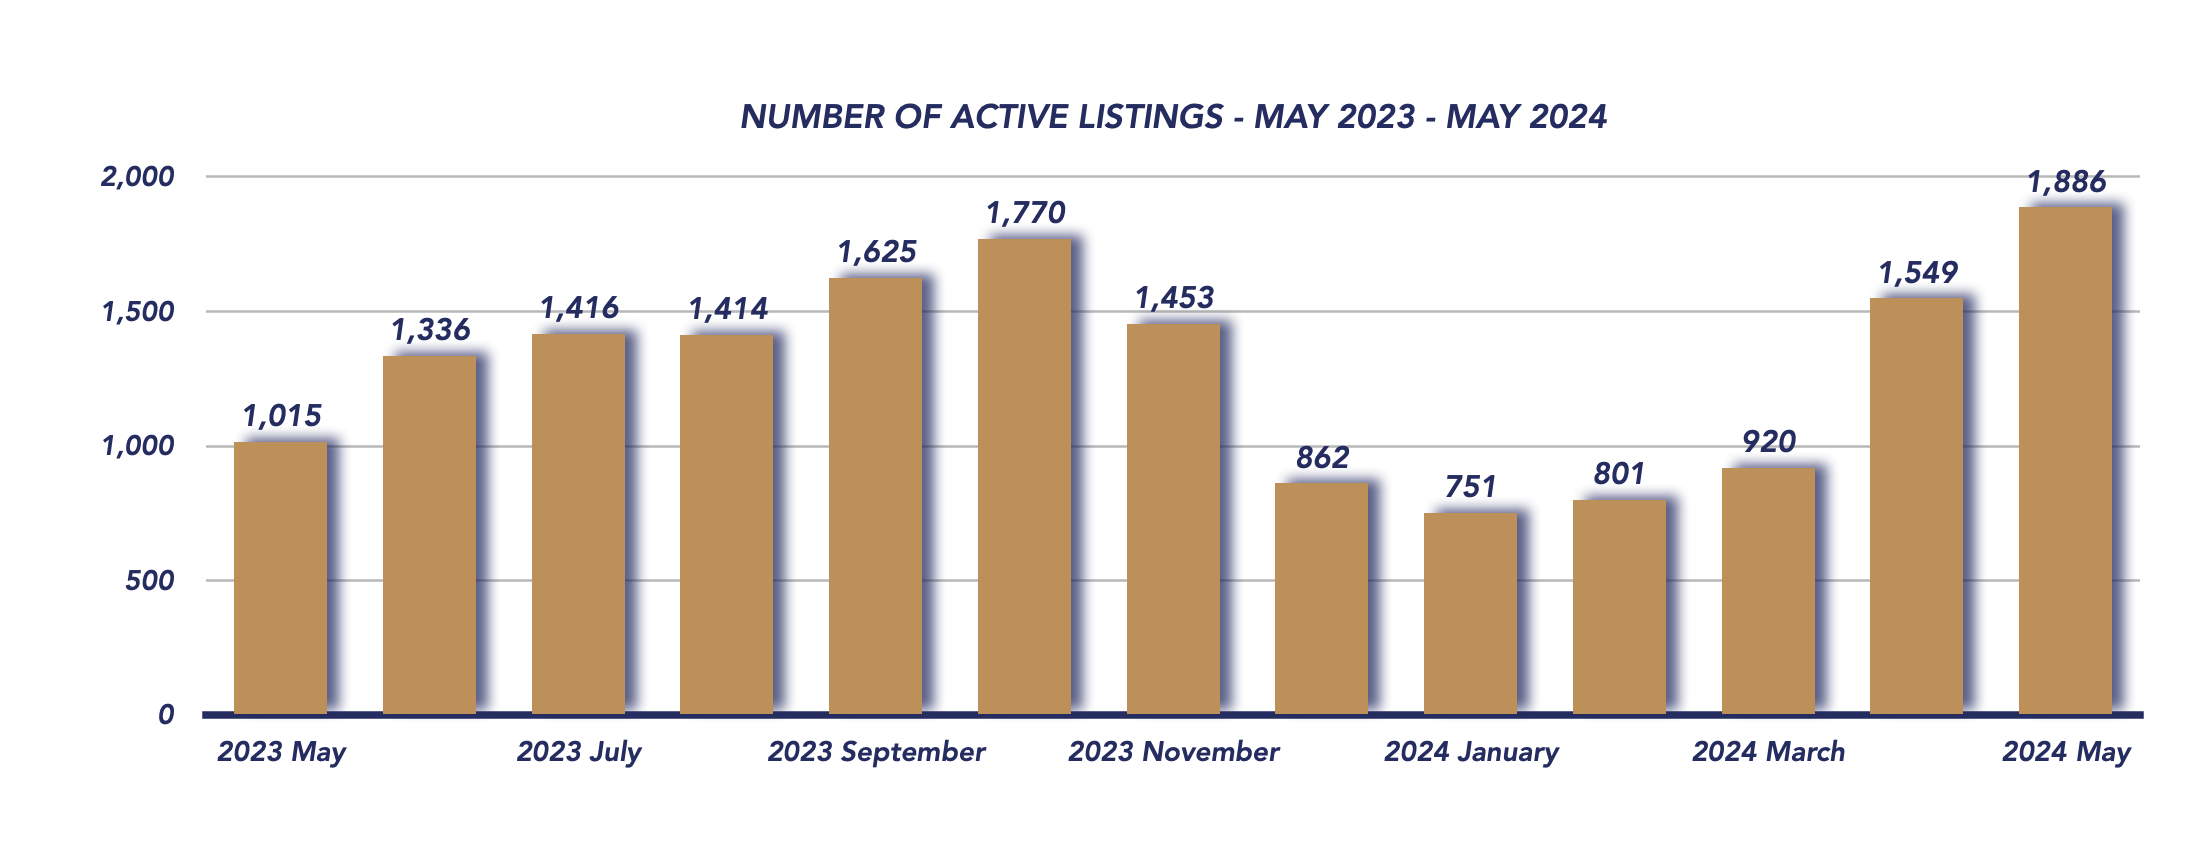
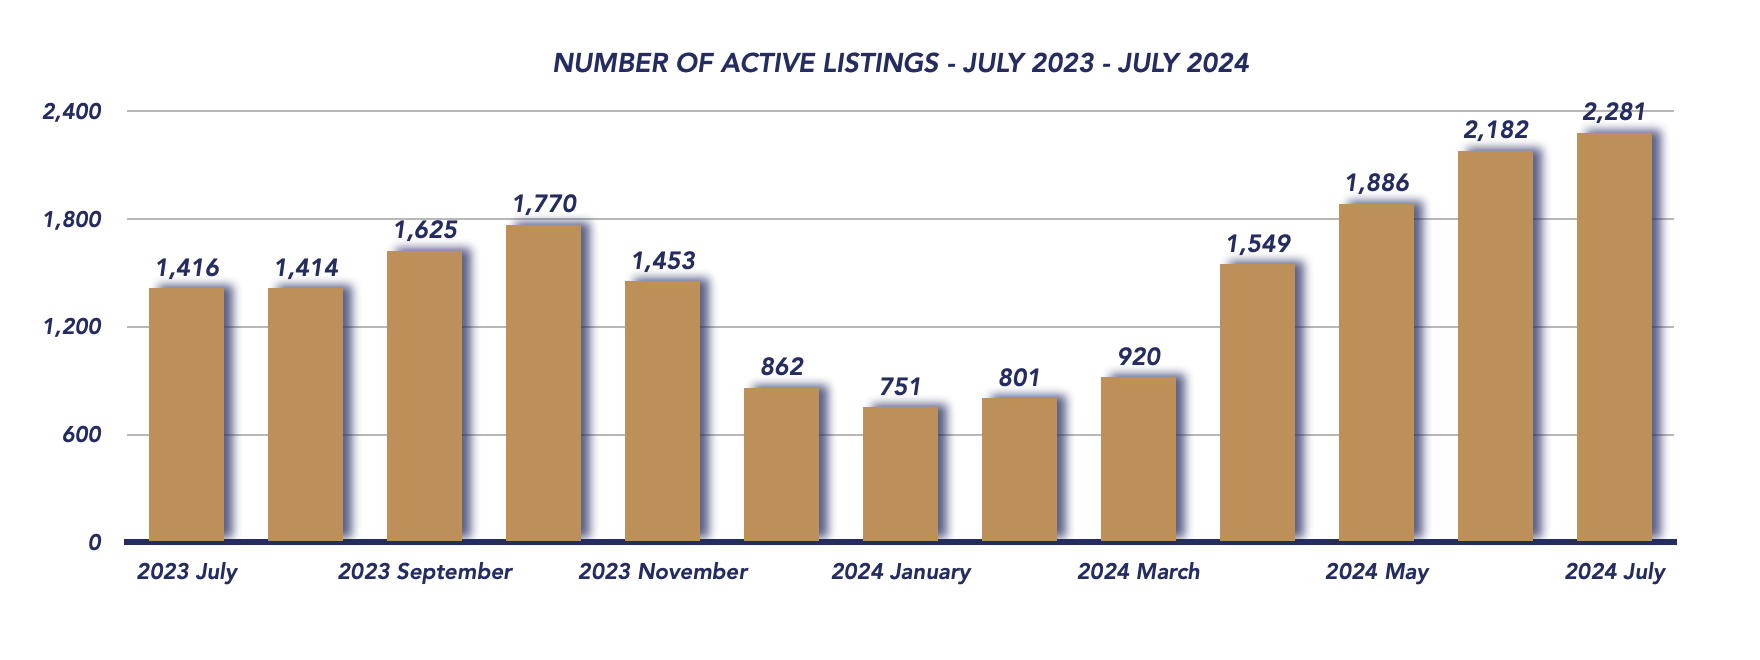
Active Listings
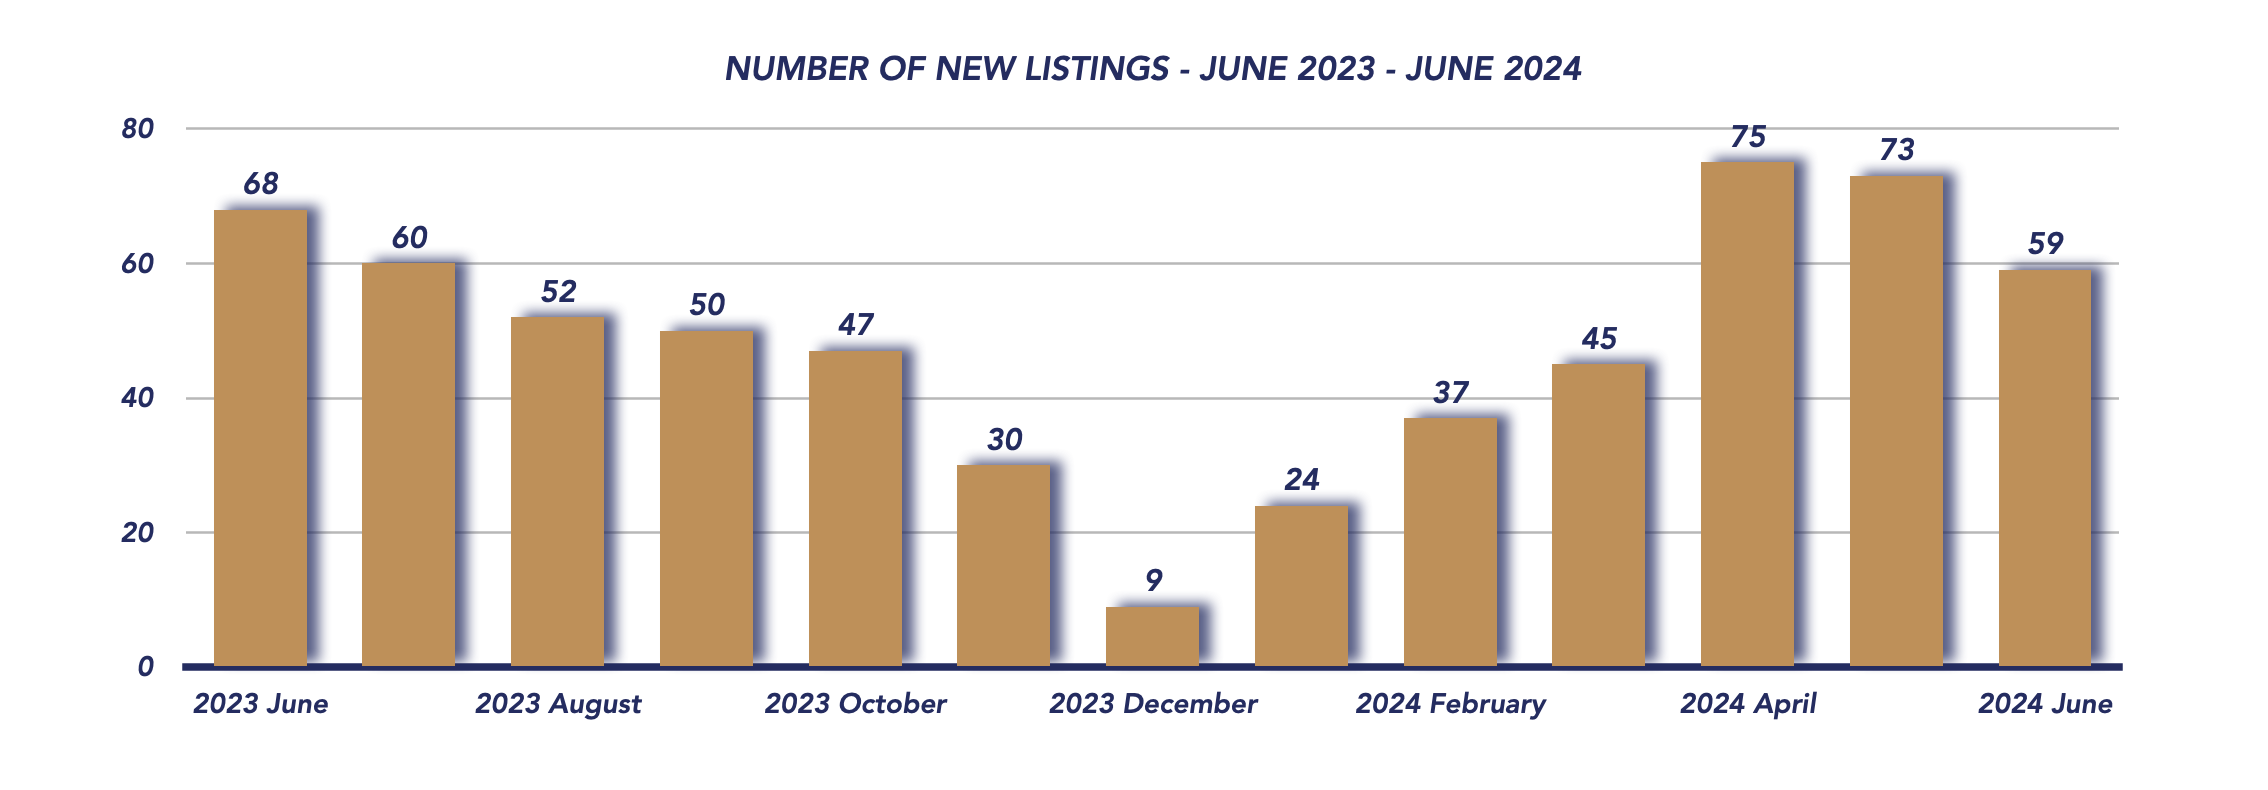
Number of New Listings
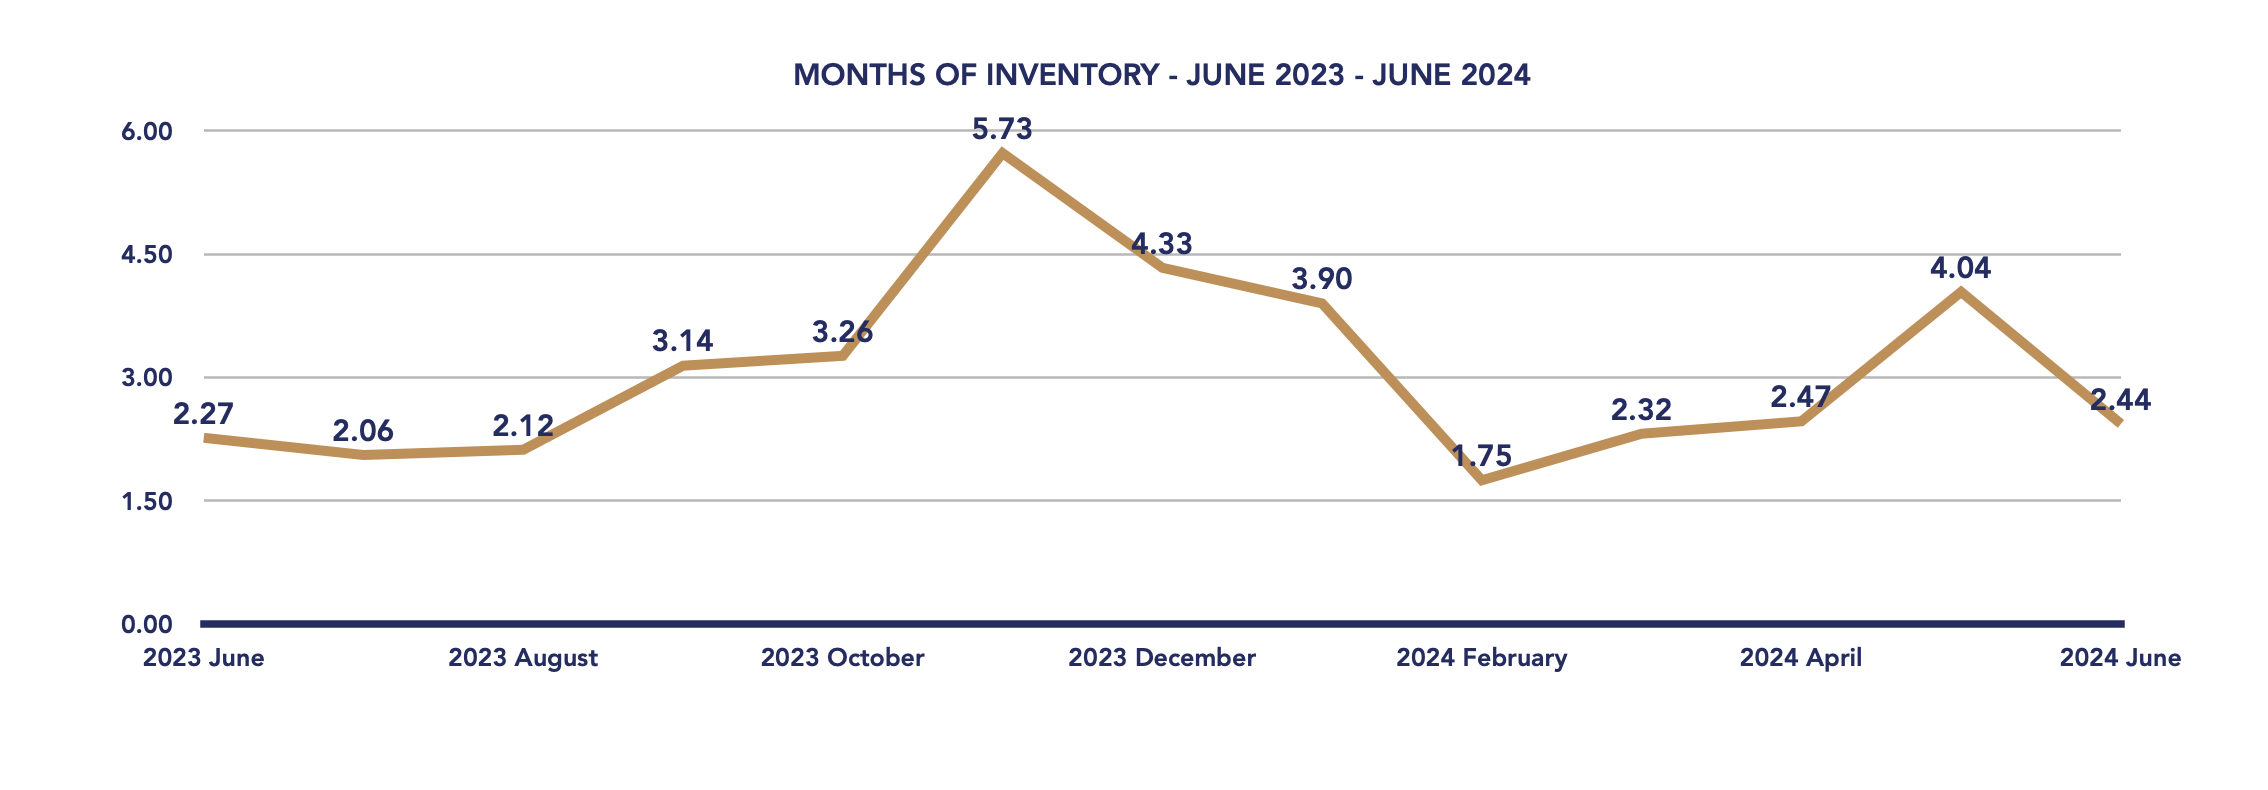
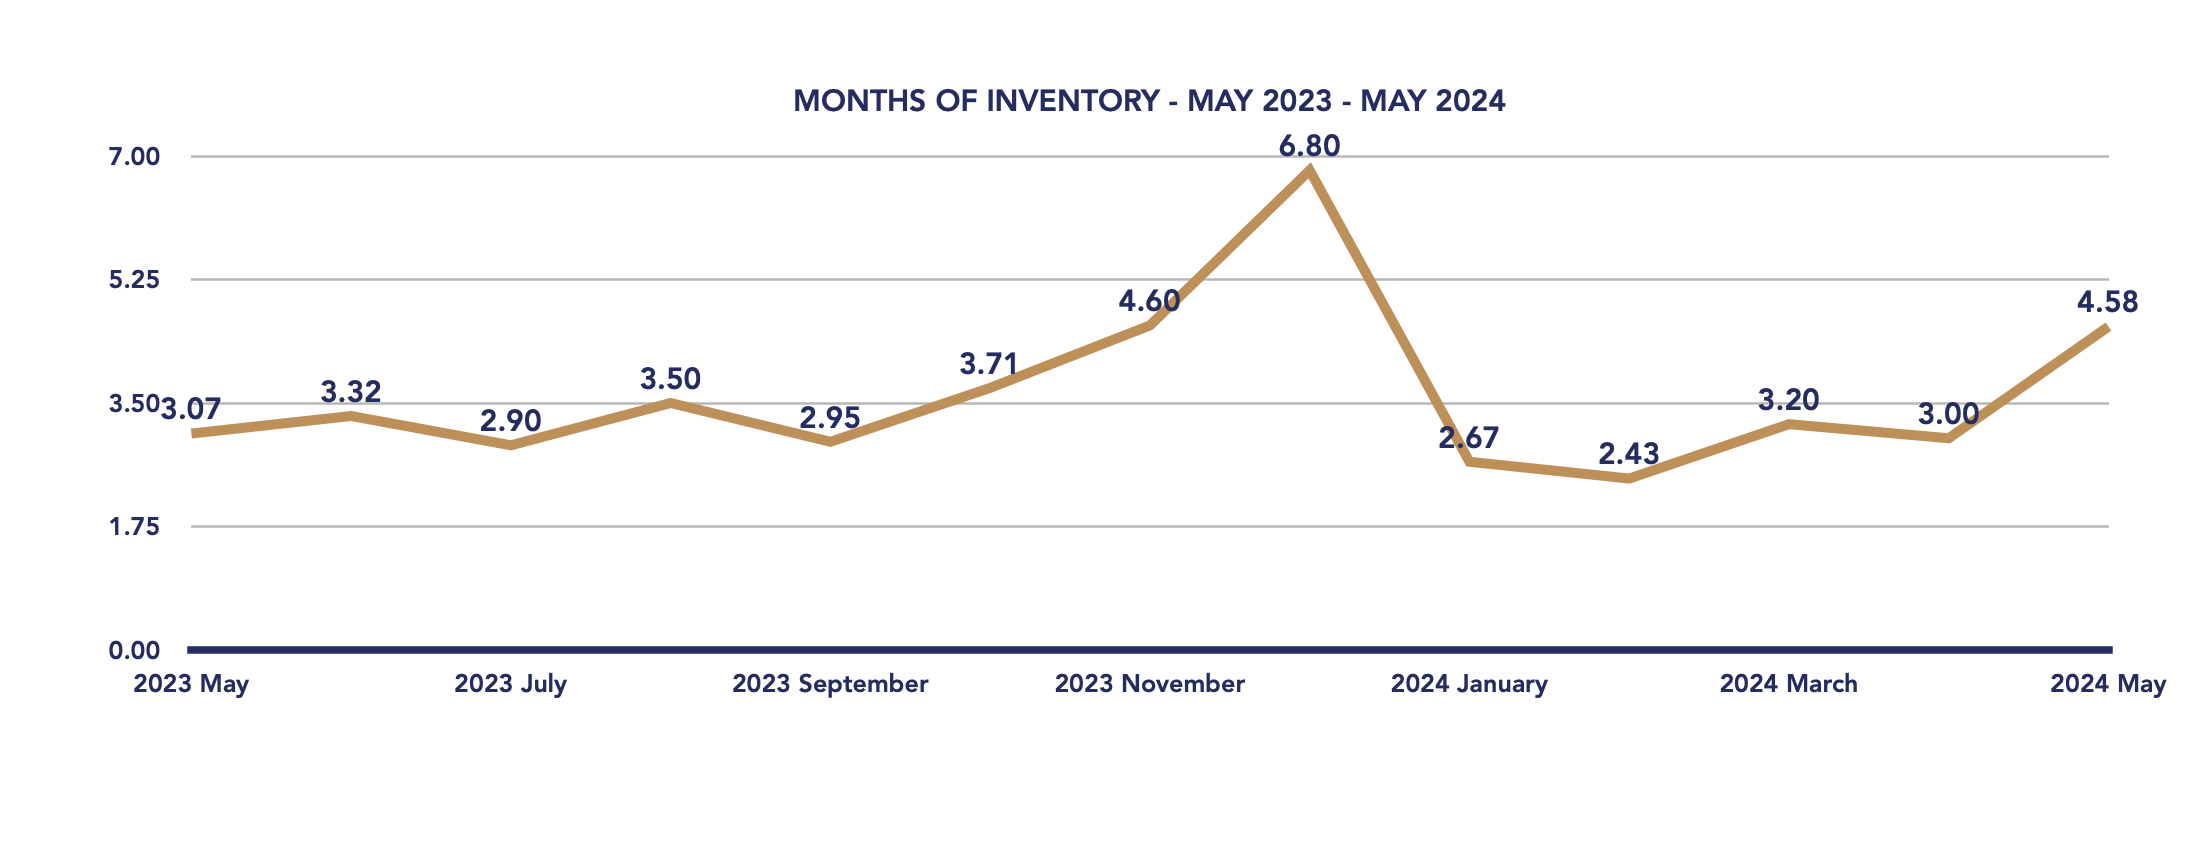
Months of Inventory
*Information is believed to be accurate at time of posting but is not guaranteed to be correct. Some values may vary slightly based on the exact date and time the reports were generated. Market stats are provided by TRREB (Toronto Regional Real Estate Board) and are based on sales for the month of Attached/Row/Townhouses, Condo Apartments, Condo Townhouses, Detached, Detached with Common Elements, Link Homes and Semi-detached. *Some values may vary slightly based on the exact date and time the reports were generated.
Not intended as a solicitation if your property is already listed by another broker. Affiliated real estate agents are independent contractor sales associates, not employees. ©2021 Coldwell Banker. All Rights Reserved. Coldwell Banker and the Coldwell Banker logos are trademarks of Coldwell Banker Real Estate LLC. The Coldwell Banker® System is comprised of company owned offices which are owned by a subsidiary of Realogy Brokerage Group LLC and franchised offices which are independently owned and operated. The Coldwell Banker System fully supports the principles of the Fair Housing Act and the Equal Opportunity Act.
Click below for more reports
Check out our Uxbridge and Scugog Events Pages to keep up to date on whats going on around town. Click the links or scan the Code with your phone to take you directly there.

UXBRIDGE EVENTS

SCUGOG EVENTS