Facebook
 X
X
 Pinterest
 Copy Link

Uxbridge Housing January 2026

Each office is independently owned and operated
![]()
![]()
Housing Market Report for January 2026
Here is the Township of Uxbridge Housing January 2026 report (all housing types), with reports from the Canadian Real Estate Association, and Toronto Regional Real Estate Board included.
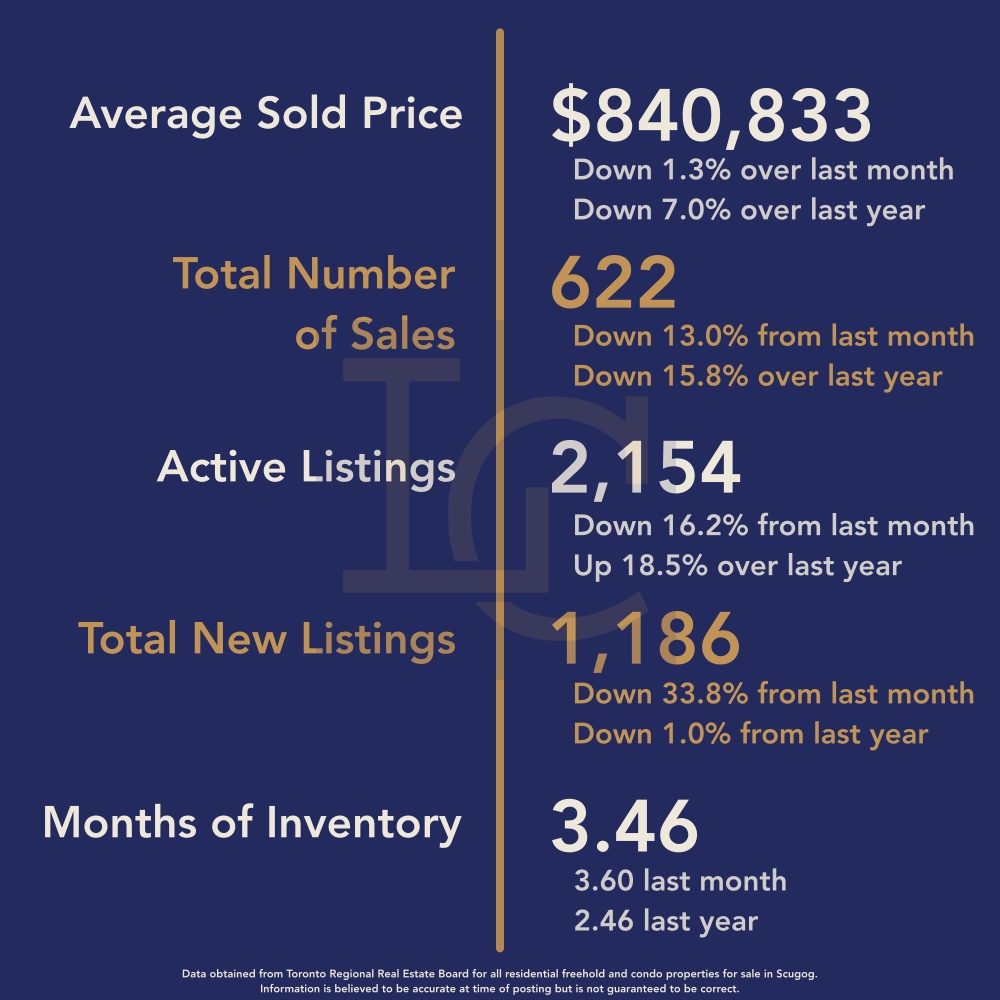
This housing report for Durham Region includes the number of new listings, average list price, number of properties sold, average selling price, average days on market and average asking price to selling price ratio for all property types within the Region of Durham.
Scroll to the bottom for links to take you to the housing market reports for Durham Region, Scugog and Brock.
![]()
![]()
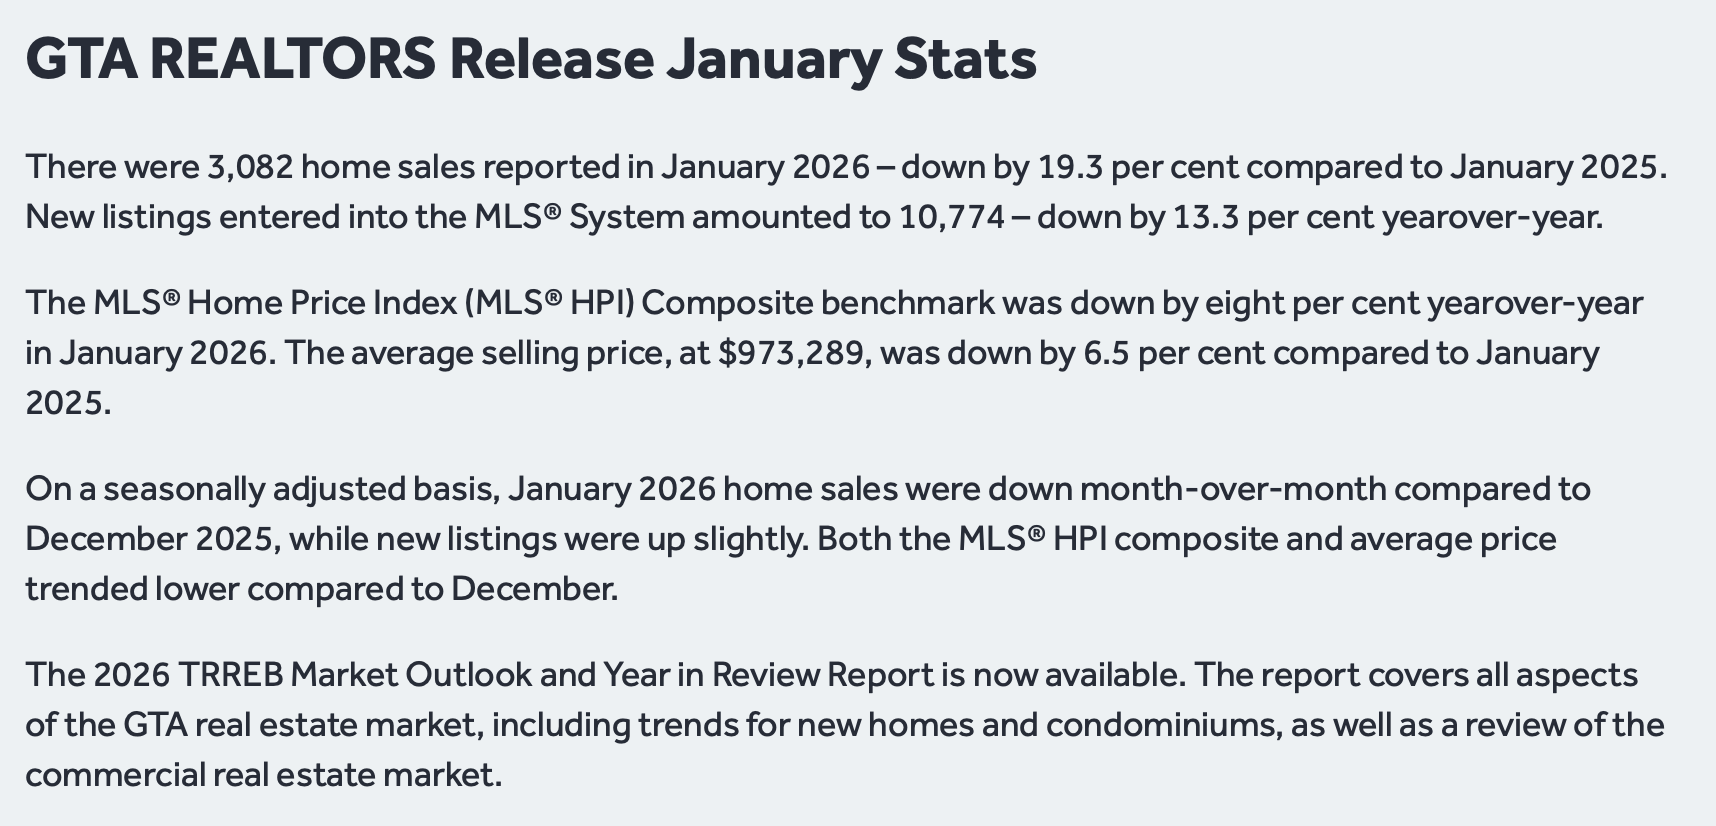
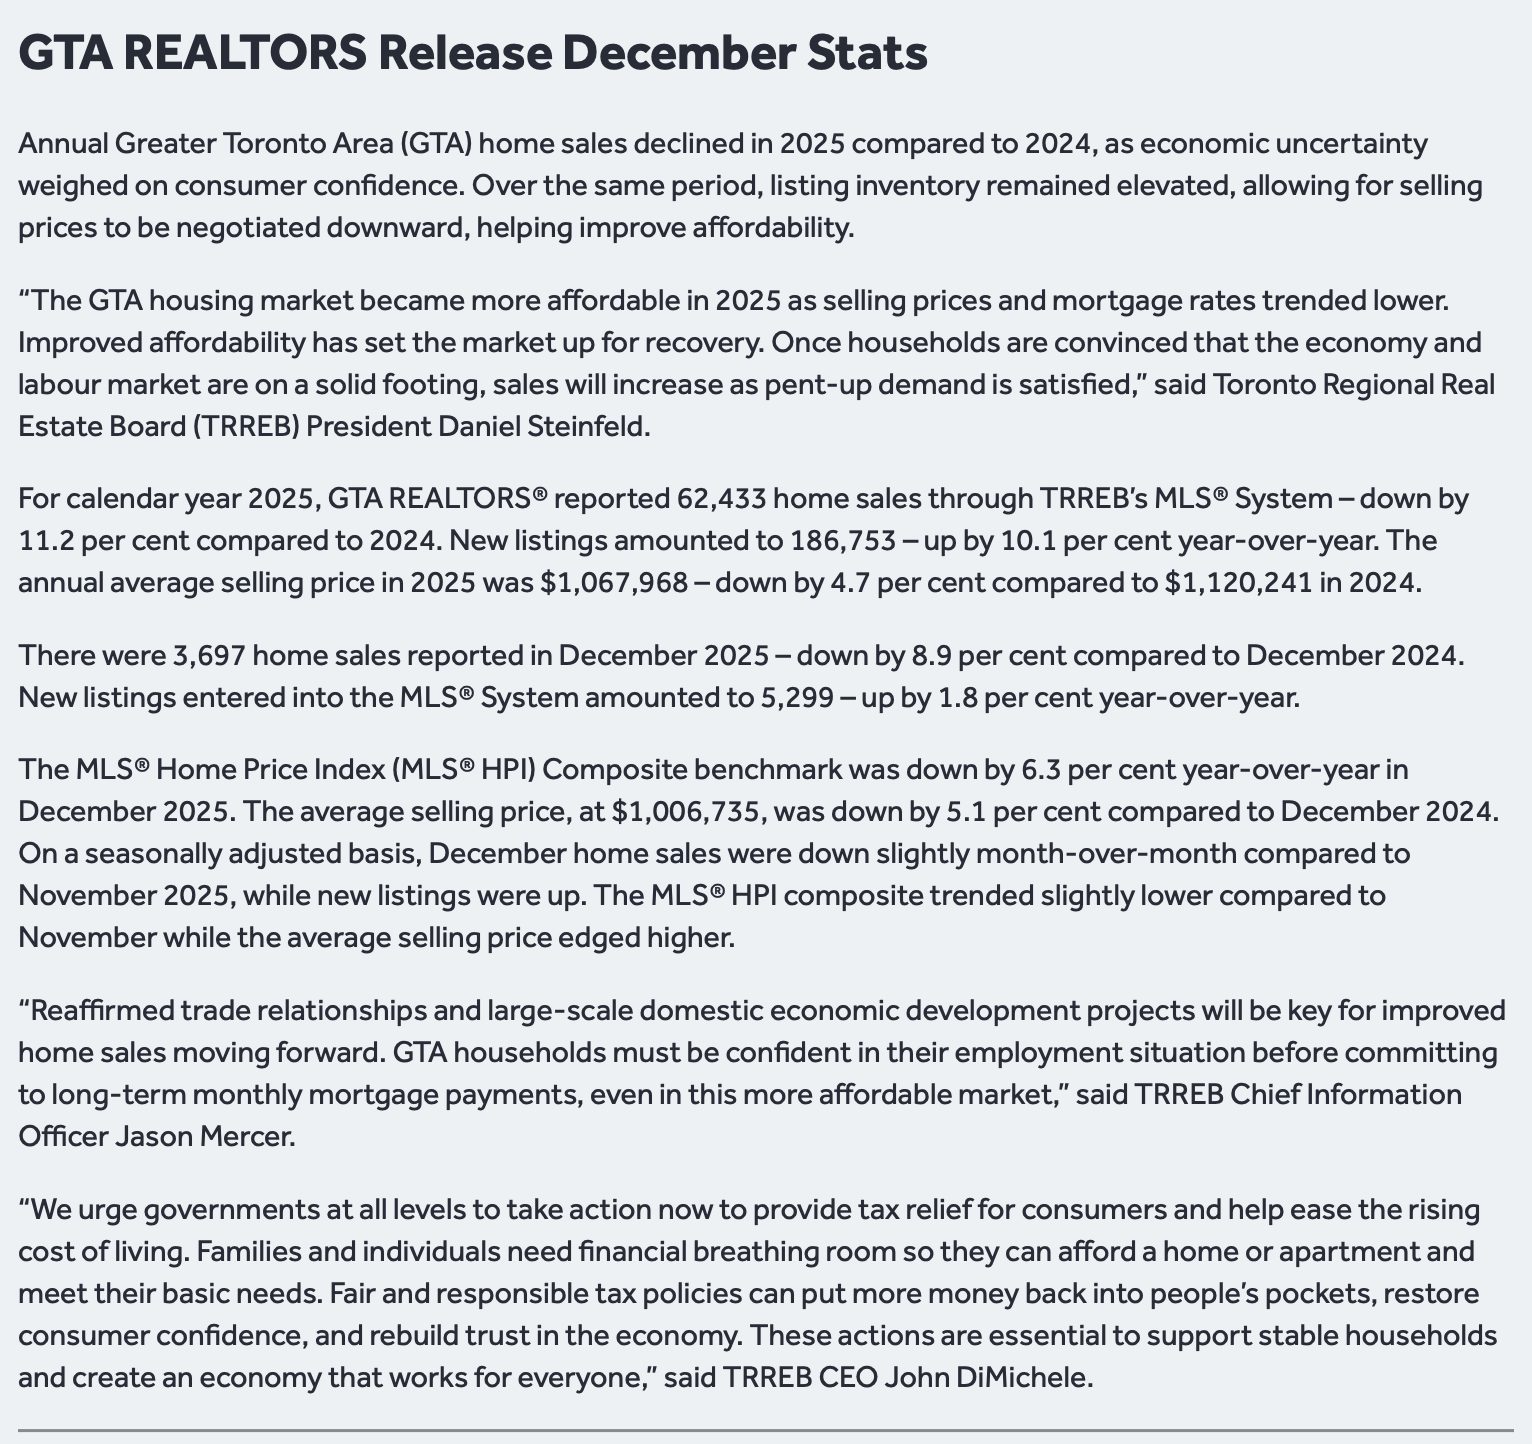
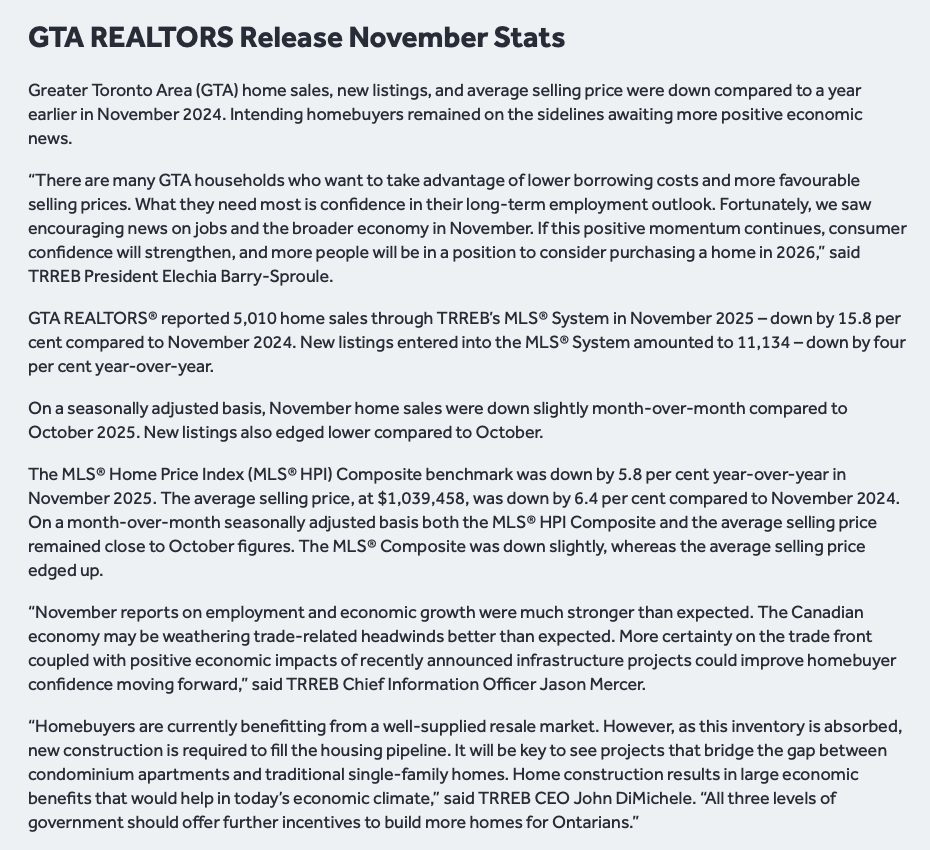
From Toronto Regional Real Estate Board
Please note: The PropTx MLS® System, of which TRREB is a part, has added a number of new client boards over the last year. Many of these boards’ Members trade within the Greater Toronto Area and broader Greater Golden Horseshoe regions. As a result, historic data have been updated to reflect the addition of these boards’ listings and transactions. This means historic data have changed relative to previously published static reports. To view updated historic data, click here.
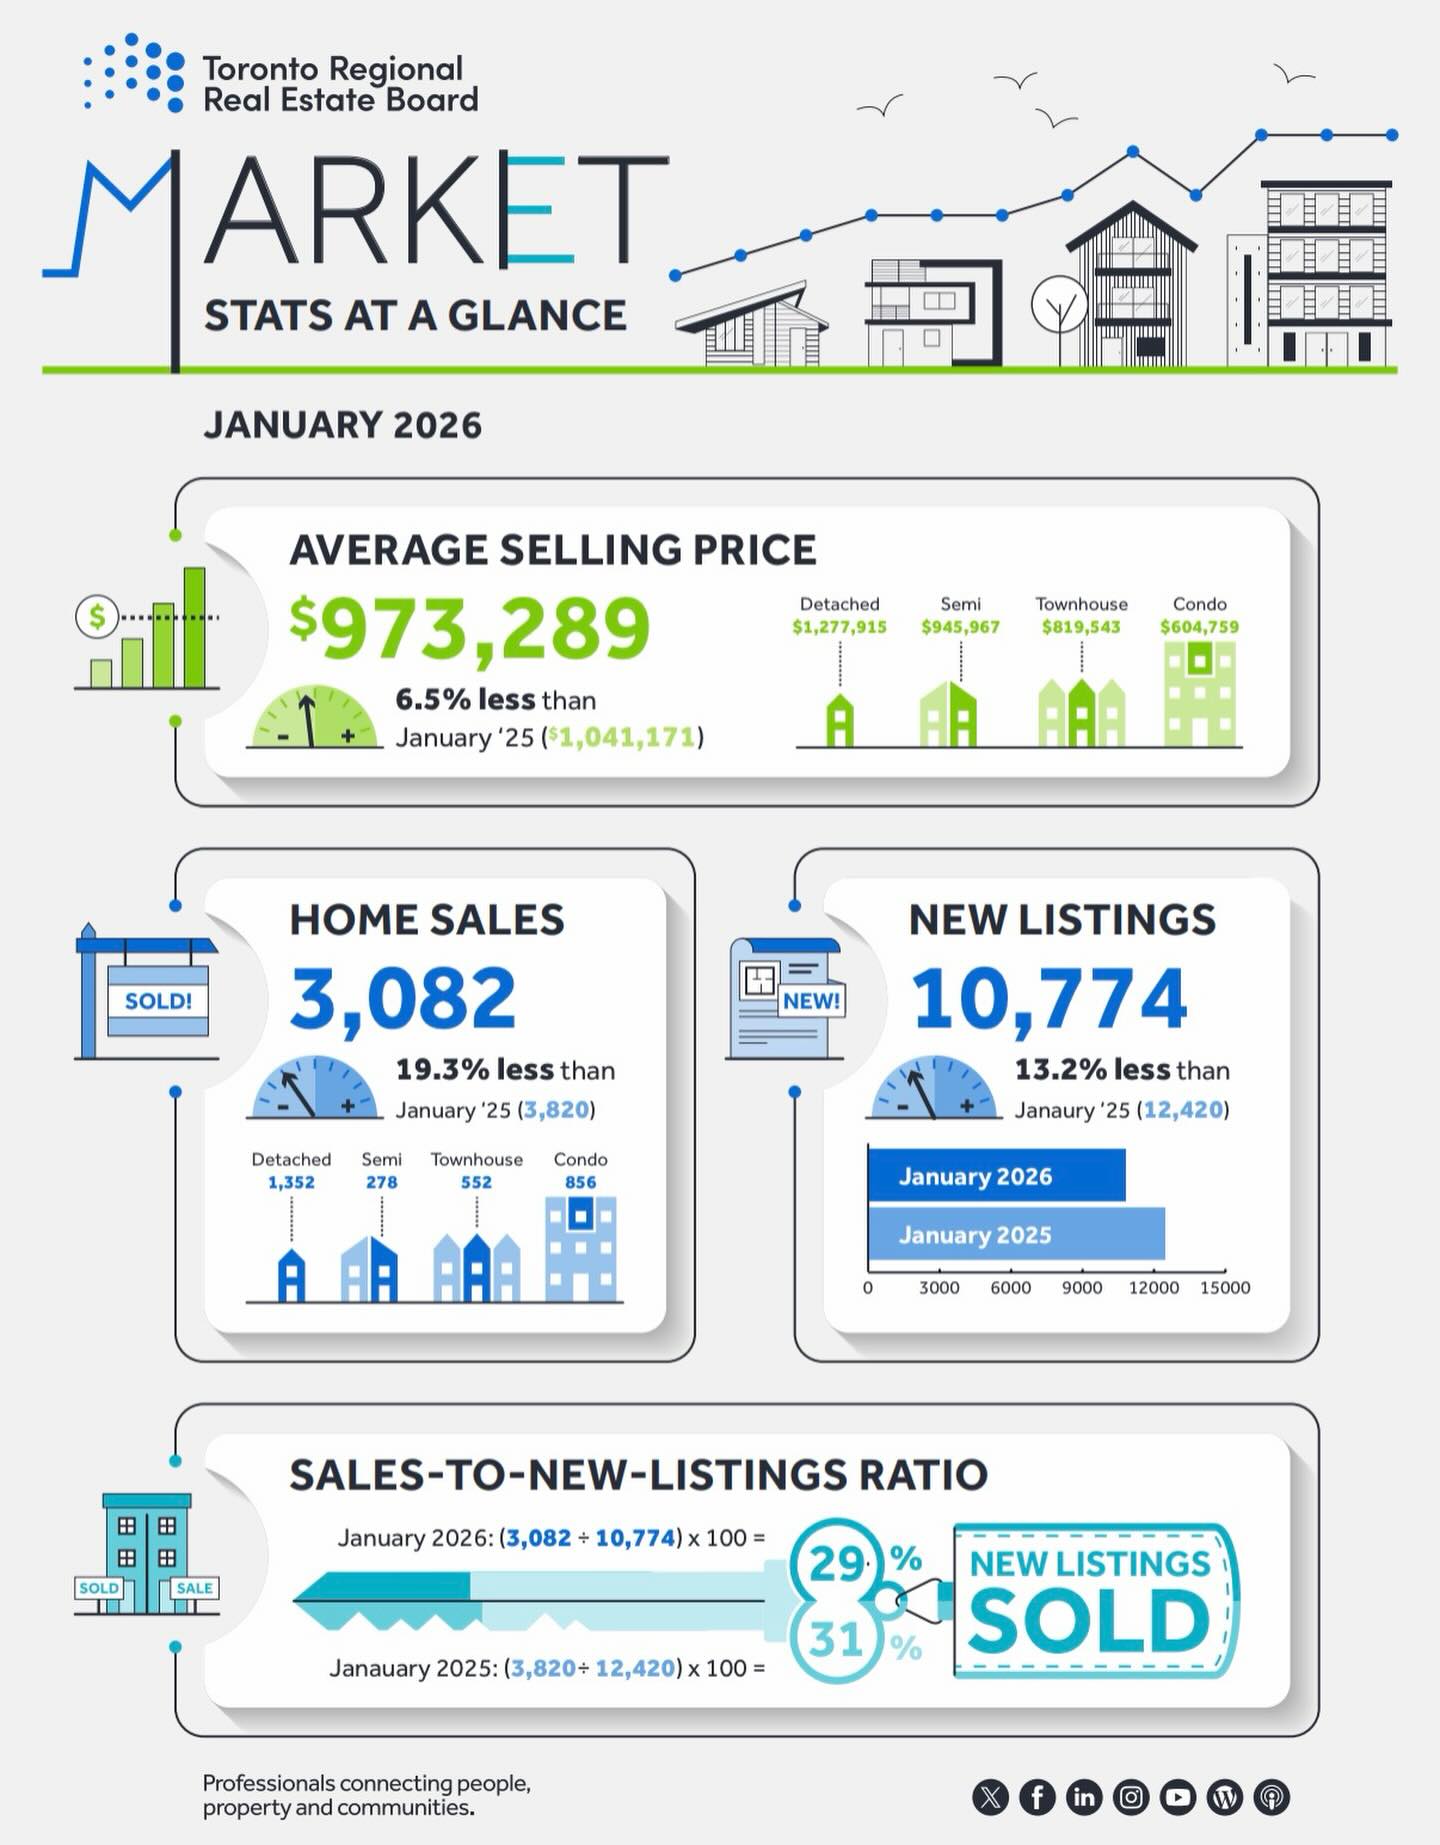
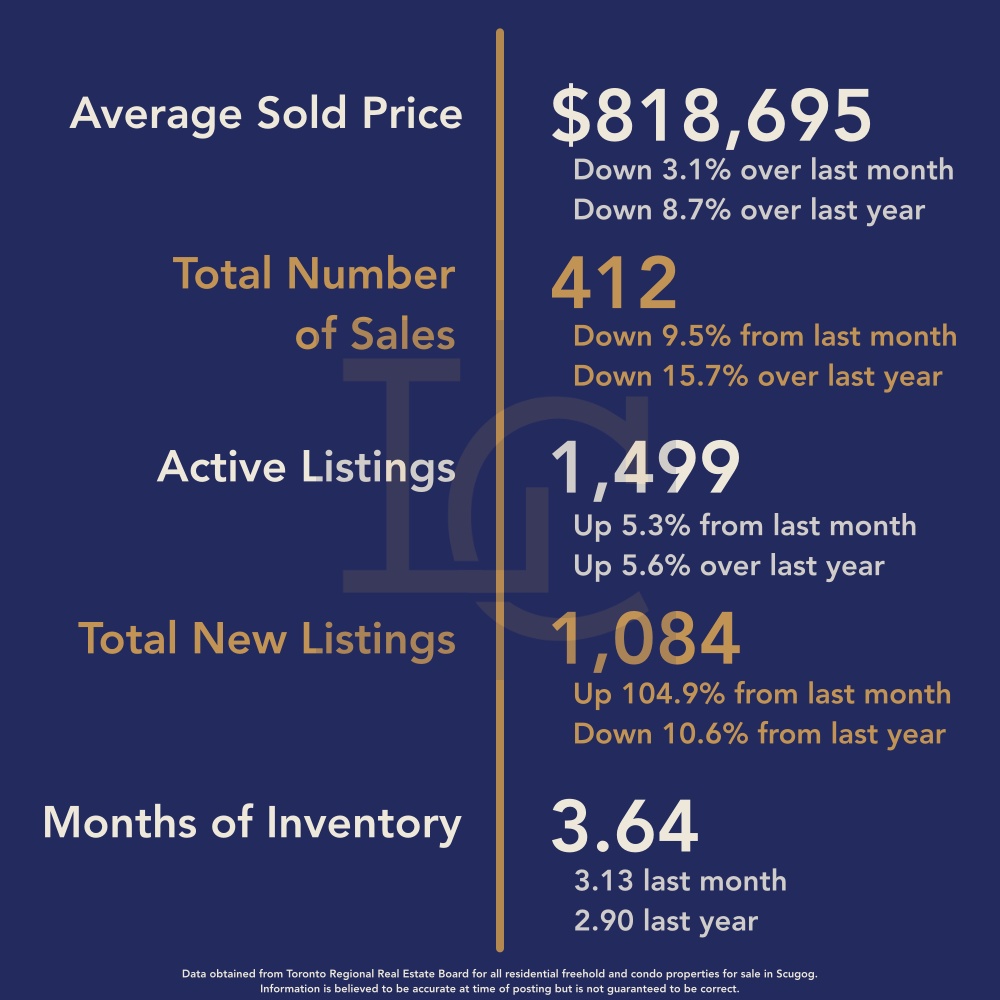
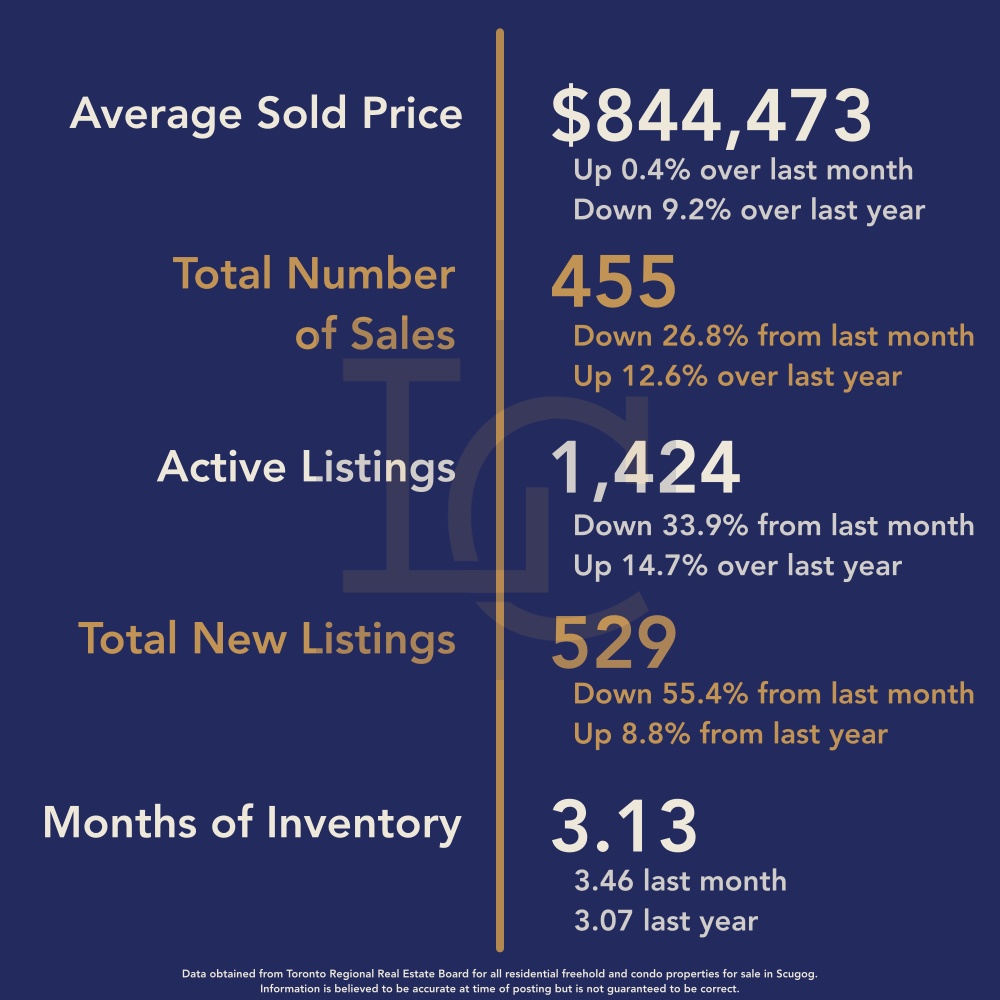
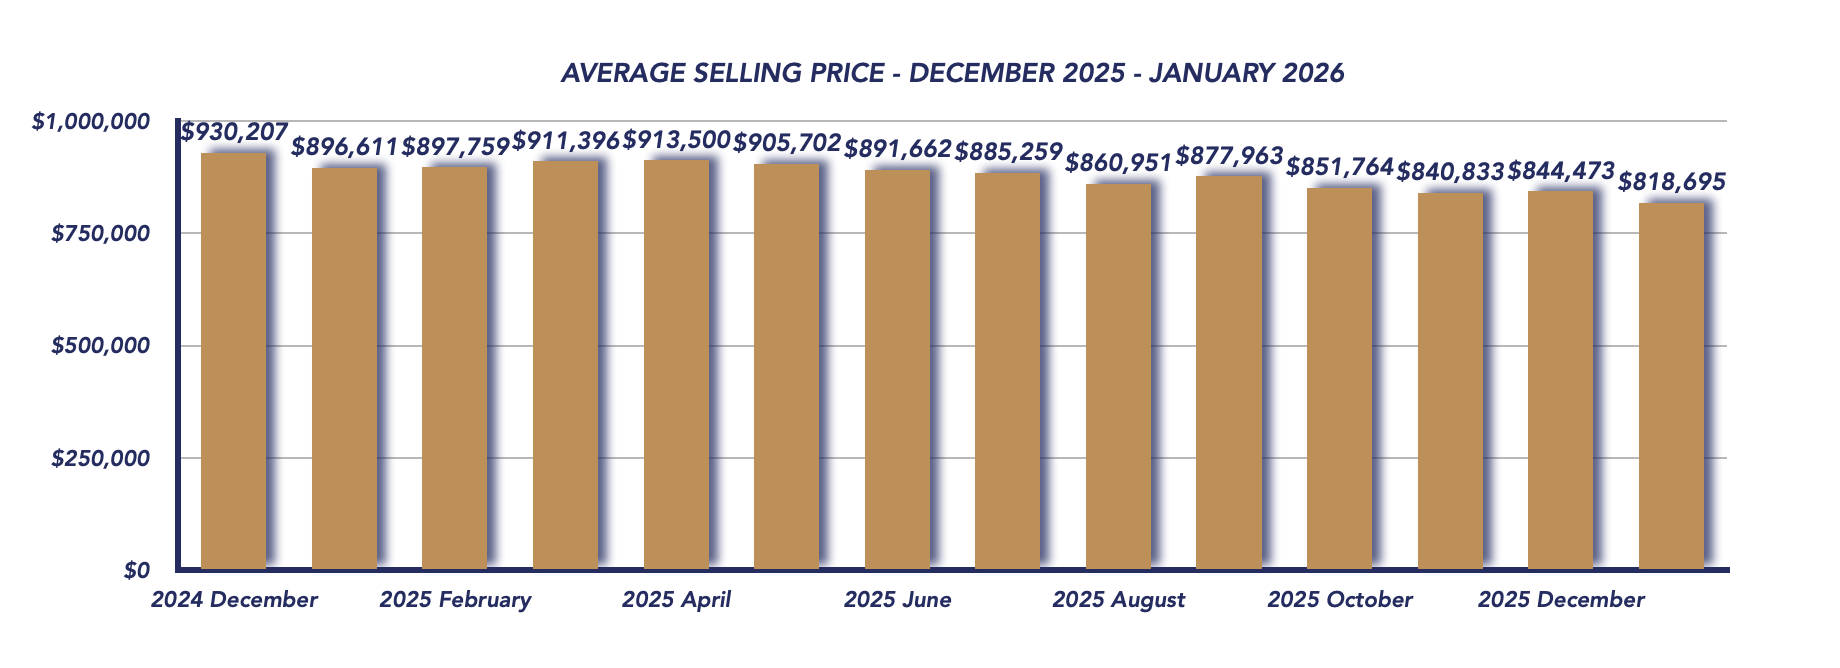
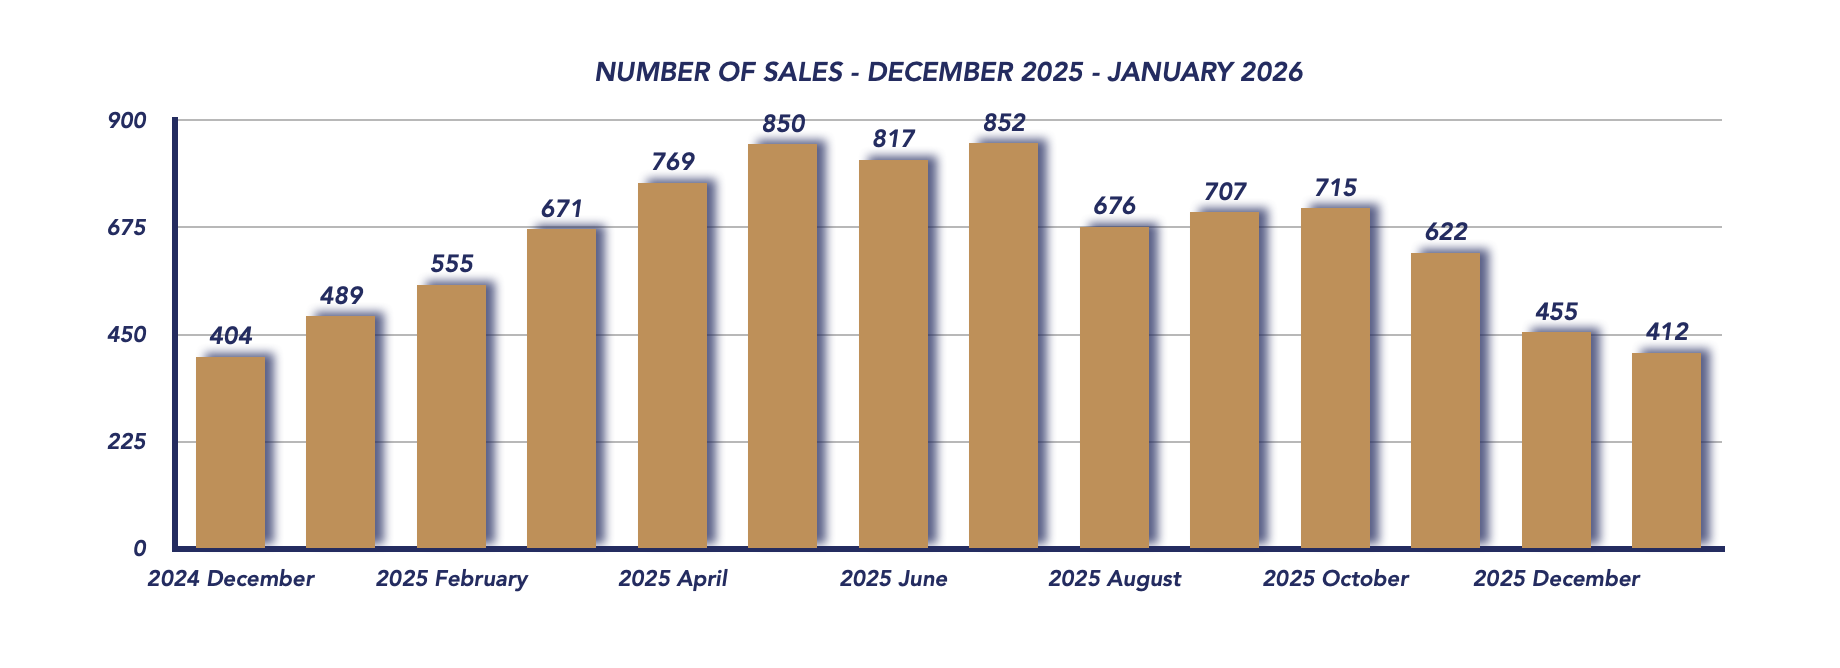
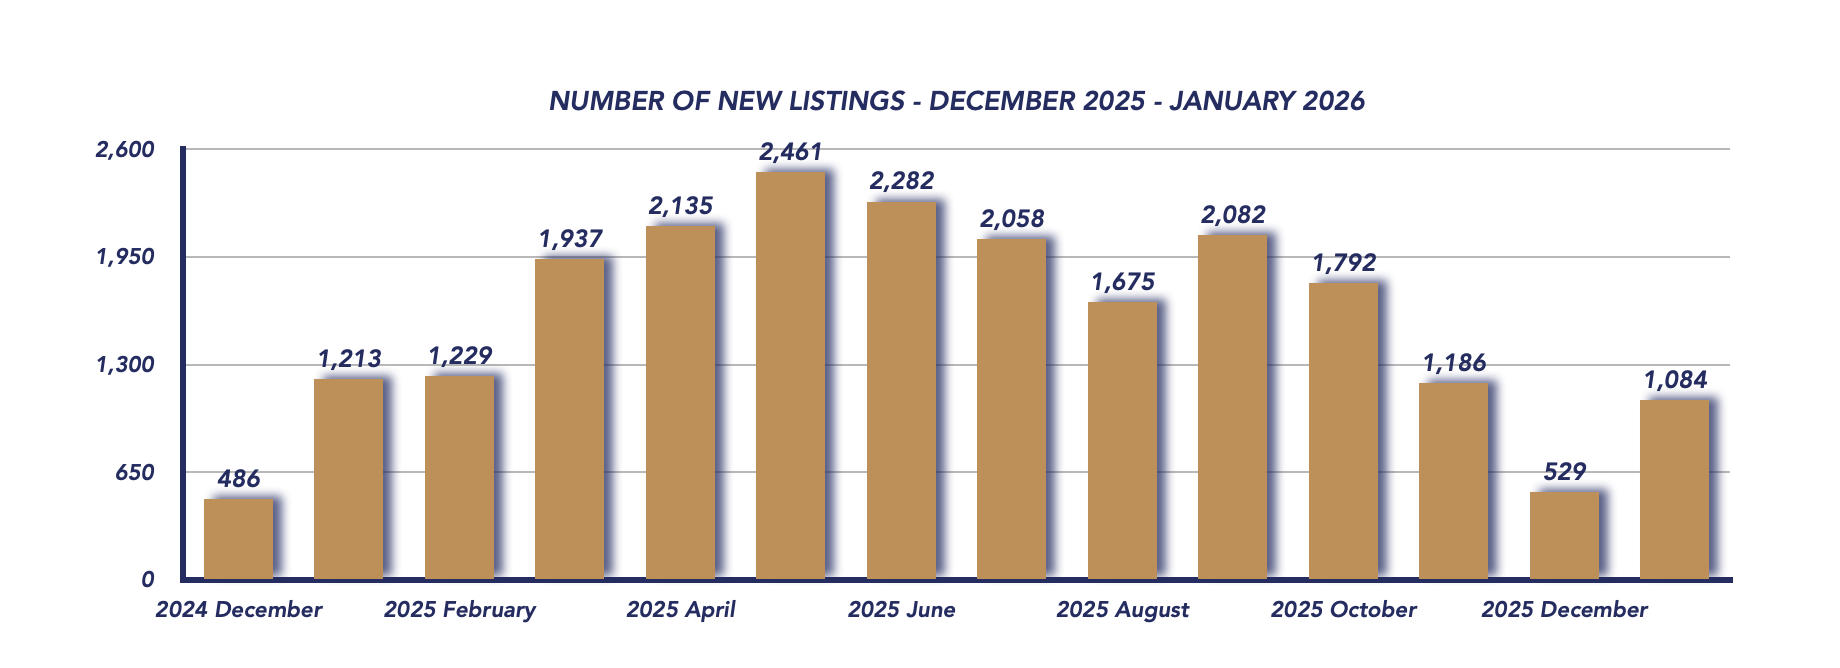
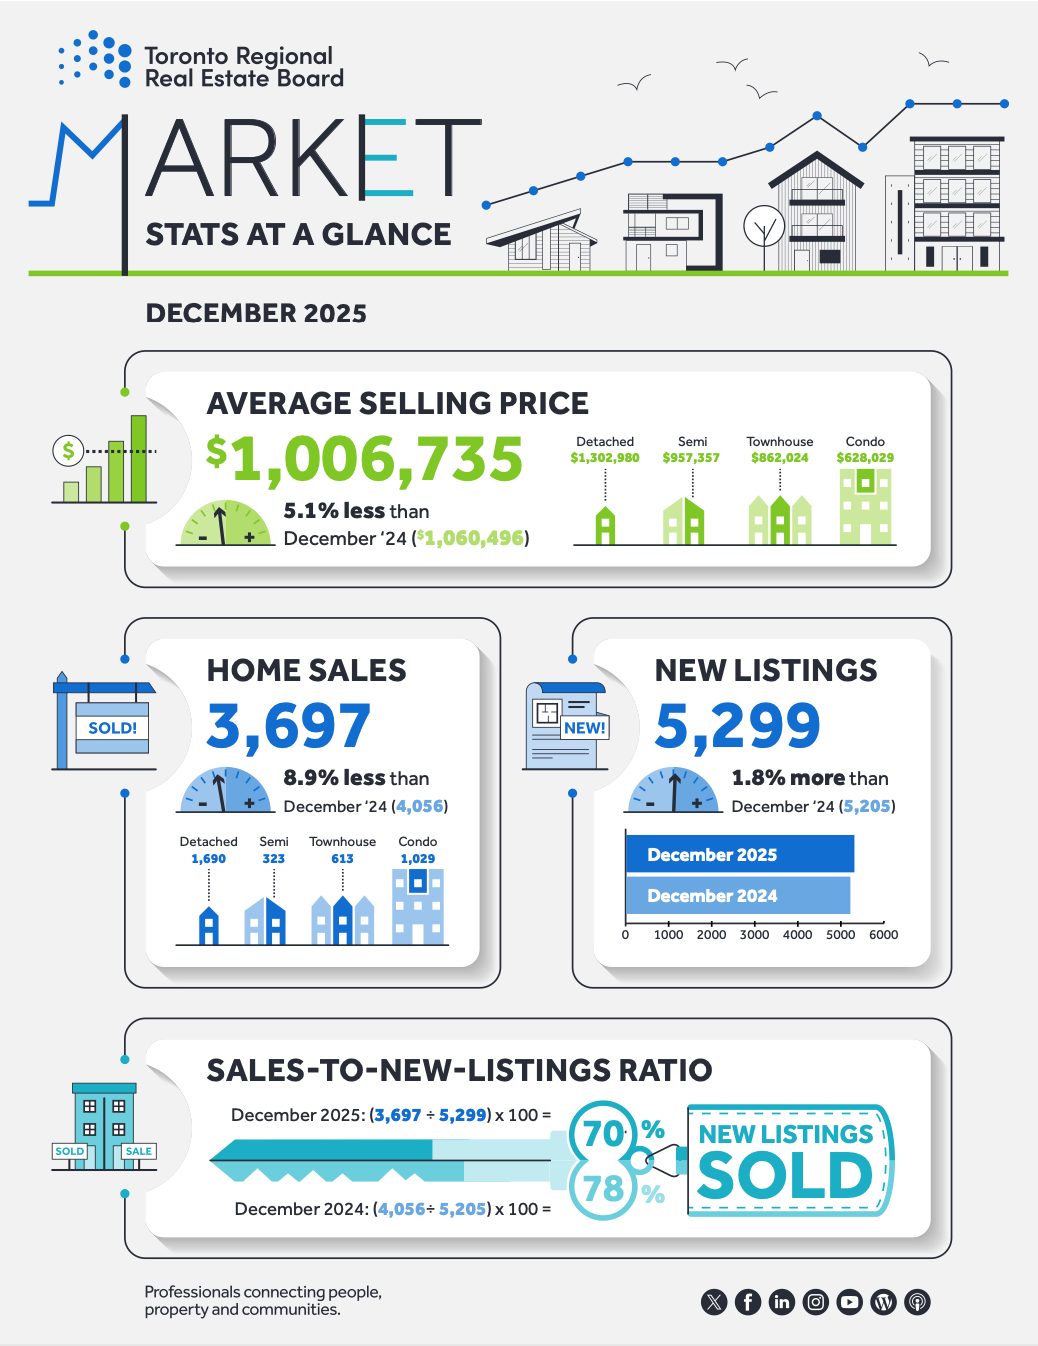
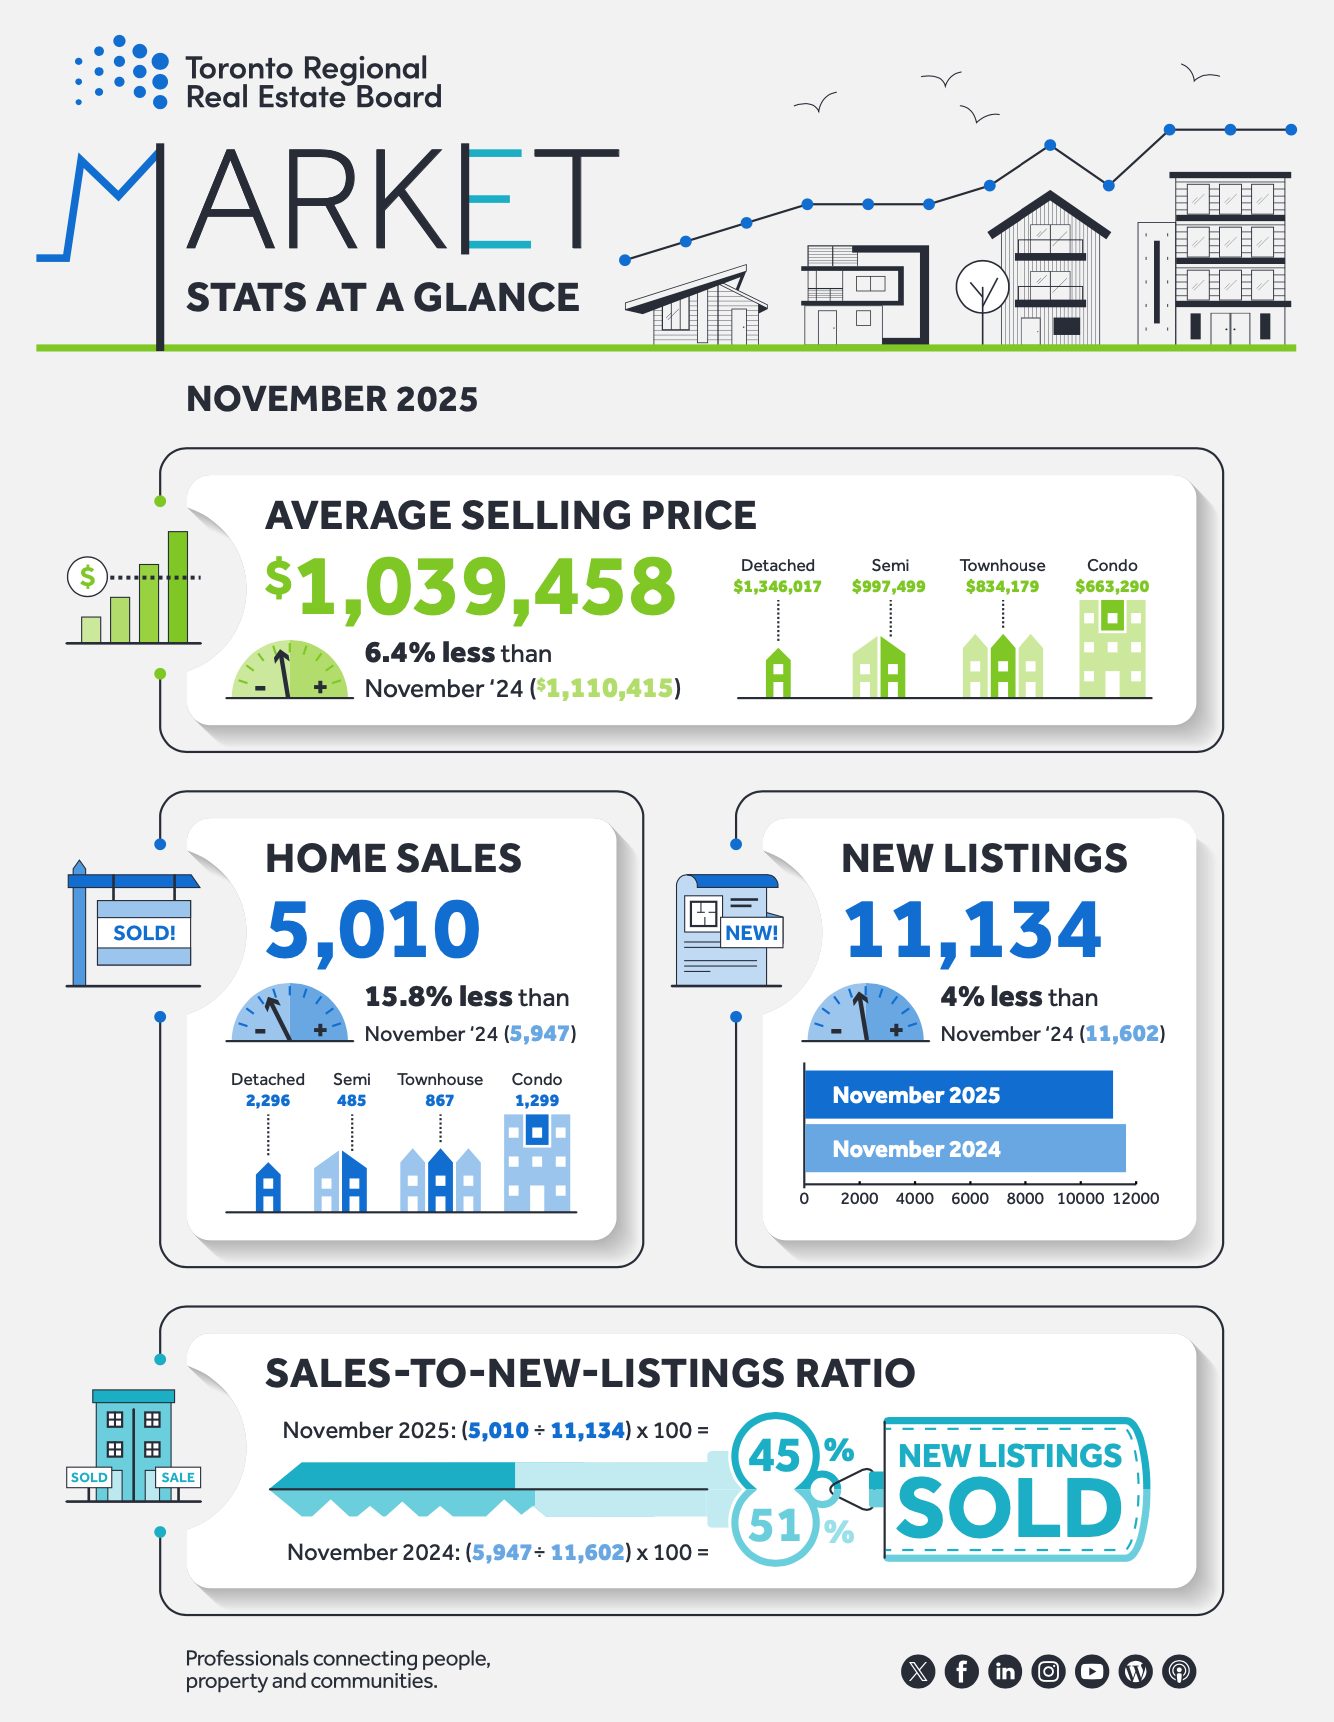
Toronto Regional Real Estate Board – Market Stats At A Glance – January 2026
Read the Toronto Regional Real Estate Board Market Watch Report
![]()
Uxbridge Township Real Estate Market Analysis – January 2026
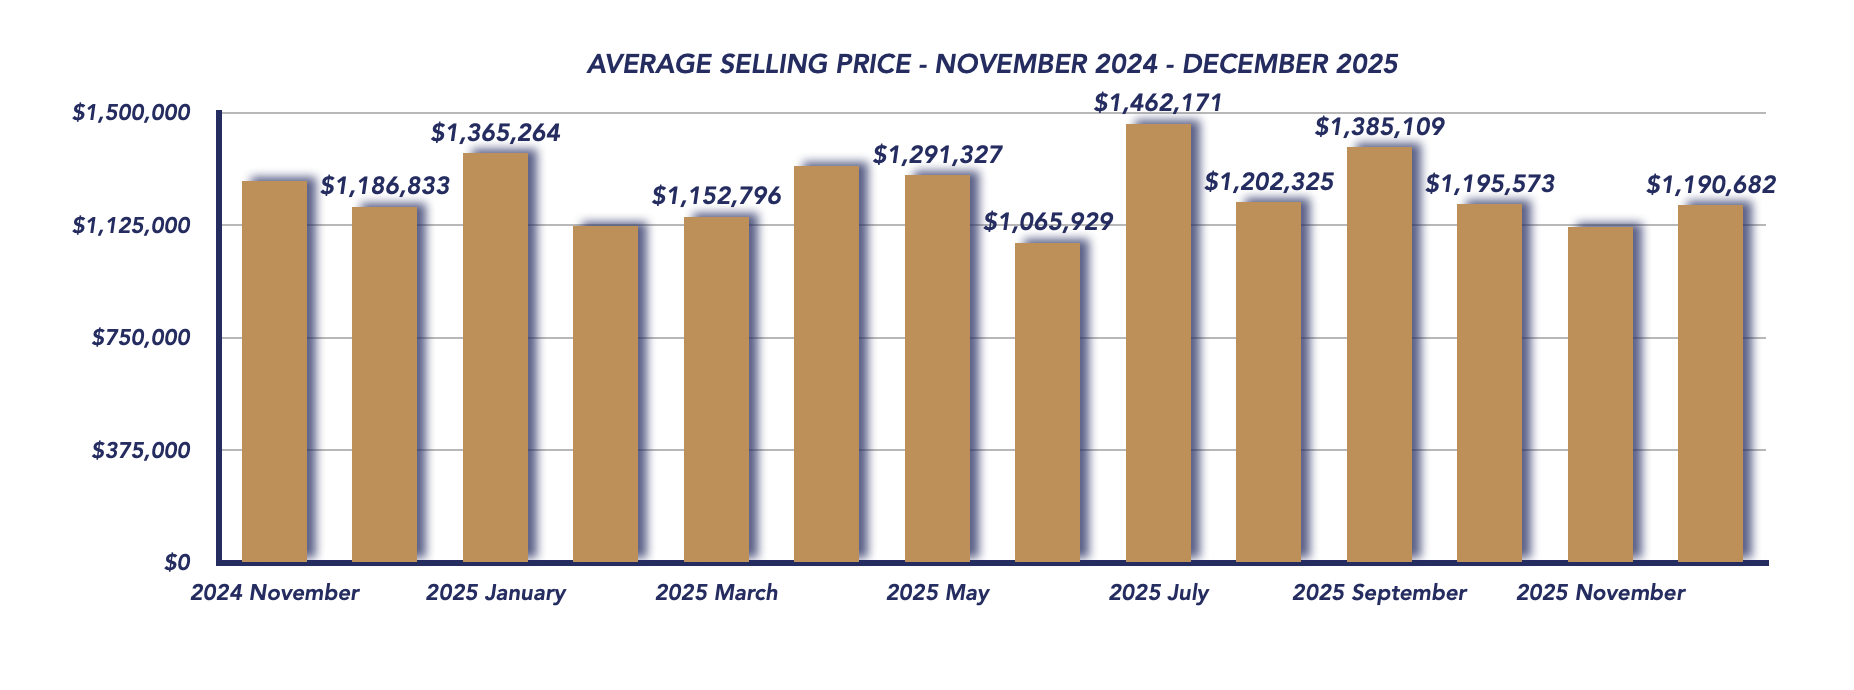
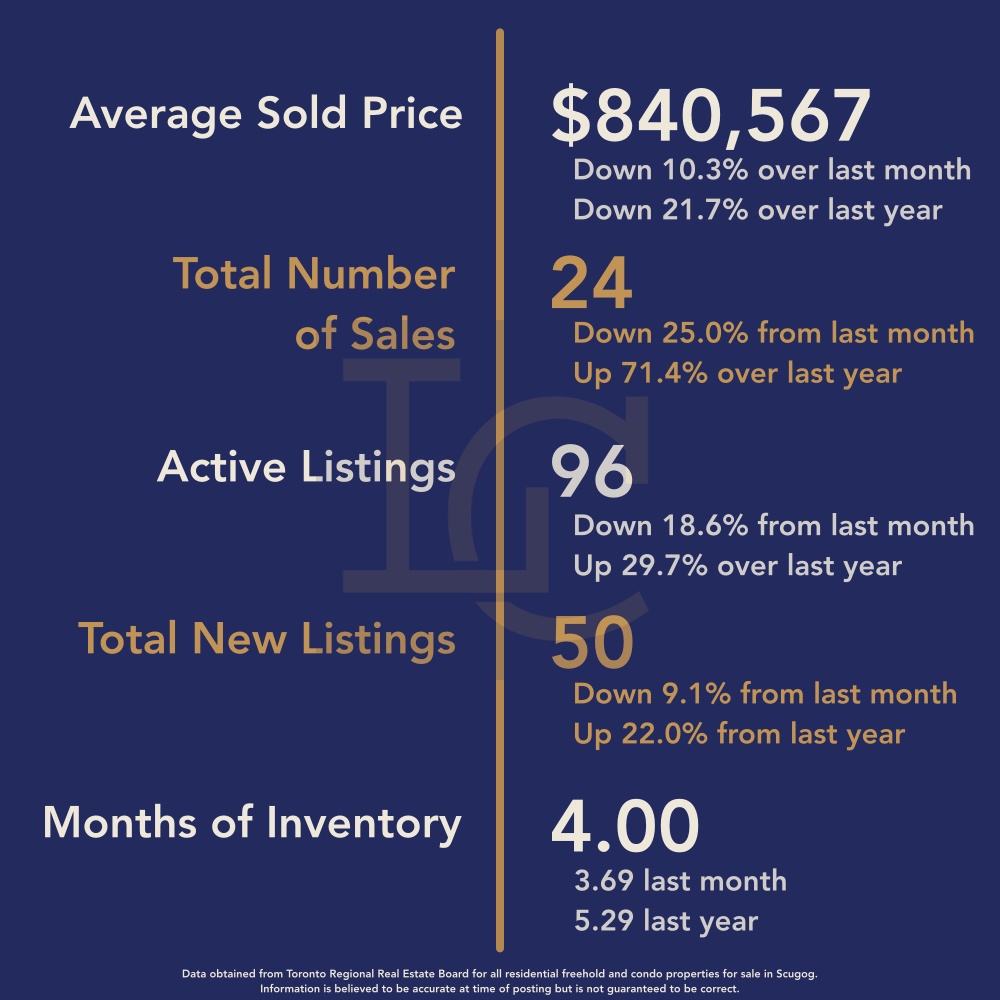
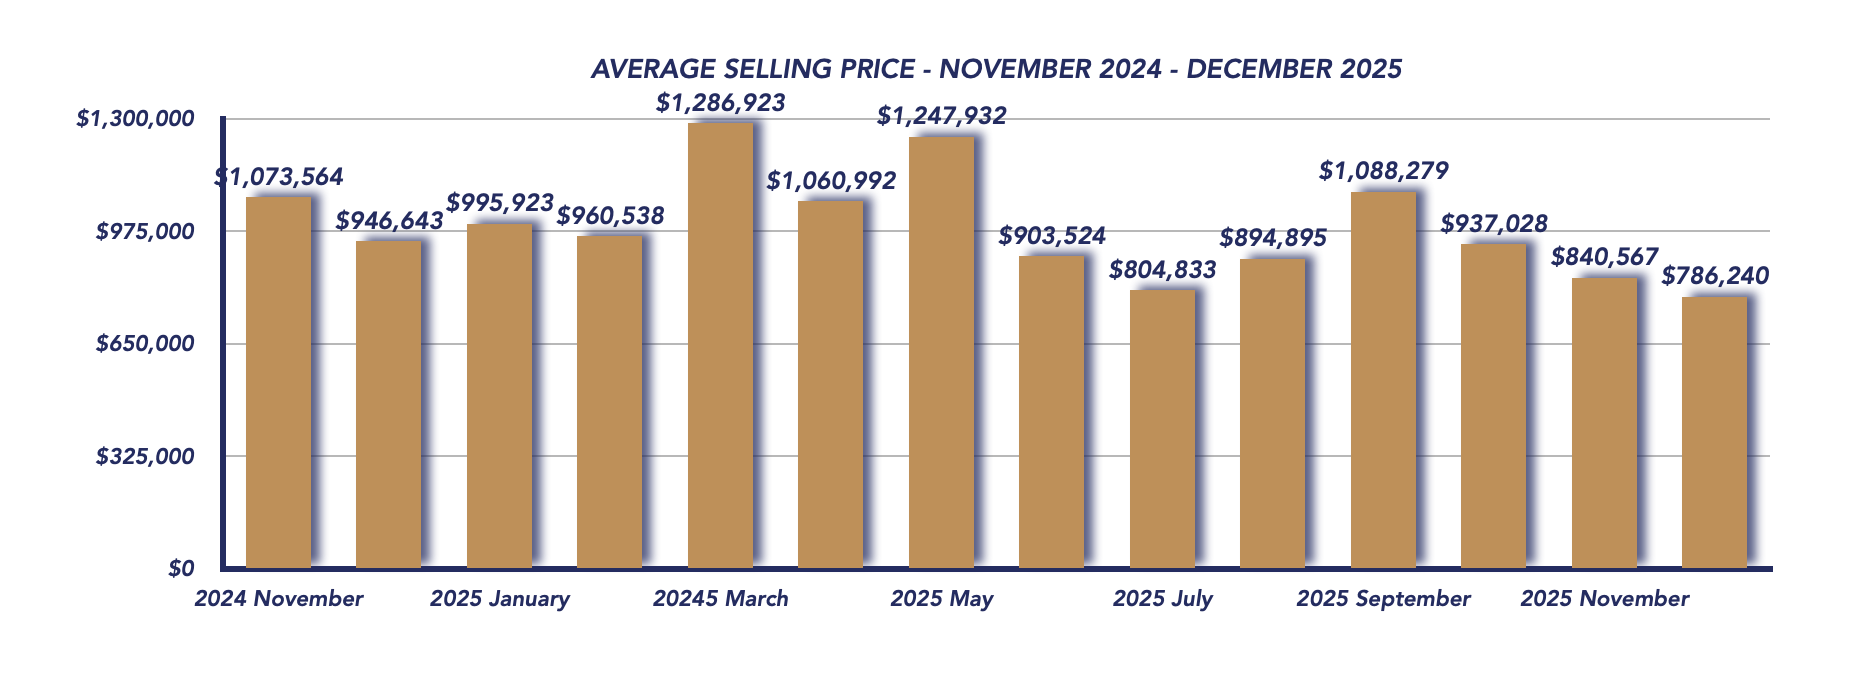
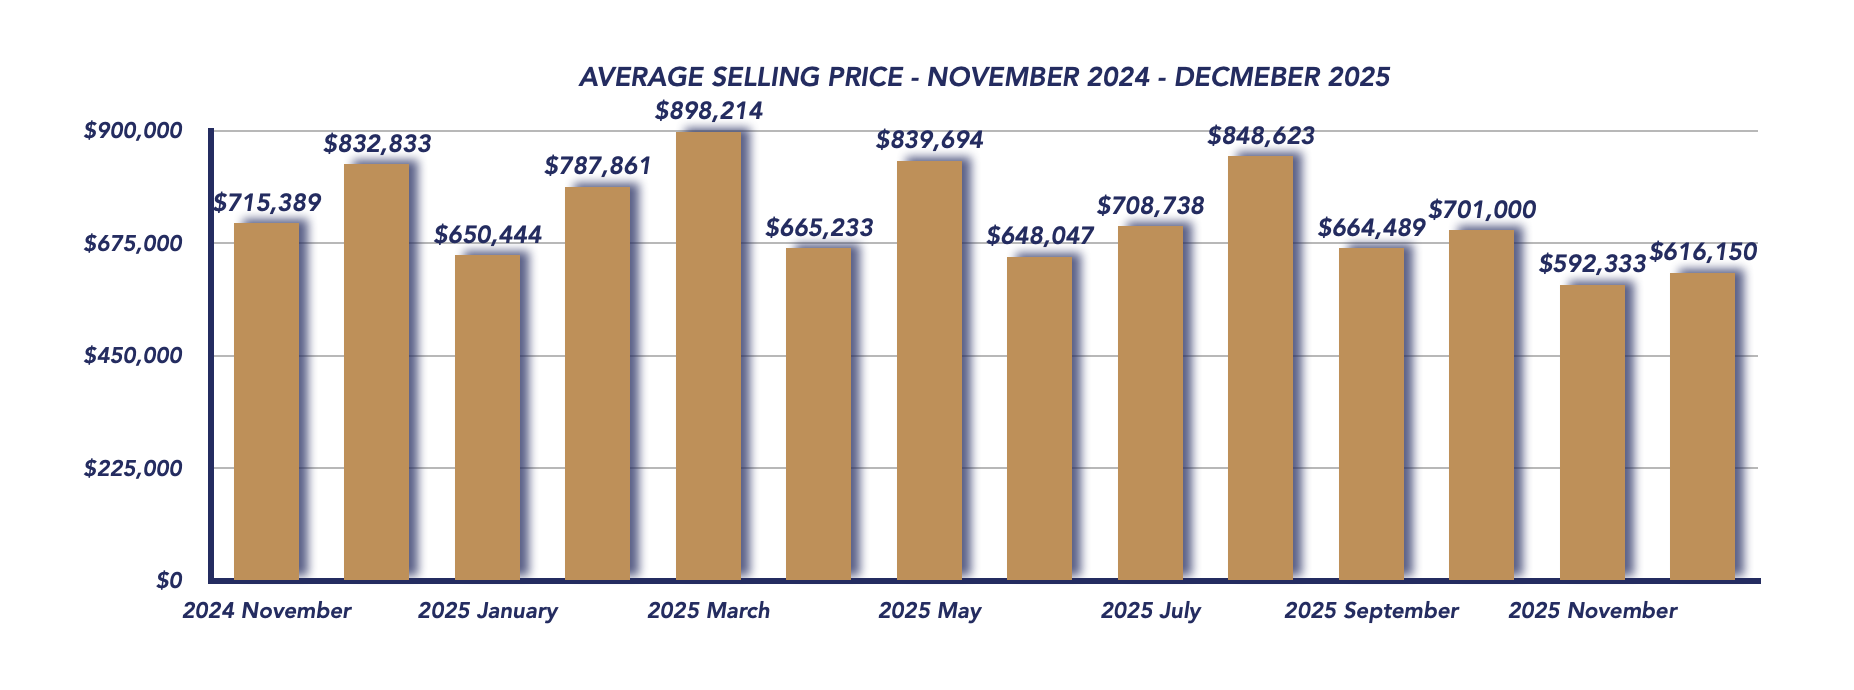
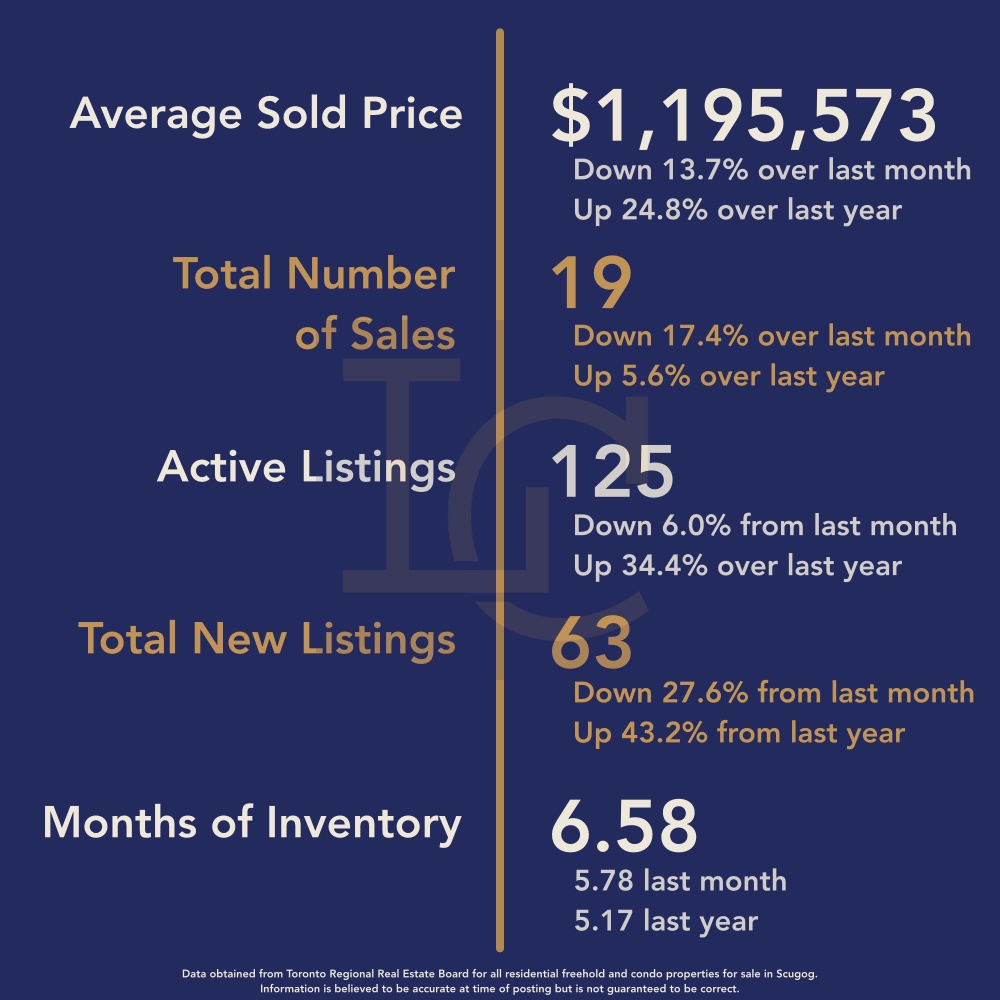
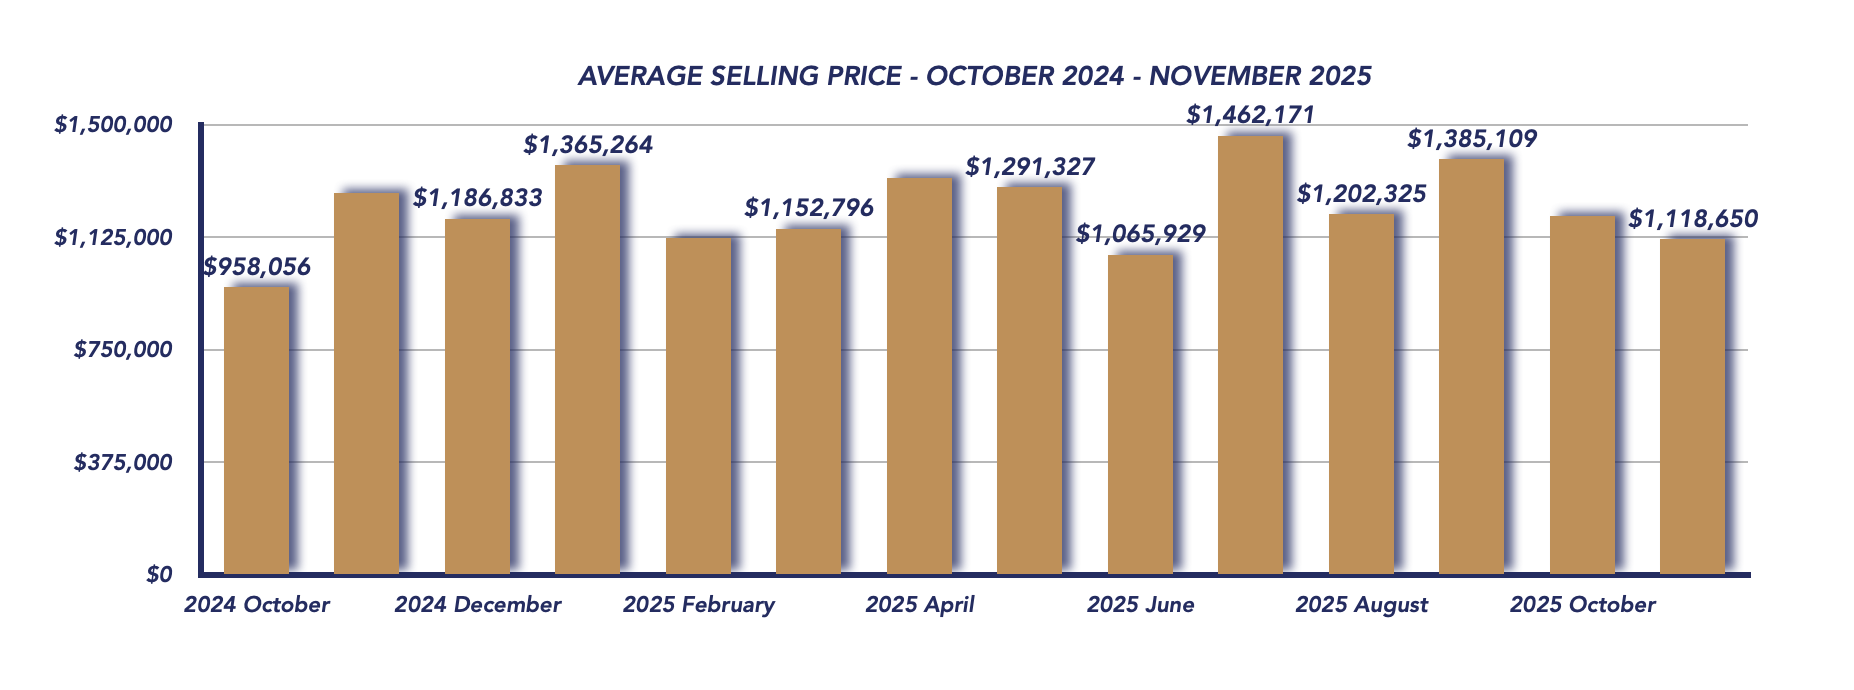
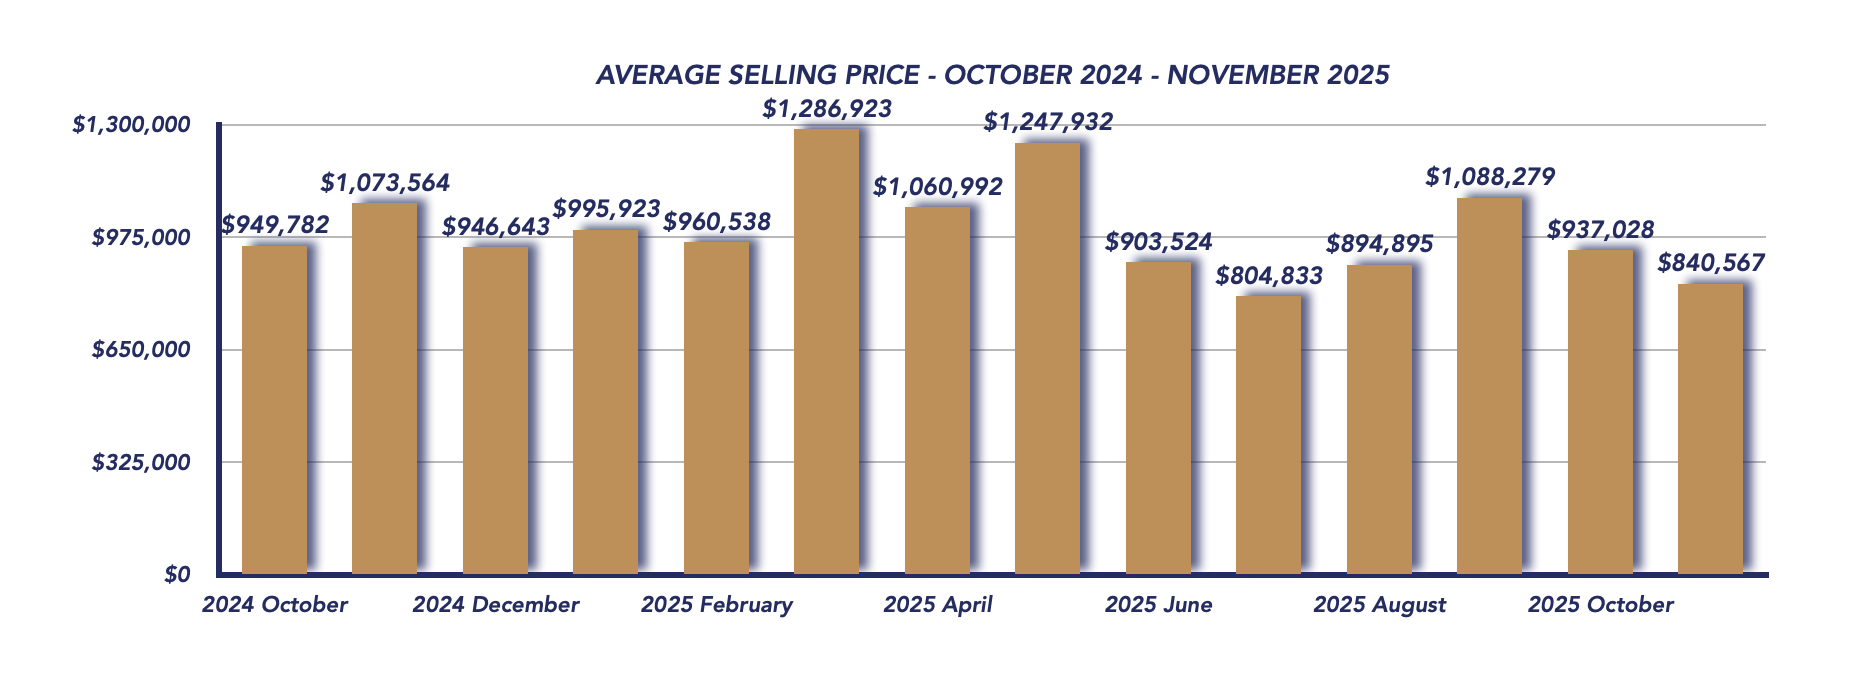
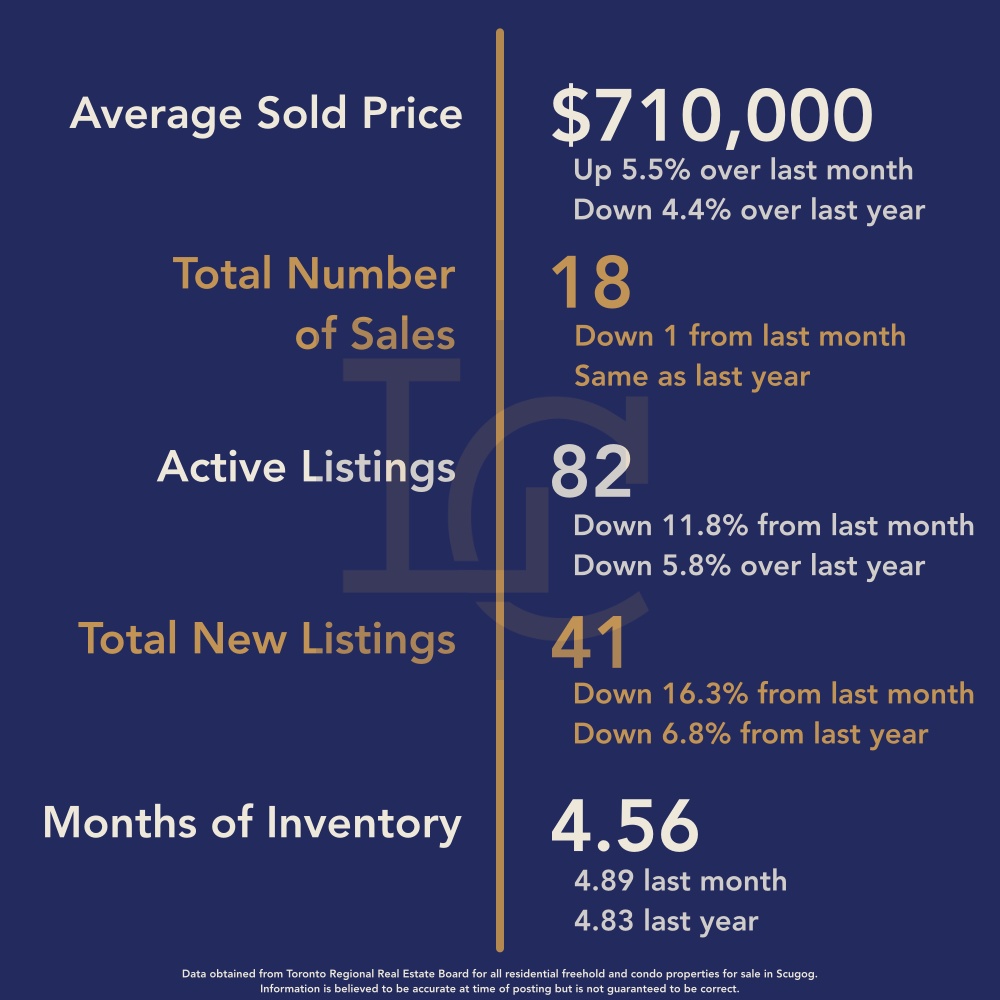
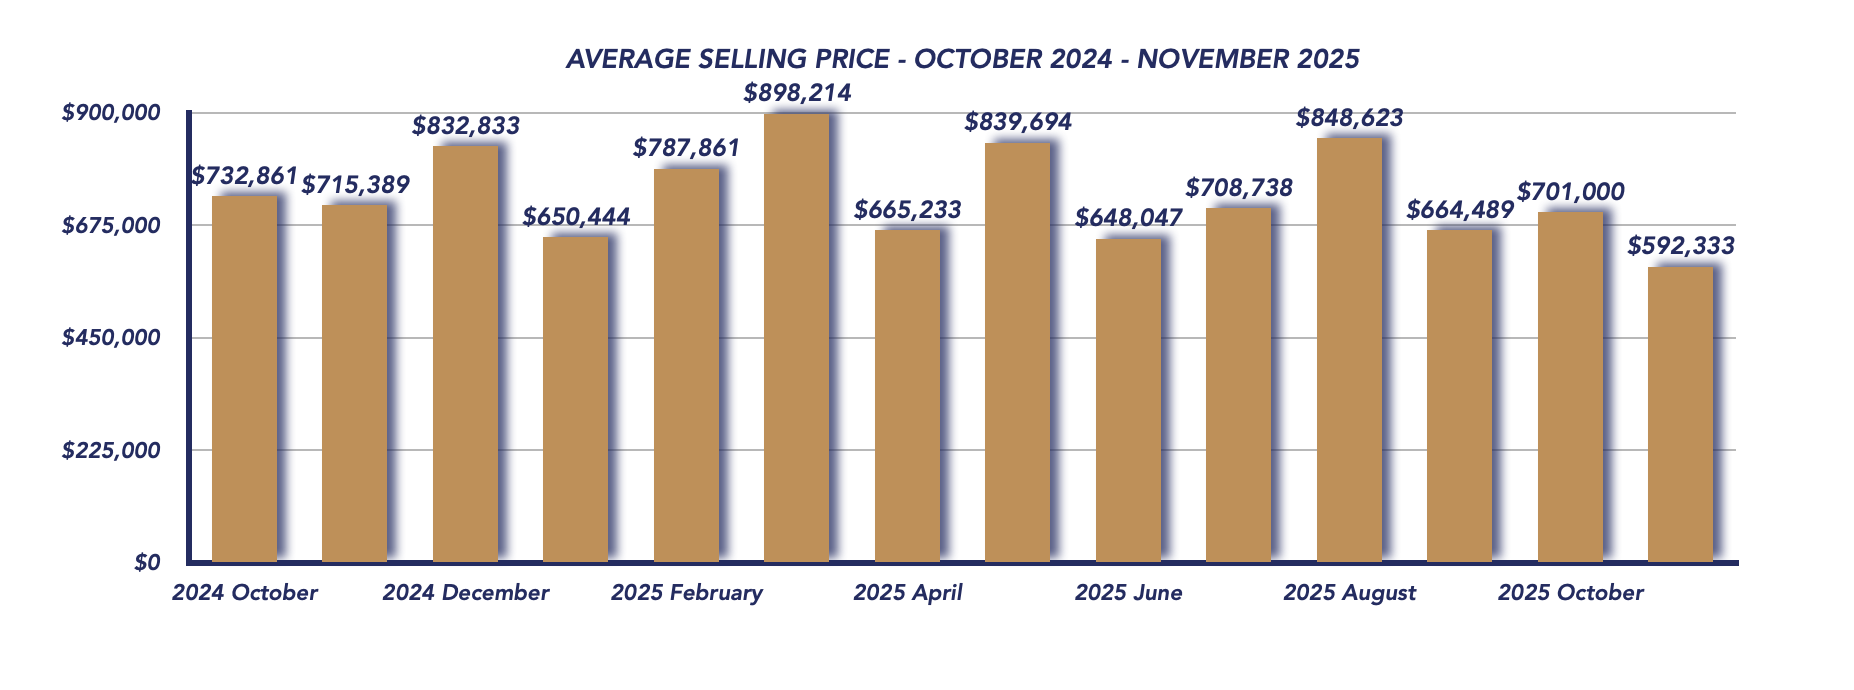
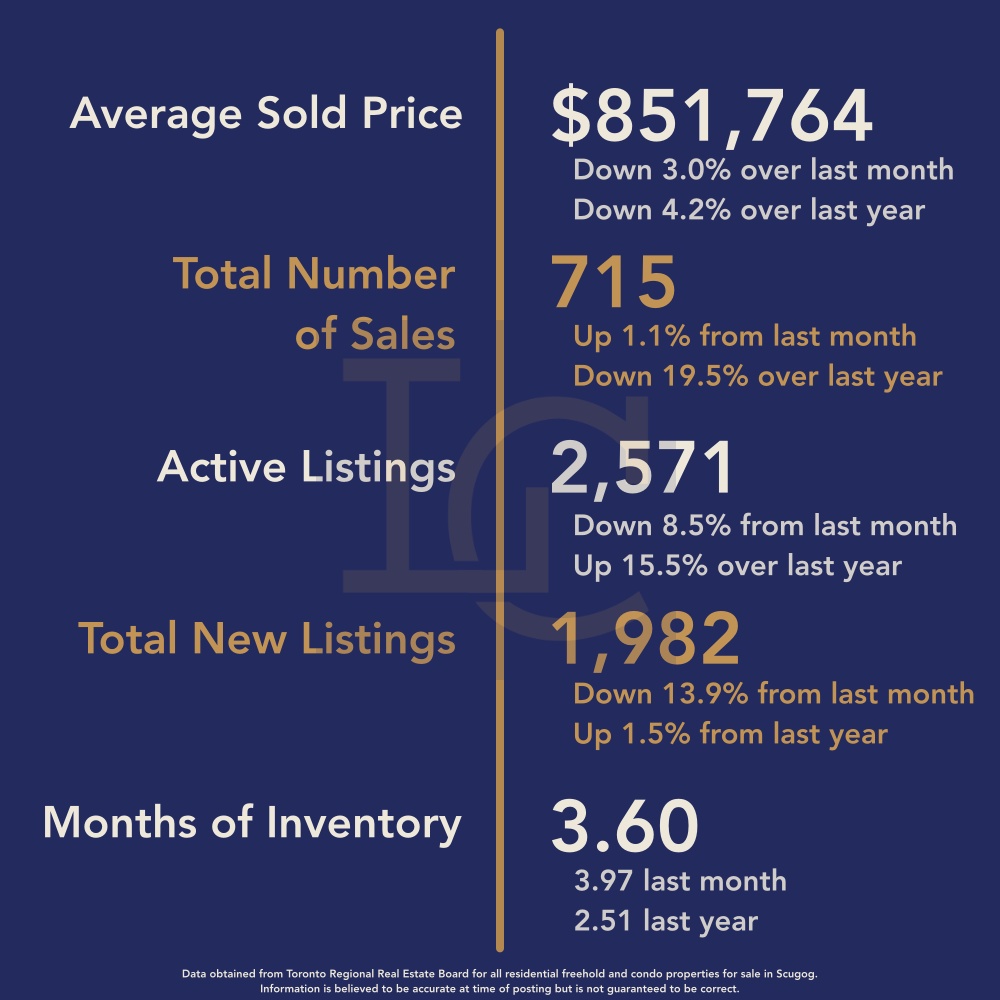
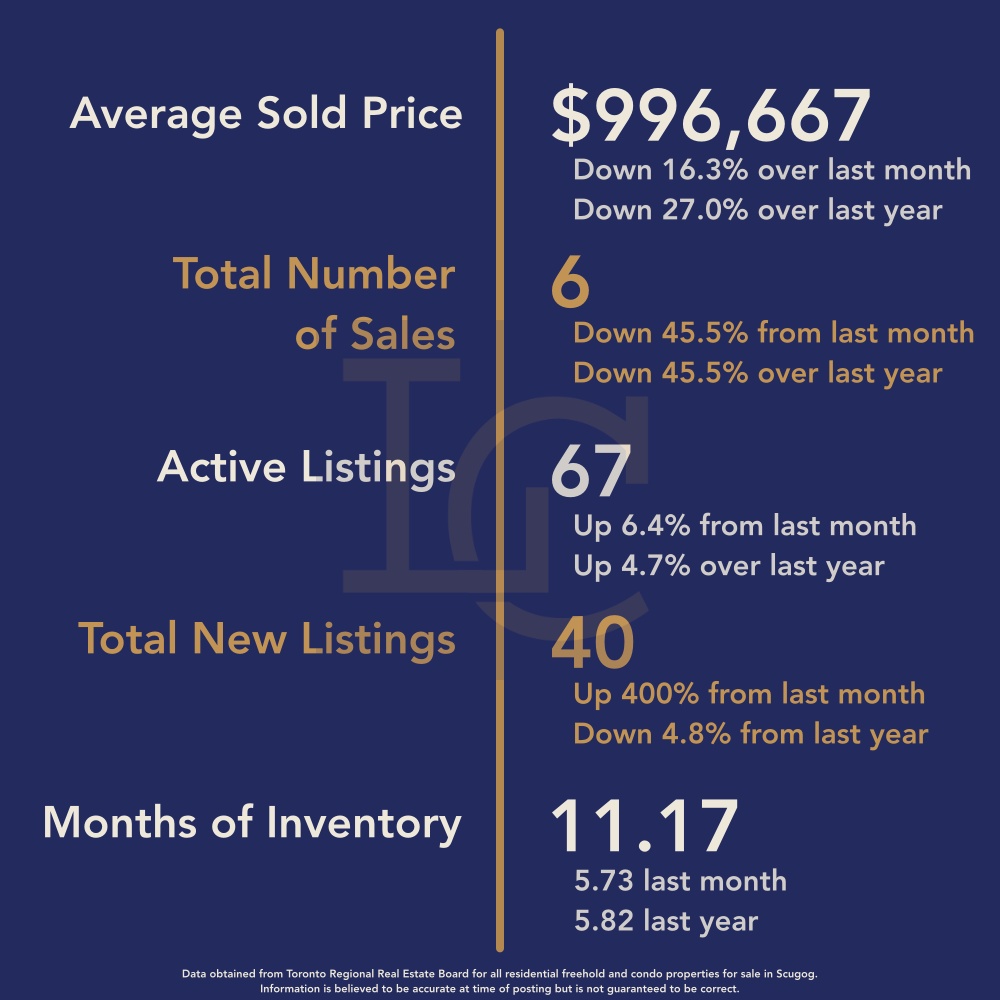
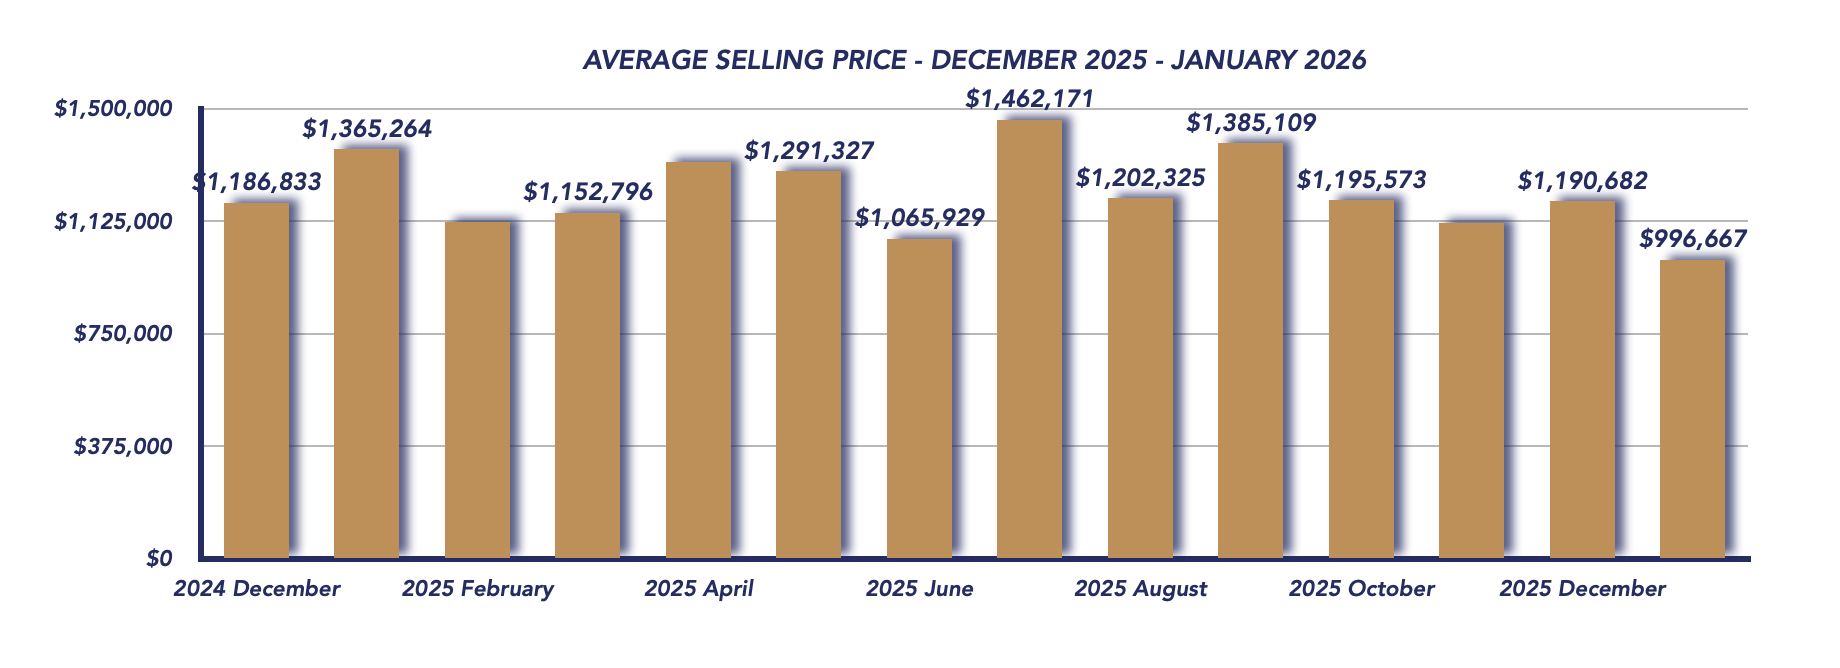
The Uxbridge housing market began the new year with a noticeable slowdown, reflecting typical seasonal trends combined with softer price performance. The average sale price in January was $996,667, representing a 16.3% decrease from December’s $1,190,682 and a significant 27% decline compared to January 2024’s $1,365,264.
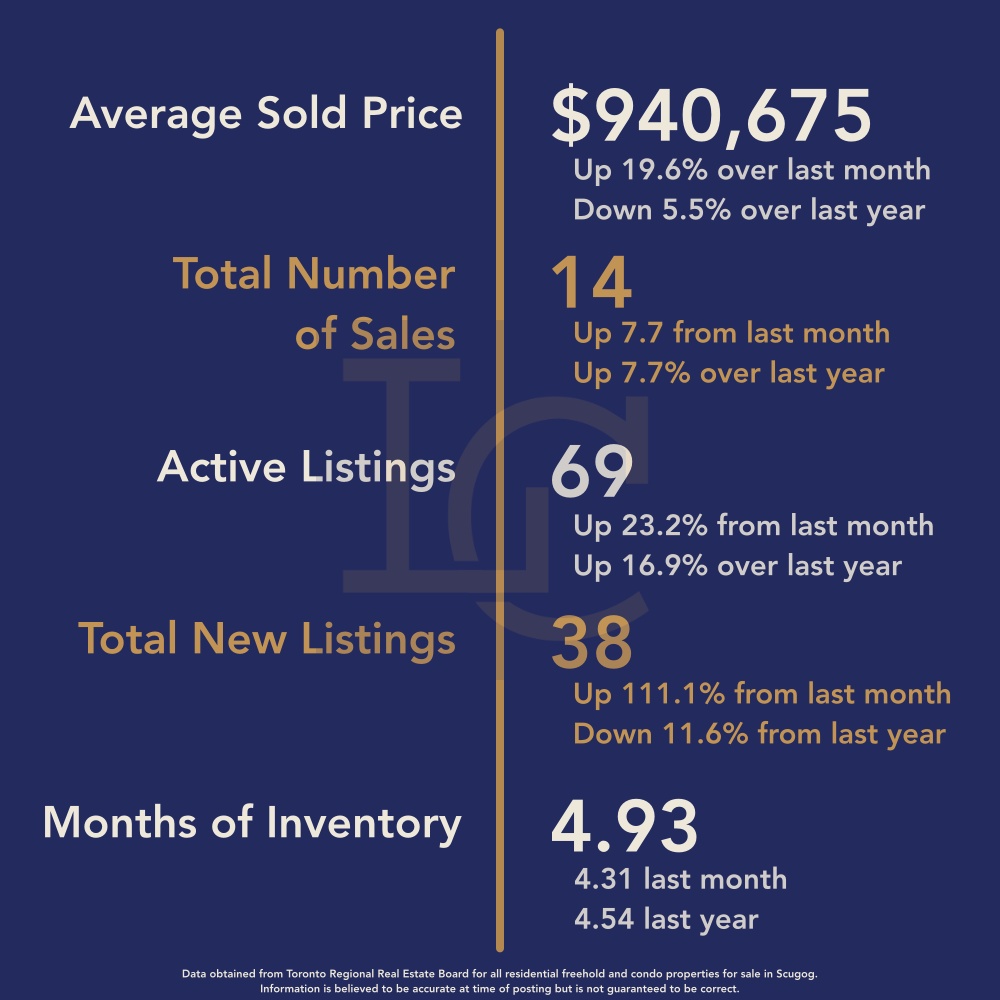
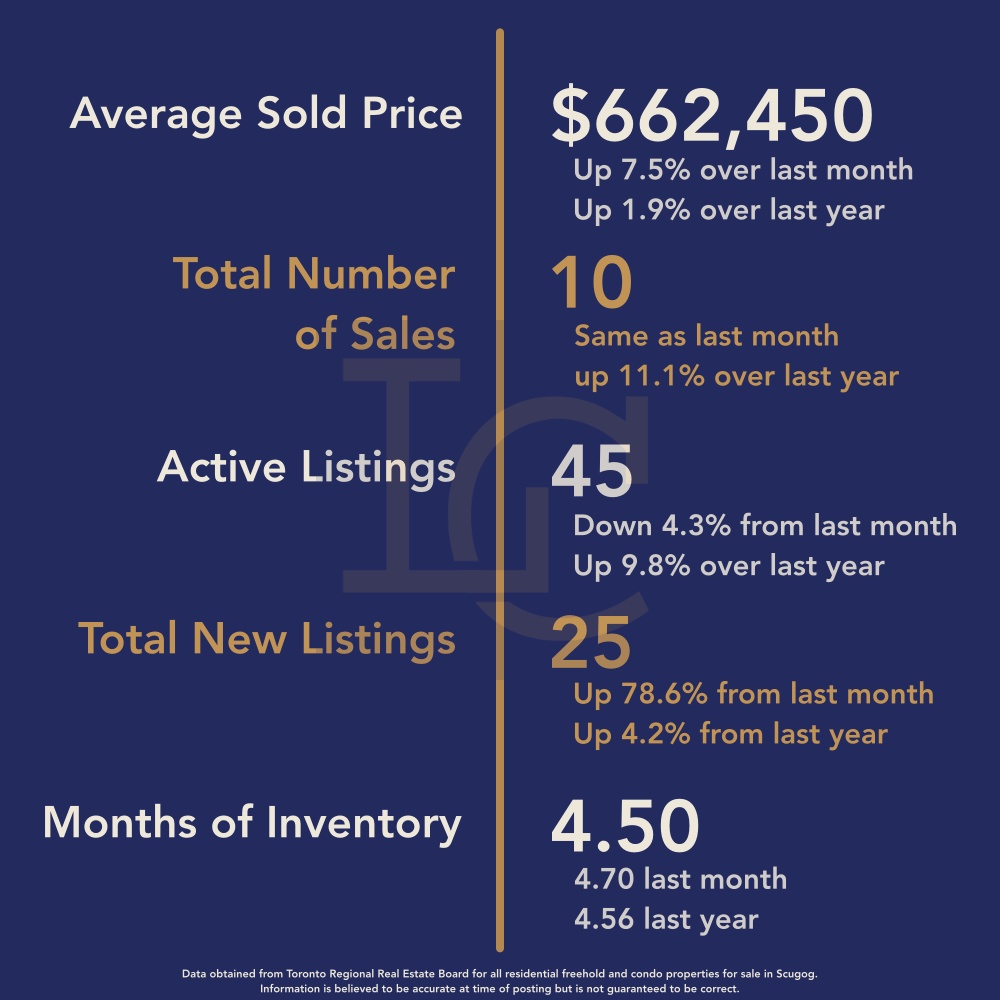
January 2026
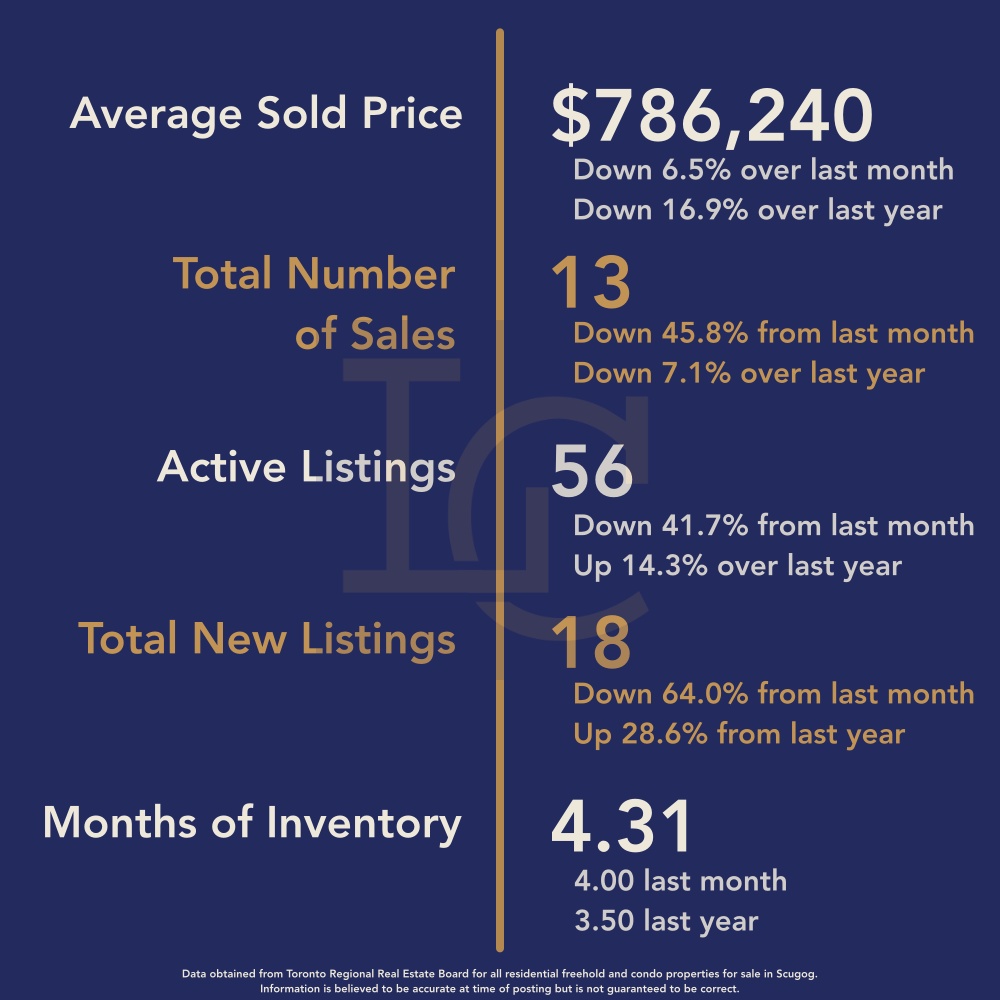
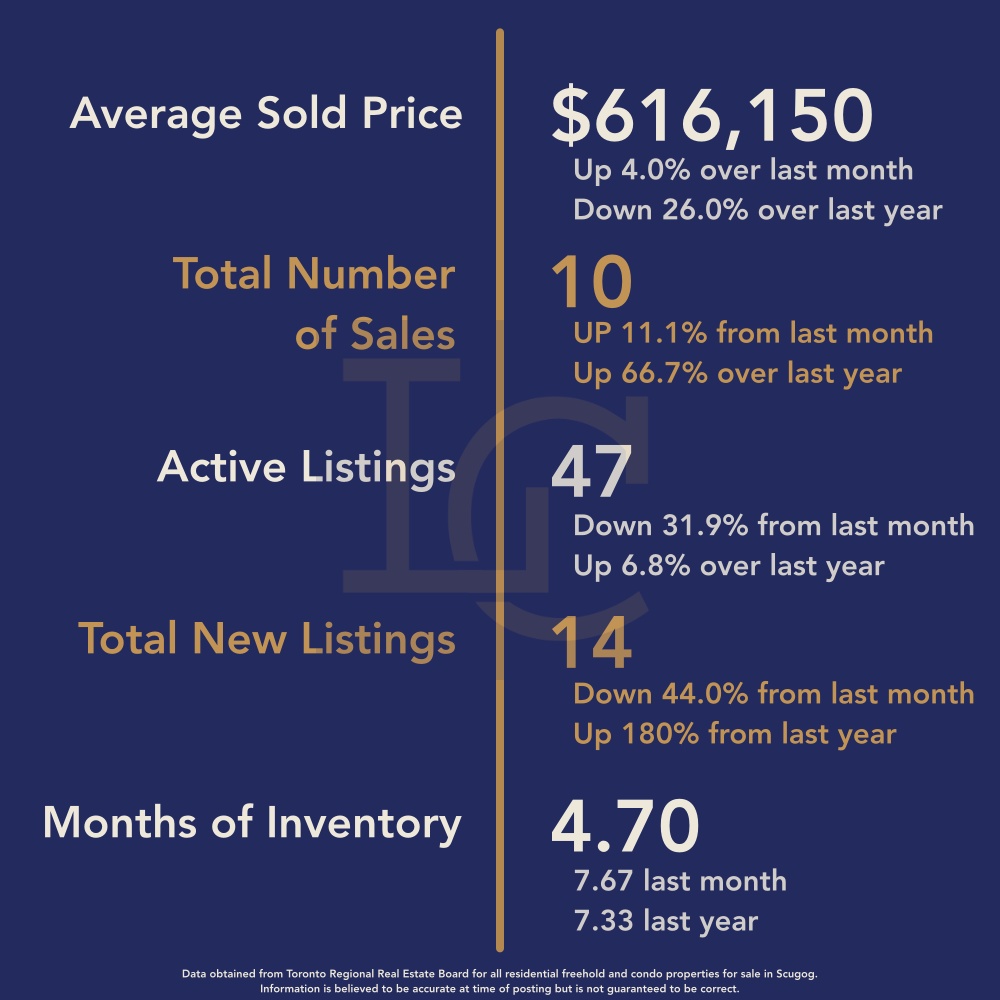
December 2025
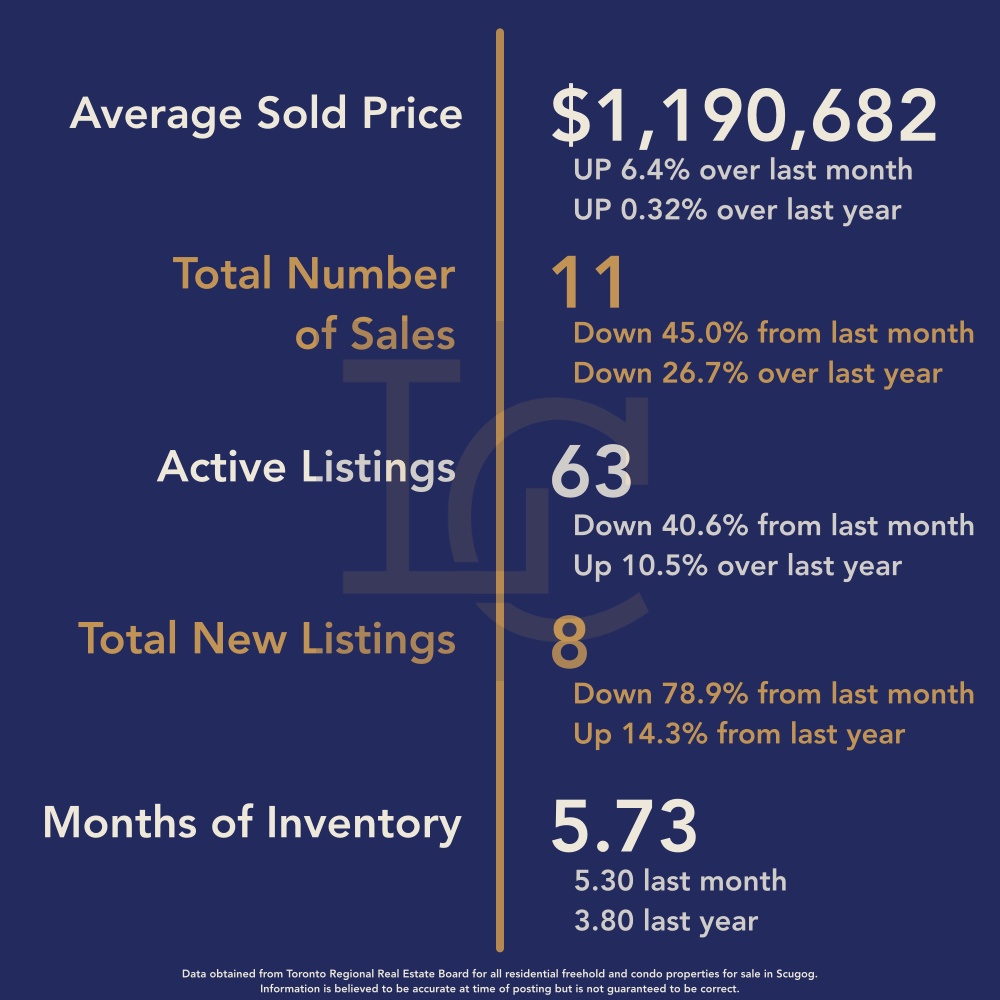
This sharp drop in average price is largely influenced by the type of properties sold during the month. In December, the market included one sale over $2 million and five between $1–$2 million, helping to support higher averages. In contrast, January saw only three properties sell above $1 million, with the highest sale reaching $1,390,000, and two condominium sales under $800,000, which pulled the overall average lower. With just six total sales, even a small shift in price mix significantly impacts the monthly average.
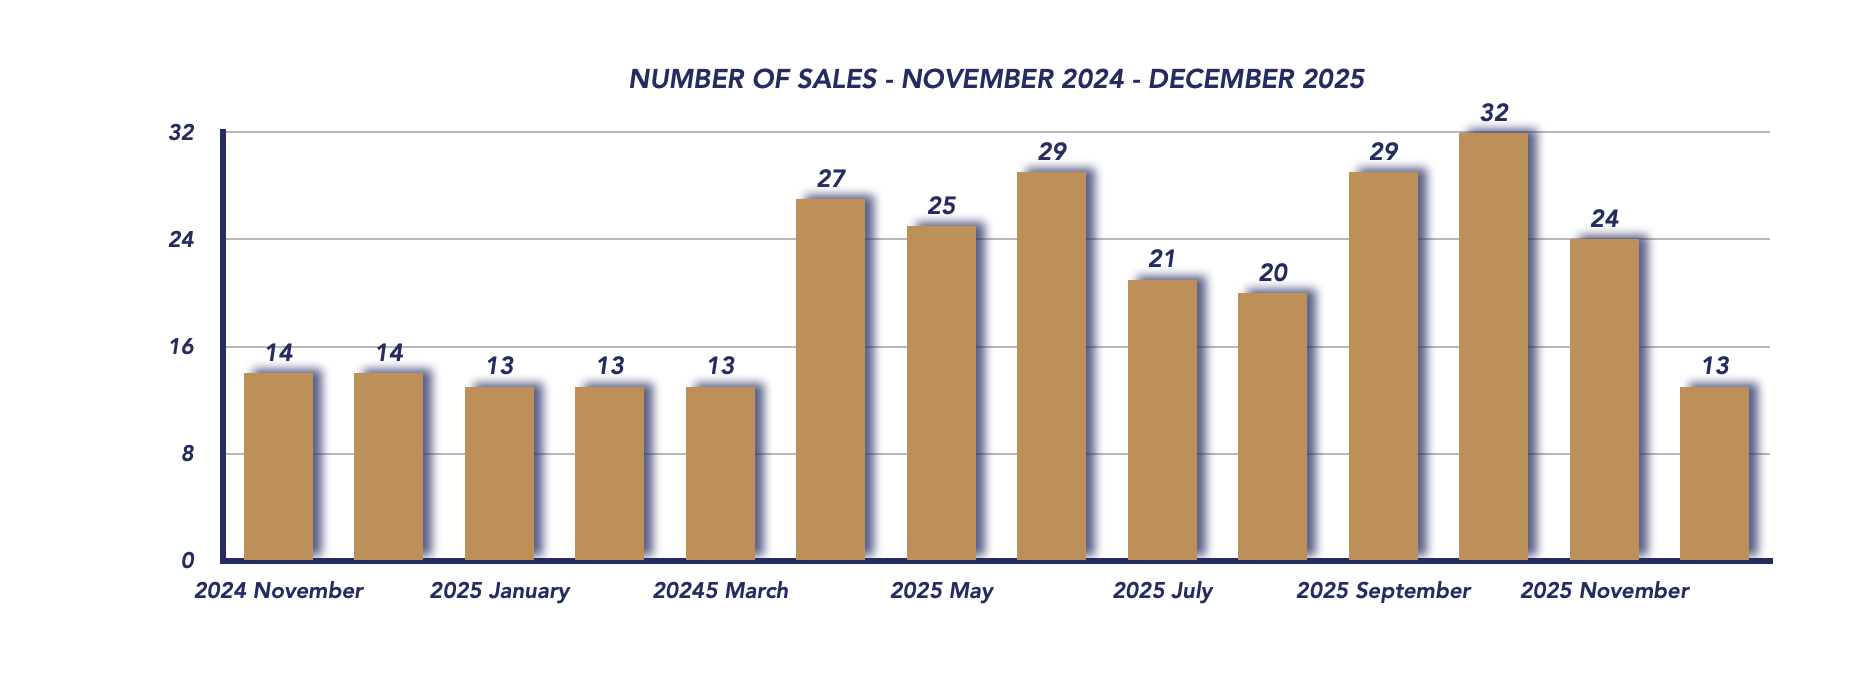
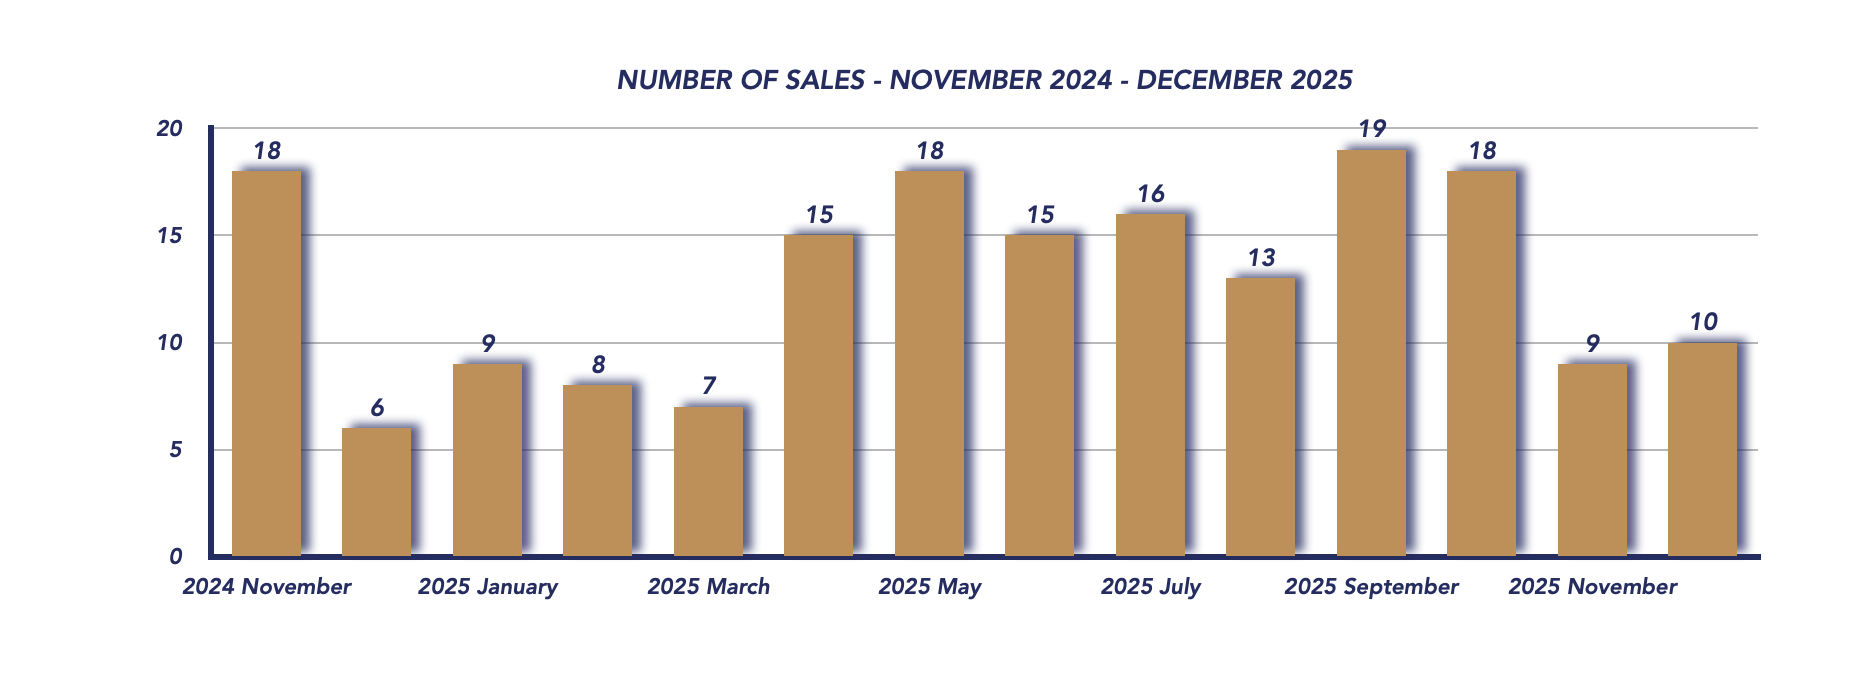
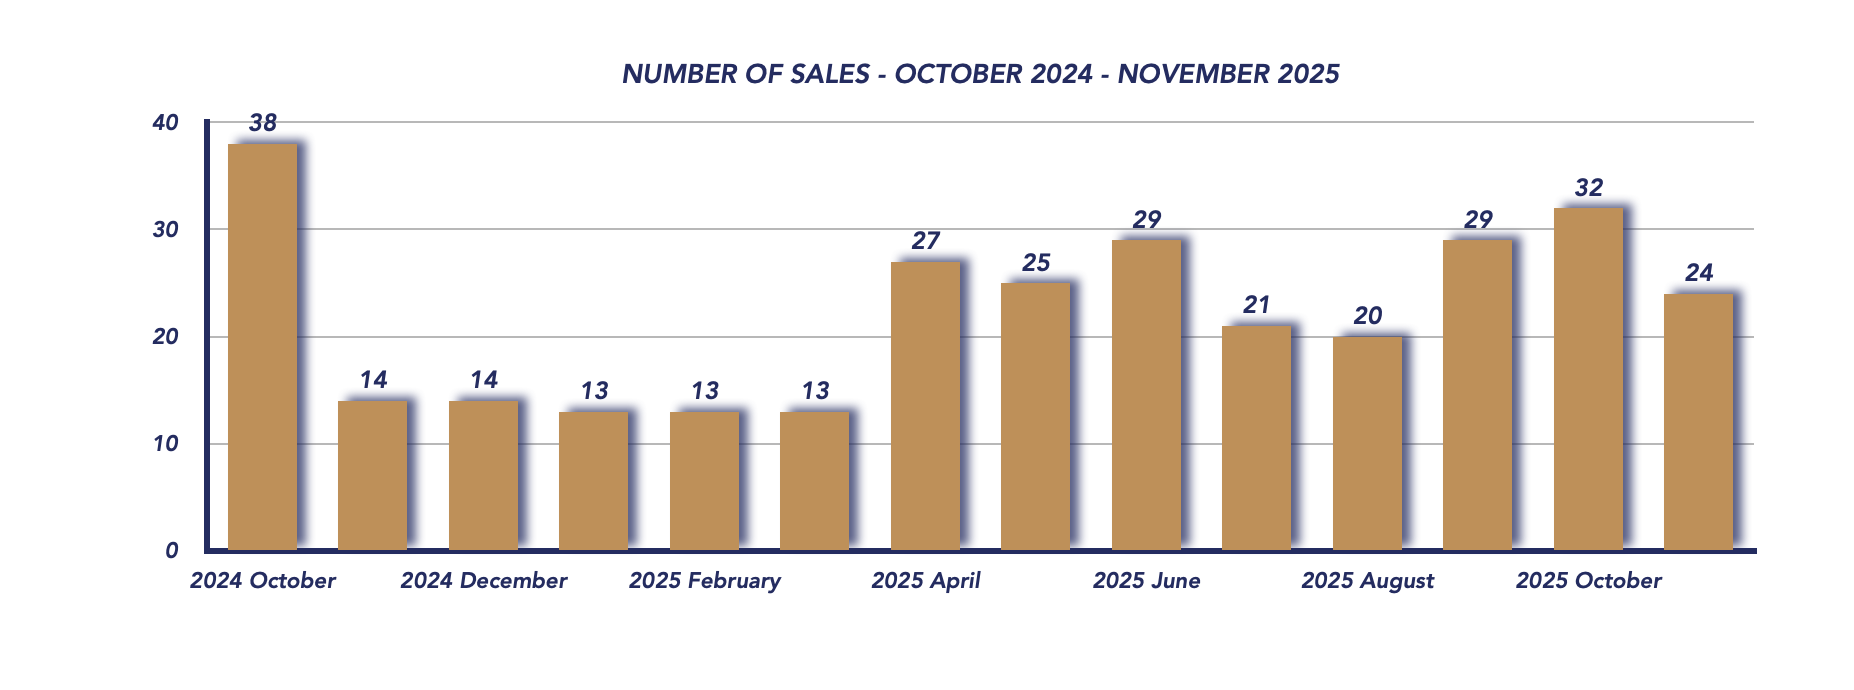
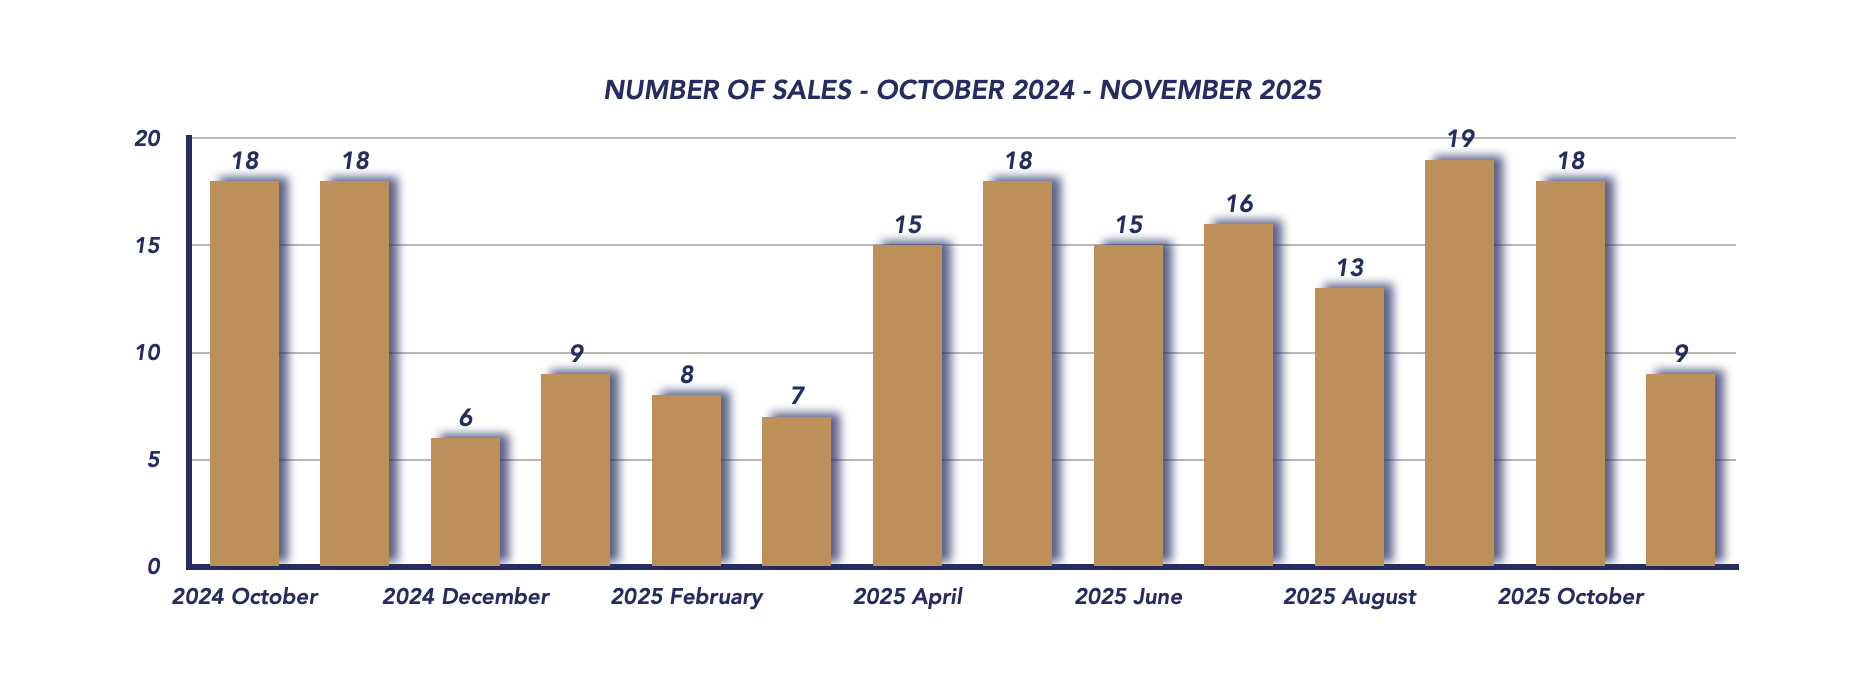
Sales Activity
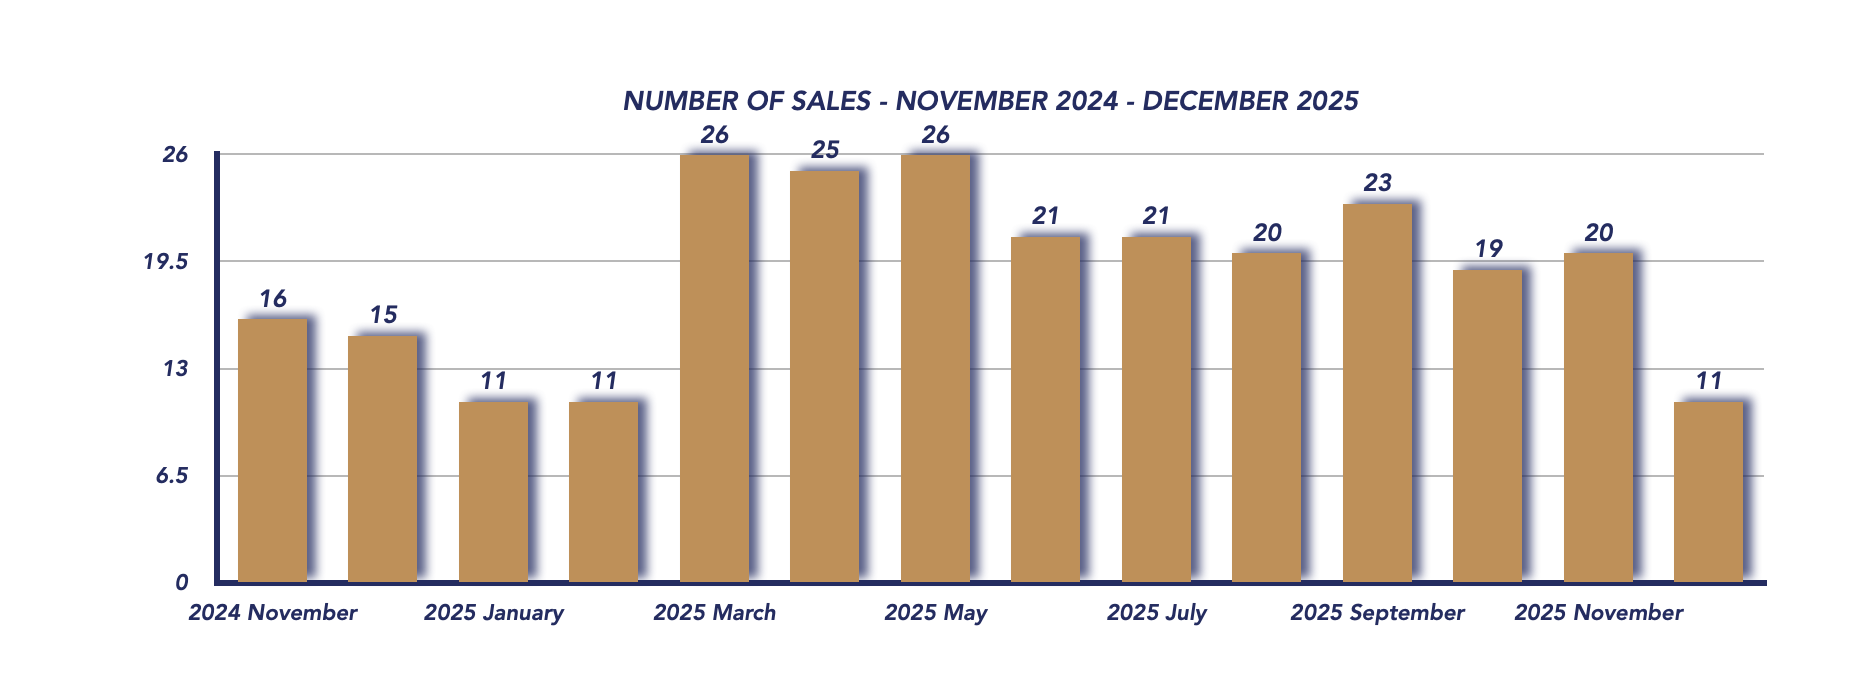
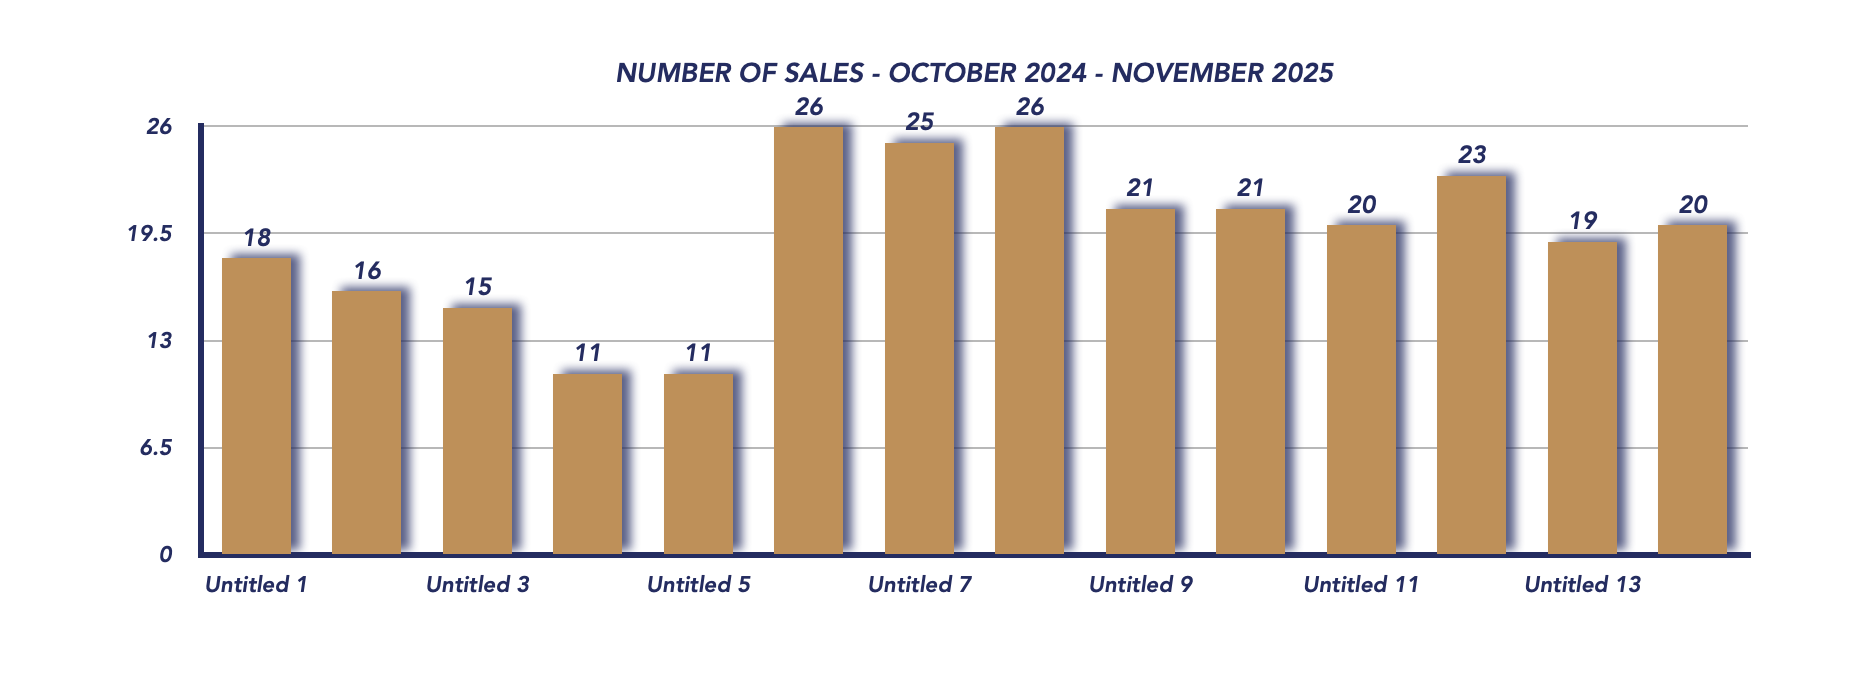
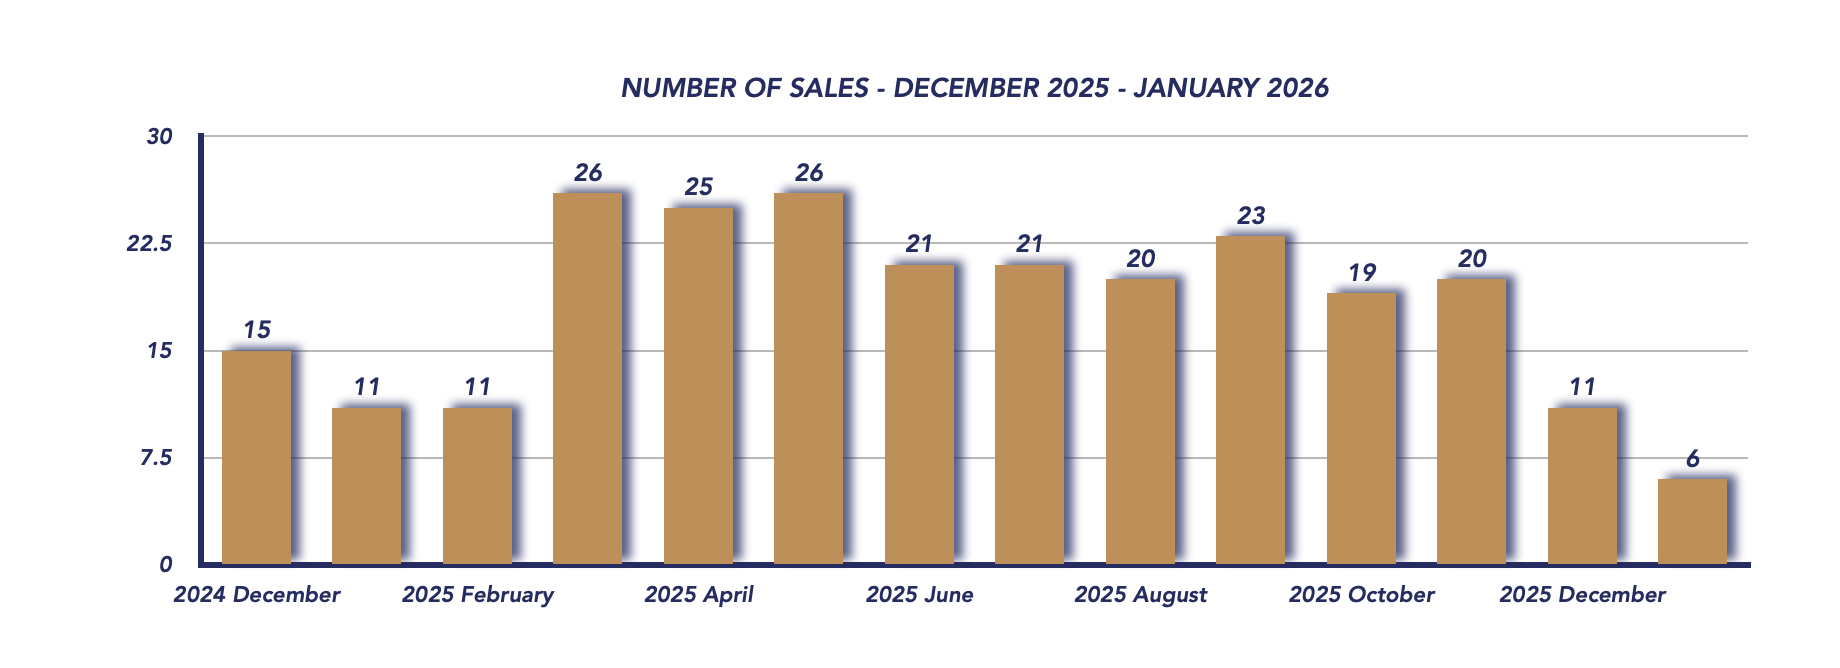
Total sales fell to just 6 transactions, down from 11 in December and 11 in January 2024. This represents a sharp decline in activity and highlights the slower pace typical of early winter markets. However, this drop is more pronounced than usual and signals a cautious start to the year for buyers.
Sale-to-List Price Ratio
The sale-to-list price ratio edged up to 94%, compared to 93% in December. While still below fall levels, this slight improvement suggests that sellers who priced appropriately were able to secure competitive offers despite reduced demand.
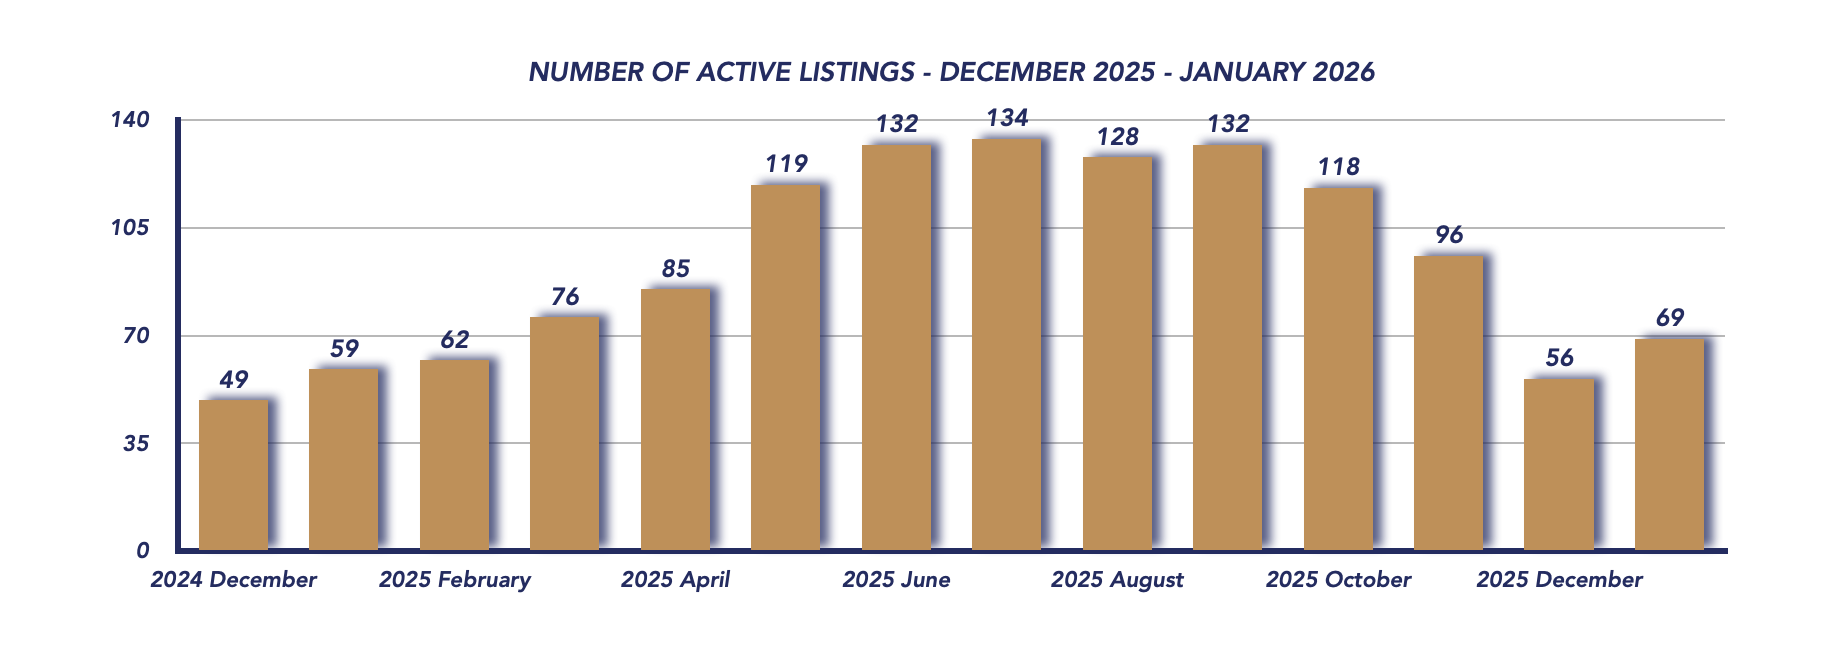
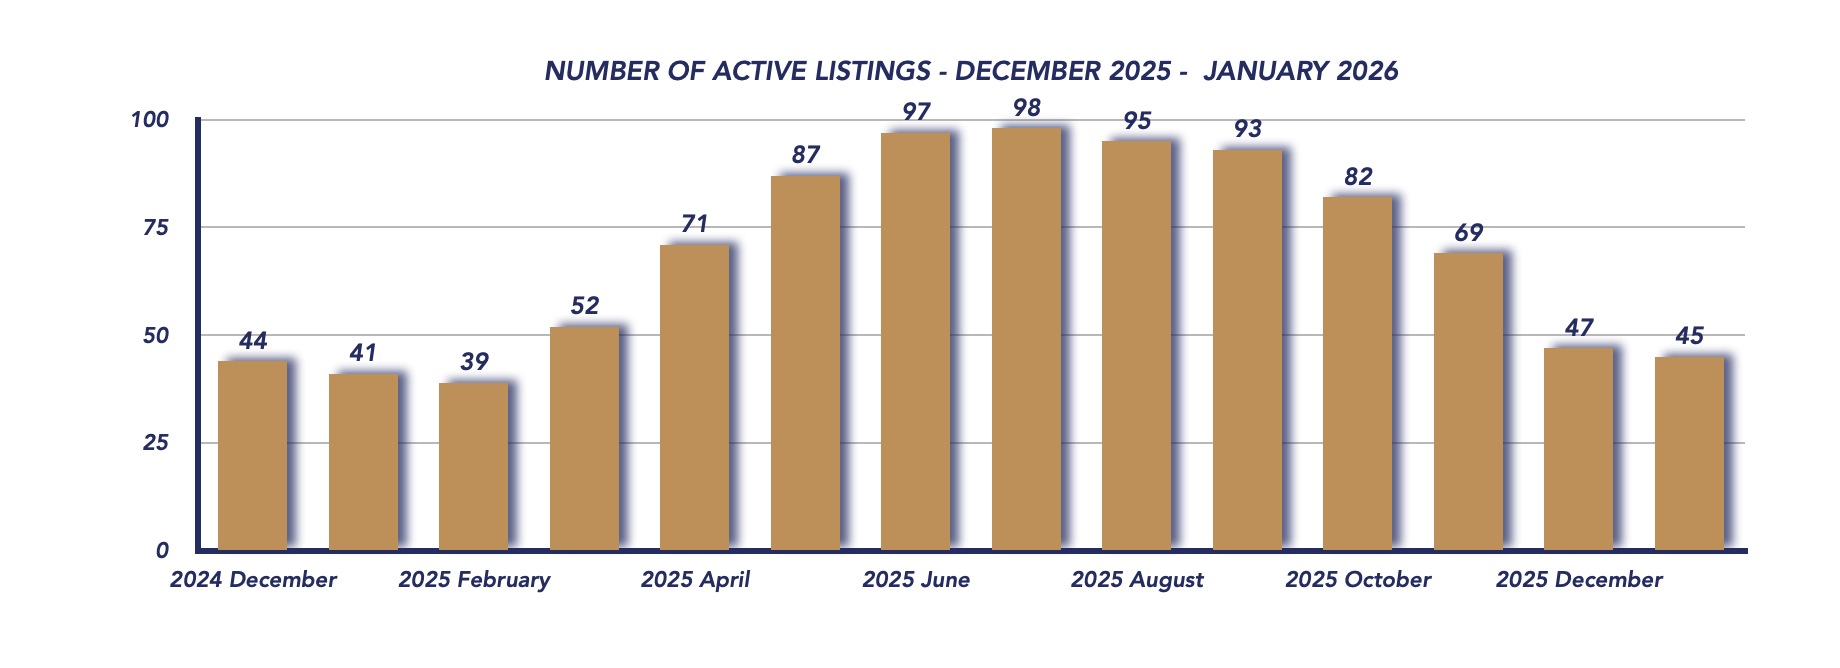
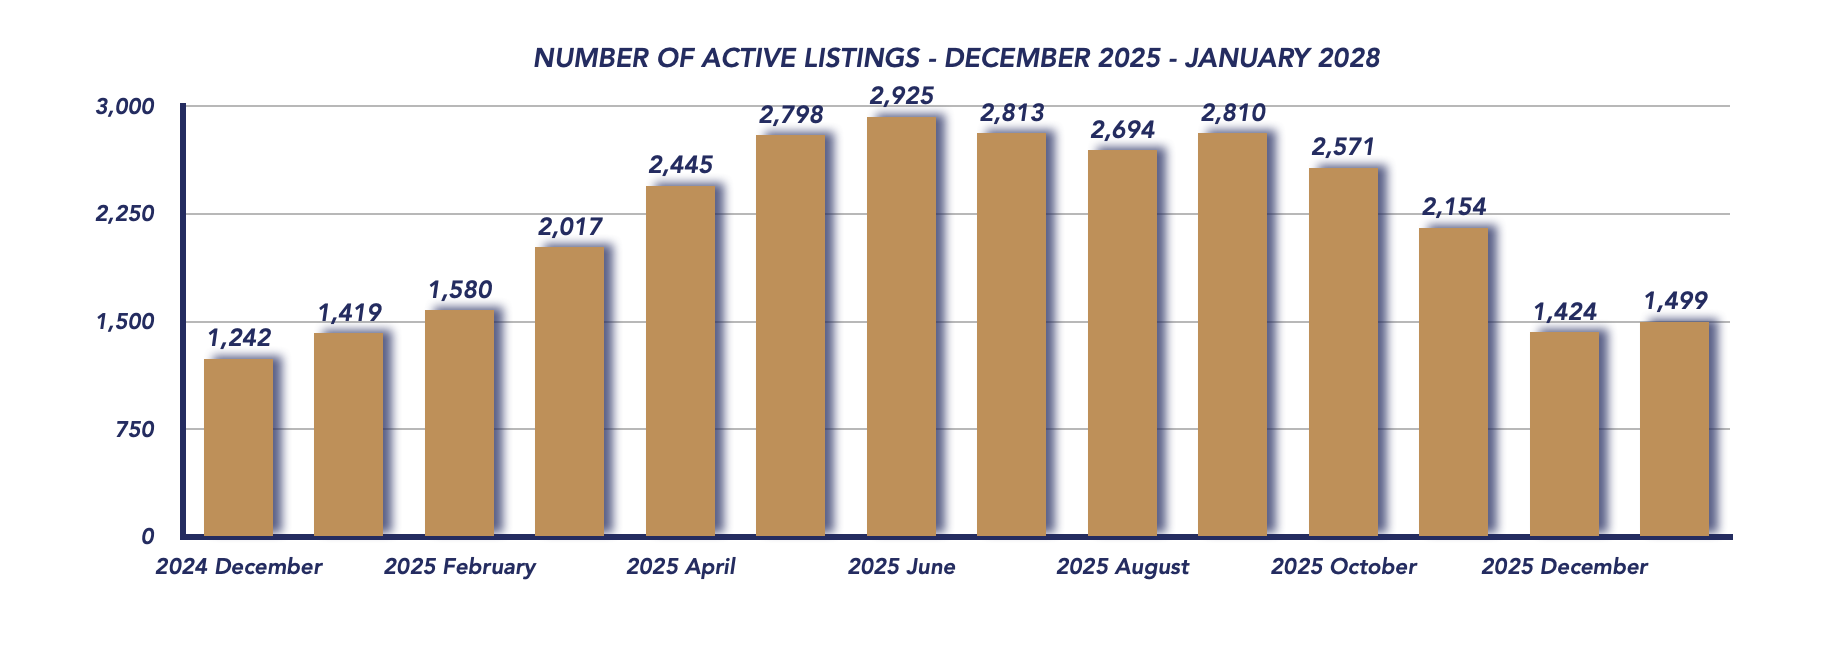
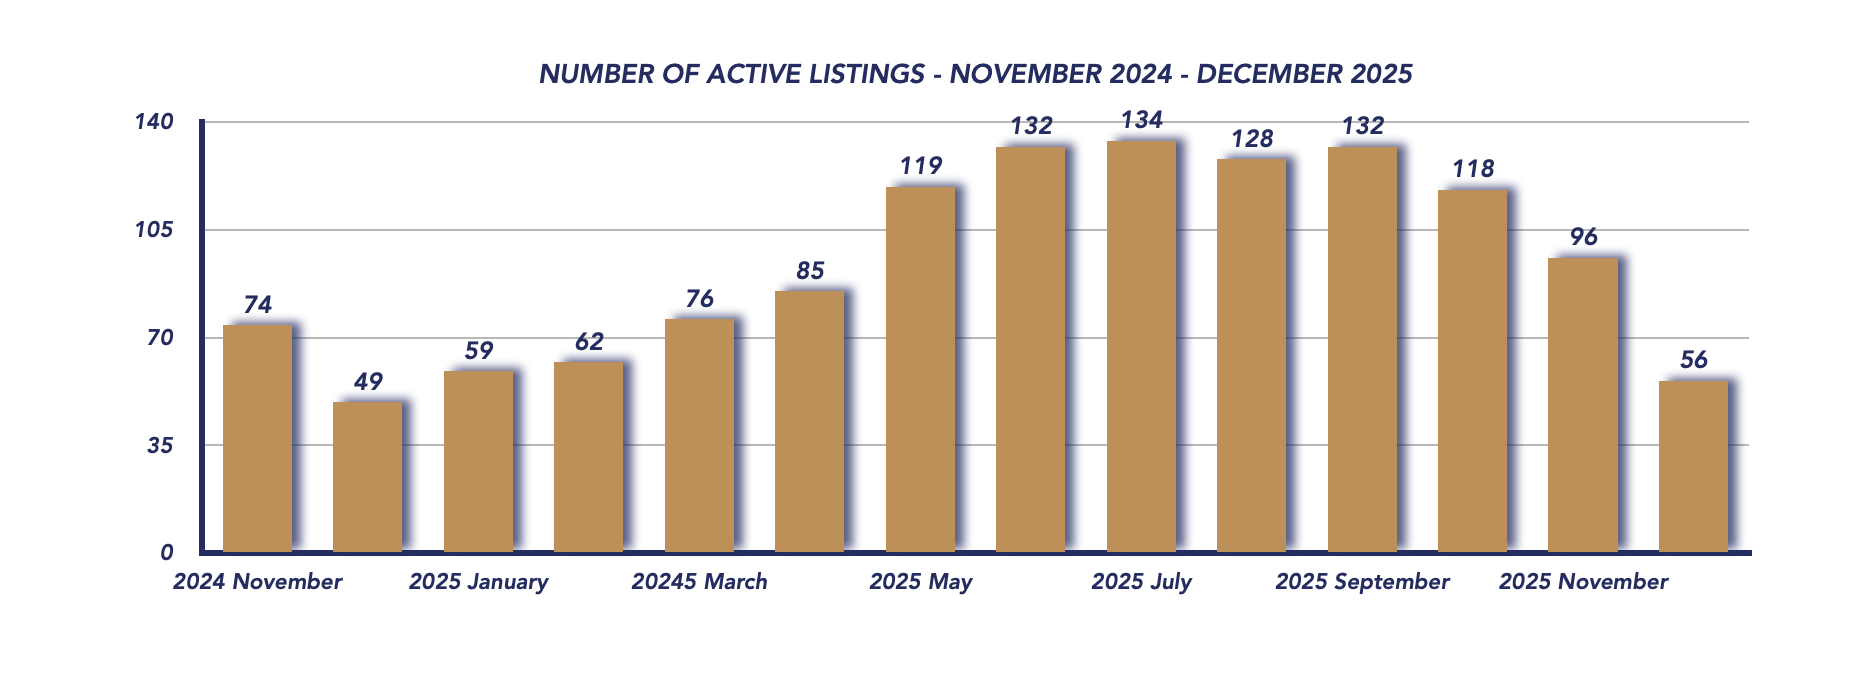
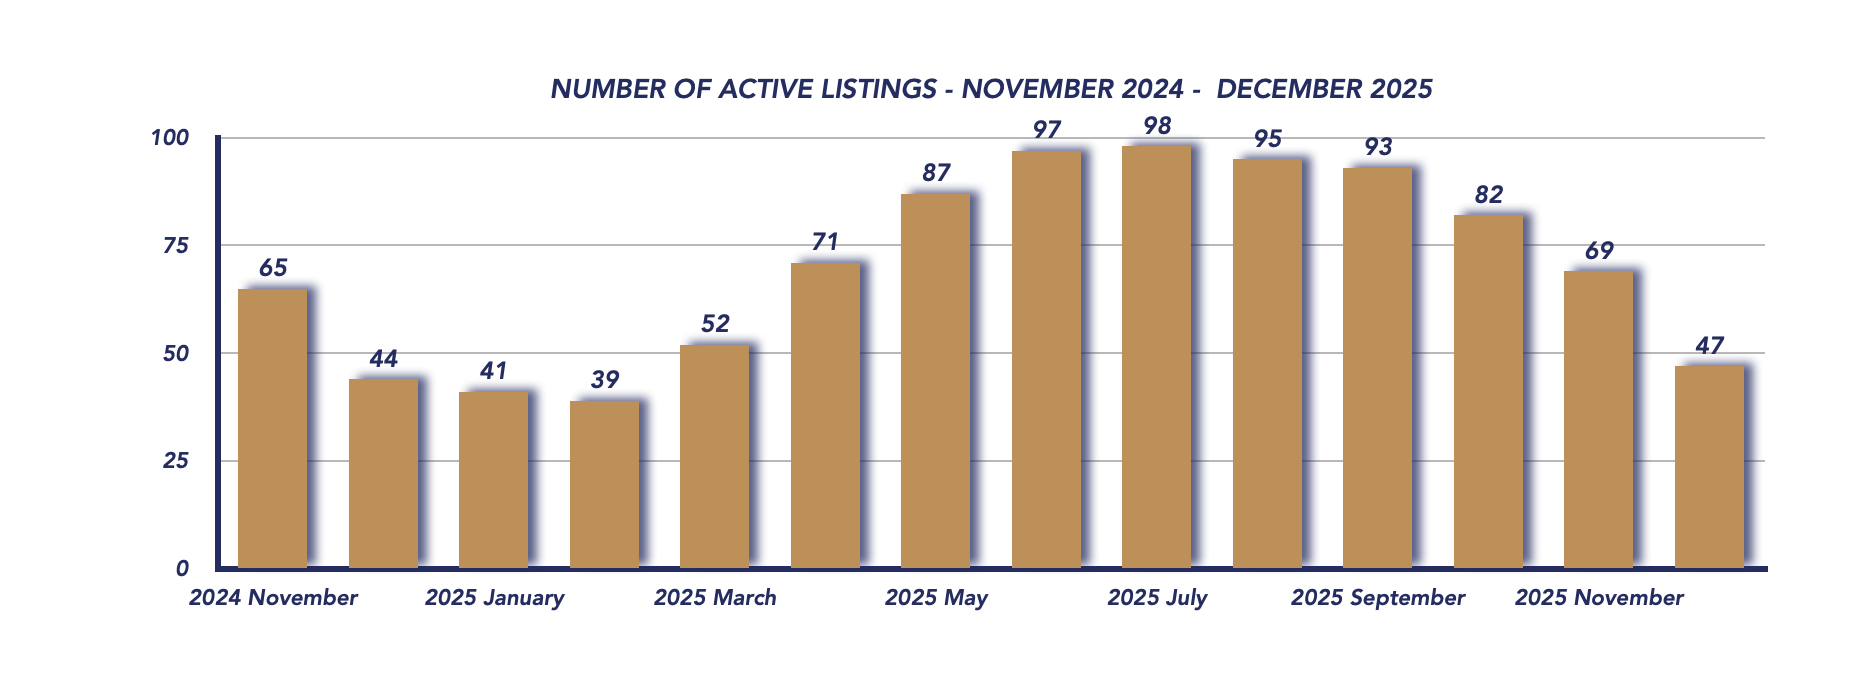
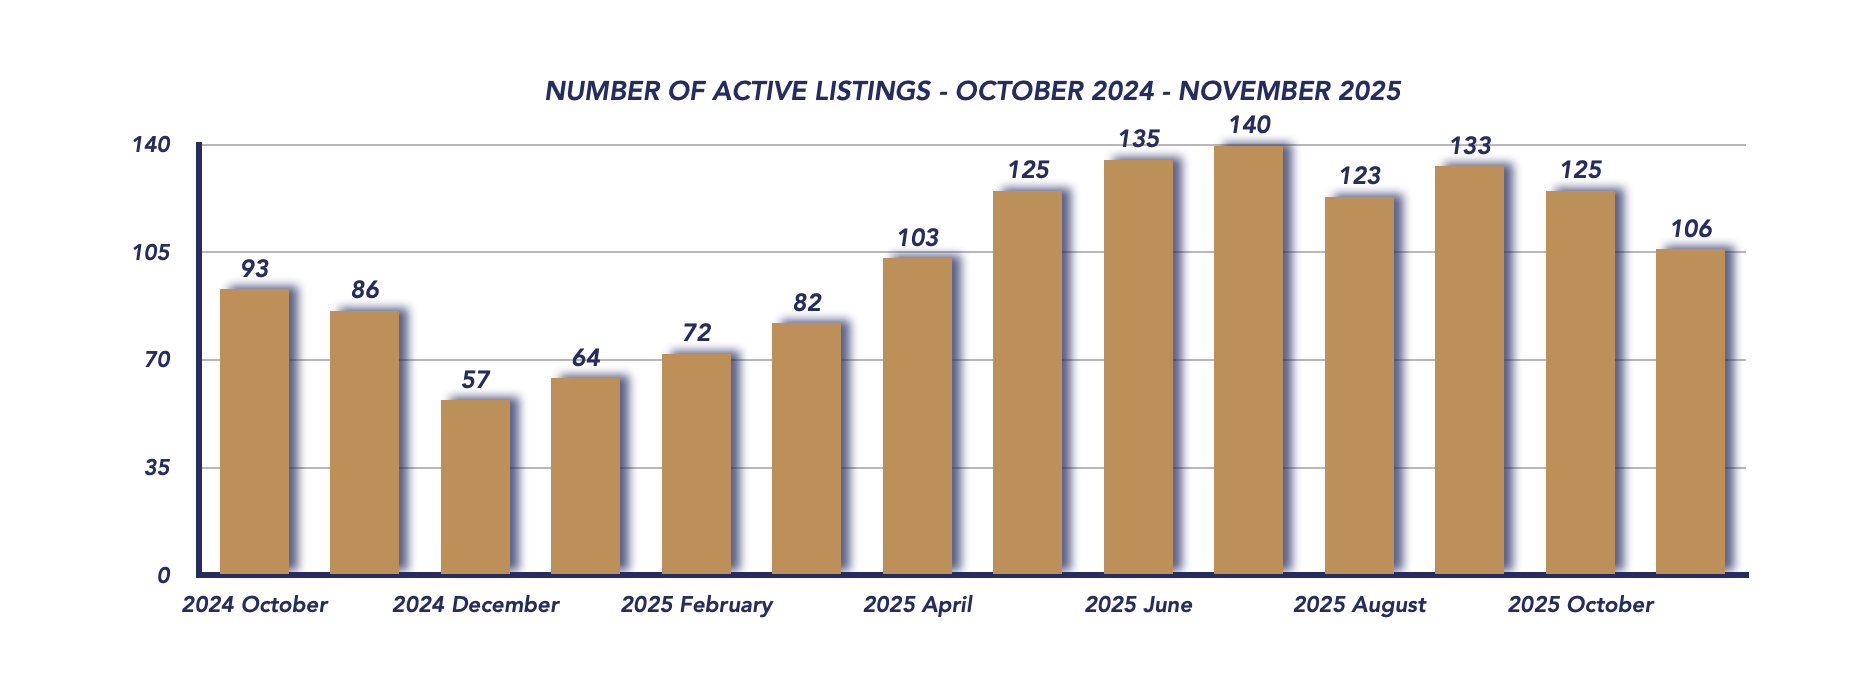
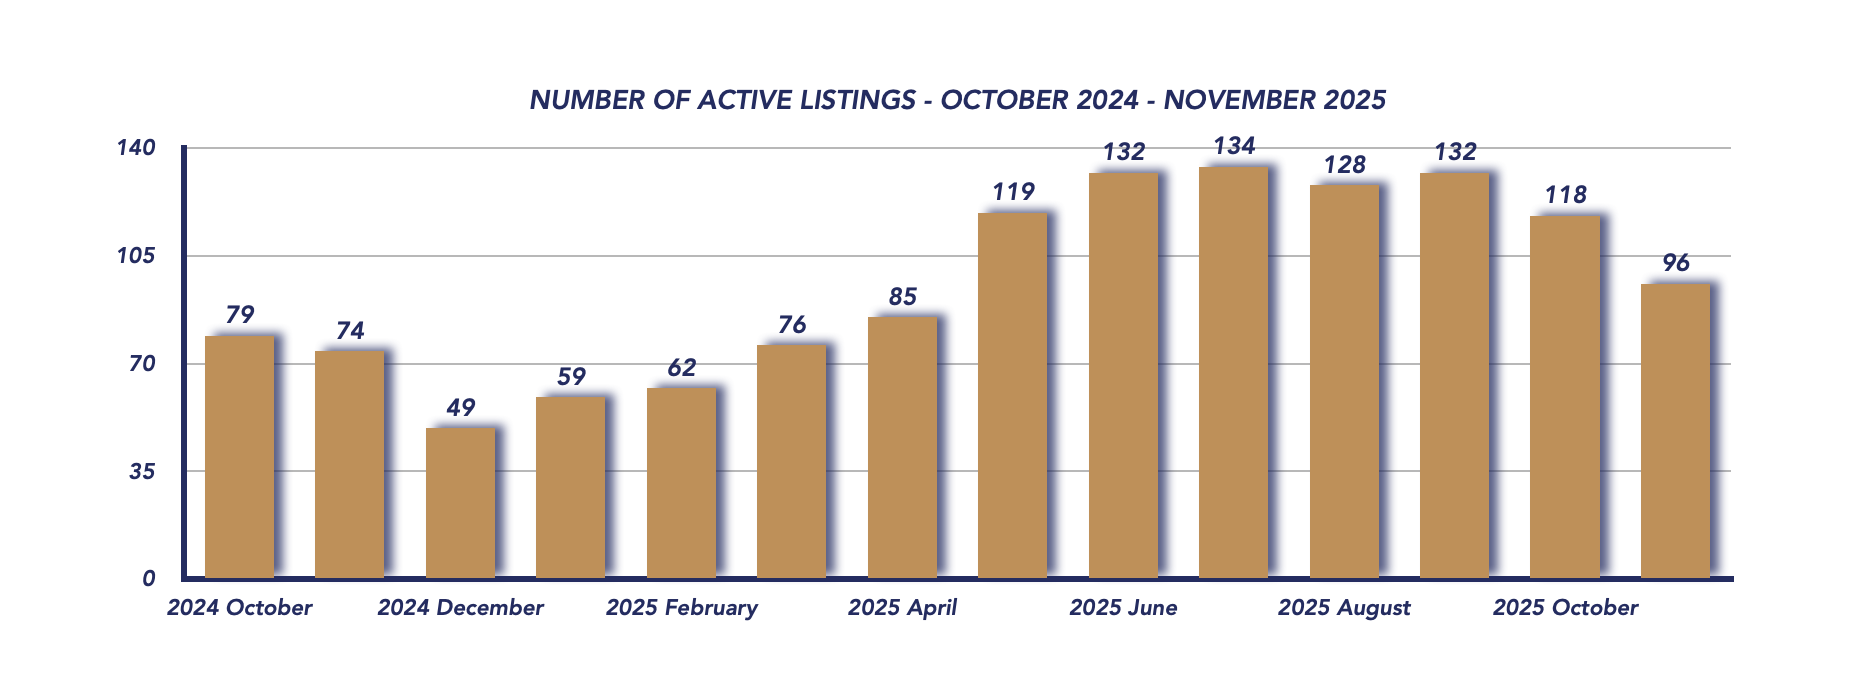
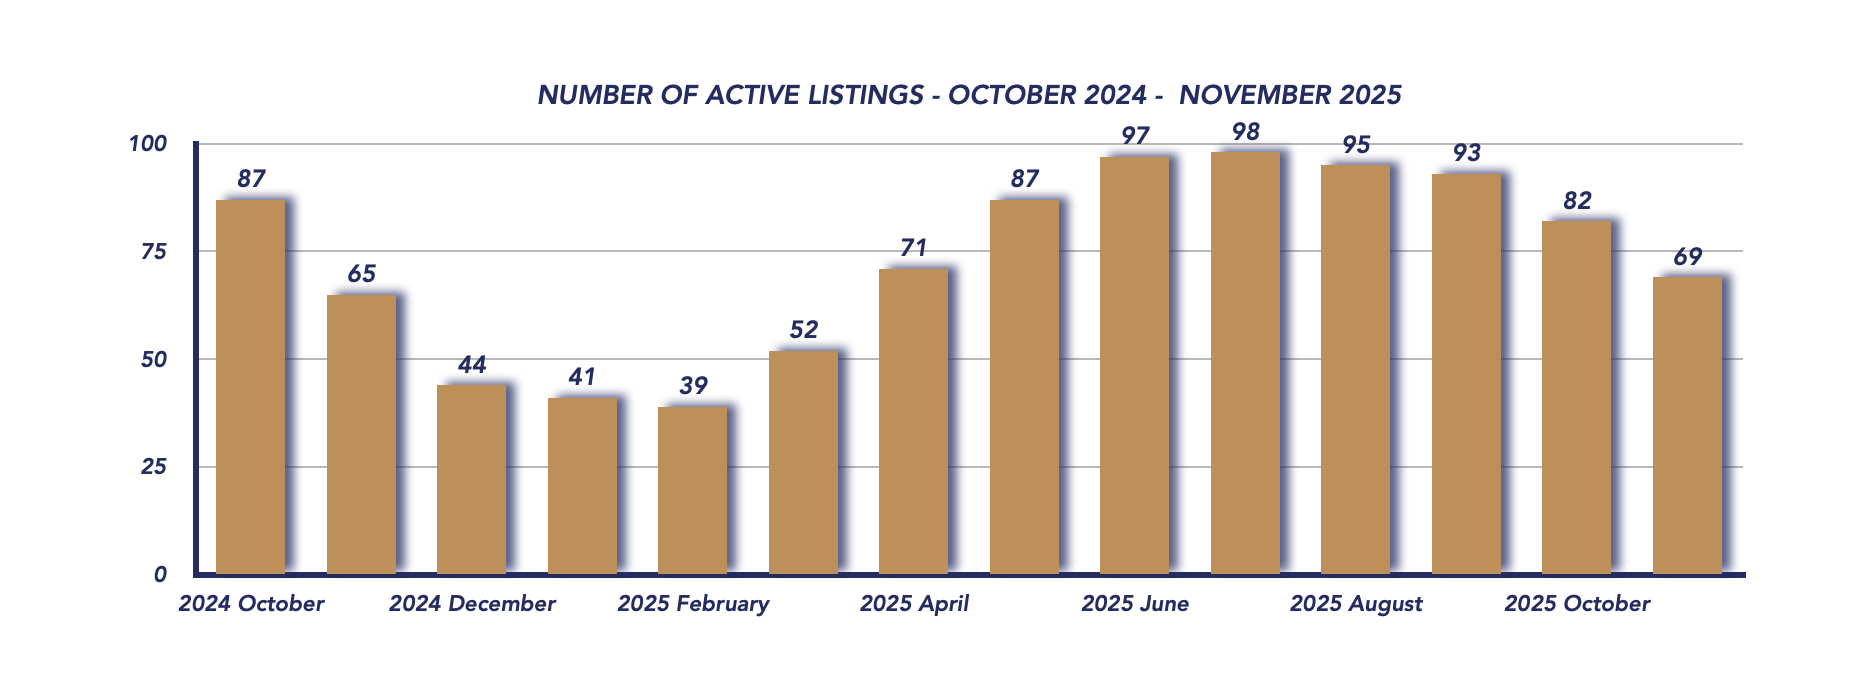
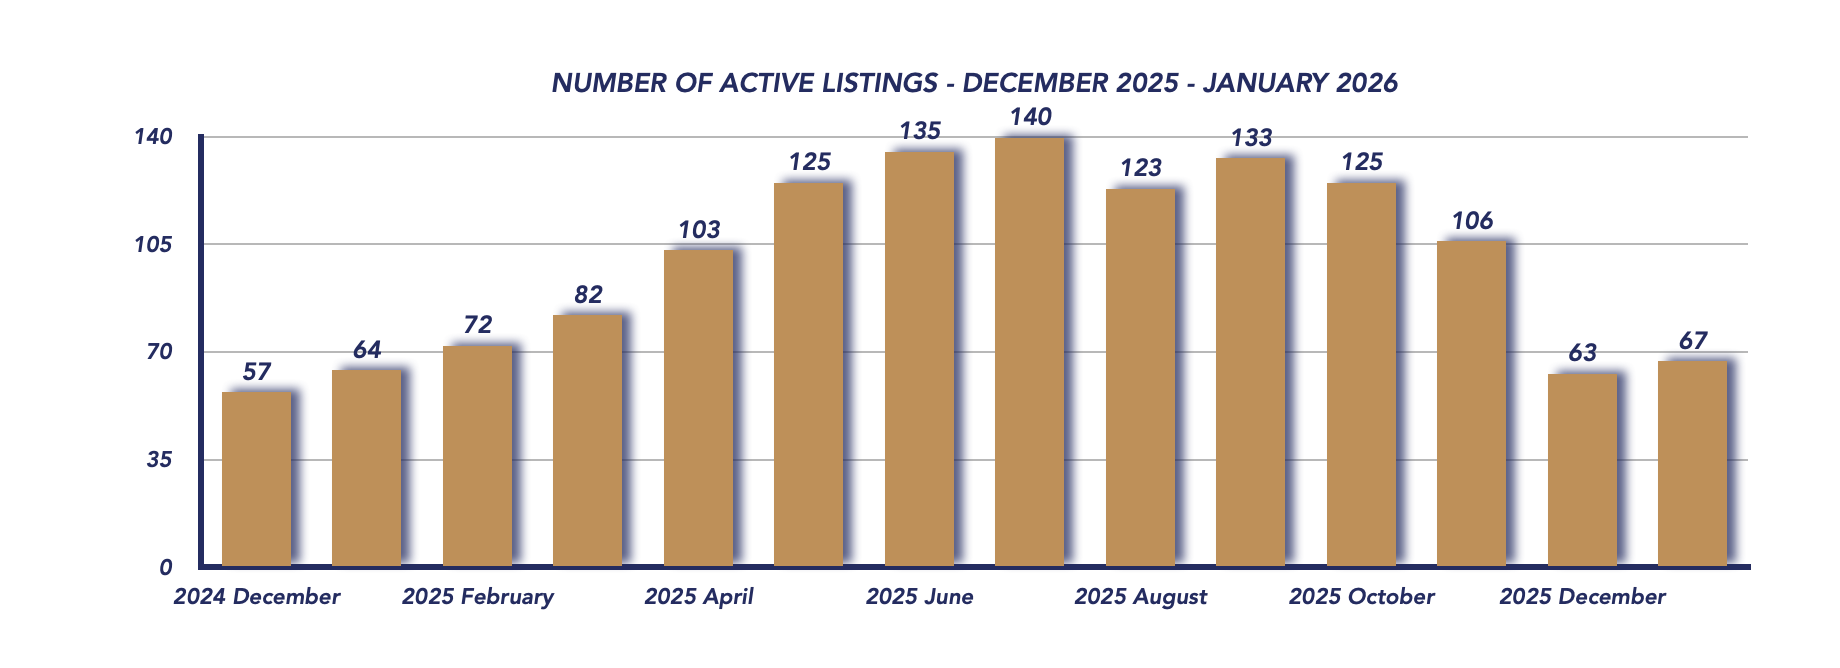
Active Listings
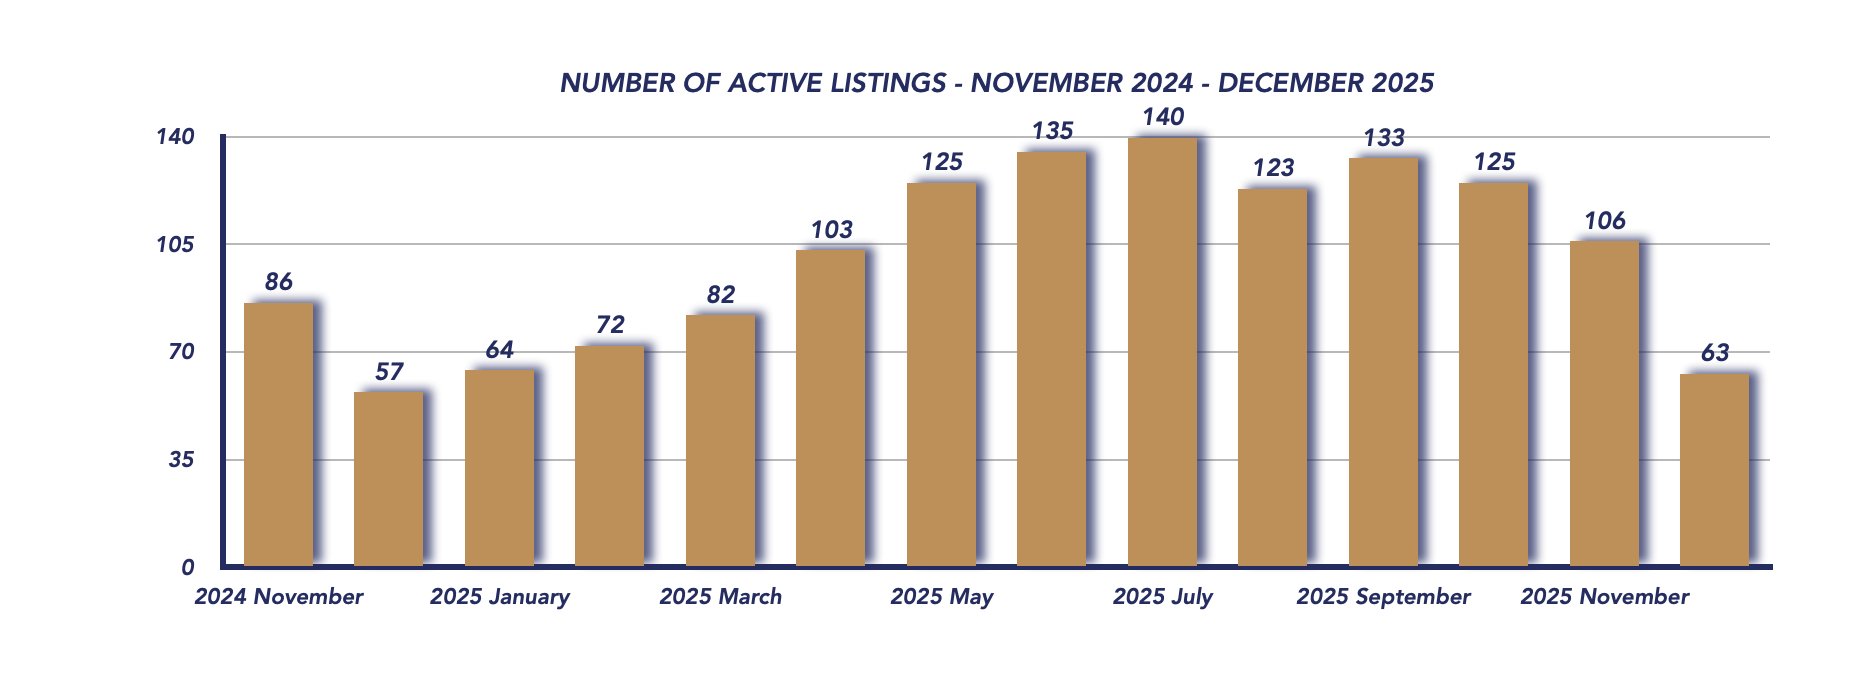
Inventory remained relatively stable with 67 active listings, slightly up from 63 in December and 64 last January. While supply hasn’t surged dramatically, the significant drop in sales activity has increased overall market balance in favour of buyers.
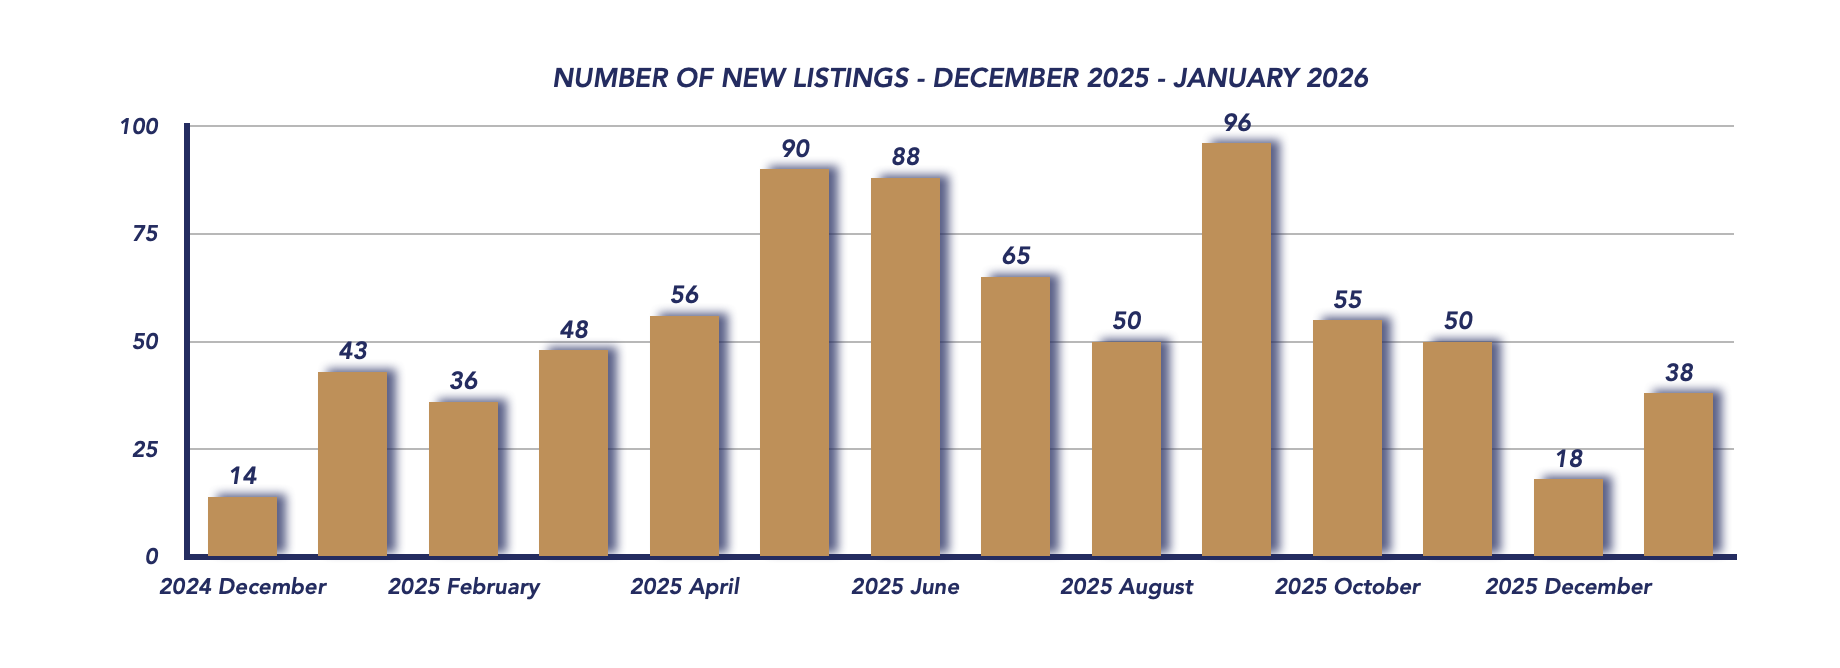
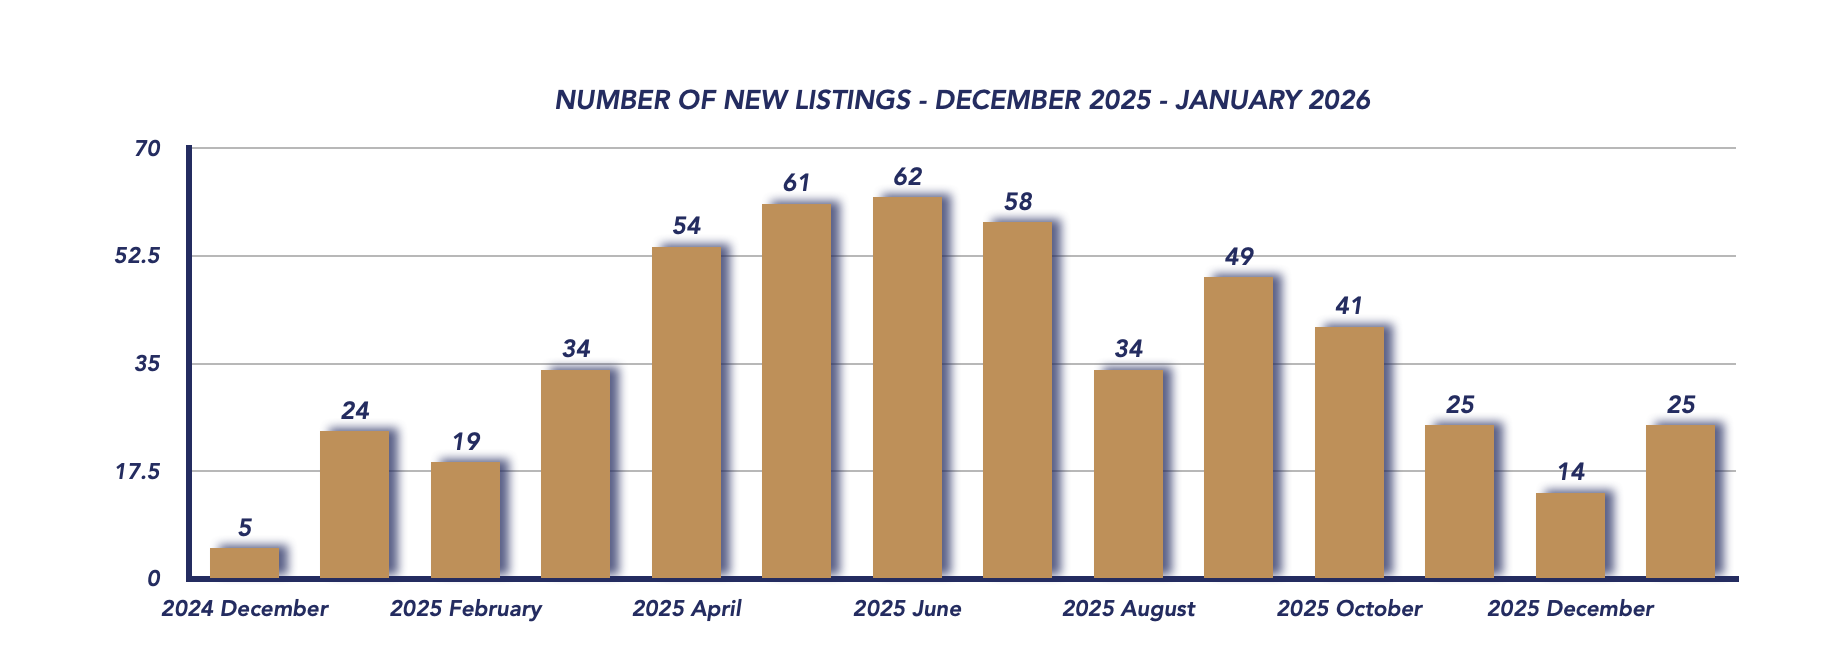
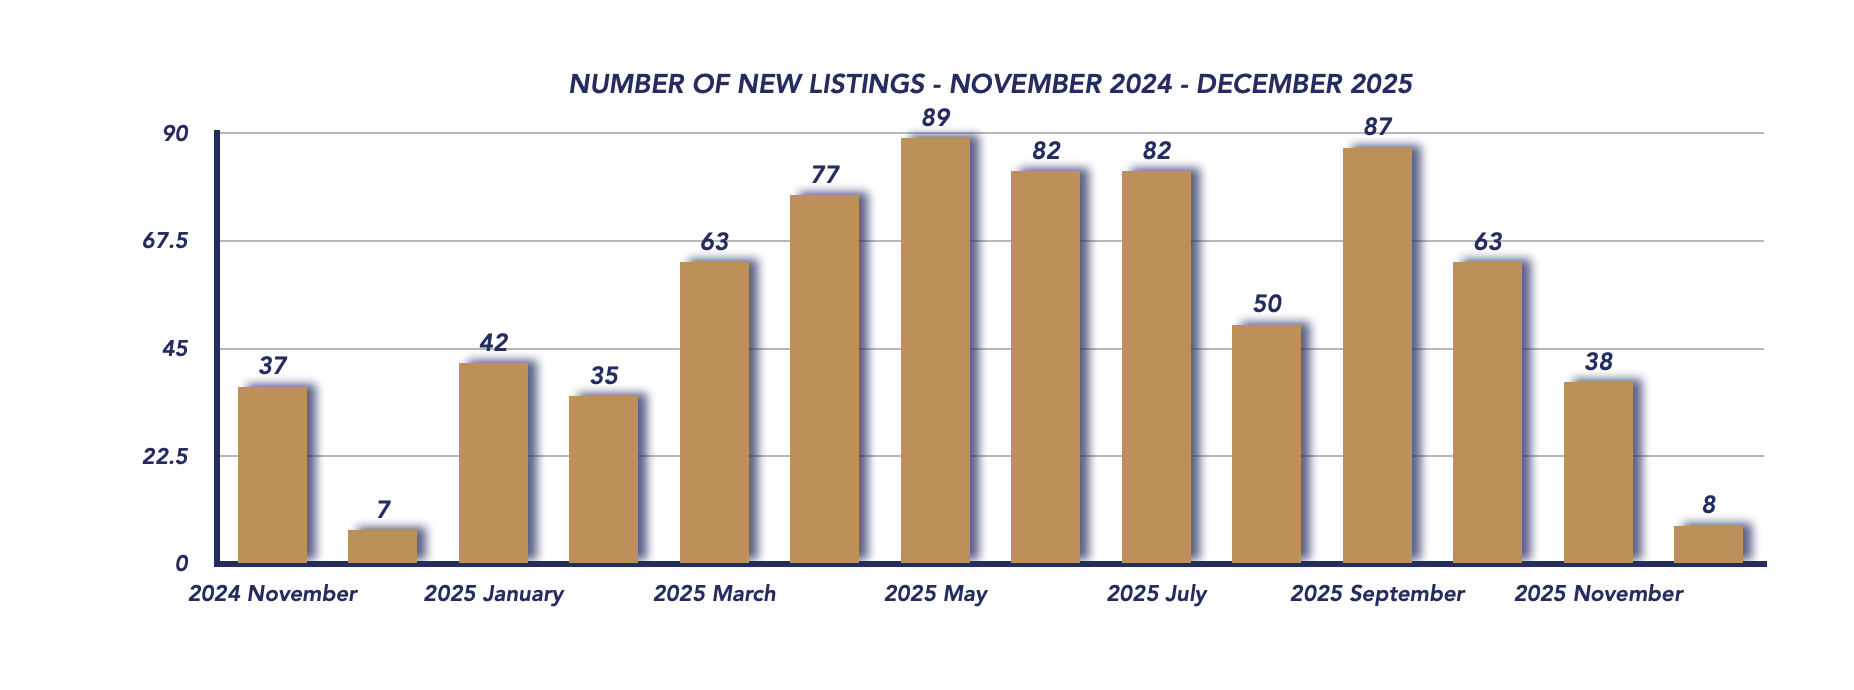
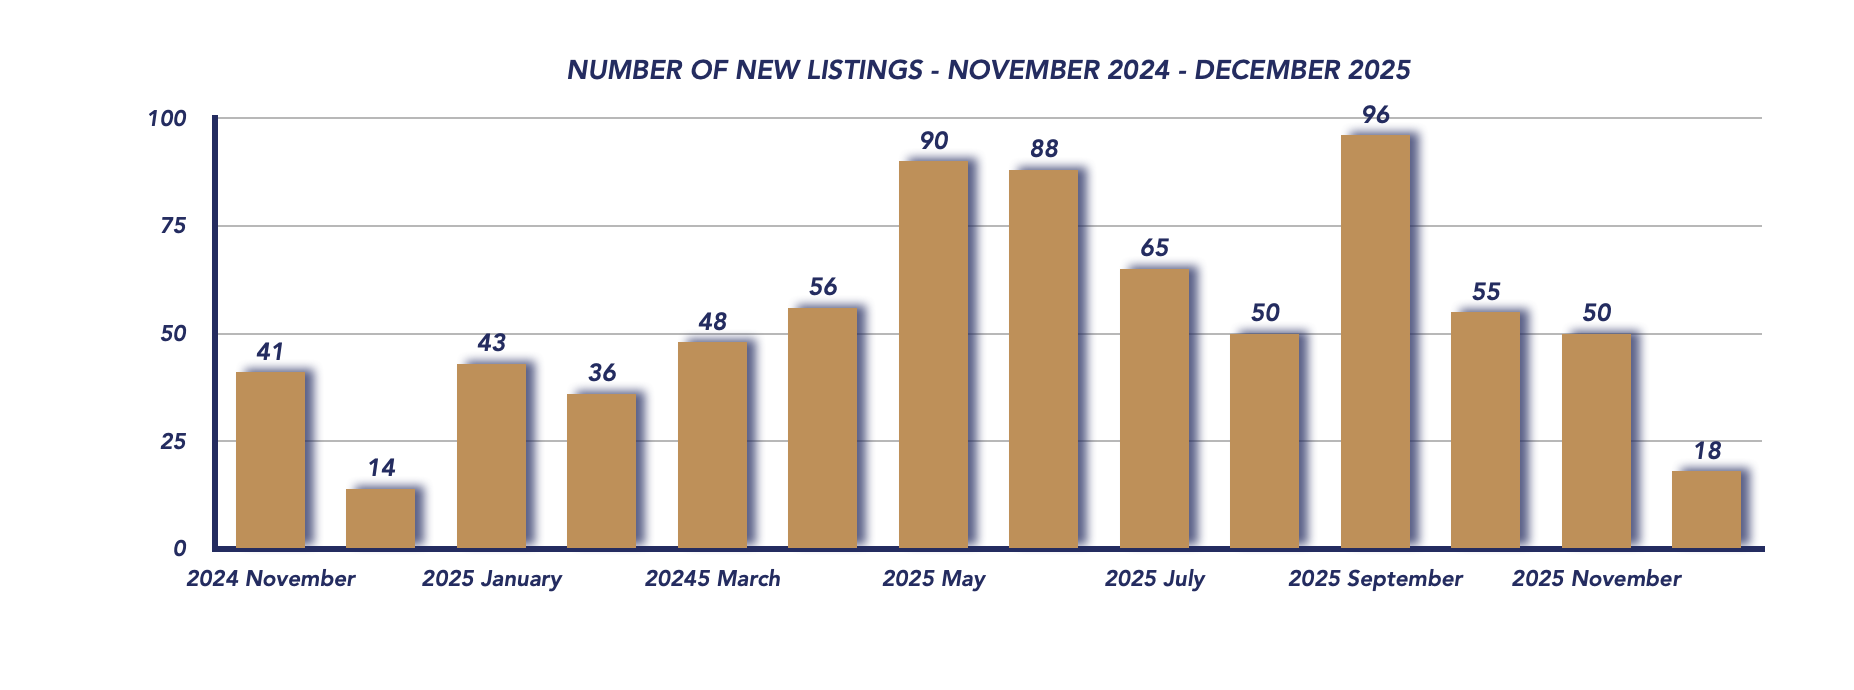
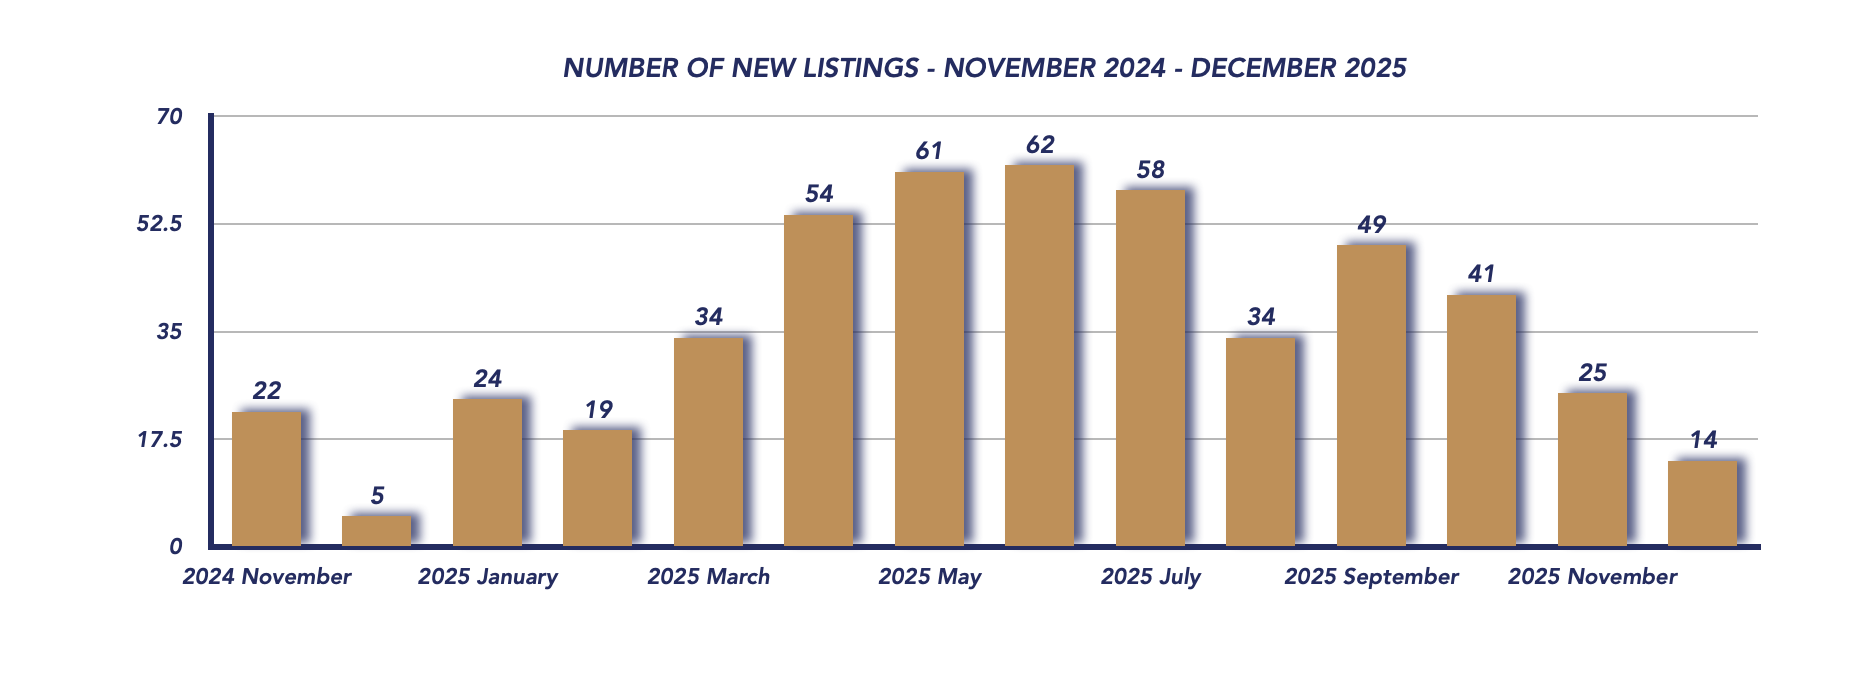
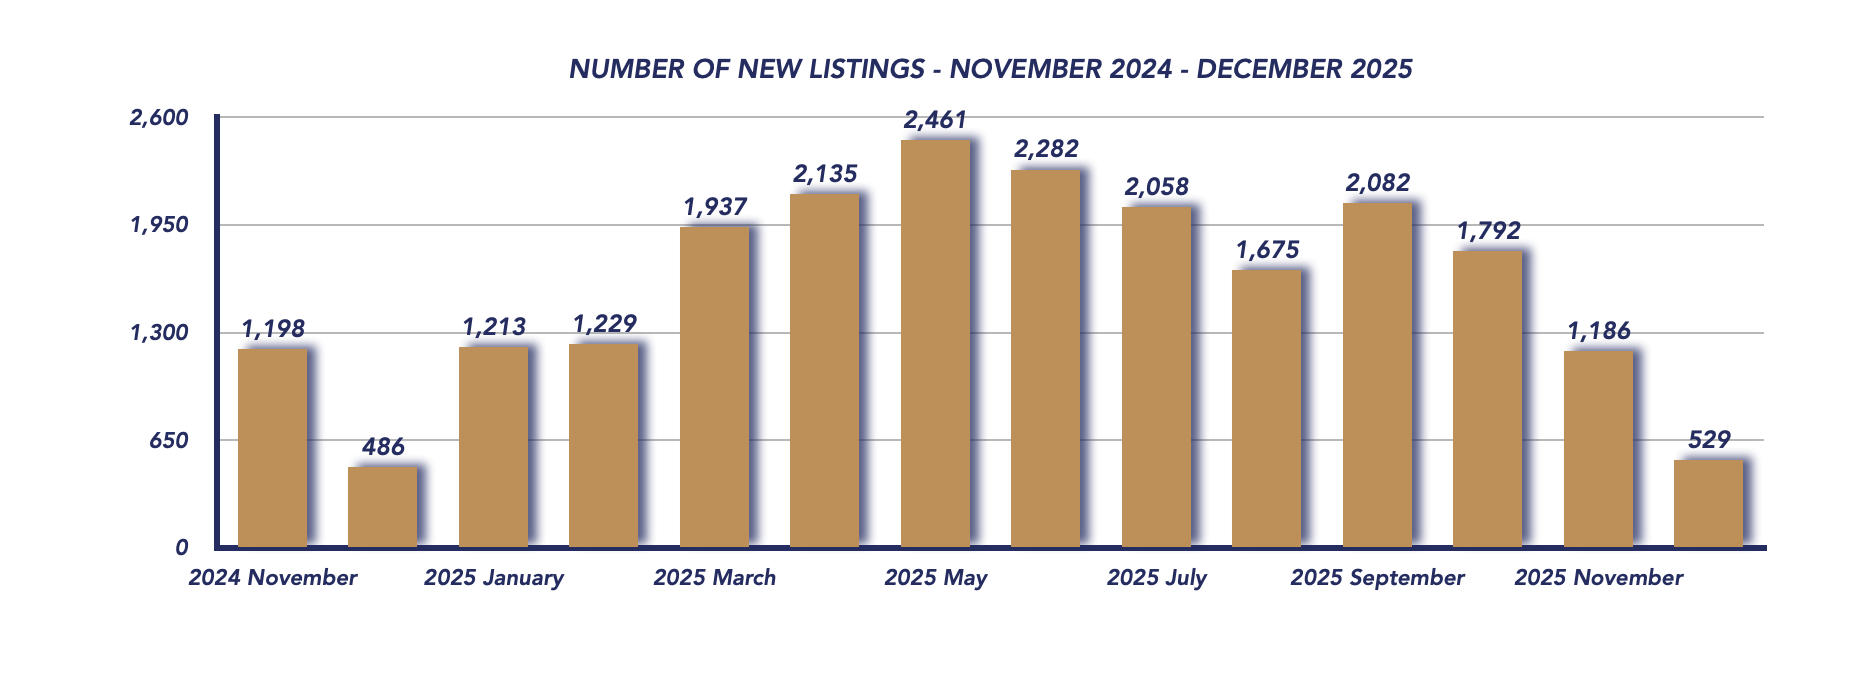
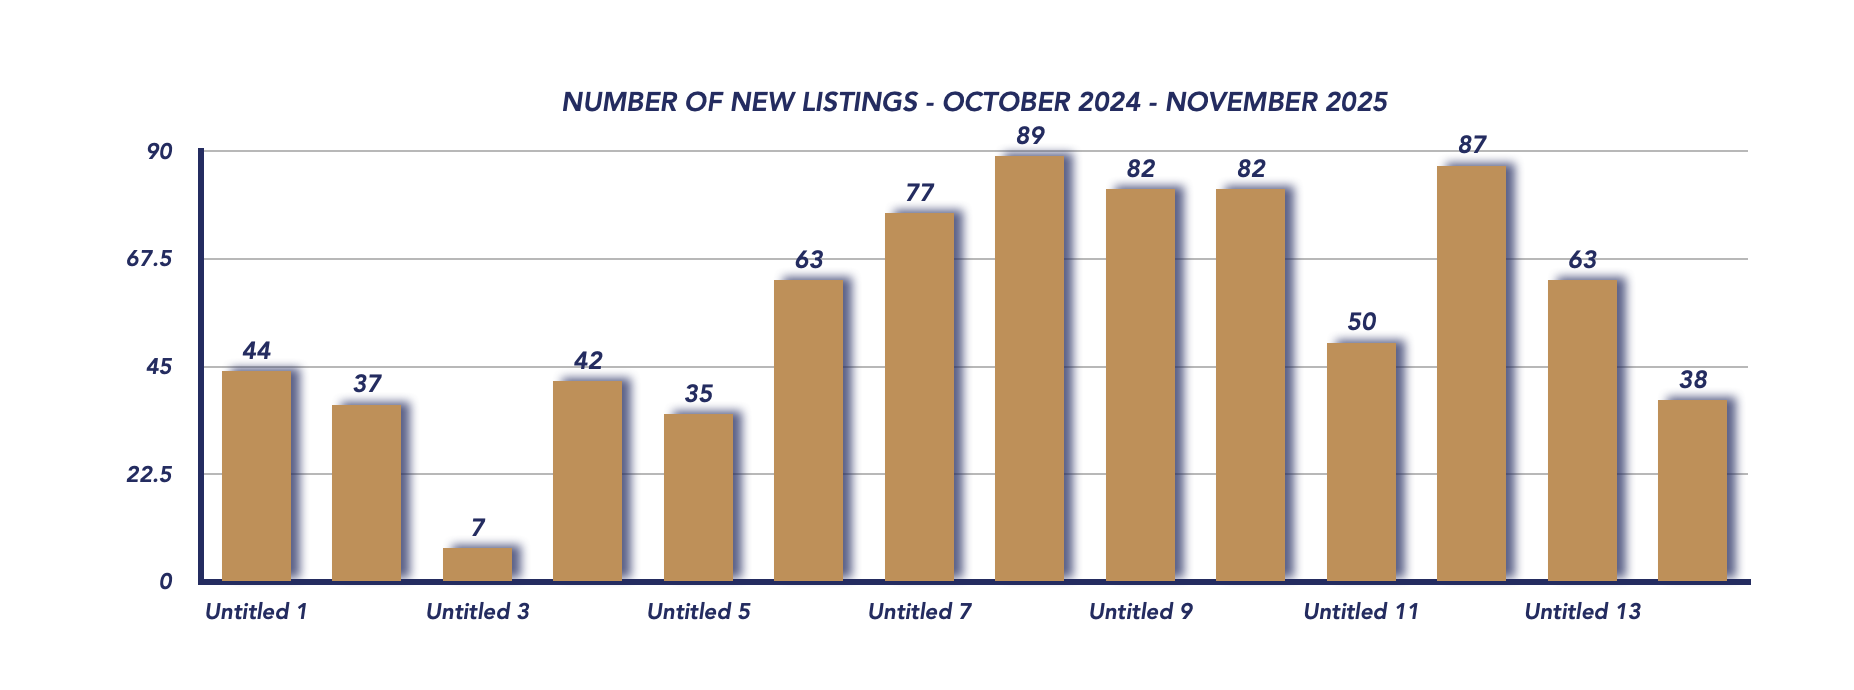
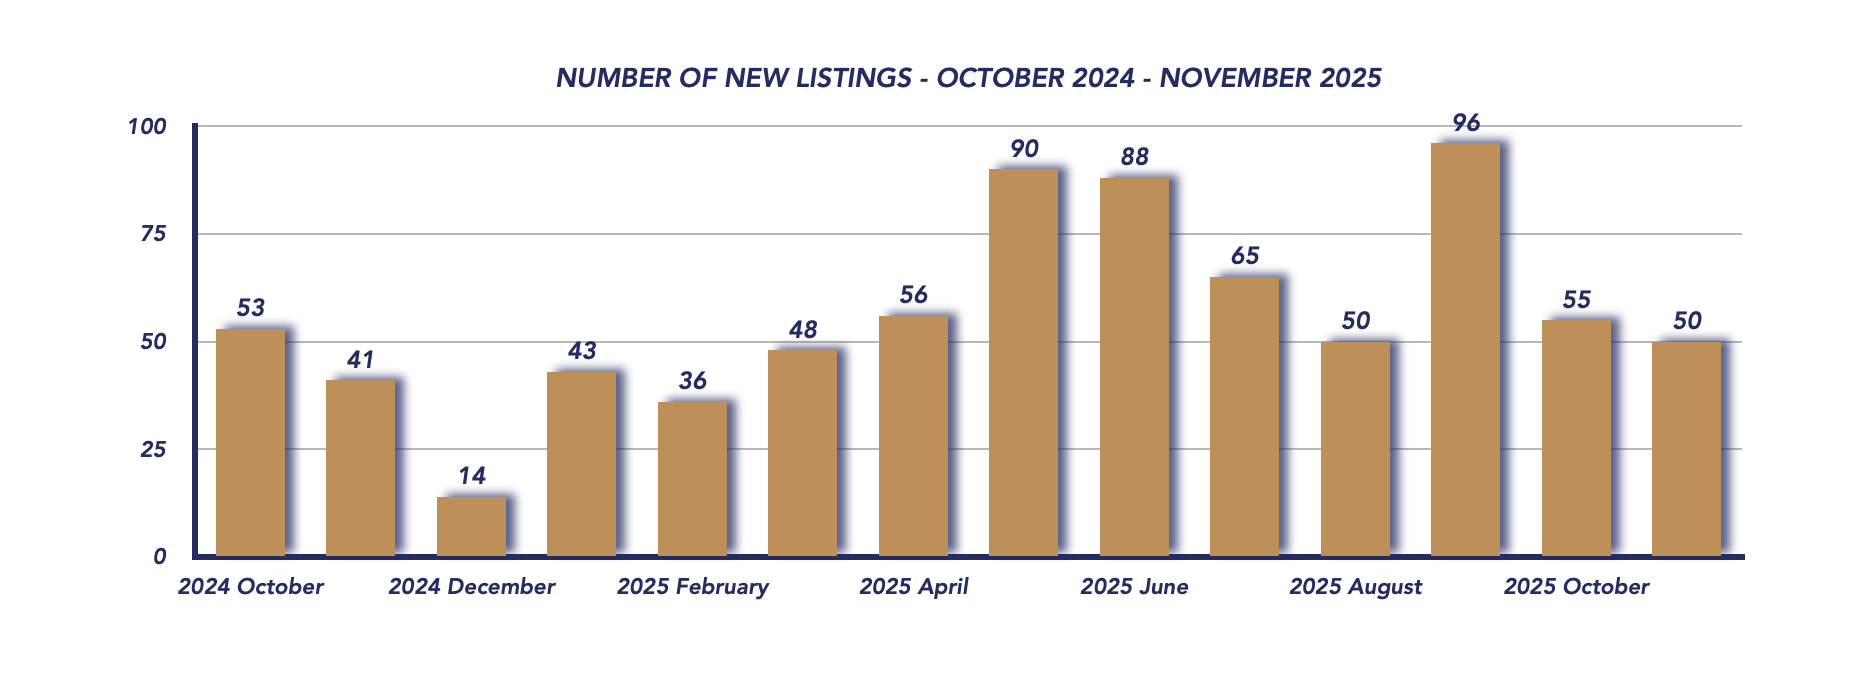
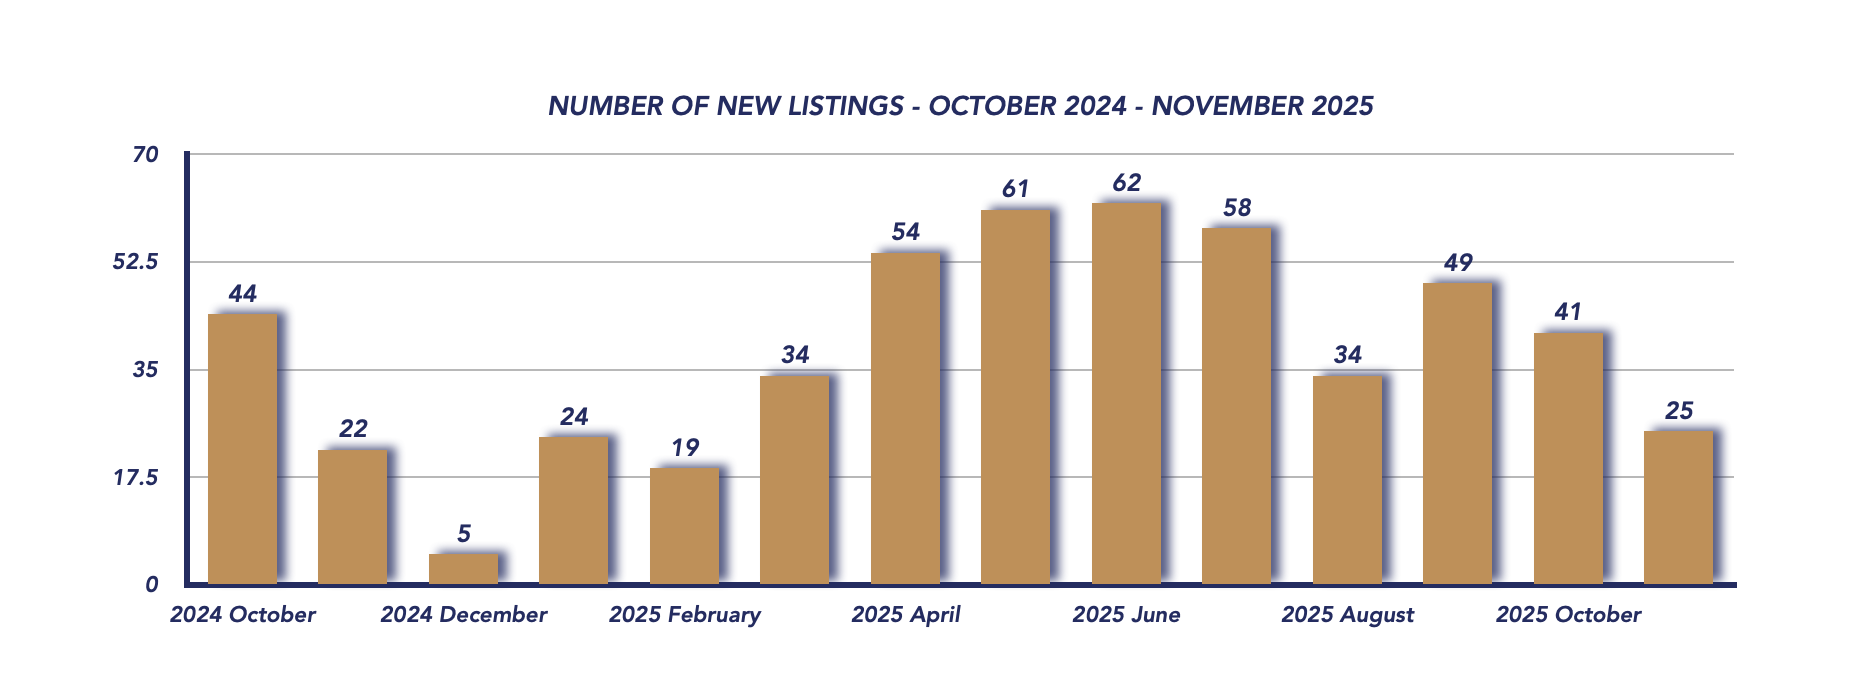
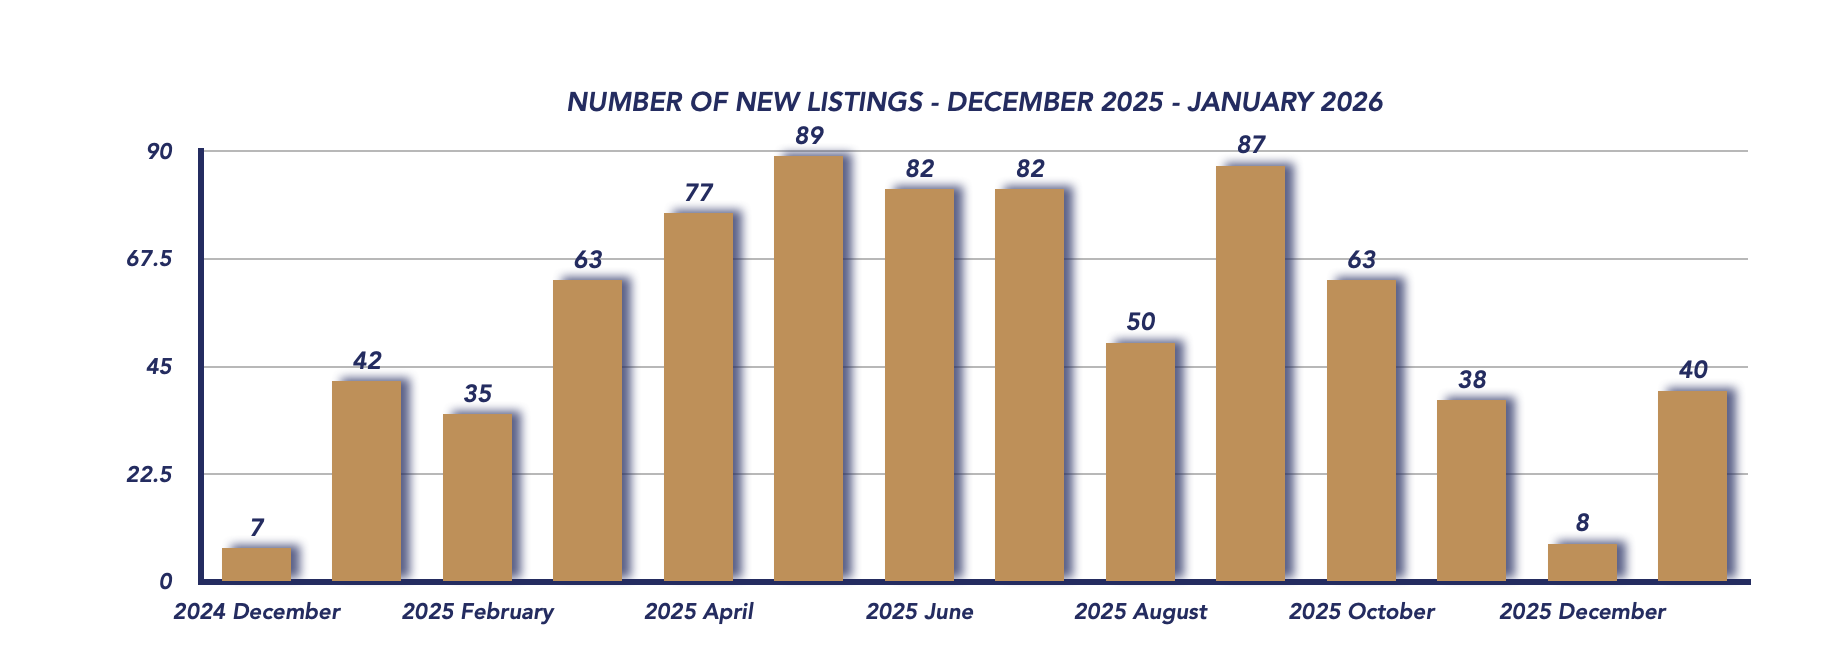
New Listings
There were 40 new listings in January, a sharp increase from 8 in December and similar to the 42 new listings recorded in January 2024. This jump is typical for the new year, as many sellers who removed their properties during the holidays reintroduce them to the market in January.
The combination of returning listings and slower buyer activity has contributed to a growing supply-demand imbalance.
Days on Market
Homes took an average of 91 days to sell, down from 129 days in December’s reported year-end figure reset, but still reflecting slower winter market conditions. Buyers are taking their time, and negotiations remain more deliberate.
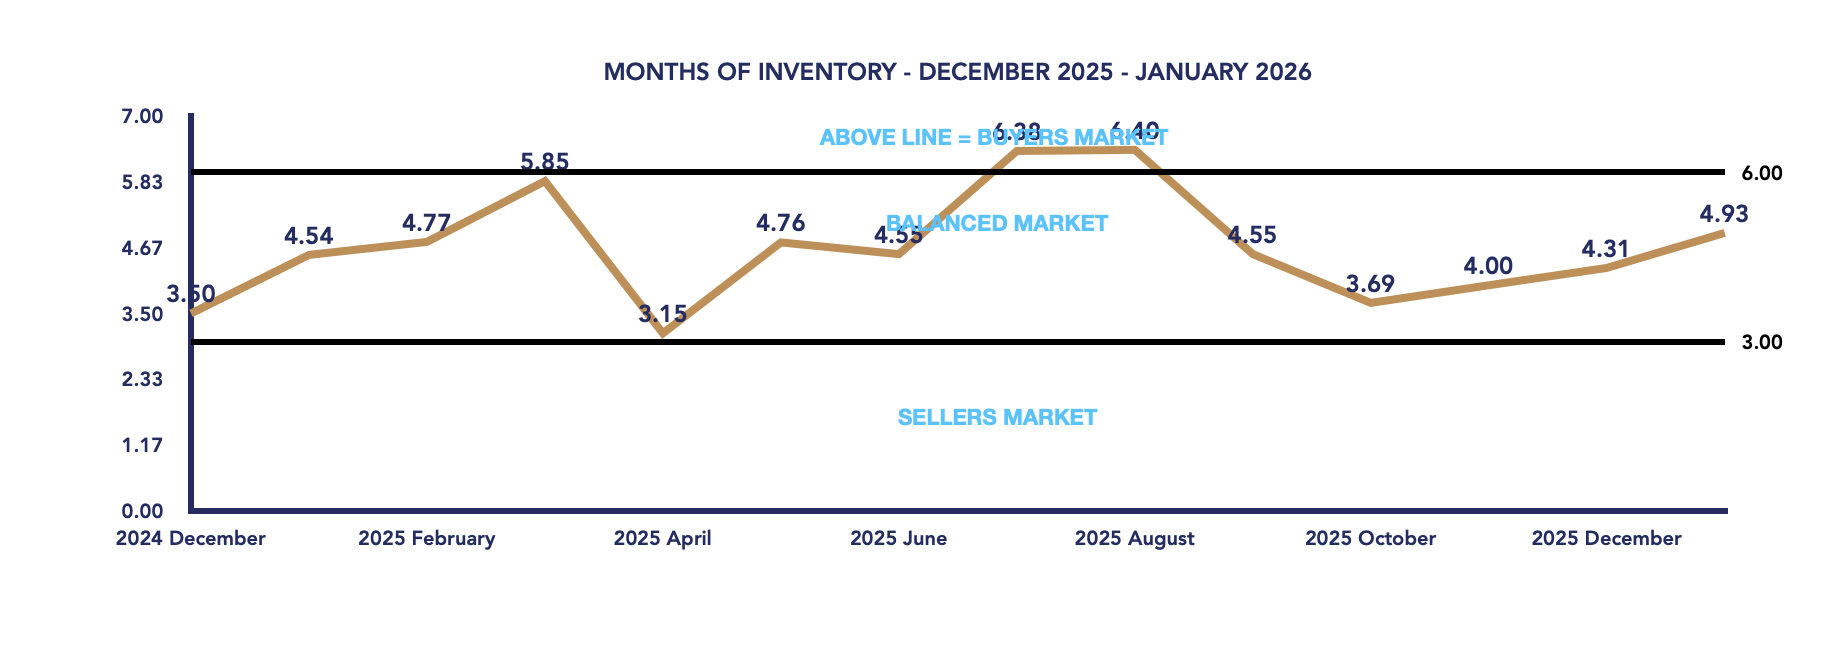
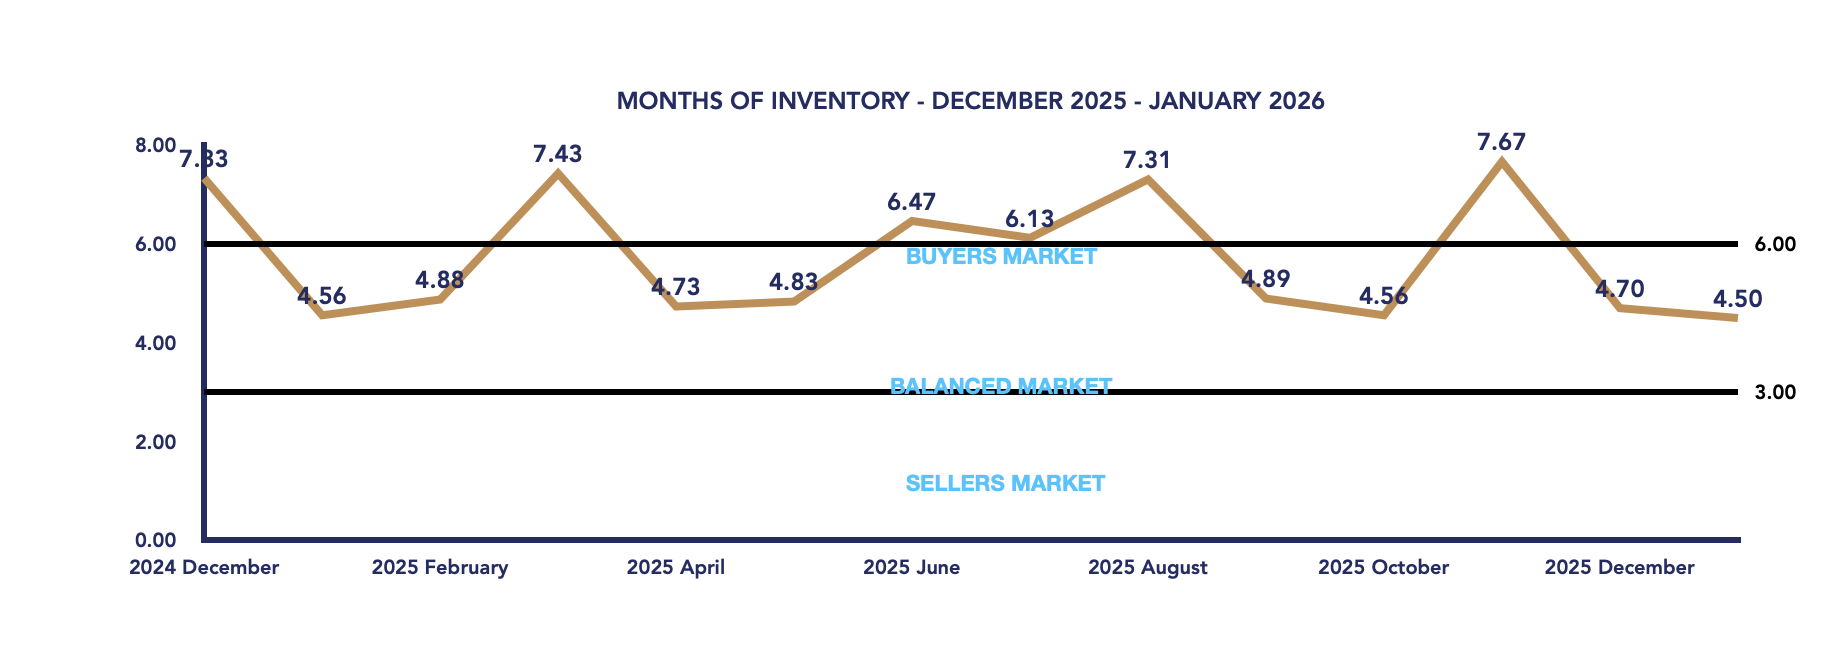
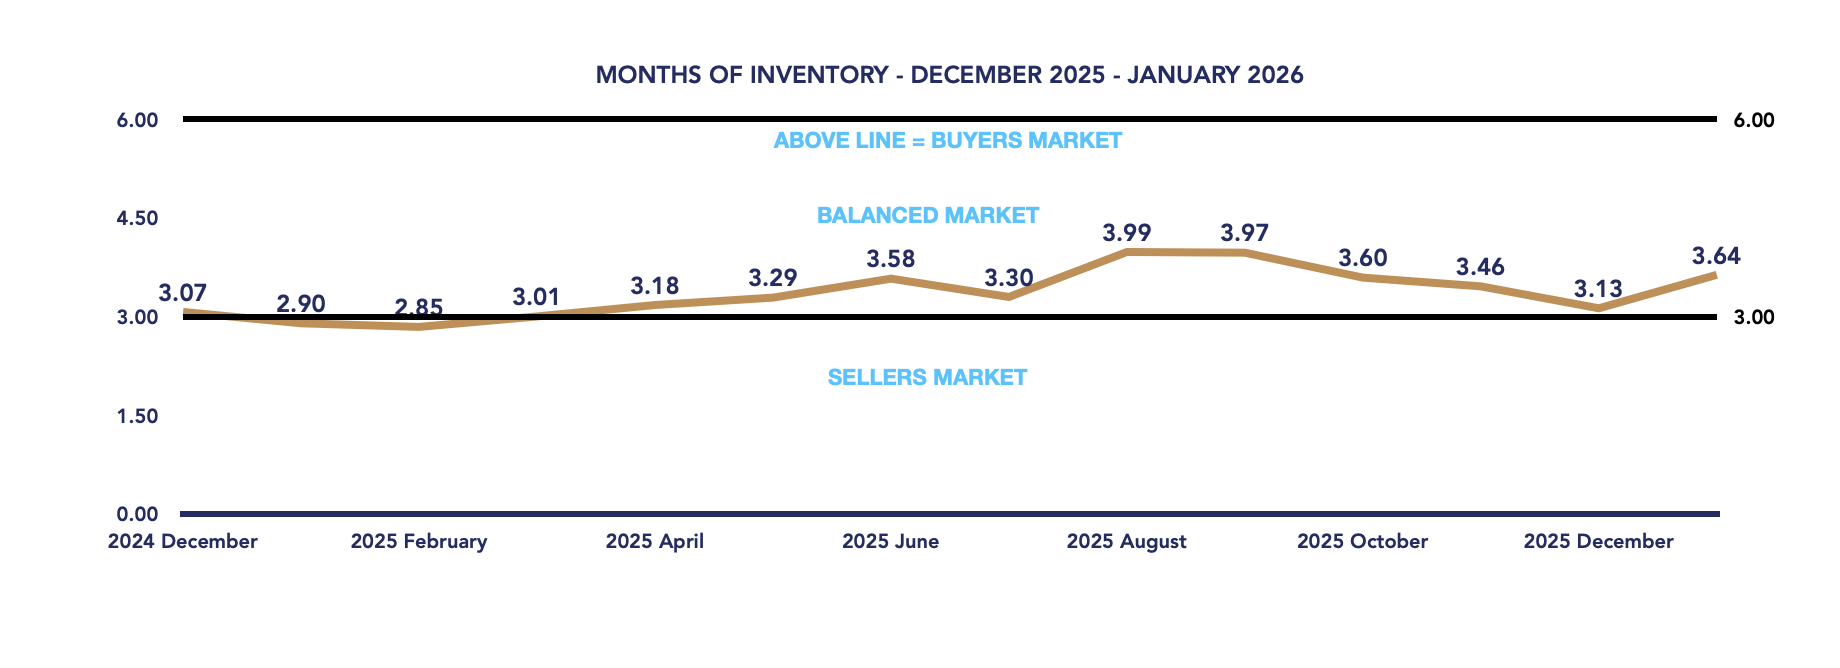
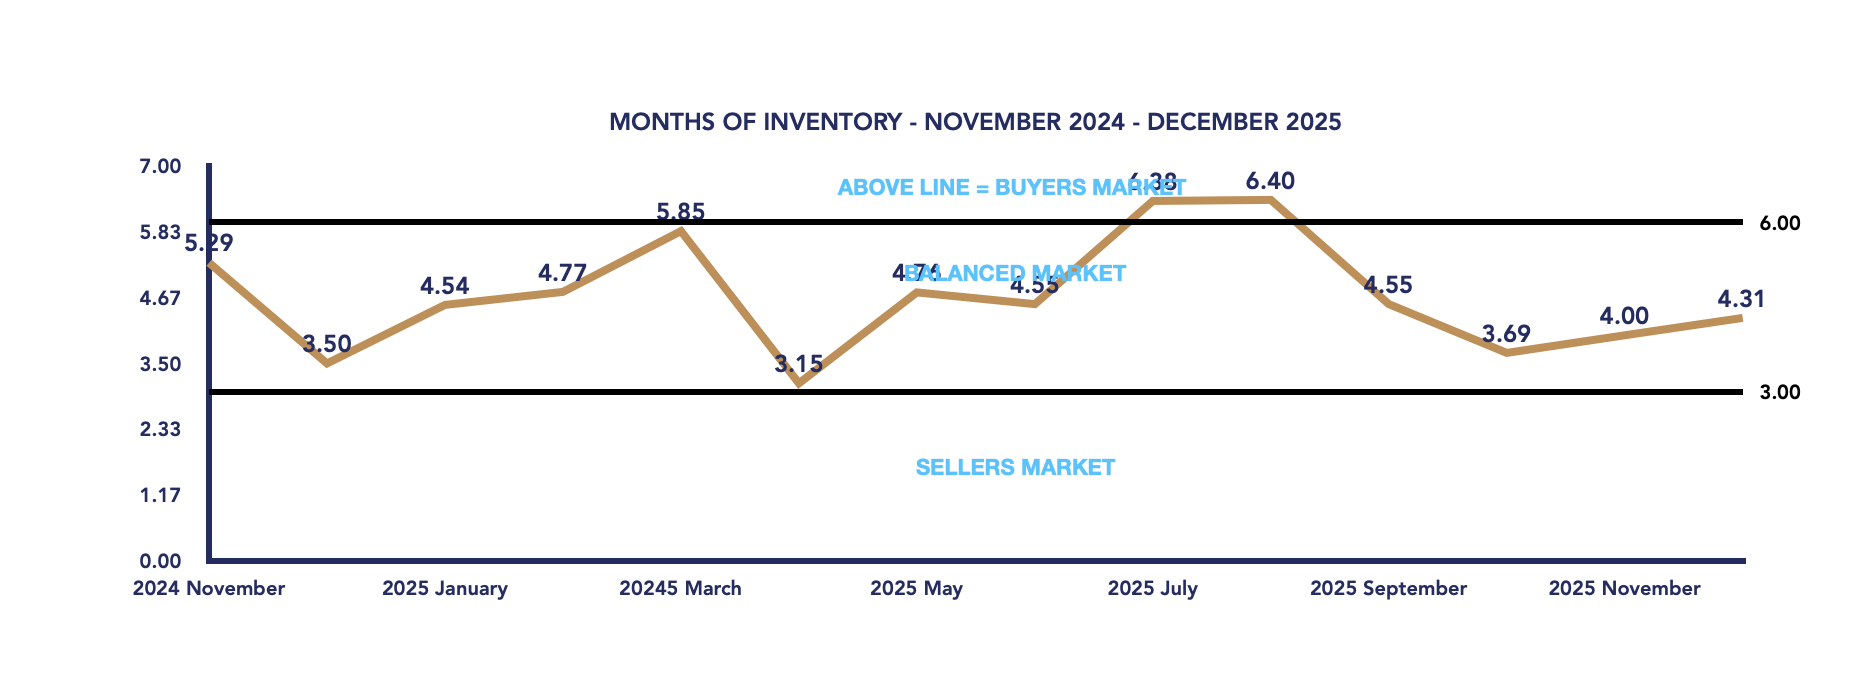
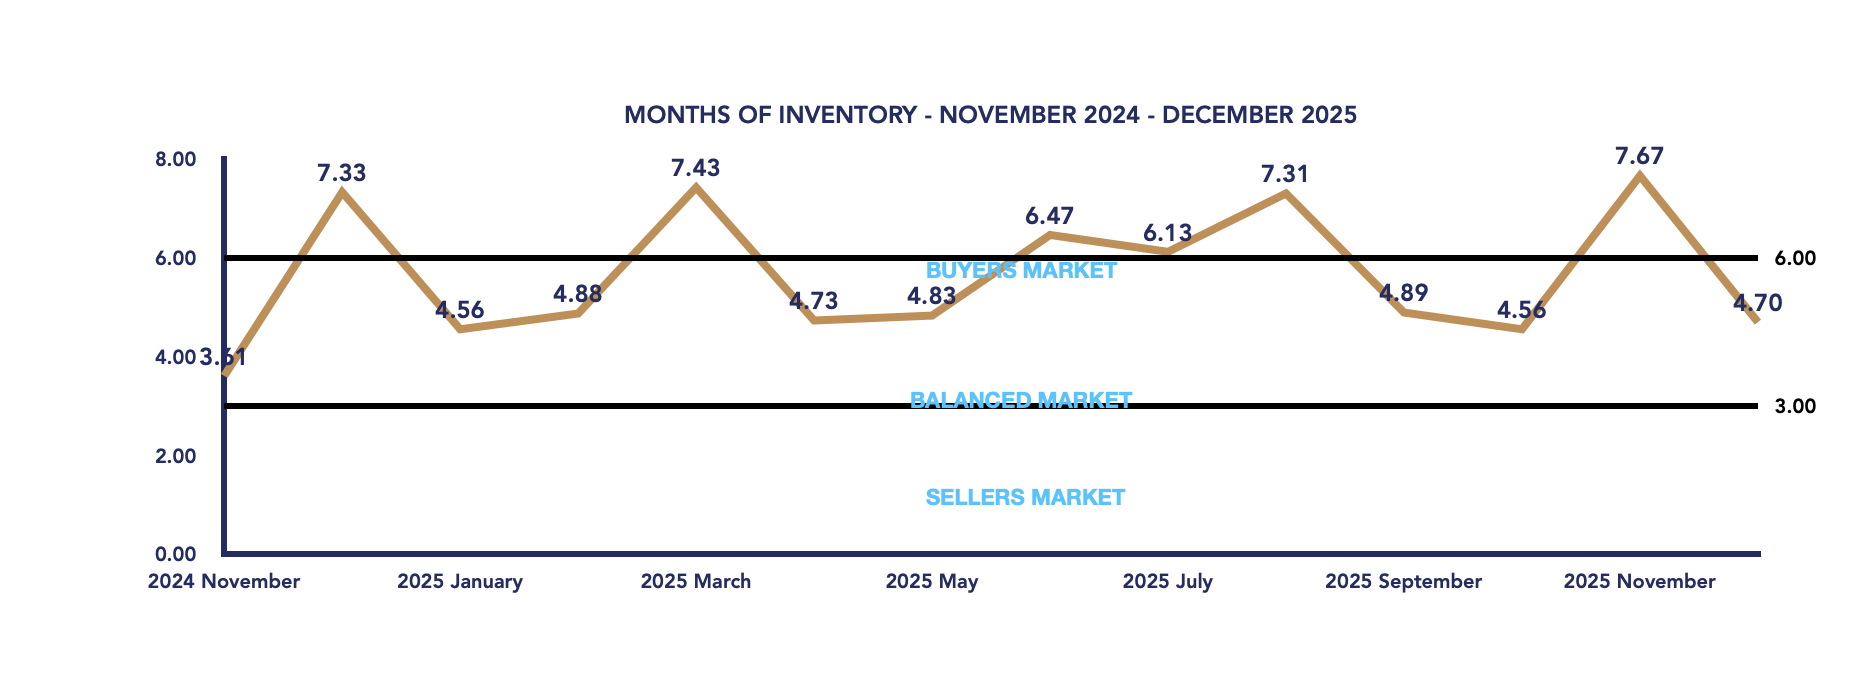
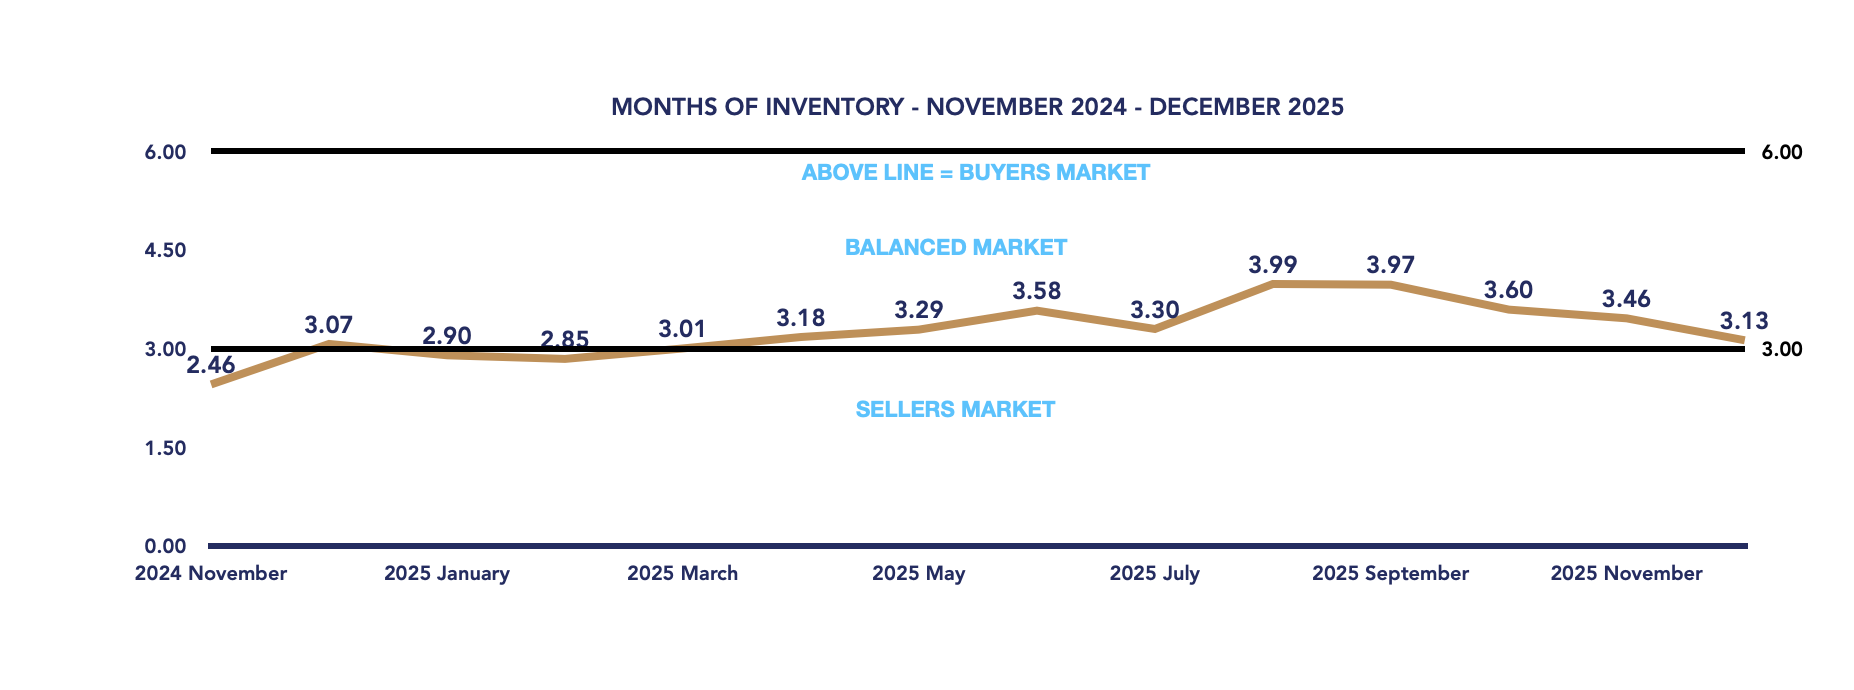
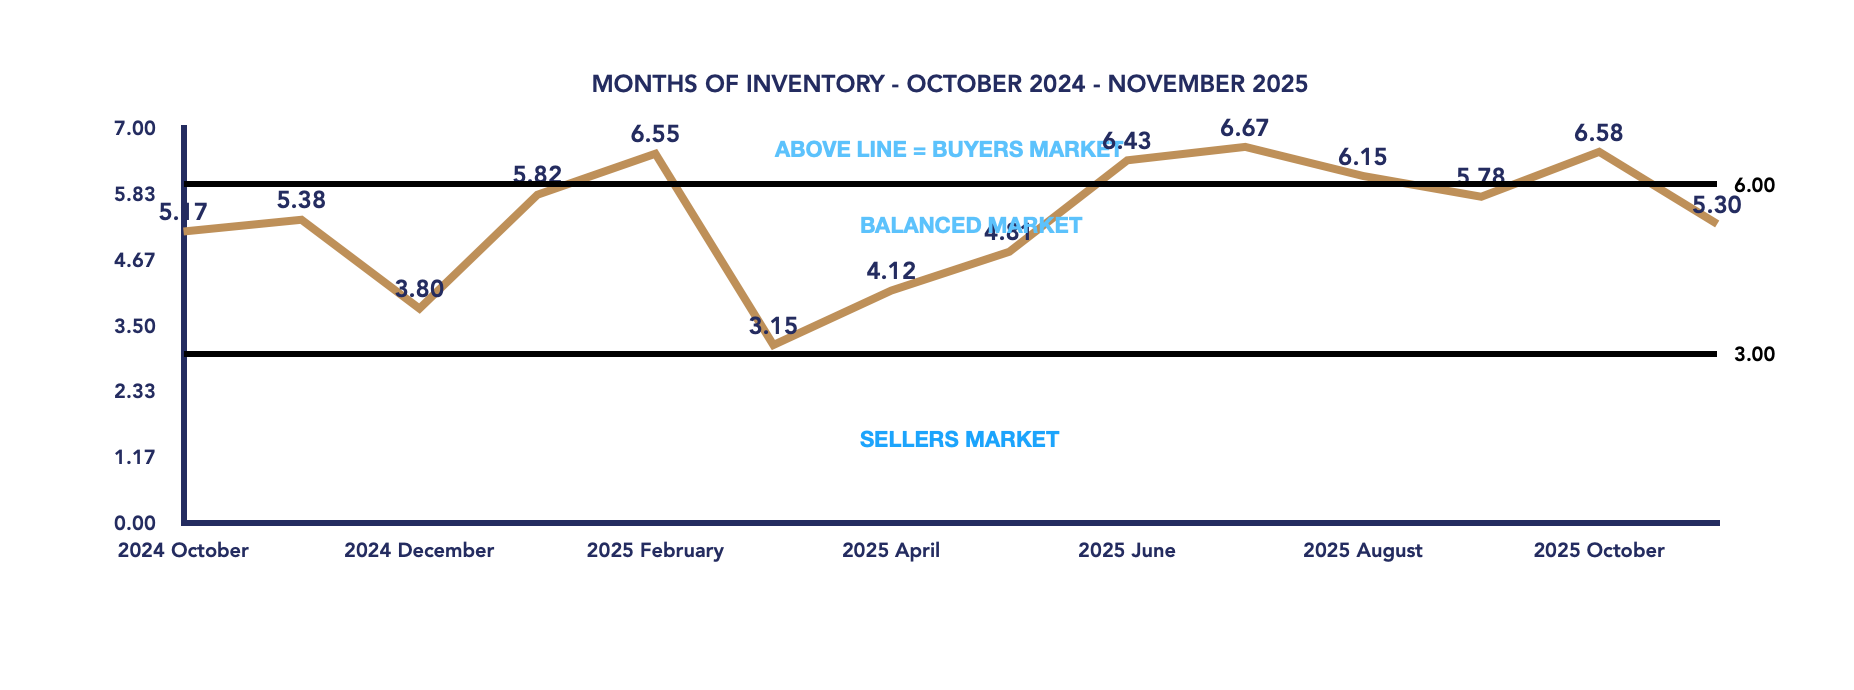
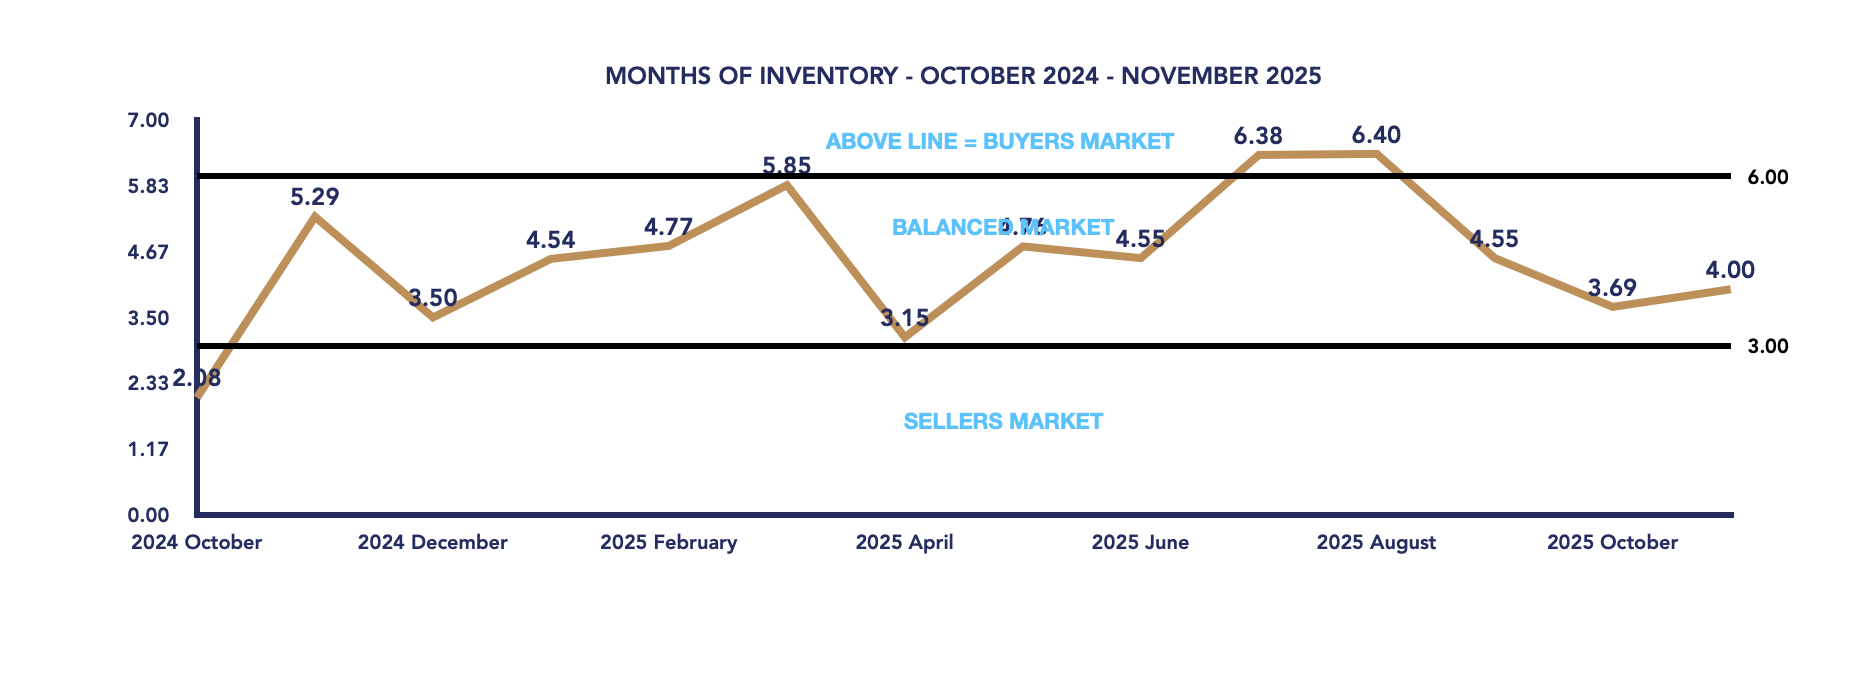
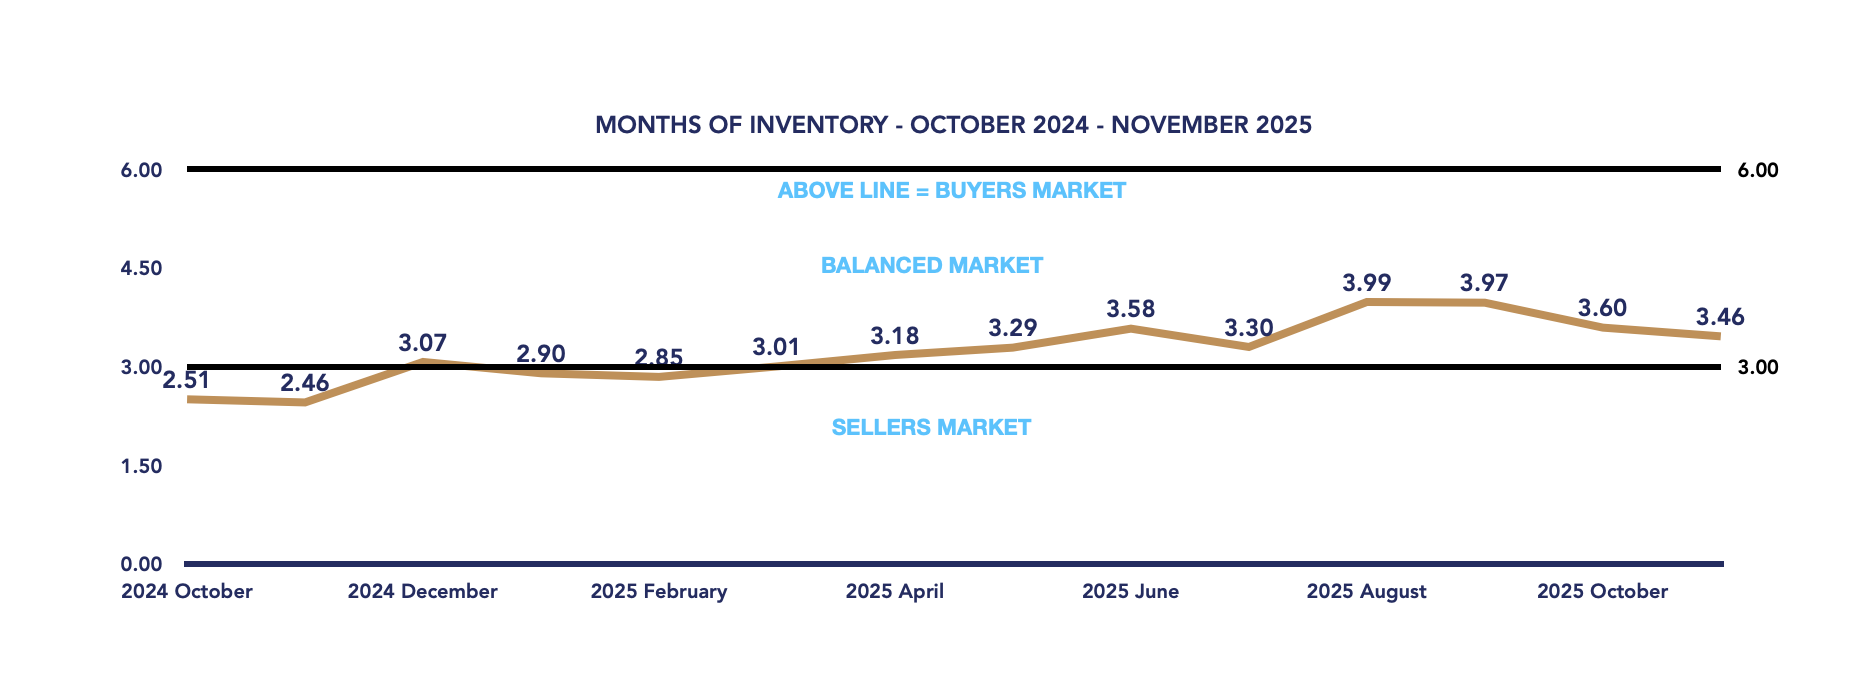
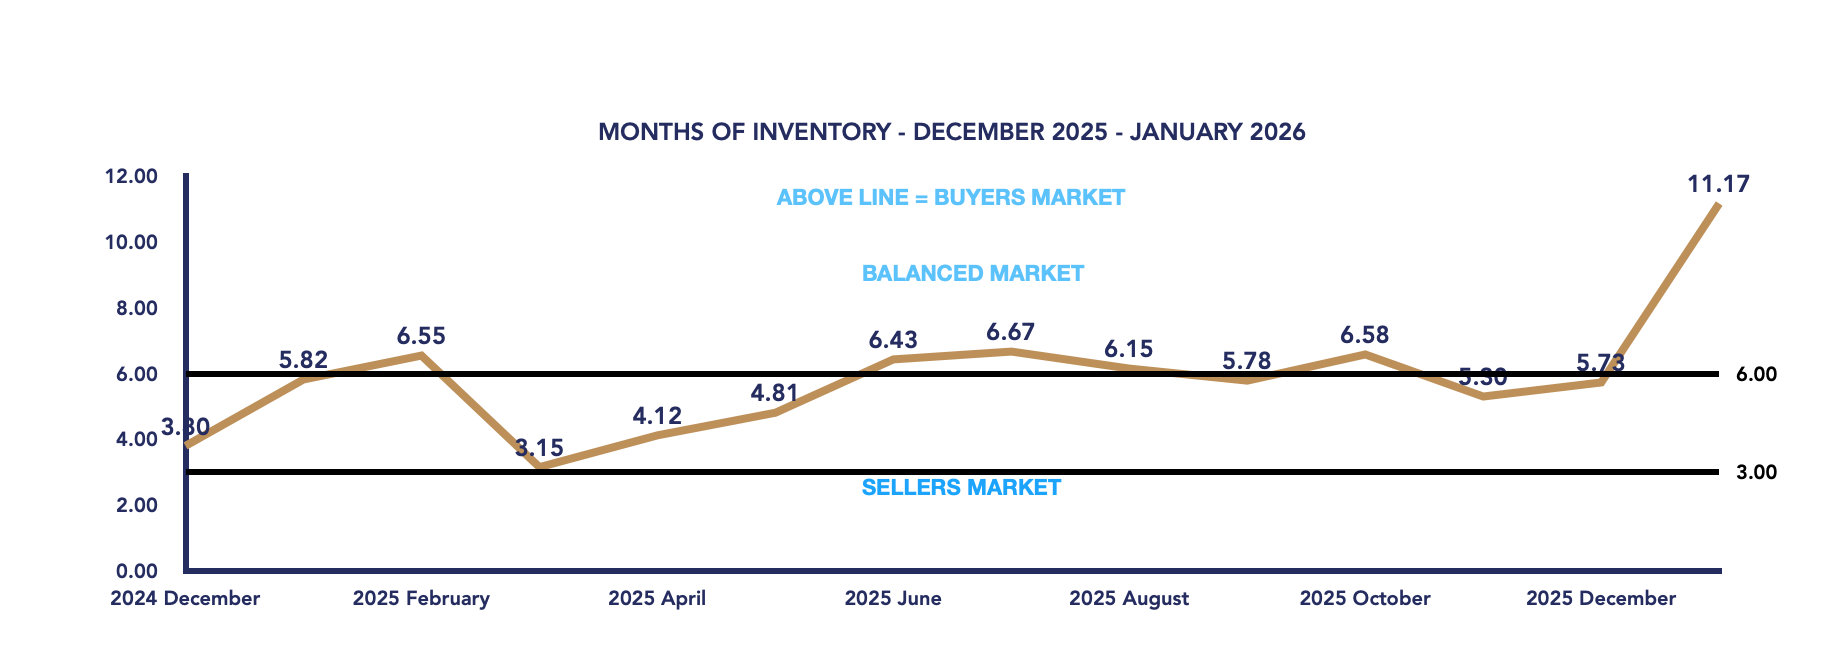
Months of Inventory
The most significant shift this month is reflected in months of inventory, which jumped to 11.17, up from 5.73 in December. This dramatic increase pushes Uxbridge firmly into buyer’s market territory, indicating that at the current pace of sales, it would take over 11 months to clear existing inventory.
Conclusion
January 2026 marks a slow and buyer-favourable start to the year for Uxbridge real estate. Lower sales volume, softer pricing, and rising months of inventory highlight a market adjusting to seasonal realities and cautious buyer sentiment.
However, January trends often set the tone only temporarily. As we move toward the spring market, increased activity could rebalance conditions. For now, buyers benefit from more negotiating power and greater selection, while sellers must focus on competitive pricing and strong presentation to stand out in a more competitive environment.
If you’re considering buying or selling in 2026, early preparation and strategy will be key in navigating this shifting market landscape.
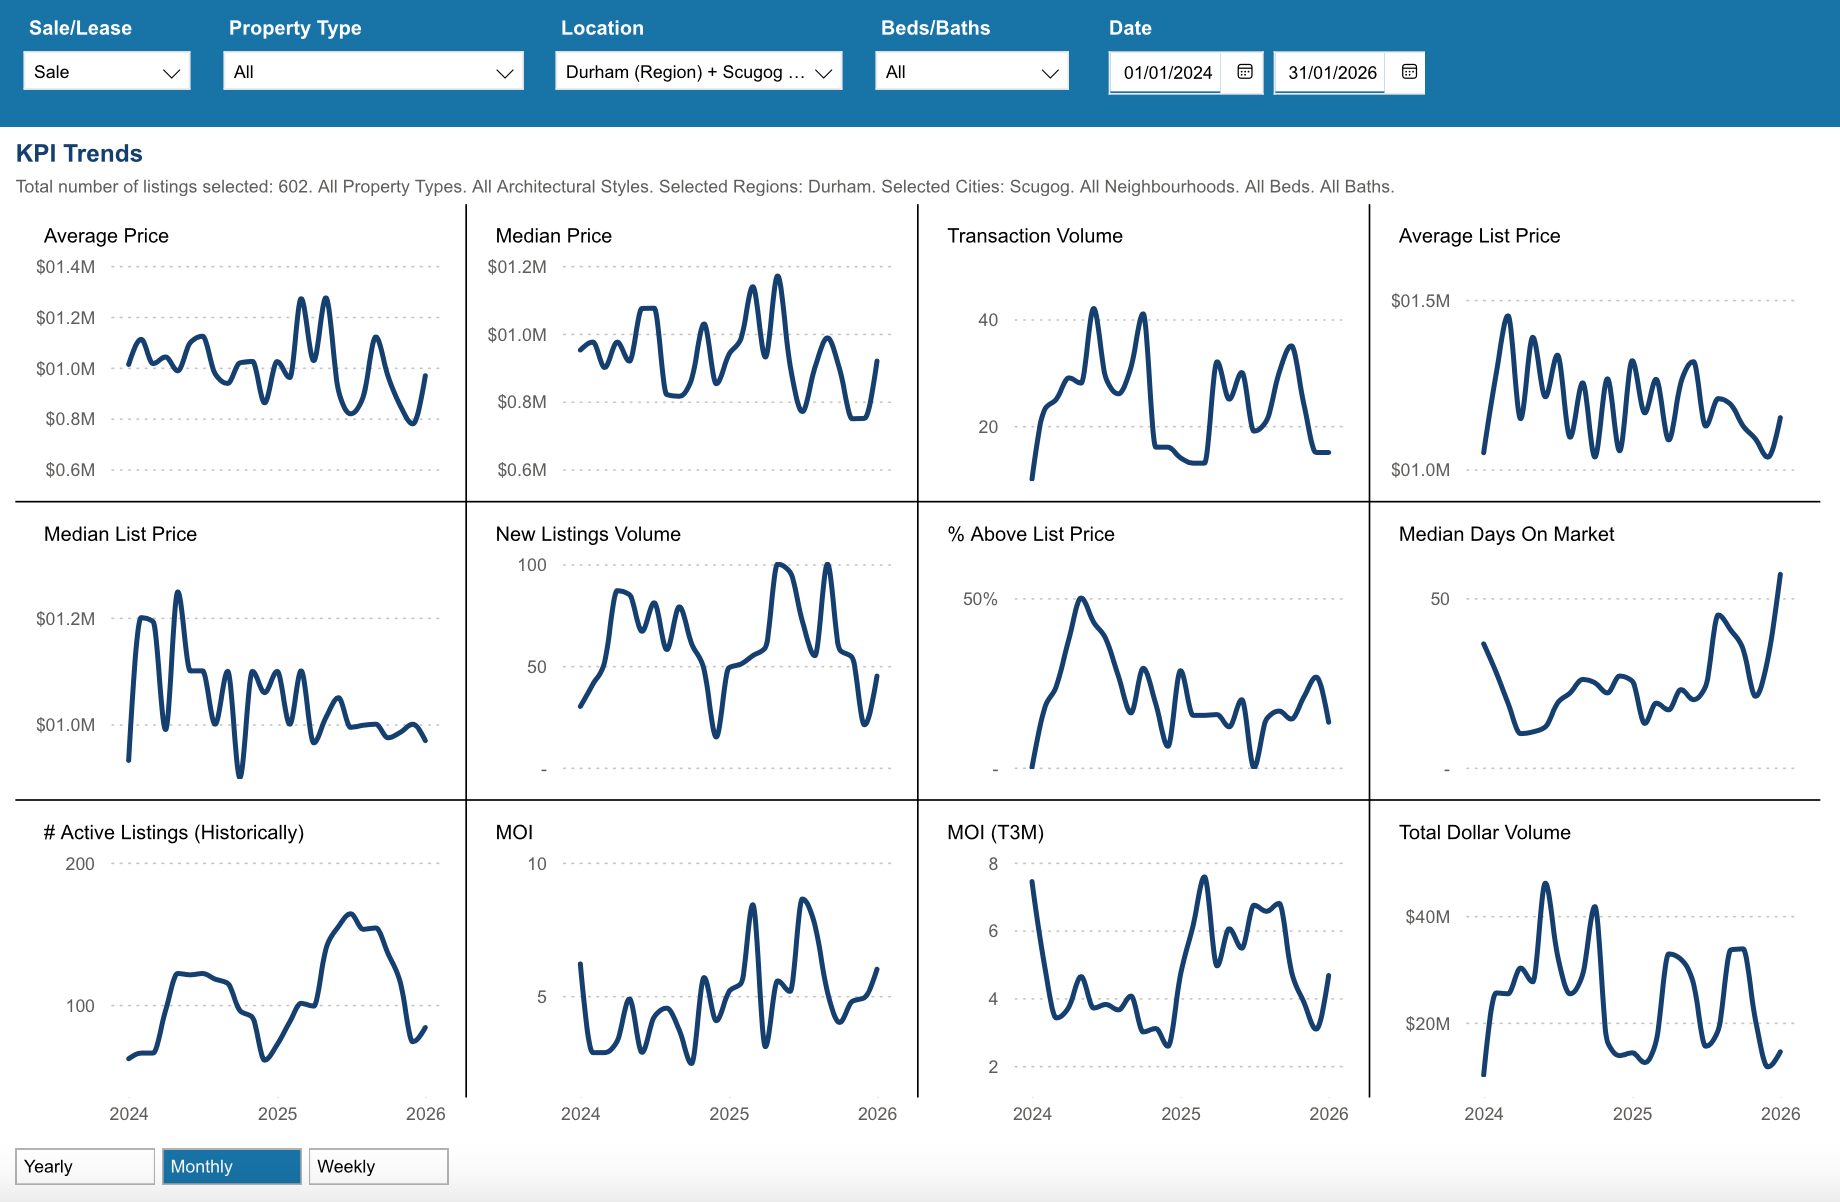
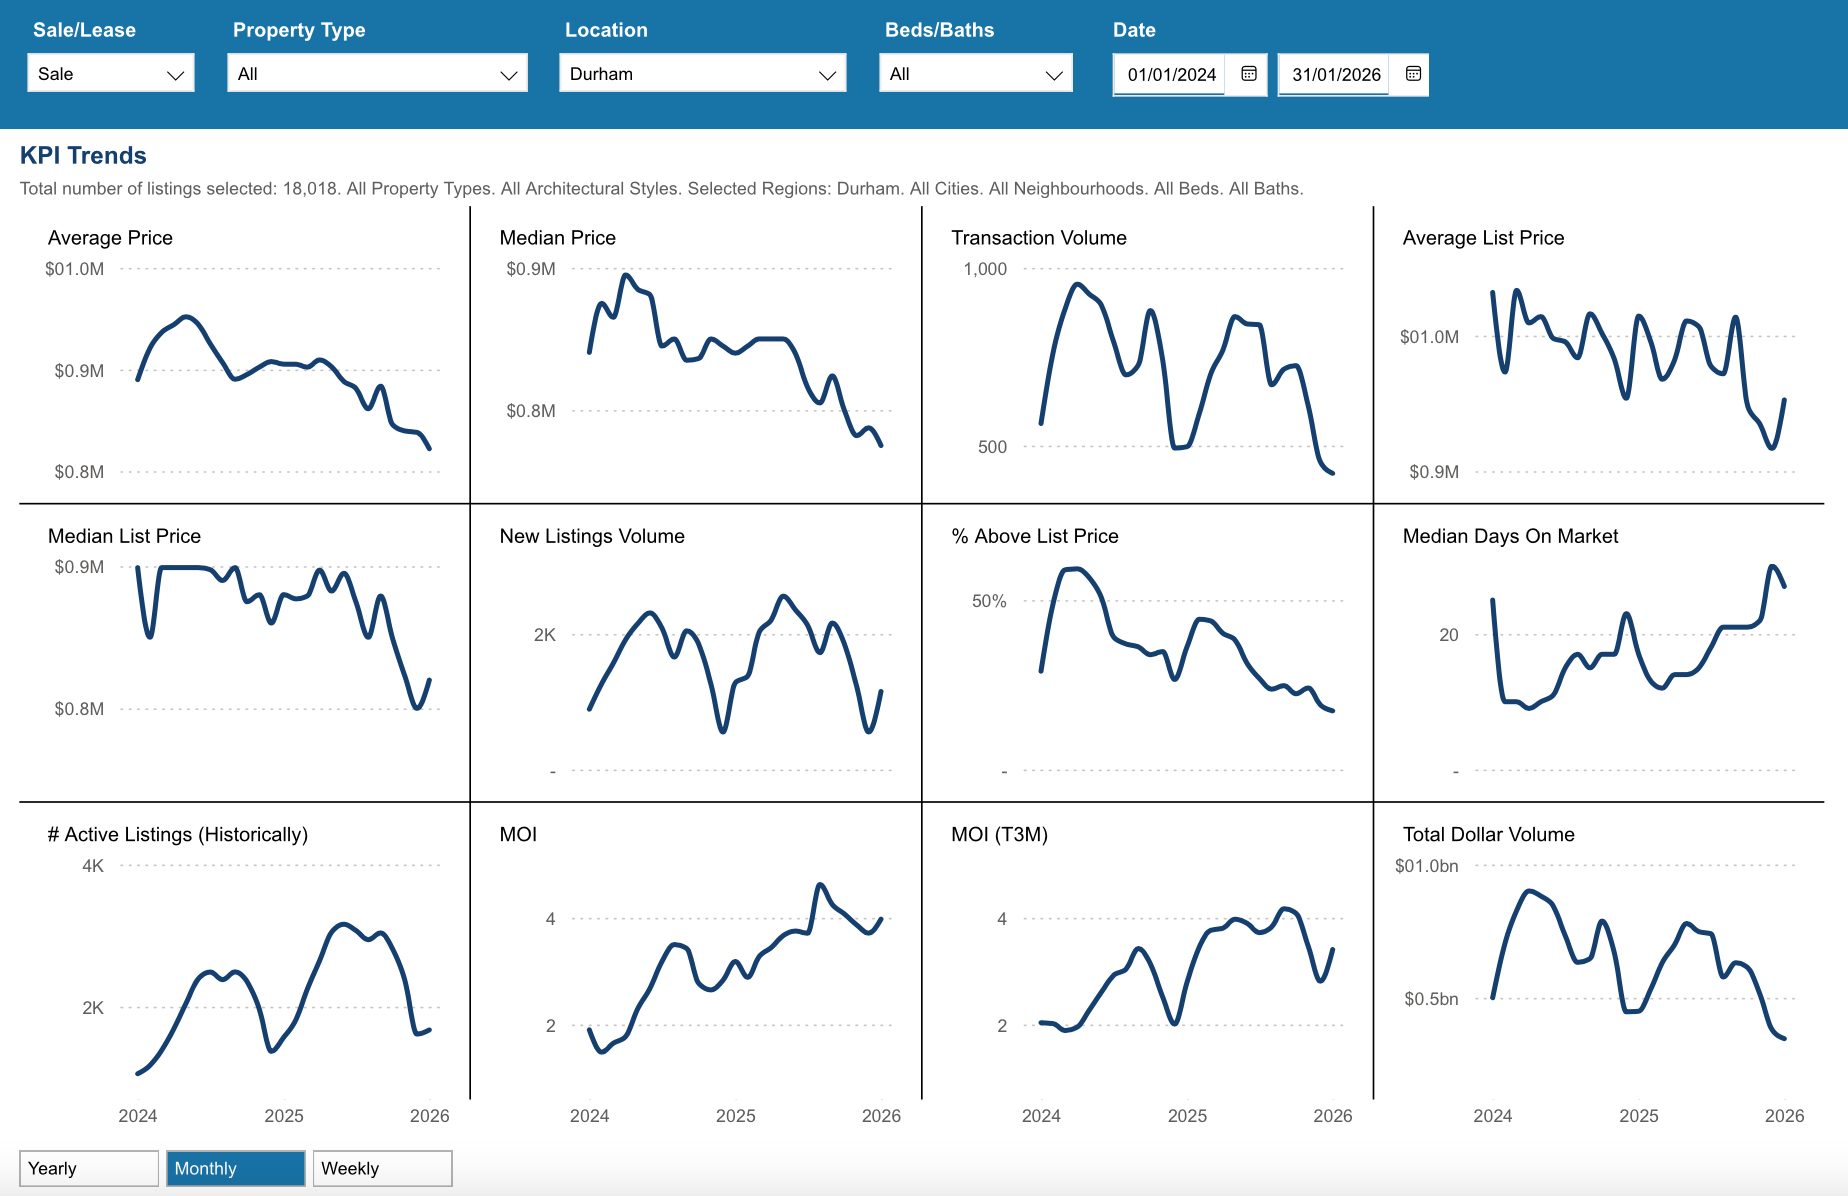
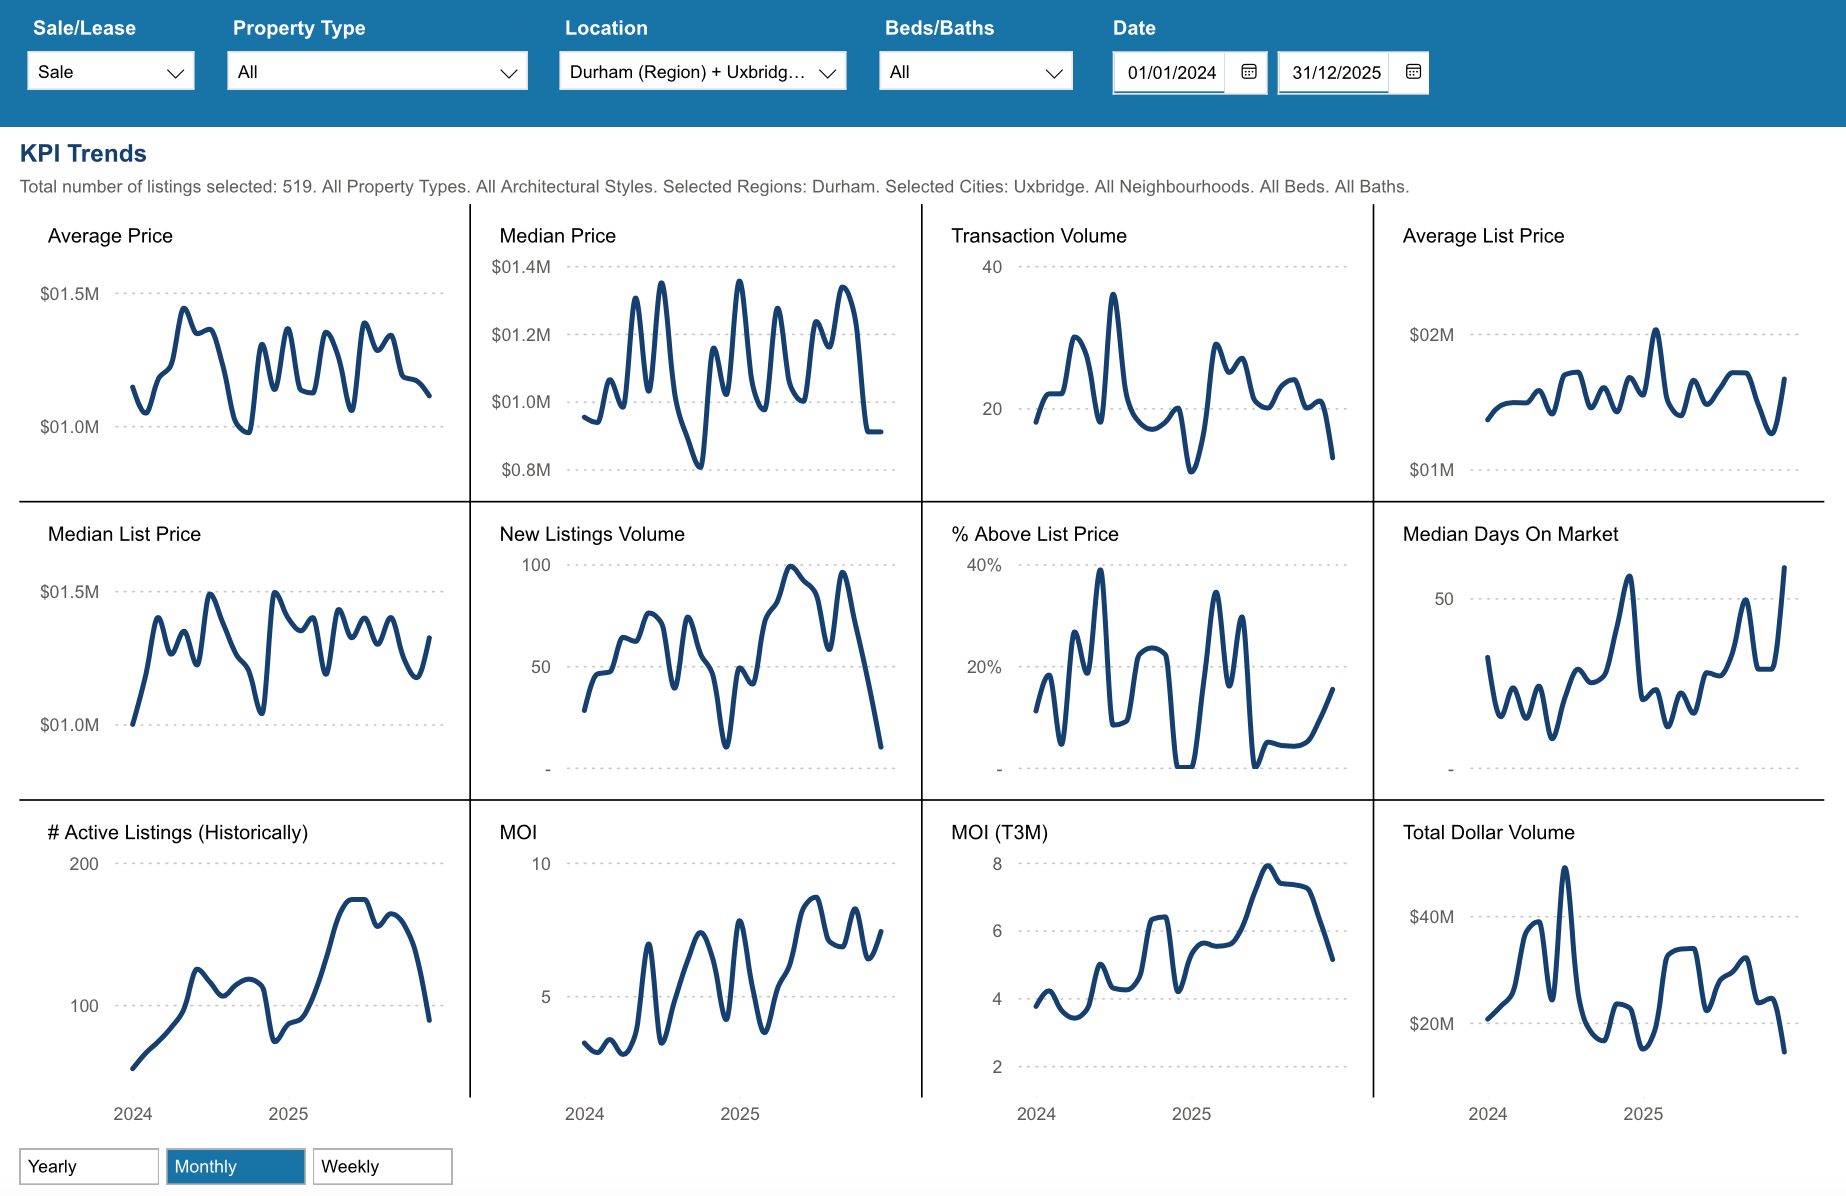
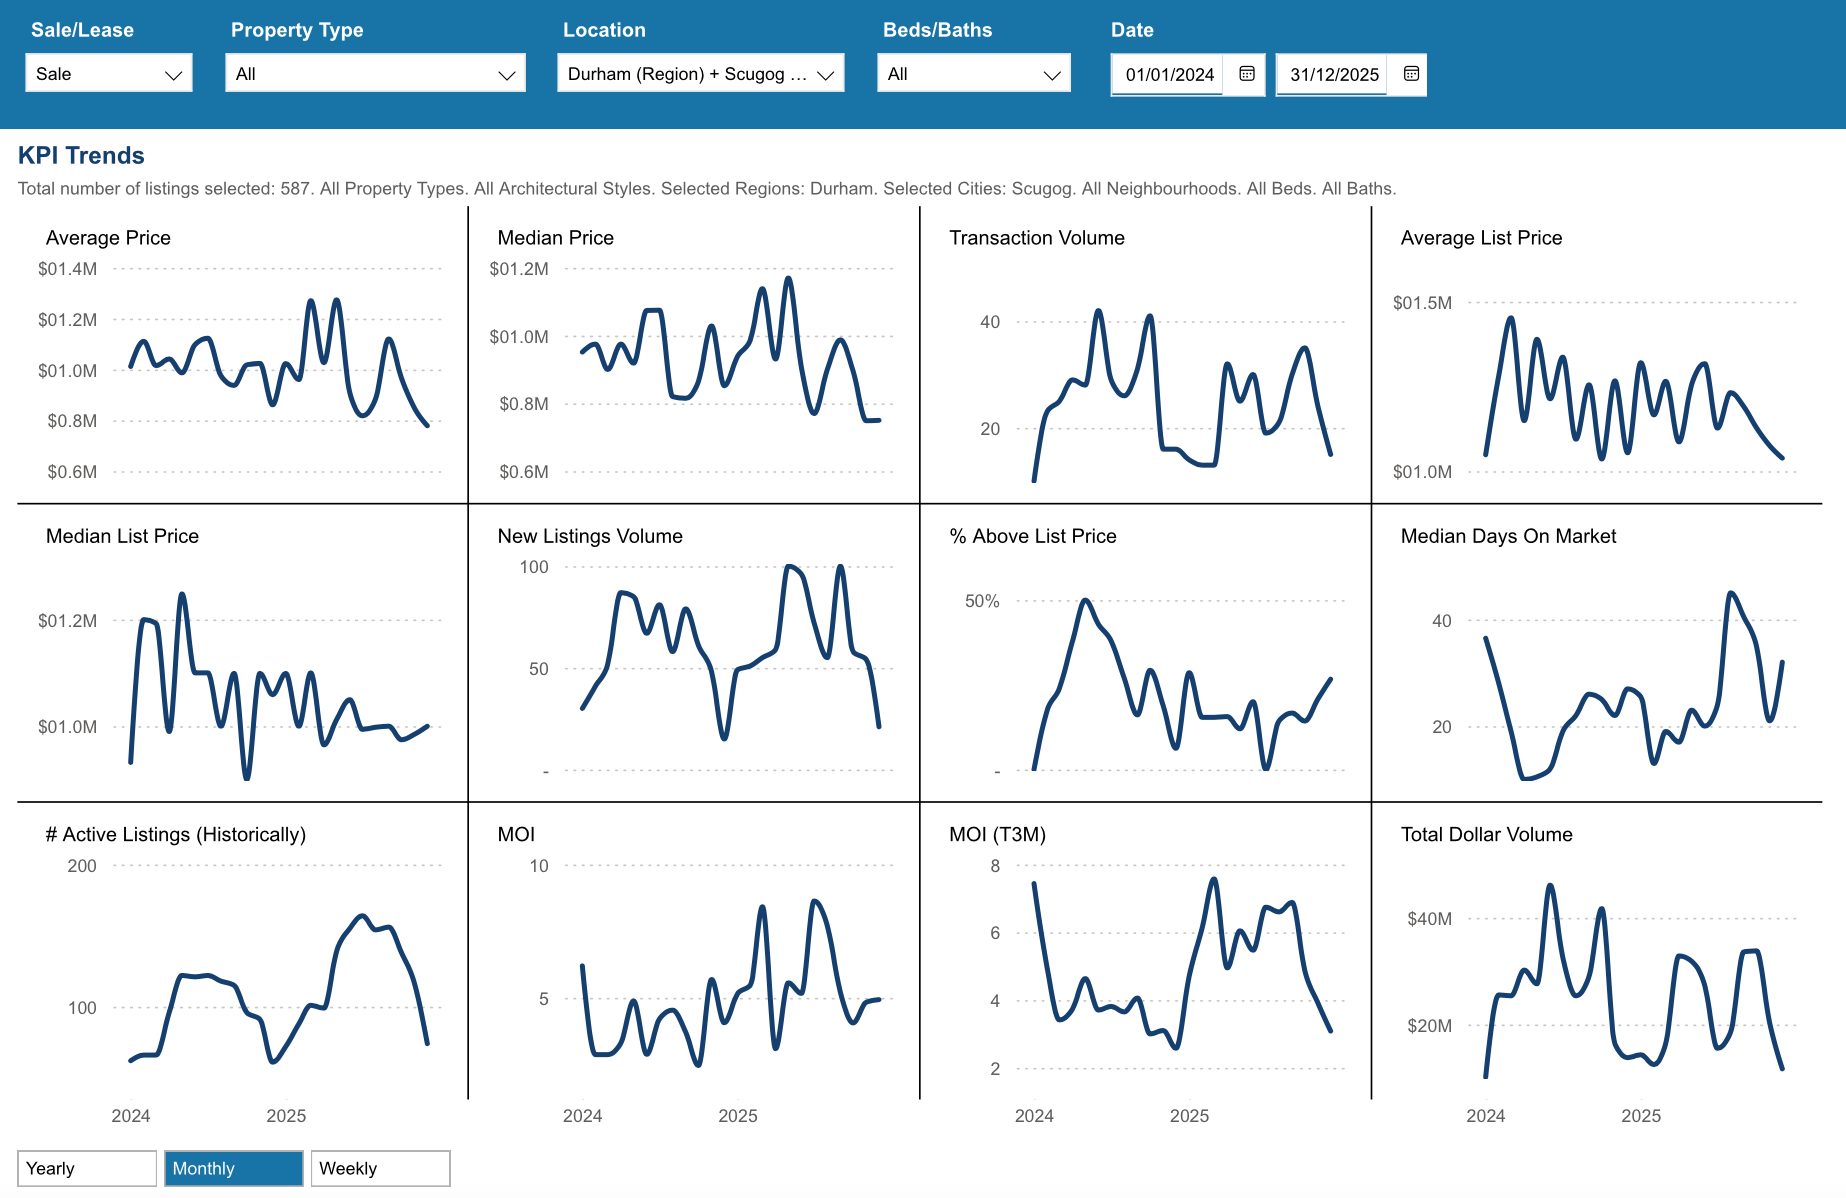
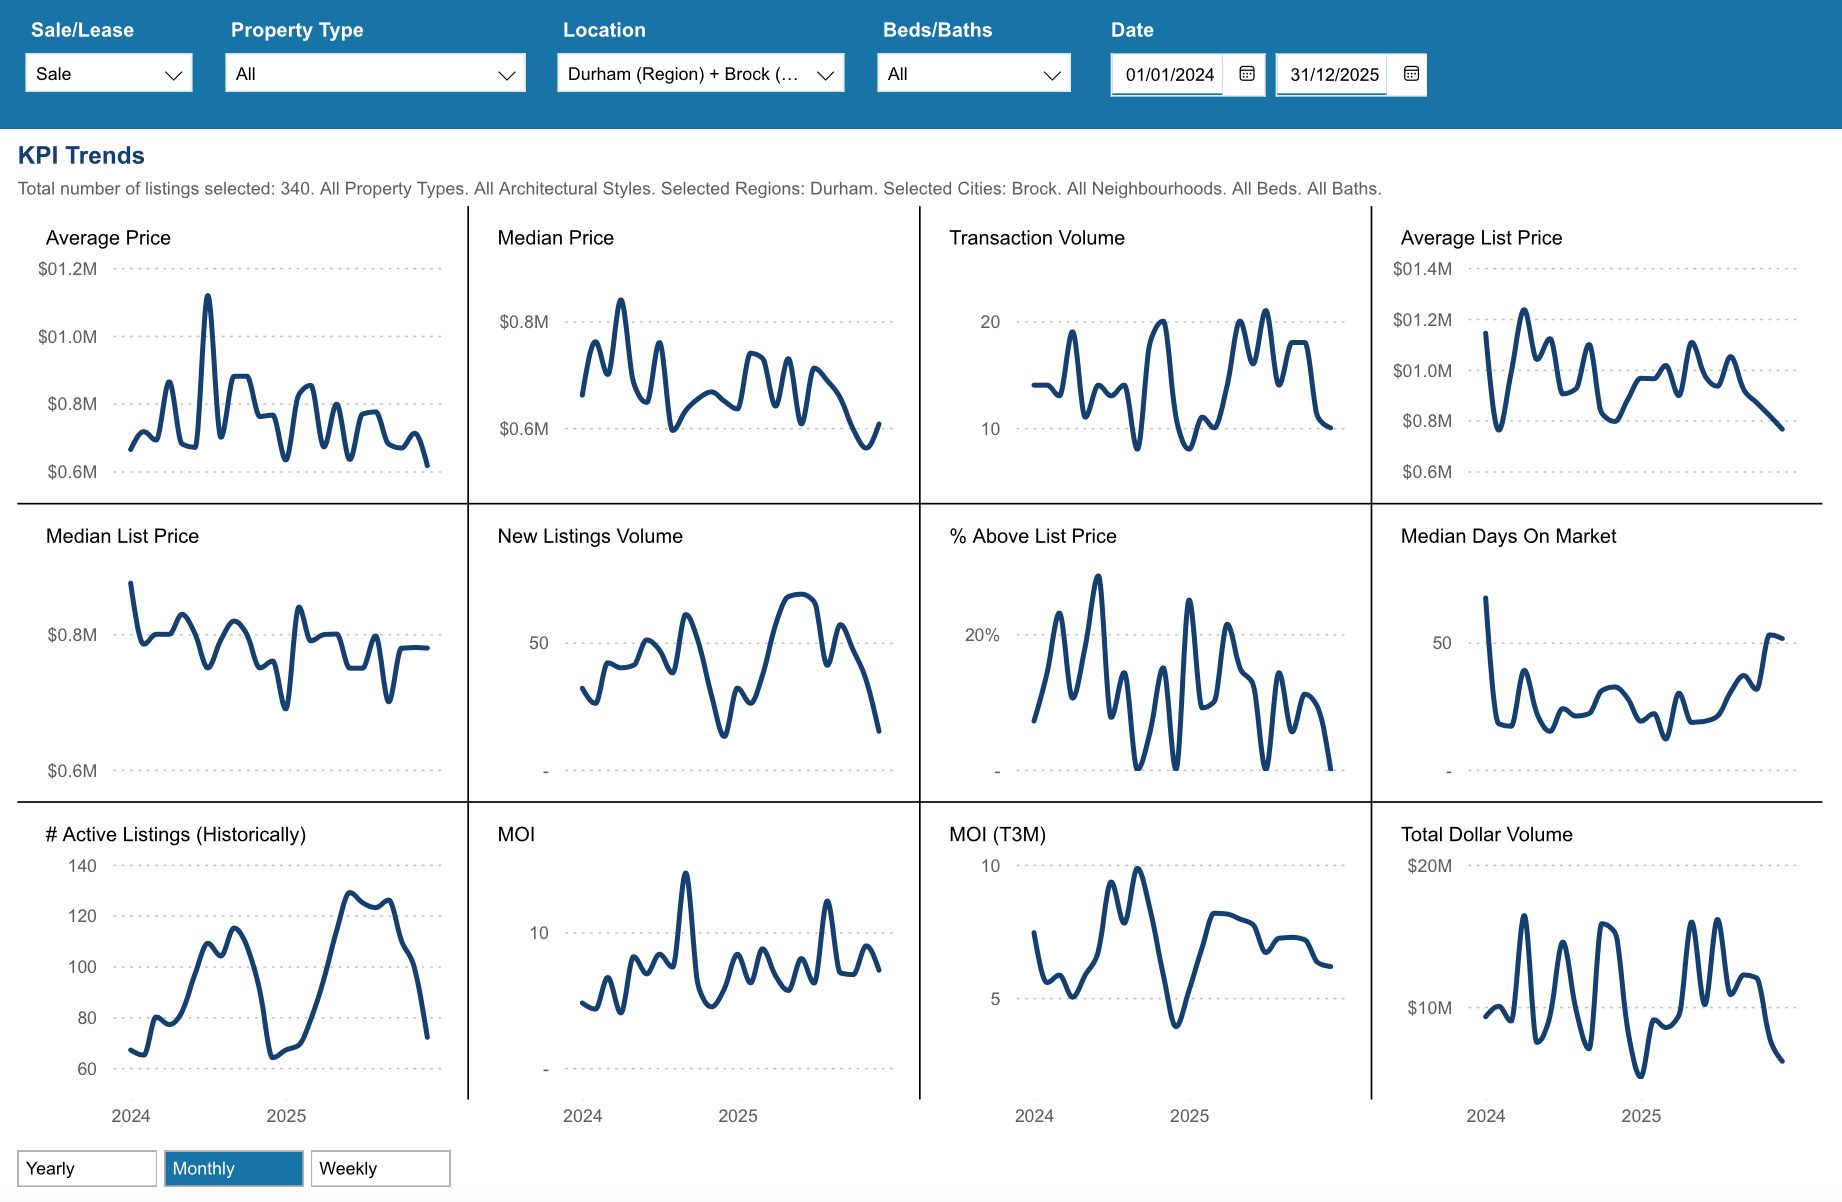
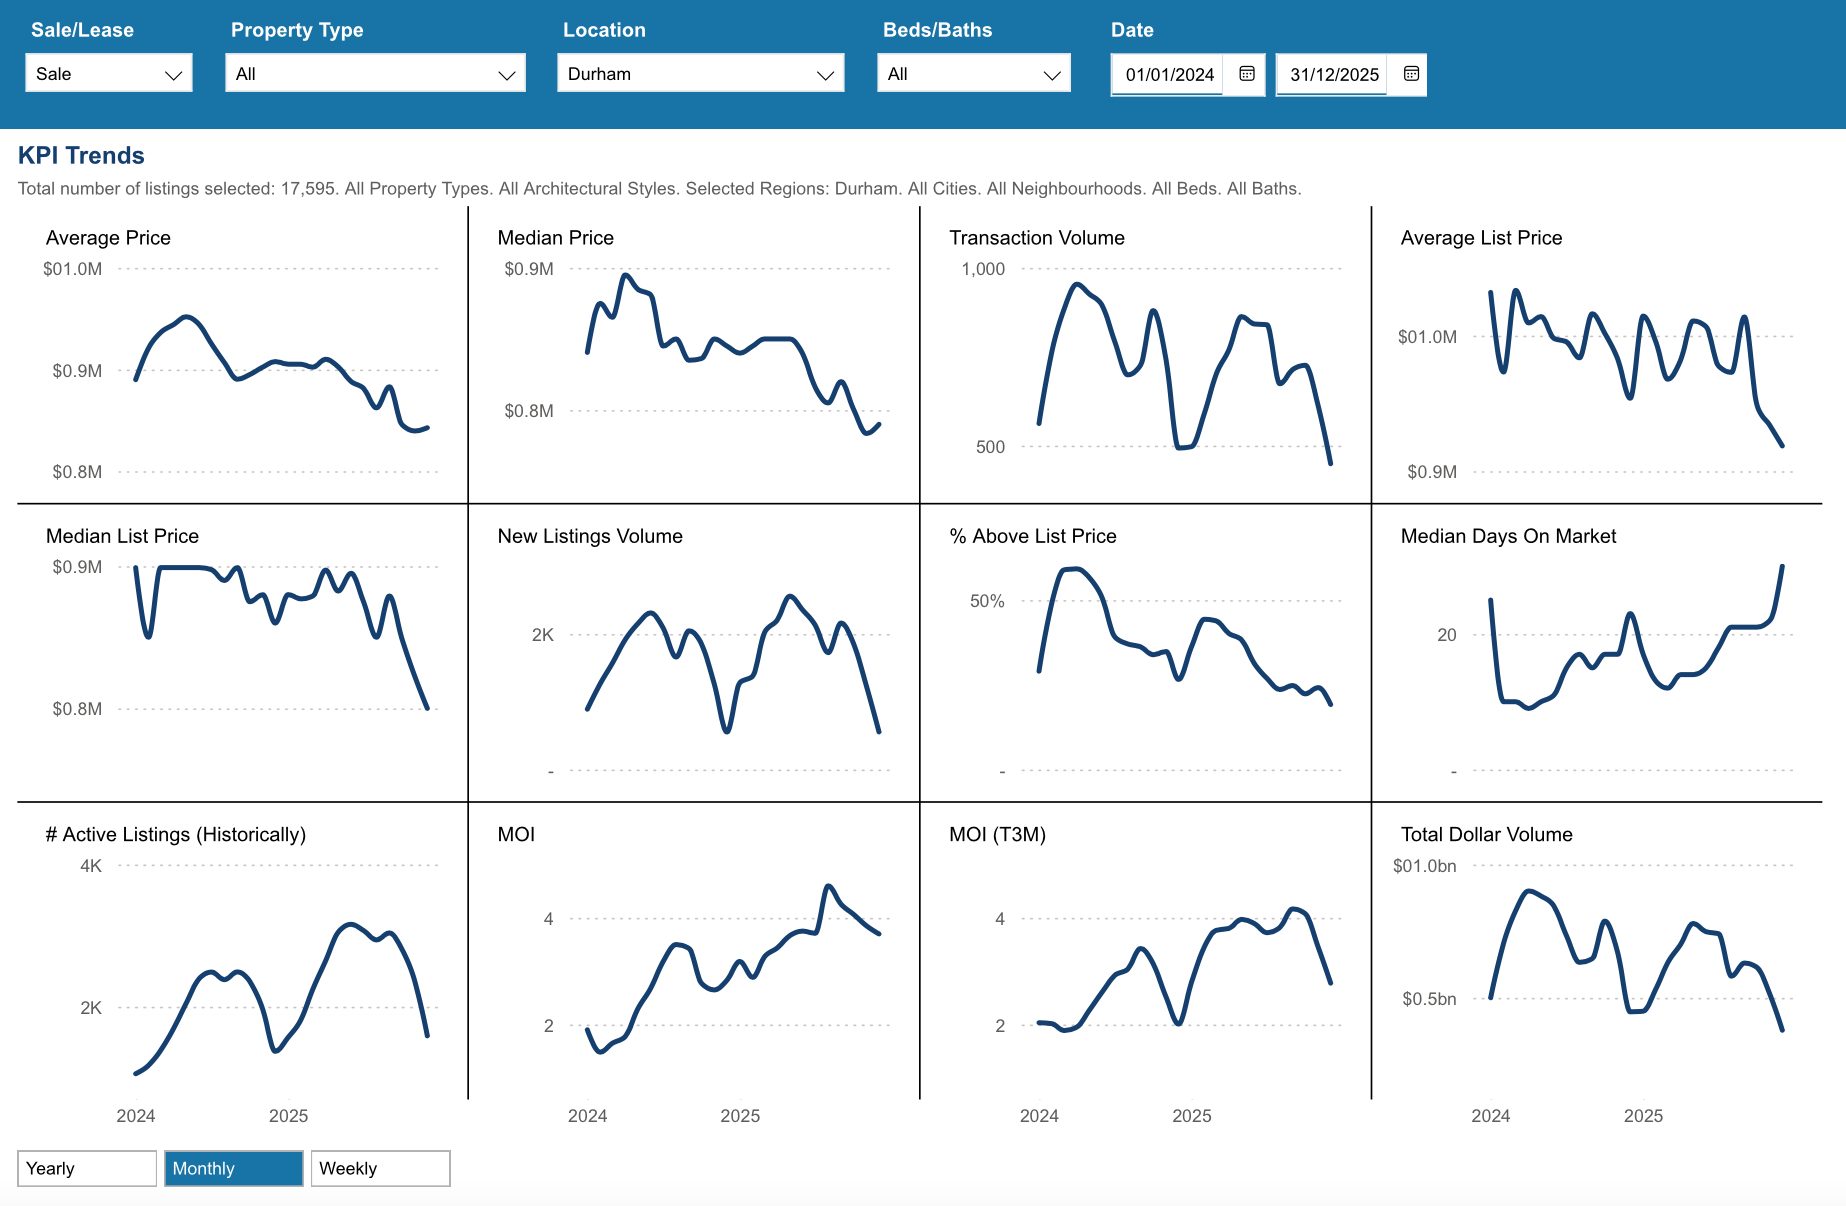
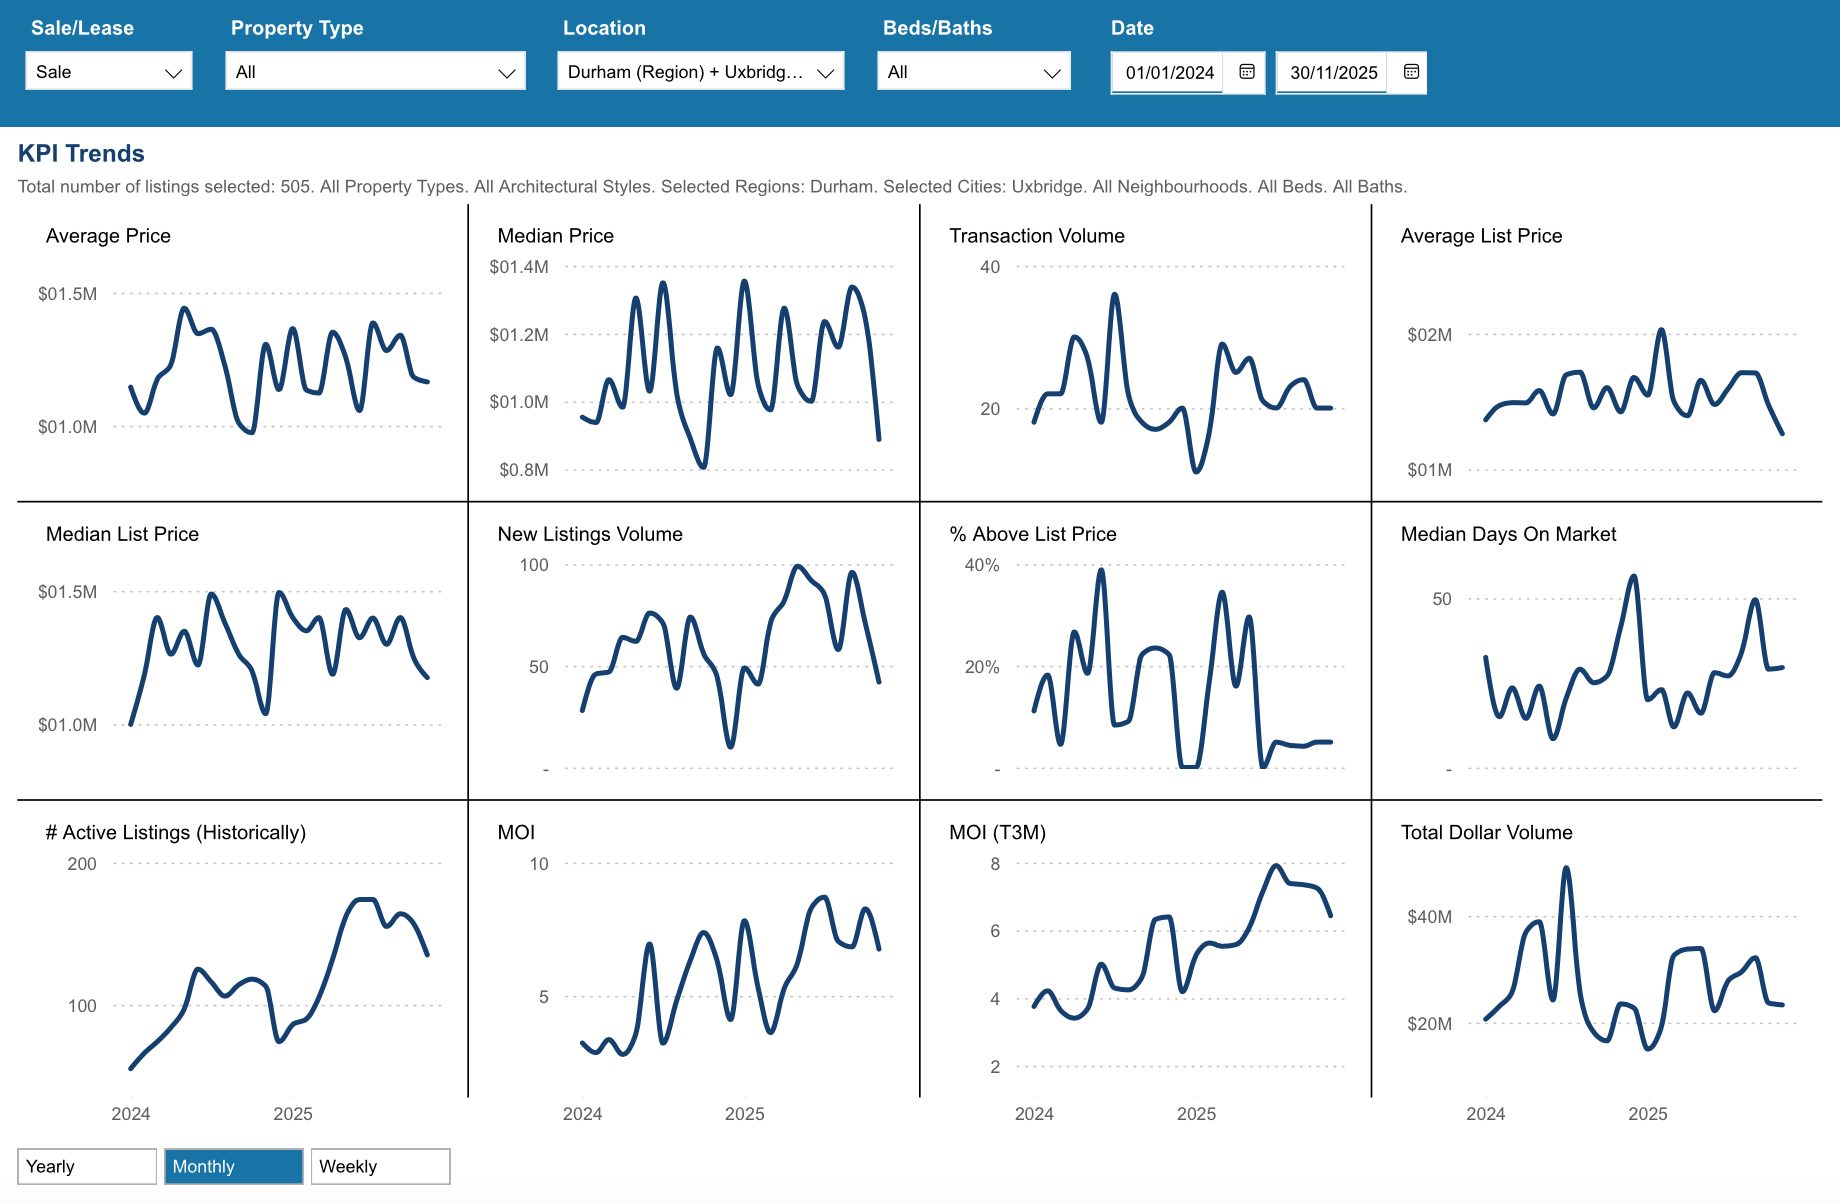
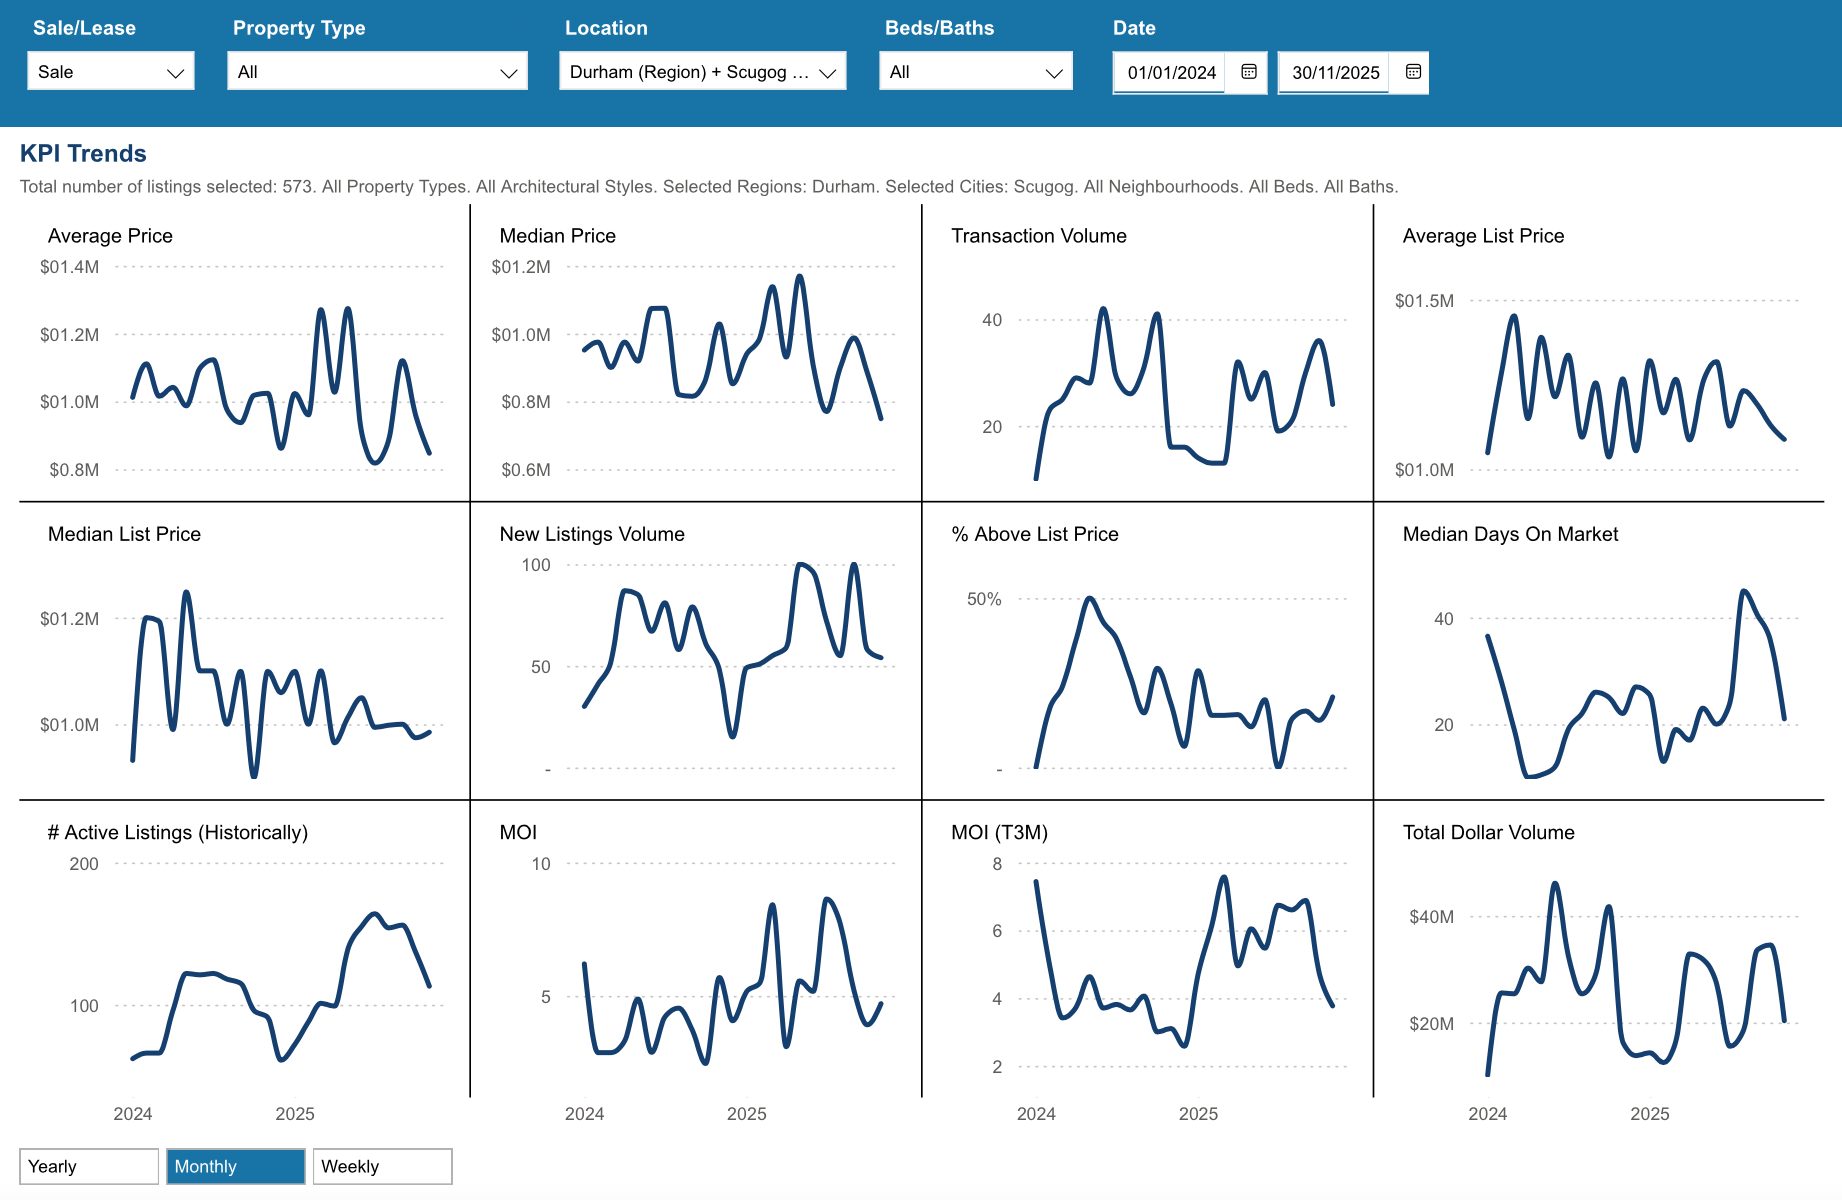
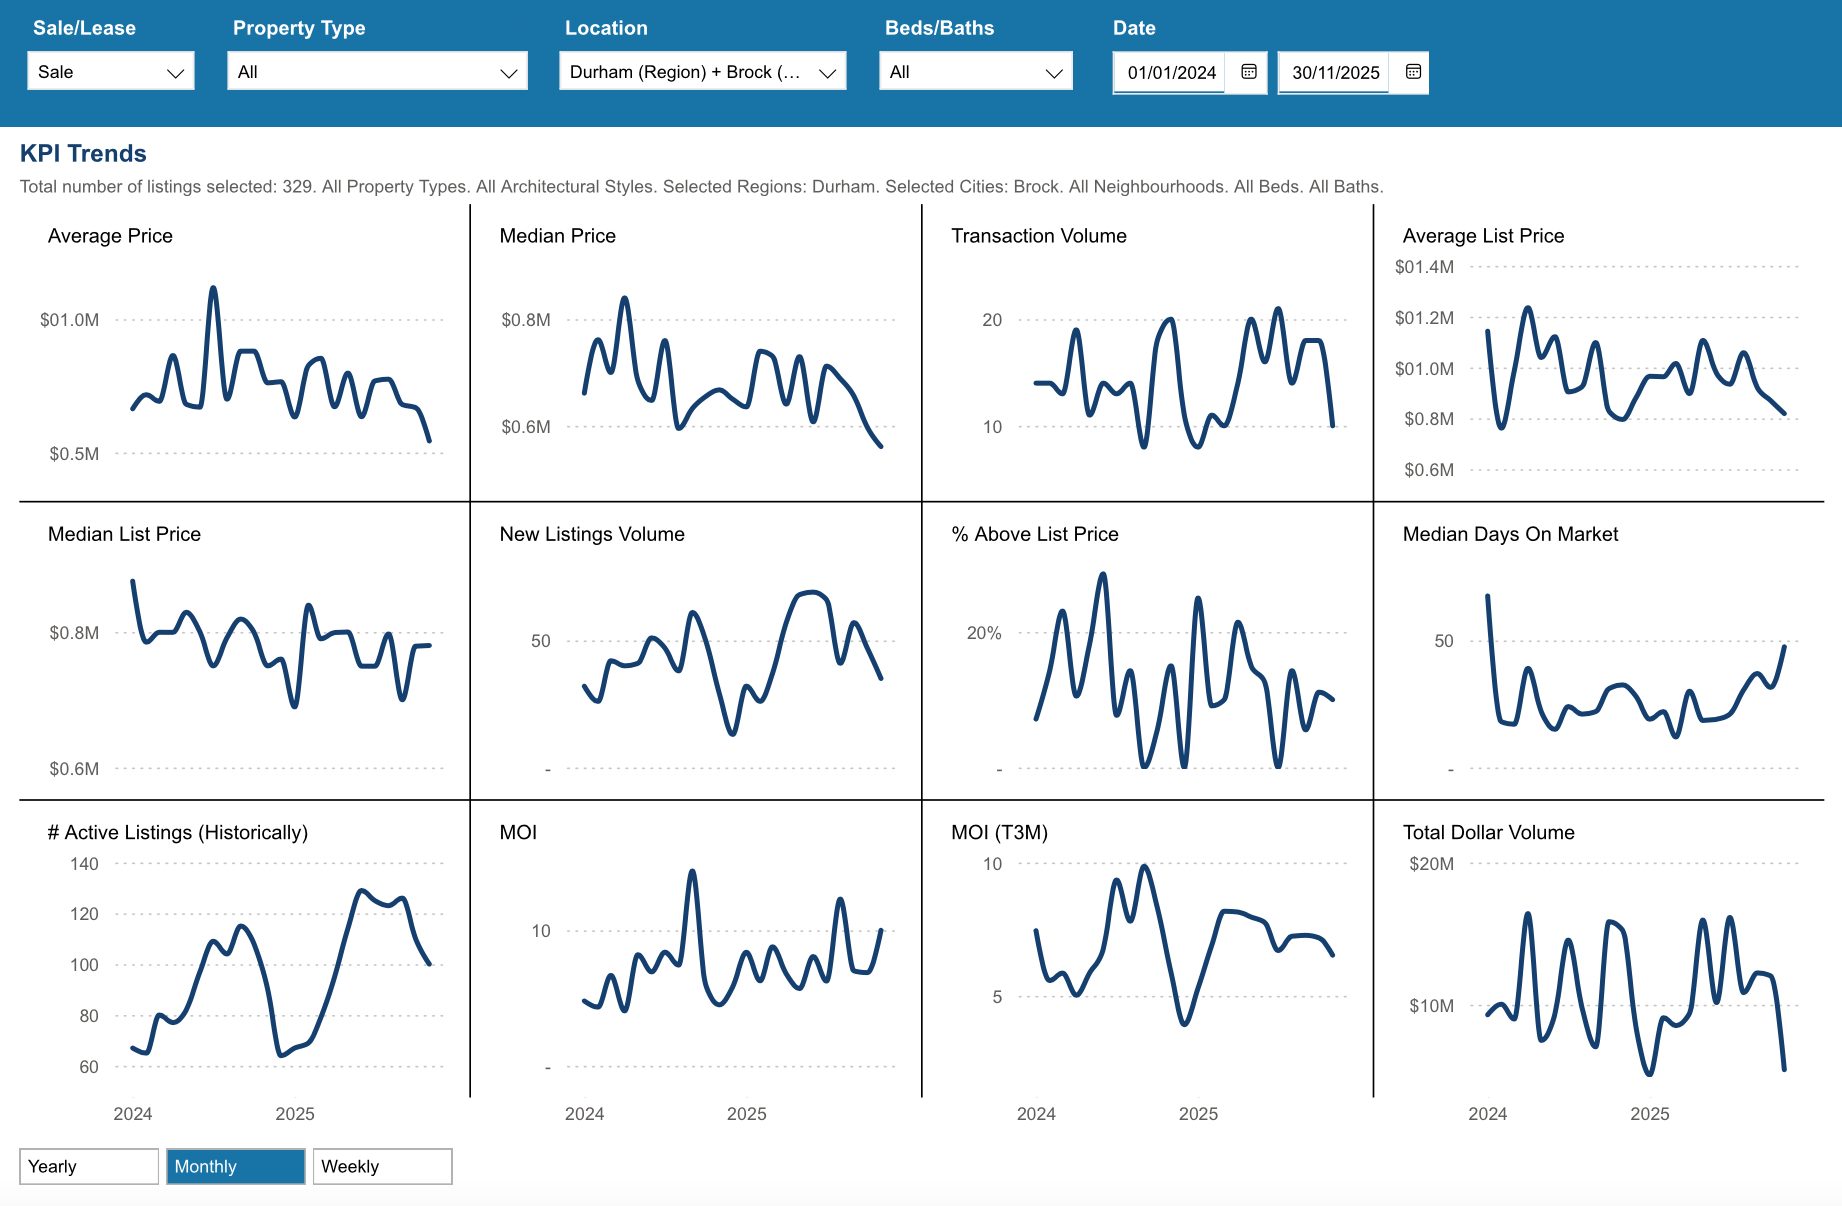
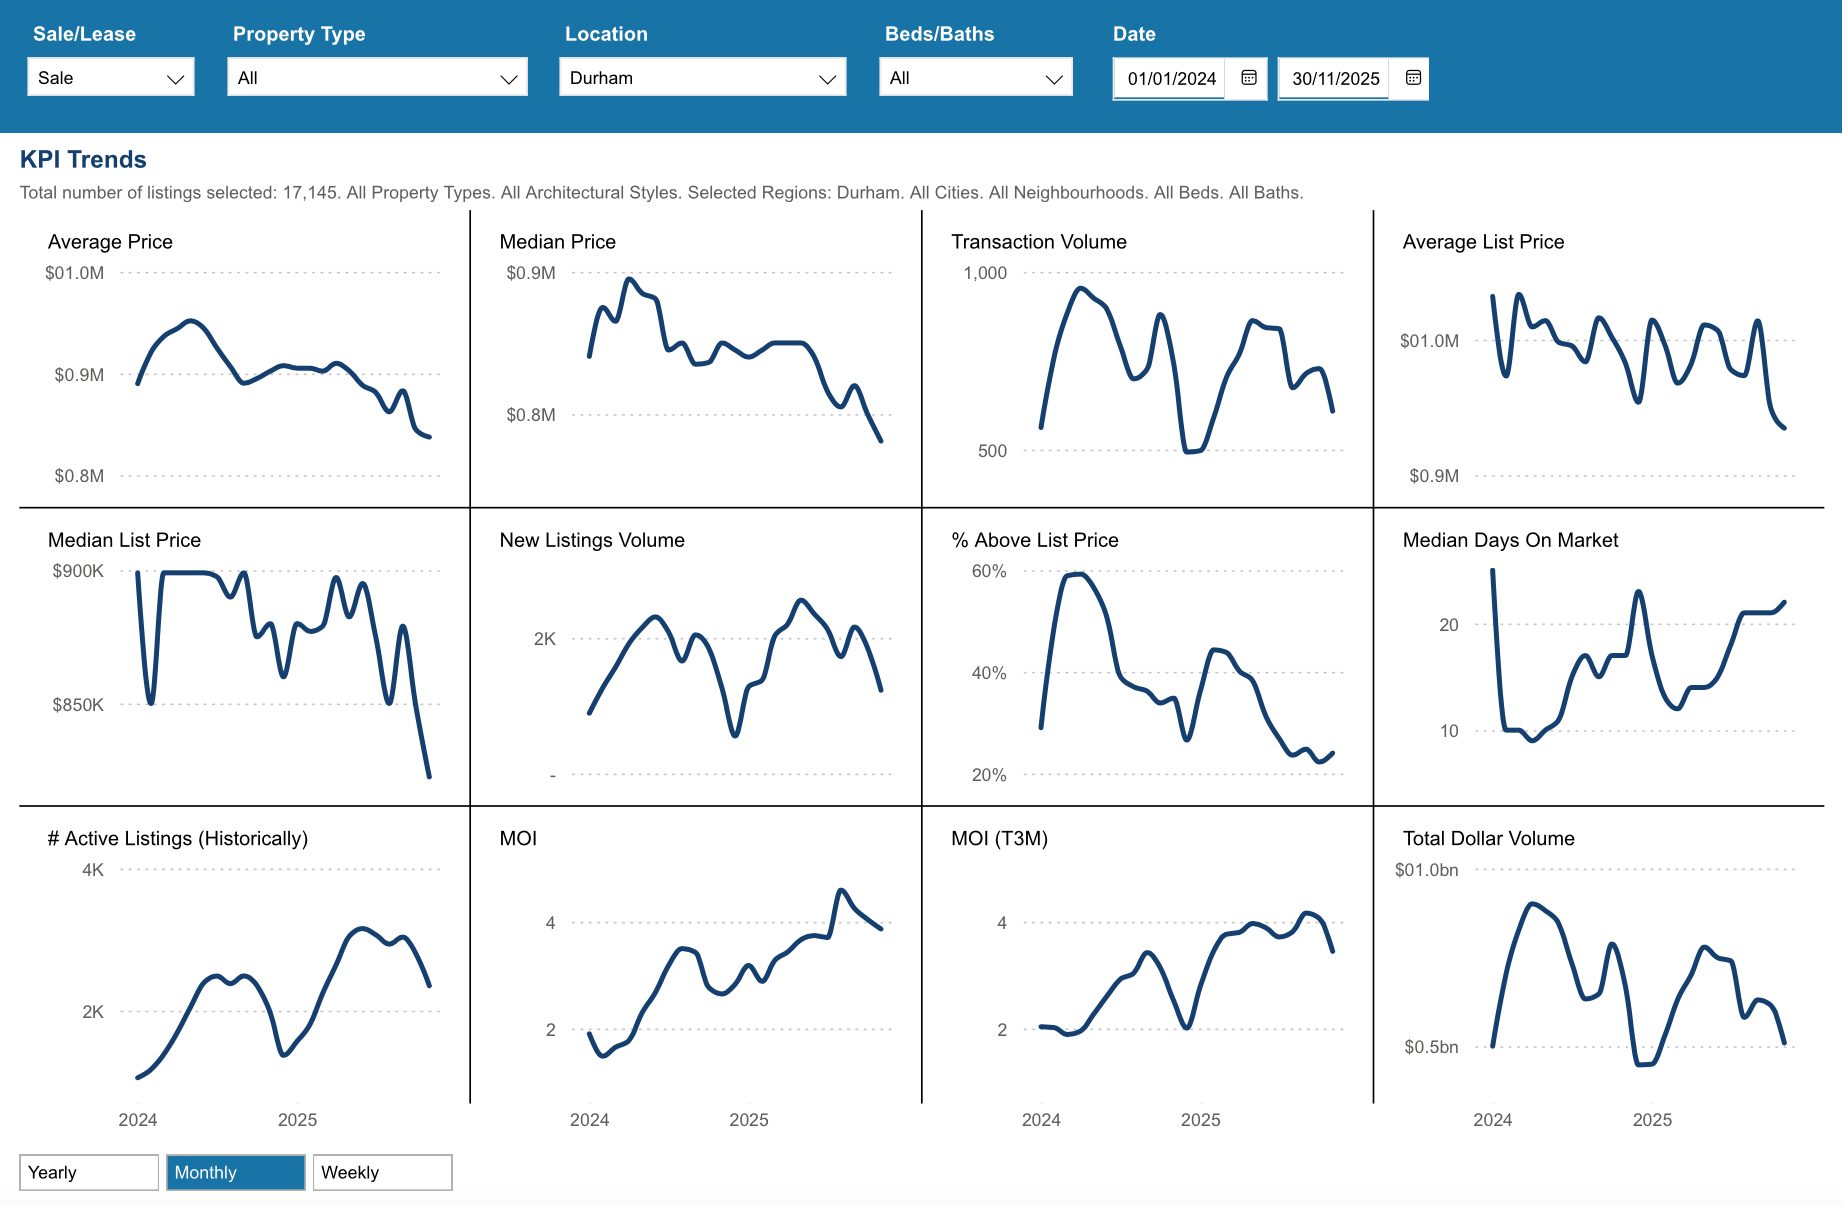
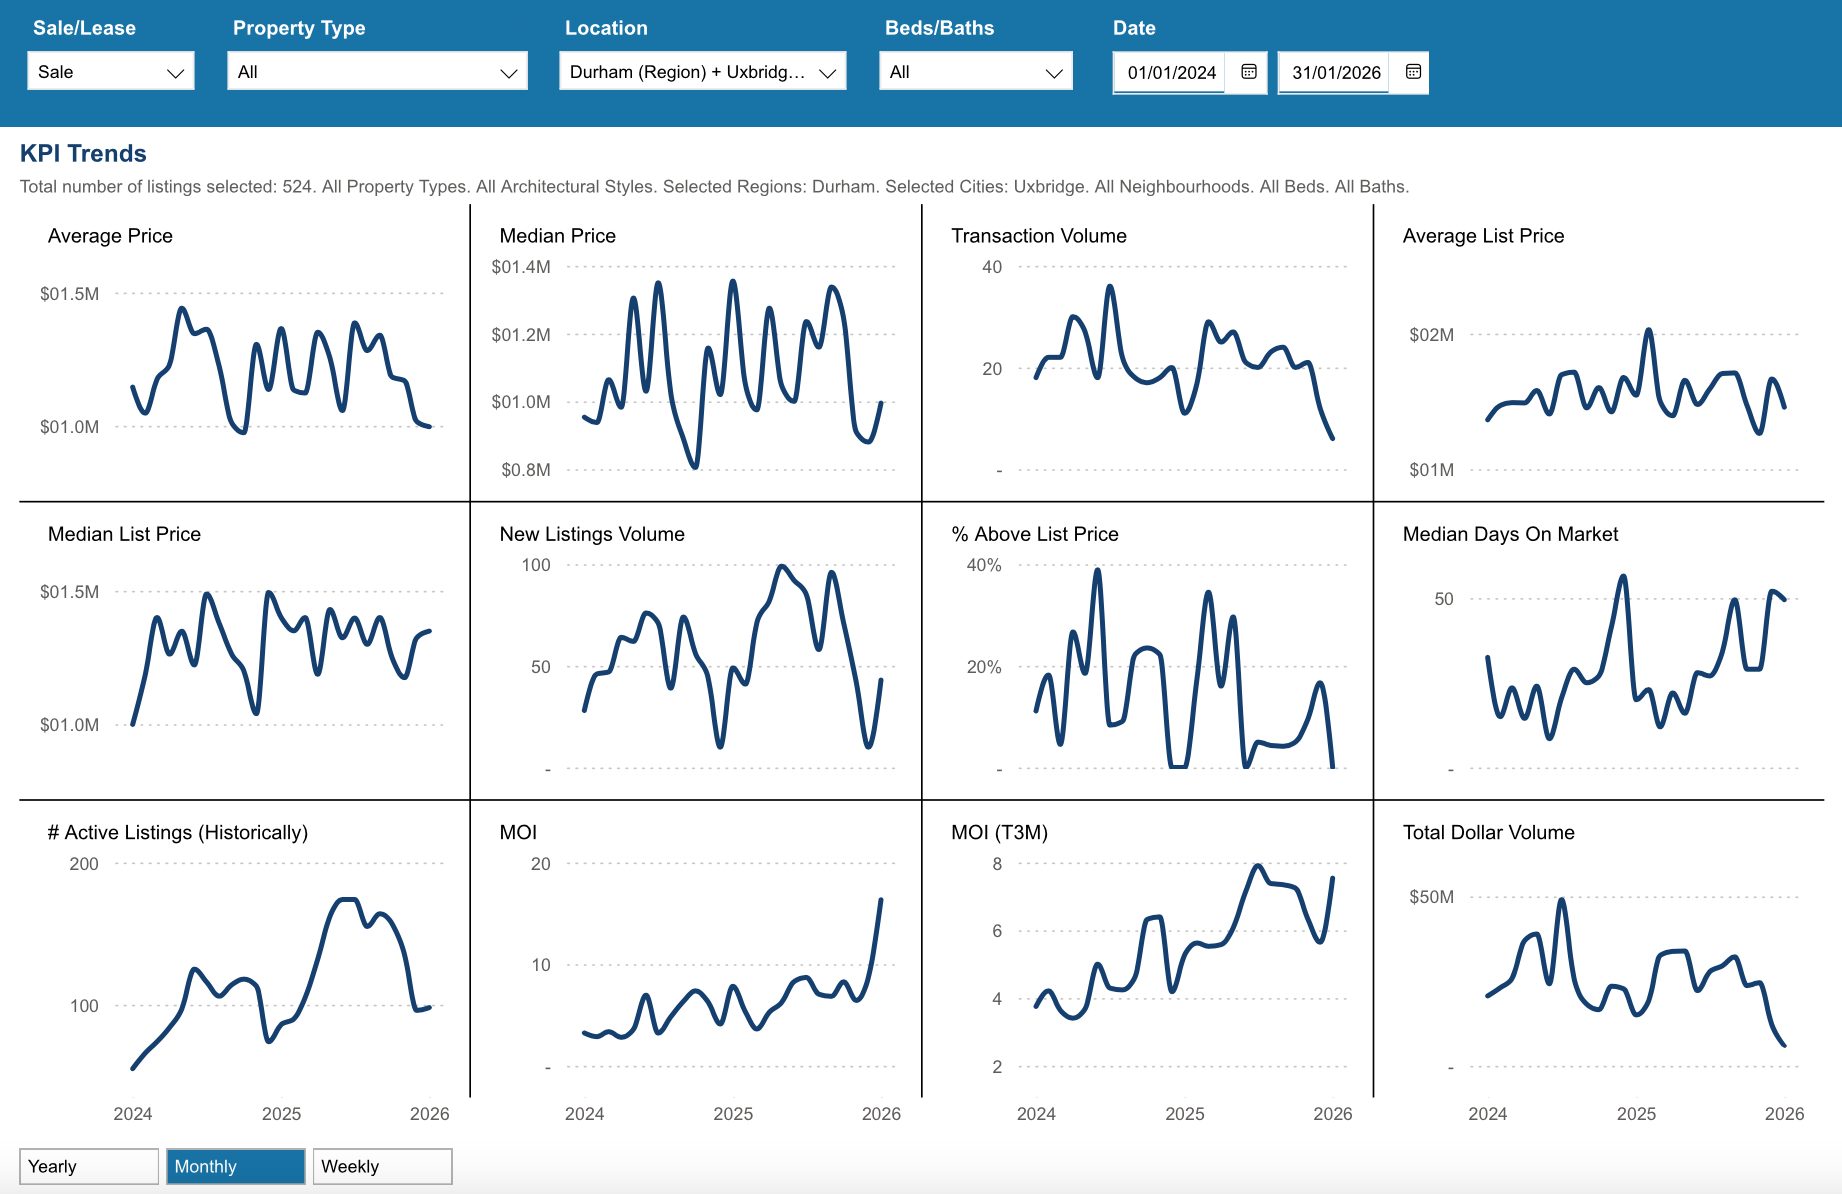
Key Performance Indicators (KPIs) from January 2024 through January 2026 provide a clear snapshot of how the Township of Uxbridge real estate market has evolved across all property types, architectural styles, and home configurations
WATCH OUR MONDAY MARKET MINUTES

*Information is believed to be accurate at time of posting but is not guaranteed to be correct. Some values may vary slightly based on the exact date and time the reports were generated. Market stats are provided by TRREB (Toronto Regional Real Estate Board) and are based on sales for the month of Attached/Row/Townhouses, Condo Apartments, Condo Townhouses, Detached, Detached with Common Elements, Link Homes and Semi-detached. *Some values may vary slightly based on the exact date and time the reports were generated.
Not intended as a solicitation if your property is already listed by another broker. Affiliated real estate agents are independent contractor sales associates, not employees. ©2021 Coldwell Banker. All Rights Reserved. Coldwell Banker and the Coldwell Banker logos are trademarks of Coldwell Banker Real Estate LLC. The Coldwell Banker® System is comprised of company owned offices which are owned by a subsidiary of Realogy Brokerage Group LLC and franchised offices which are independently owned and operated. The Coldwell Banker System fully supports the principles of the Fair Housing Act and the Equal Opportunity Act.
Click below for more reports
Check out our Uxbridge and Scugog Events Pages to keep up to date on whats going on around town. Click the links or scan the Code with your phone to take you directly there.

UXBRIDGE EVENTS

SCUGOG EVENTS