Facebook
 X
X
 Pinterest
 Copy Link
Uxbridge Housing January 2025

Each office is independently owned and operated
![]()

![]()
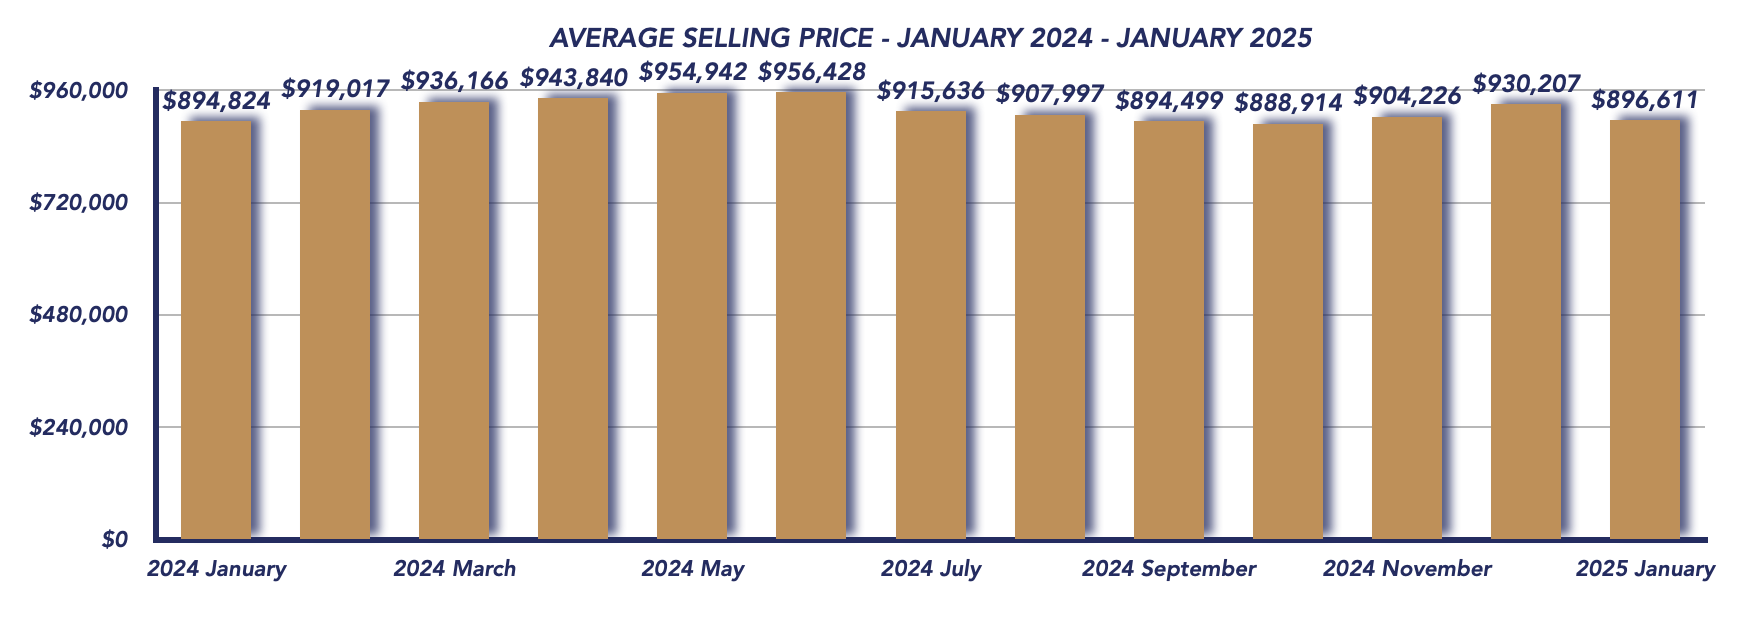
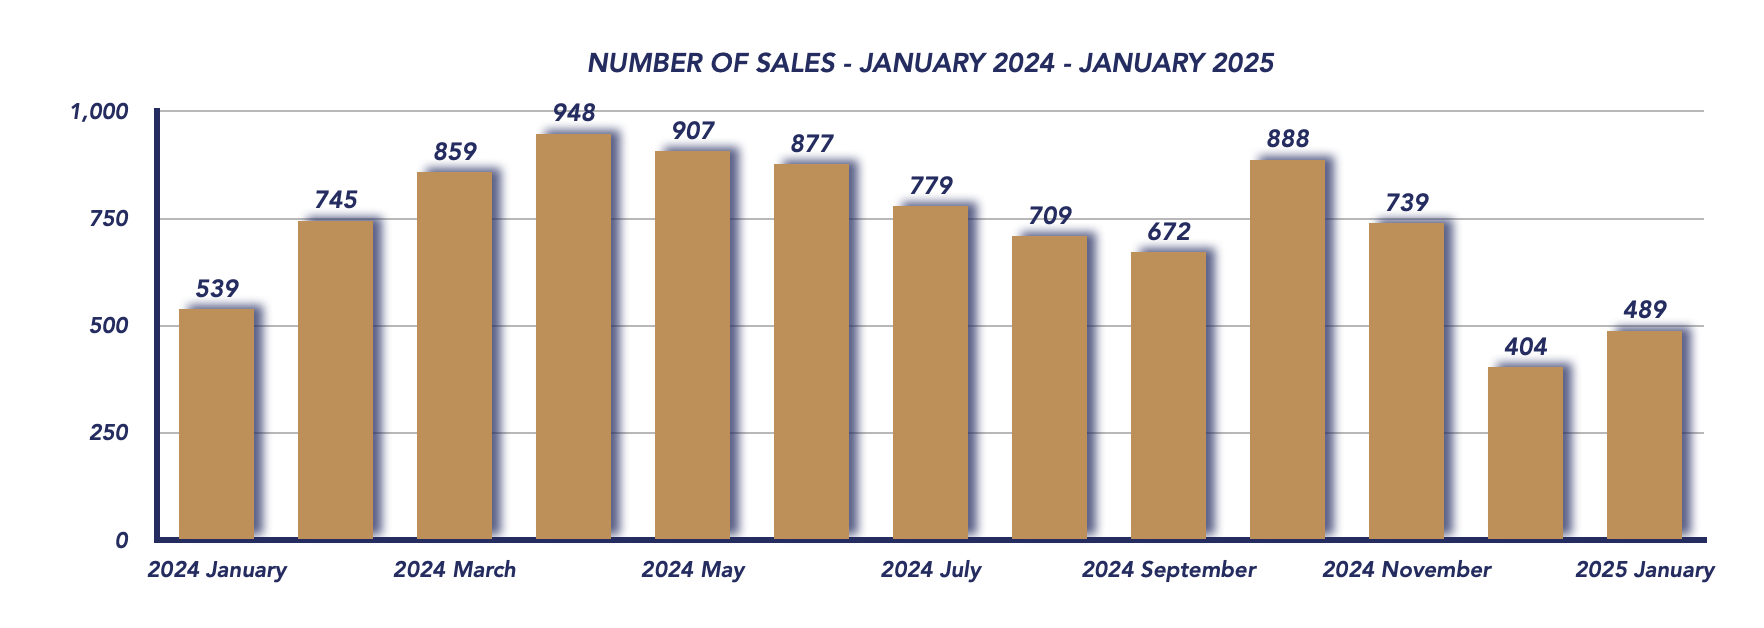
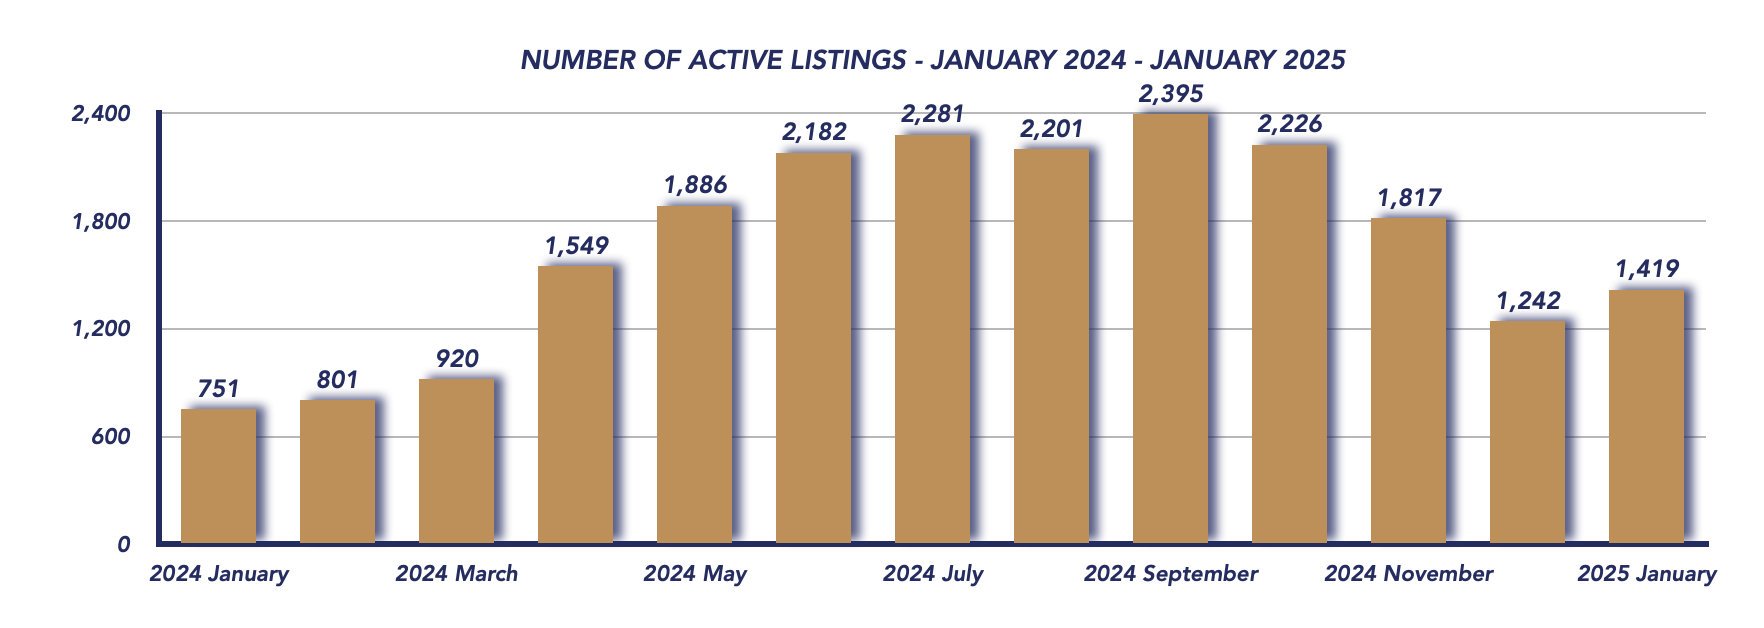
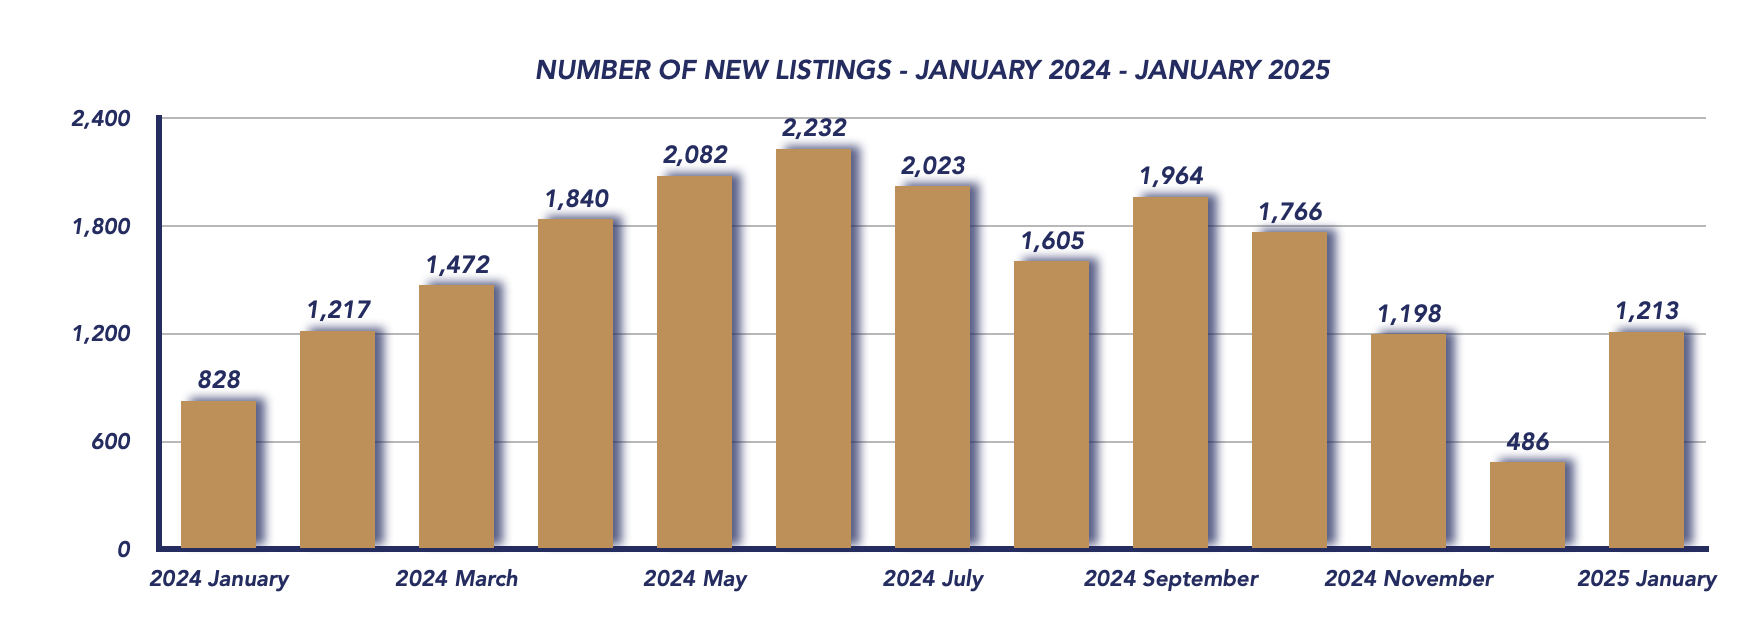
Housing Market Report for January 2025
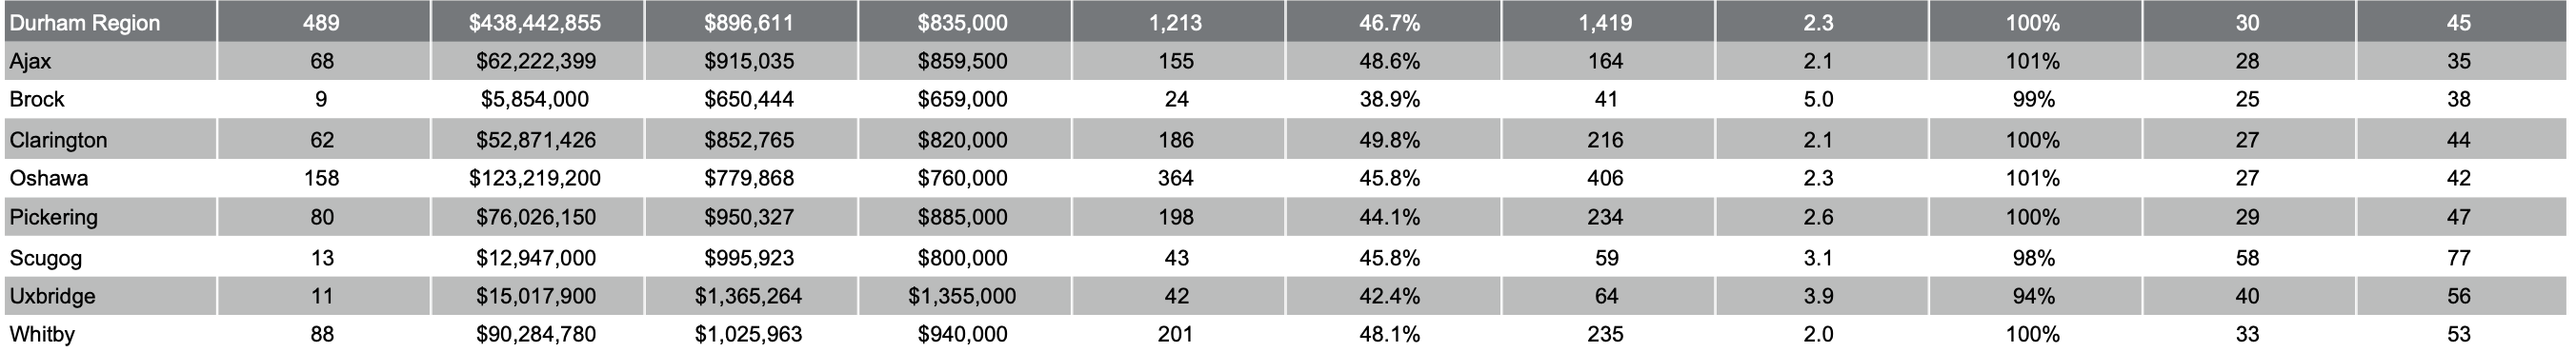
Here is the Region of Durham Housing January 2025 report (all housing types), with reports from the Canadian Real Estate Association, and Toronto Regional Real Estate Board included.
This housing report for Durham Region includes the number of new listings, average list price, number of properties sold, average selling price, average days on market and average asking price to selling price ratio for all property types within the Region of Durham.
Scroll to the bottom for links to take you to the housing market reports for Uxbridge, Scugog and Brock.
![]()
![]()

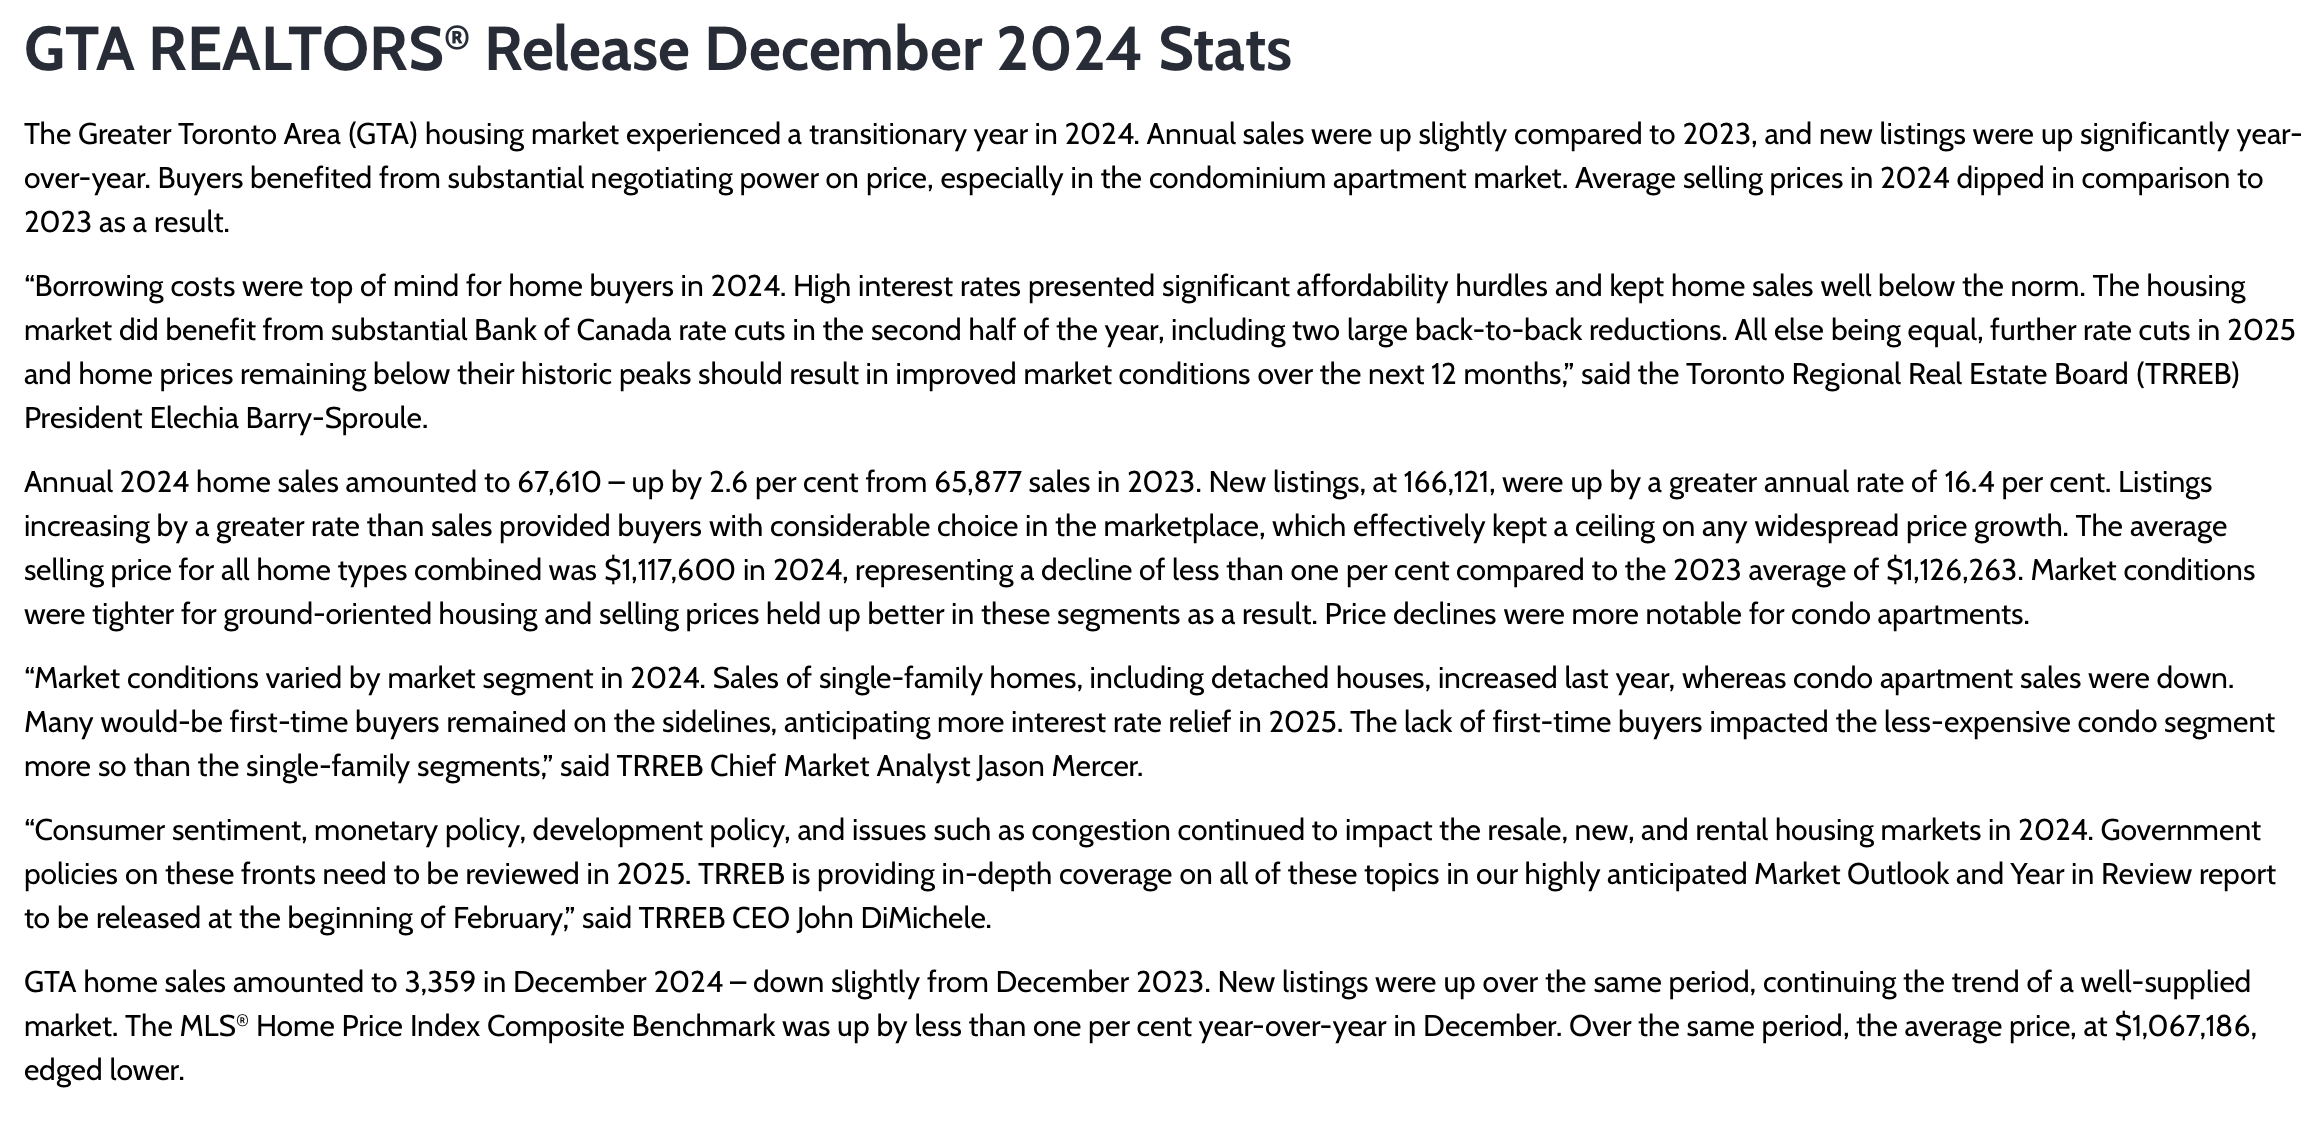
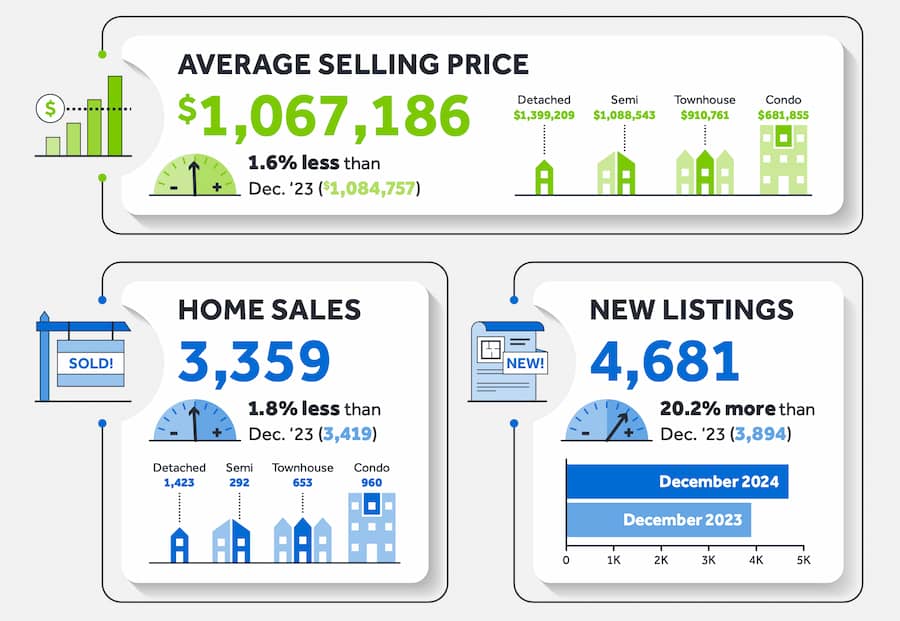
From Toronto Regional Real Estate Board
Read the Toronto Regional Real Estate Board Market Watch Report
![]()
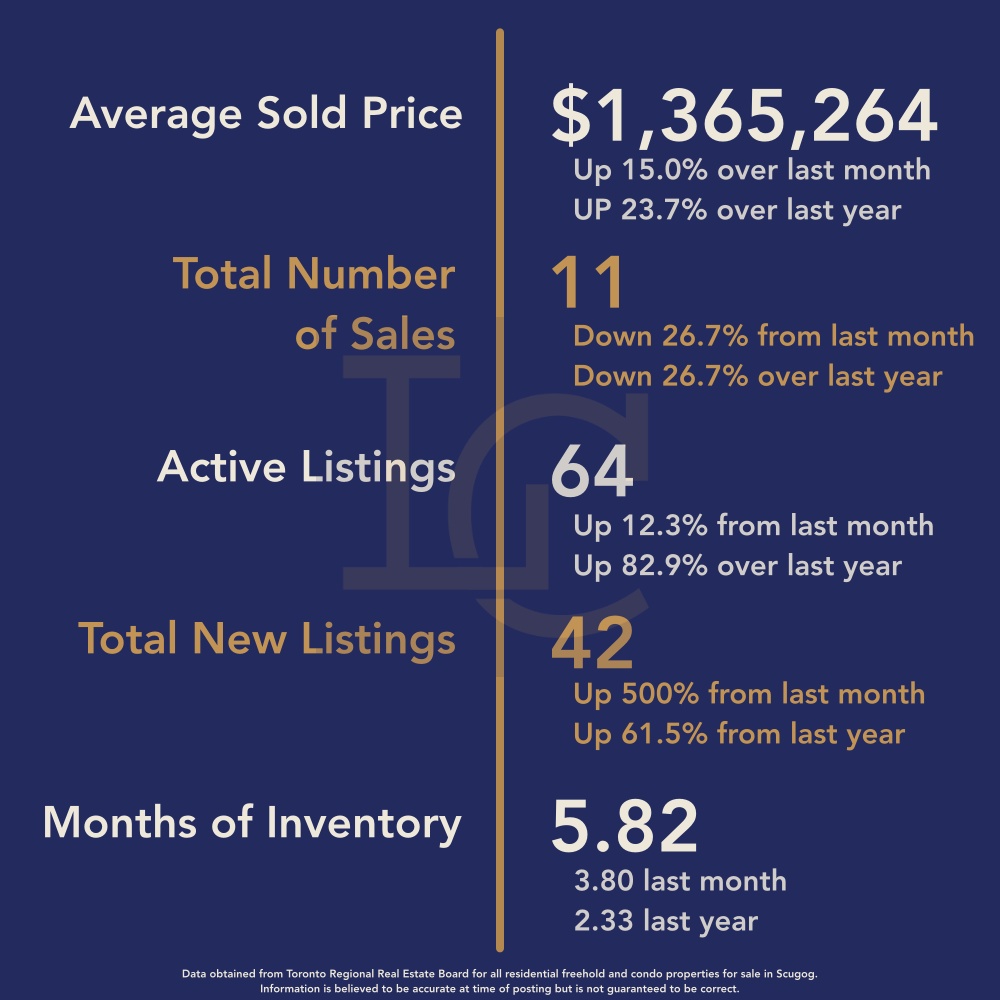
Township of Uxbridge Full Report
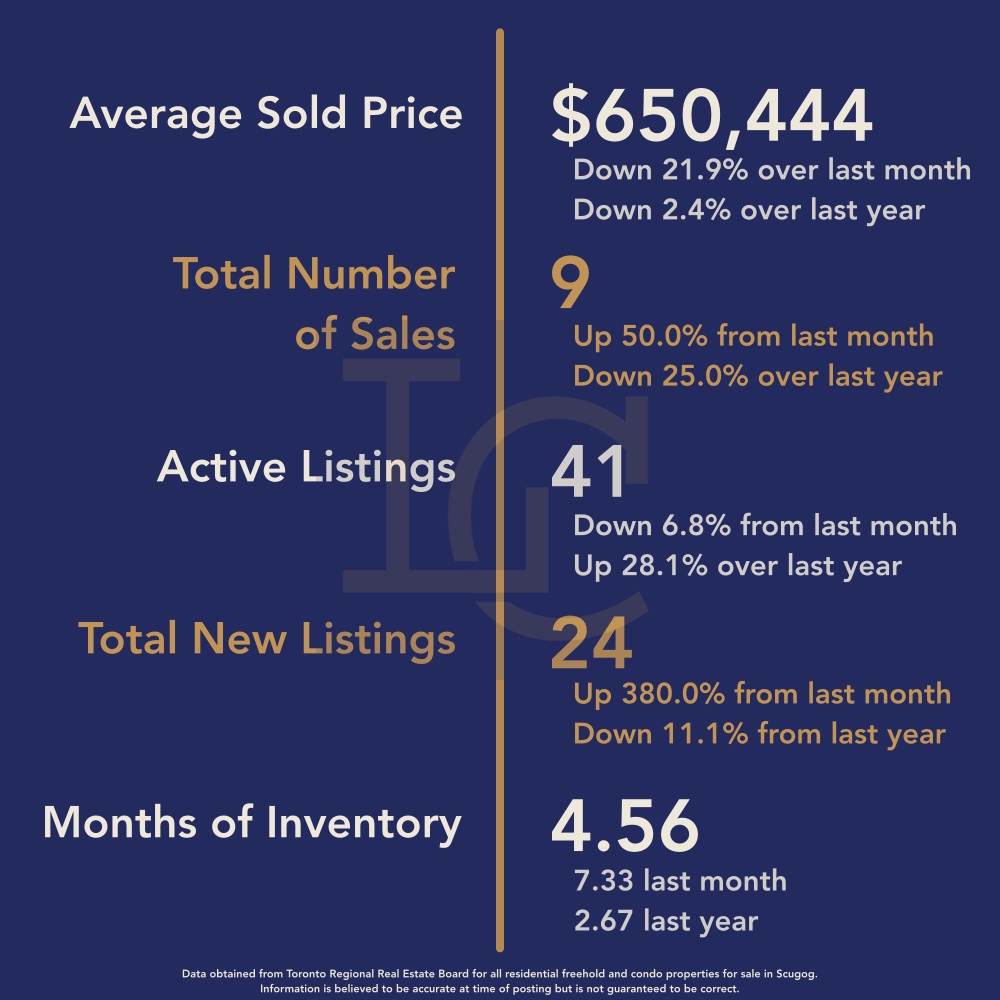
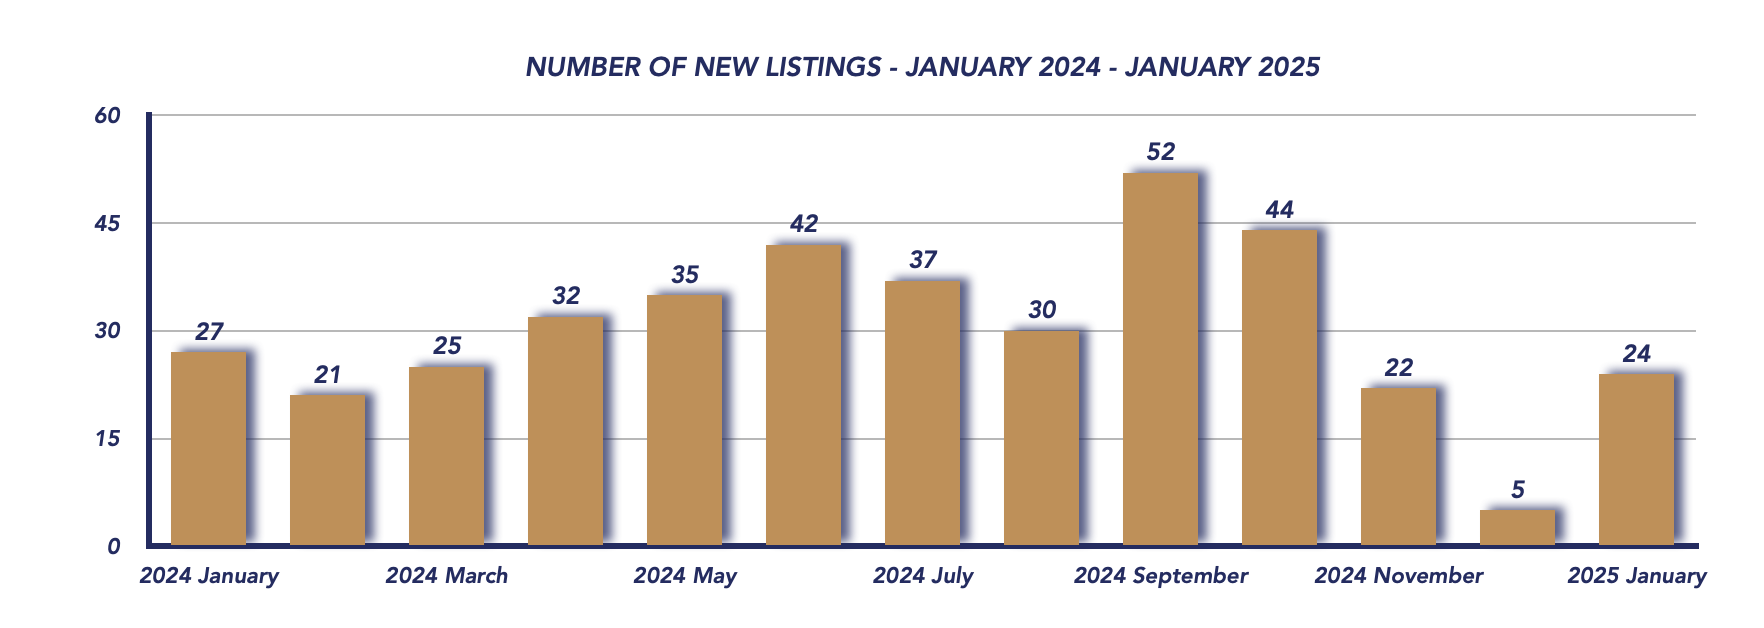
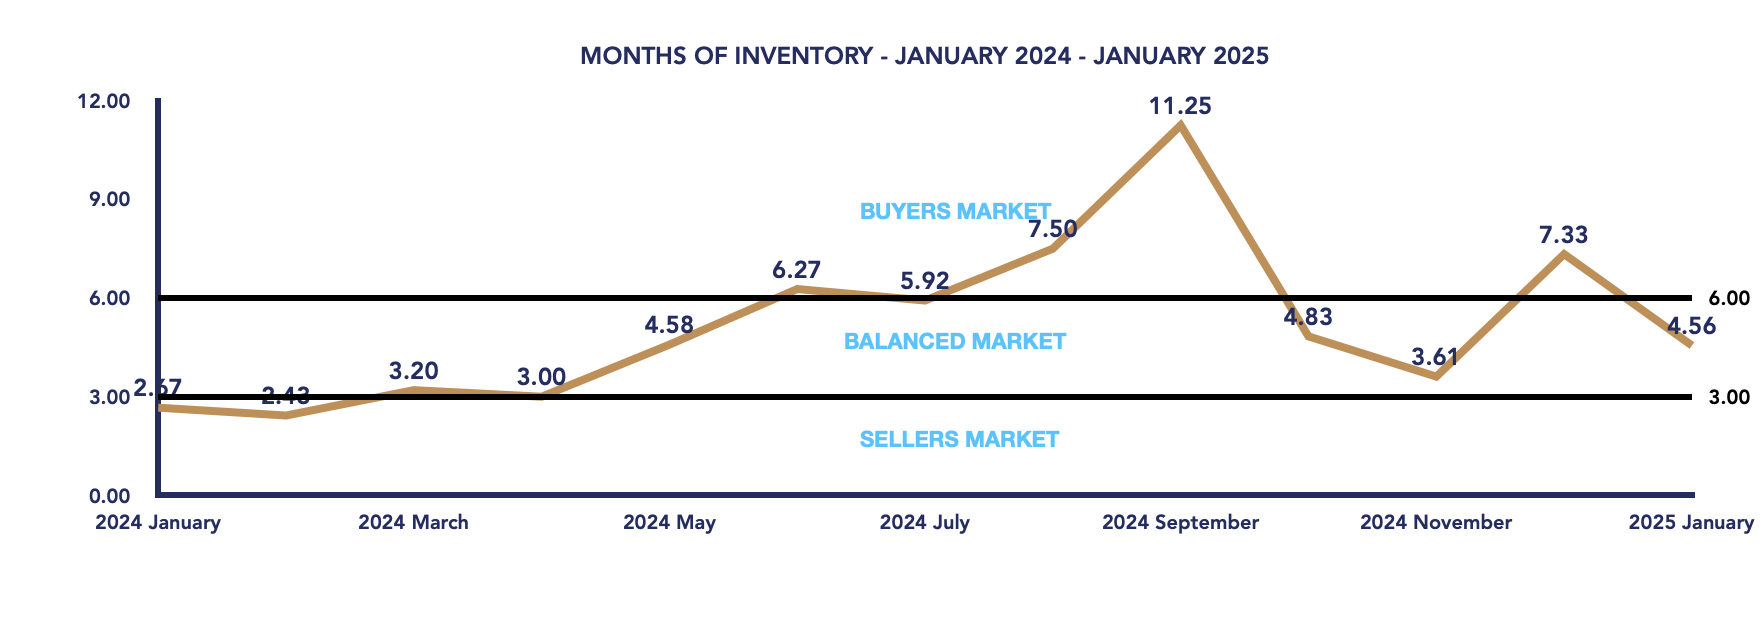
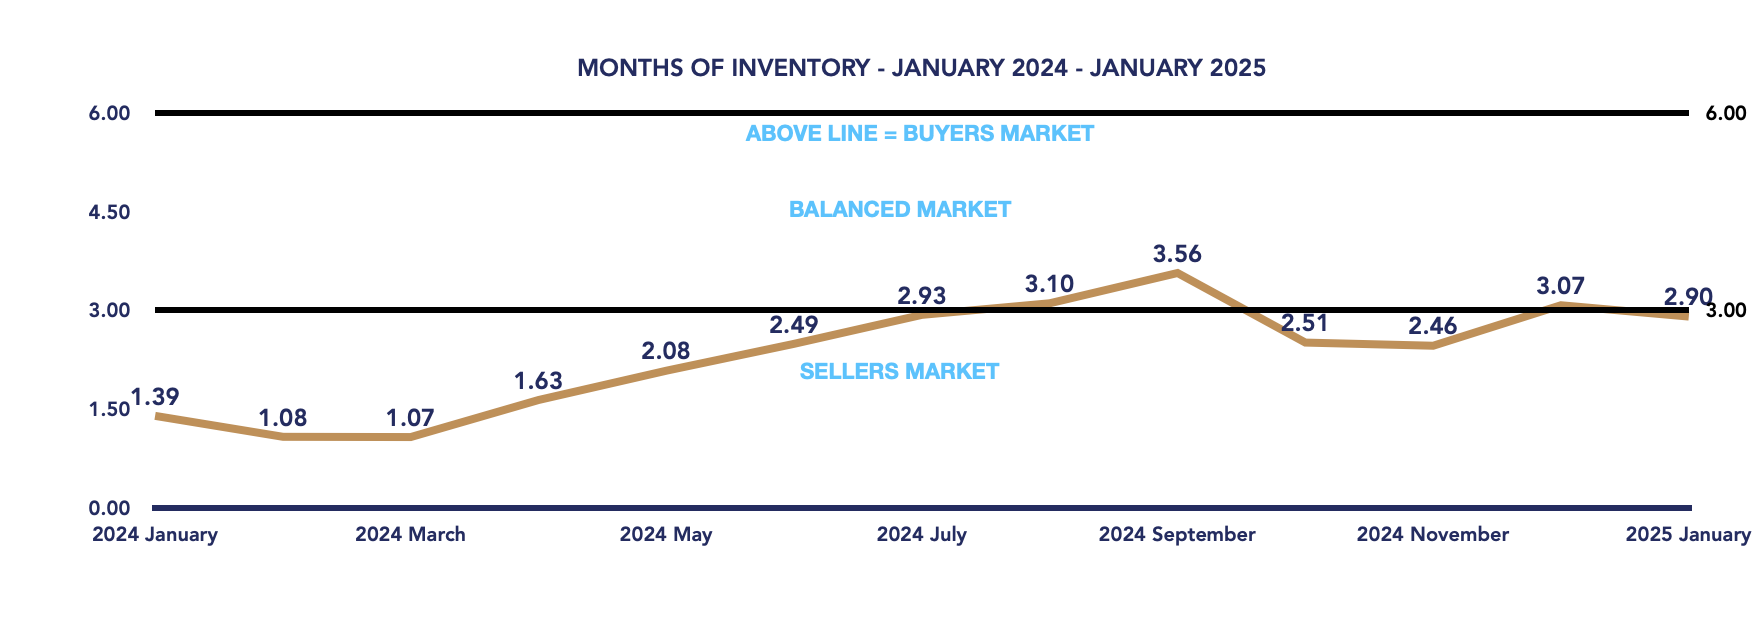
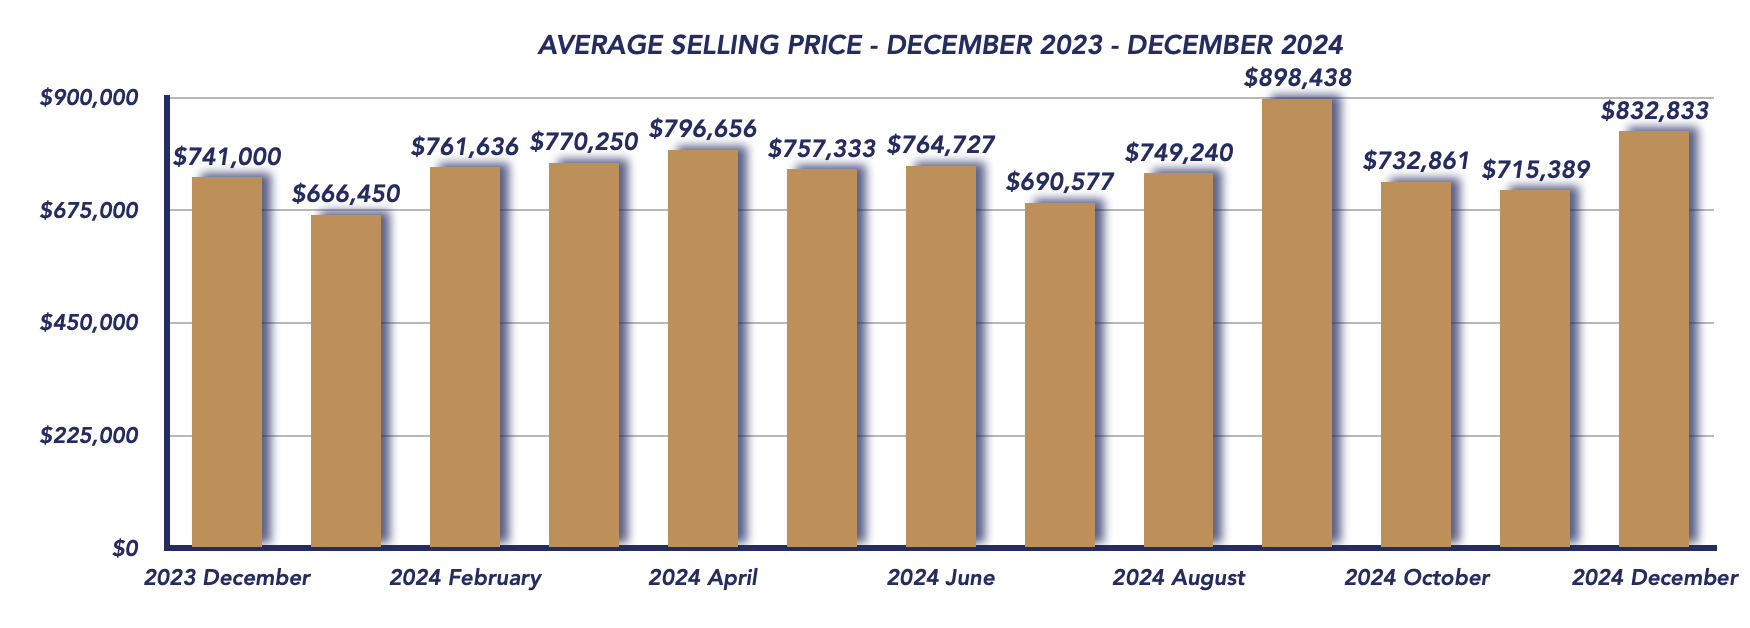
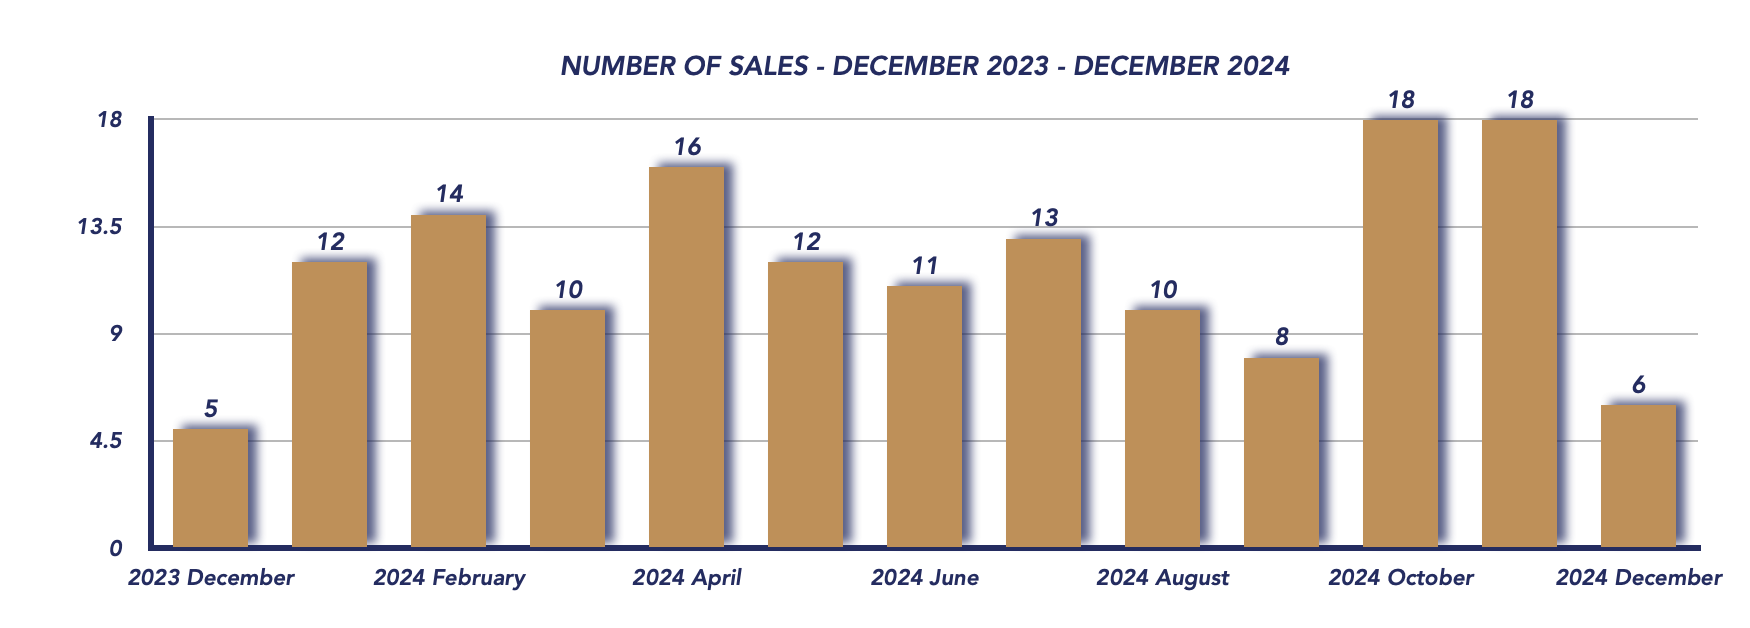
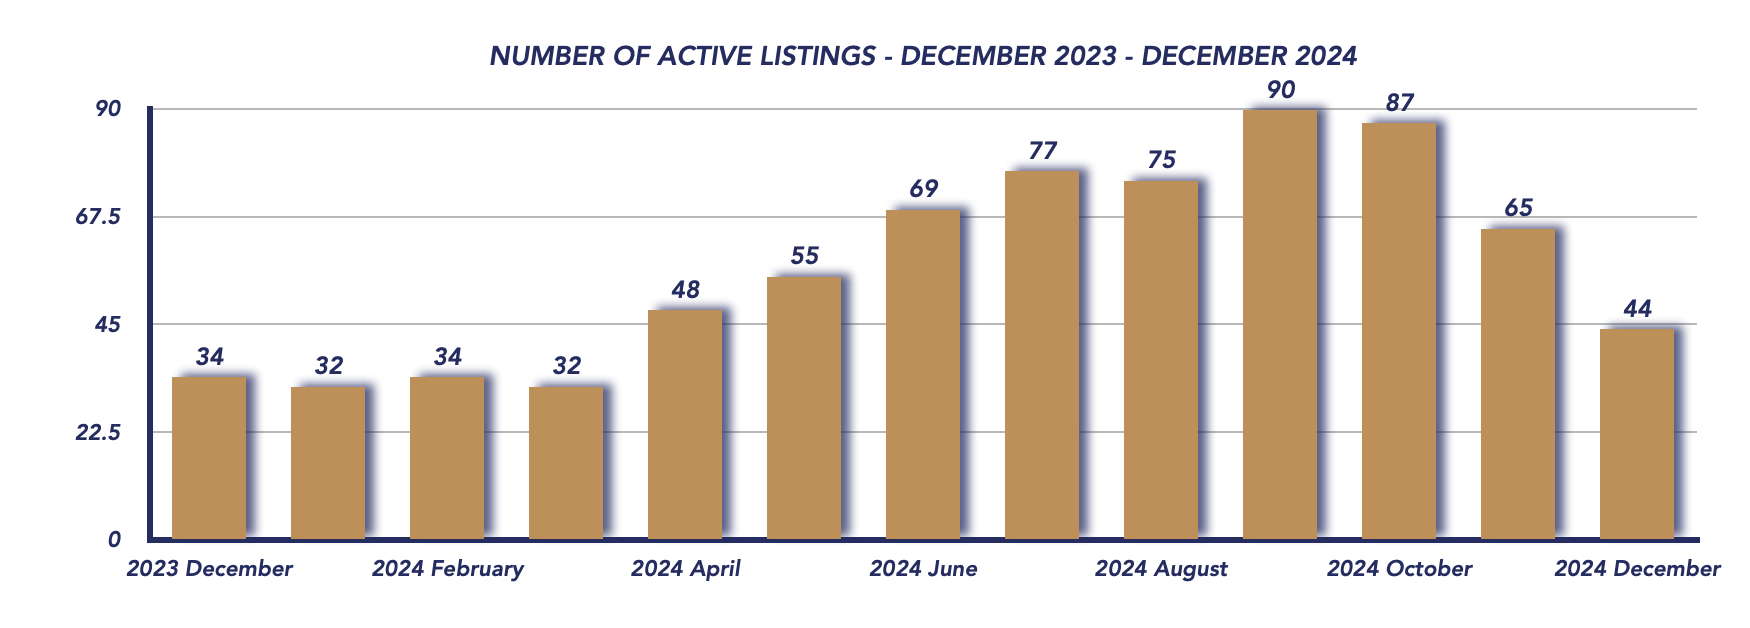
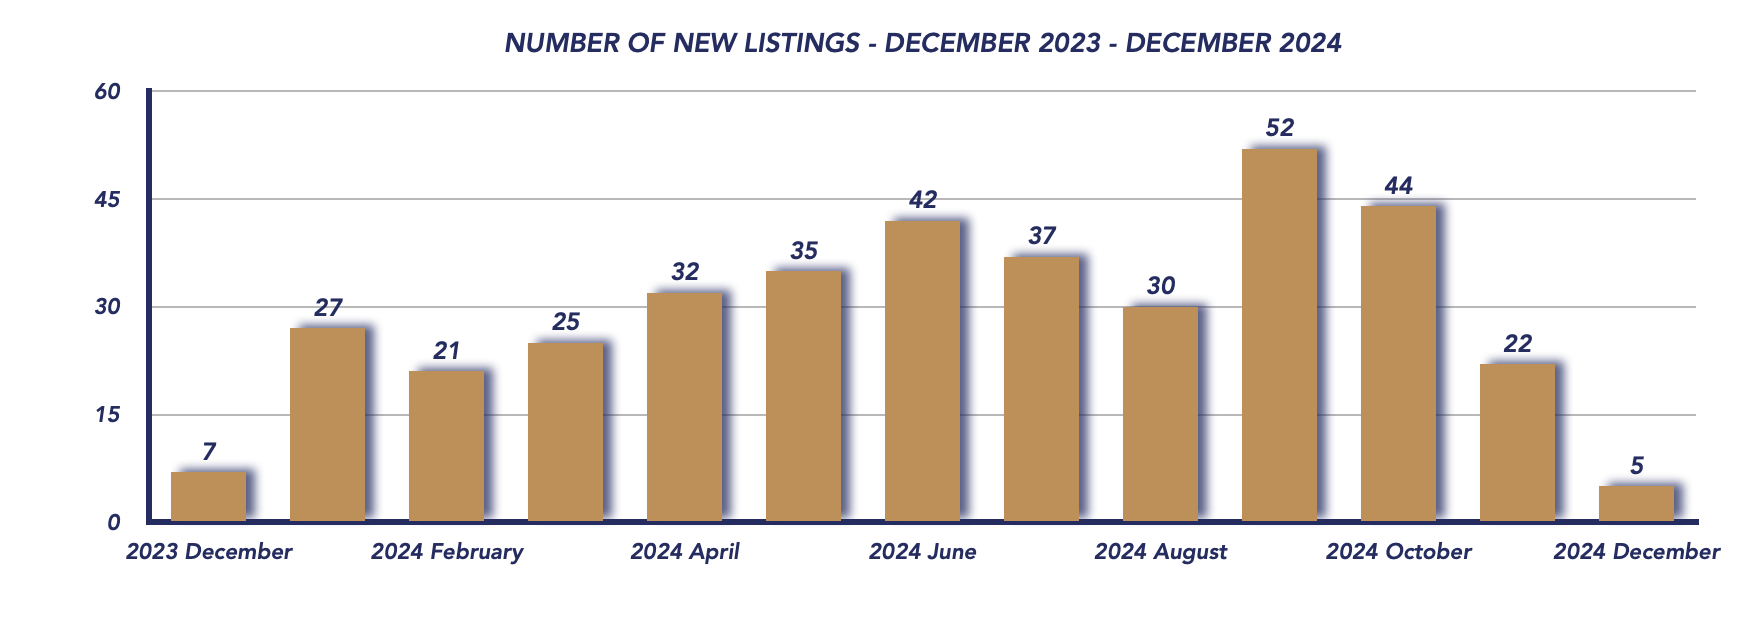
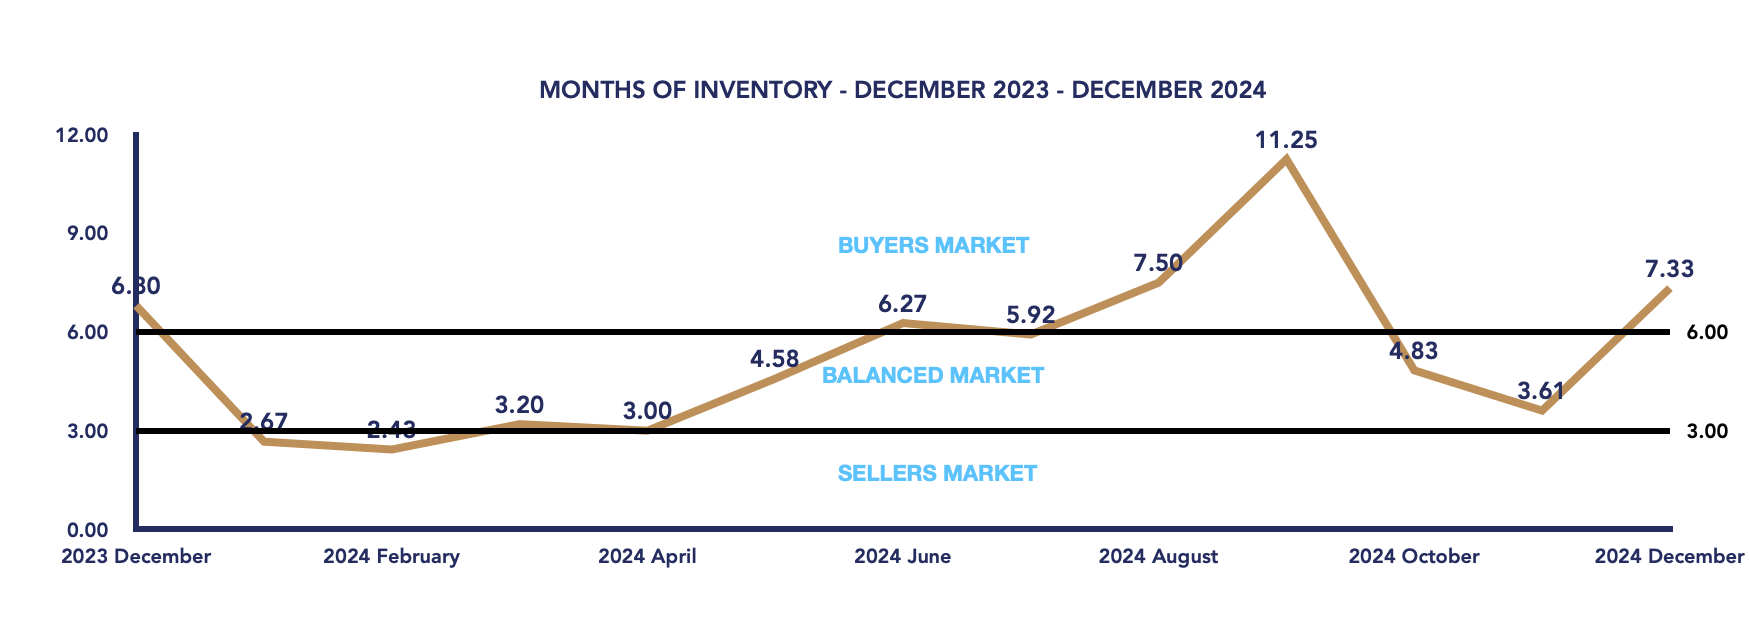
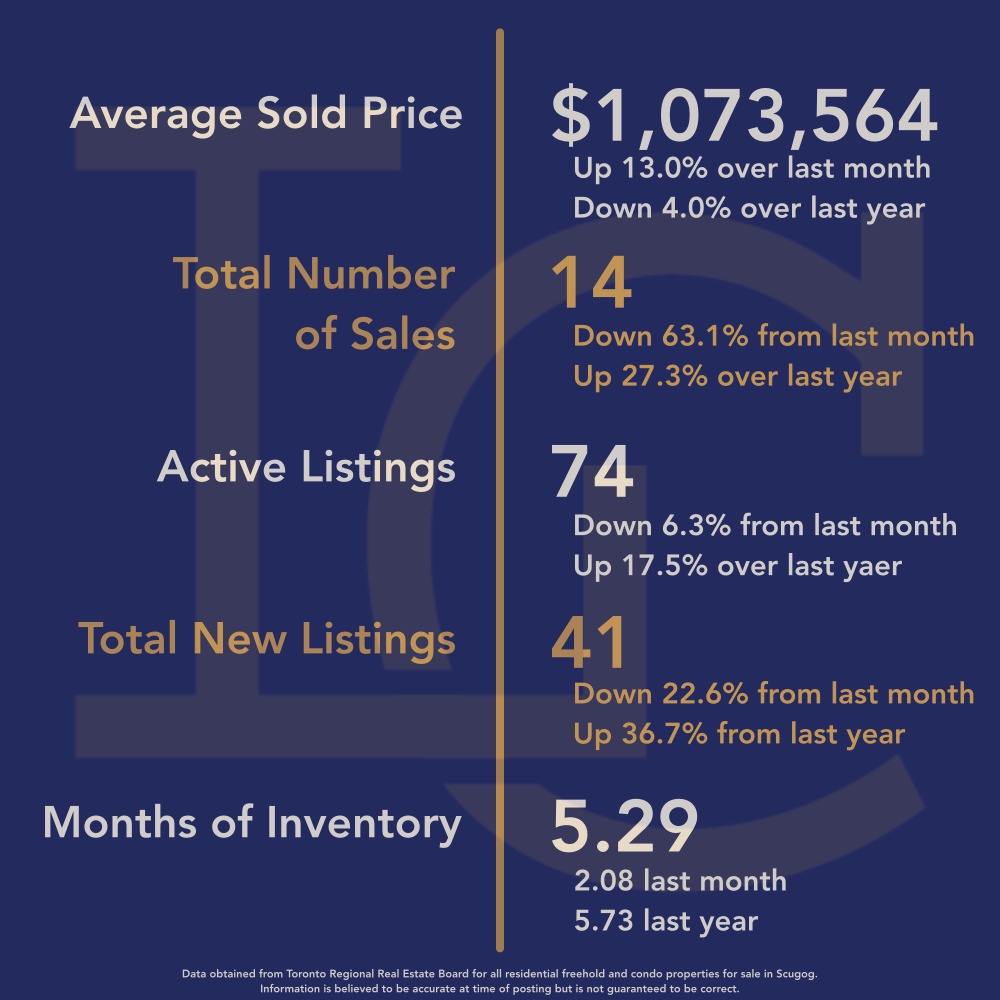
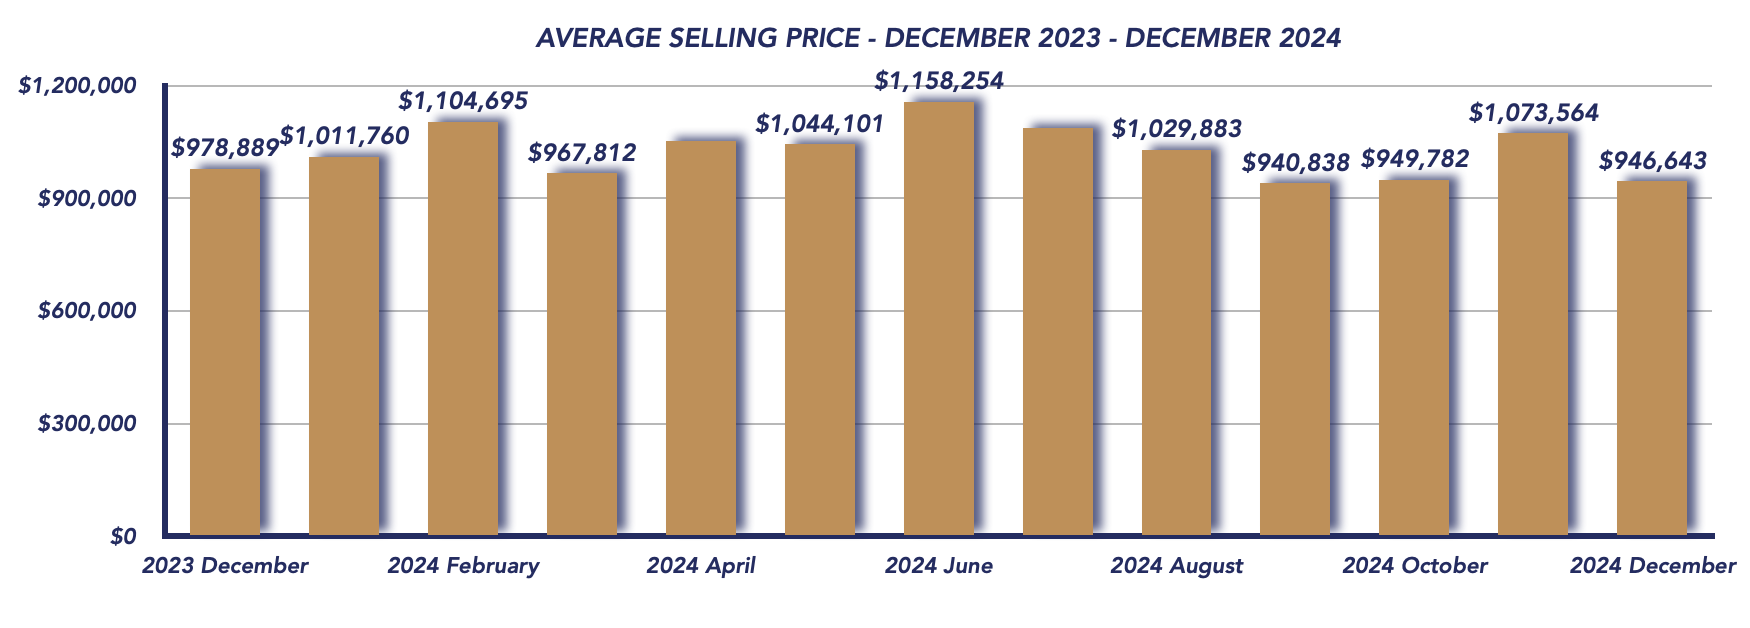
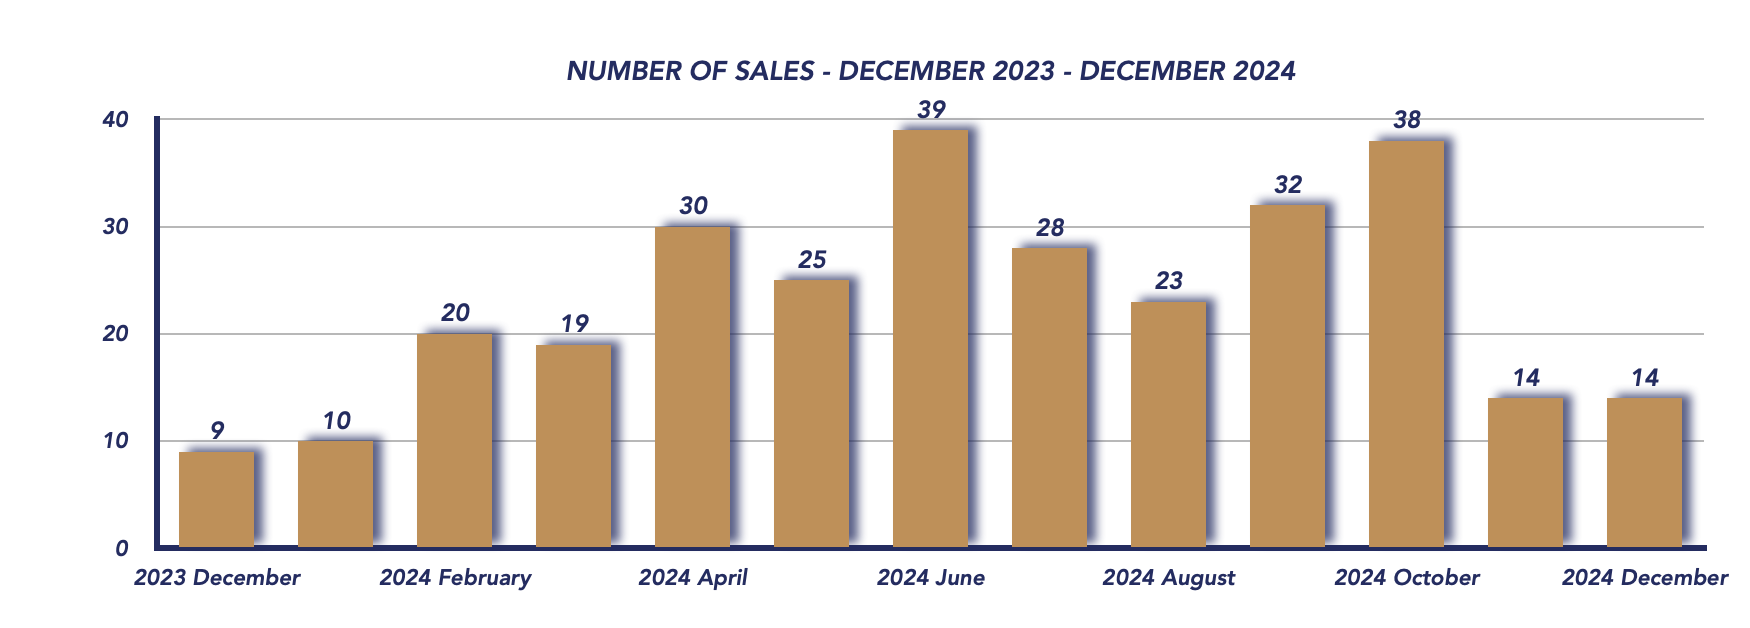
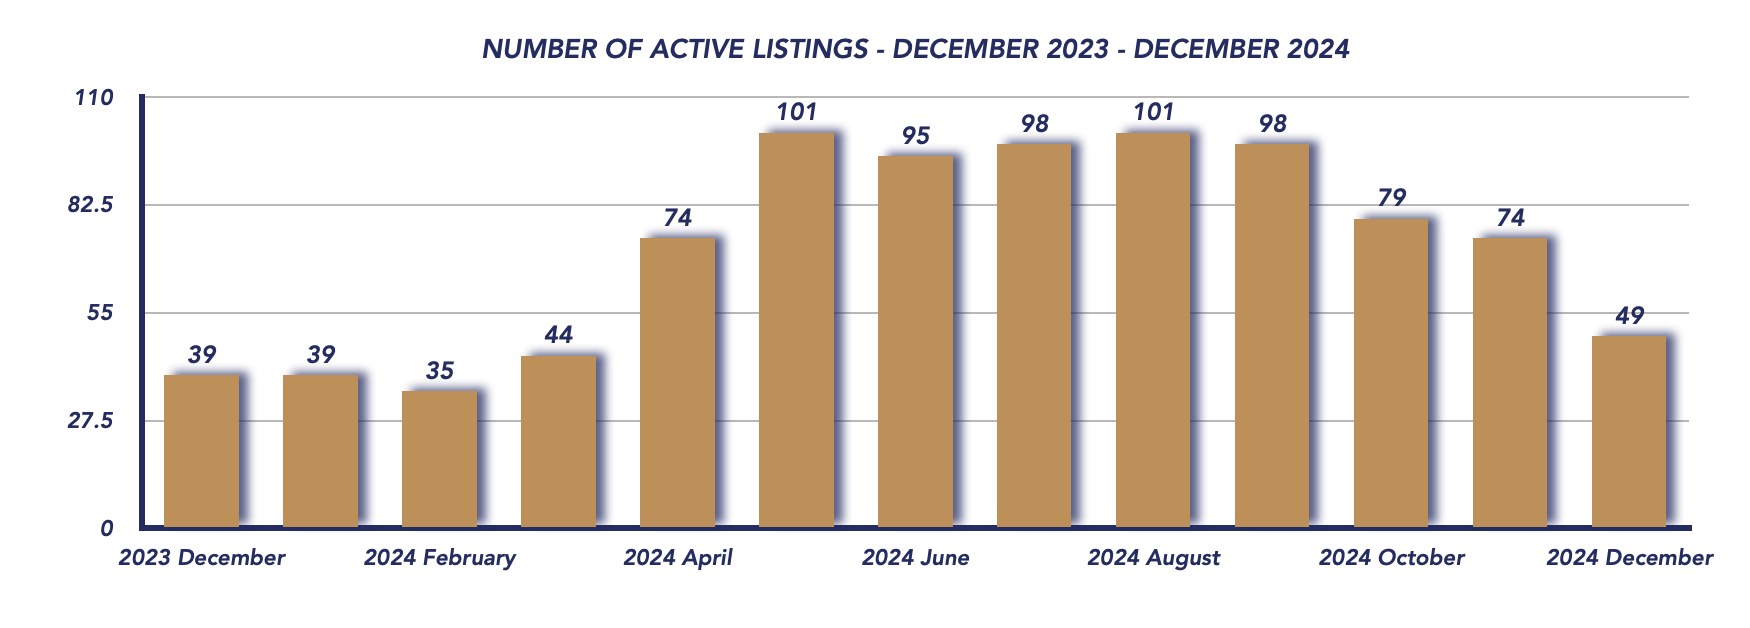
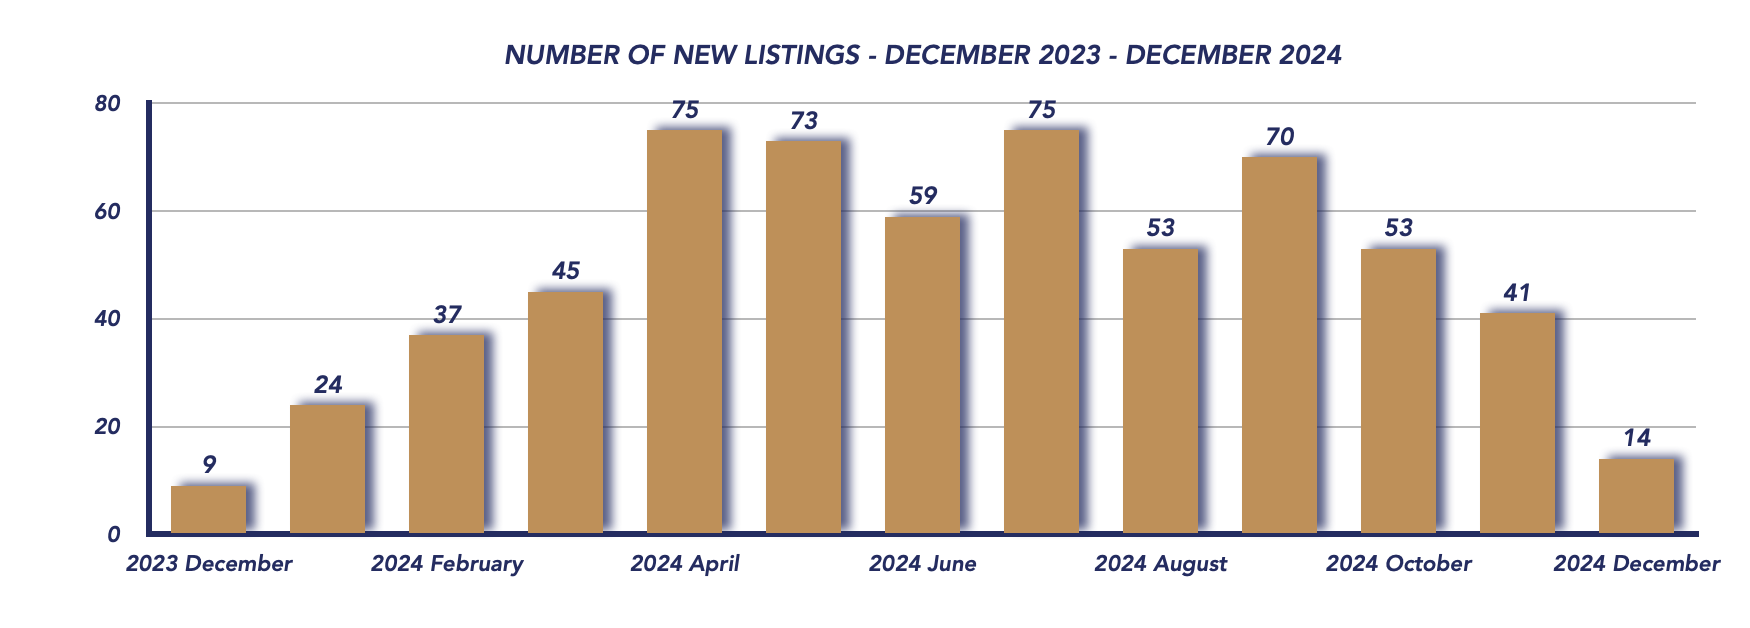
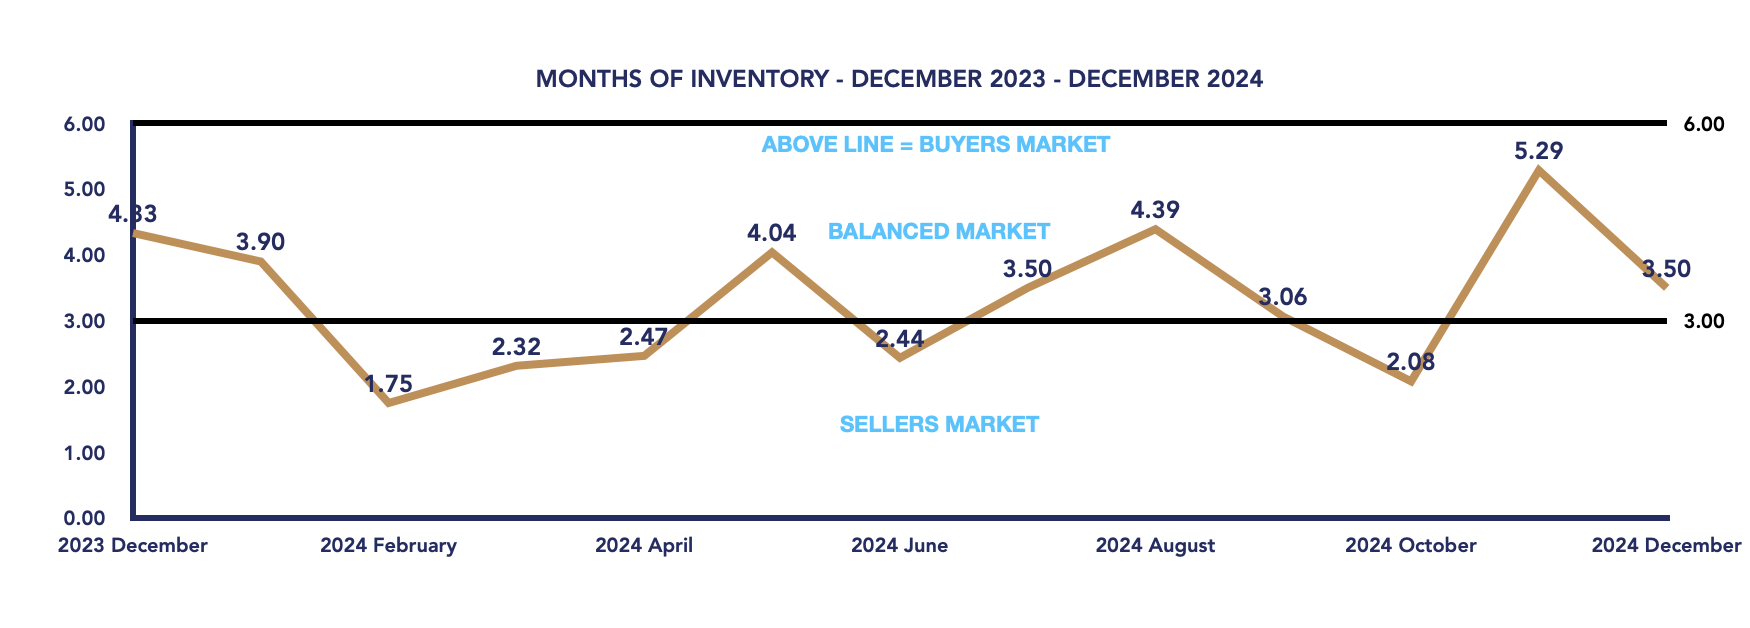
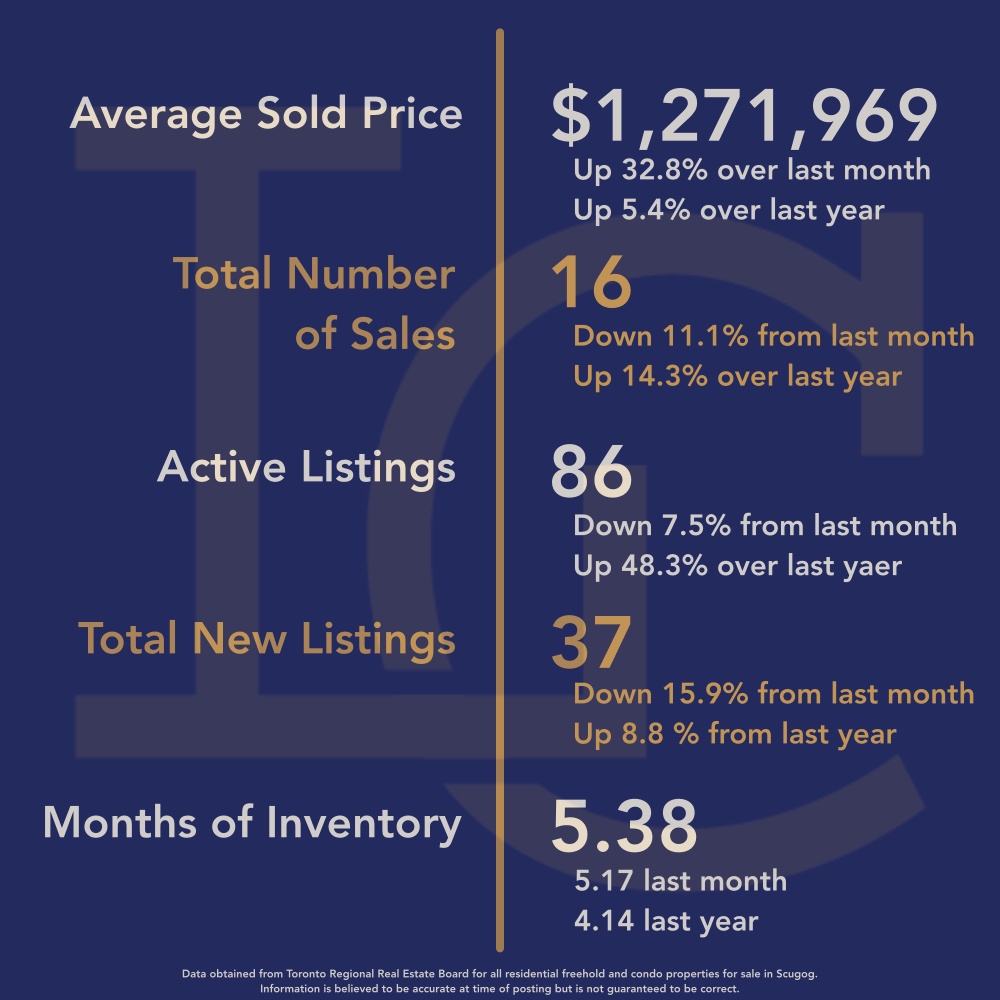
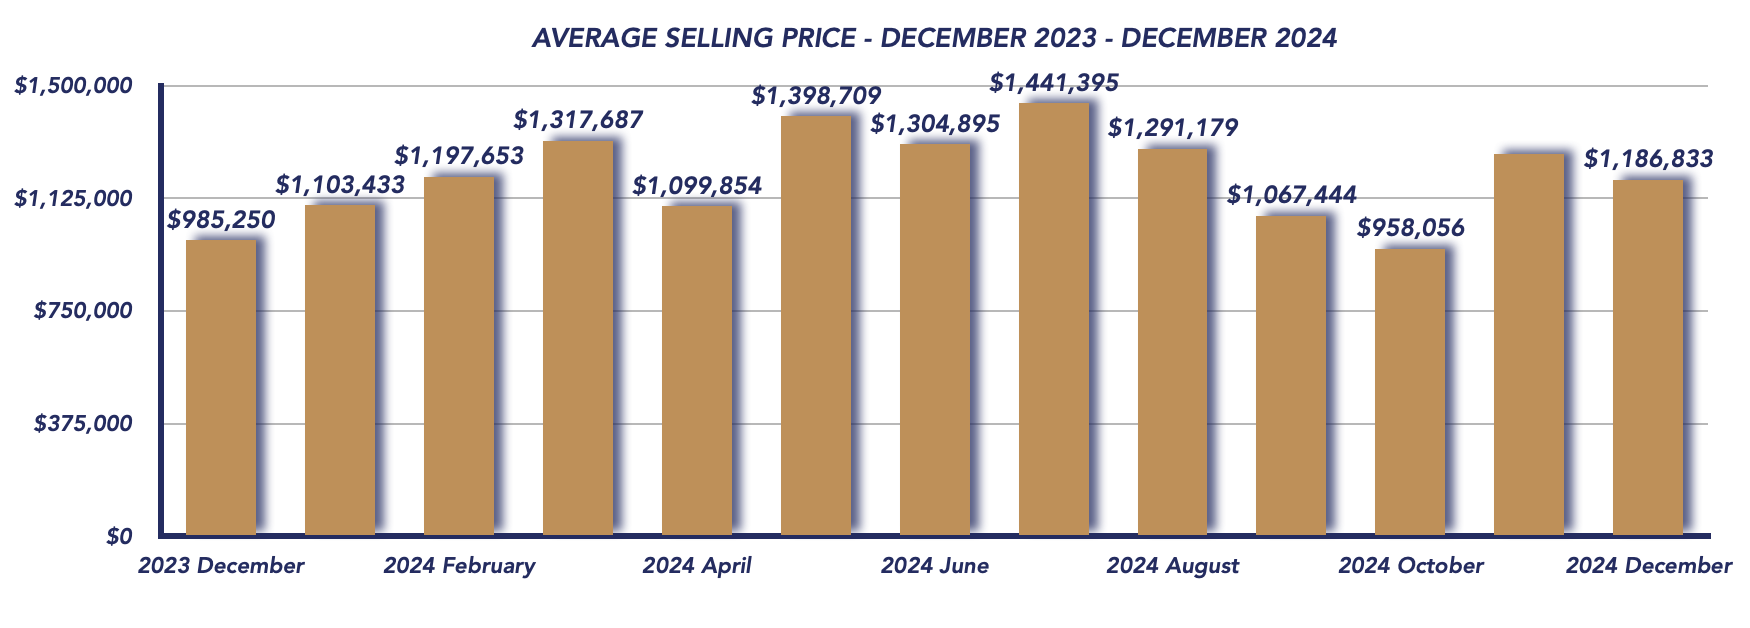
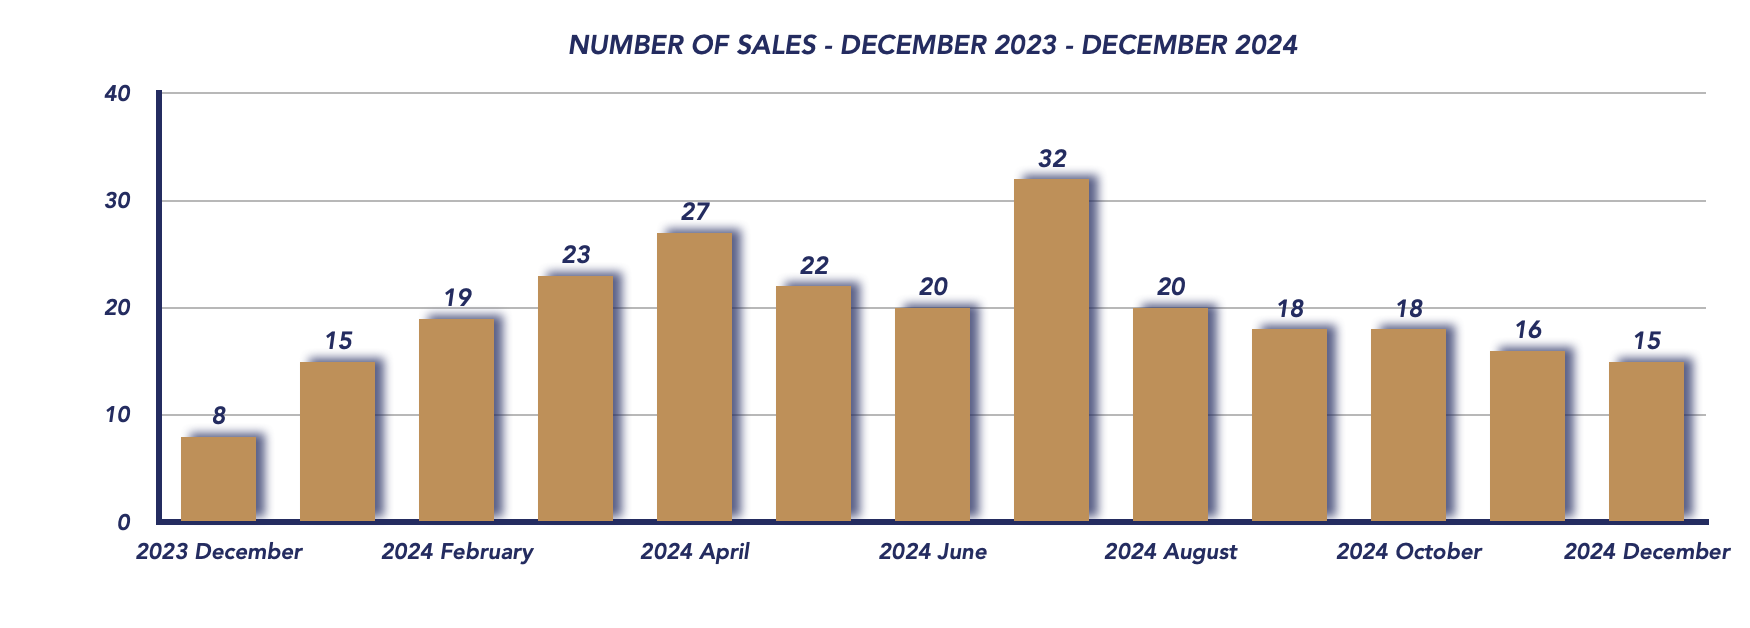
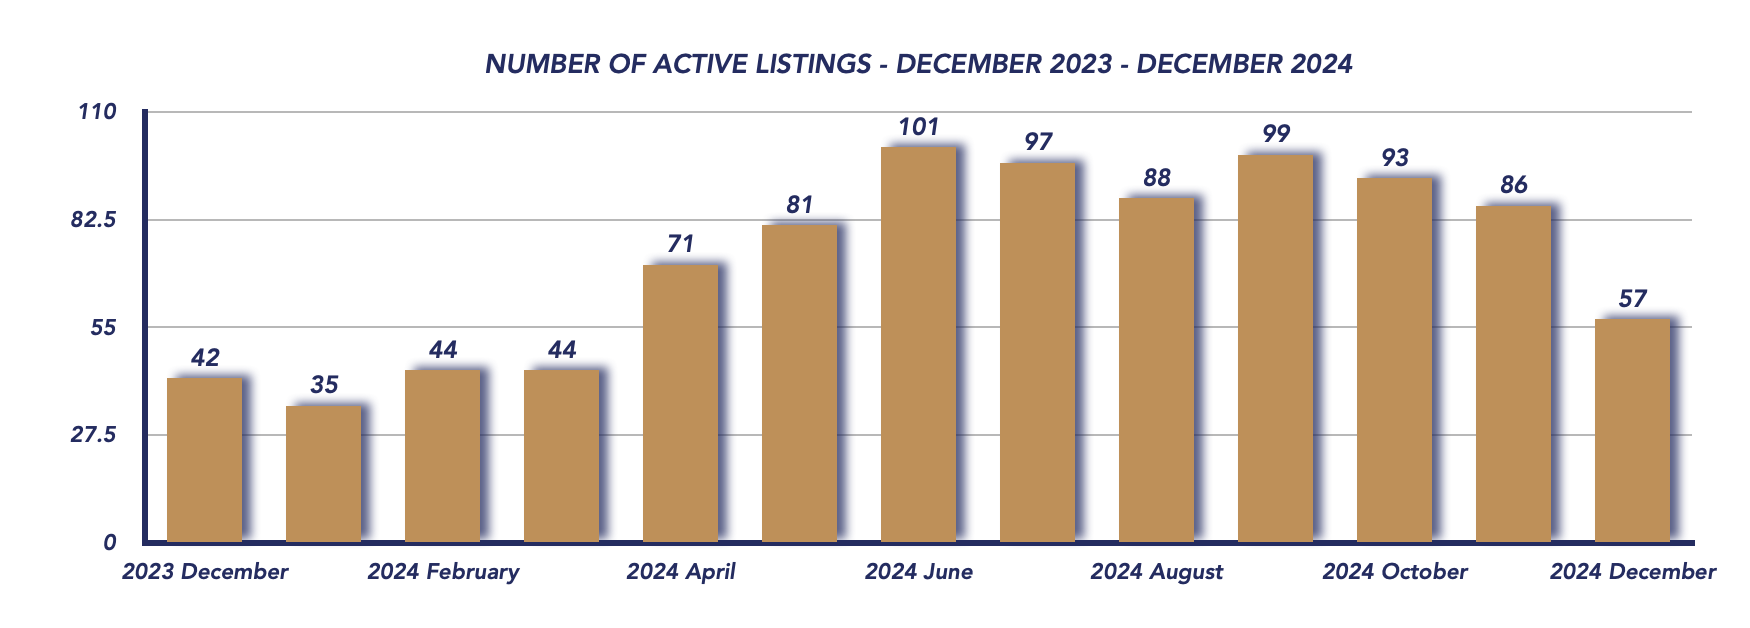
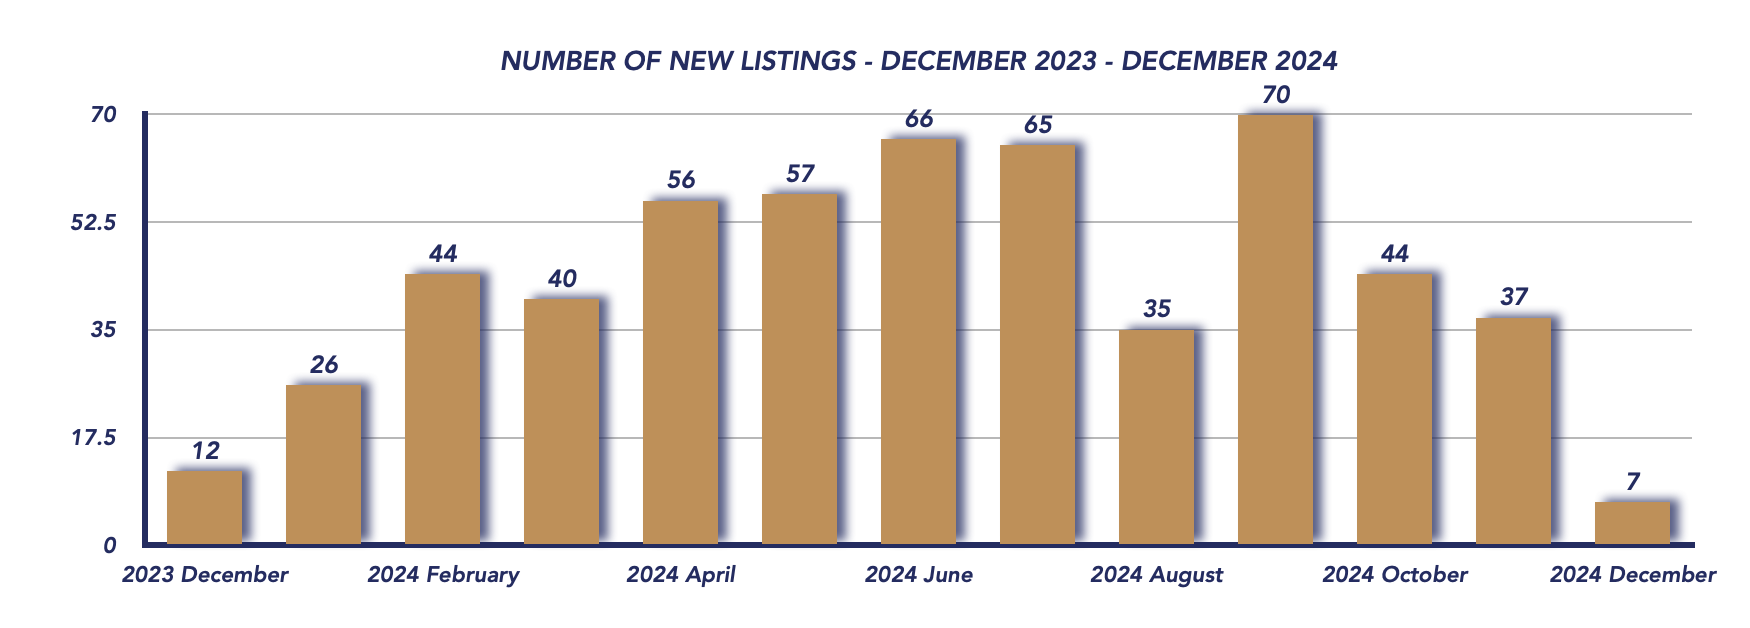
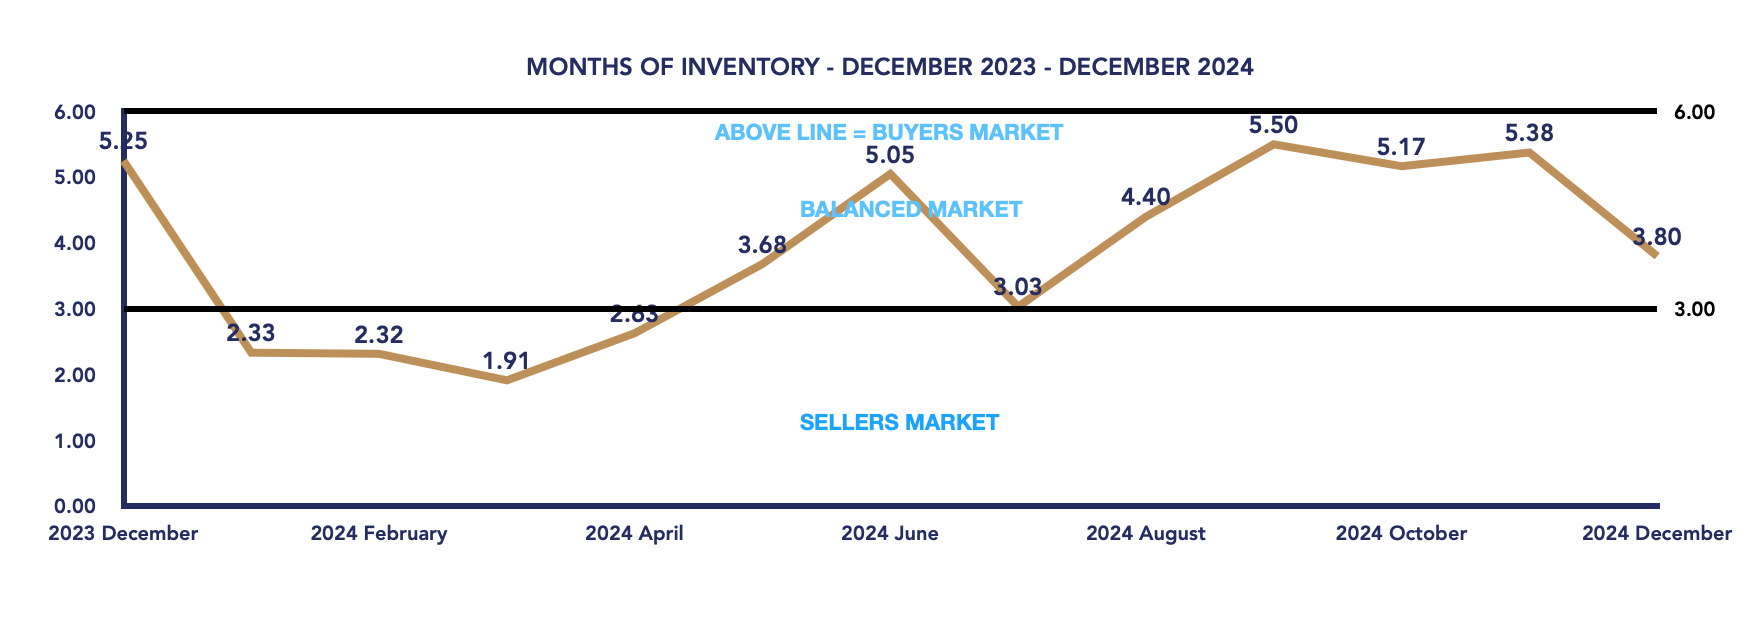
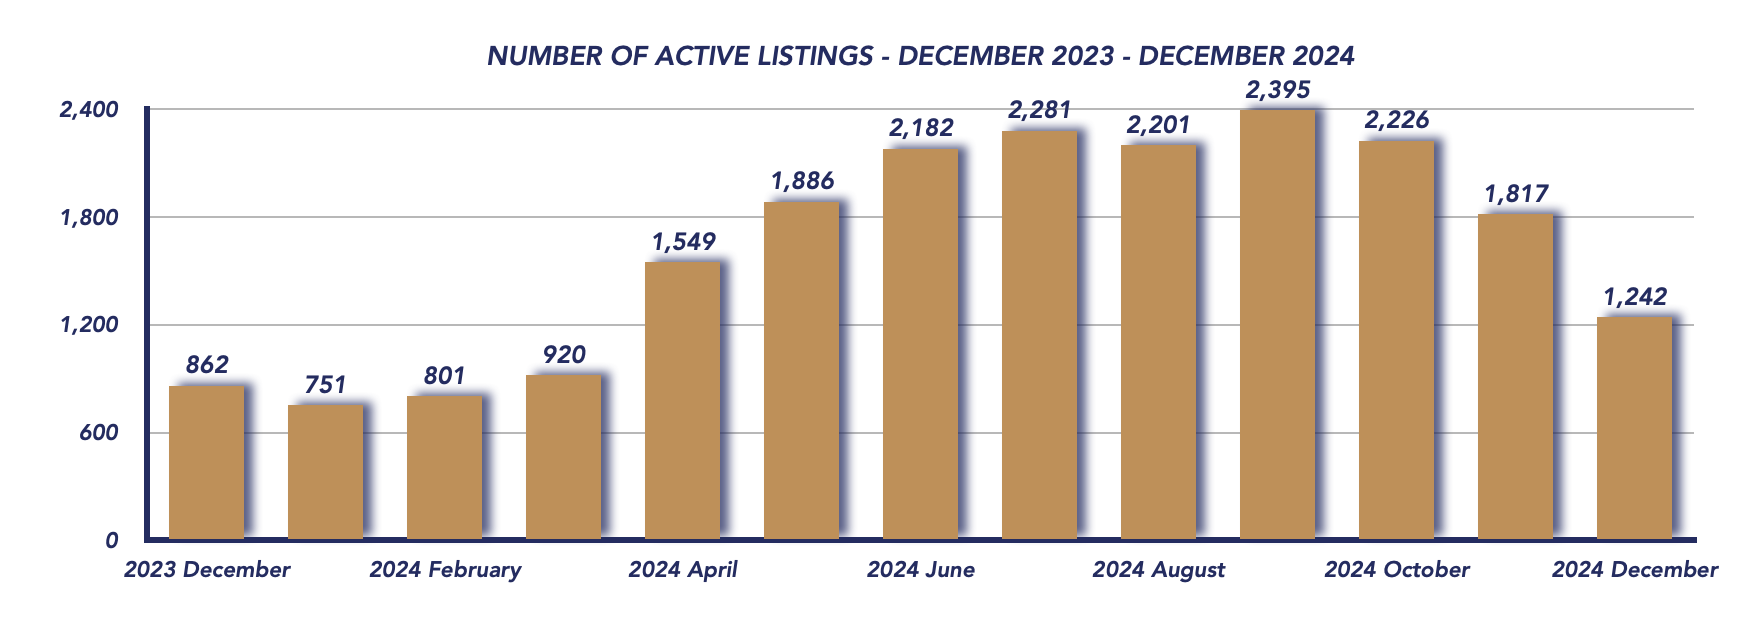
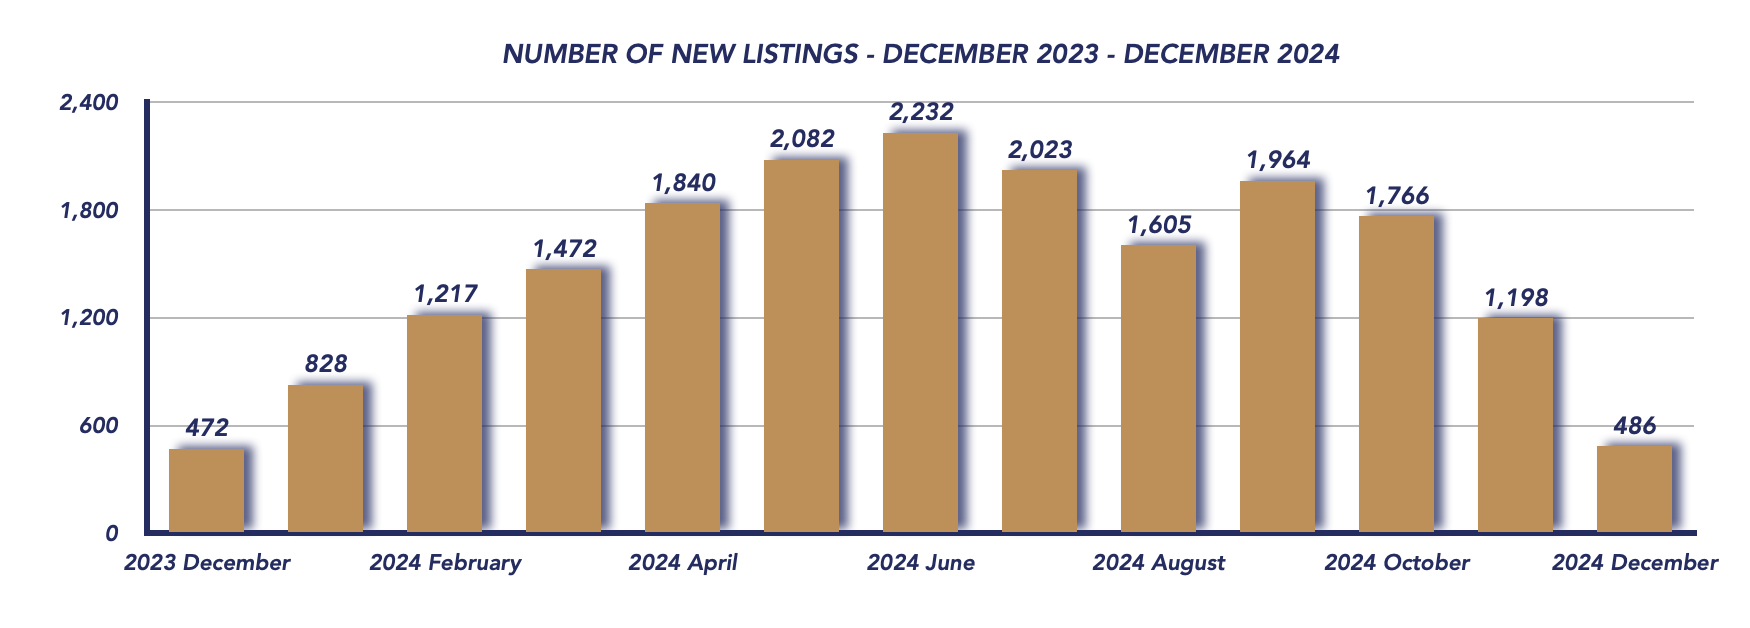
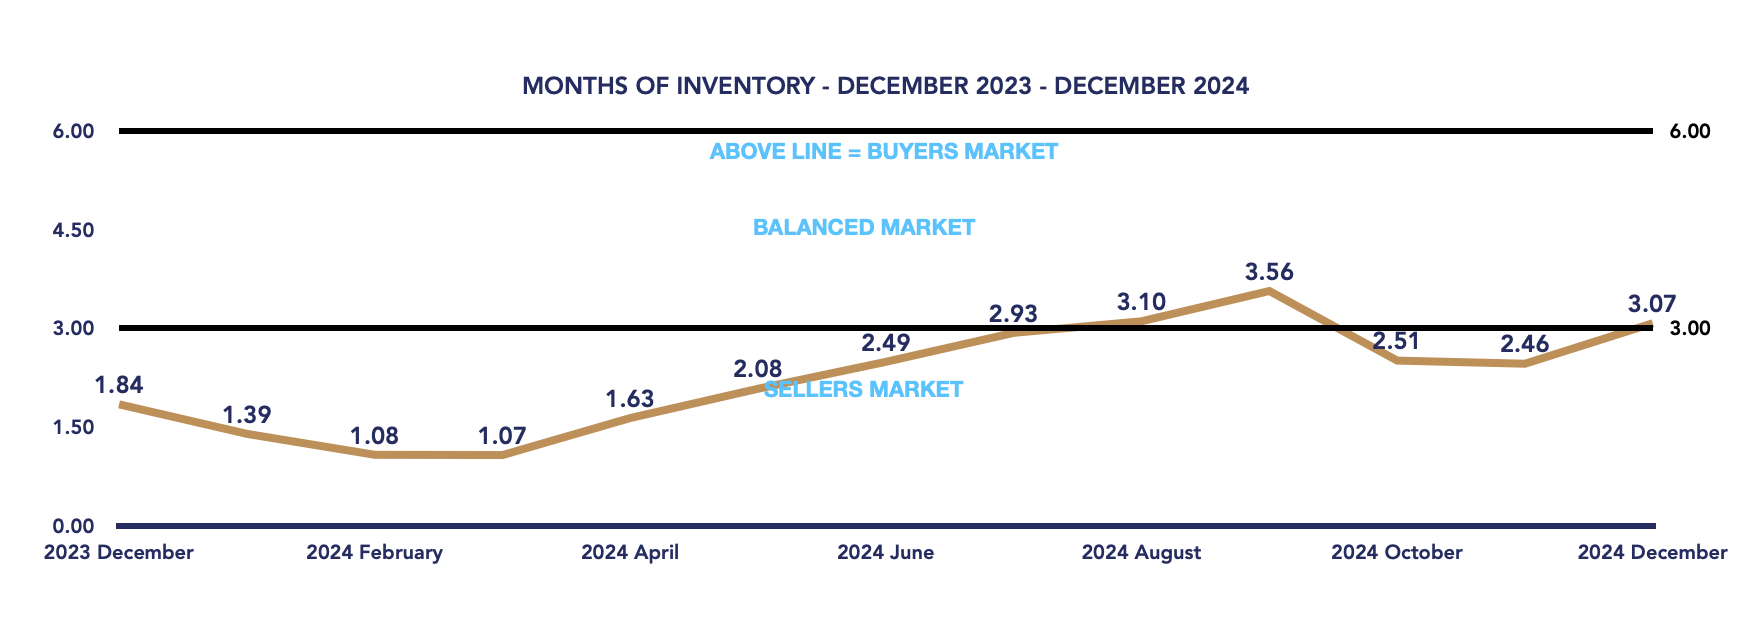
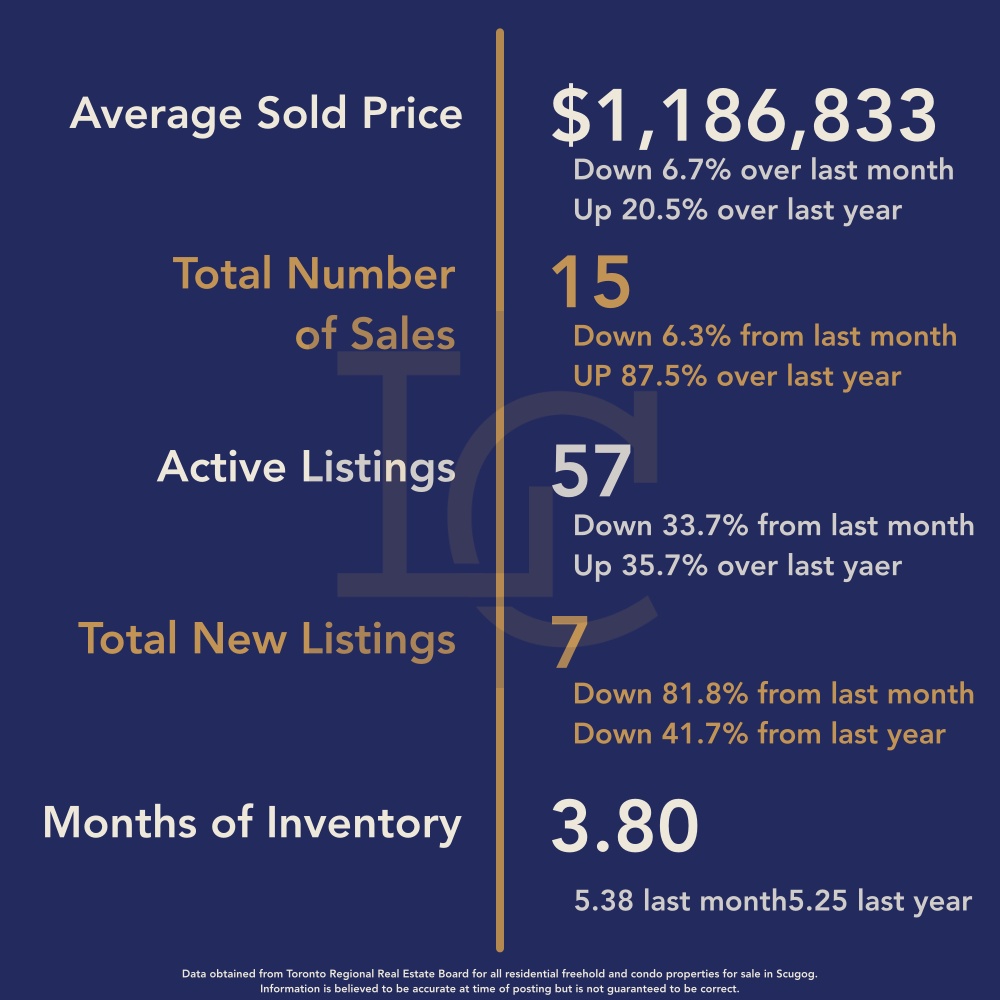
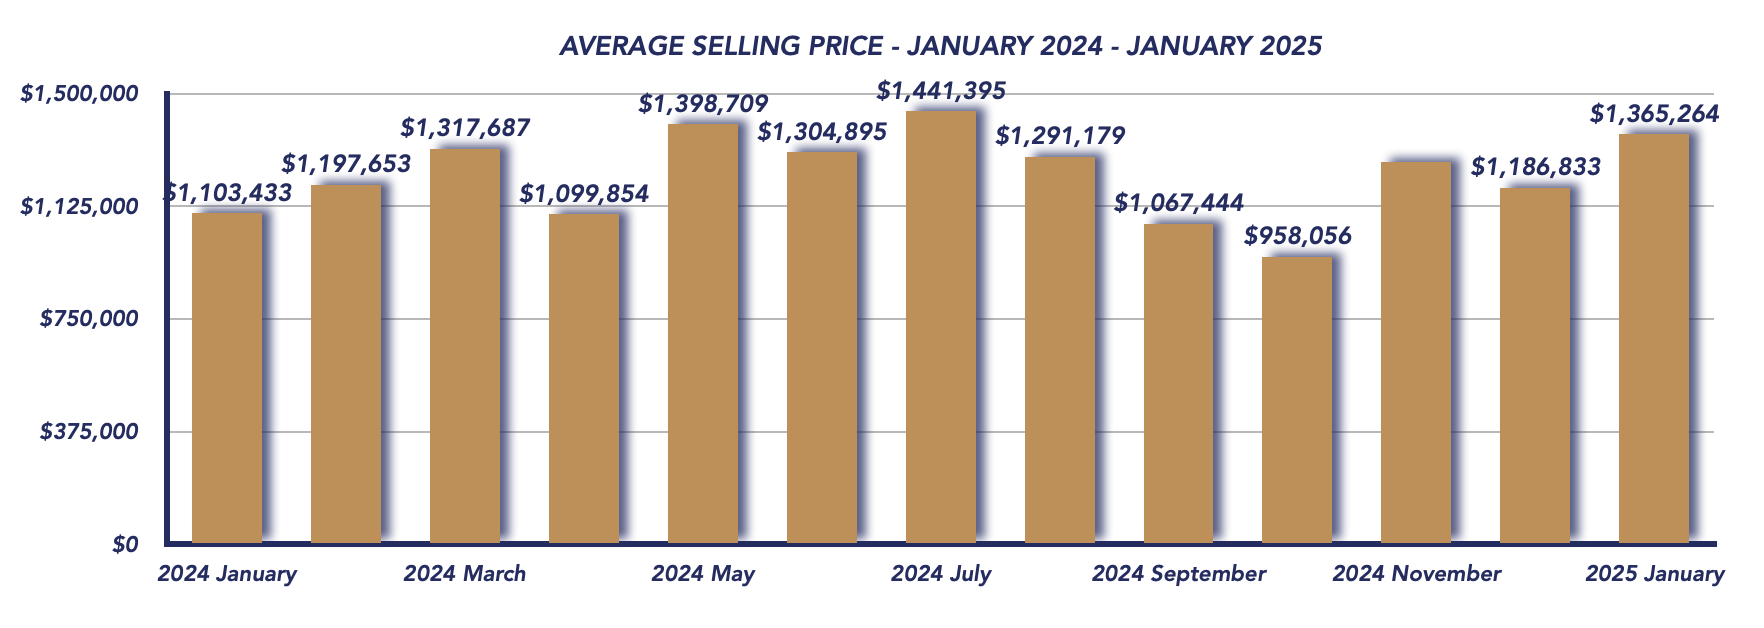
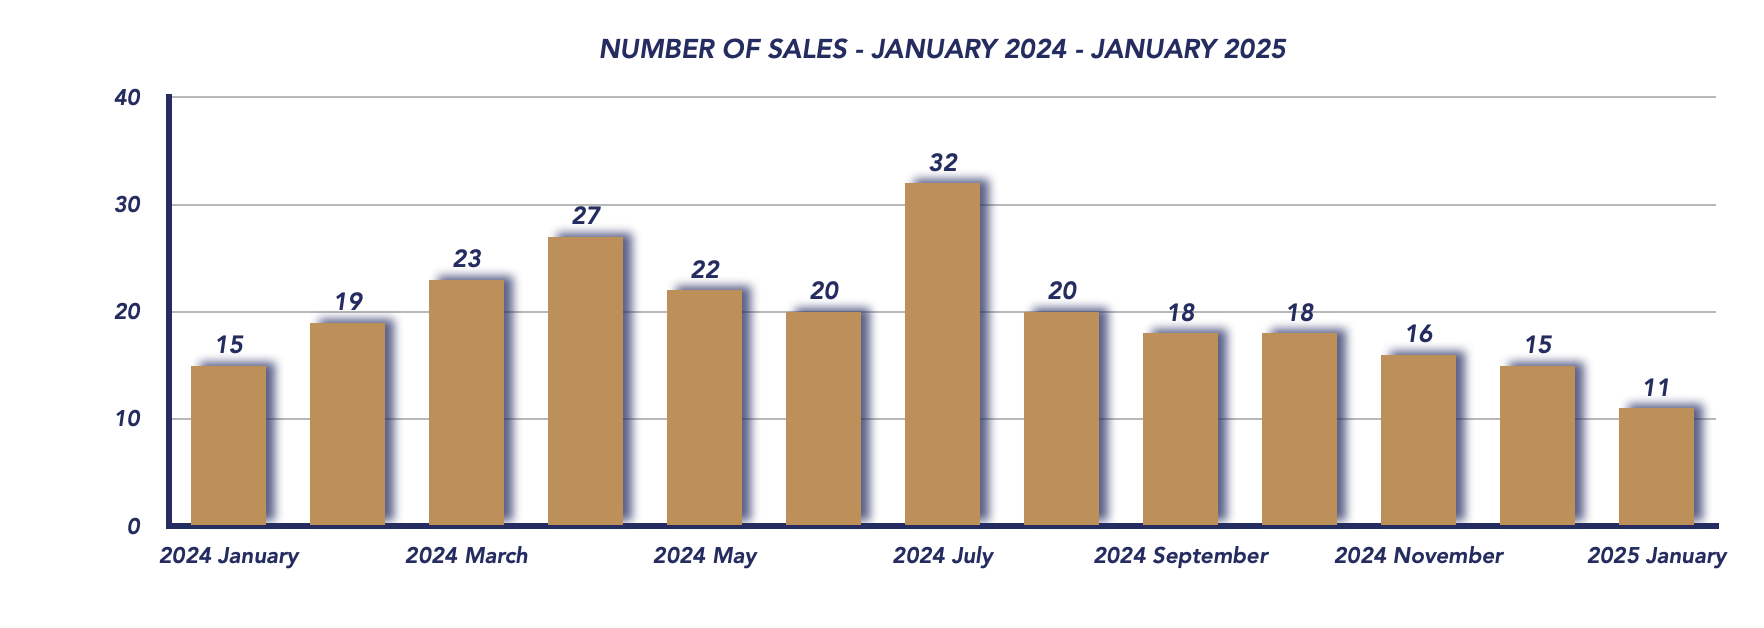
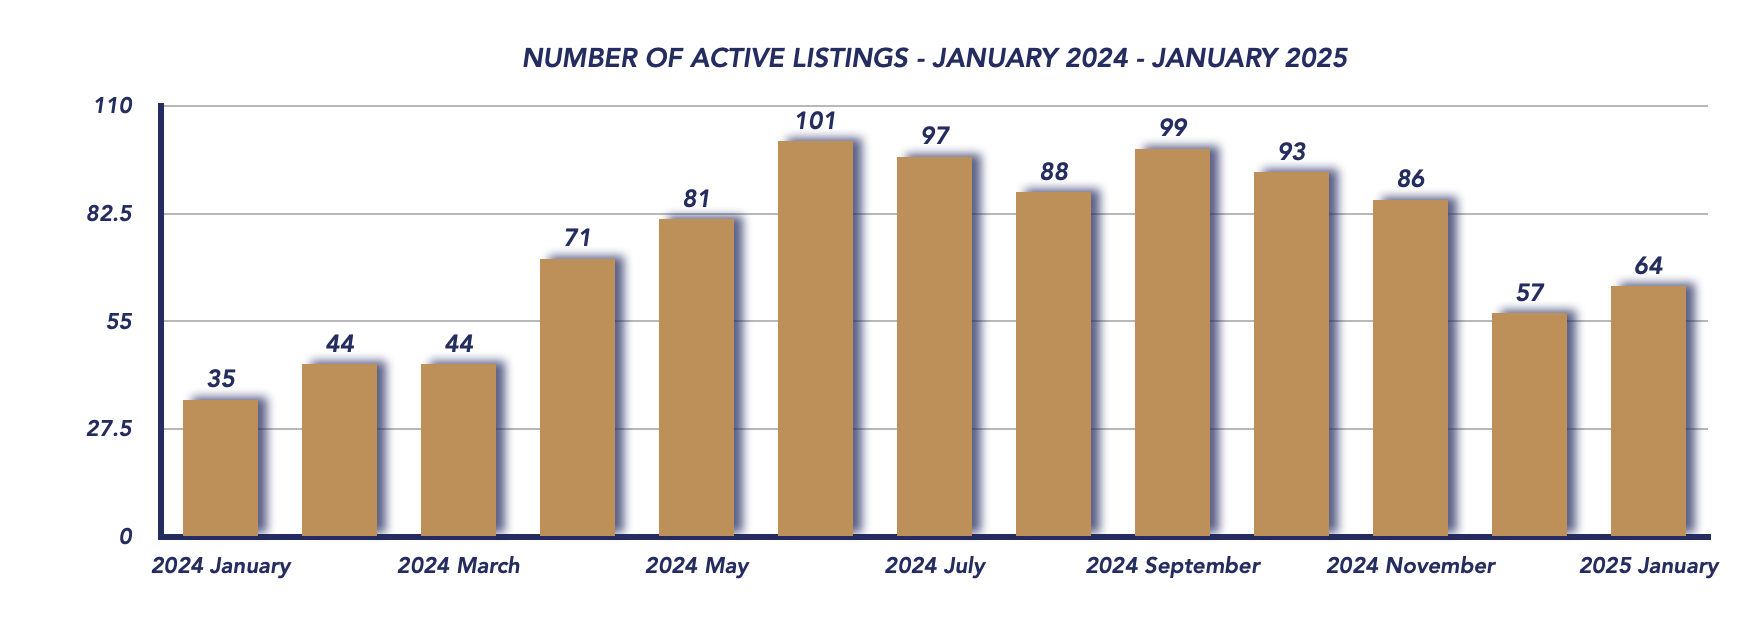
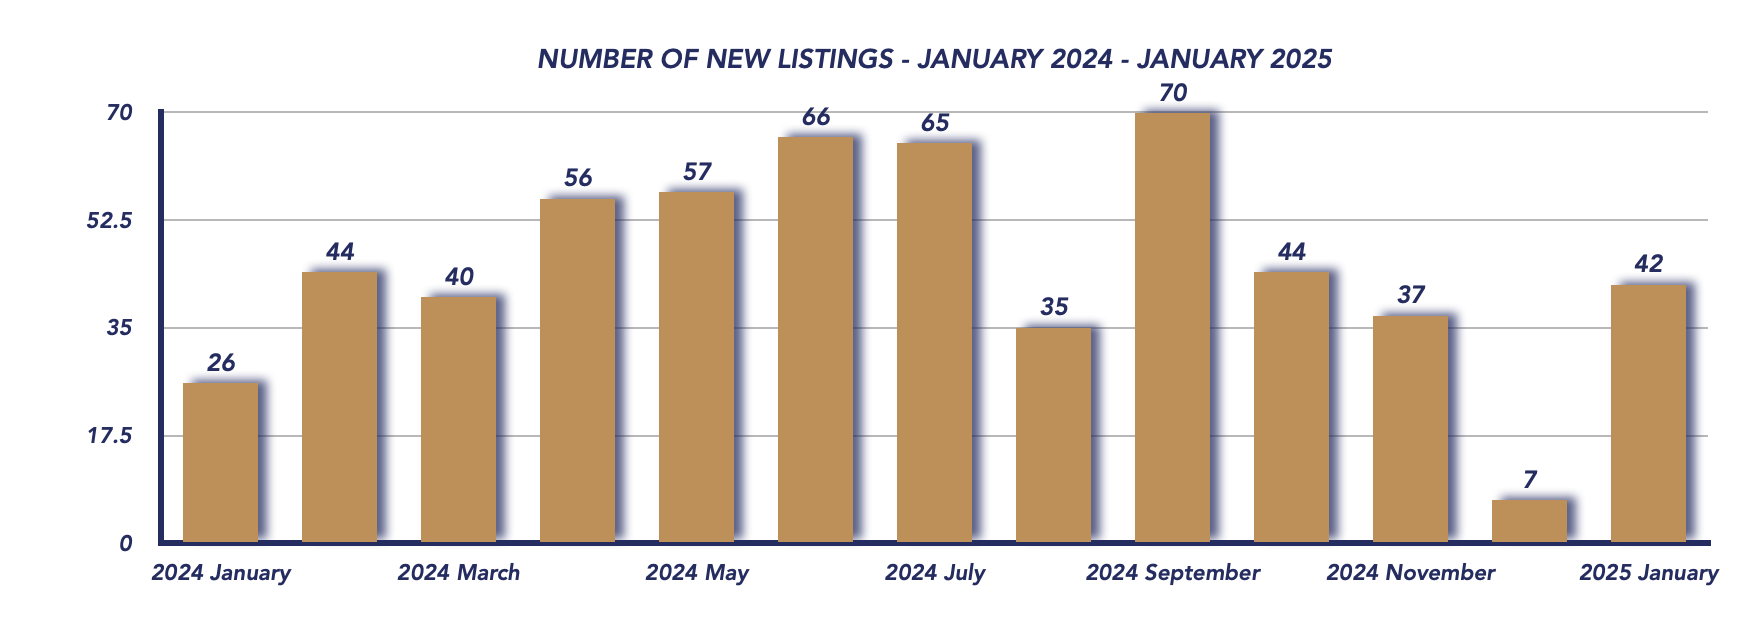
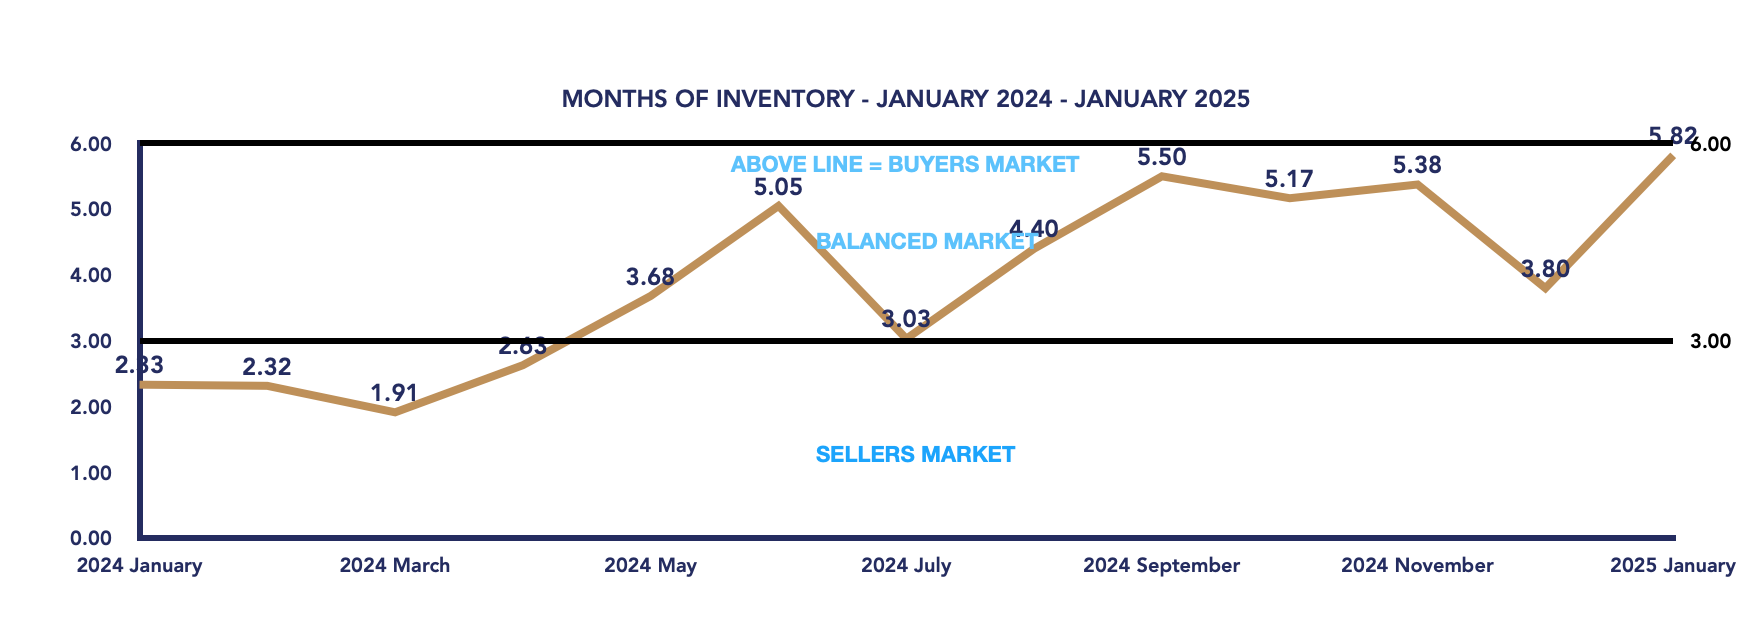
The Uxbridge Township real estate market saw a notable price surge in January 2025, with the average sales price reaching $1,365,264—up 15% from December and an impressive 23.7% year-over-year. Properties sold within a broad range of $760,000 to $2,950,000, with three homes selling for over $1 million, three surpassing $1.5 million, and one exceeding $2.5 million. Despite the price increase, the sale-to-list price ratio dipped to 94%, down from 96% last month. Sales activity slowed slightly, with 11 transactions compared to 15 in both December and January of last year. However, new listings surged to 42, a significant jump from just seven last month and 26 last year. Properties spent an average of 56 days on the market. Months of inventory rose to 5.82 from 3.80, bringing the market to the verge of shifting toward buyer-friendly conditions.
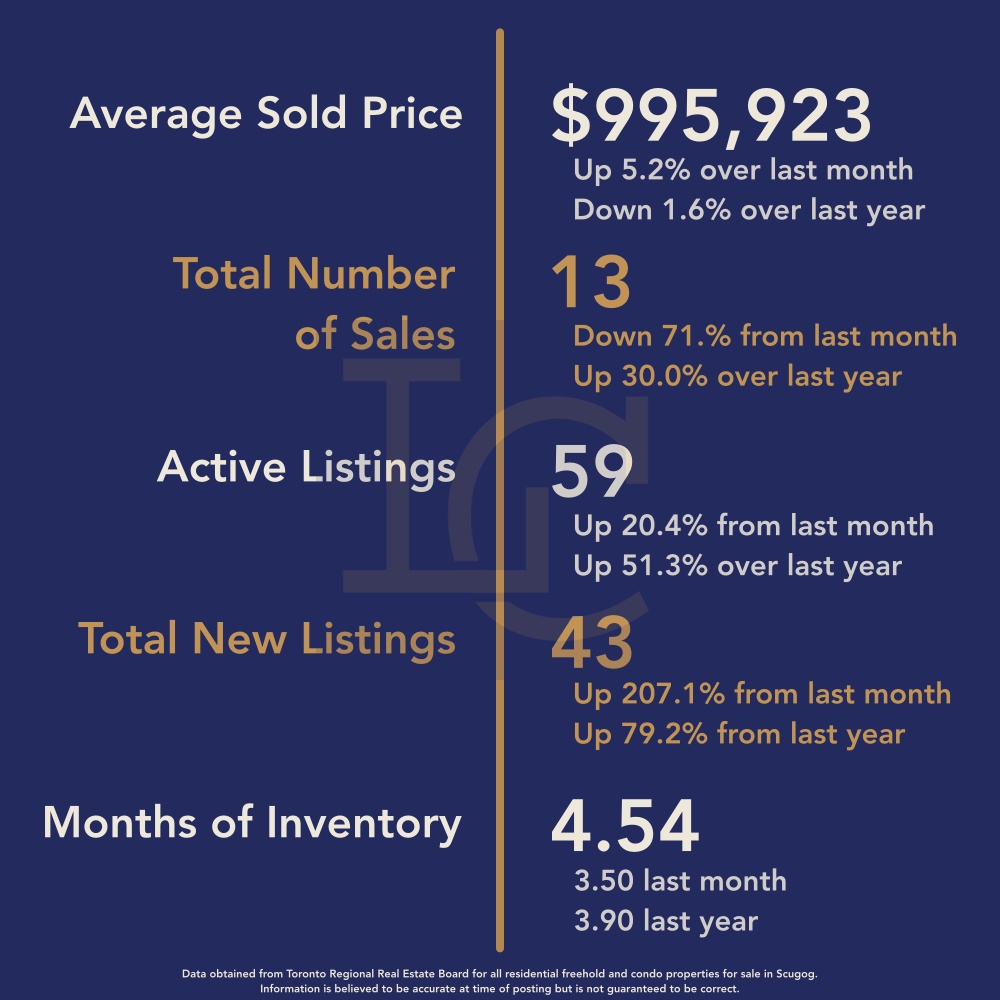
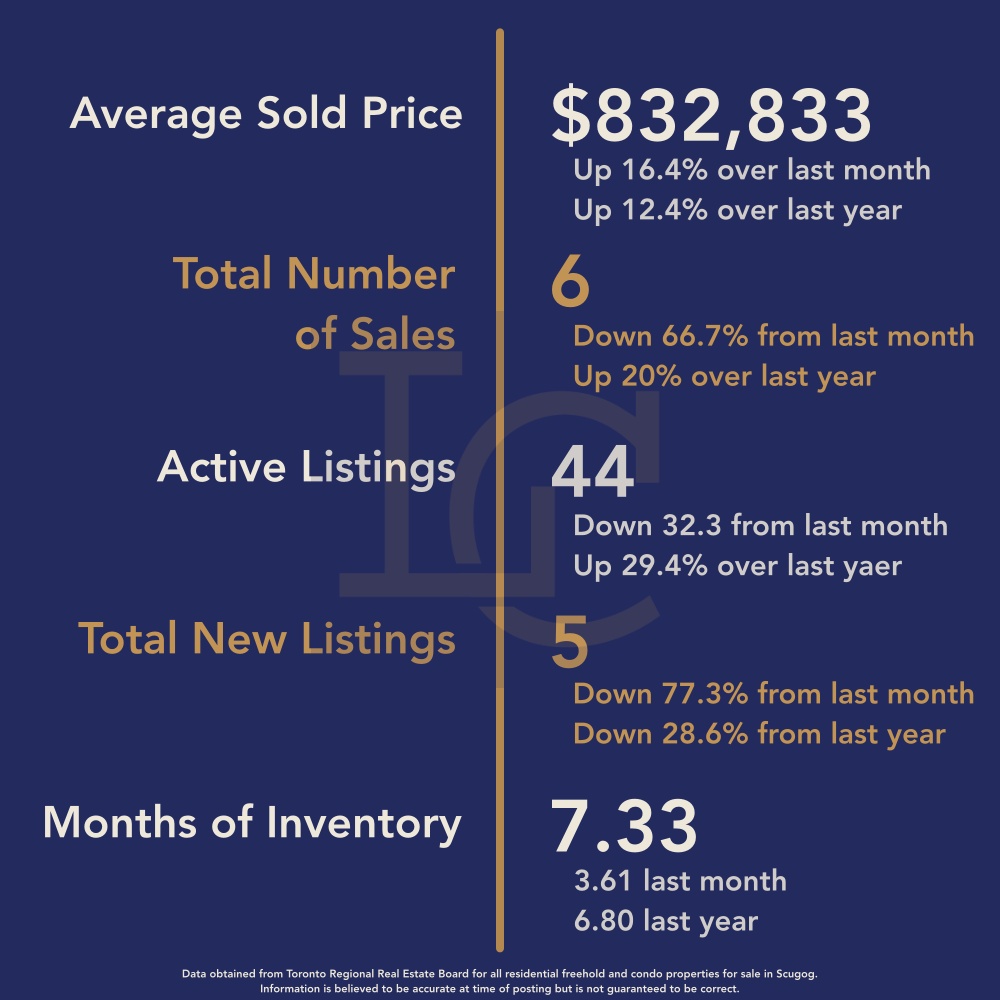
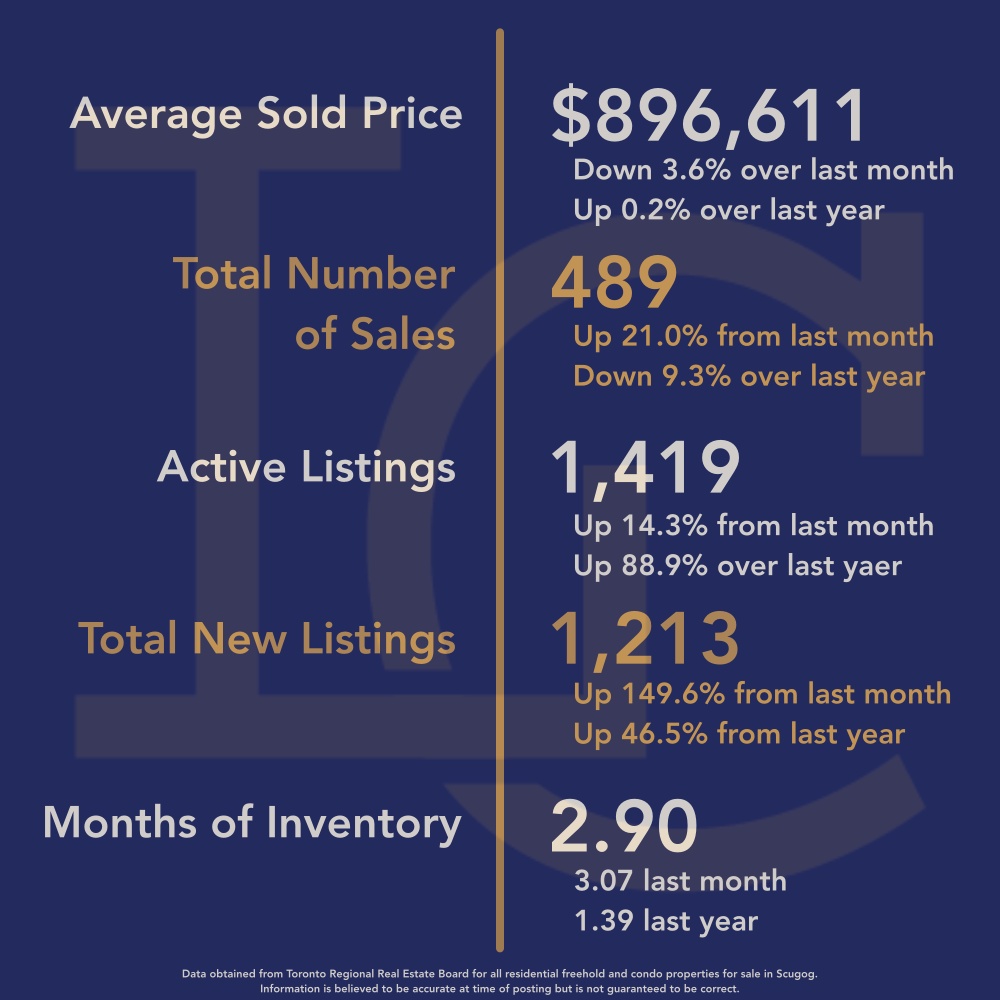
January 2025
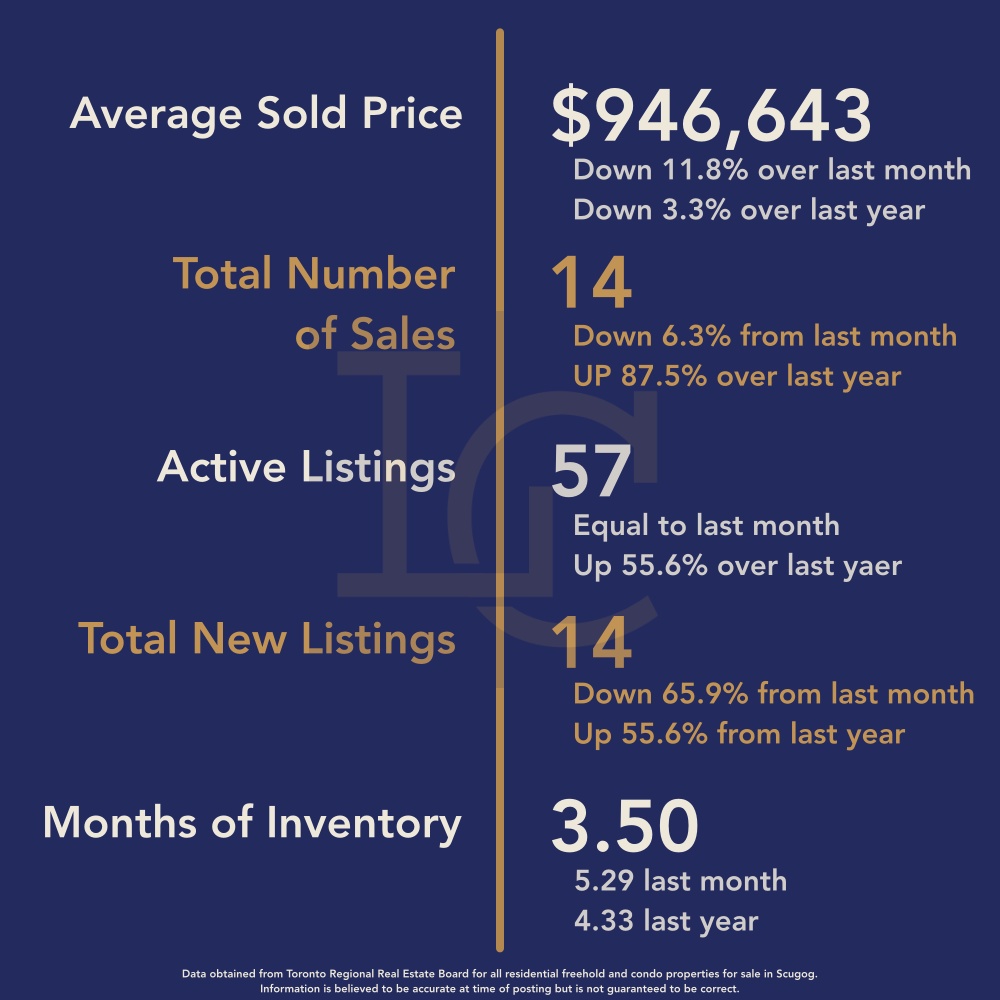
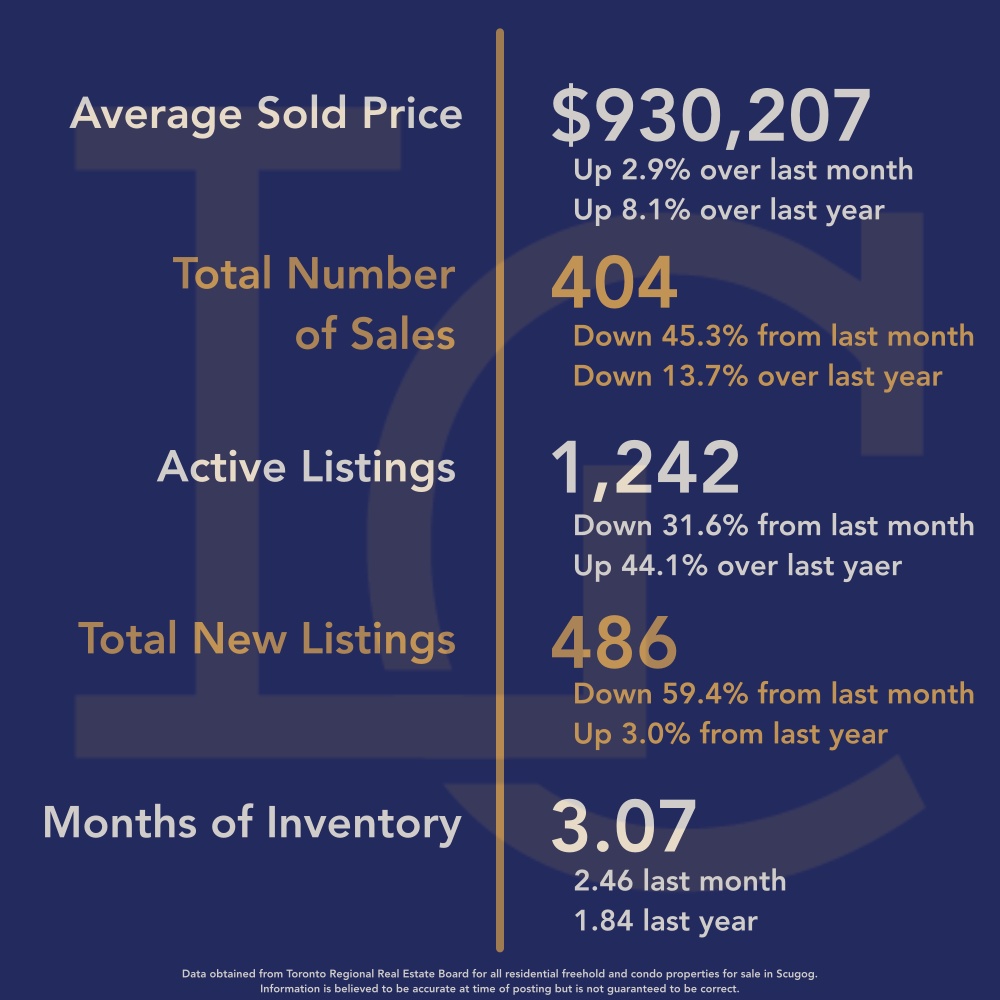
December 2024
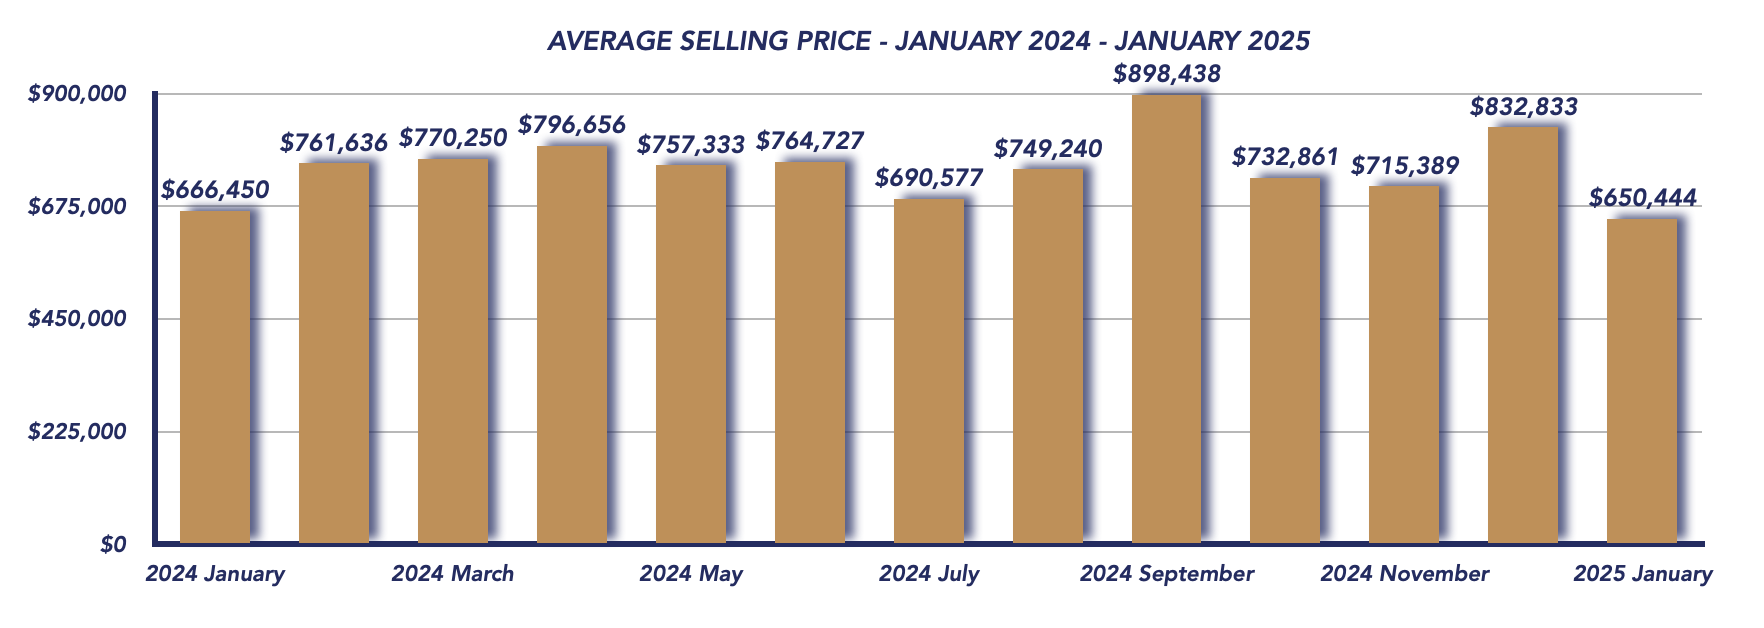
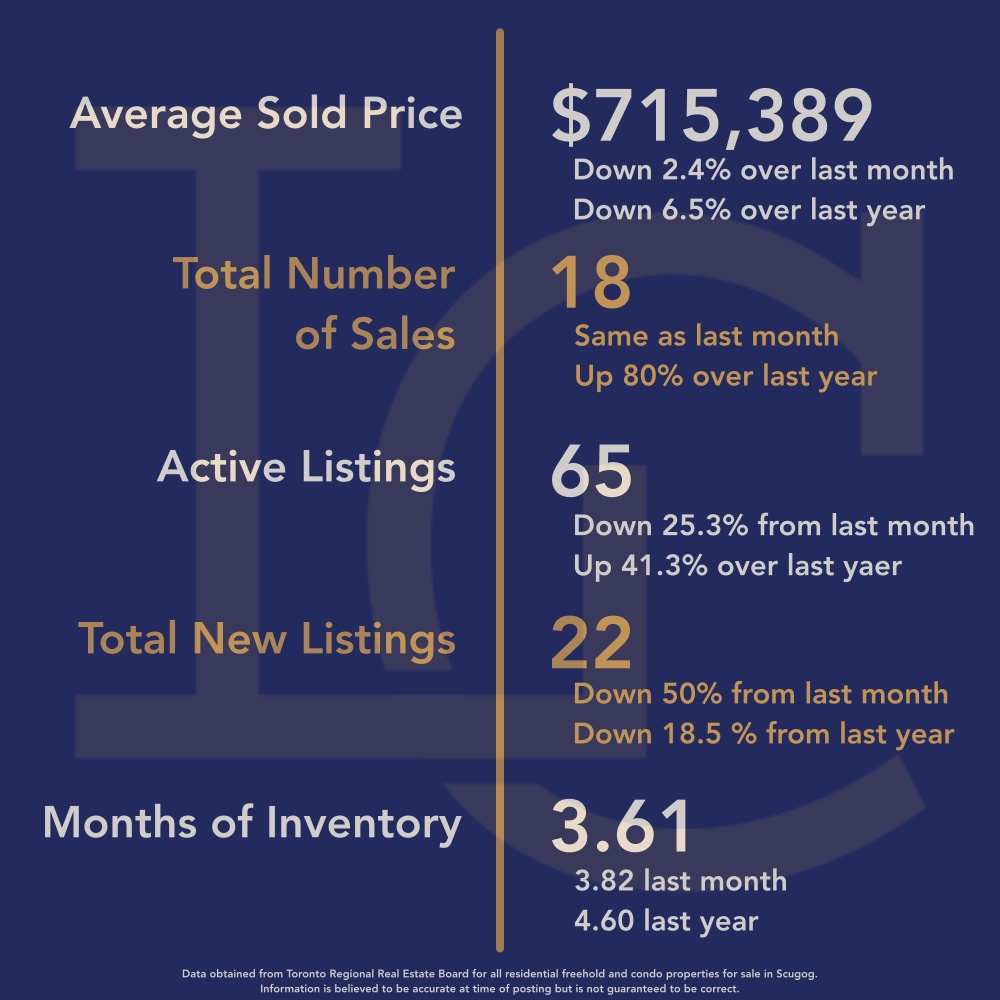
Average Sold Price
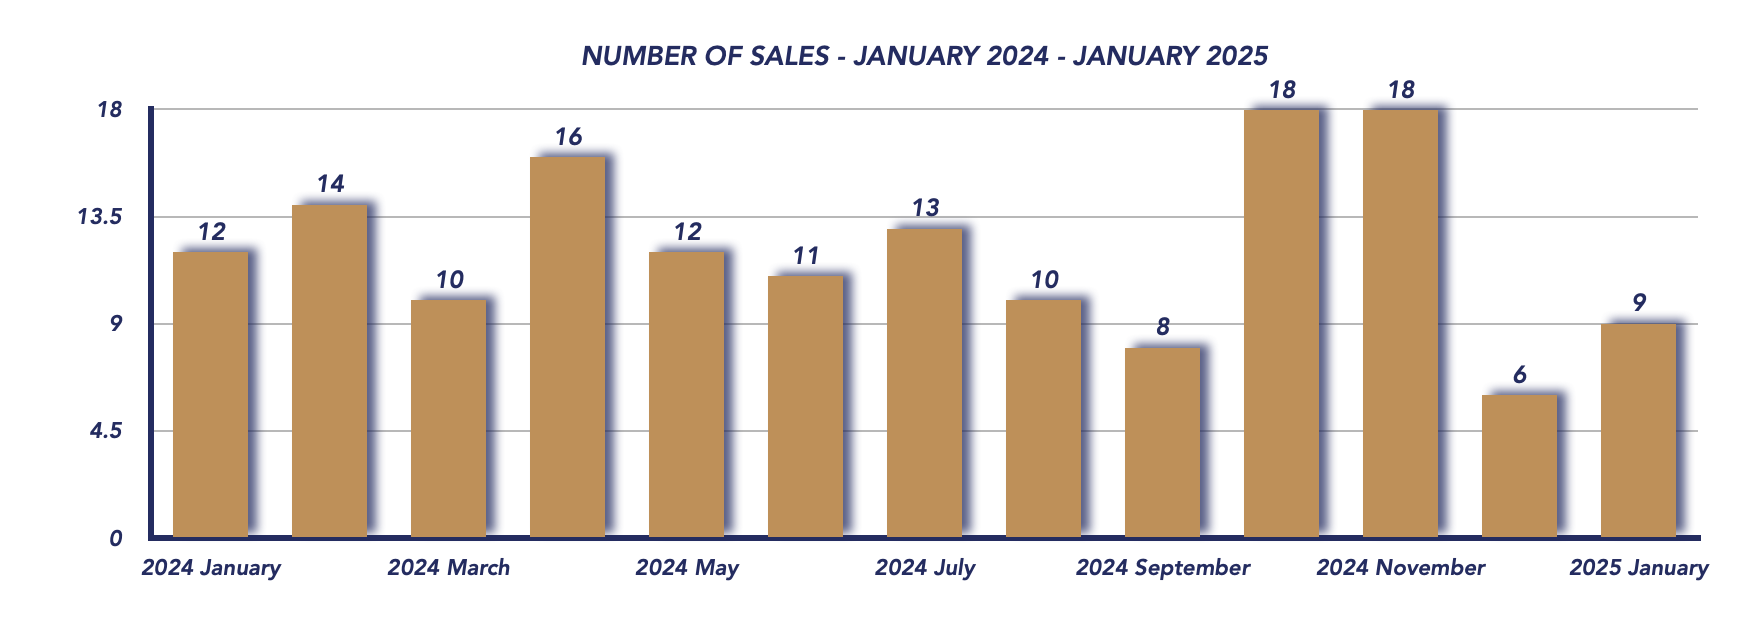
Number of Properties Sold
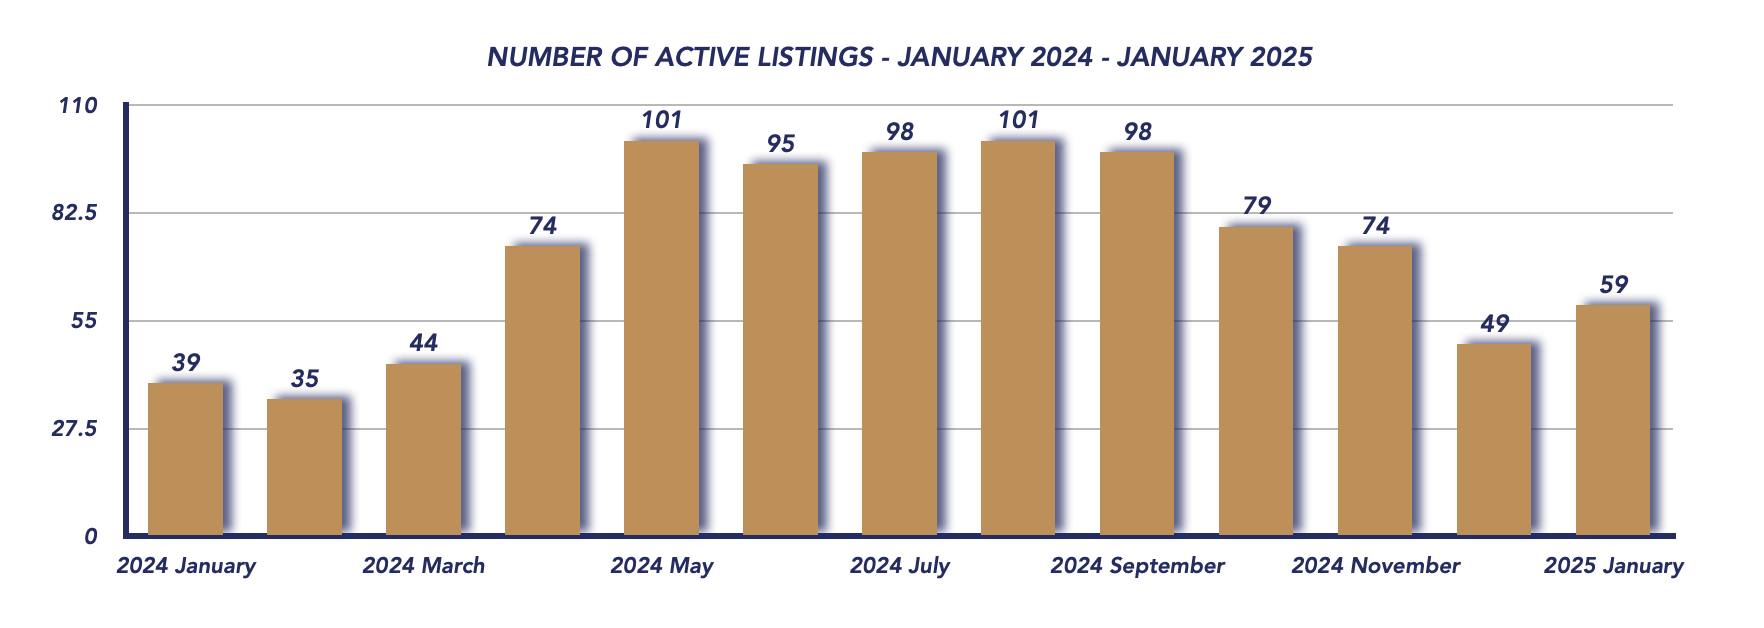
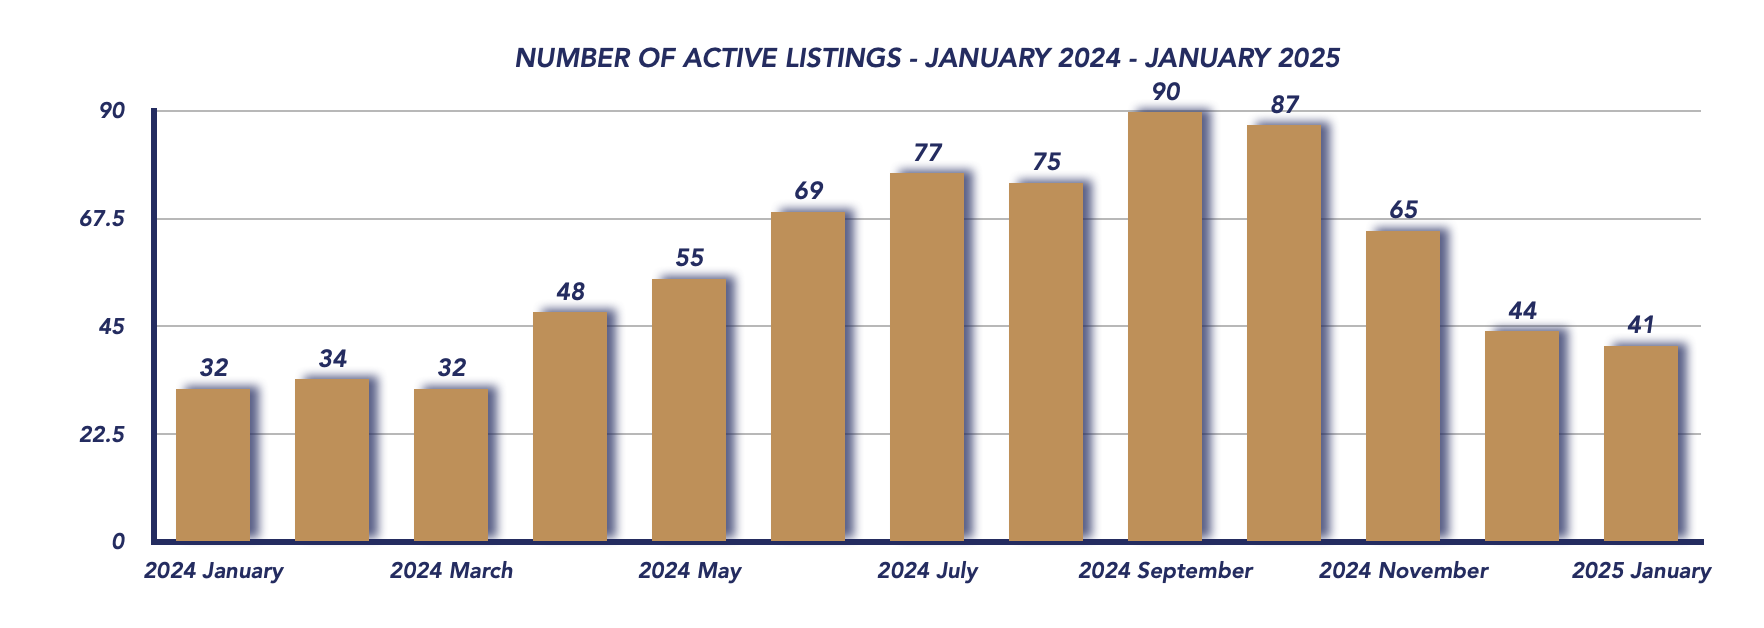
Active Listings
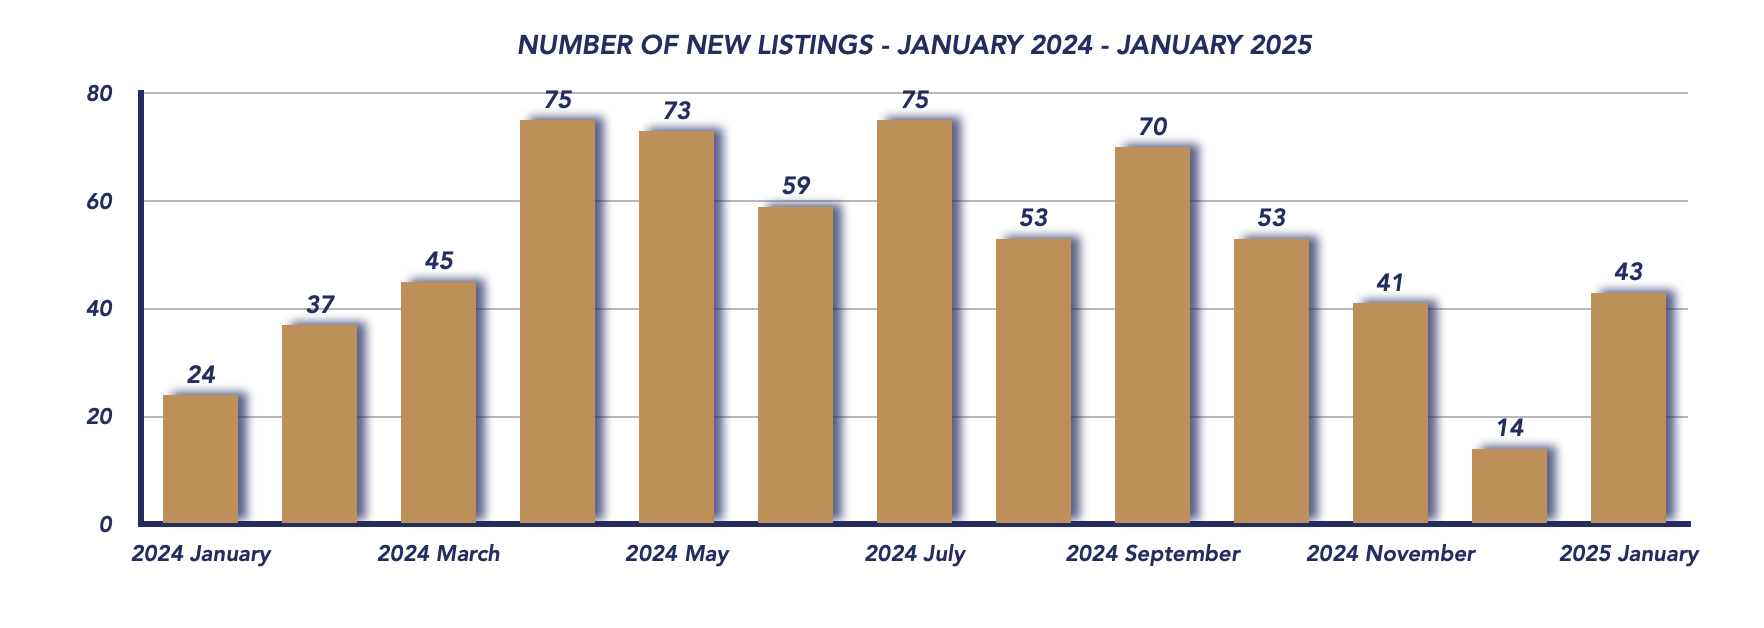
Number of New Listings
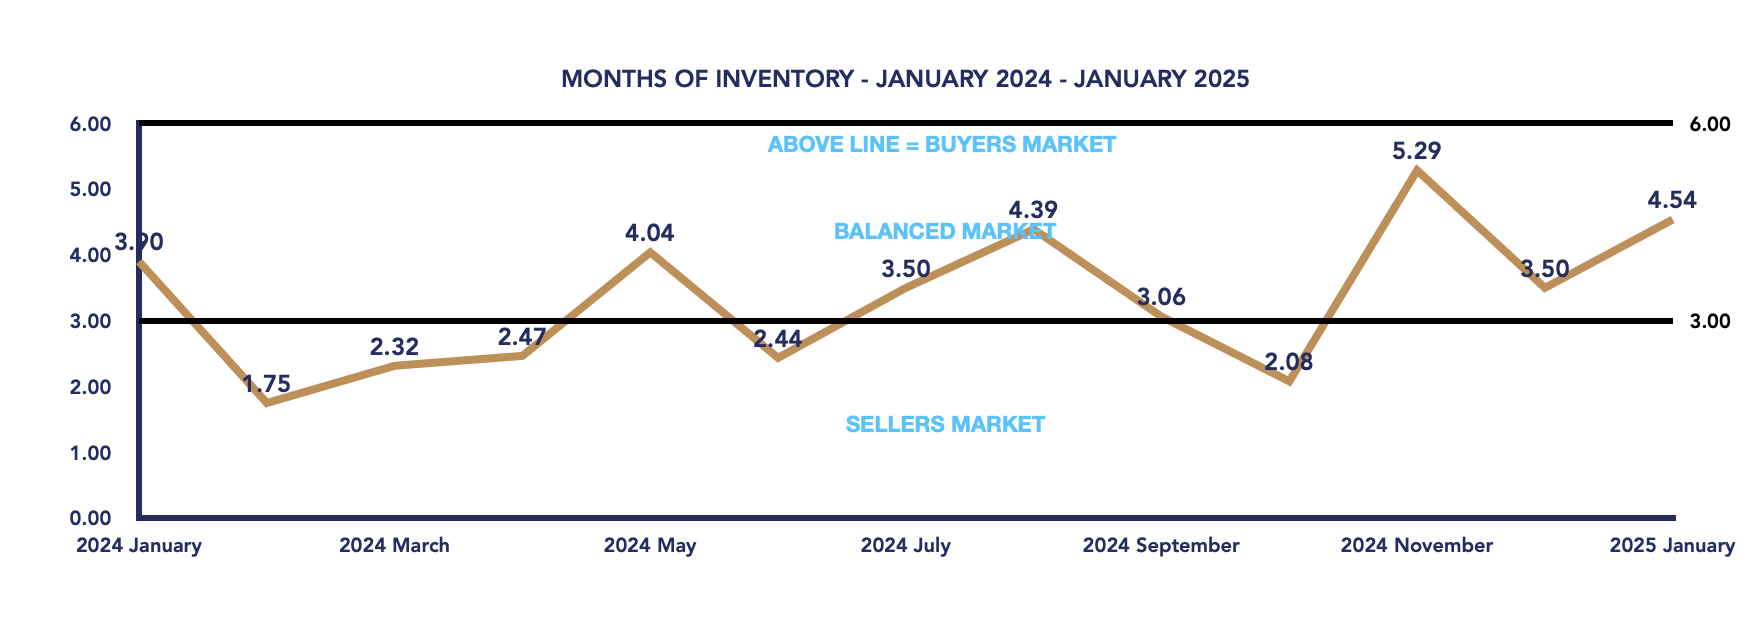
Months of Inventory
*Information is believed to be accurate at time of posting but is not guaranteed to be correct. Some values may vary slightly based on the exact date and time the reports were generated. Market stats are provided by TRREB (Toronto Regional Real Estate Board) and are based on sales for the month of Attached/Row/Townhouses, Condo Apartments, Condo Townhouses, Detached, Detached with Common Elements, Link Homes and Semi-detached. *Some values may vary slightly based on the exact date and time the reports were generated.
Not intended as a solicitation if your property is already listed by another broker. Affiliated real estate agents are independent contractor sales associates, not employees. ©2021 Coldwell Banker. All Rights Reserved. Coldwell Banker and the Coldwell Banker logos are trademarks of Coldwell Banker Real Estate LLC. The Coldwell Banker® System is comprised of company owned offices which are owned by a subsidiary of Realogy Brokerage Group LLC and franchised offices which are independently owned and operated. The Coldwell Banker System fully supports the principles of the Fair Housing Act and the Equal Opportunity Act.
Click below for more reports
Check out our Uxbridge and Scugog Events Pages to keep up to date on whats going on around town. Click the links or scan the Code with your phone to take you directly there.

UXBRIDGE EVENTS

SCUGOG EVENTS