
 Facebook
 X
X
 Pinterest
 Copy Link
Uxbridge Housing September 2023
![]()
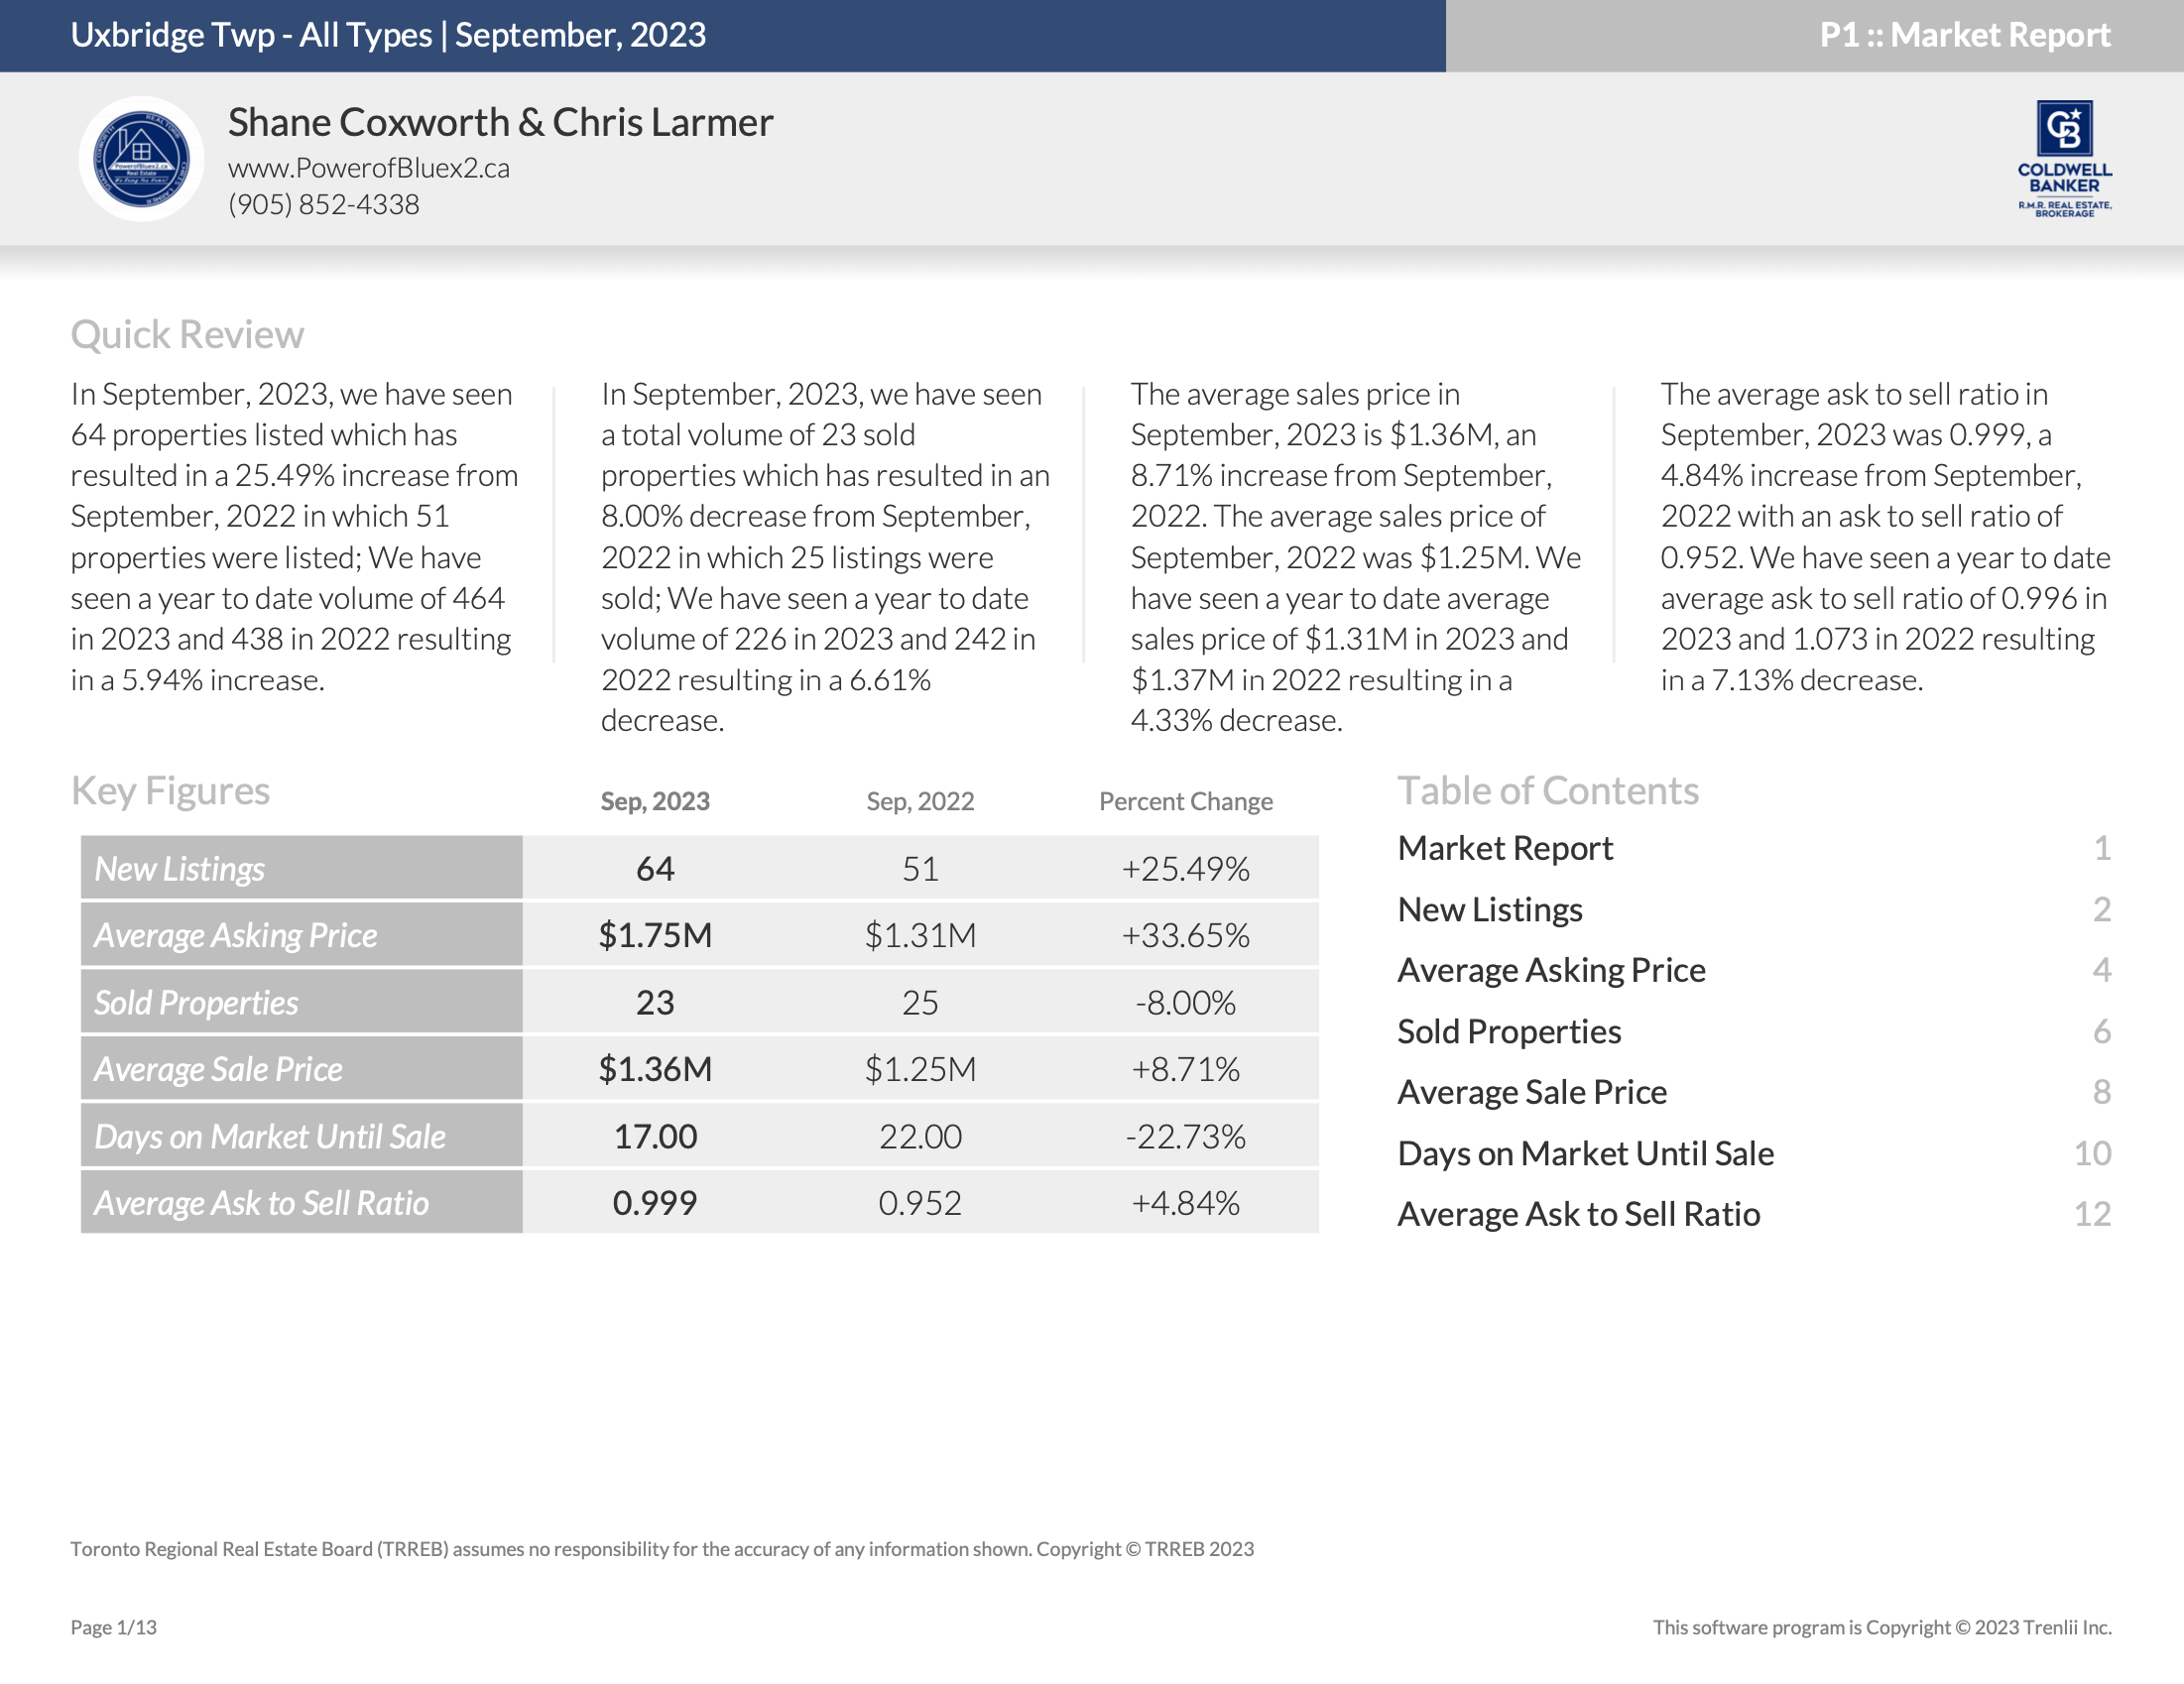
Housing Market Report for September 2023
Here is the Township of Uxbridge Housing September 2023 report (all housing types), with reports from the Toronto Regional Real Estate Board and the Durham Association of REALTORS® included.
This housing report for Township of Uxbridge includes the number of new listings, average list price, number of properties sold, average selling price, average days on market and average asking price to selling price ratio for all property types within the Township of Uxbridge.
Scroll to the bottom for links to take you to the housing market reports for Durham, Scugog, Brock and the Kawartha Lakes.
![]()
![]()
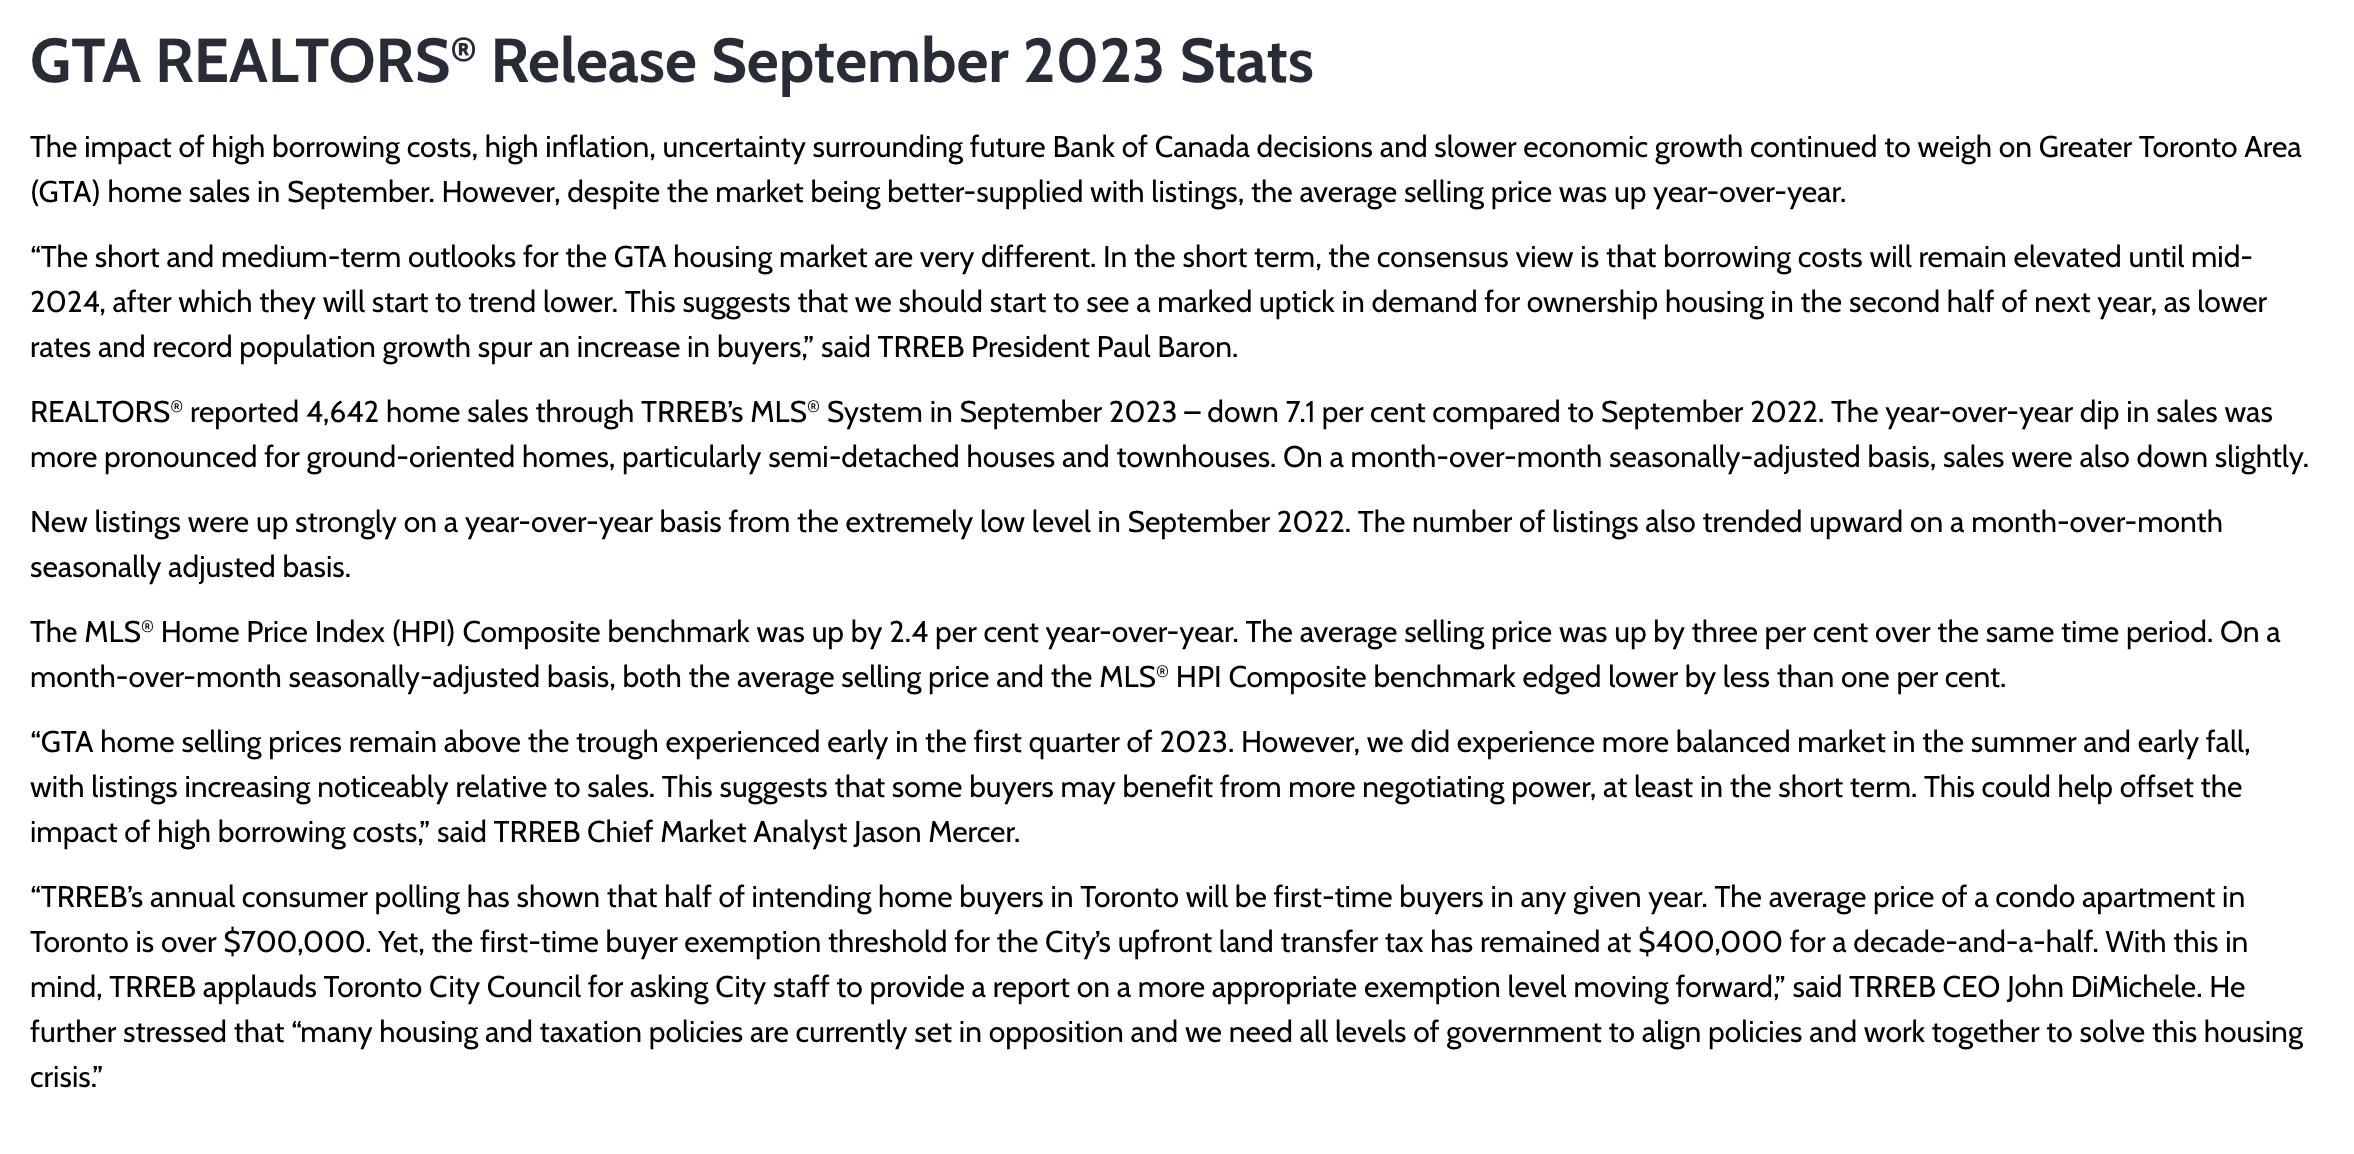
From Toronto Regional Real Estate Board
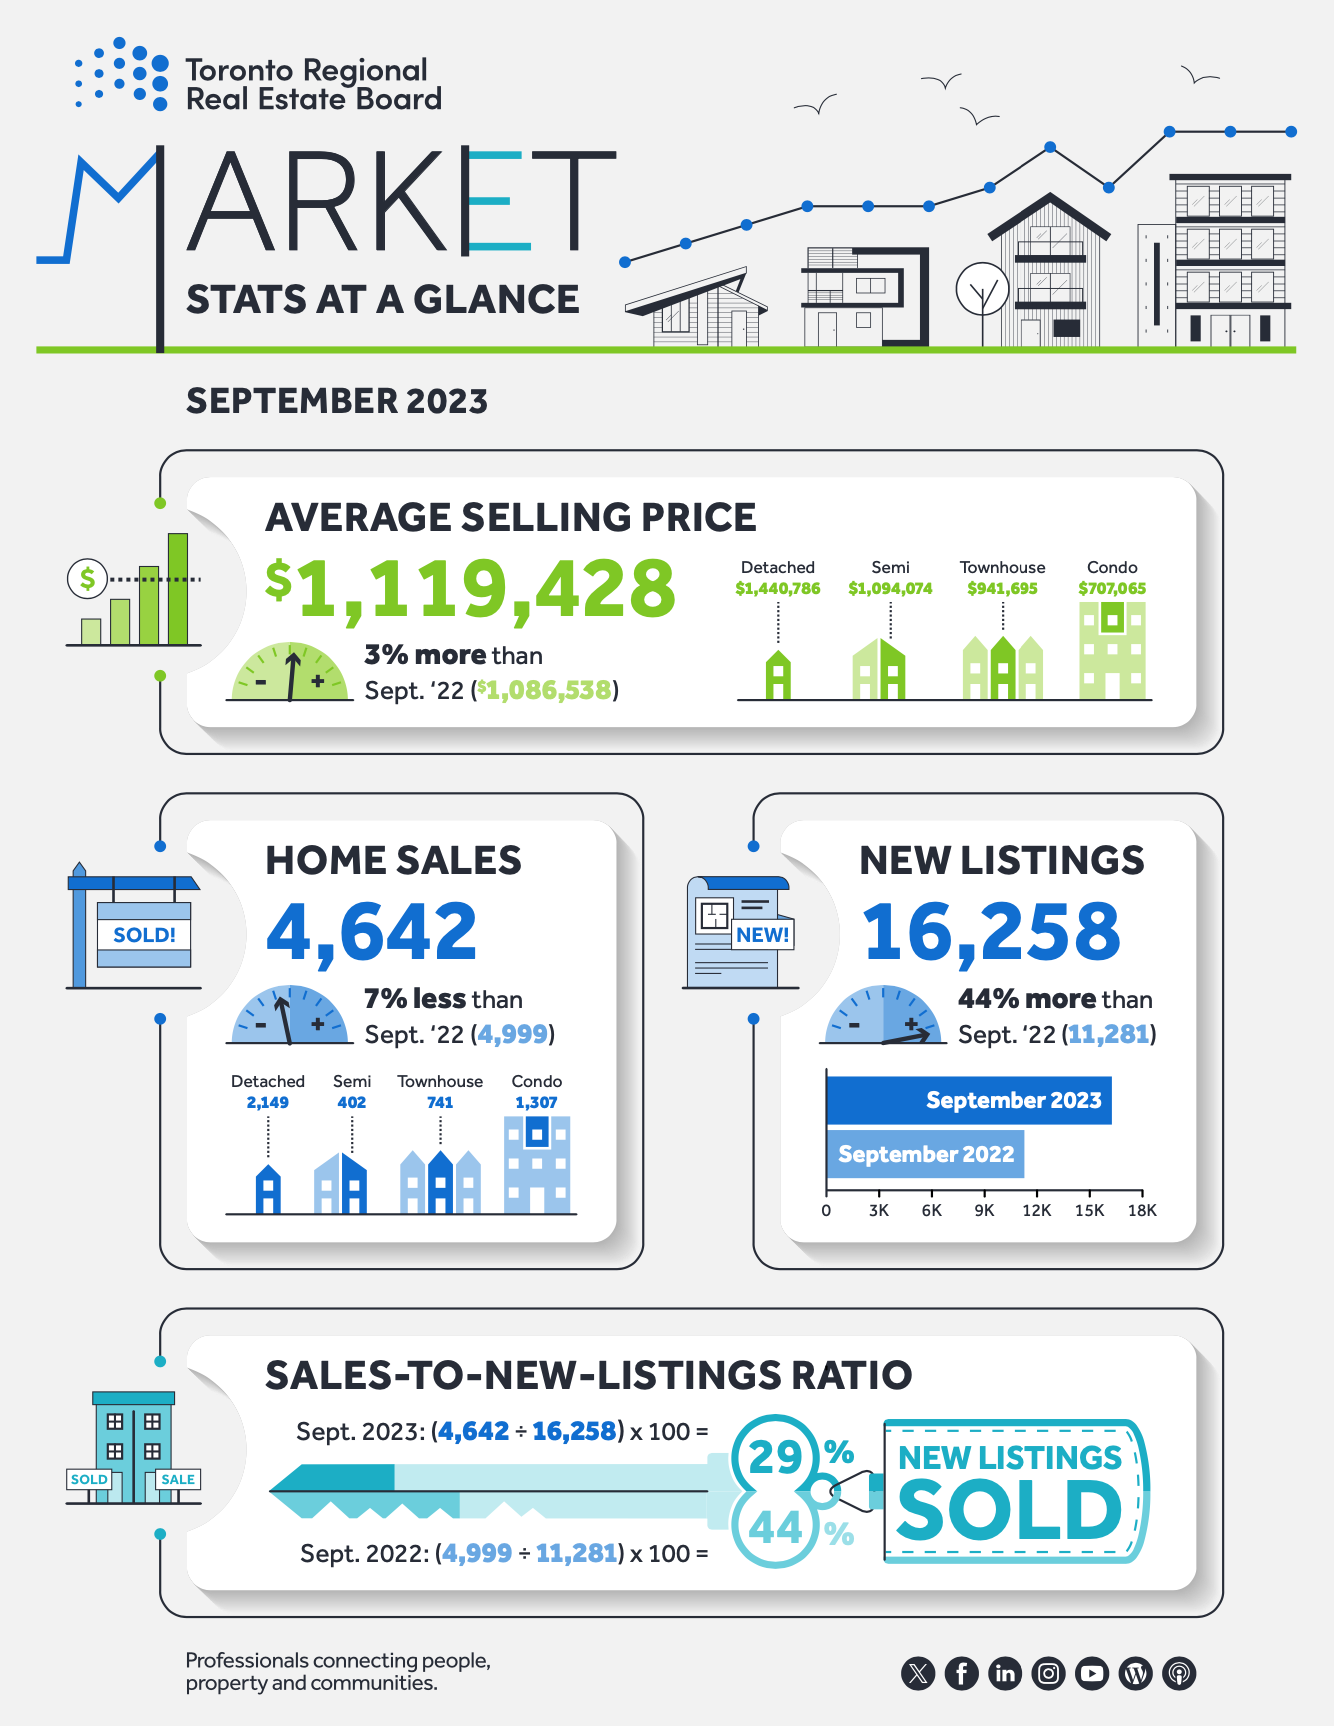
Toronto Regional Real Estate Board – Market Stats At A Glance – September 2023
Read the Toronto Regional Real Estate Board Market Watch Report
![]()
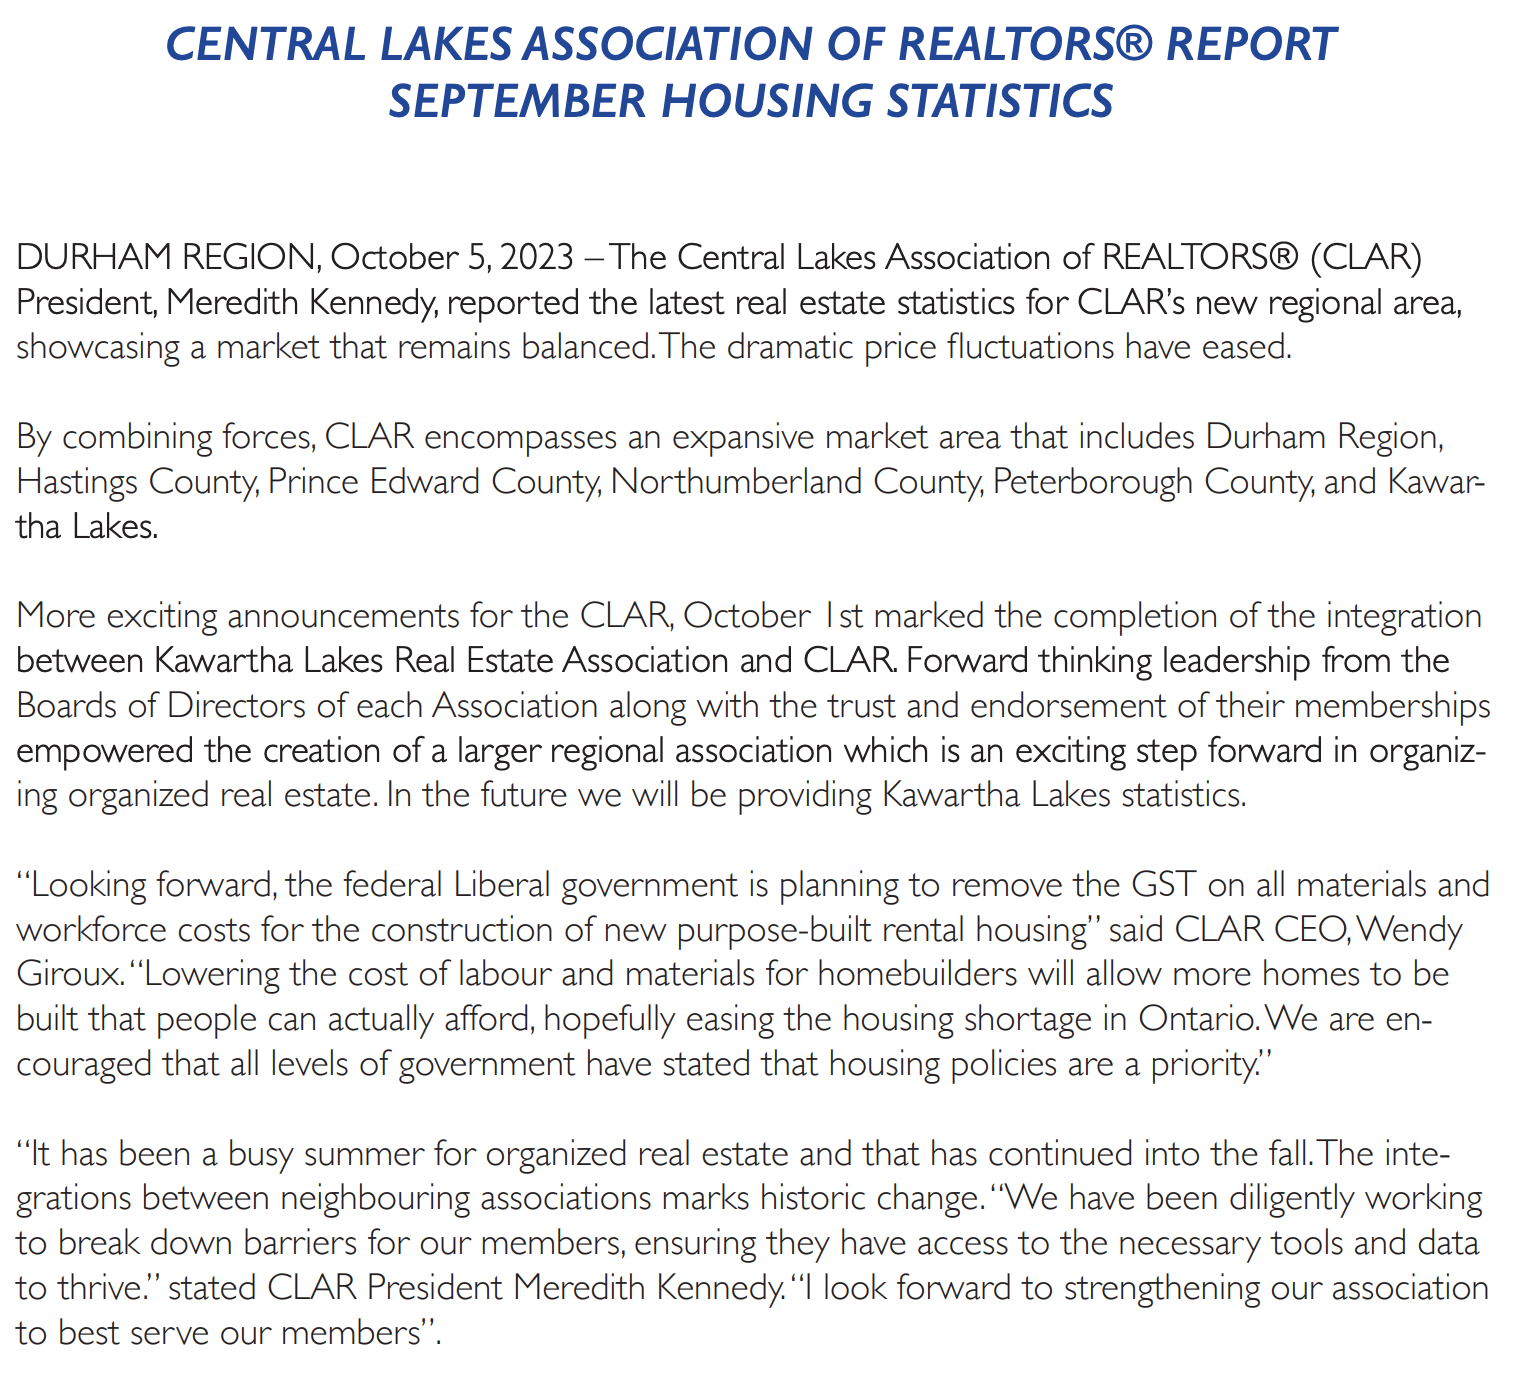
Durham REALTORS® Report September 2023 Housing Statistics
Read the Durham Association of REALTORS® FULL Real Estate Report
![]()
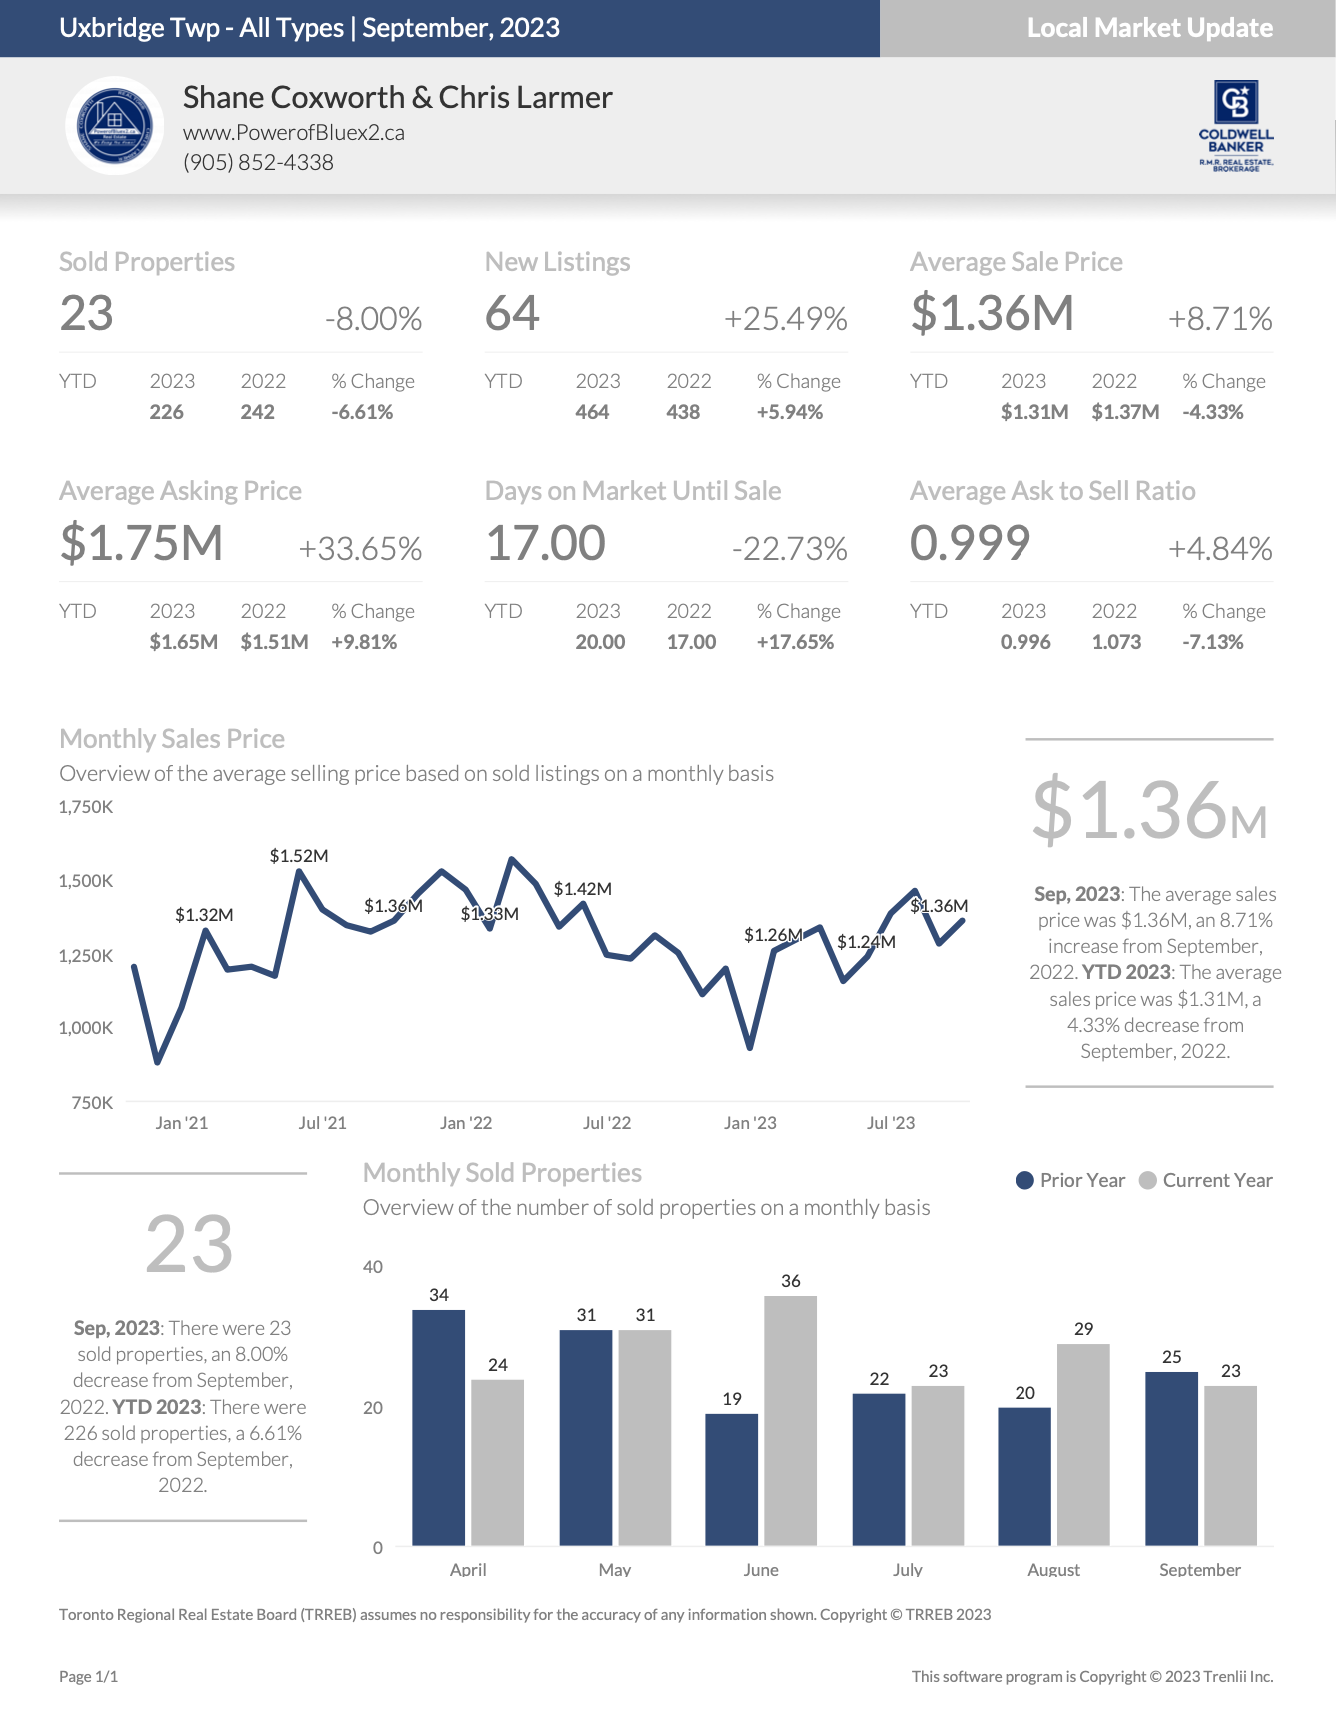
Township of Uxbridge Full Report
*Some values may vary slightly based on the exact date and time the reports were generated.
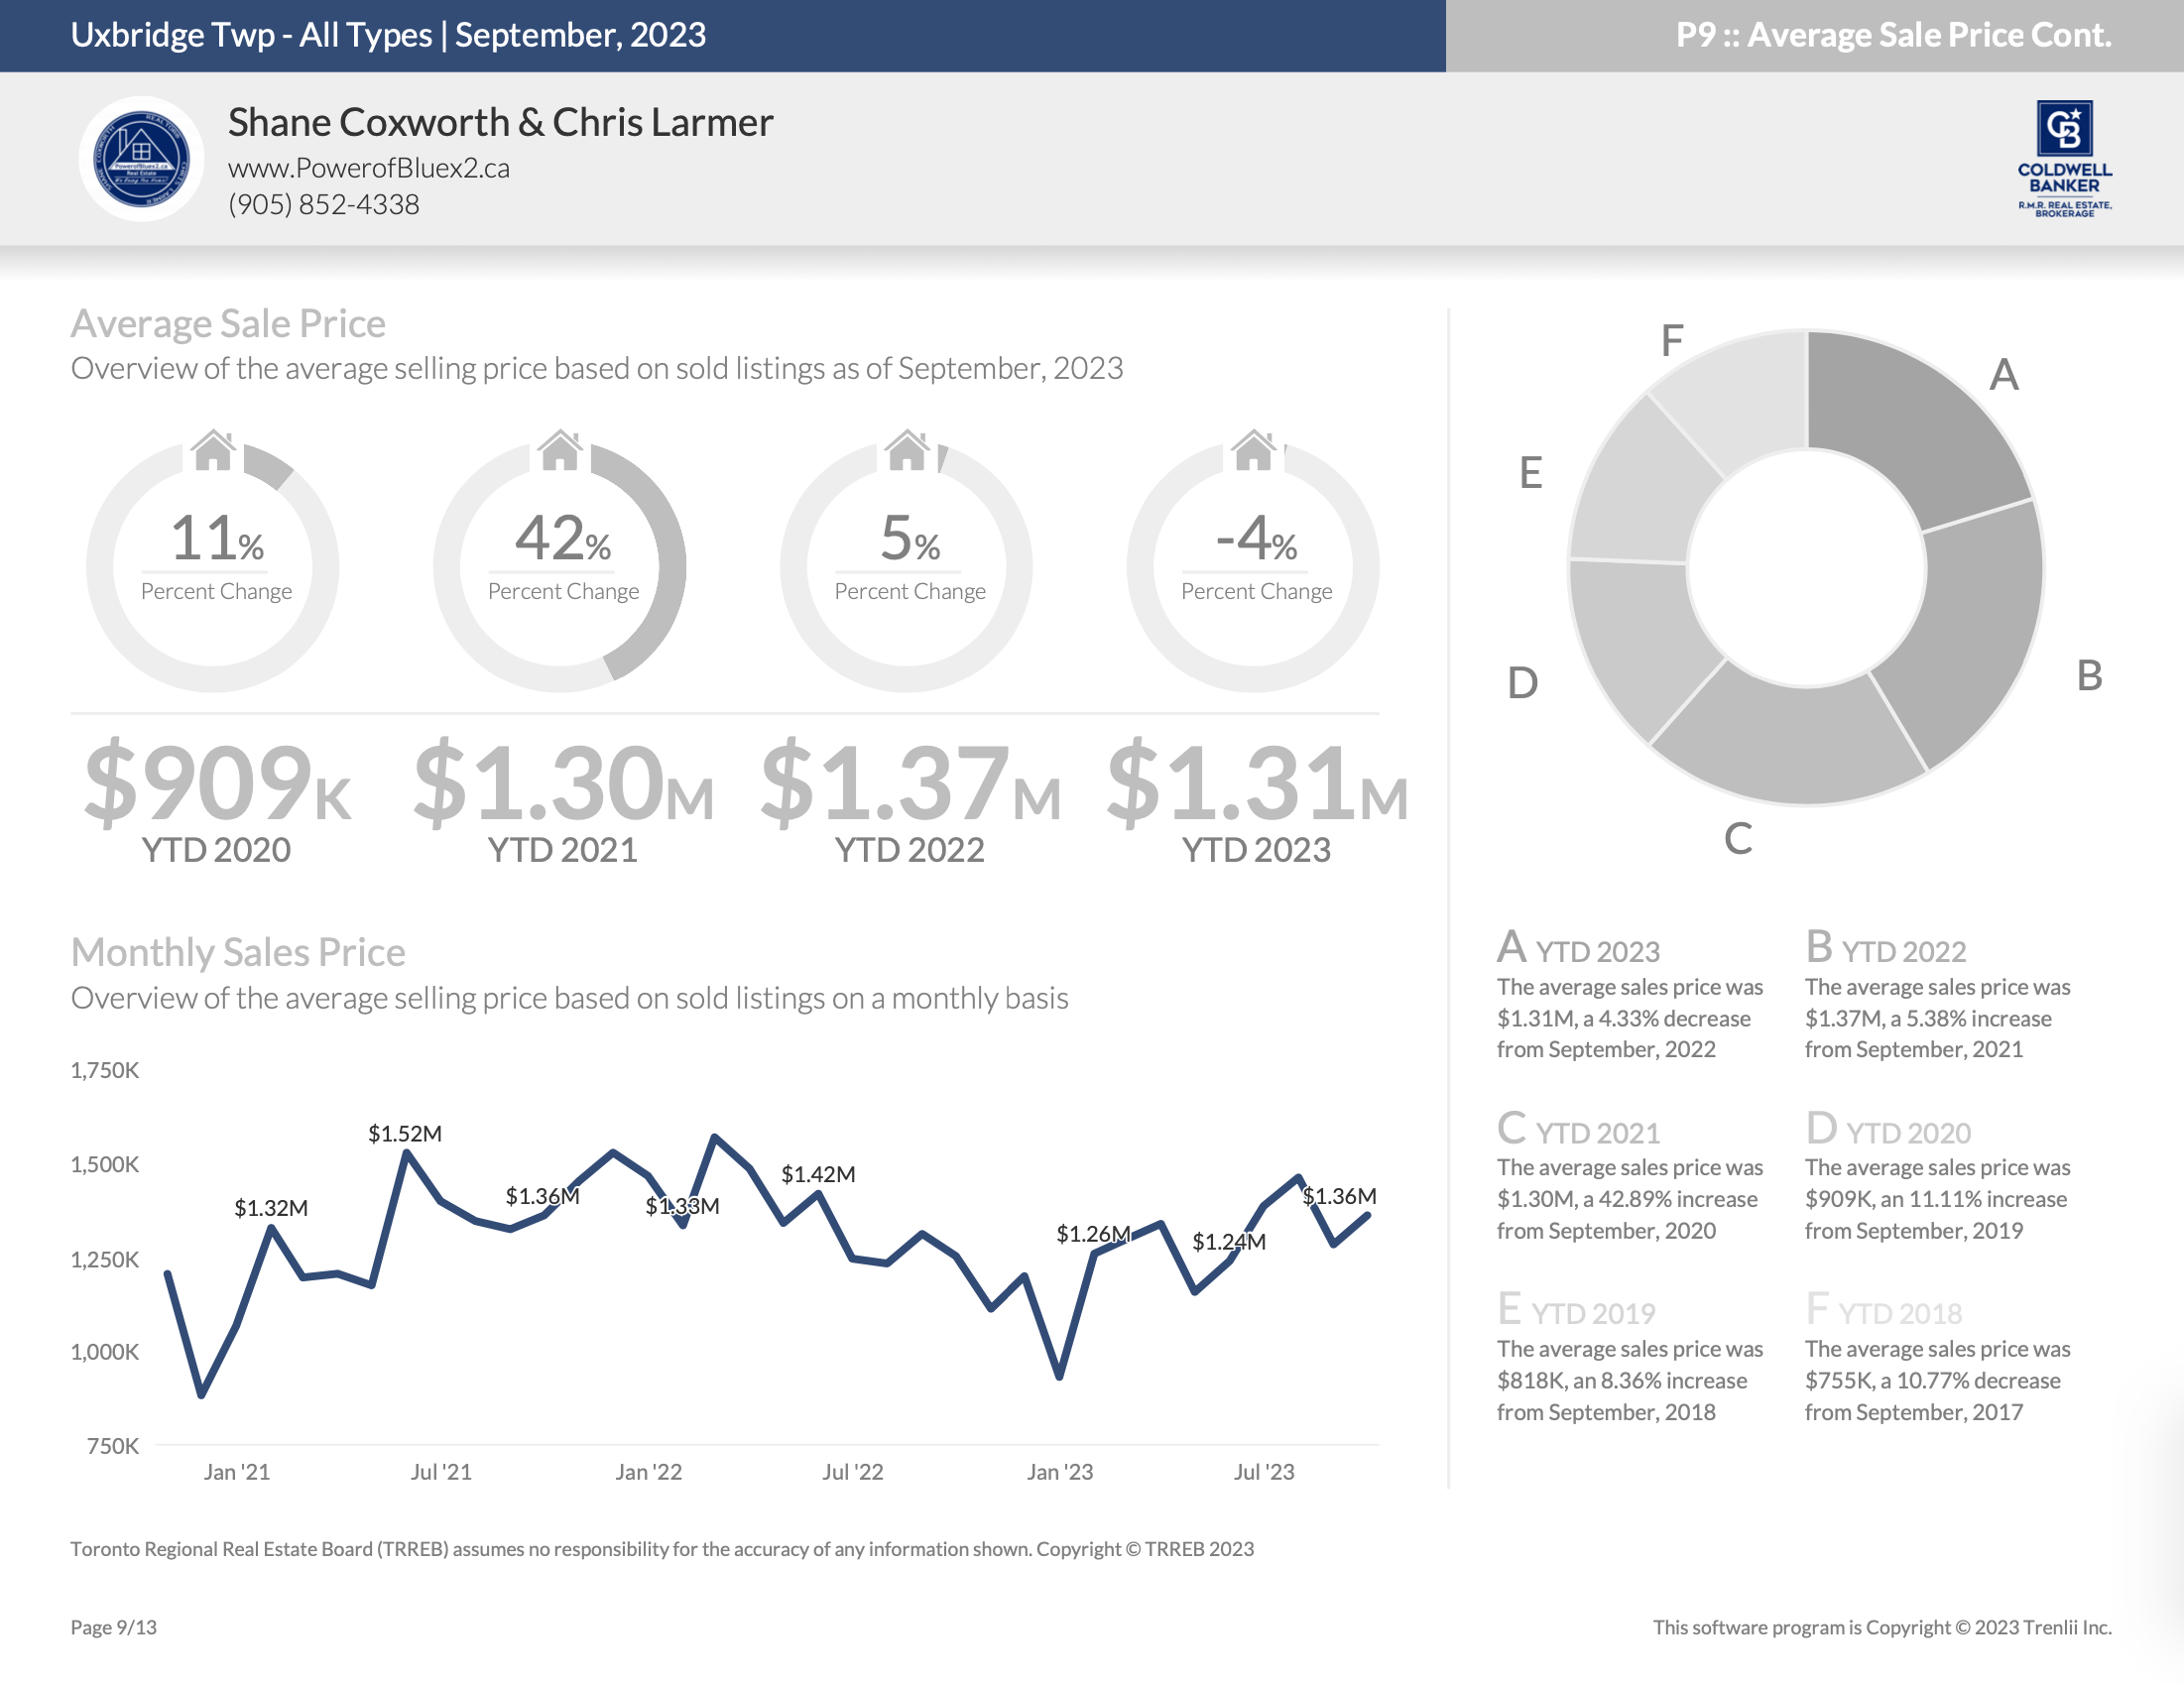
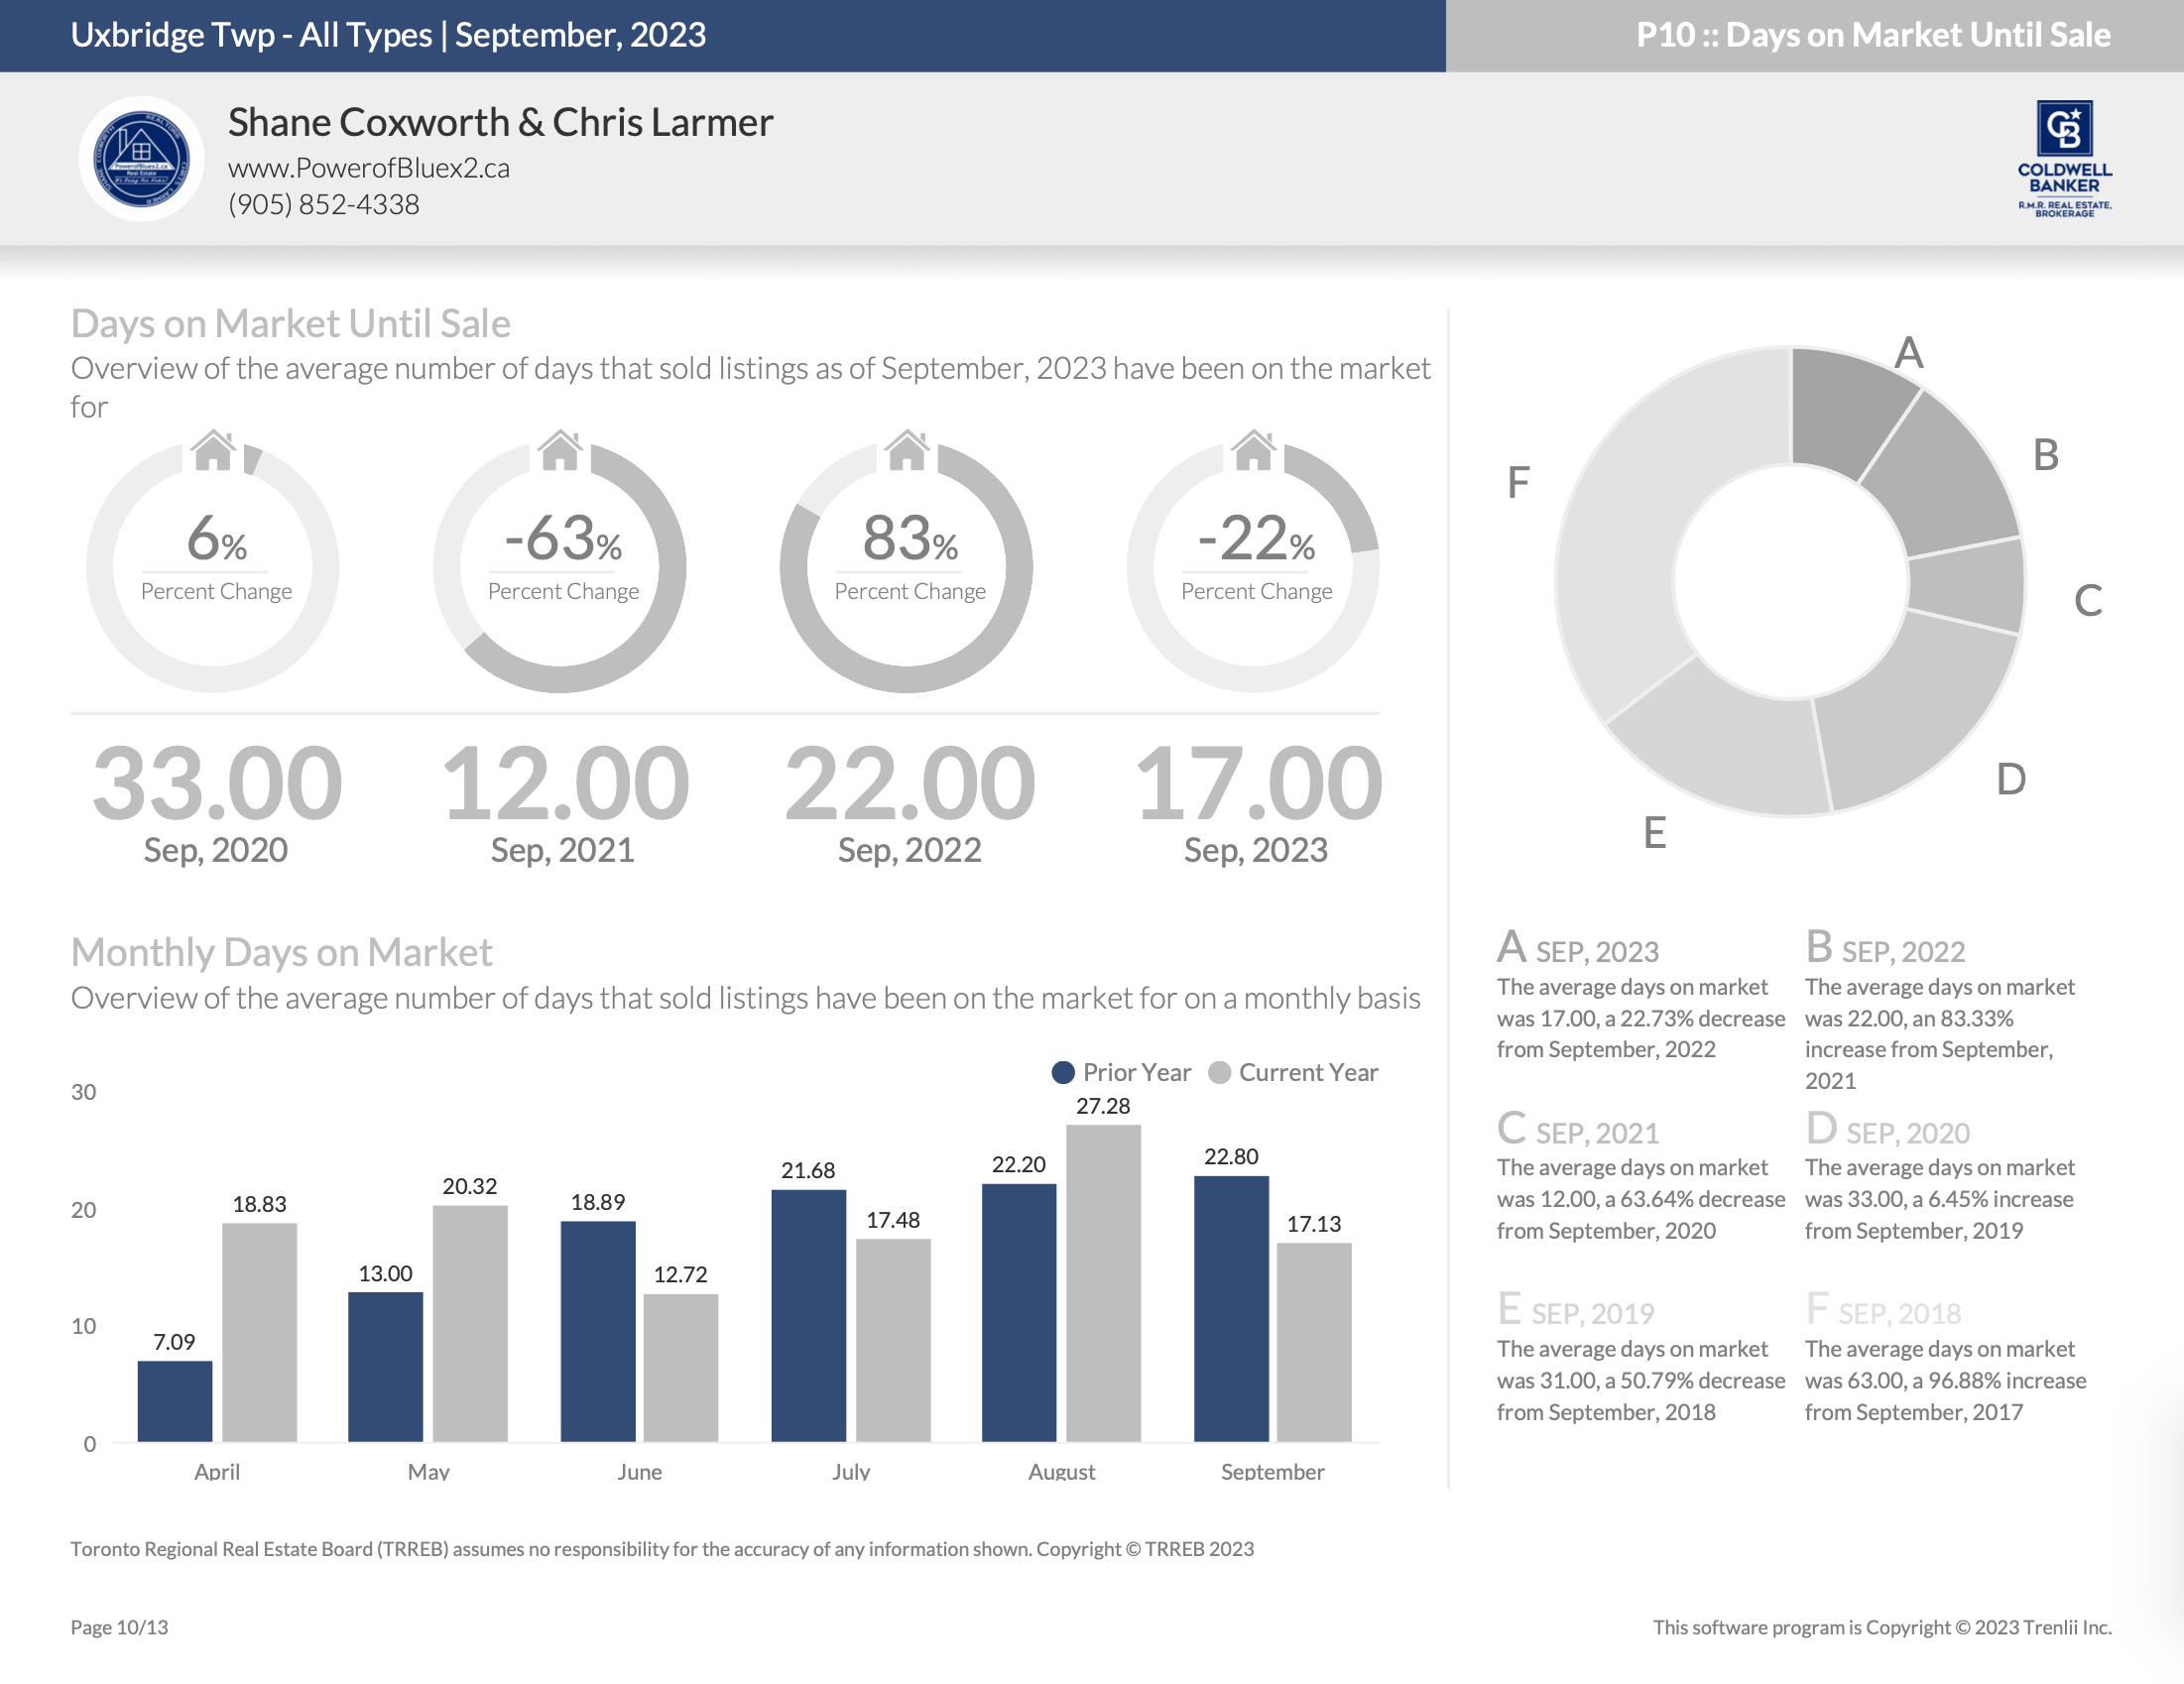
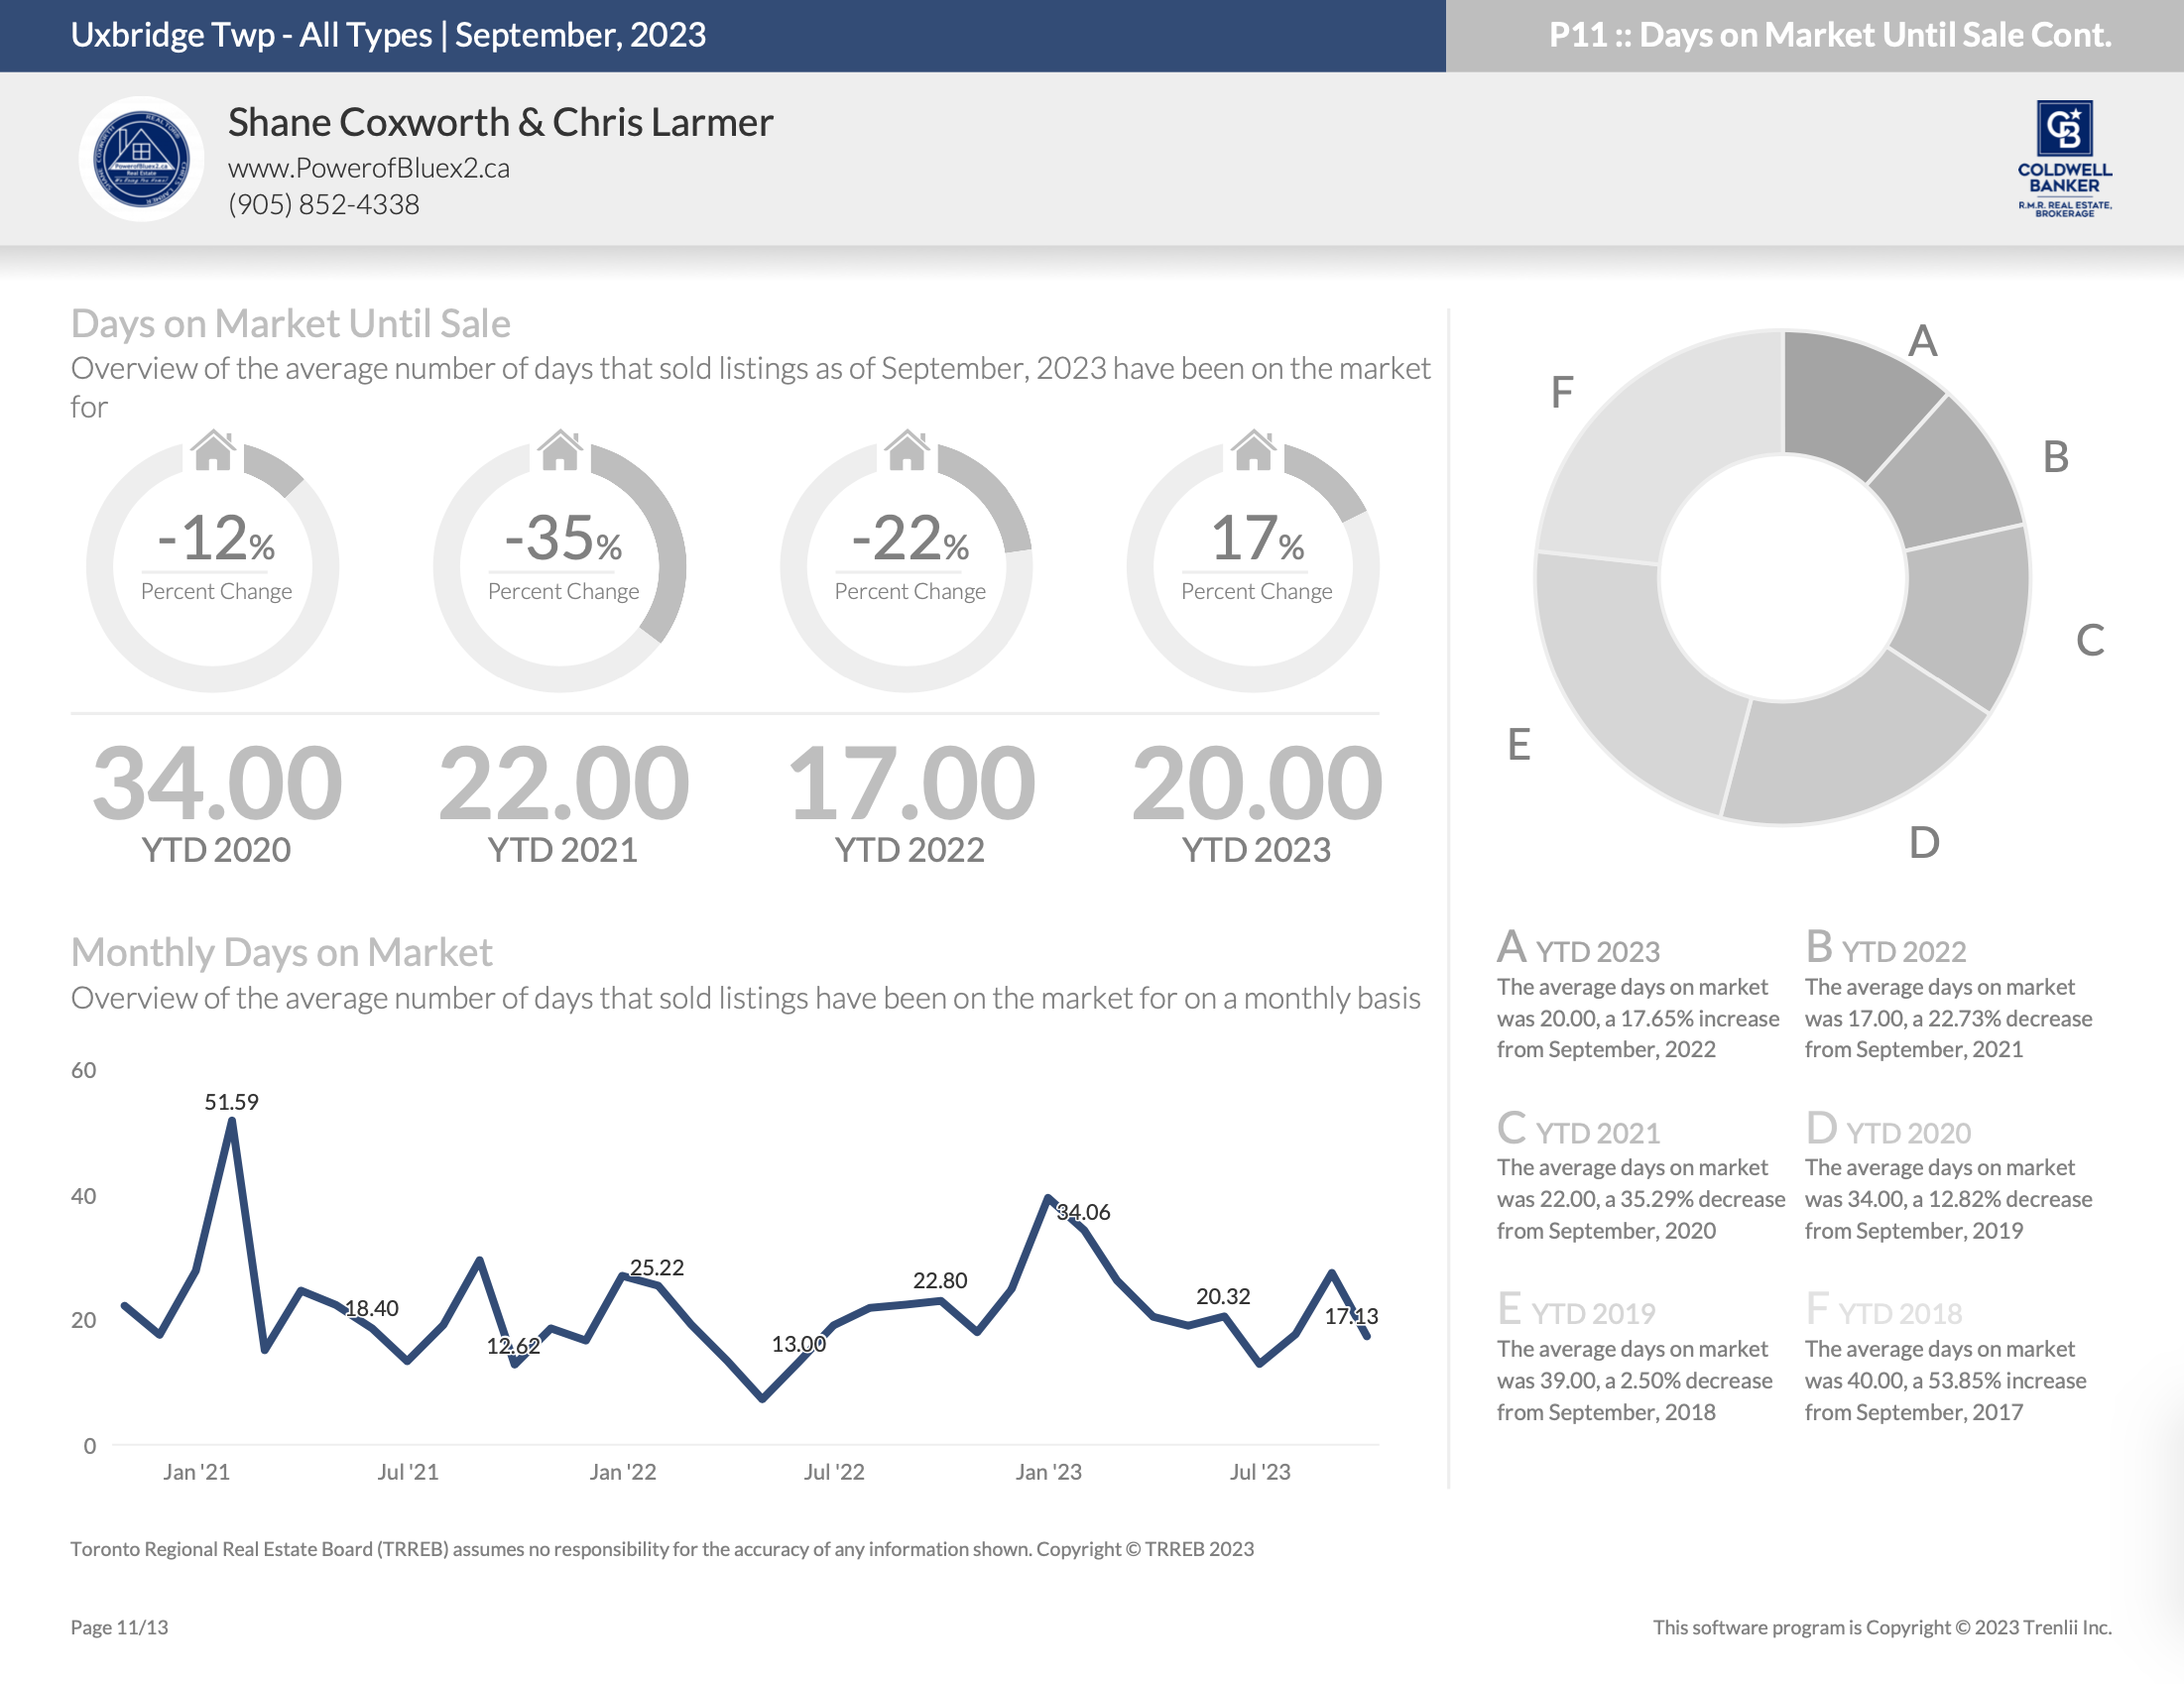
The real estate market in the Township of Uxbridge has displayed a resilient and balanced performance throughout 2023. Monthly sales prices have experienced minor fluctuations with no significant increases or decreases, ultimately reaching $1,324,645 in September, up from $1,132,693 in January. Meanwhile, active listings have steadily increased, providing a growing inventory for prospective buyers, climbing from 32 in January to 69 in September. Days on the market have improved significantly, dropping from a high of 39 days in January to just 22 days in September. While January saw 14 sales, the number of sales increased from January, reaching its peak in June before declining to 19 in September. This suggests a balanced market where demand and supply are in harmony. Despite the drop in the number of sales, we haven’t observed a dramatic decrease in sales prices, making it a favourable market for buyers and sellers alike in Uxbridge.
Quick Review
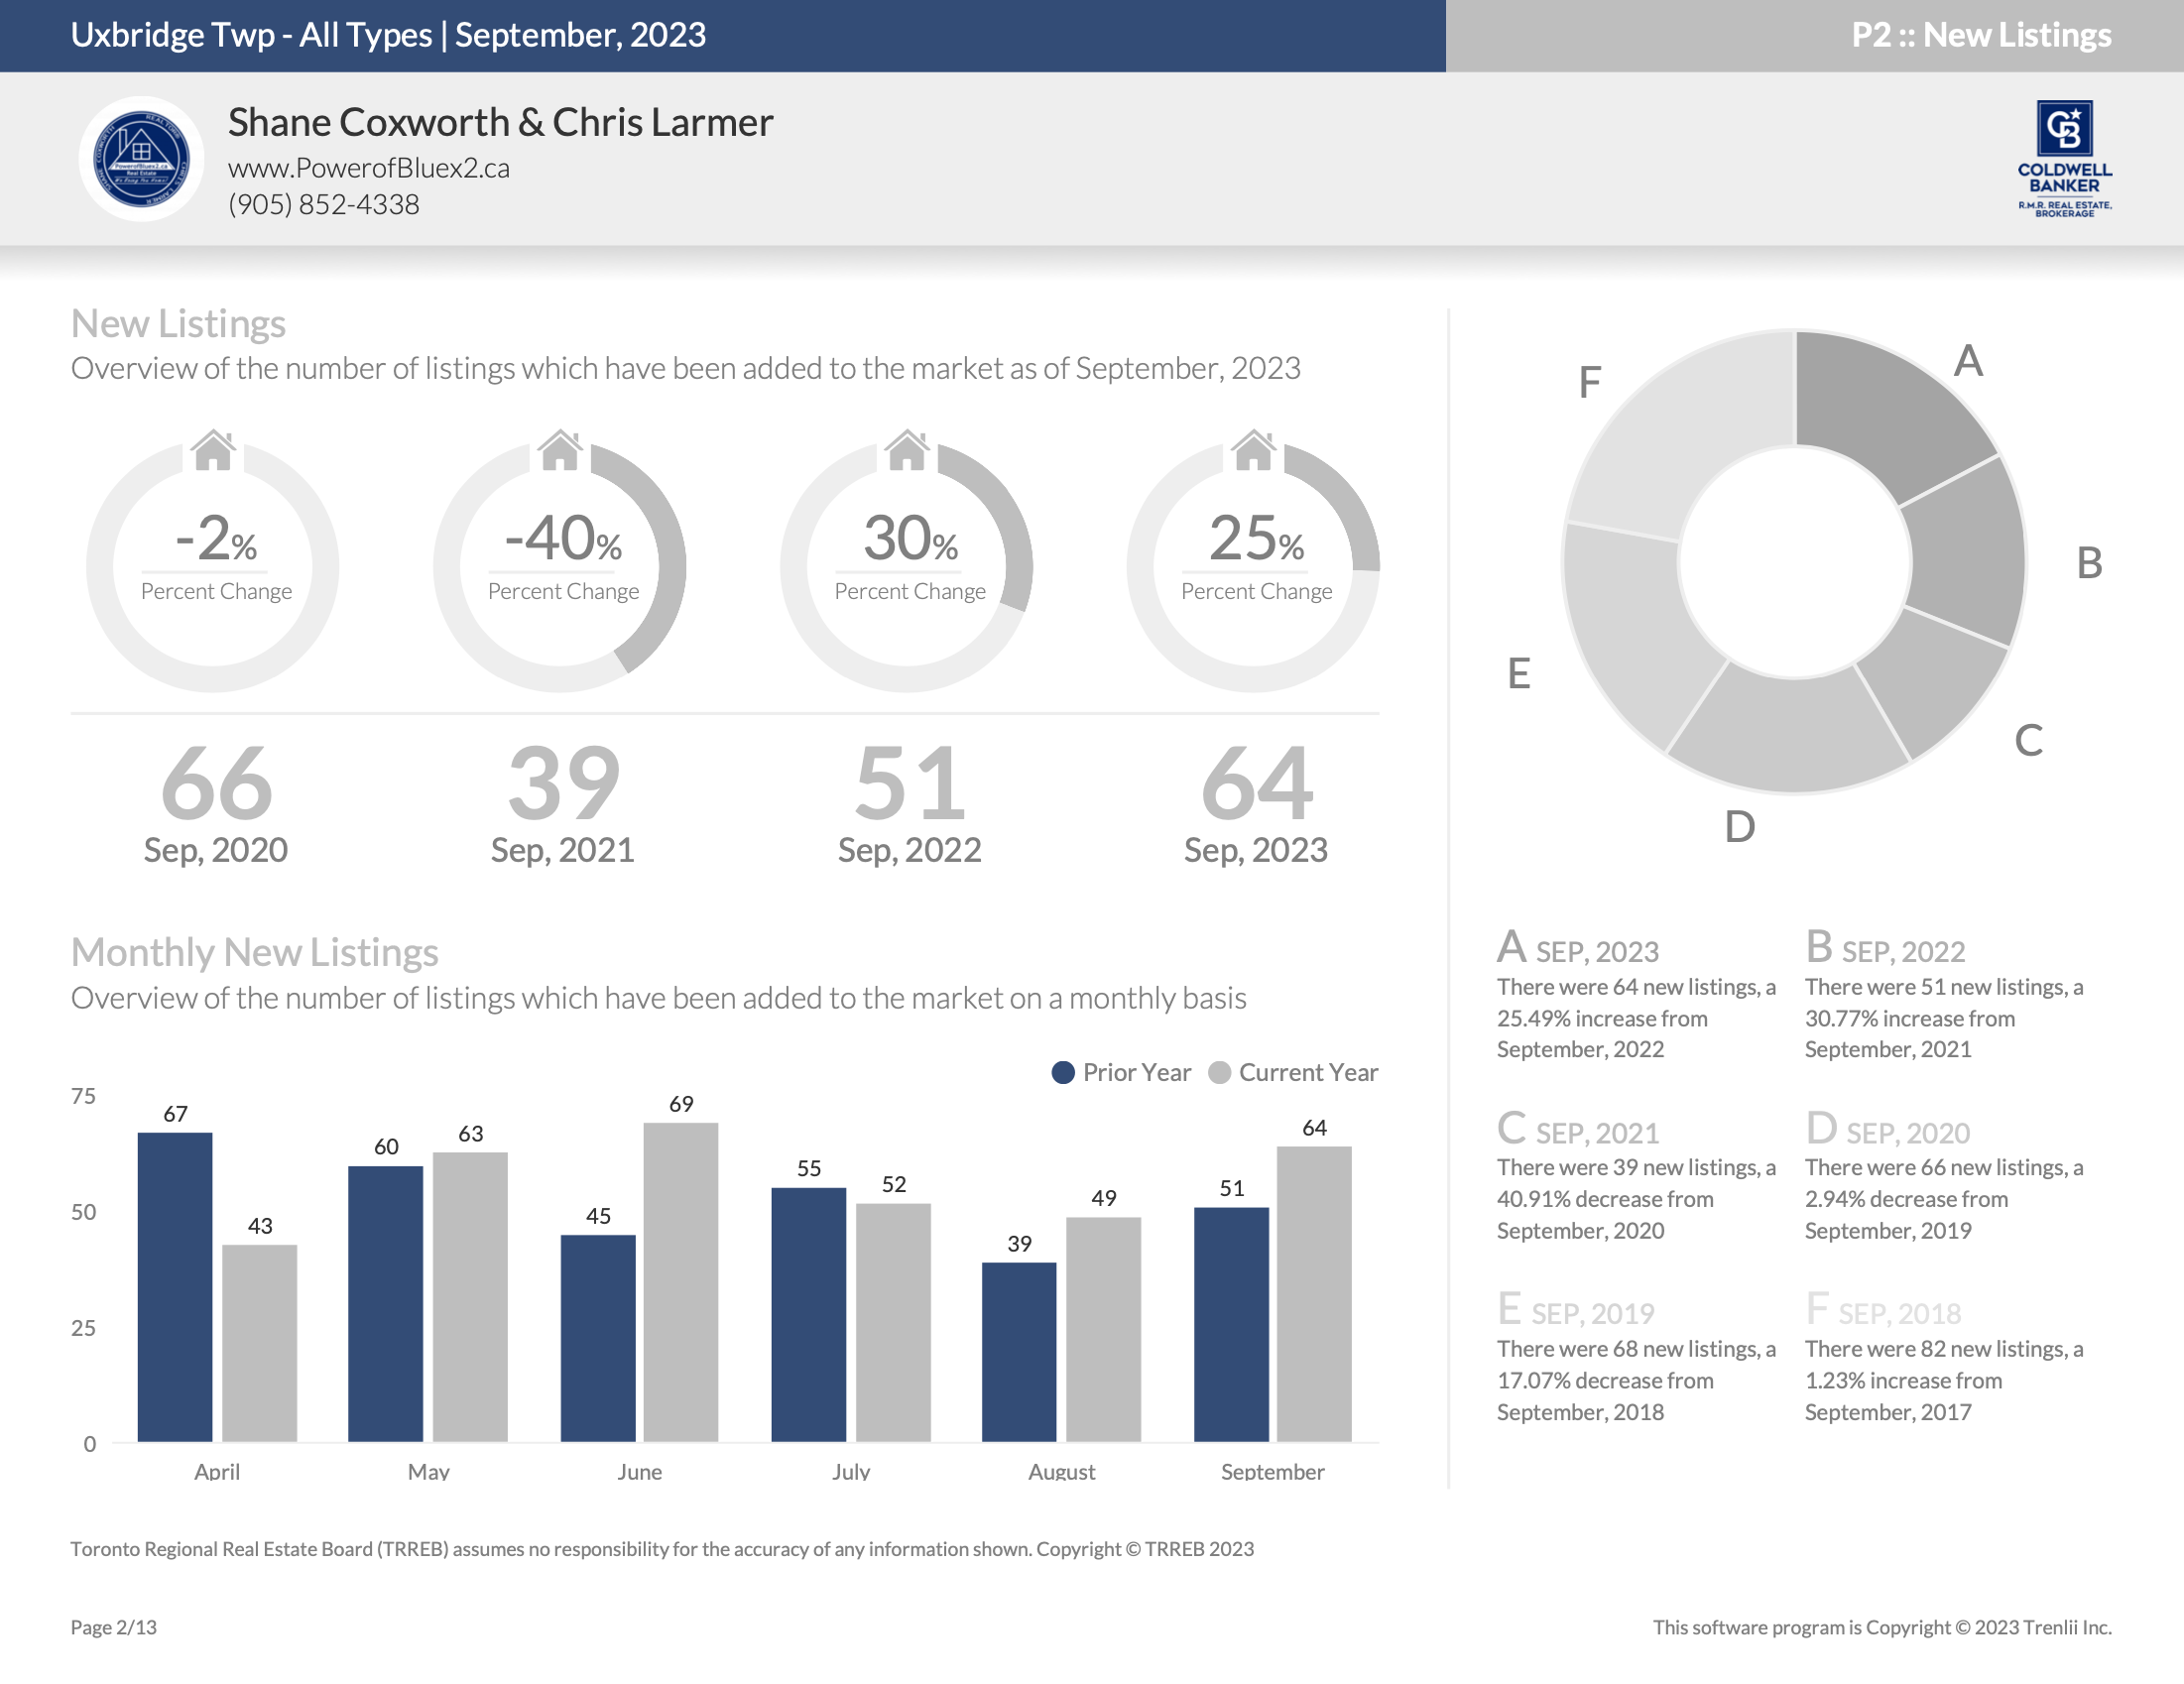
New Listings – September 2023
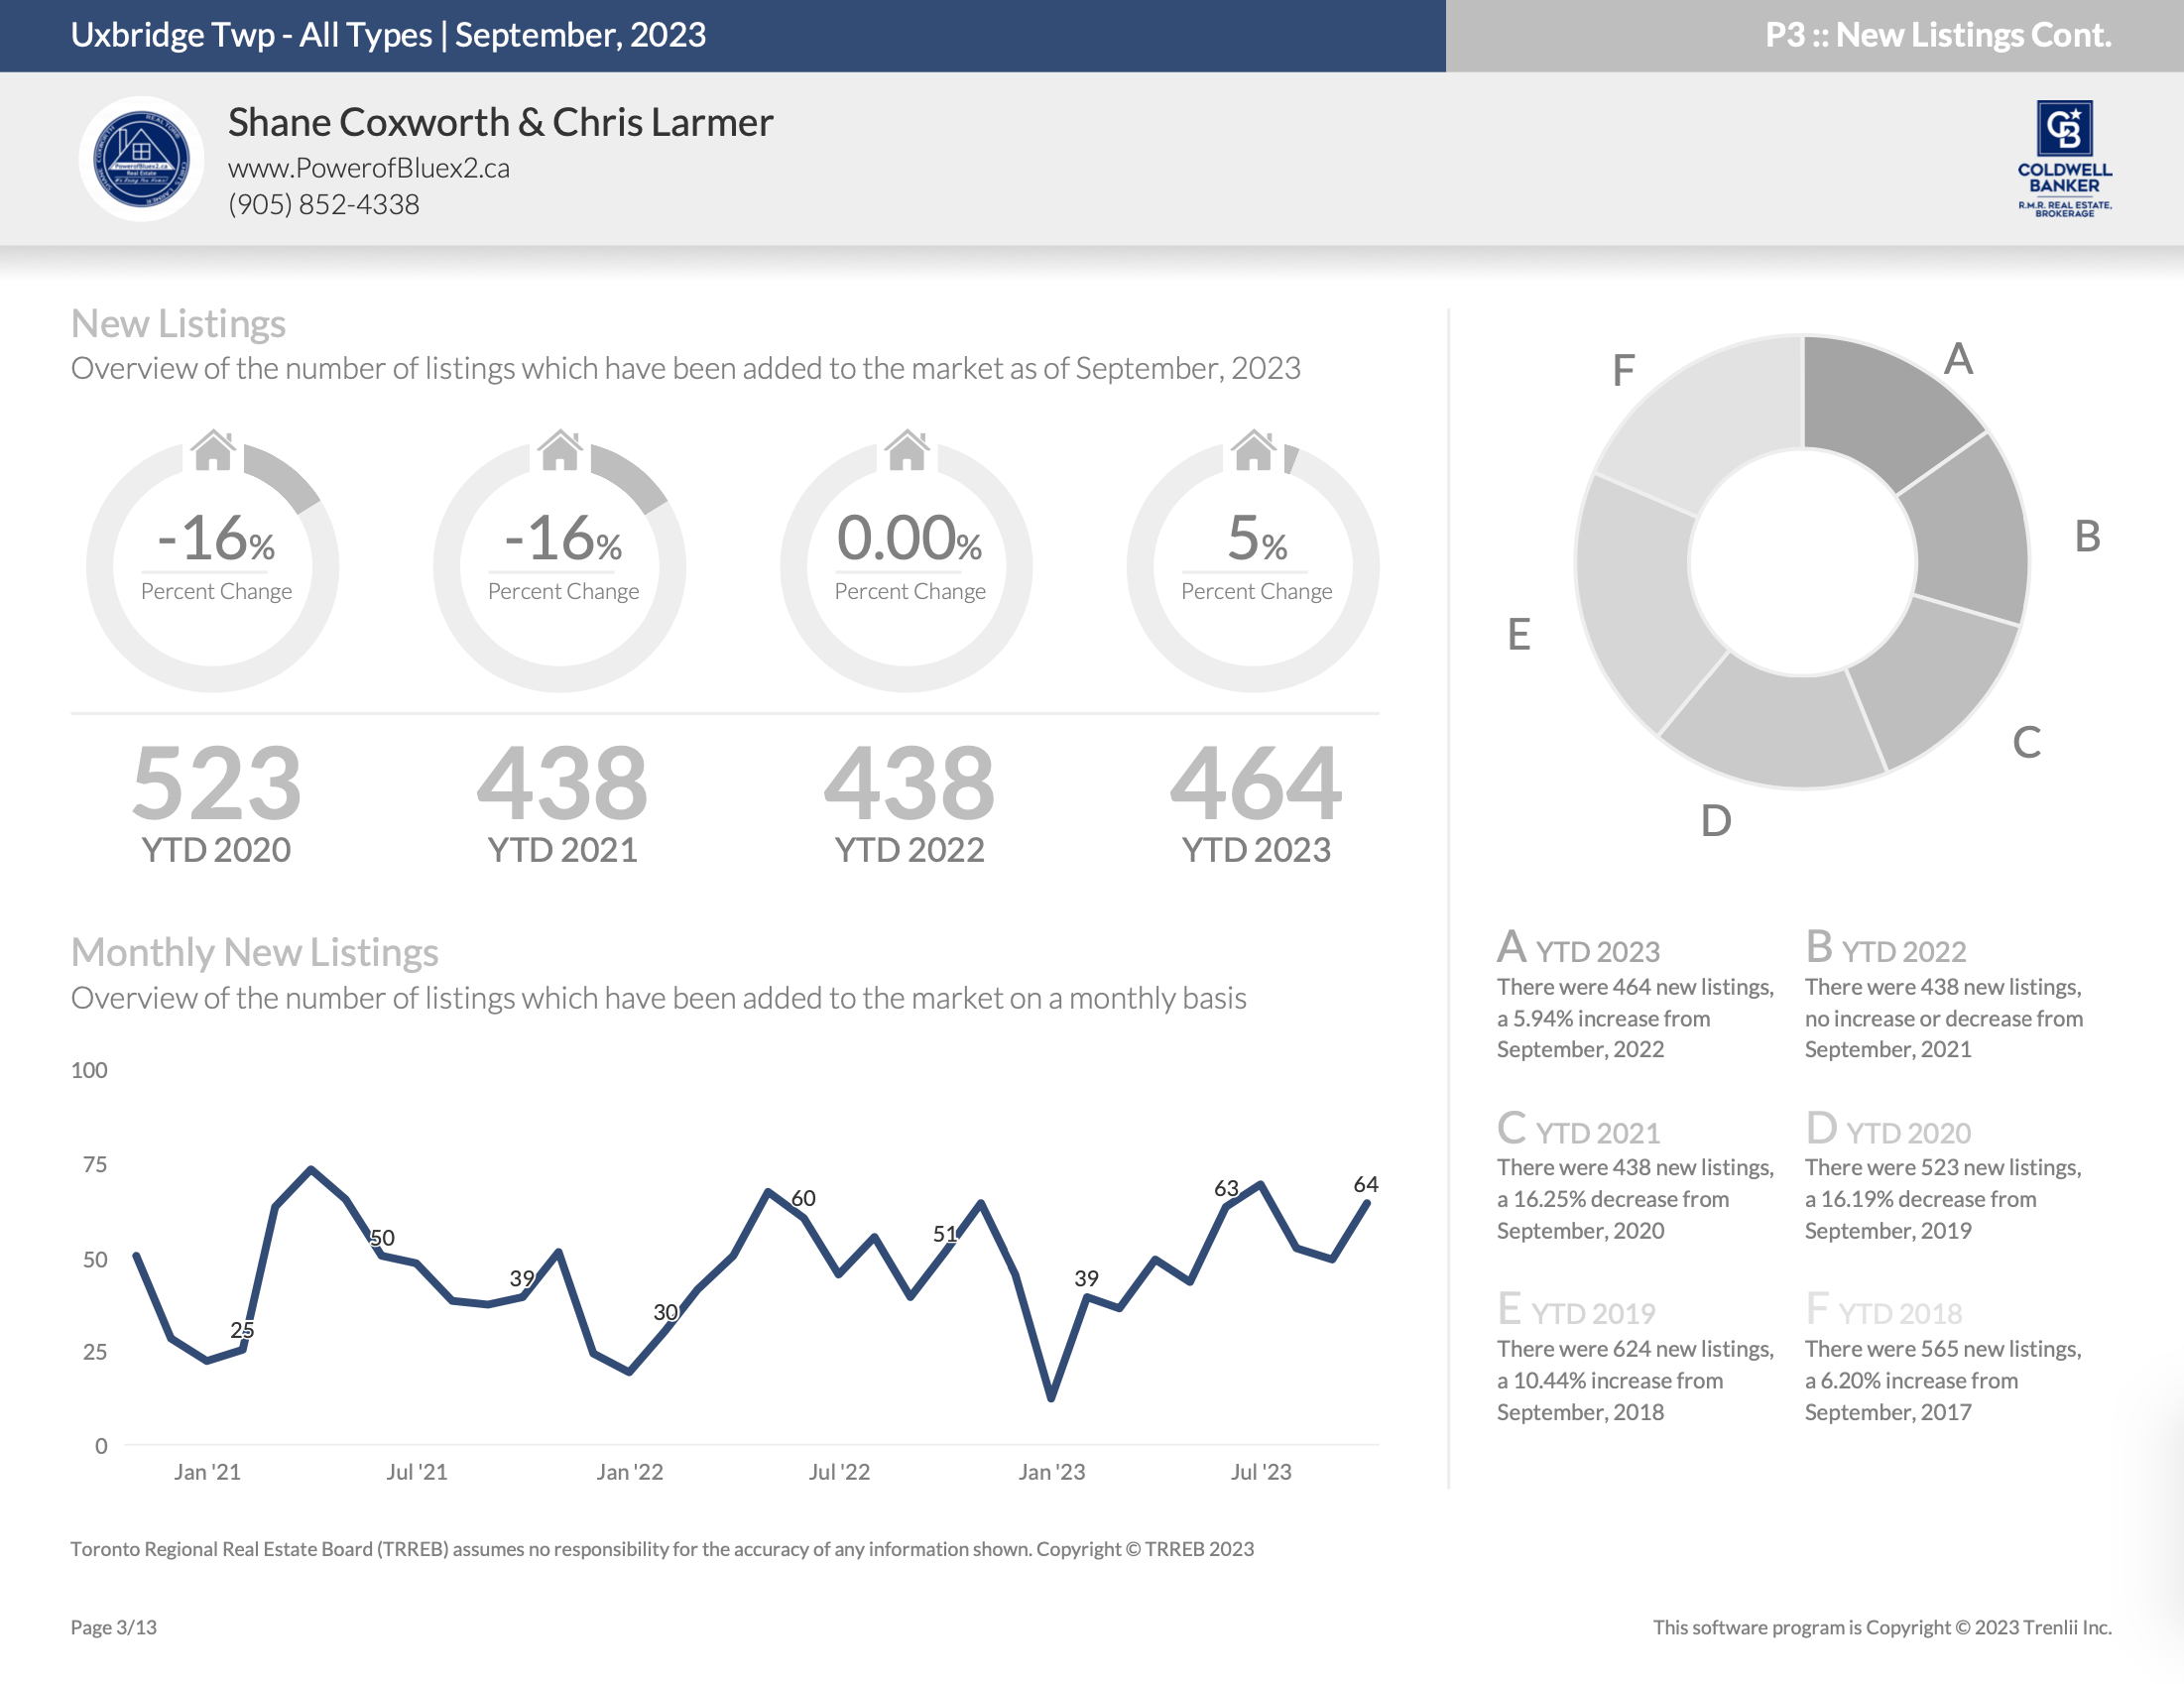
New Listings – Year-To-Date
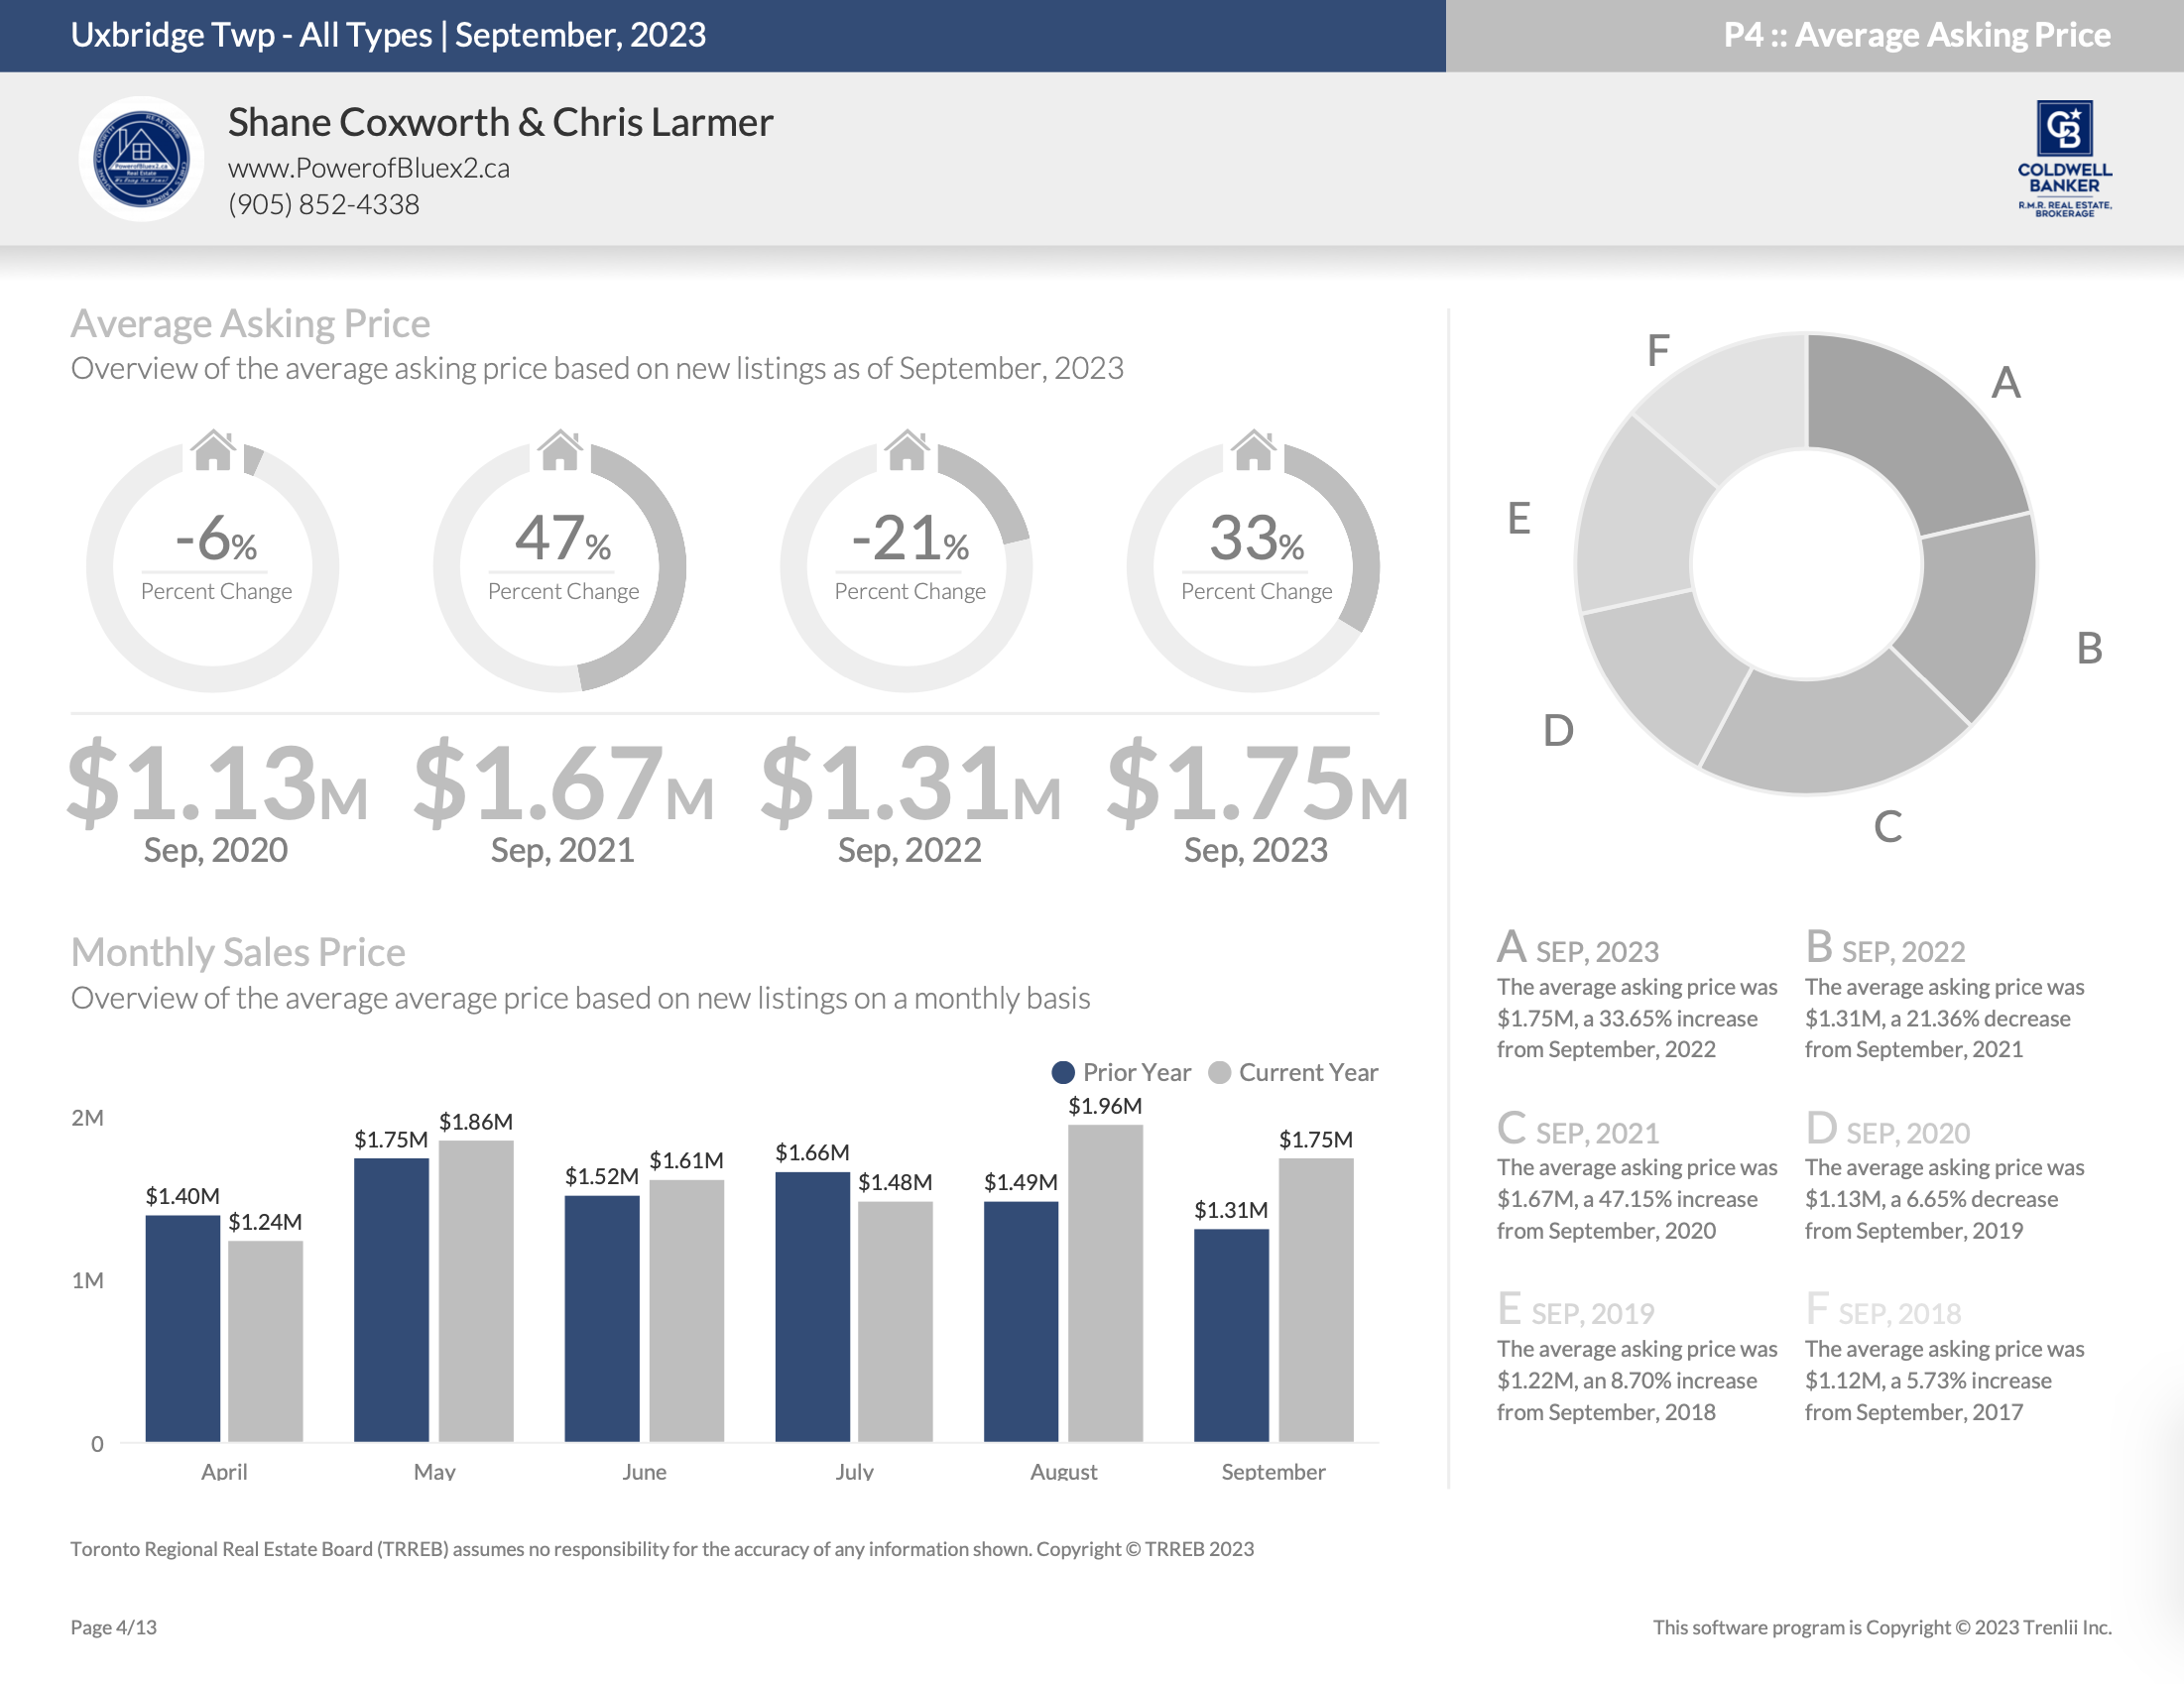
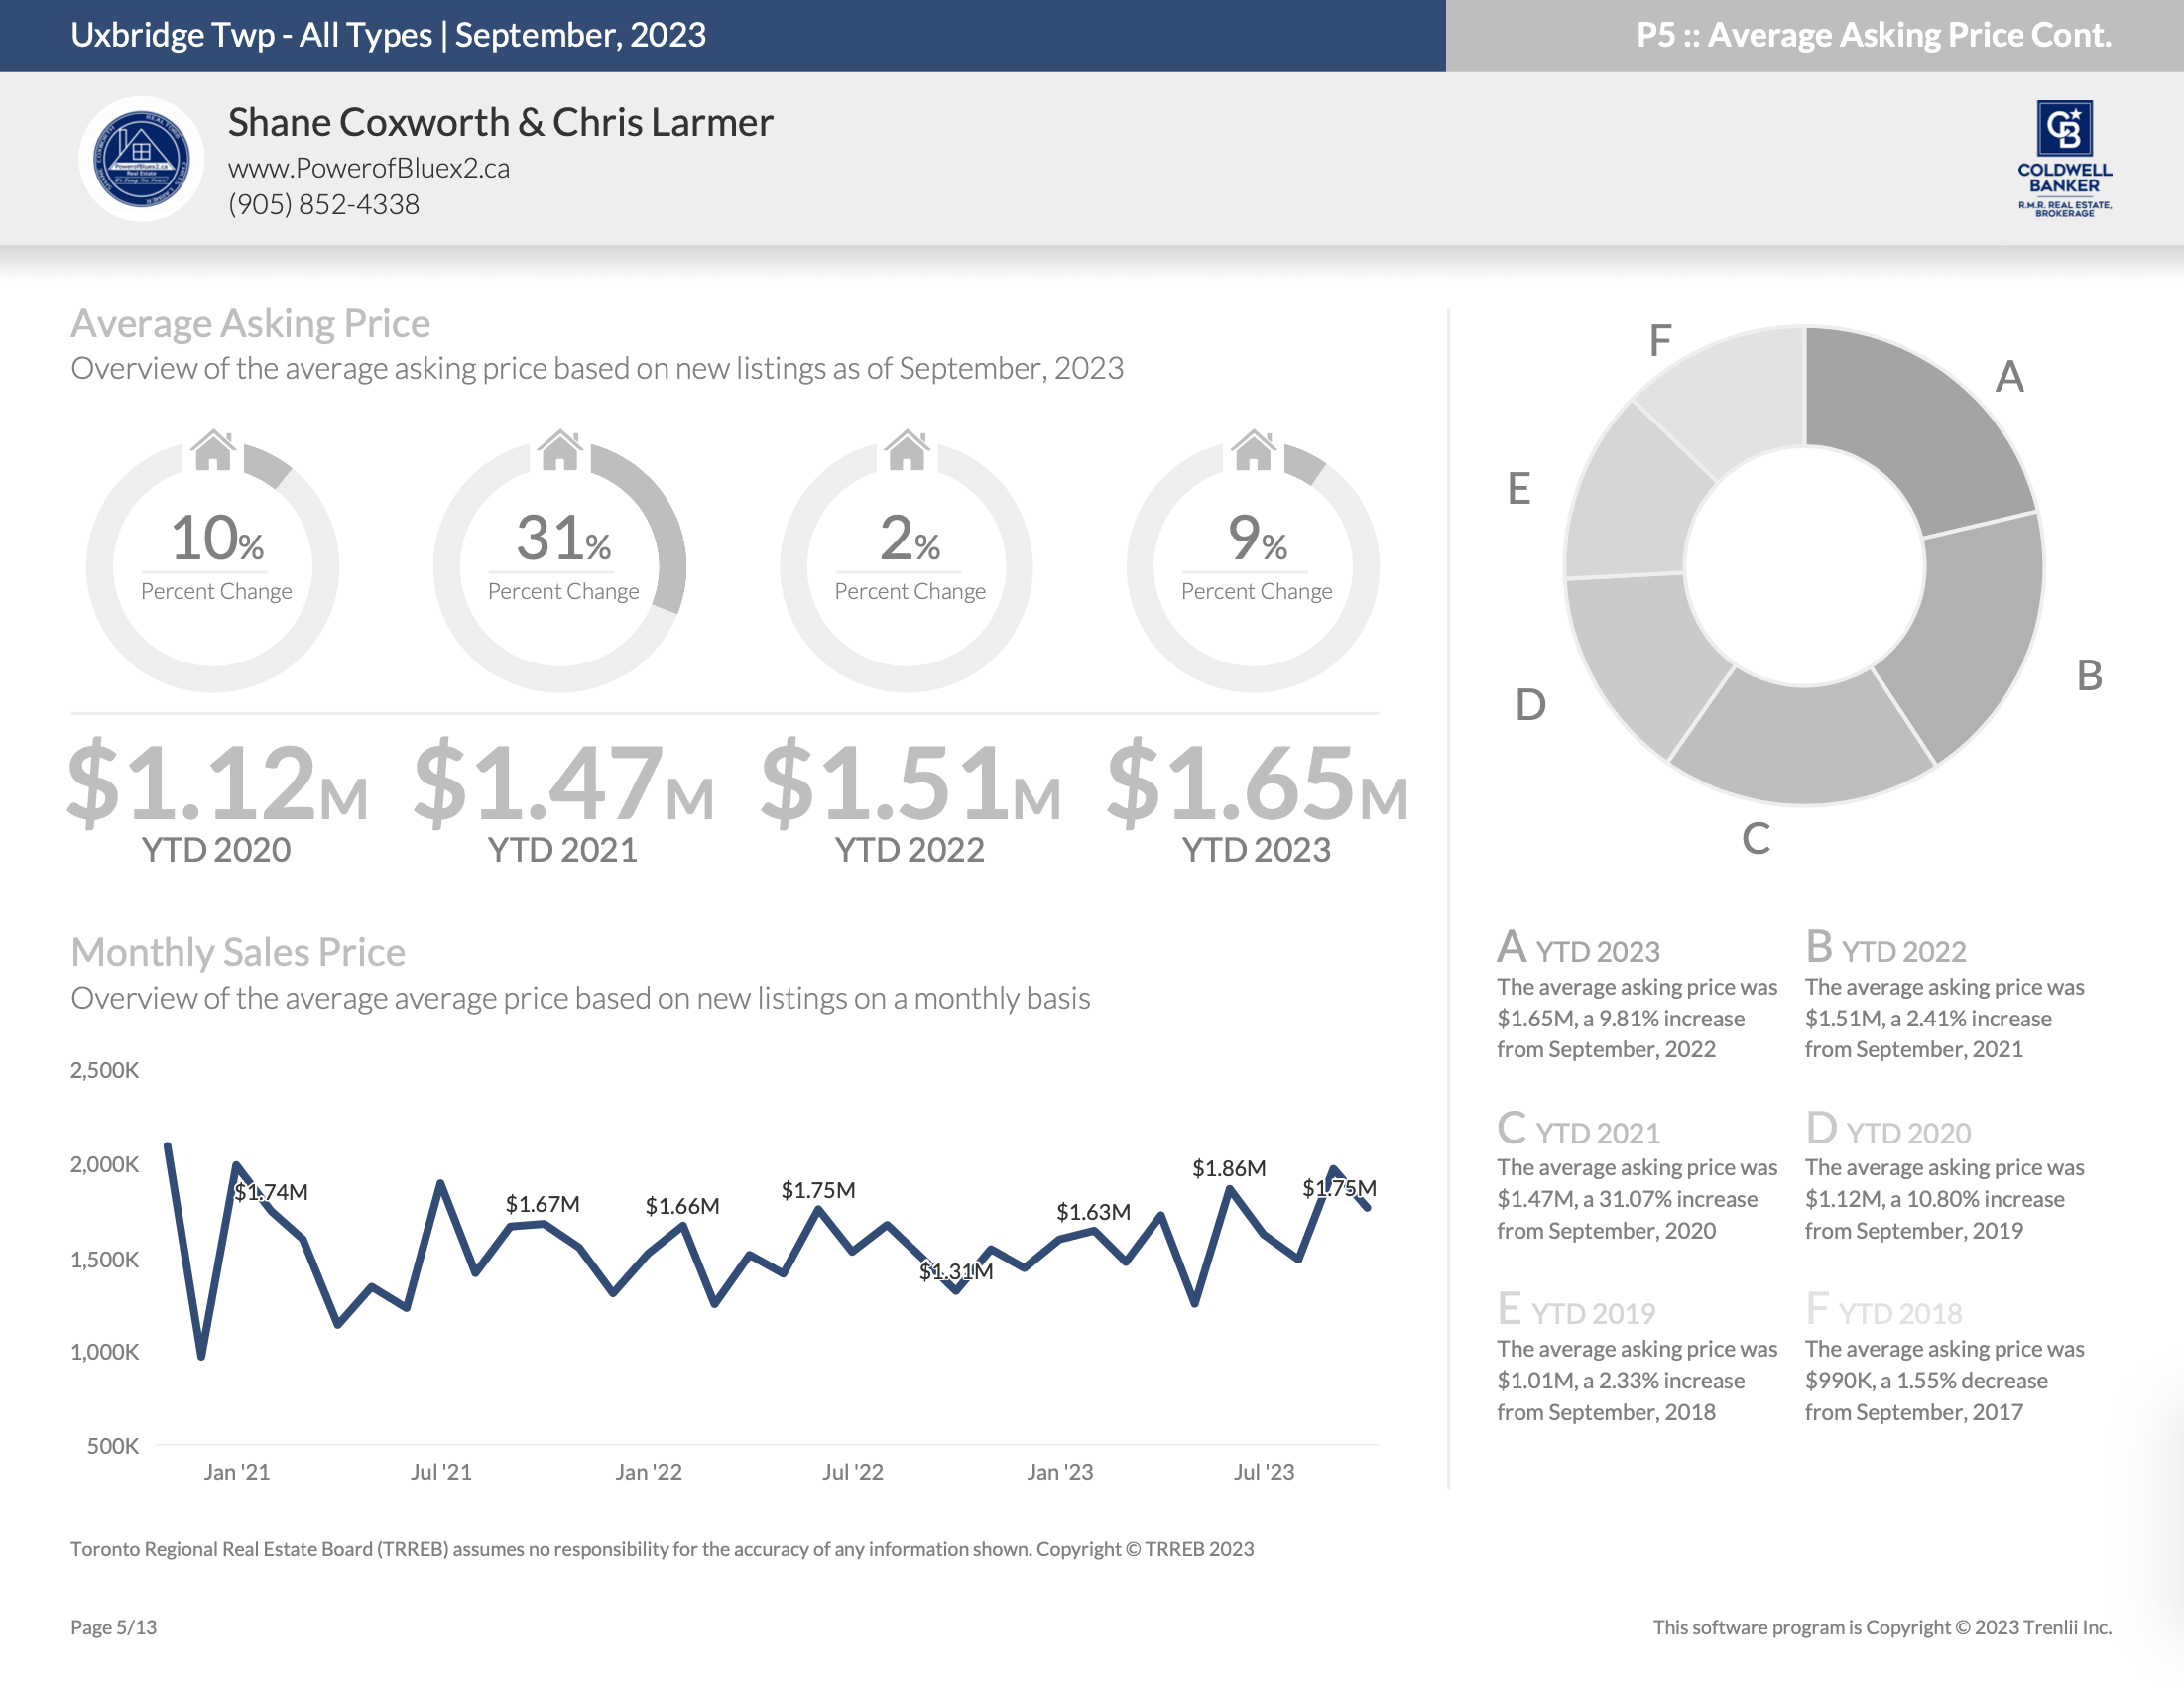
Average Asking Price – September 2023
Average Asking Price – Year-to-Date
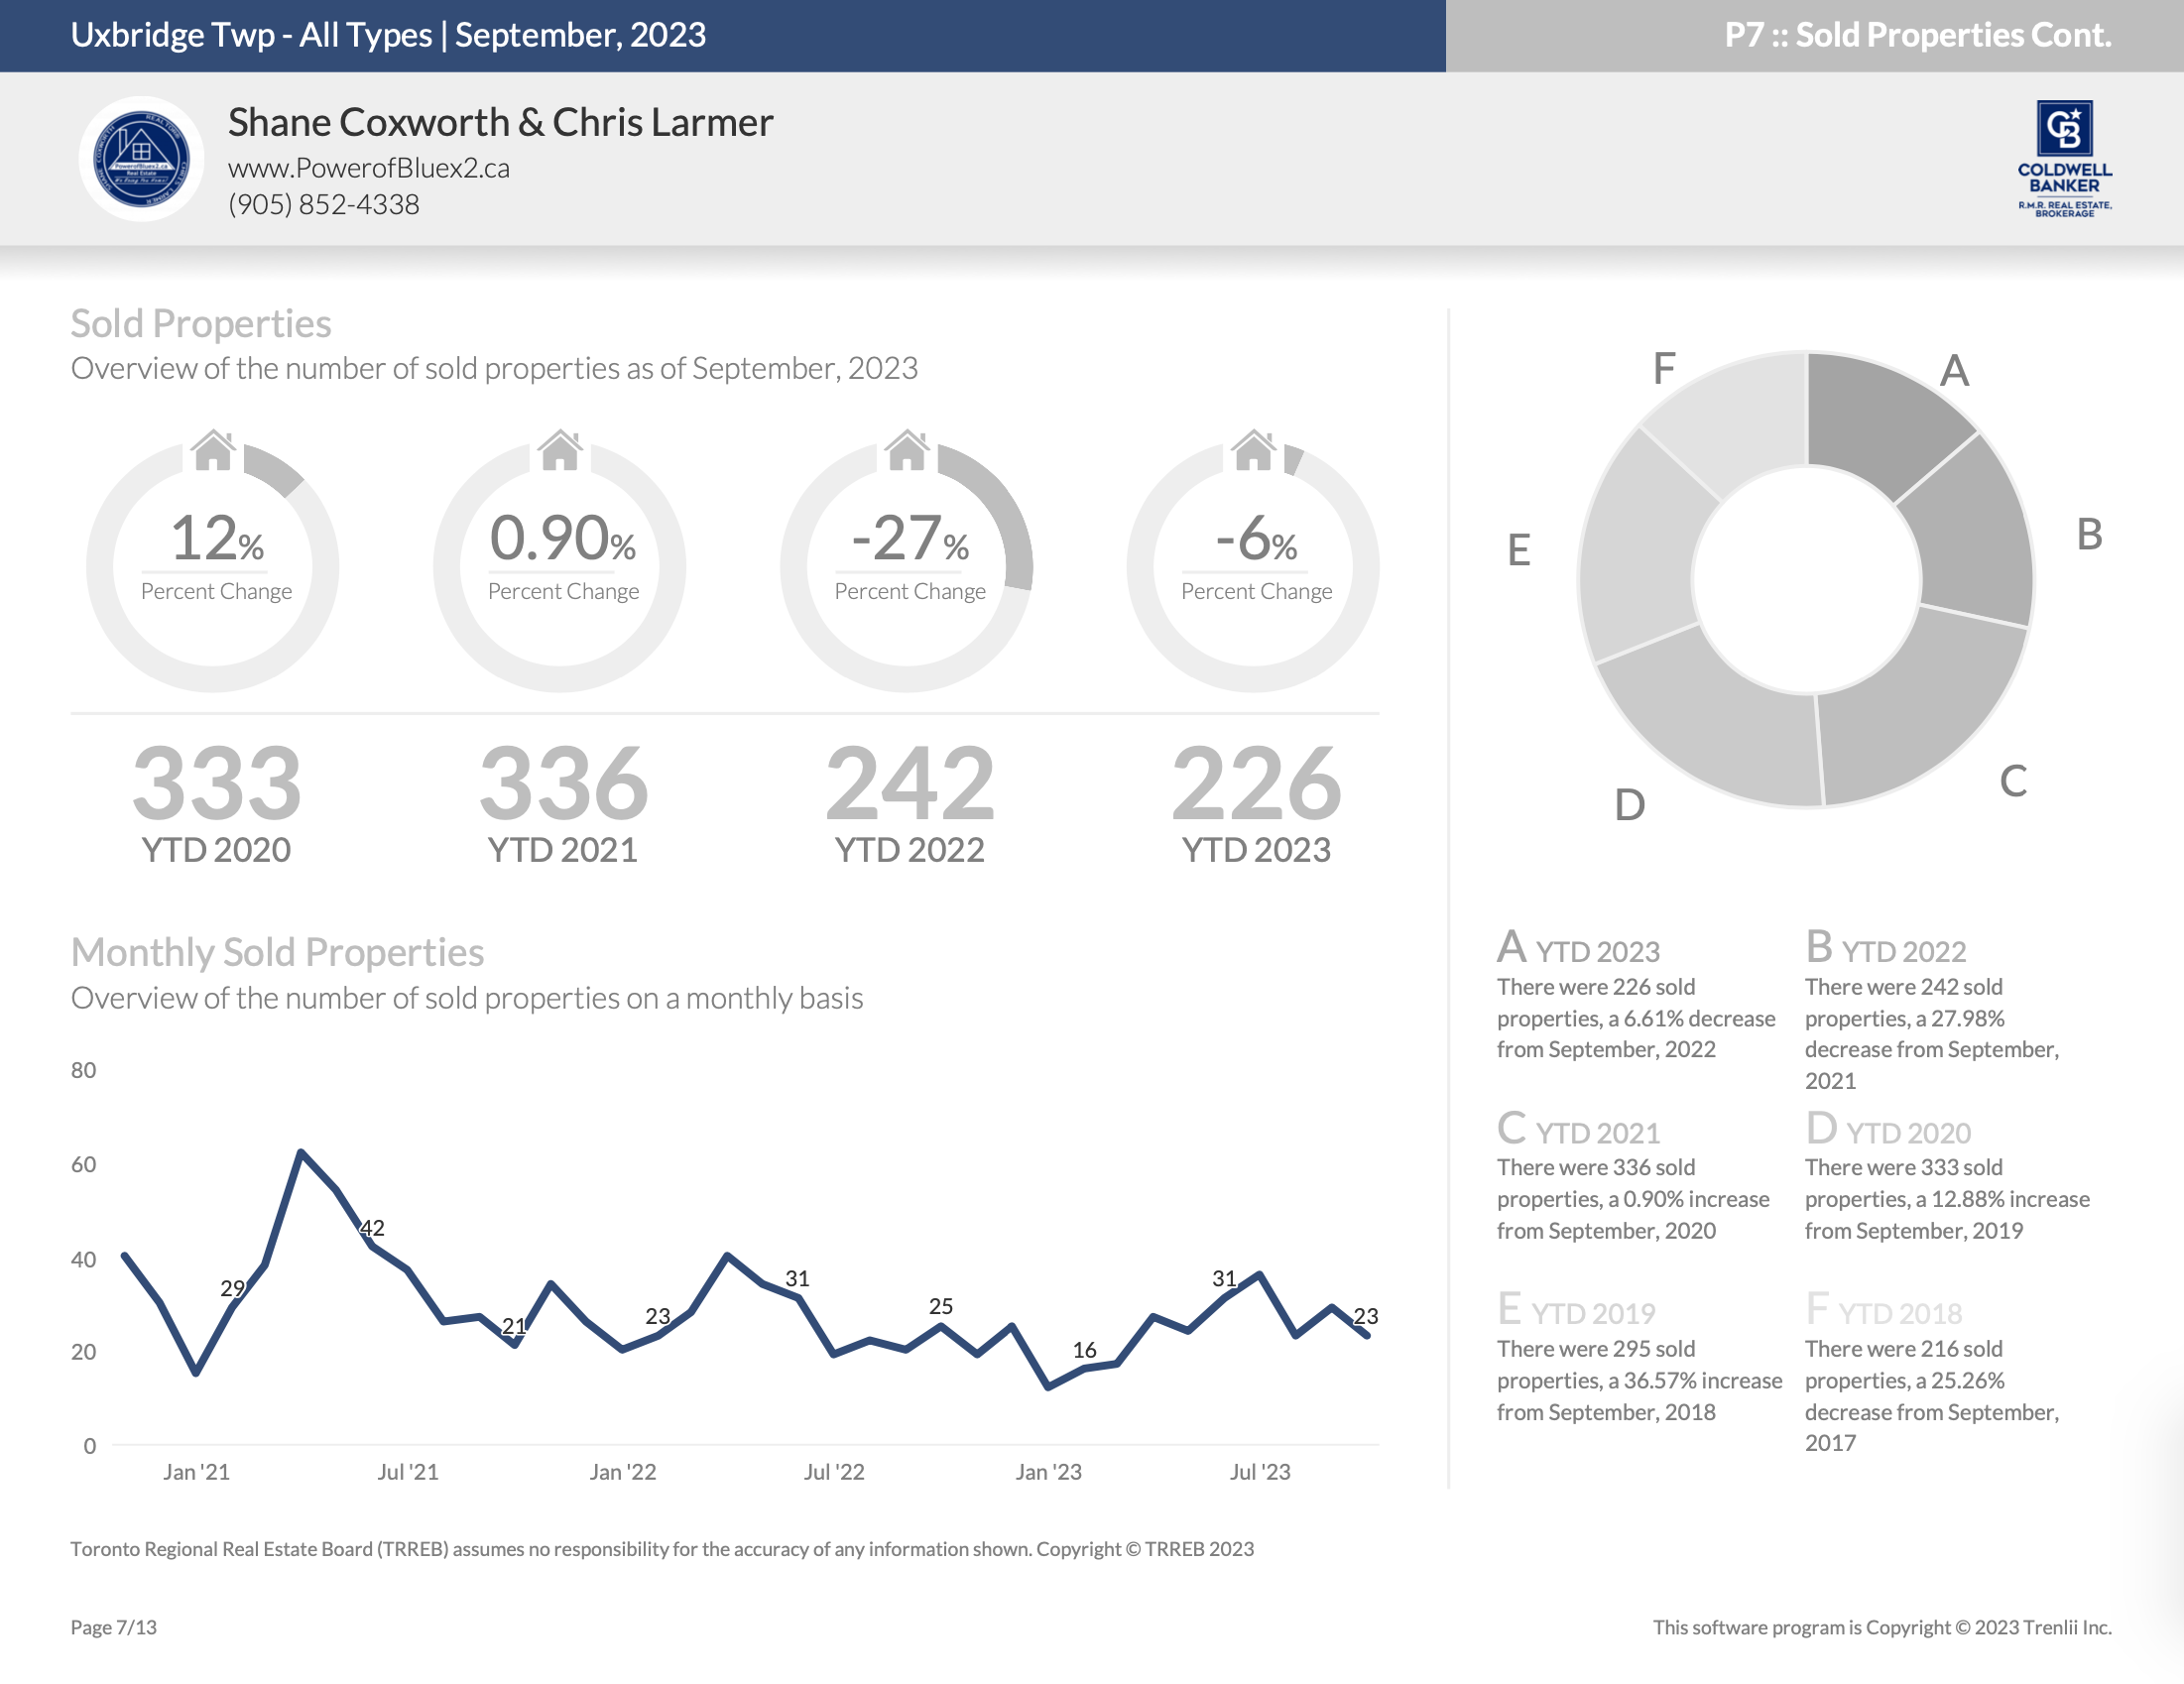
Number of Properties Sold – September 2023
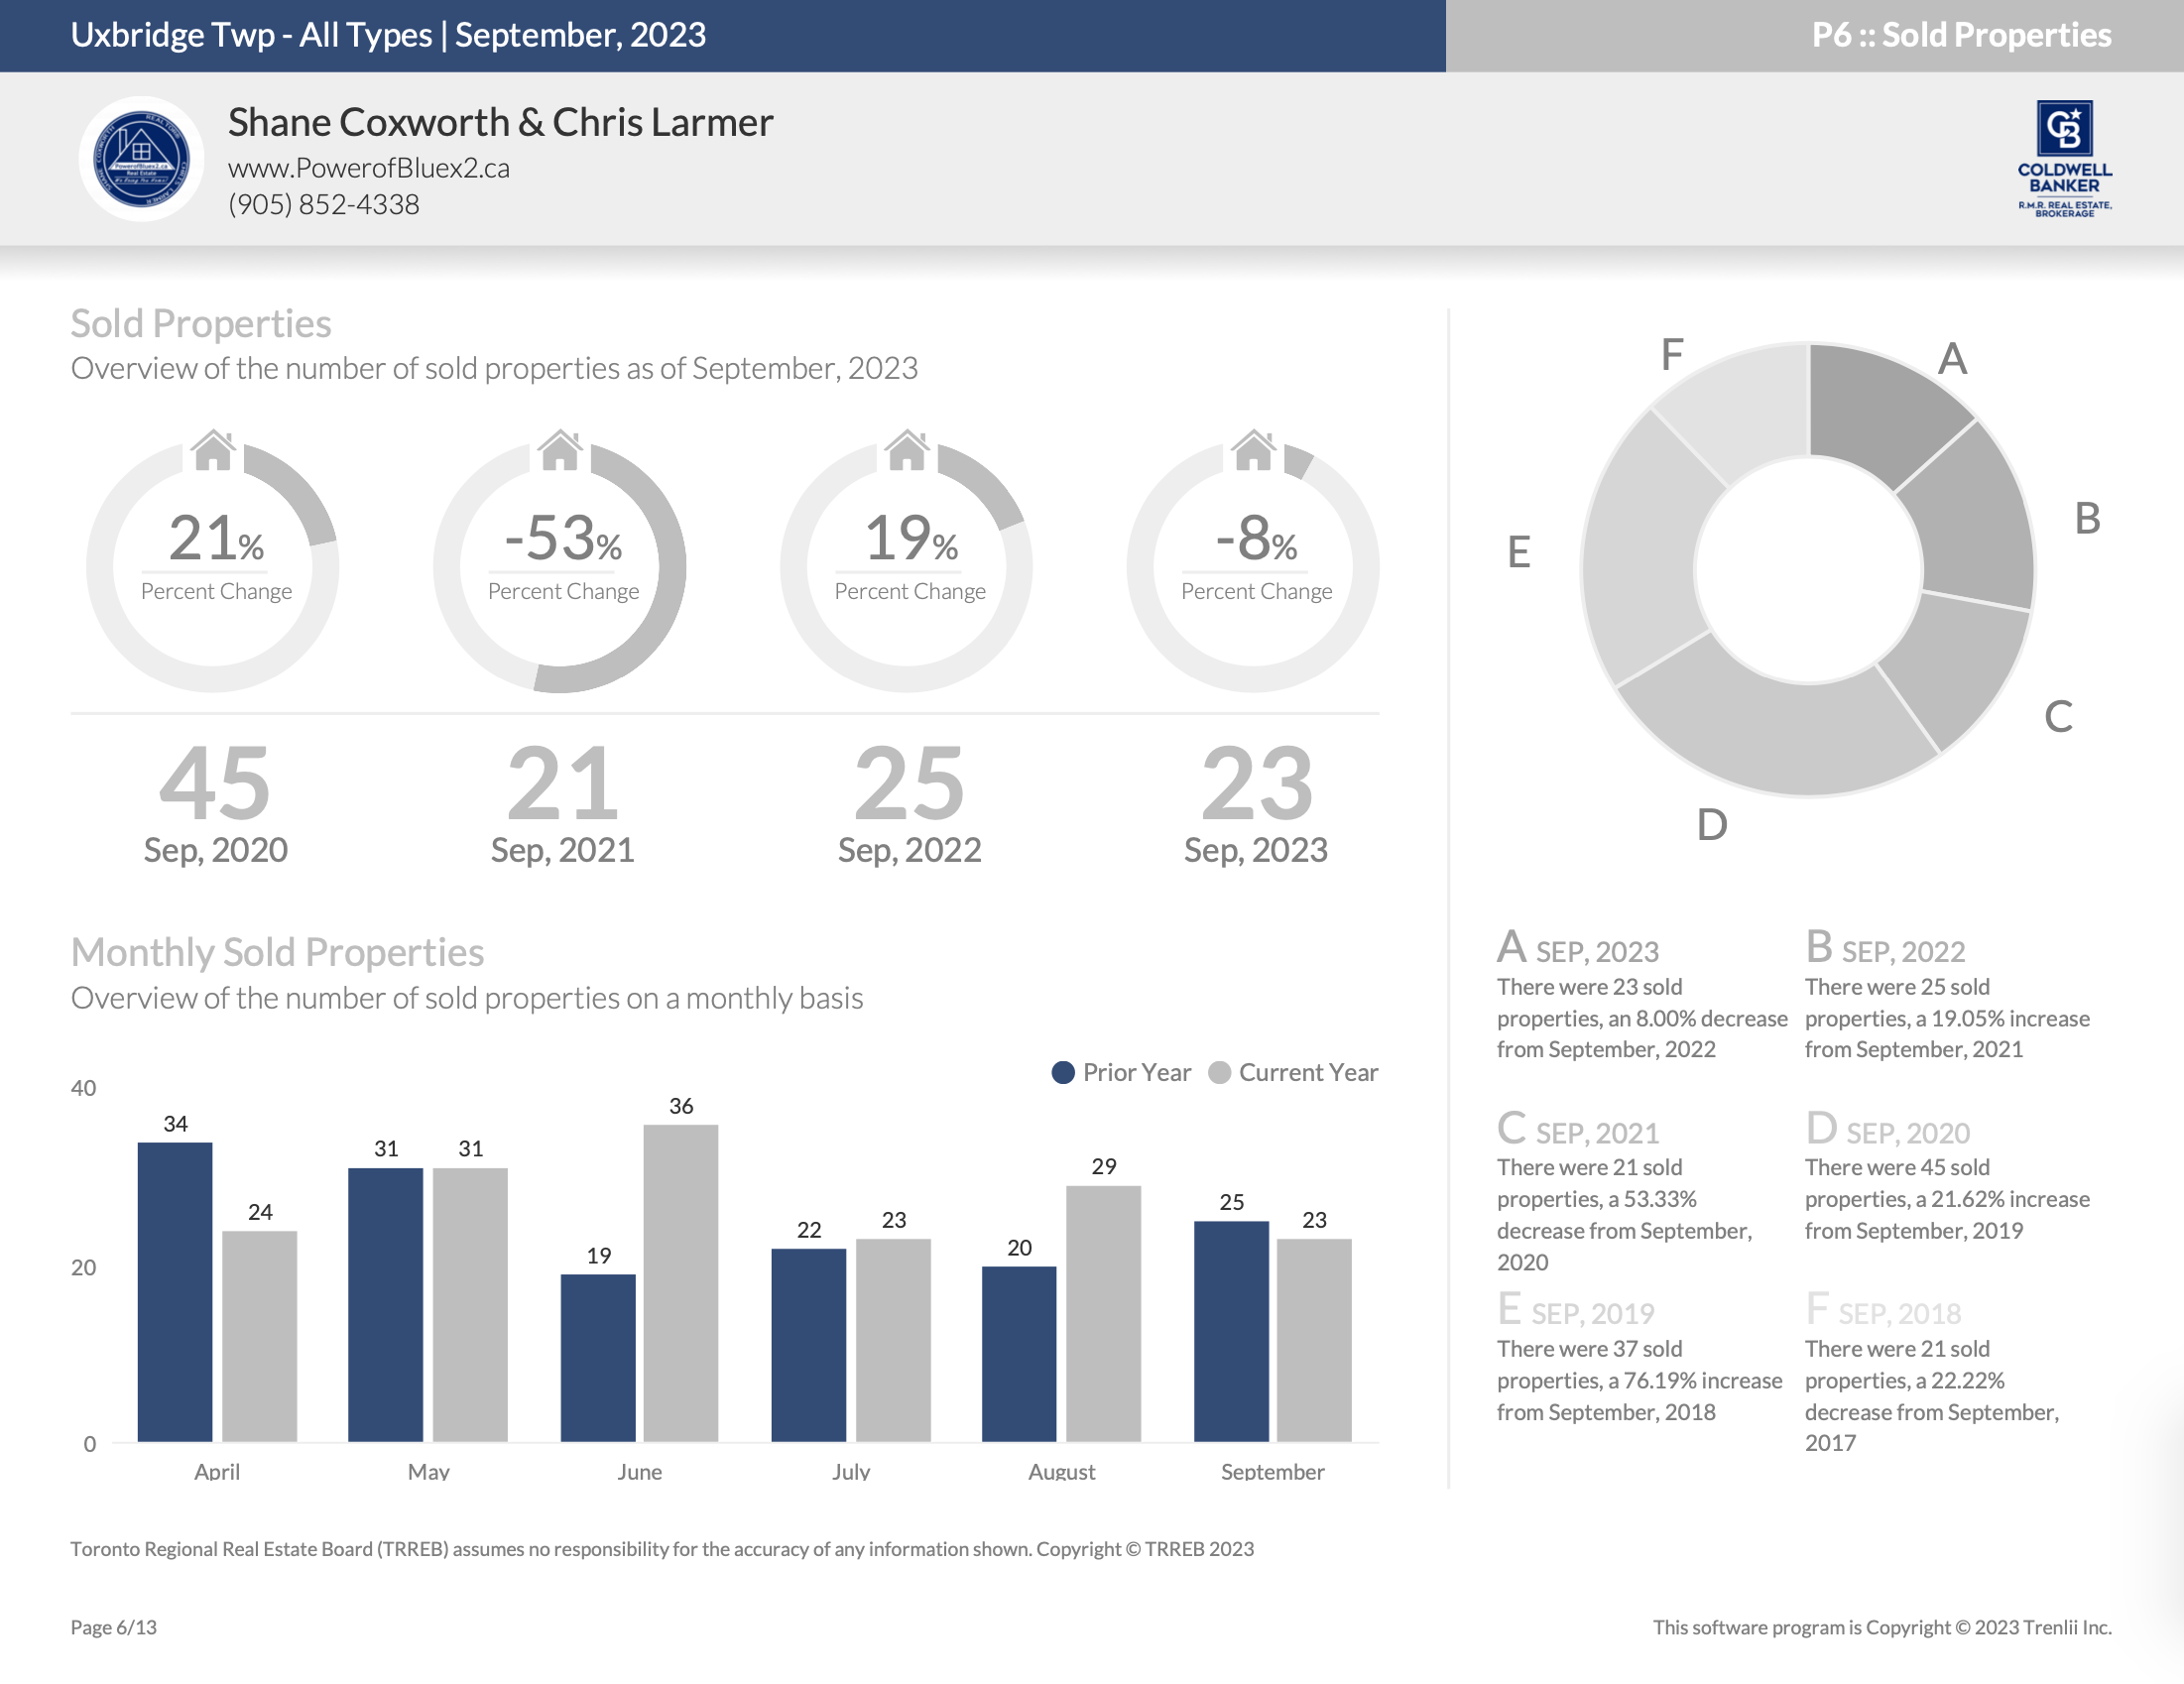
Number of Properties Sold – Year-to-Date
Average Sold Price – September 2023
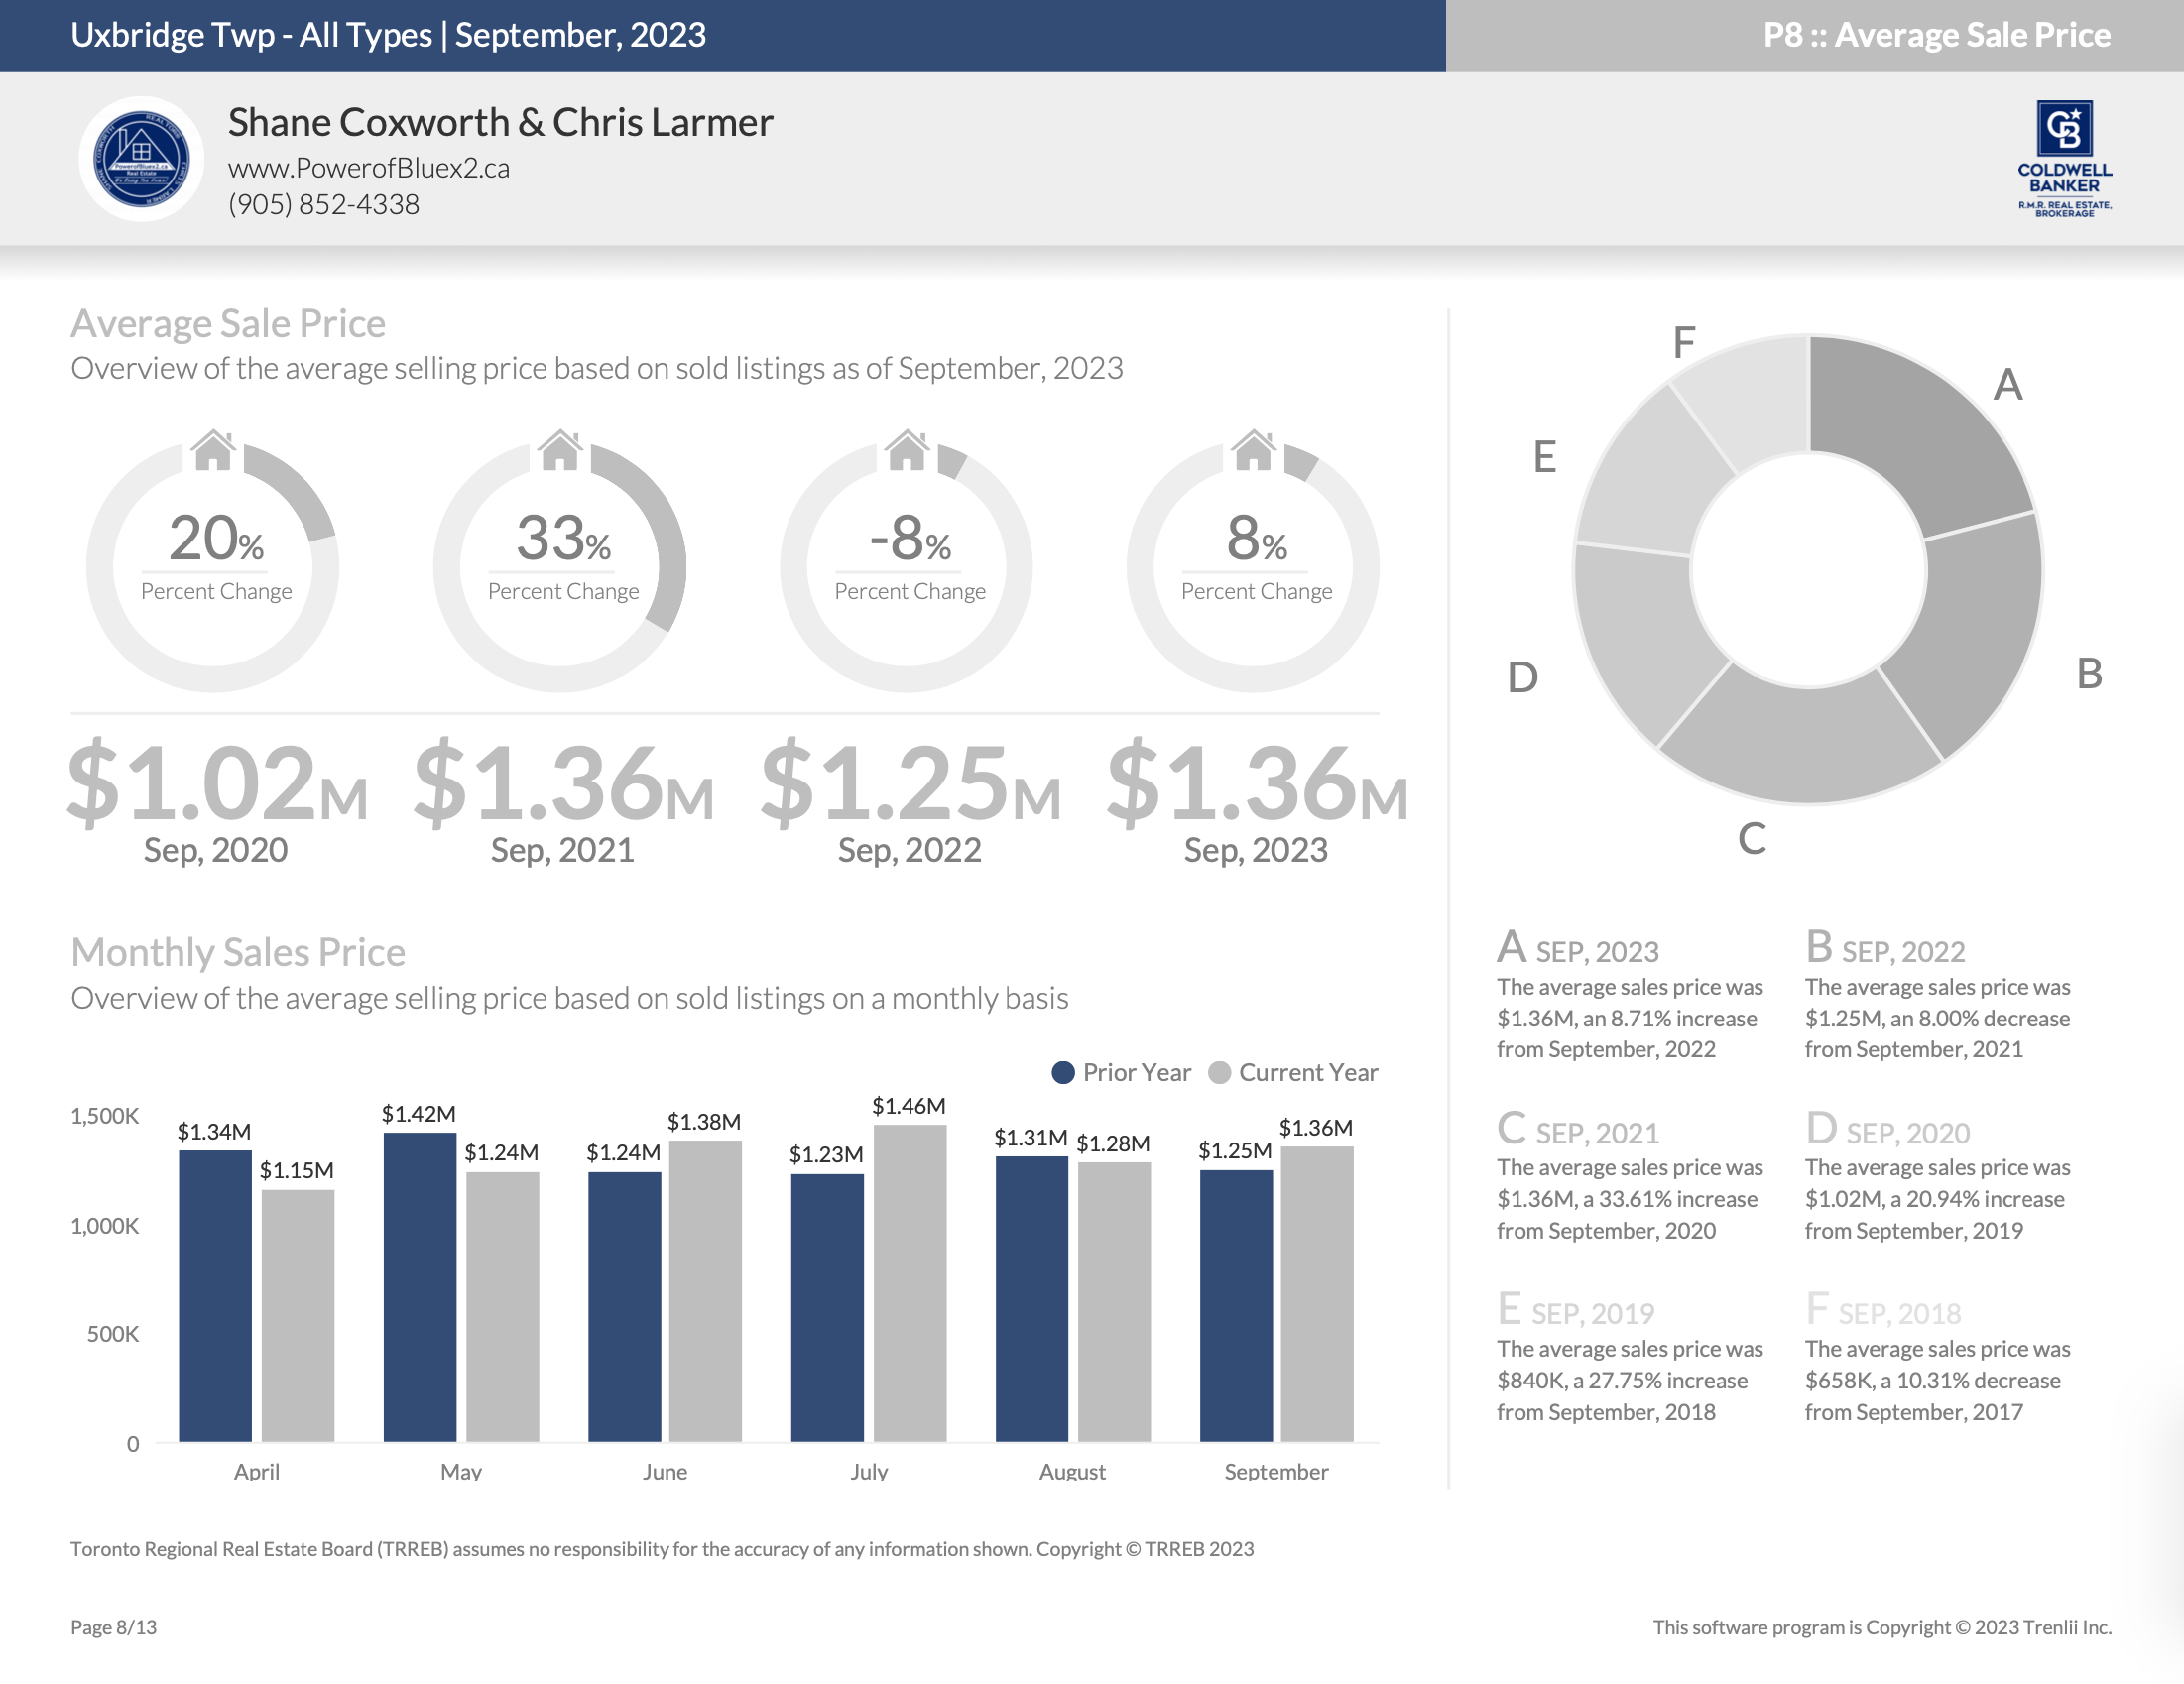
Average Sold Price – Year-to-Date
Days on Market – September 2023
Days on Market – Year-to-Date
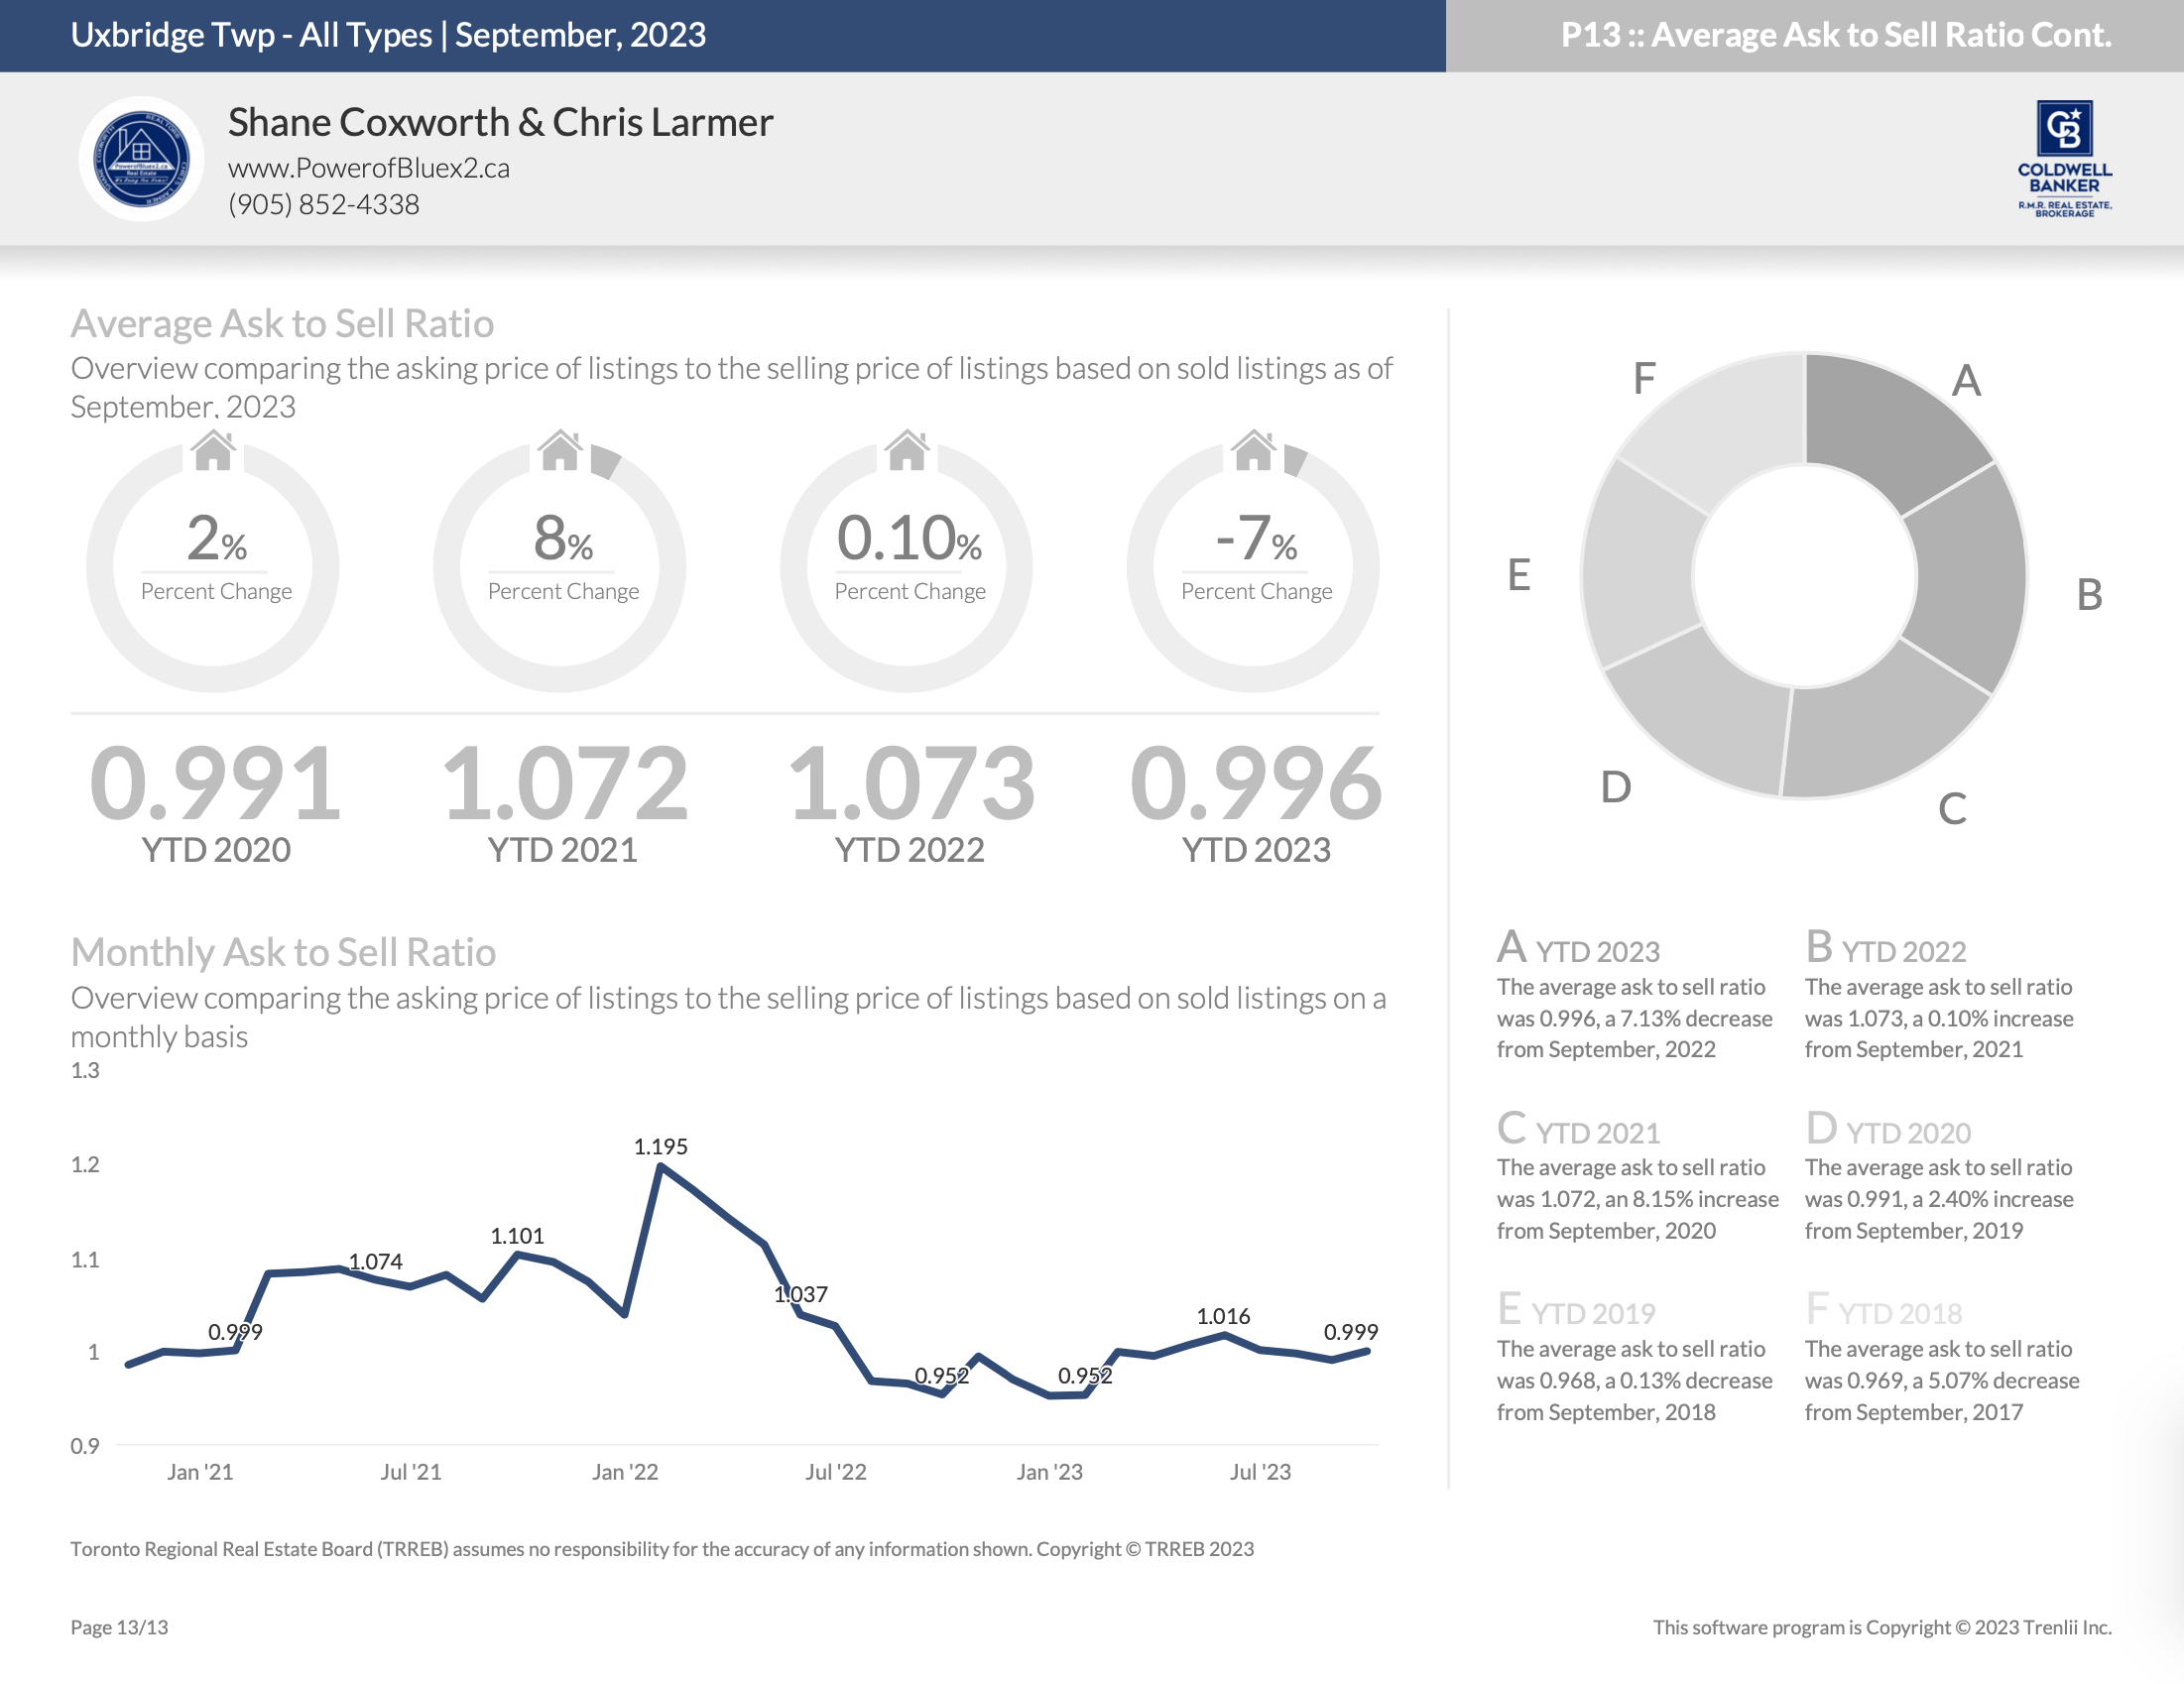
Average List Price to Sell Price Ratio – September 2023
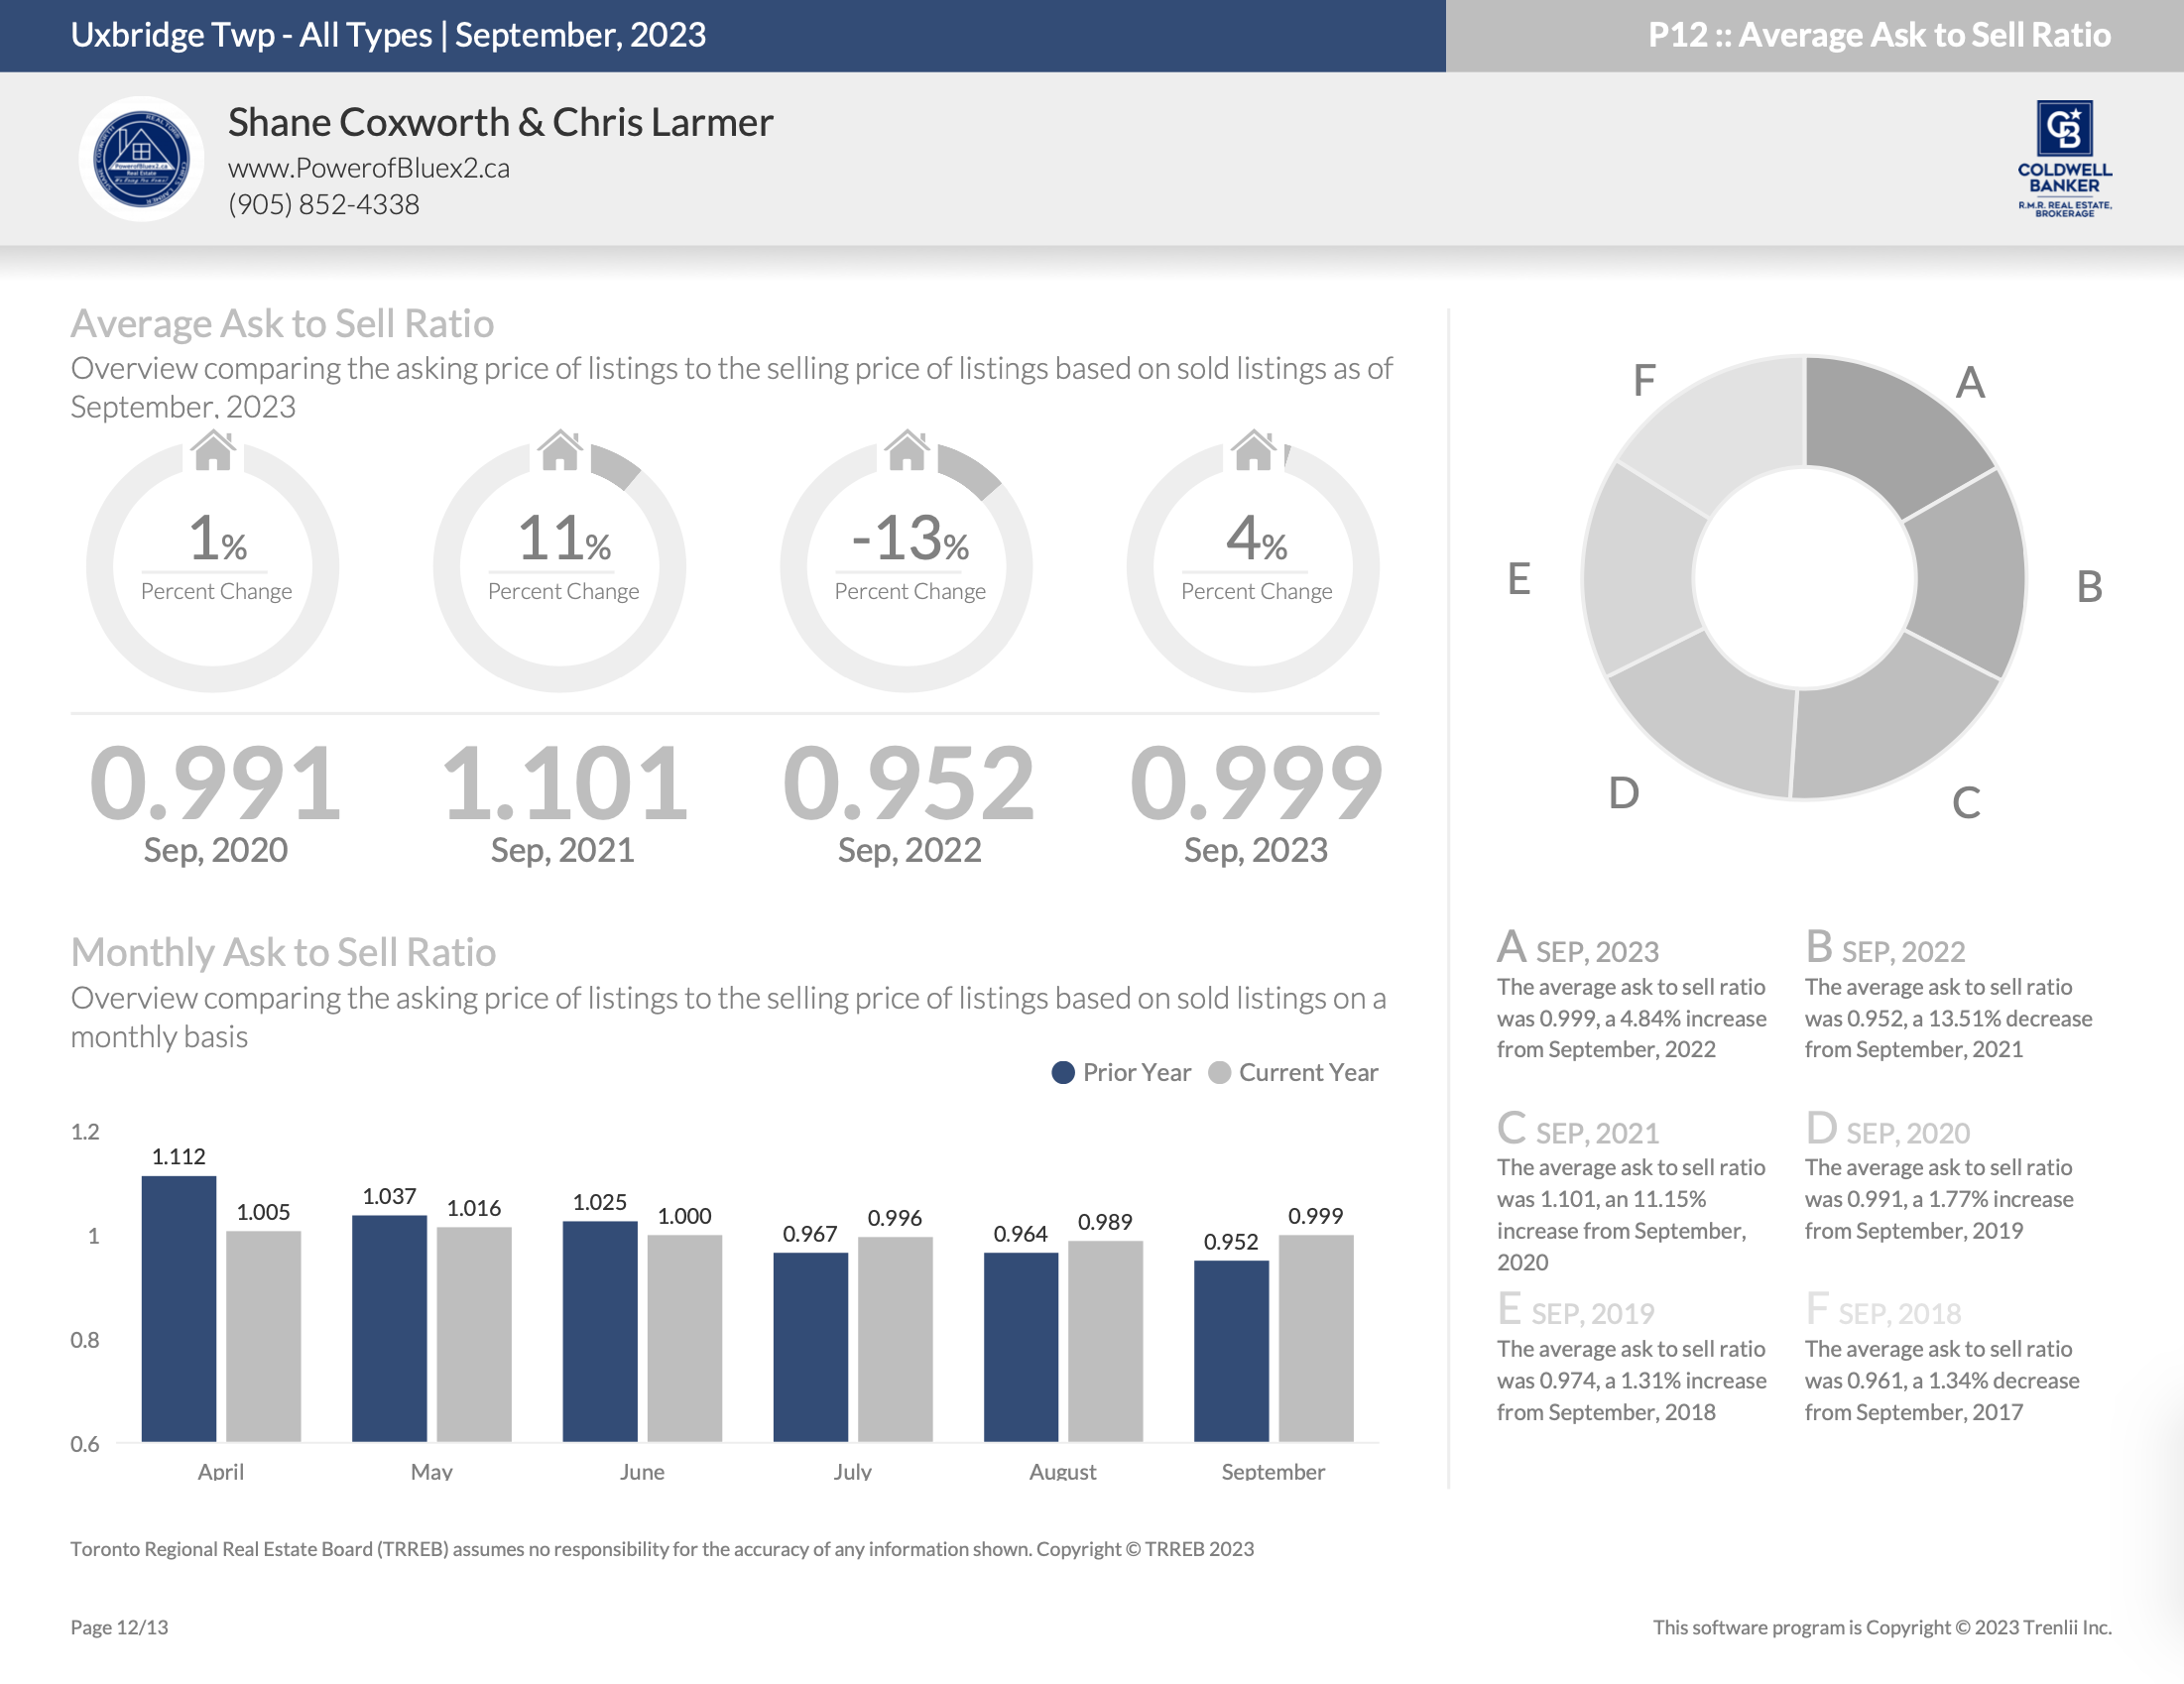
Average List Price to Sell Price Ratio – Year-to-Date
*Information is believed to be accurate at time of posting but is not guaranteed to be correct
Not intended as a solicitation if your property is already listed by another broker. Affiliated real estate agents are independent contractor sales associates, not employees. ©2021 Coldwell Banker. All Rights Reserved. Coldwell Banker and the Coldwell Banker logos are trademarks of Coldwell Banker Real Estate LLC. The Coldwell Banker® System is comprised of company owned offices which are owned by a subsidiary of Realogy Brokerage Group LLC and franchised offices which are independently owned and operated. The Coldwell Banker System fully supports the principles of the Fair Housing Act and the Equal Opportunity Act.
Click below for more reports


