
 Facebook
 X
X
 Pinterest
 Copy Link
Kawartha Lakes Housing October 2023
Kawartha Lakes Housing October 2023
![]()
Housing Market Report for October 2023
Here is the Kawartha Lakes Housing October 2023 report (all housing types), with reports from the Canadian Real Estate Association, Toronto Regional Real Estate Board included.
This housing report for Kawartha Lakes includes the number of new listings, average list price, number of properties sold, average selling price, average days on market and average asking price to selling price ratio for all property types within the Kawartha Lakes.
Scroll to the bottom for links to take you to the housing market reports for Durham, Uxbridge, Scugog and Brock.
![]()
CREA HOUSING MARKET REPORT – NOVEMBER 2023
![]()
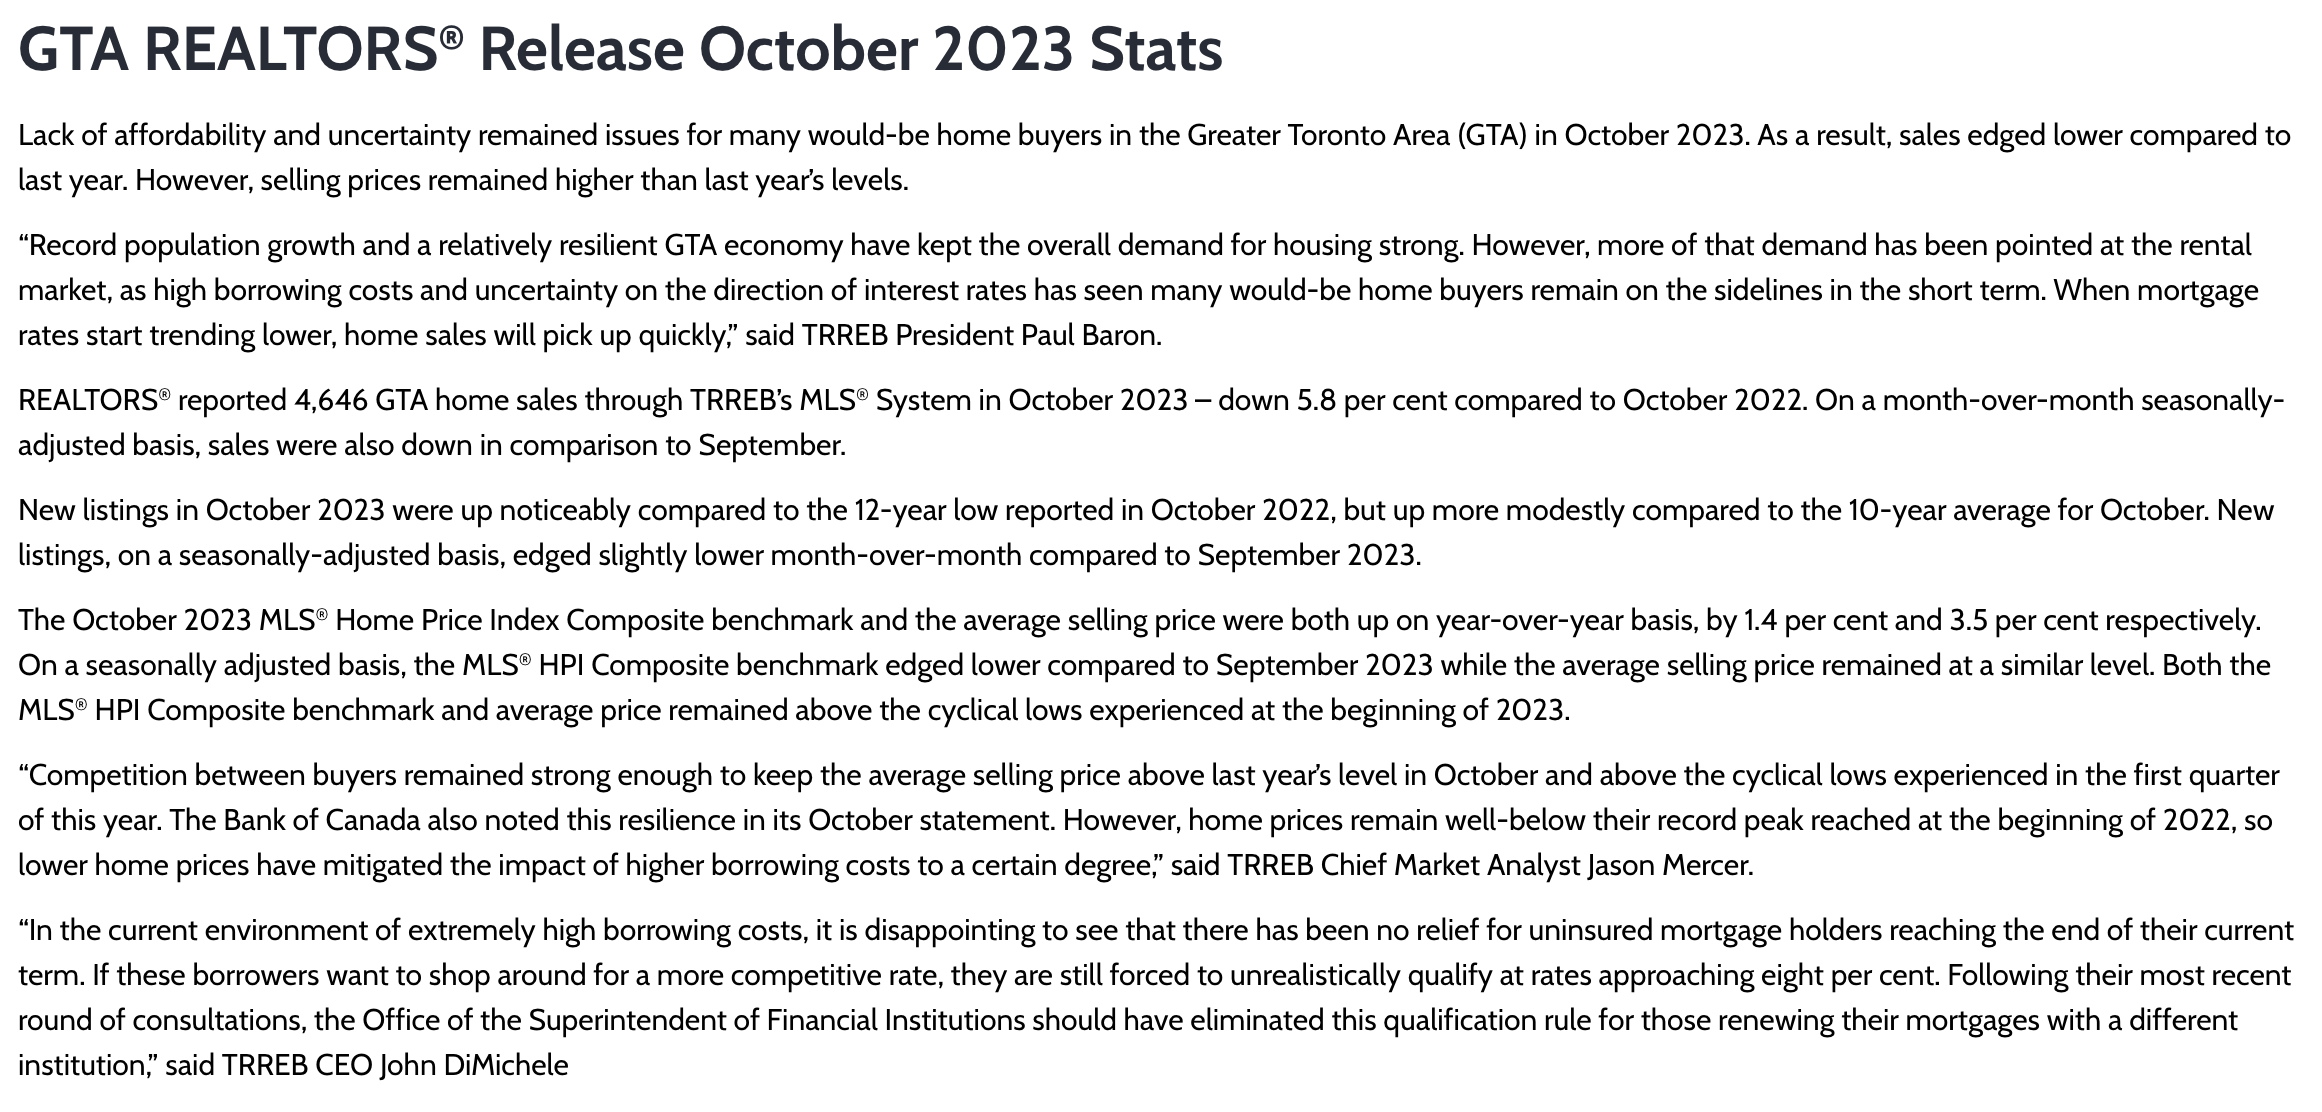
From Toronto Regional Real Estate Board
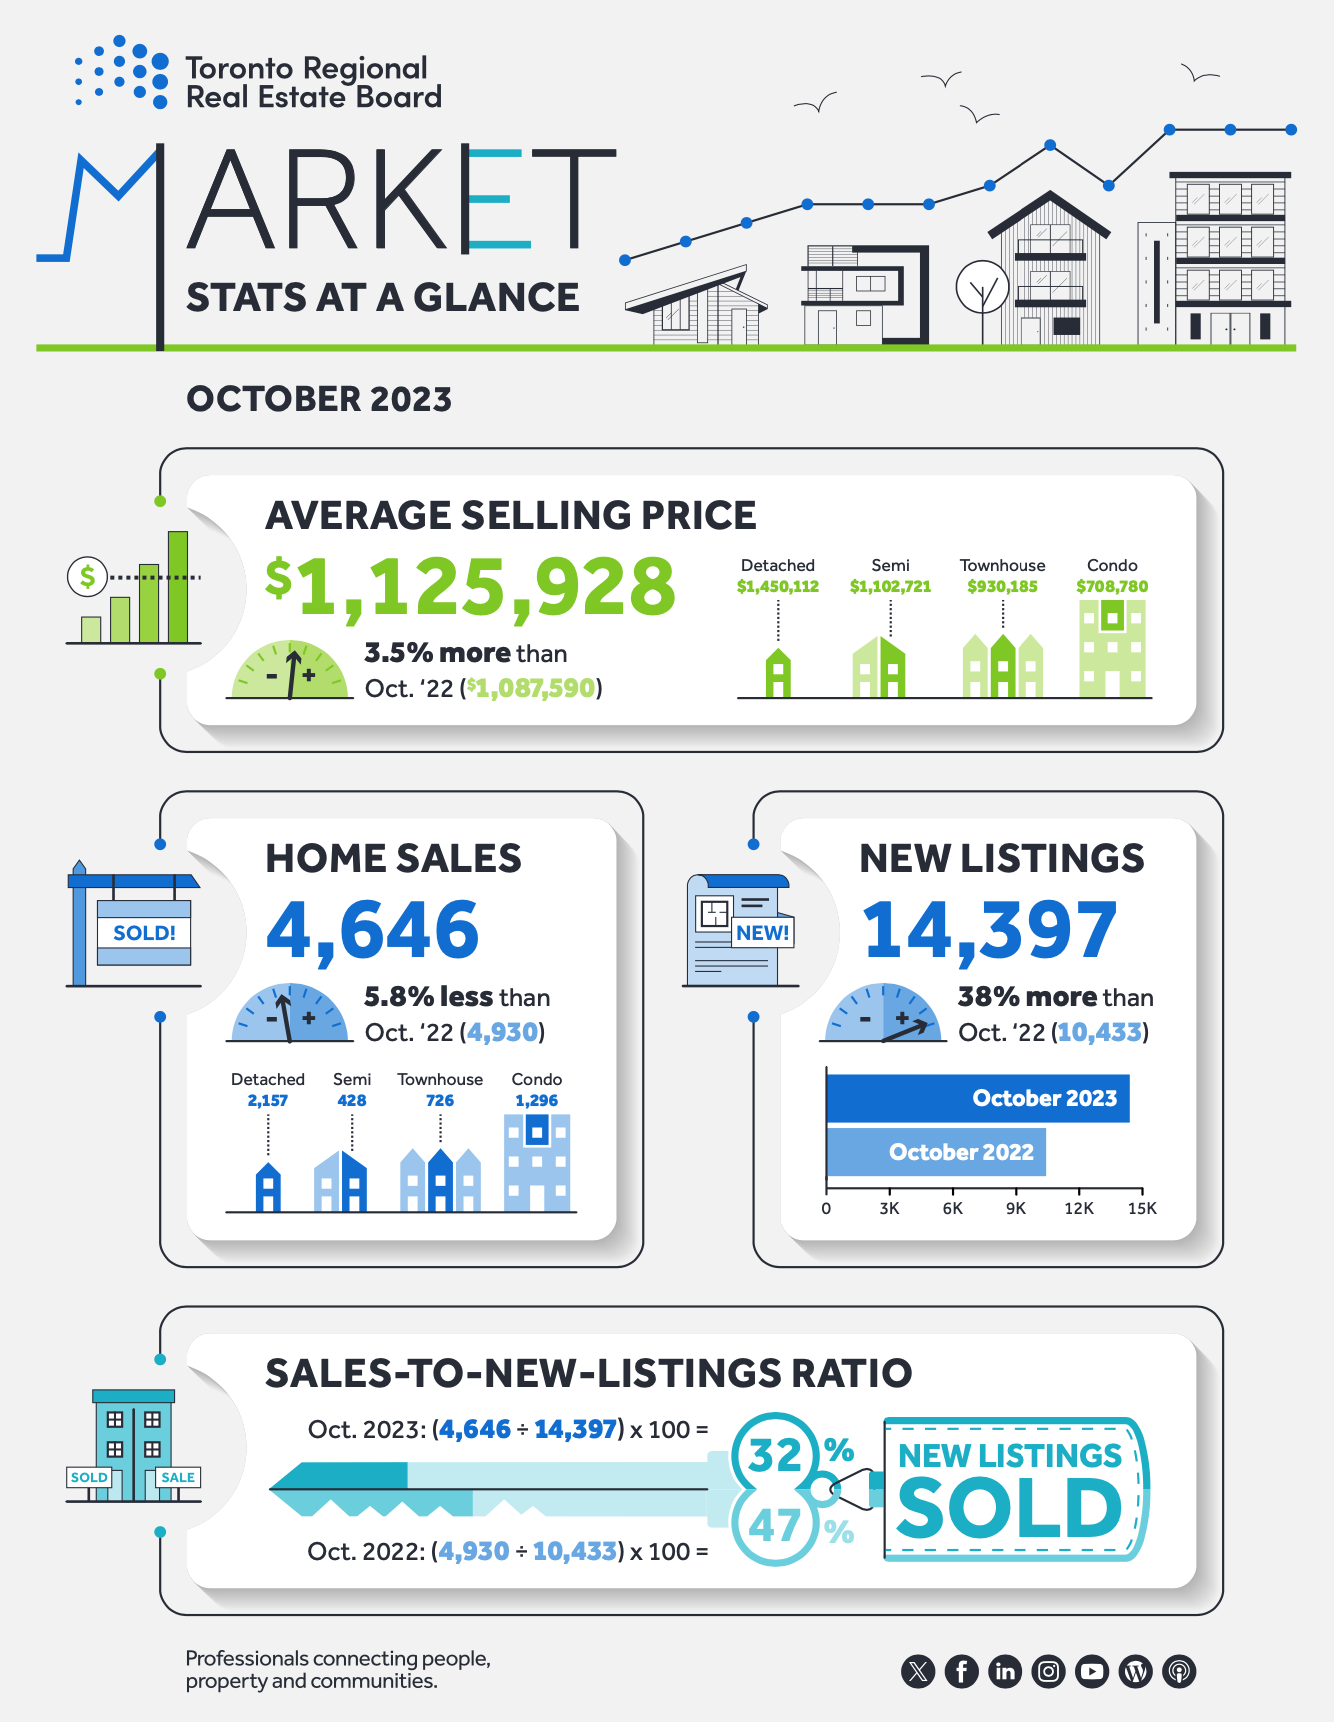
Toronto Regional Real Estate Board – Market Stats At A Glance – October 2023
Read the Toronto Regional Real Estate Board Market Watch Report
![]()
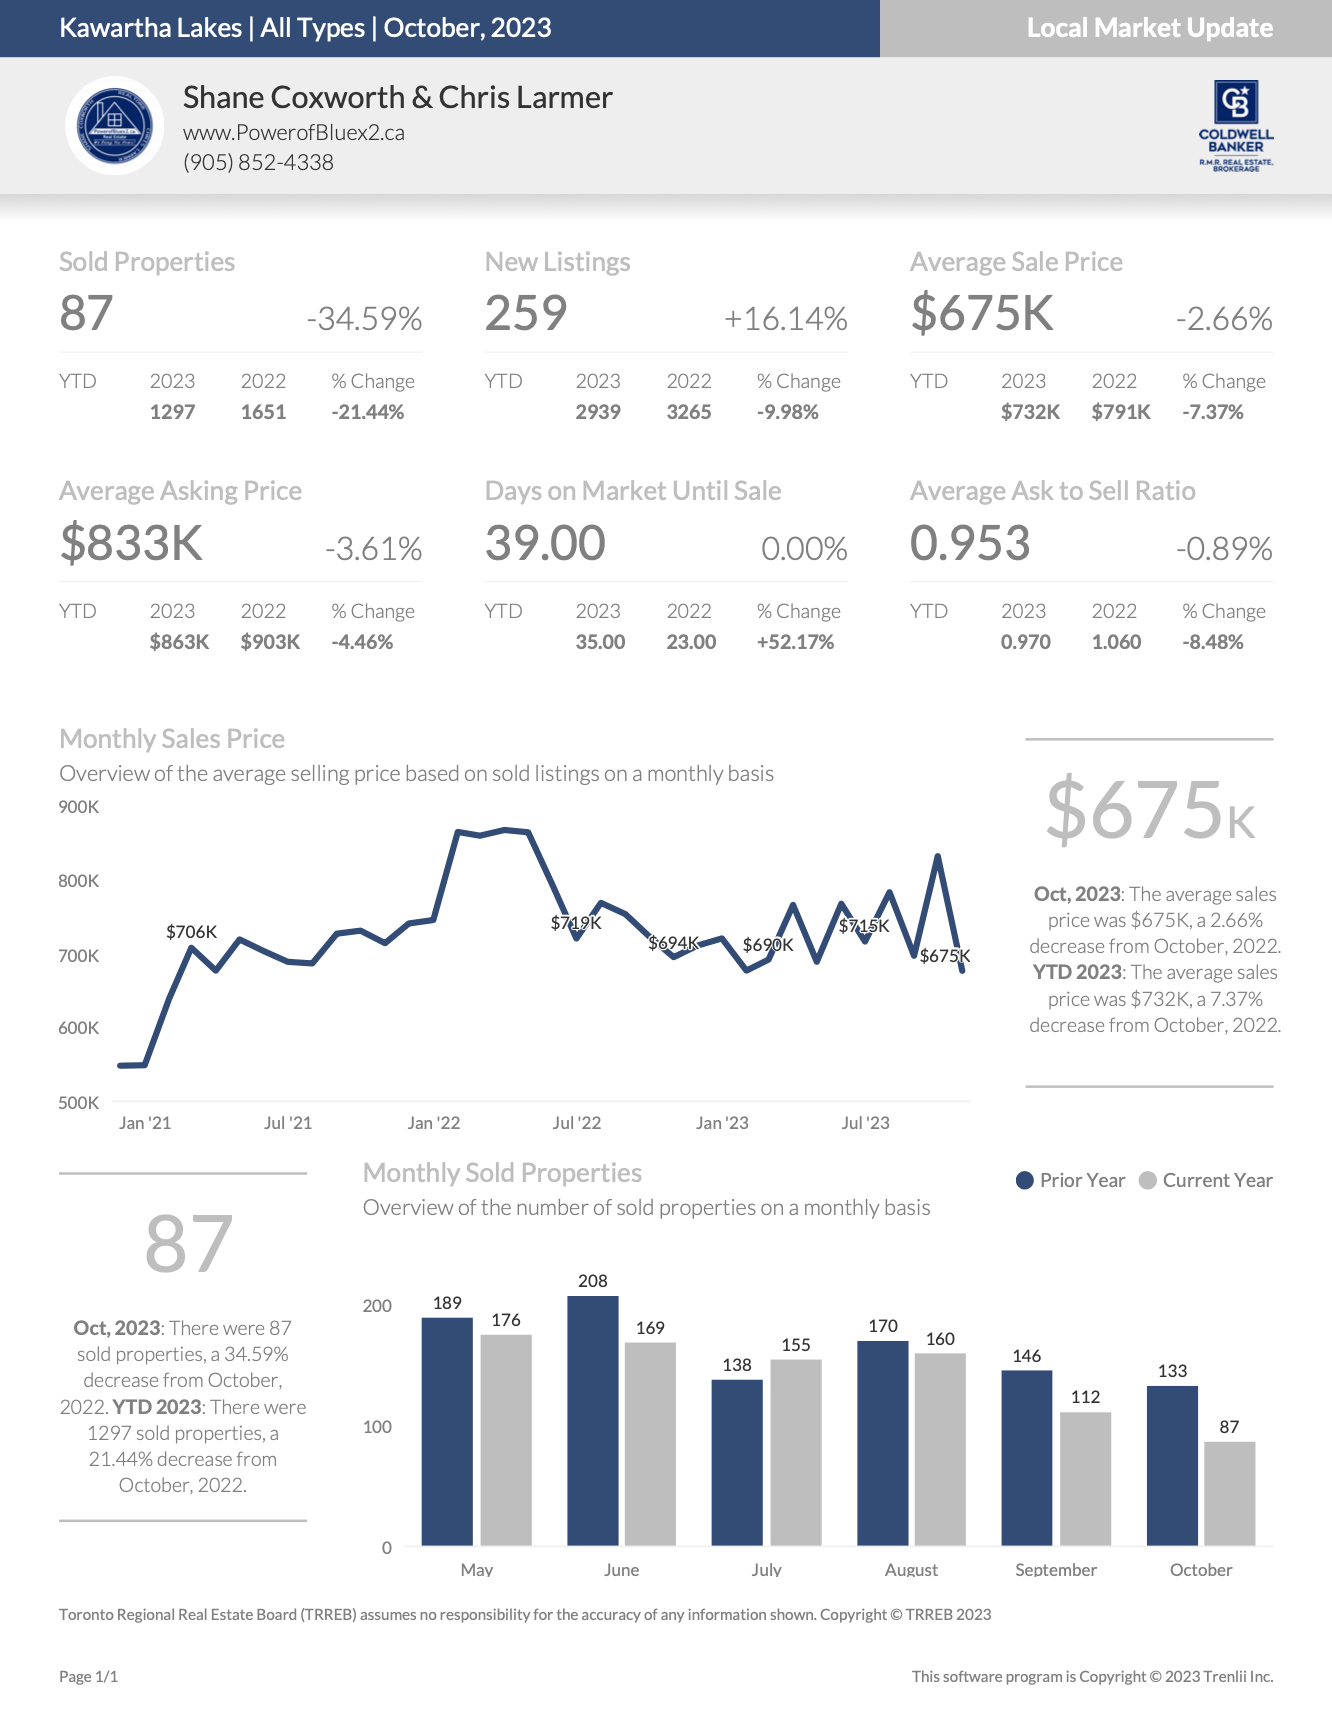
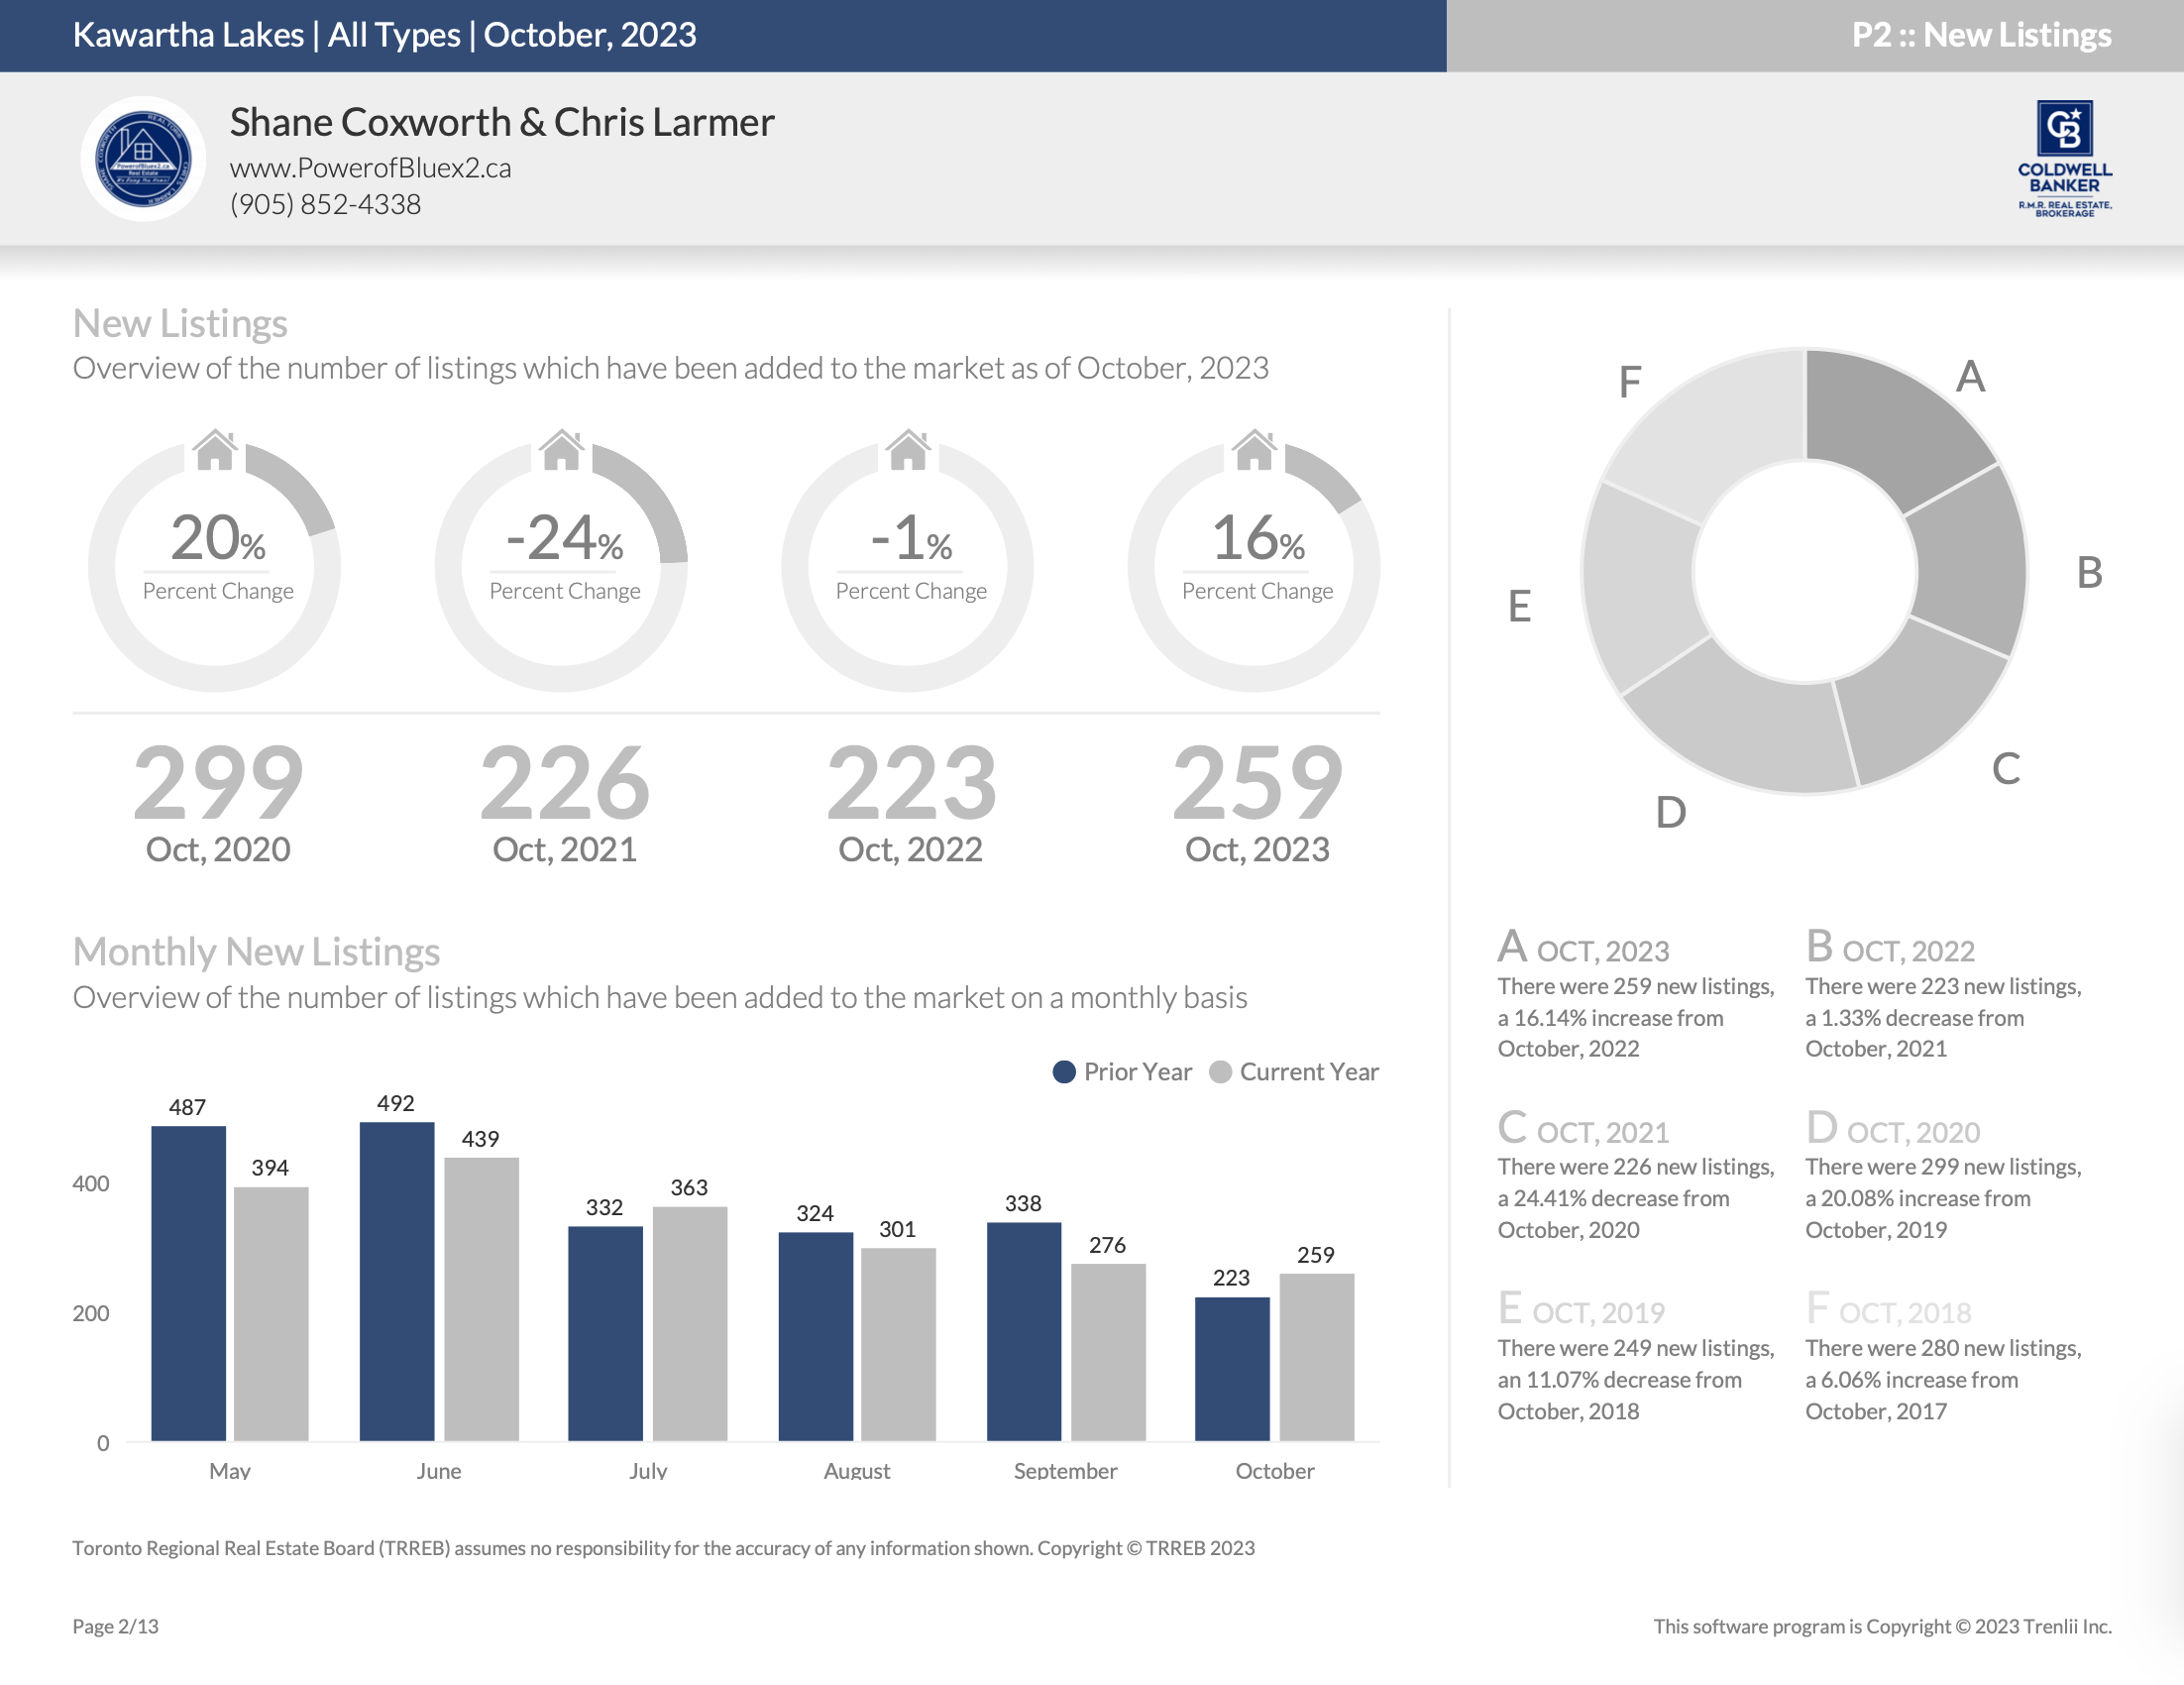
Kawartha Lakes Full Report
*Some values may vary slightly based on the exact date and time the reports were generated.
In October, 2023, we have seen 259 properties listed which has resulted in a 16.14% increase from October, 2022 in which 223 properties were listed; We have seen a year to date volume of 2939 in 2023 and 3265 in 2022 resulting in a 9.98% decrease. We have seen a total volume of 87 sold properties which has resulted in a 34.59% decrease from October, 2022 in which 133 listings were sold; We have seen a year to date volume of 1297 in 2023 and 1651 in 2022 resulting in a 21.44% decrease.
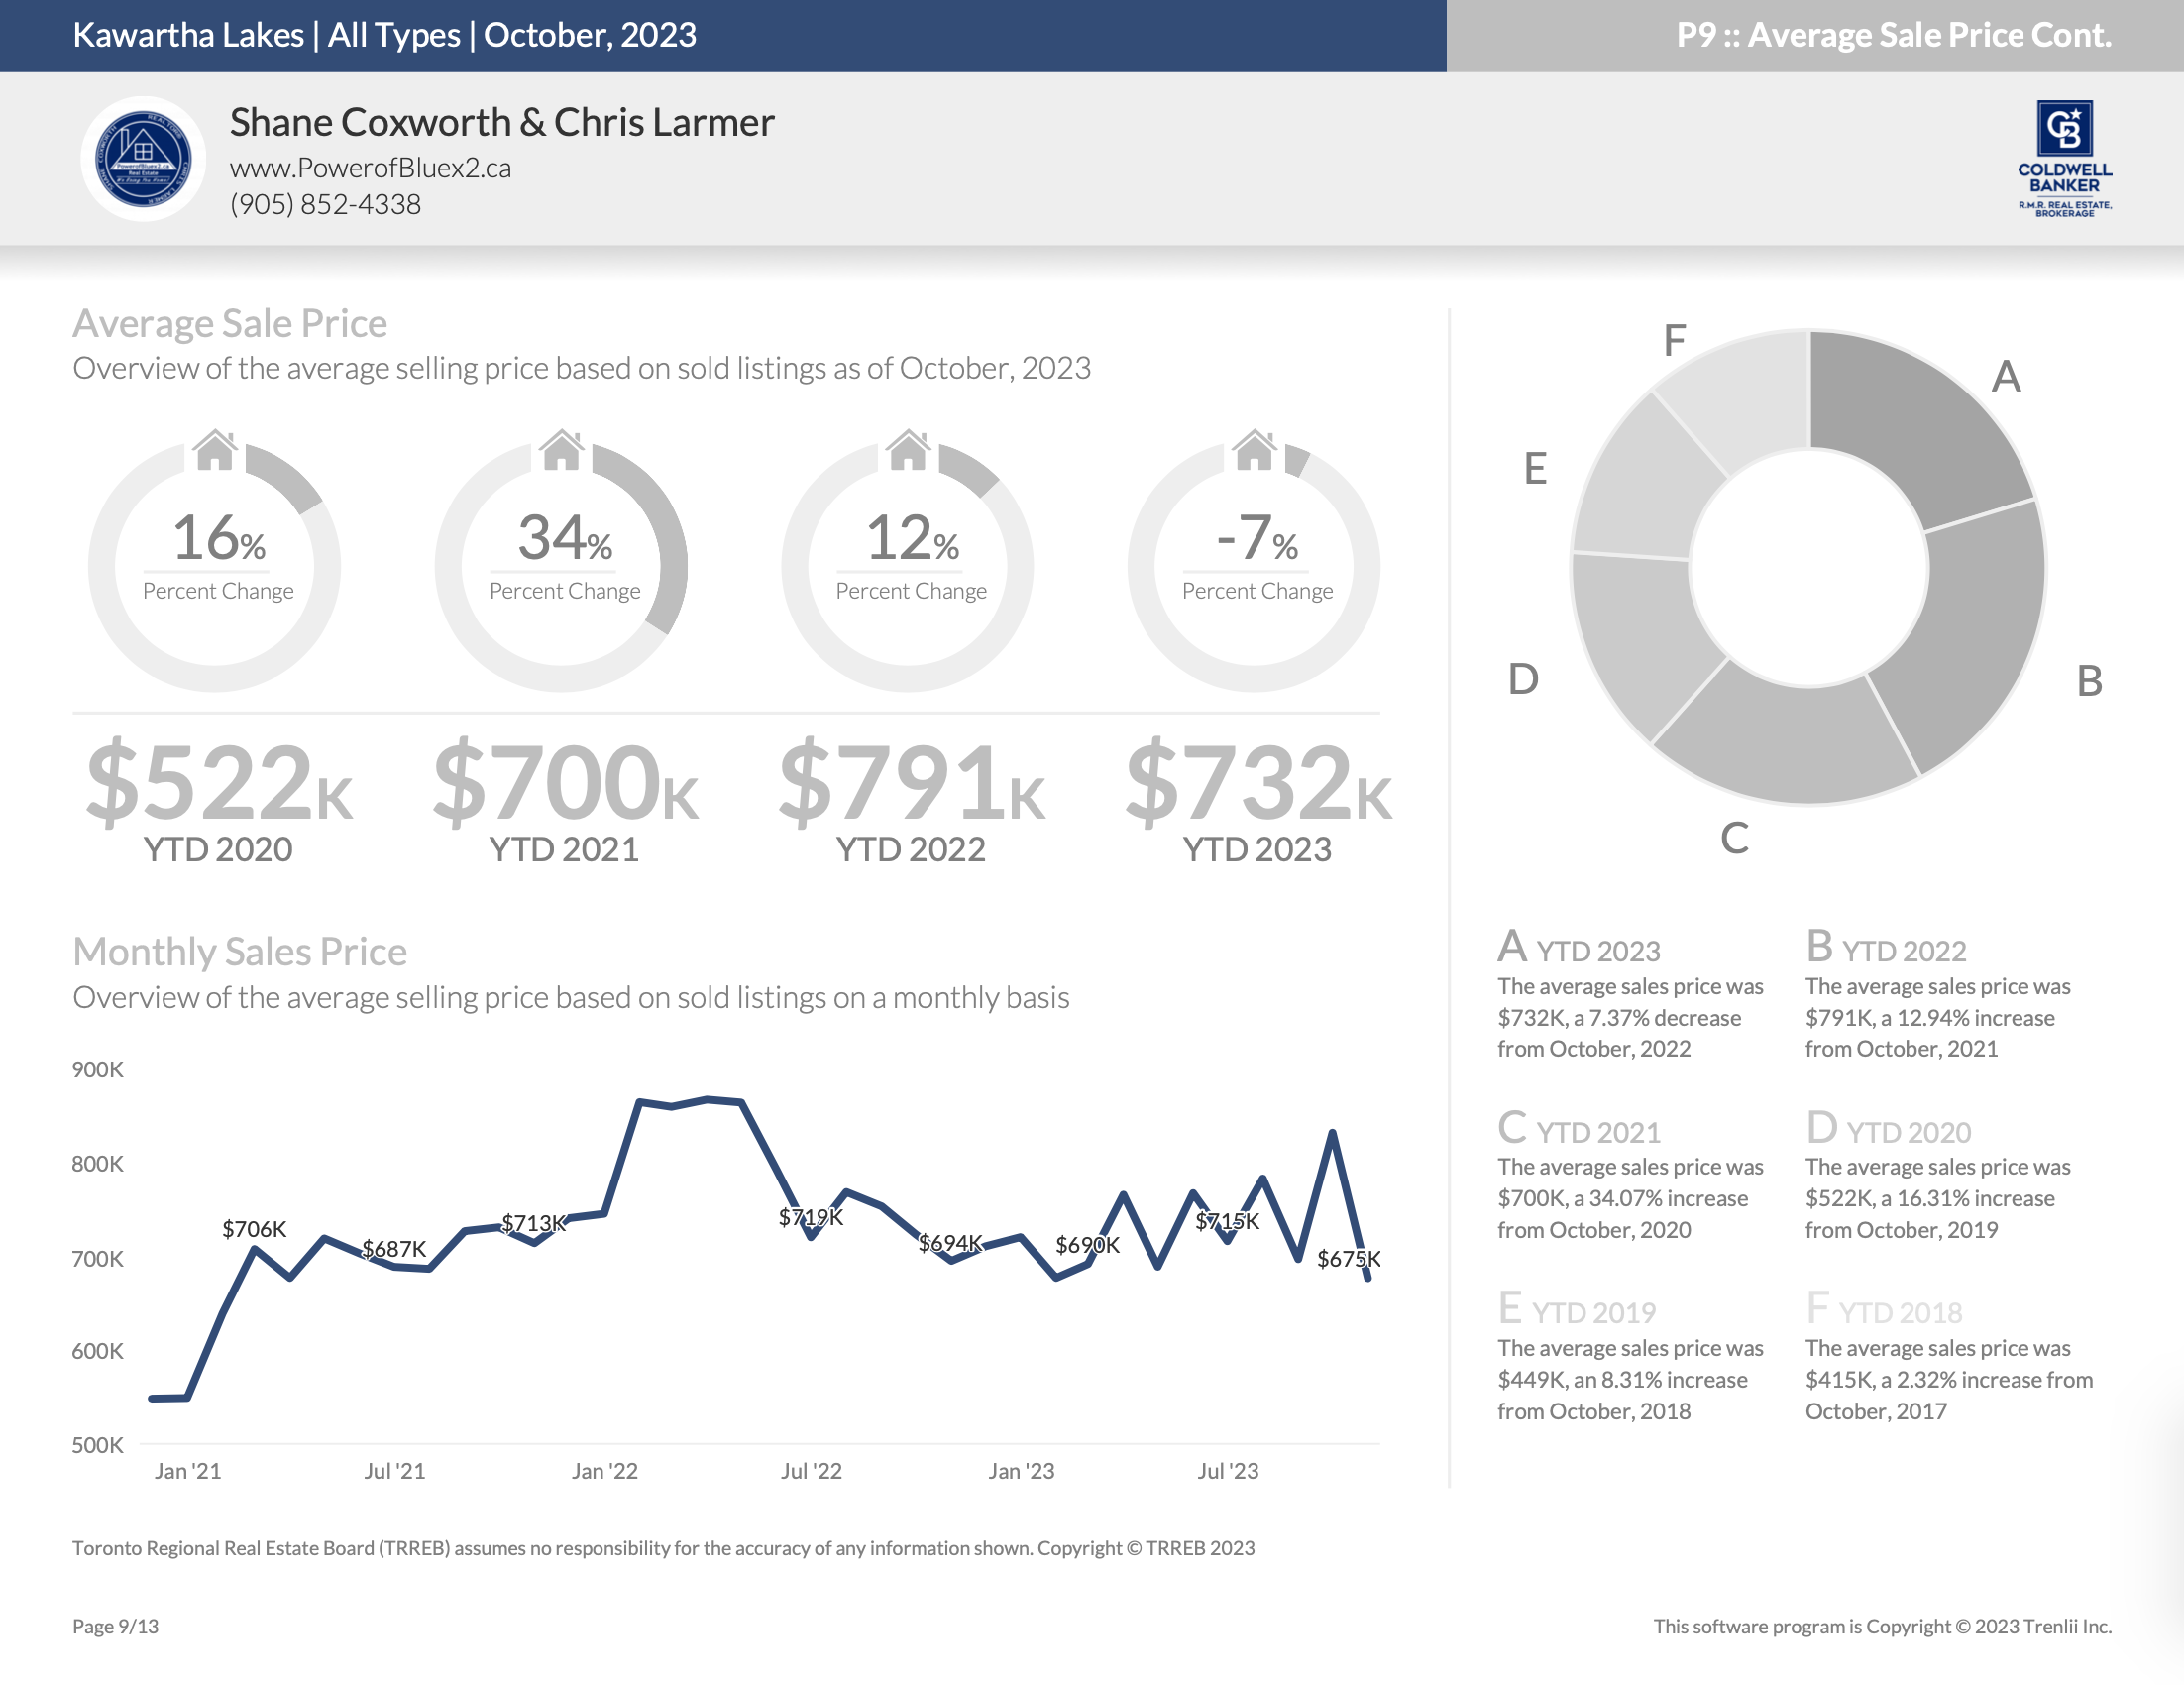
The average sales price in October, 2023 is $675K, a 2.66% decrease from October, 2022. The average sales price of October, 2022 was $694K. We have seen a year to date average sales price of $732K in 2023 and $791K in 2022 resulting in a 7.37% decrease.
Quick Review

New Listings – October 2023
New Listings – Year-To-Date

Average Asking Price – October 2023
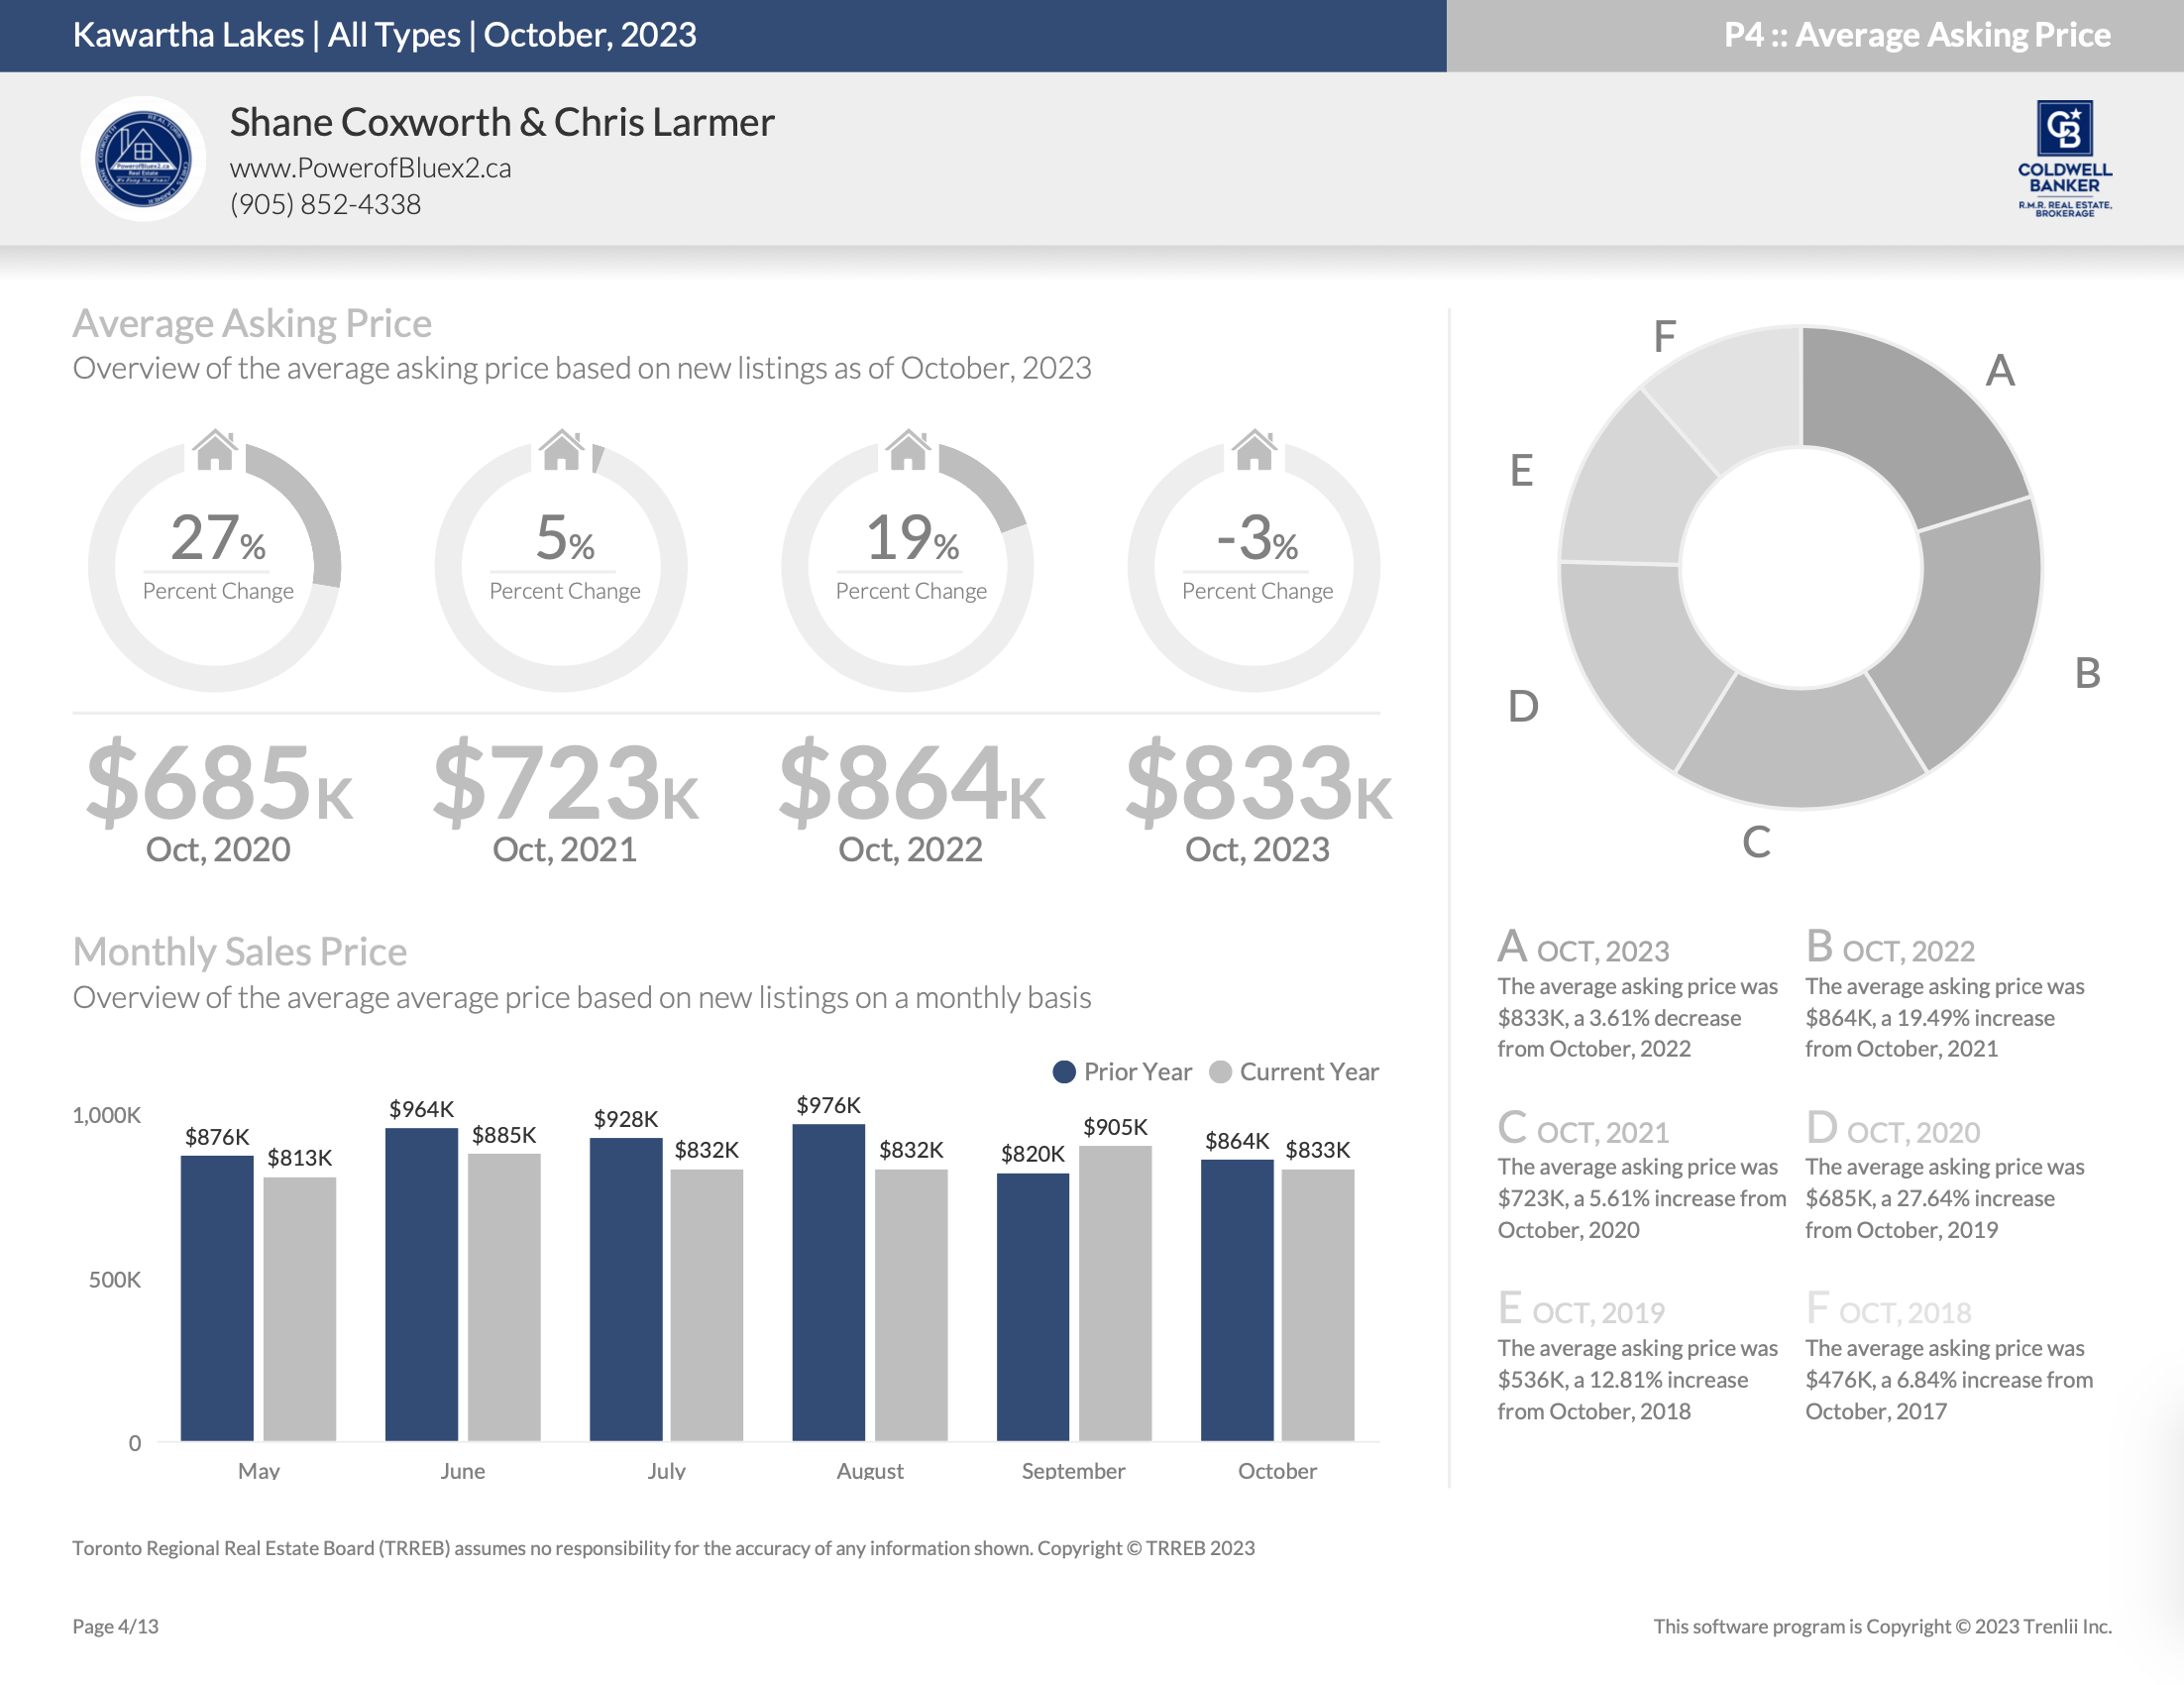
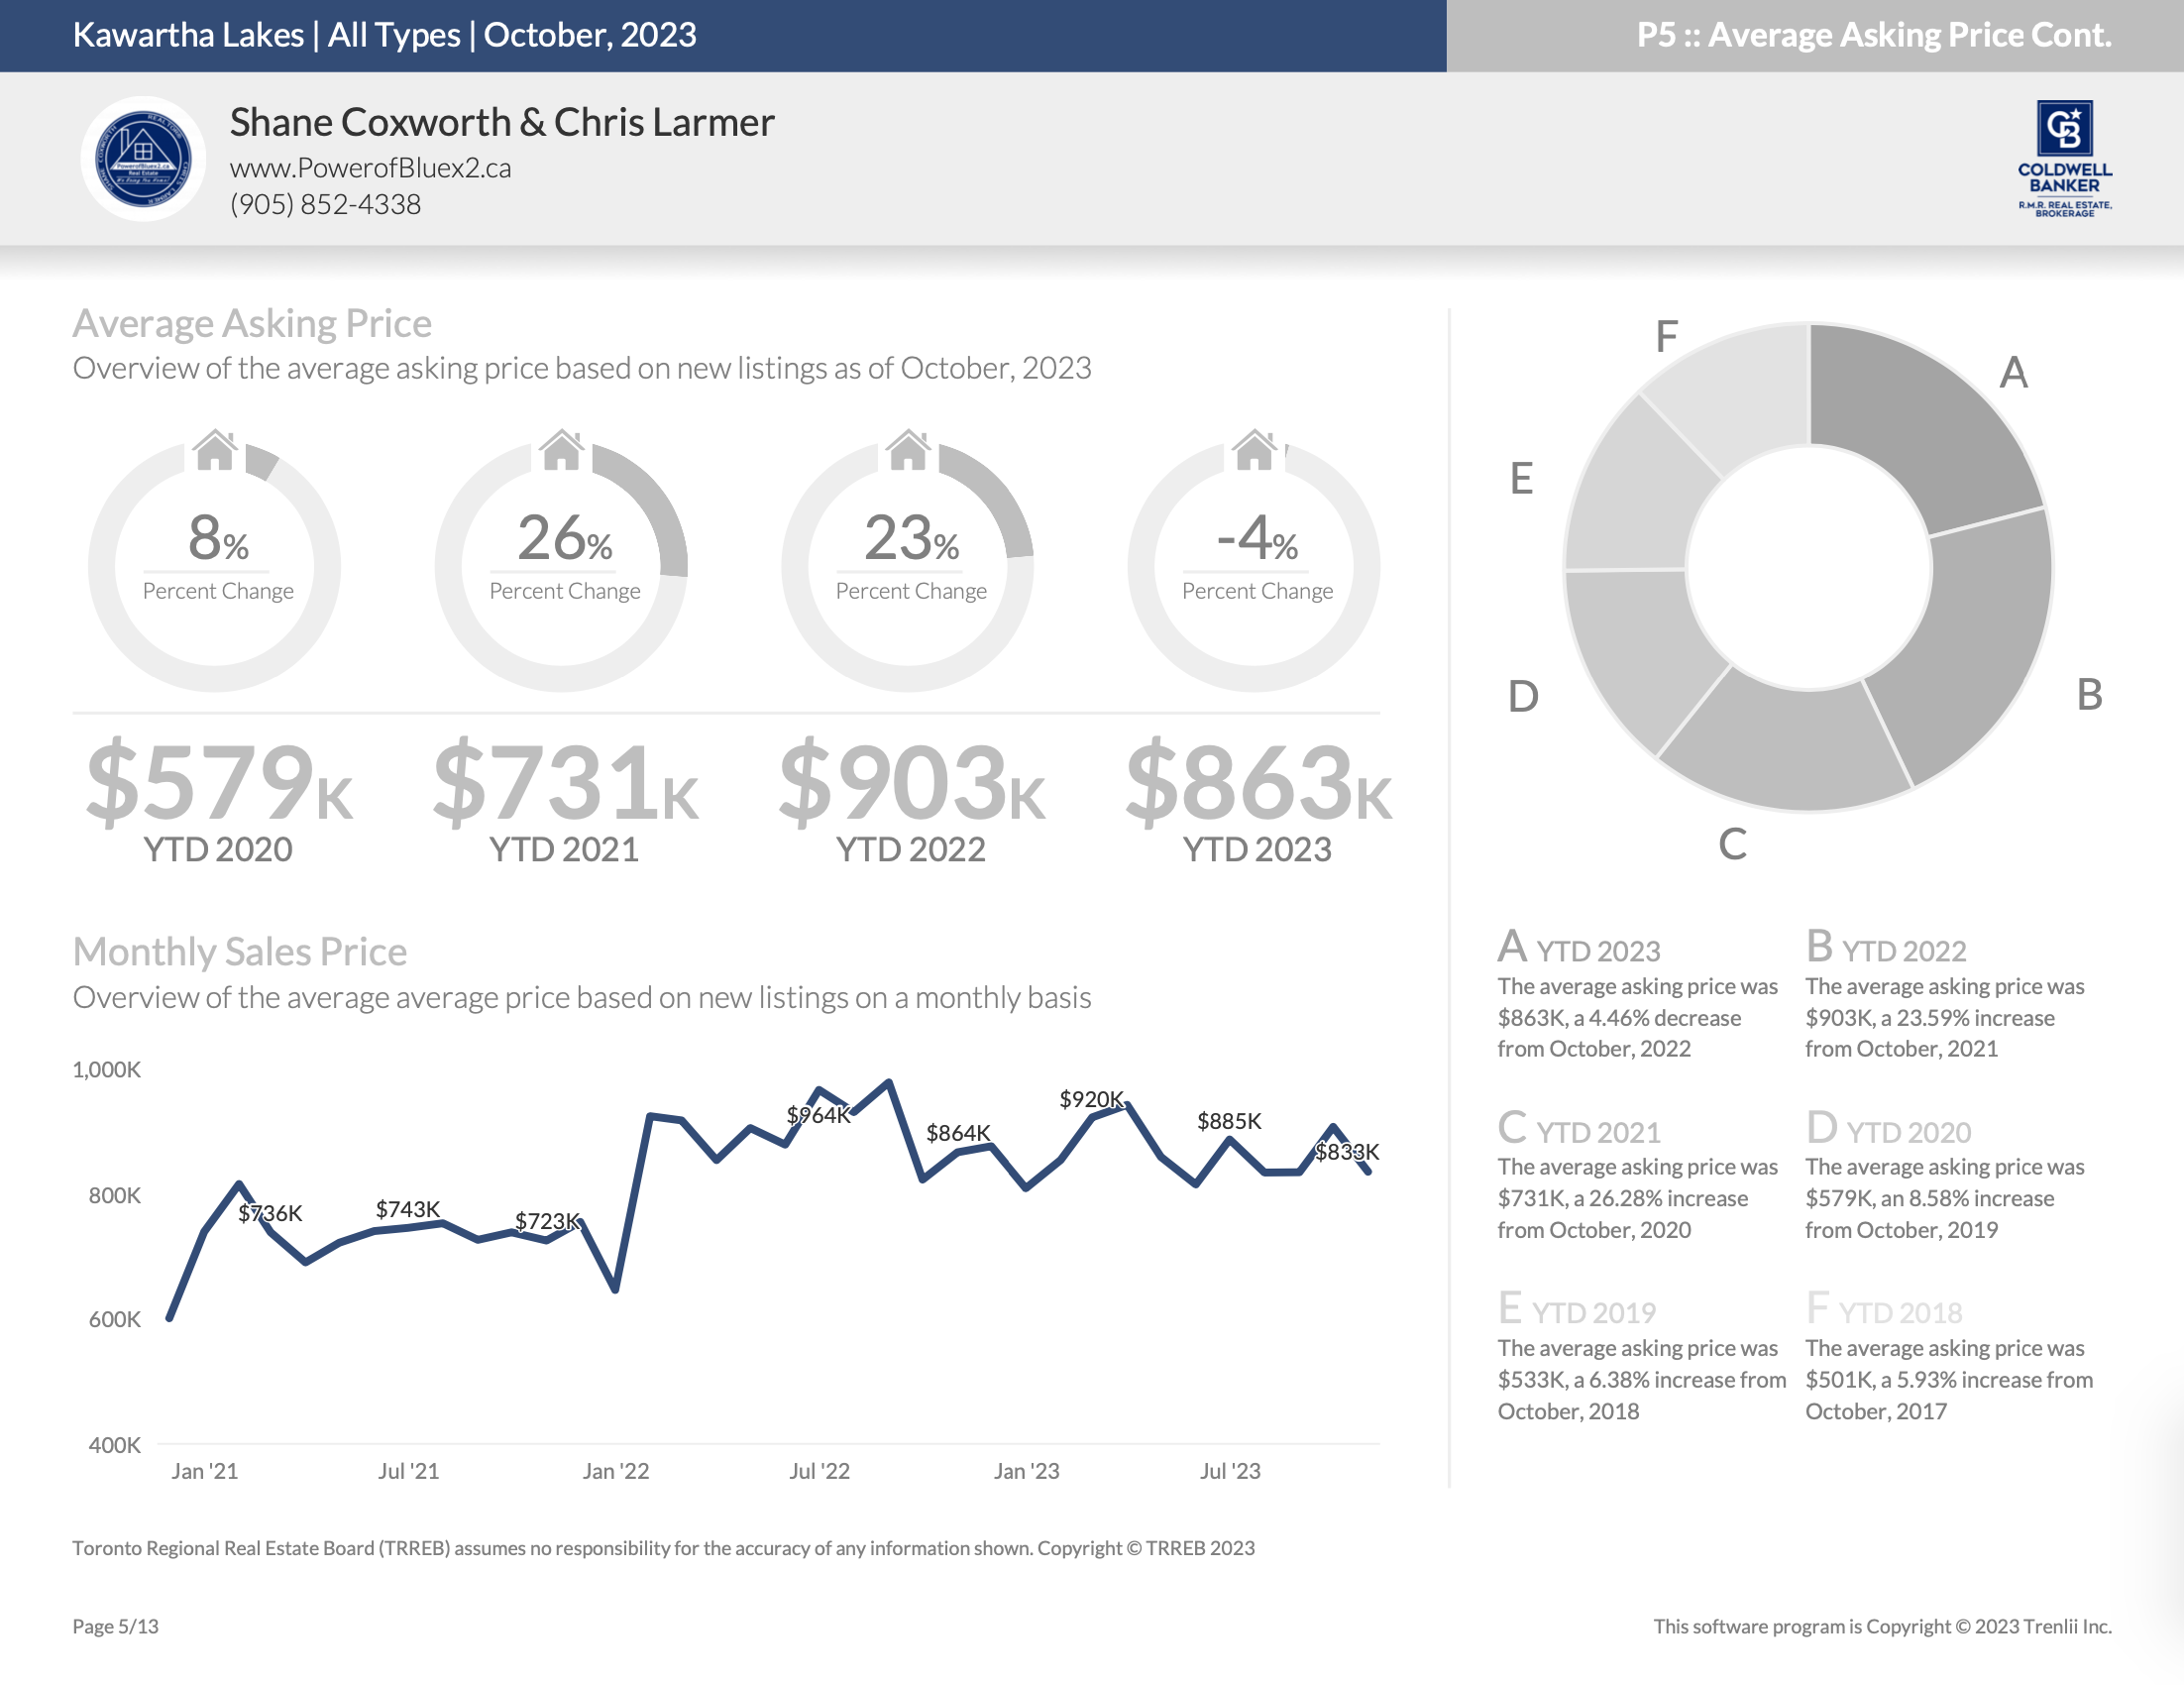
Average Asking Price – Year-to-Date
Number of Properties Sold – October 2023
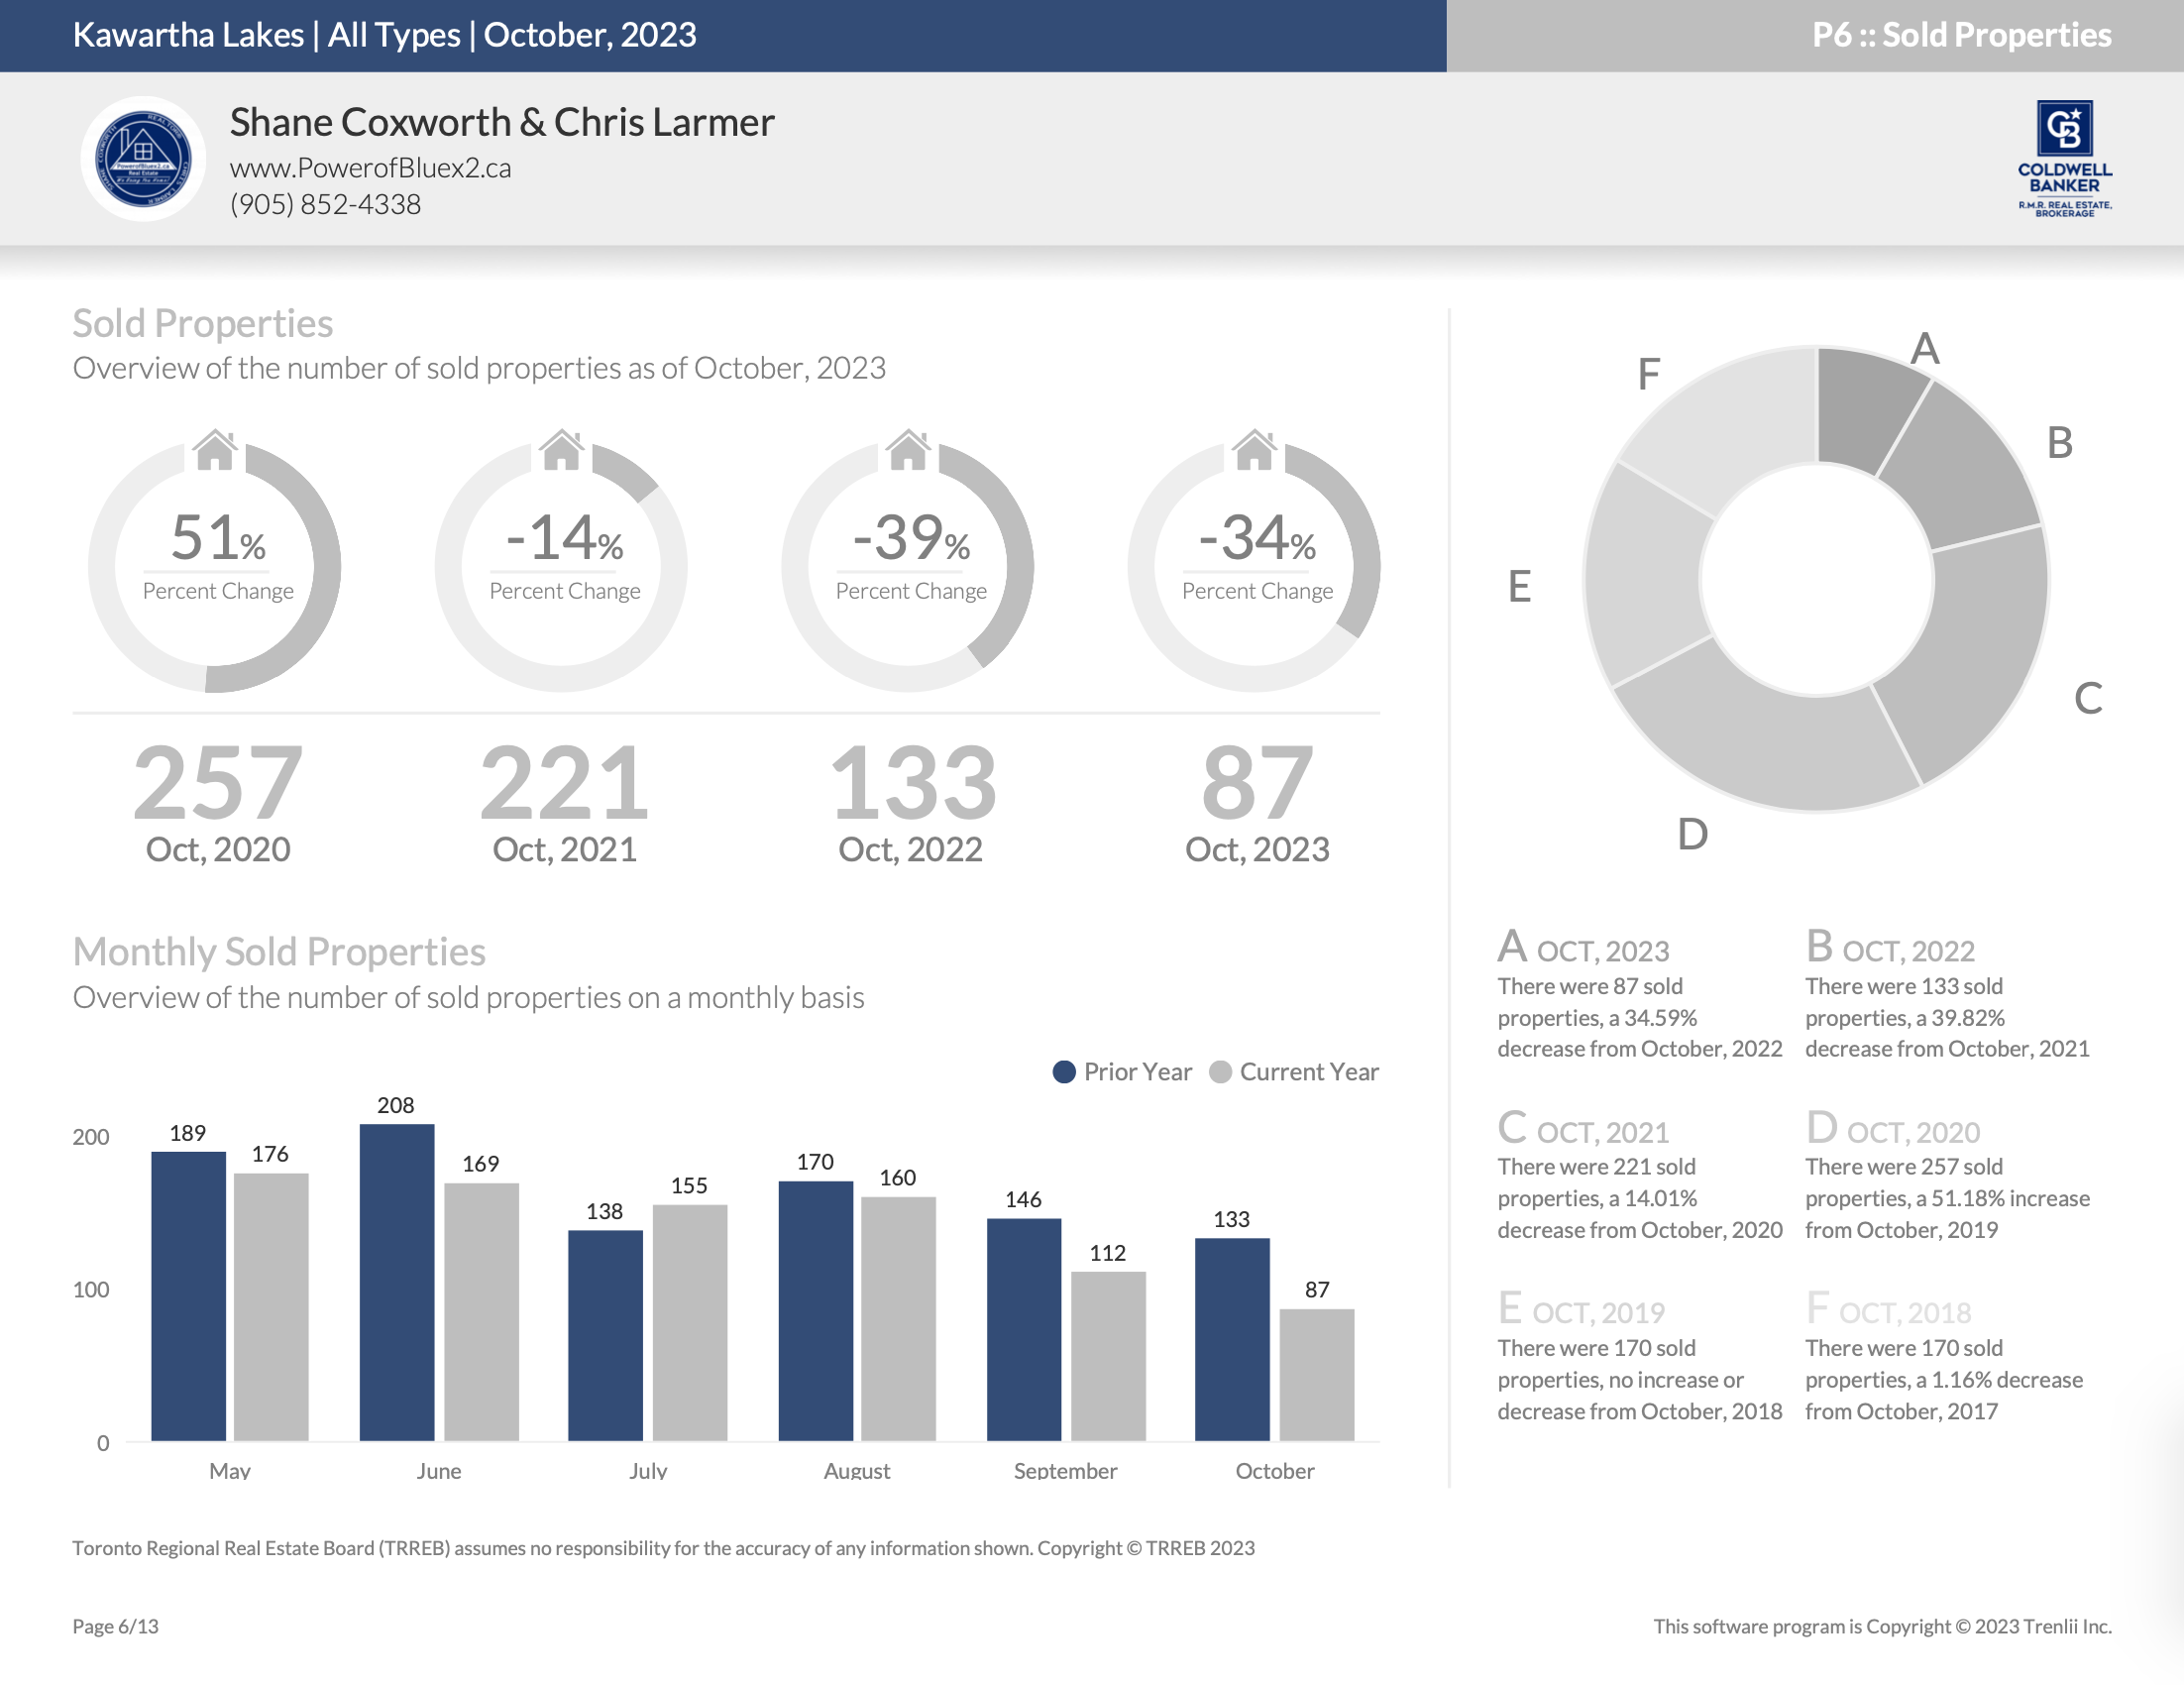
Number of Properties Sold – Year-to-Date

Average Sold Price – October 2023
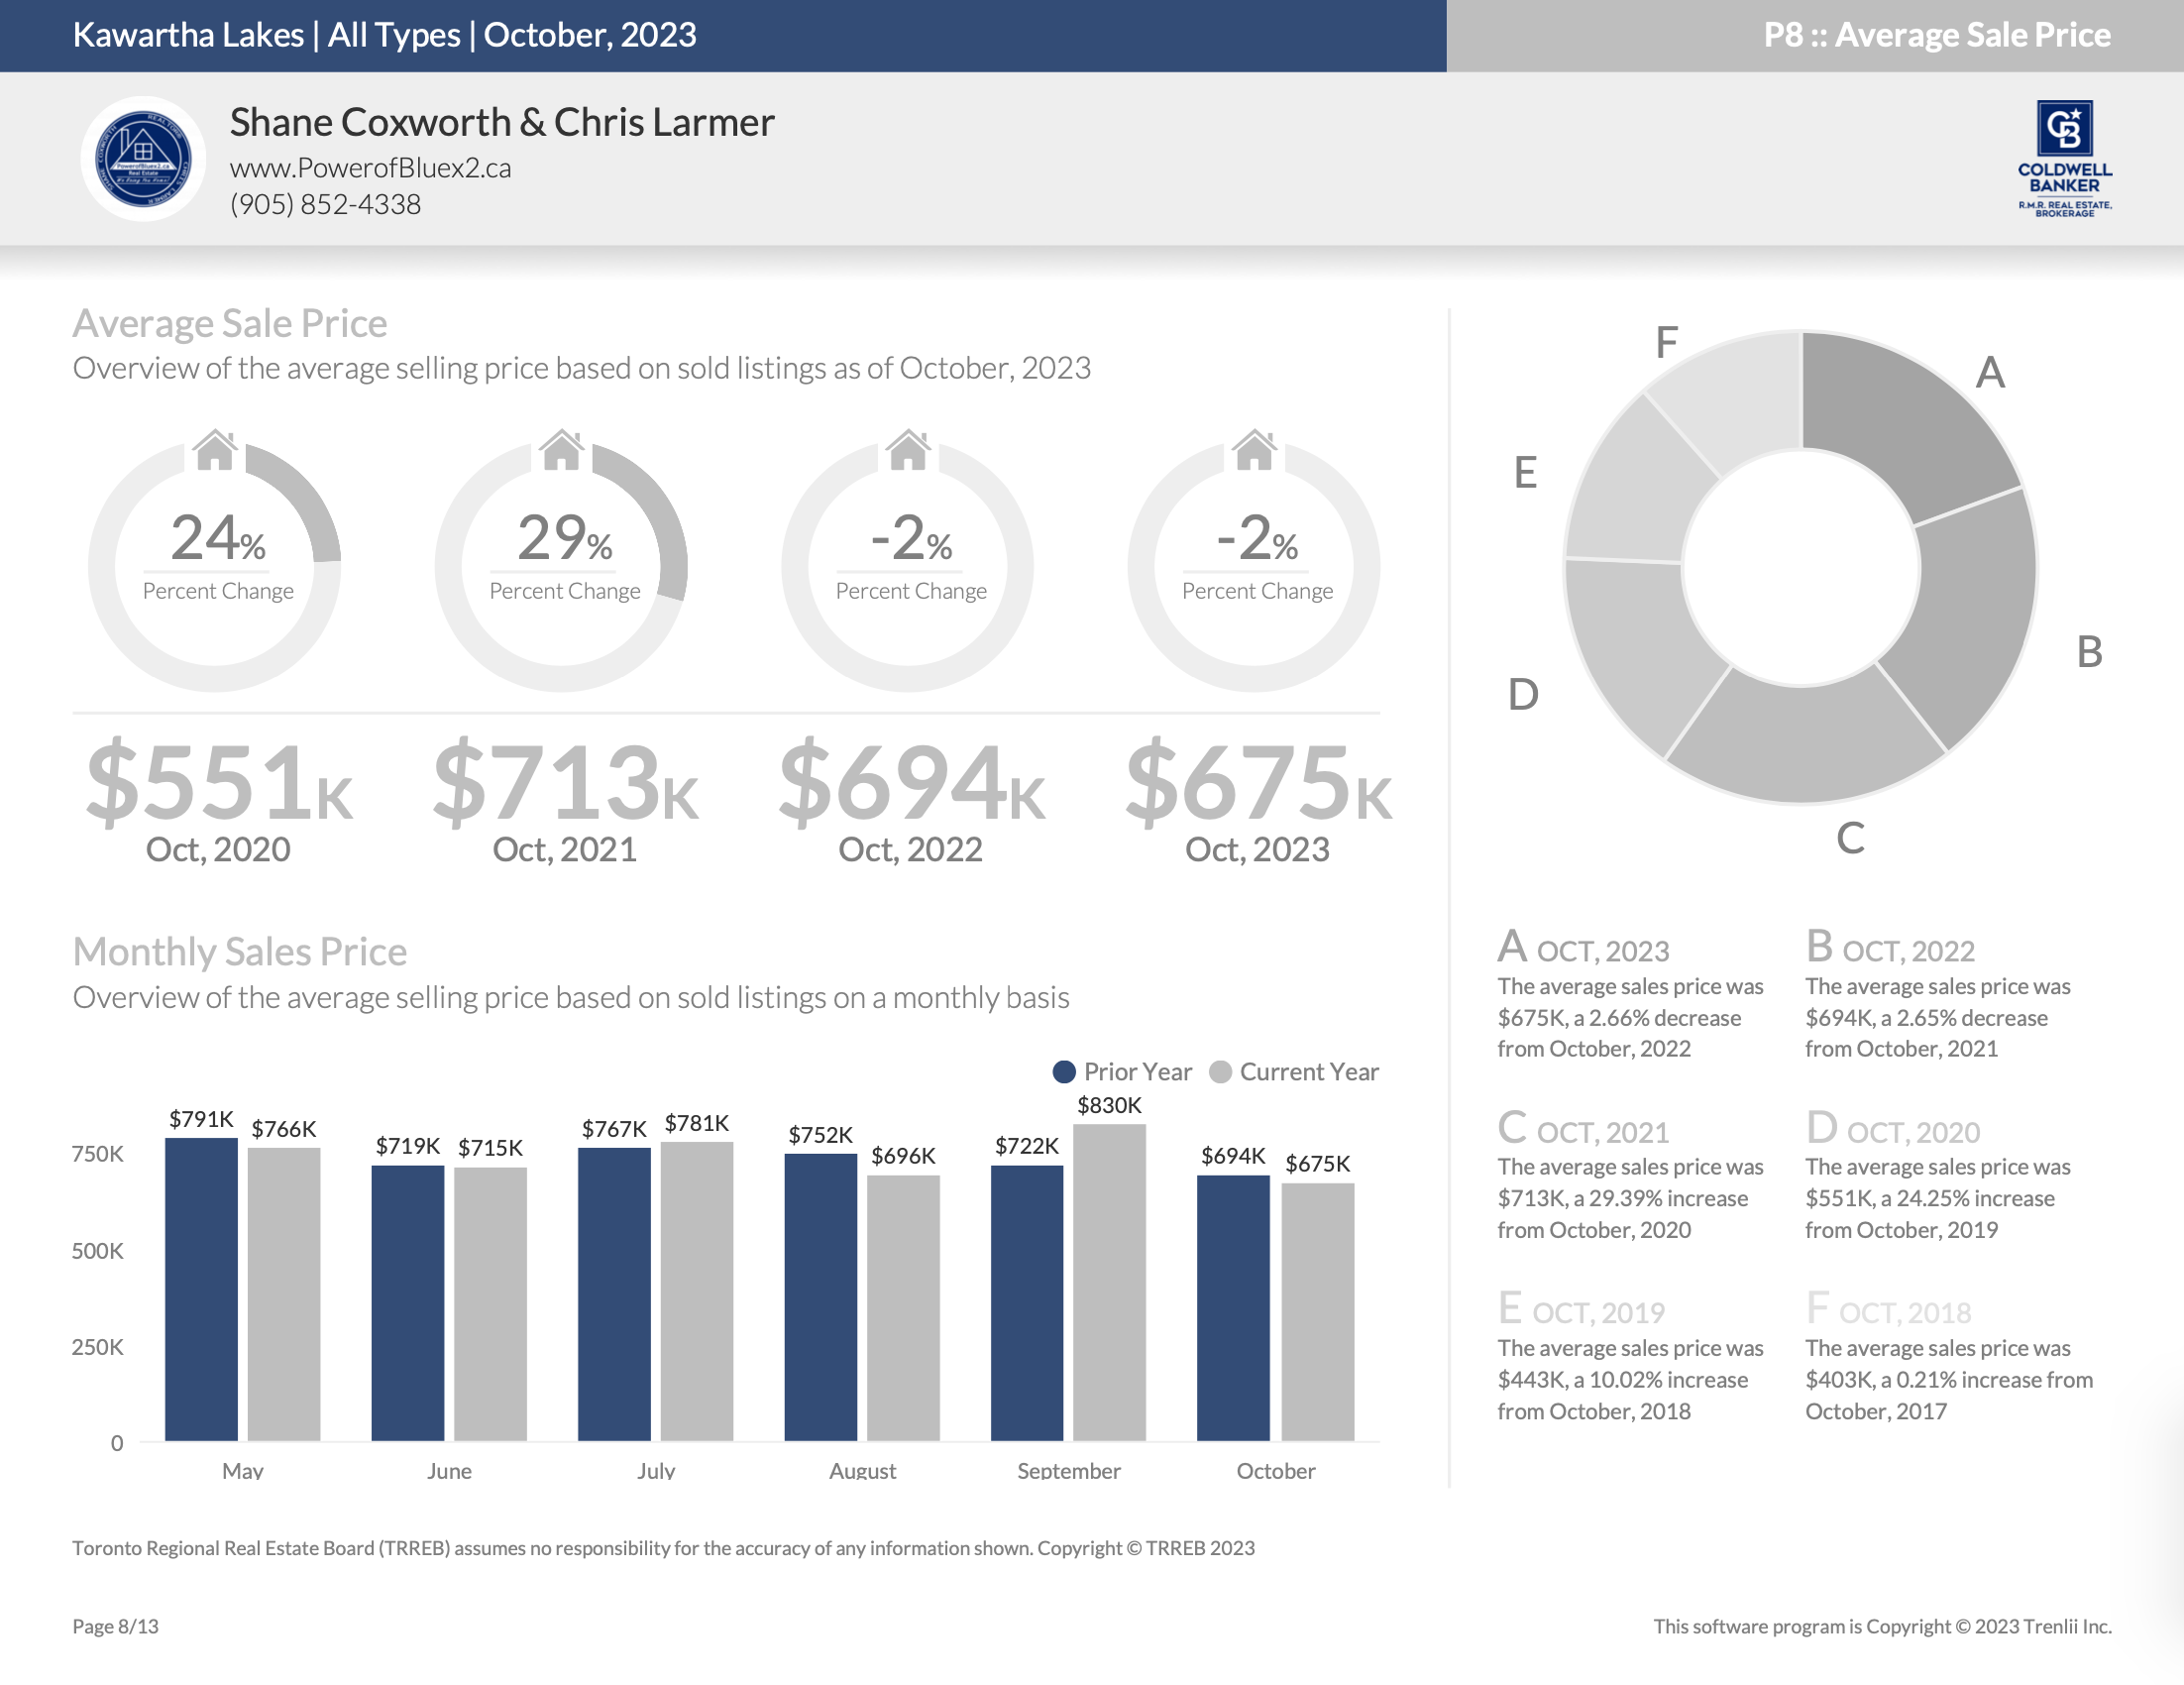
Average Sold Price – Year-to-Date
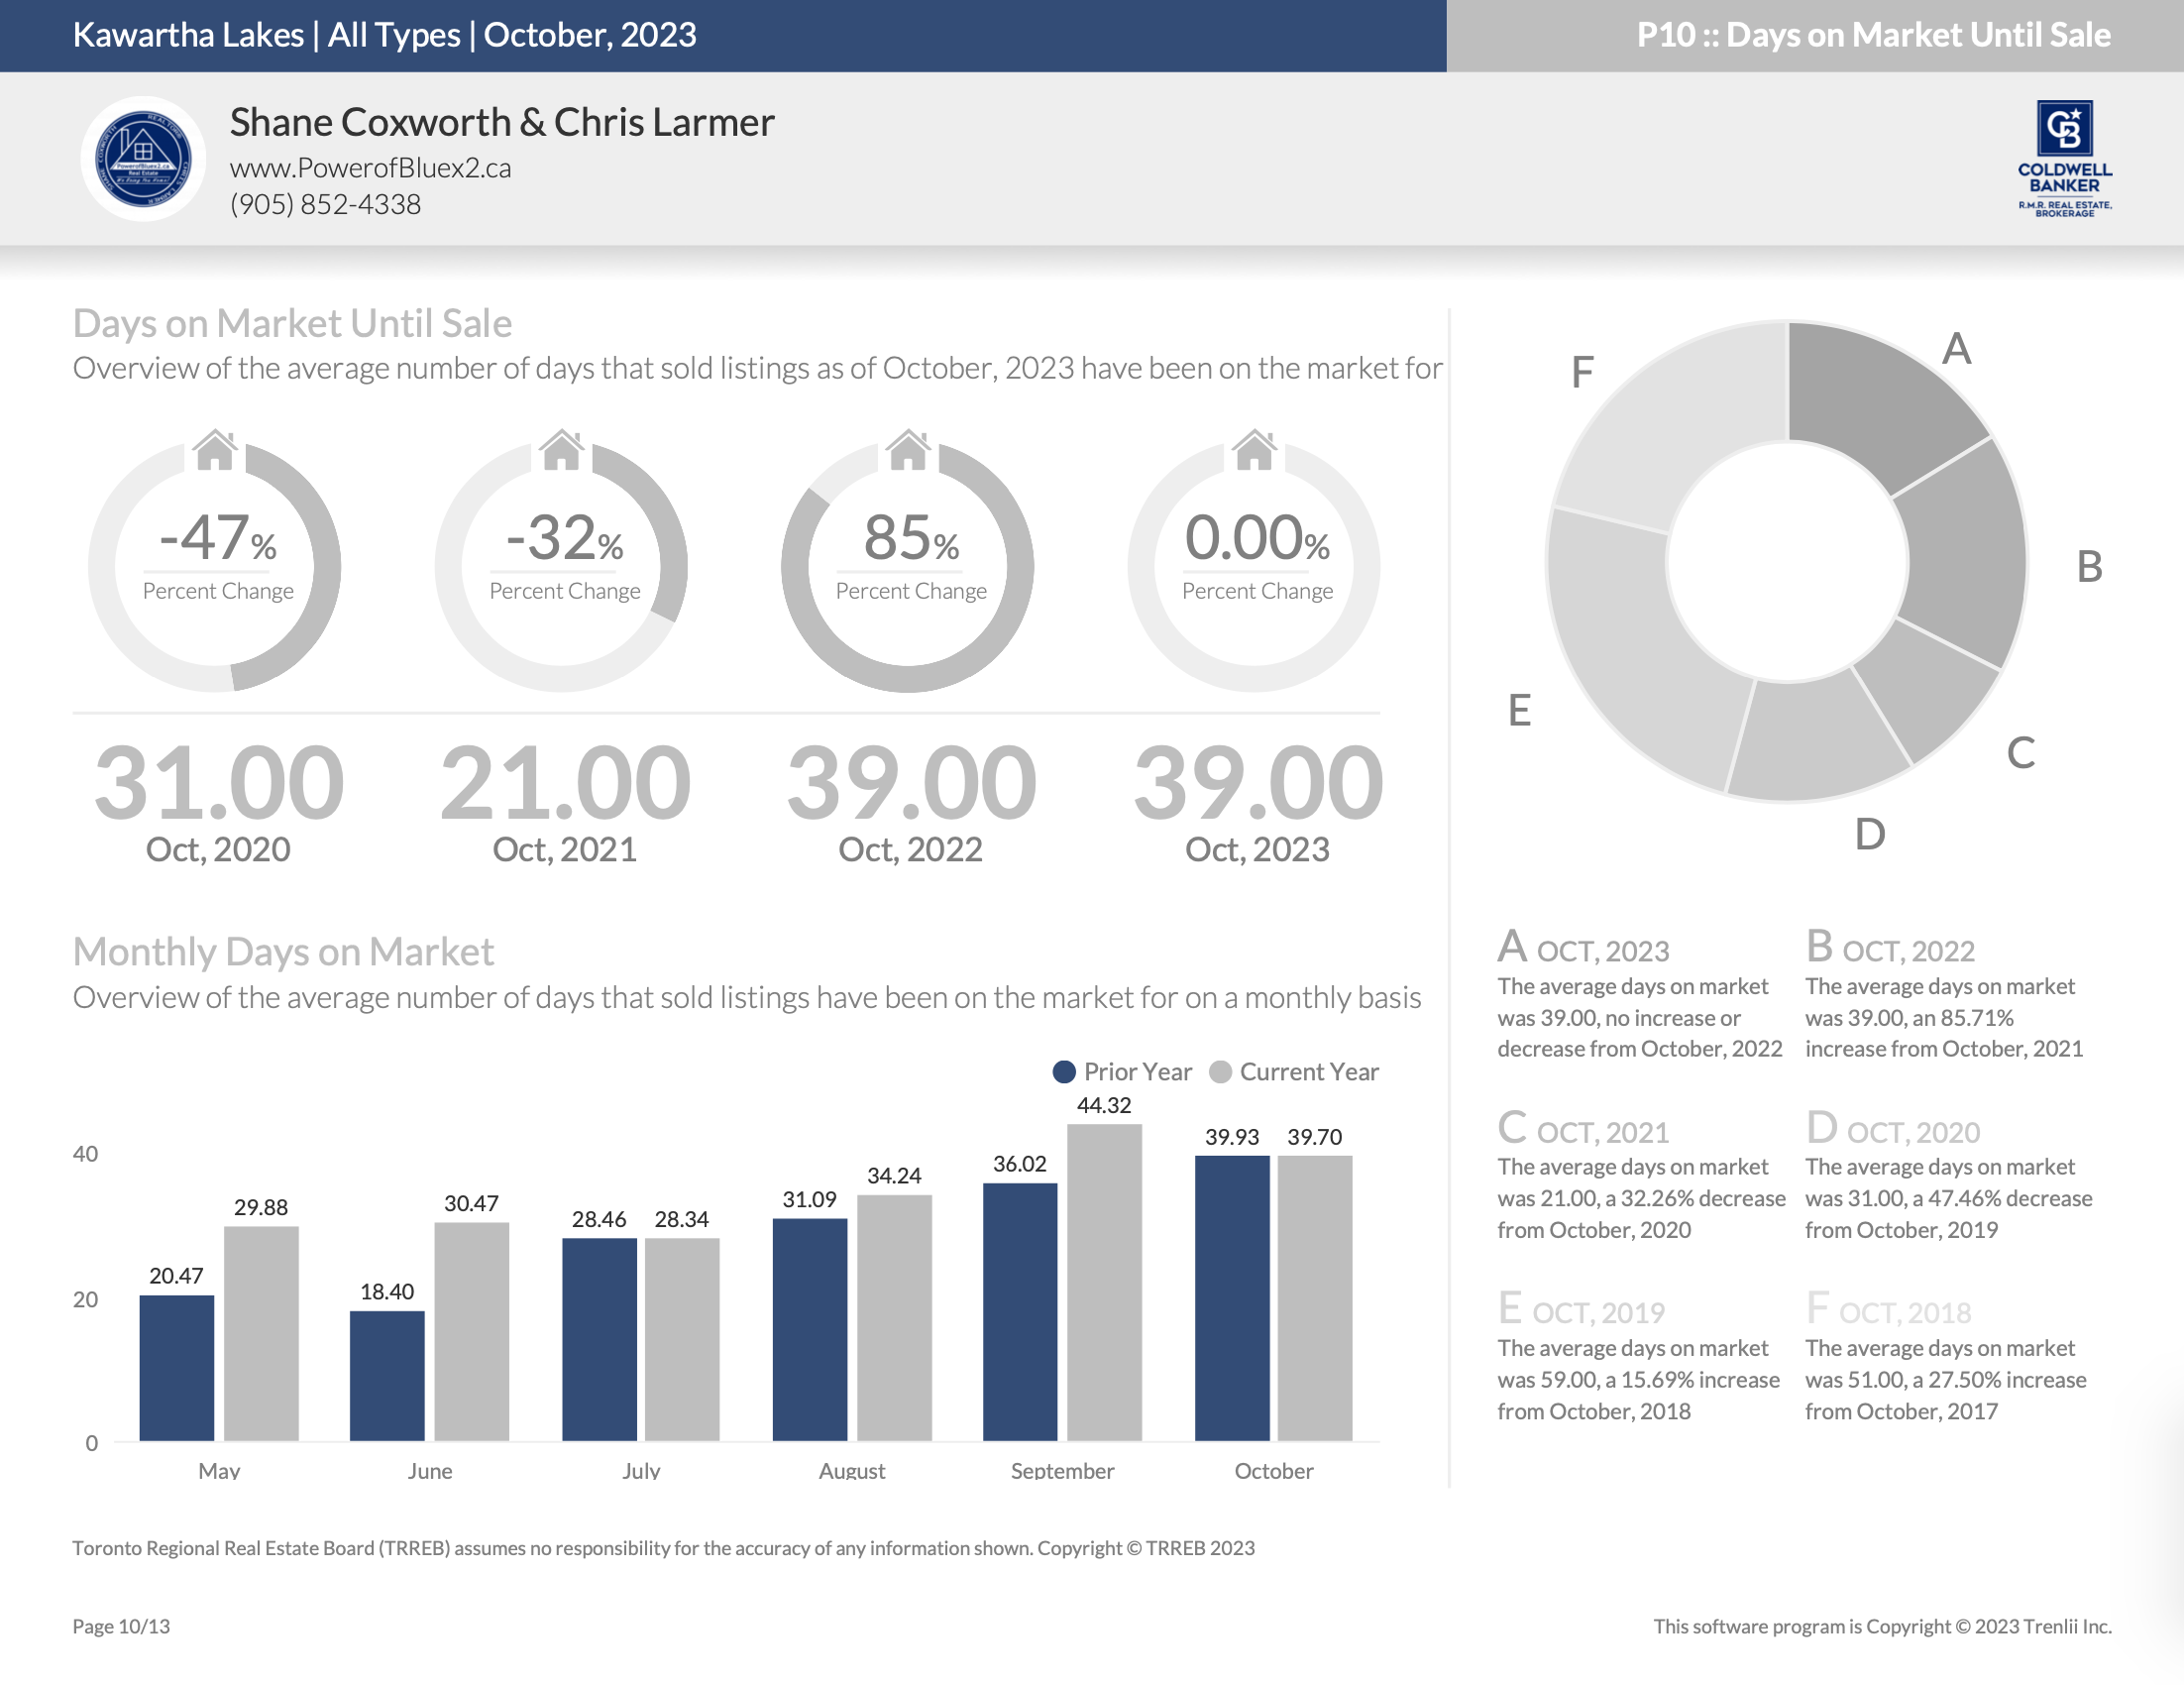
Days on Market – October 2023
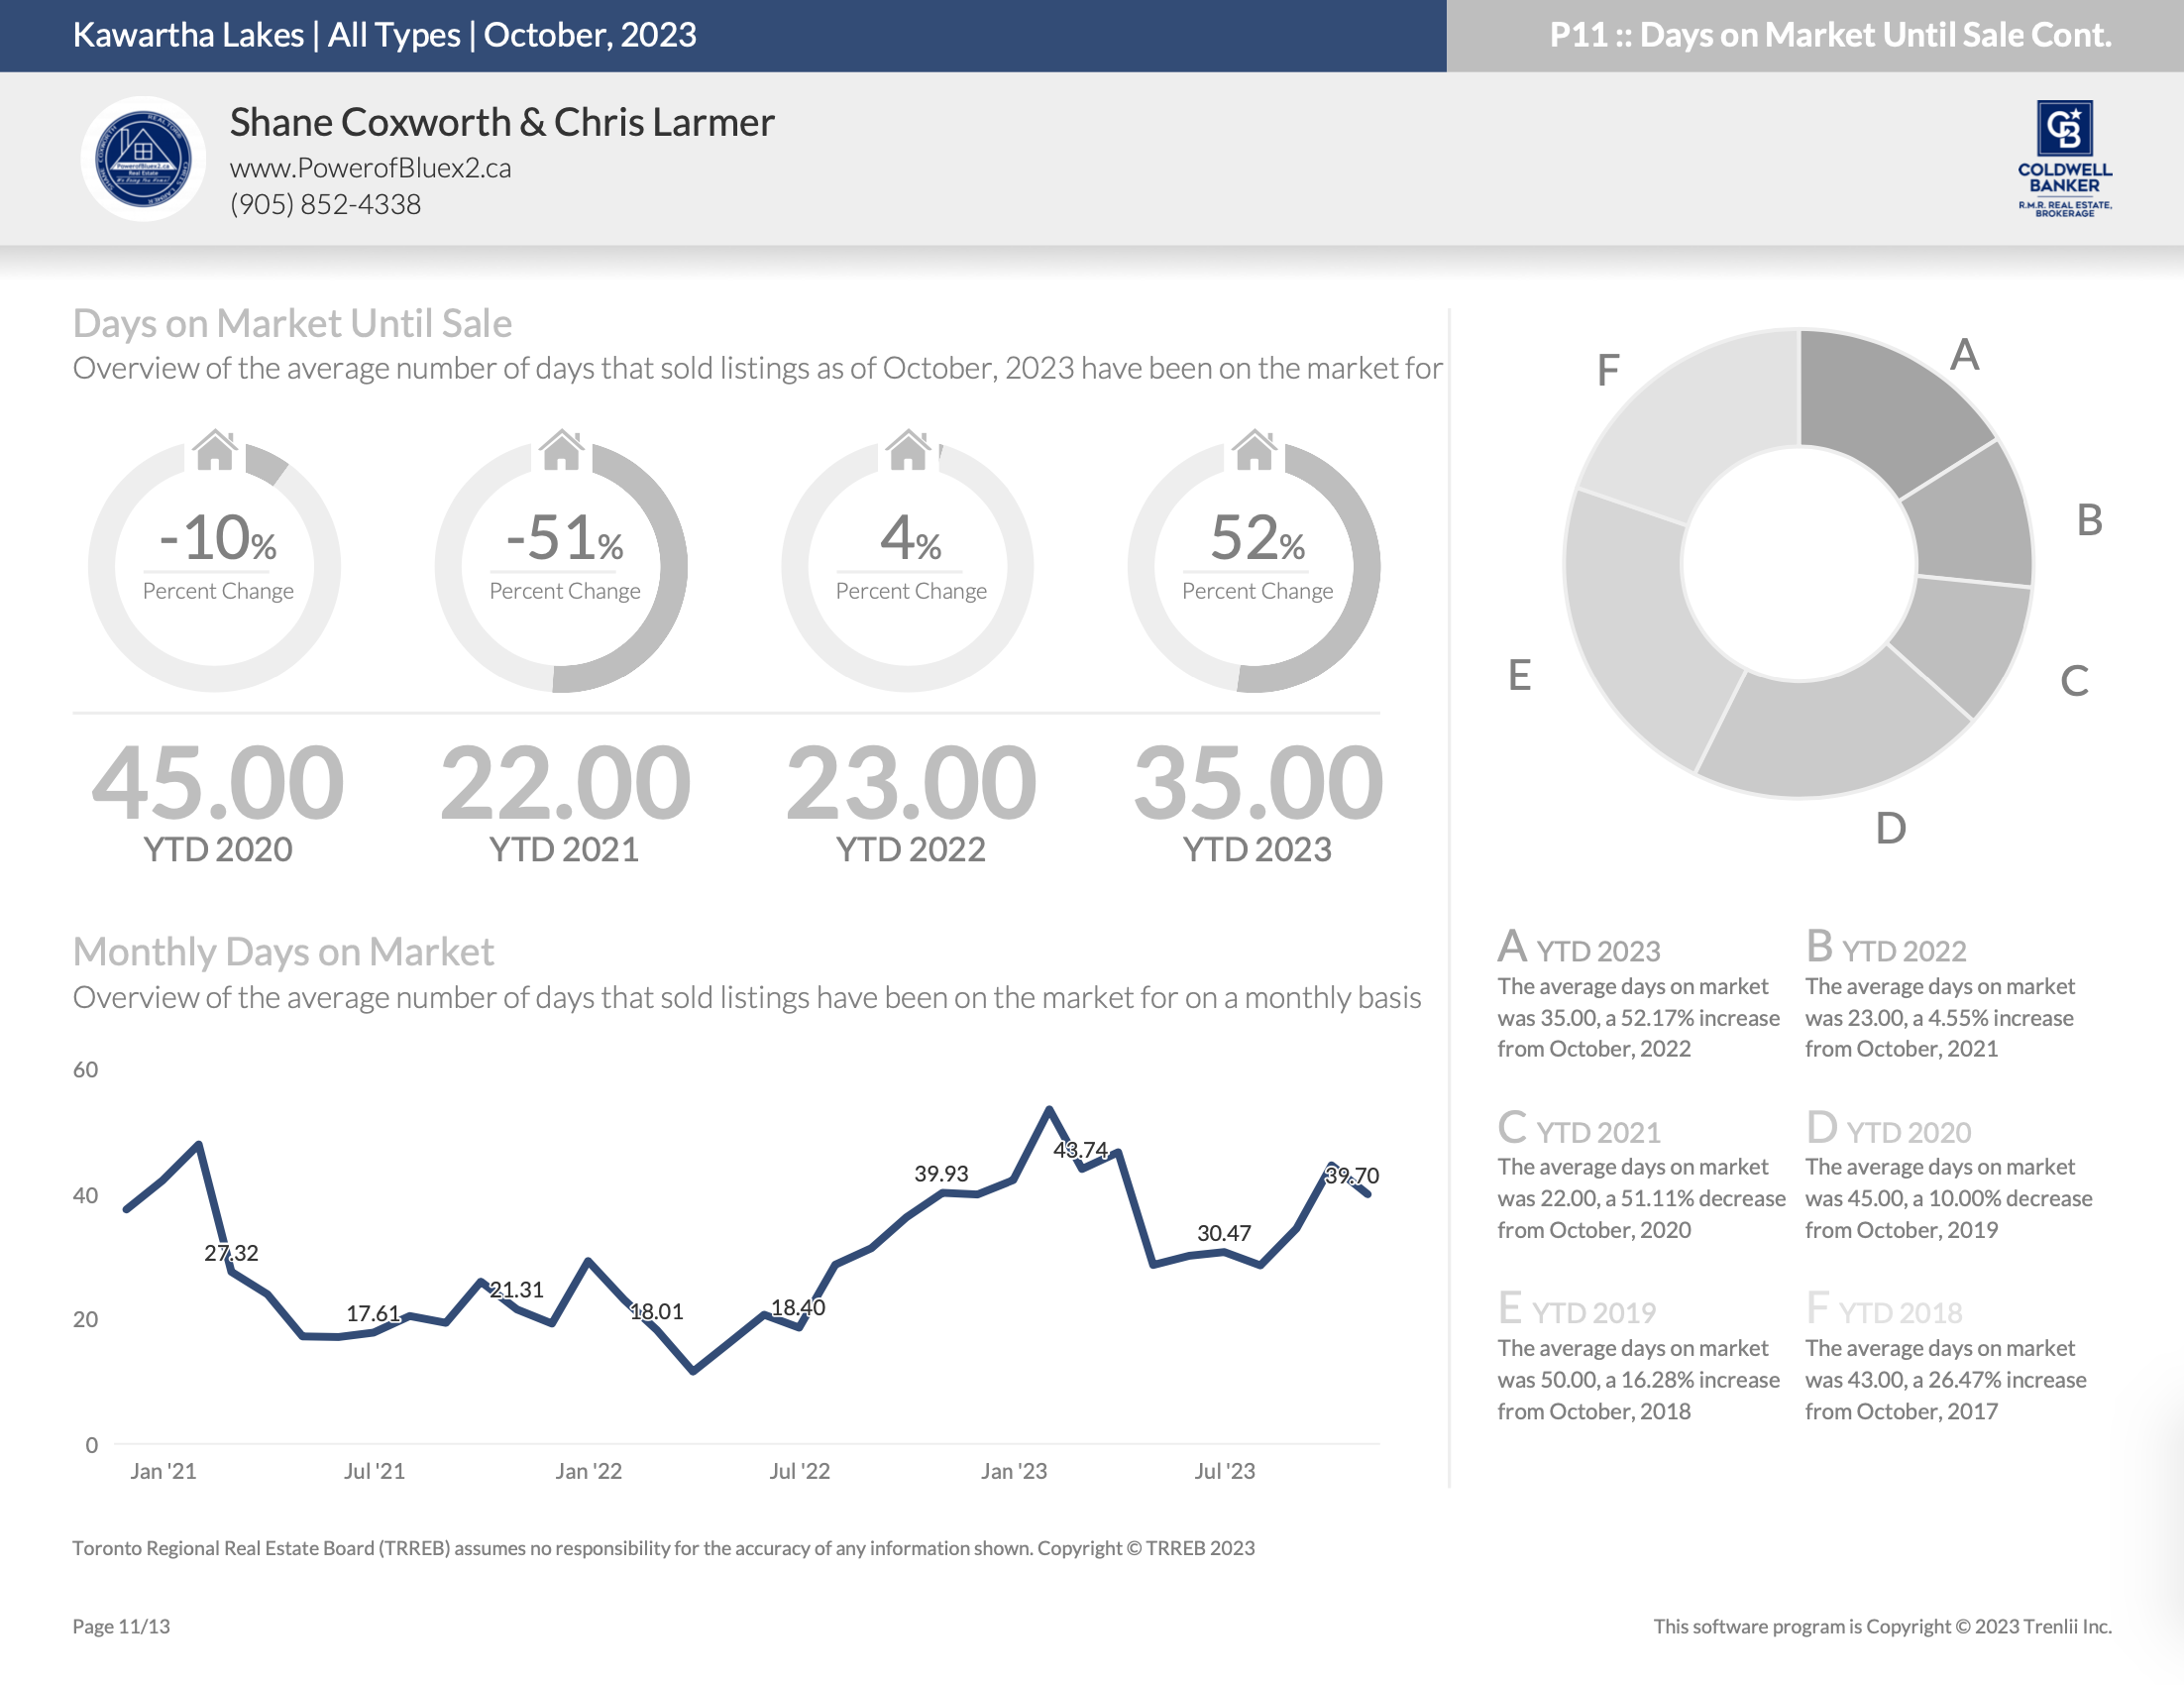
Days on Market – Year-to-Date
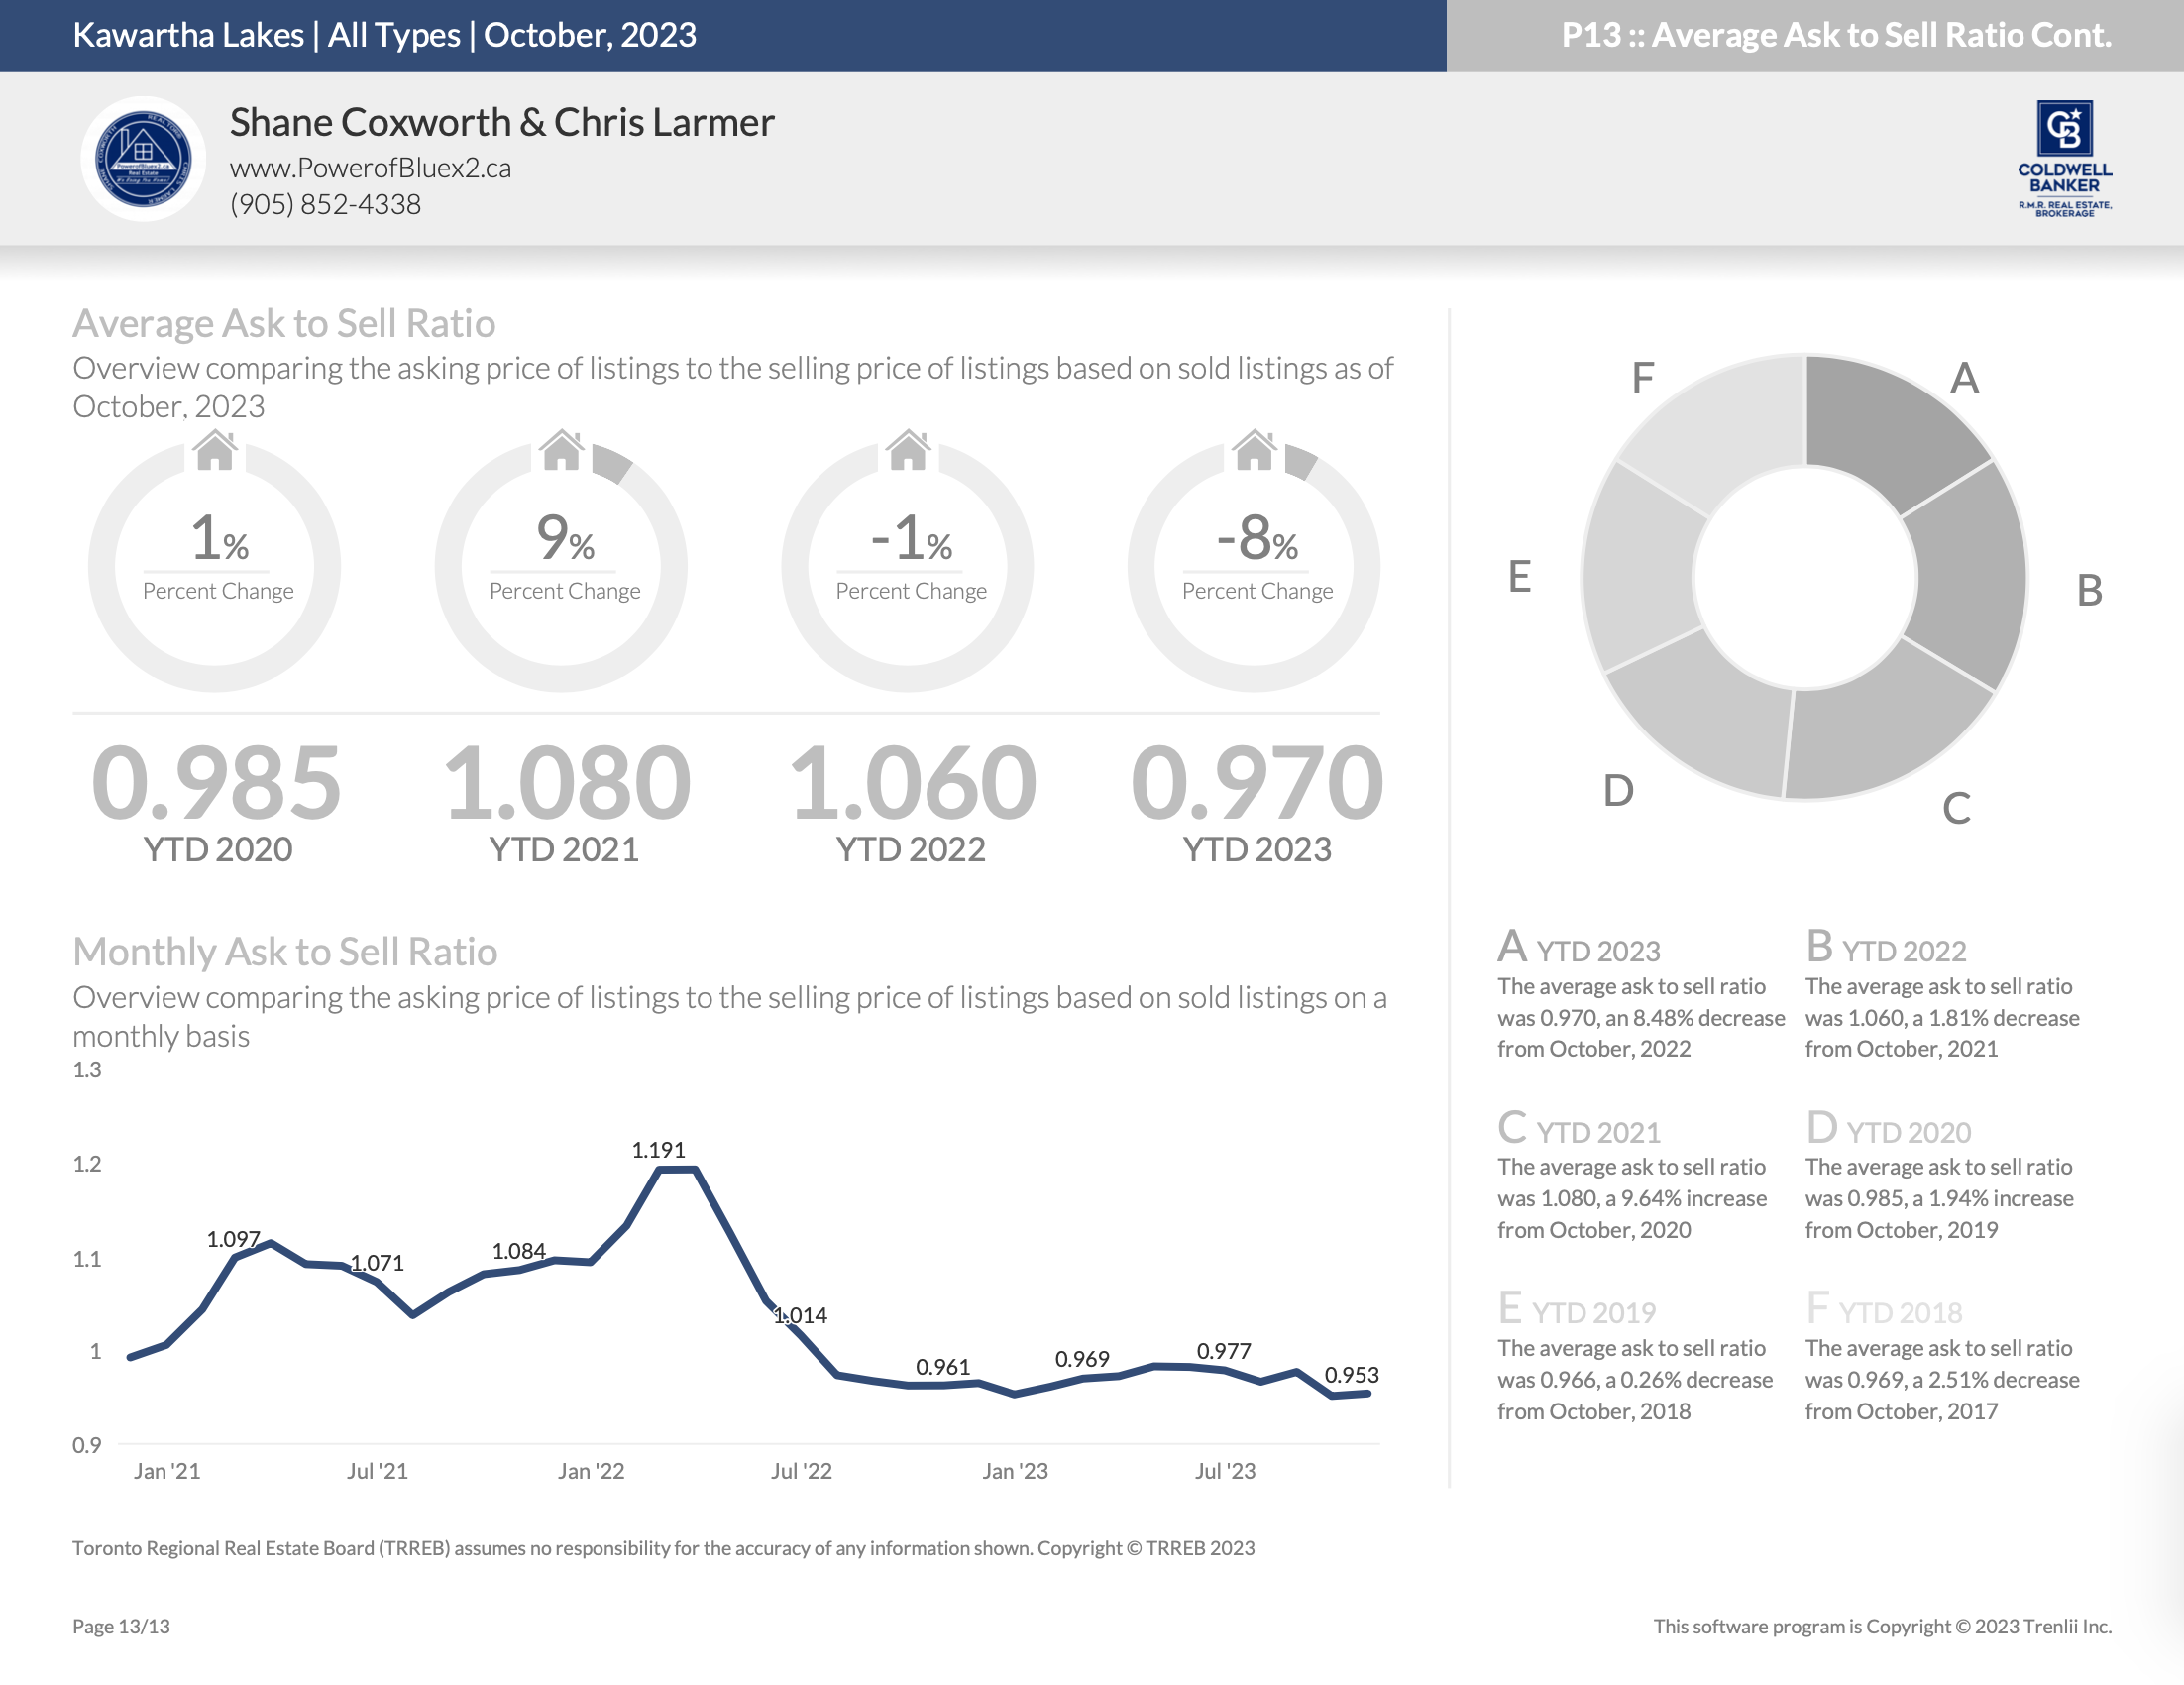
Average List Price to Sell Price Ratio – October 2023

Average List Price to Sell Price Ratio – Year-to-Date
*Information is believed to be accurate at time of posting but is not guaranteed to be correct
Not intended as a solicitation if your property is already listed by another broker. Affiliated real estate agents are independent contractor sales associates, not employees. ©2021 Coldwell Banker. All Rights Reserved. Coldwell Banker and the Coldwell Banker logos are trademarks of Coldwell Banker Real Estate LLC. The Coldwell Banker® System is comprised of company owned offices which are owned by a subsidiary of Realogy Brokerage Group LLC and franchised offices which are independently owned and operated. The Coldwell Banker System fully supports the principles of the Fair Housing Act and the Equal Opportunity Act.
Click below for more reports


Brock Housing October 2023
Brock Housing October 2023
![]()
Housing Market Report for October 2023
Here is the Township of Brock Housing October 2023 report (all housing types), with reports from the Canadian Real Estate Association, Toronto Regional Real Estate Board and the Durham Association of REALTORS® included.
This housing report for Township of Brock includes the number of new listings, average list price, number of properties sold, average selling price, average days on market and average asking price to selling price ratio for all property types within the Township of Brock.
Scroll to the bottom for links to take you to the housing market reports for Durham, Uxbridge, Scugog and the Kawartha Lakes.
![]()
CREA HOUSING MARKET REPORT – OCTOBER 2023
![]()
From Toronto Regional Real Estate Board
Toronto Regional Real Estate Board – Market Stats At A Glance – October 2023
Read the Toronto Regional Real Estate Board Market Watch Report
![]()
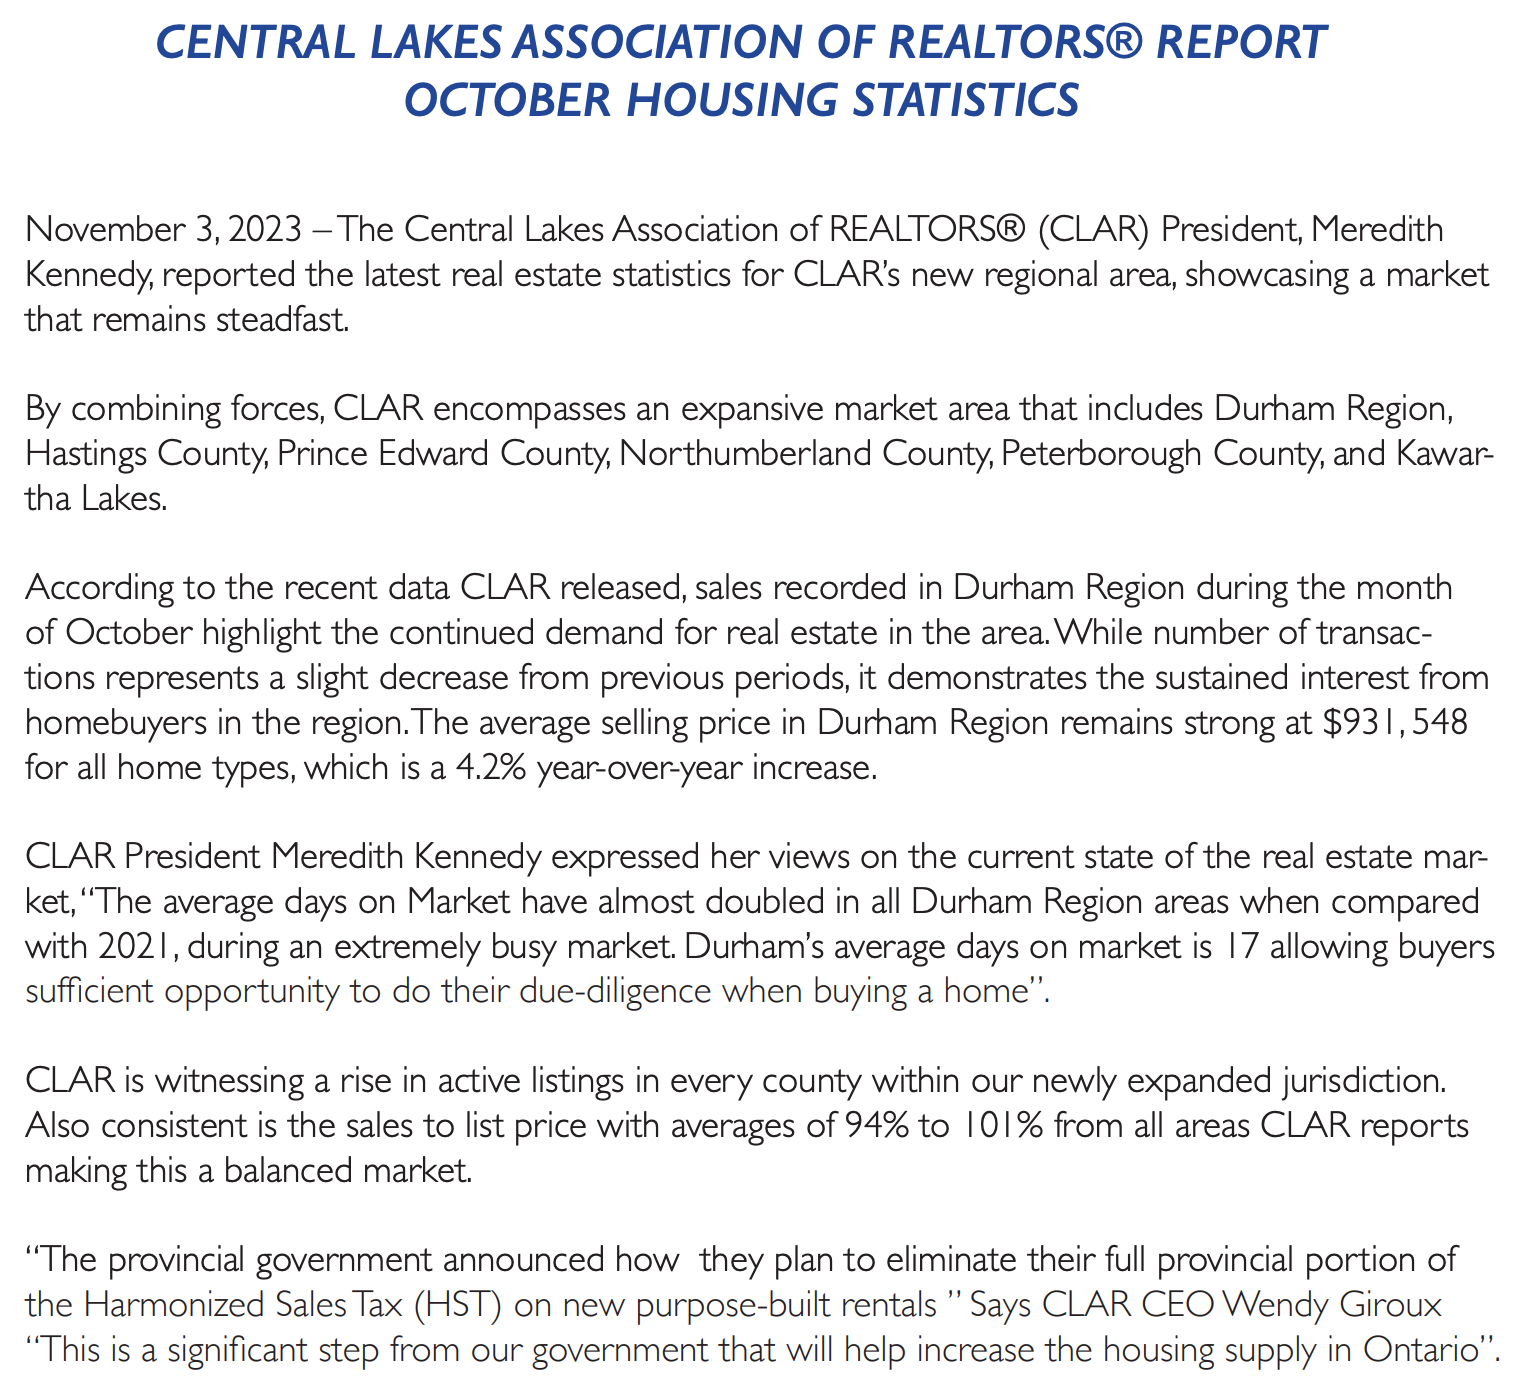
Durham REALTORS® Report October 2023 Housing Statistics
Read the Durham Association of REALTORS® FULL Real Estate Report
![]()
Township of Brock Full Report
*Some values may vary slightly based on the exact date and time the reports were generated.
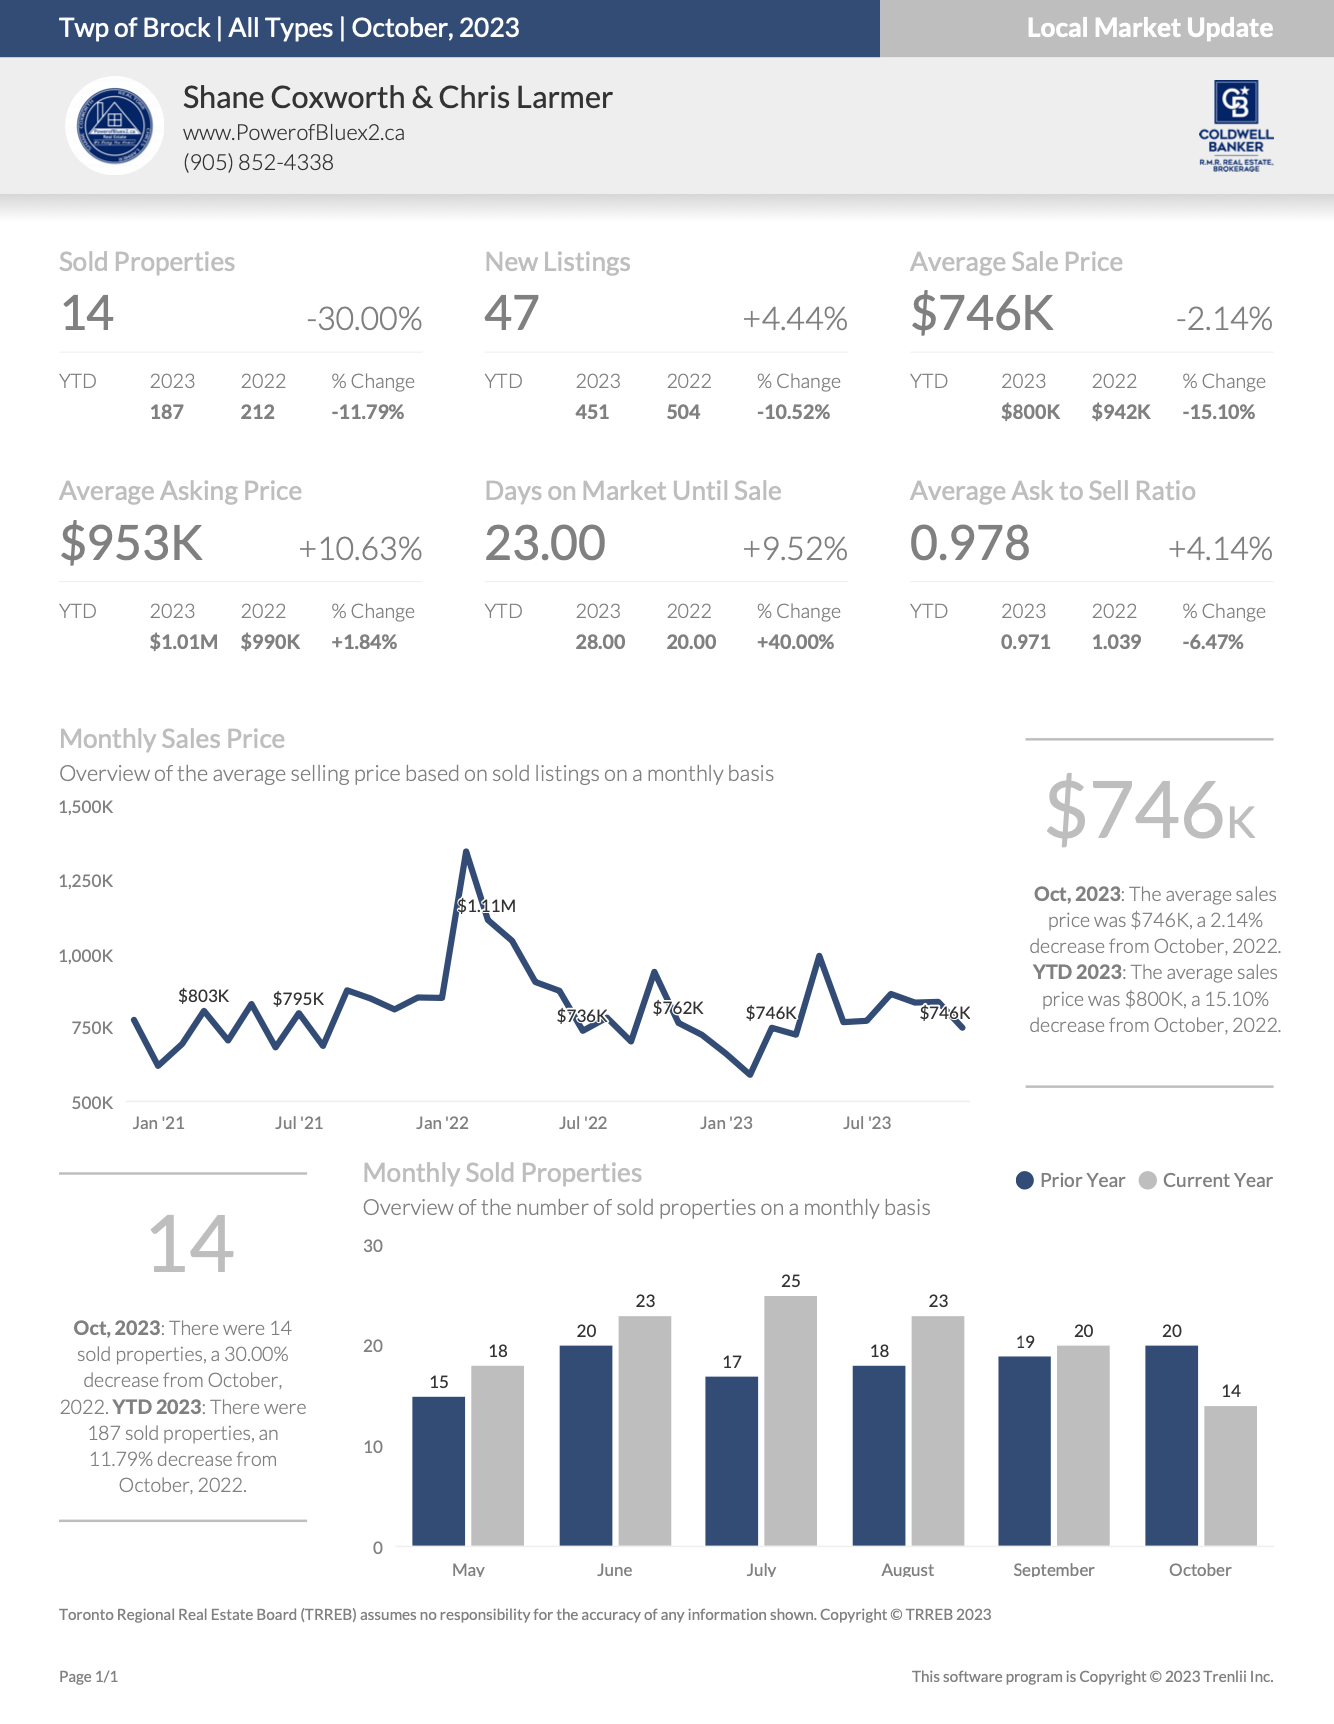
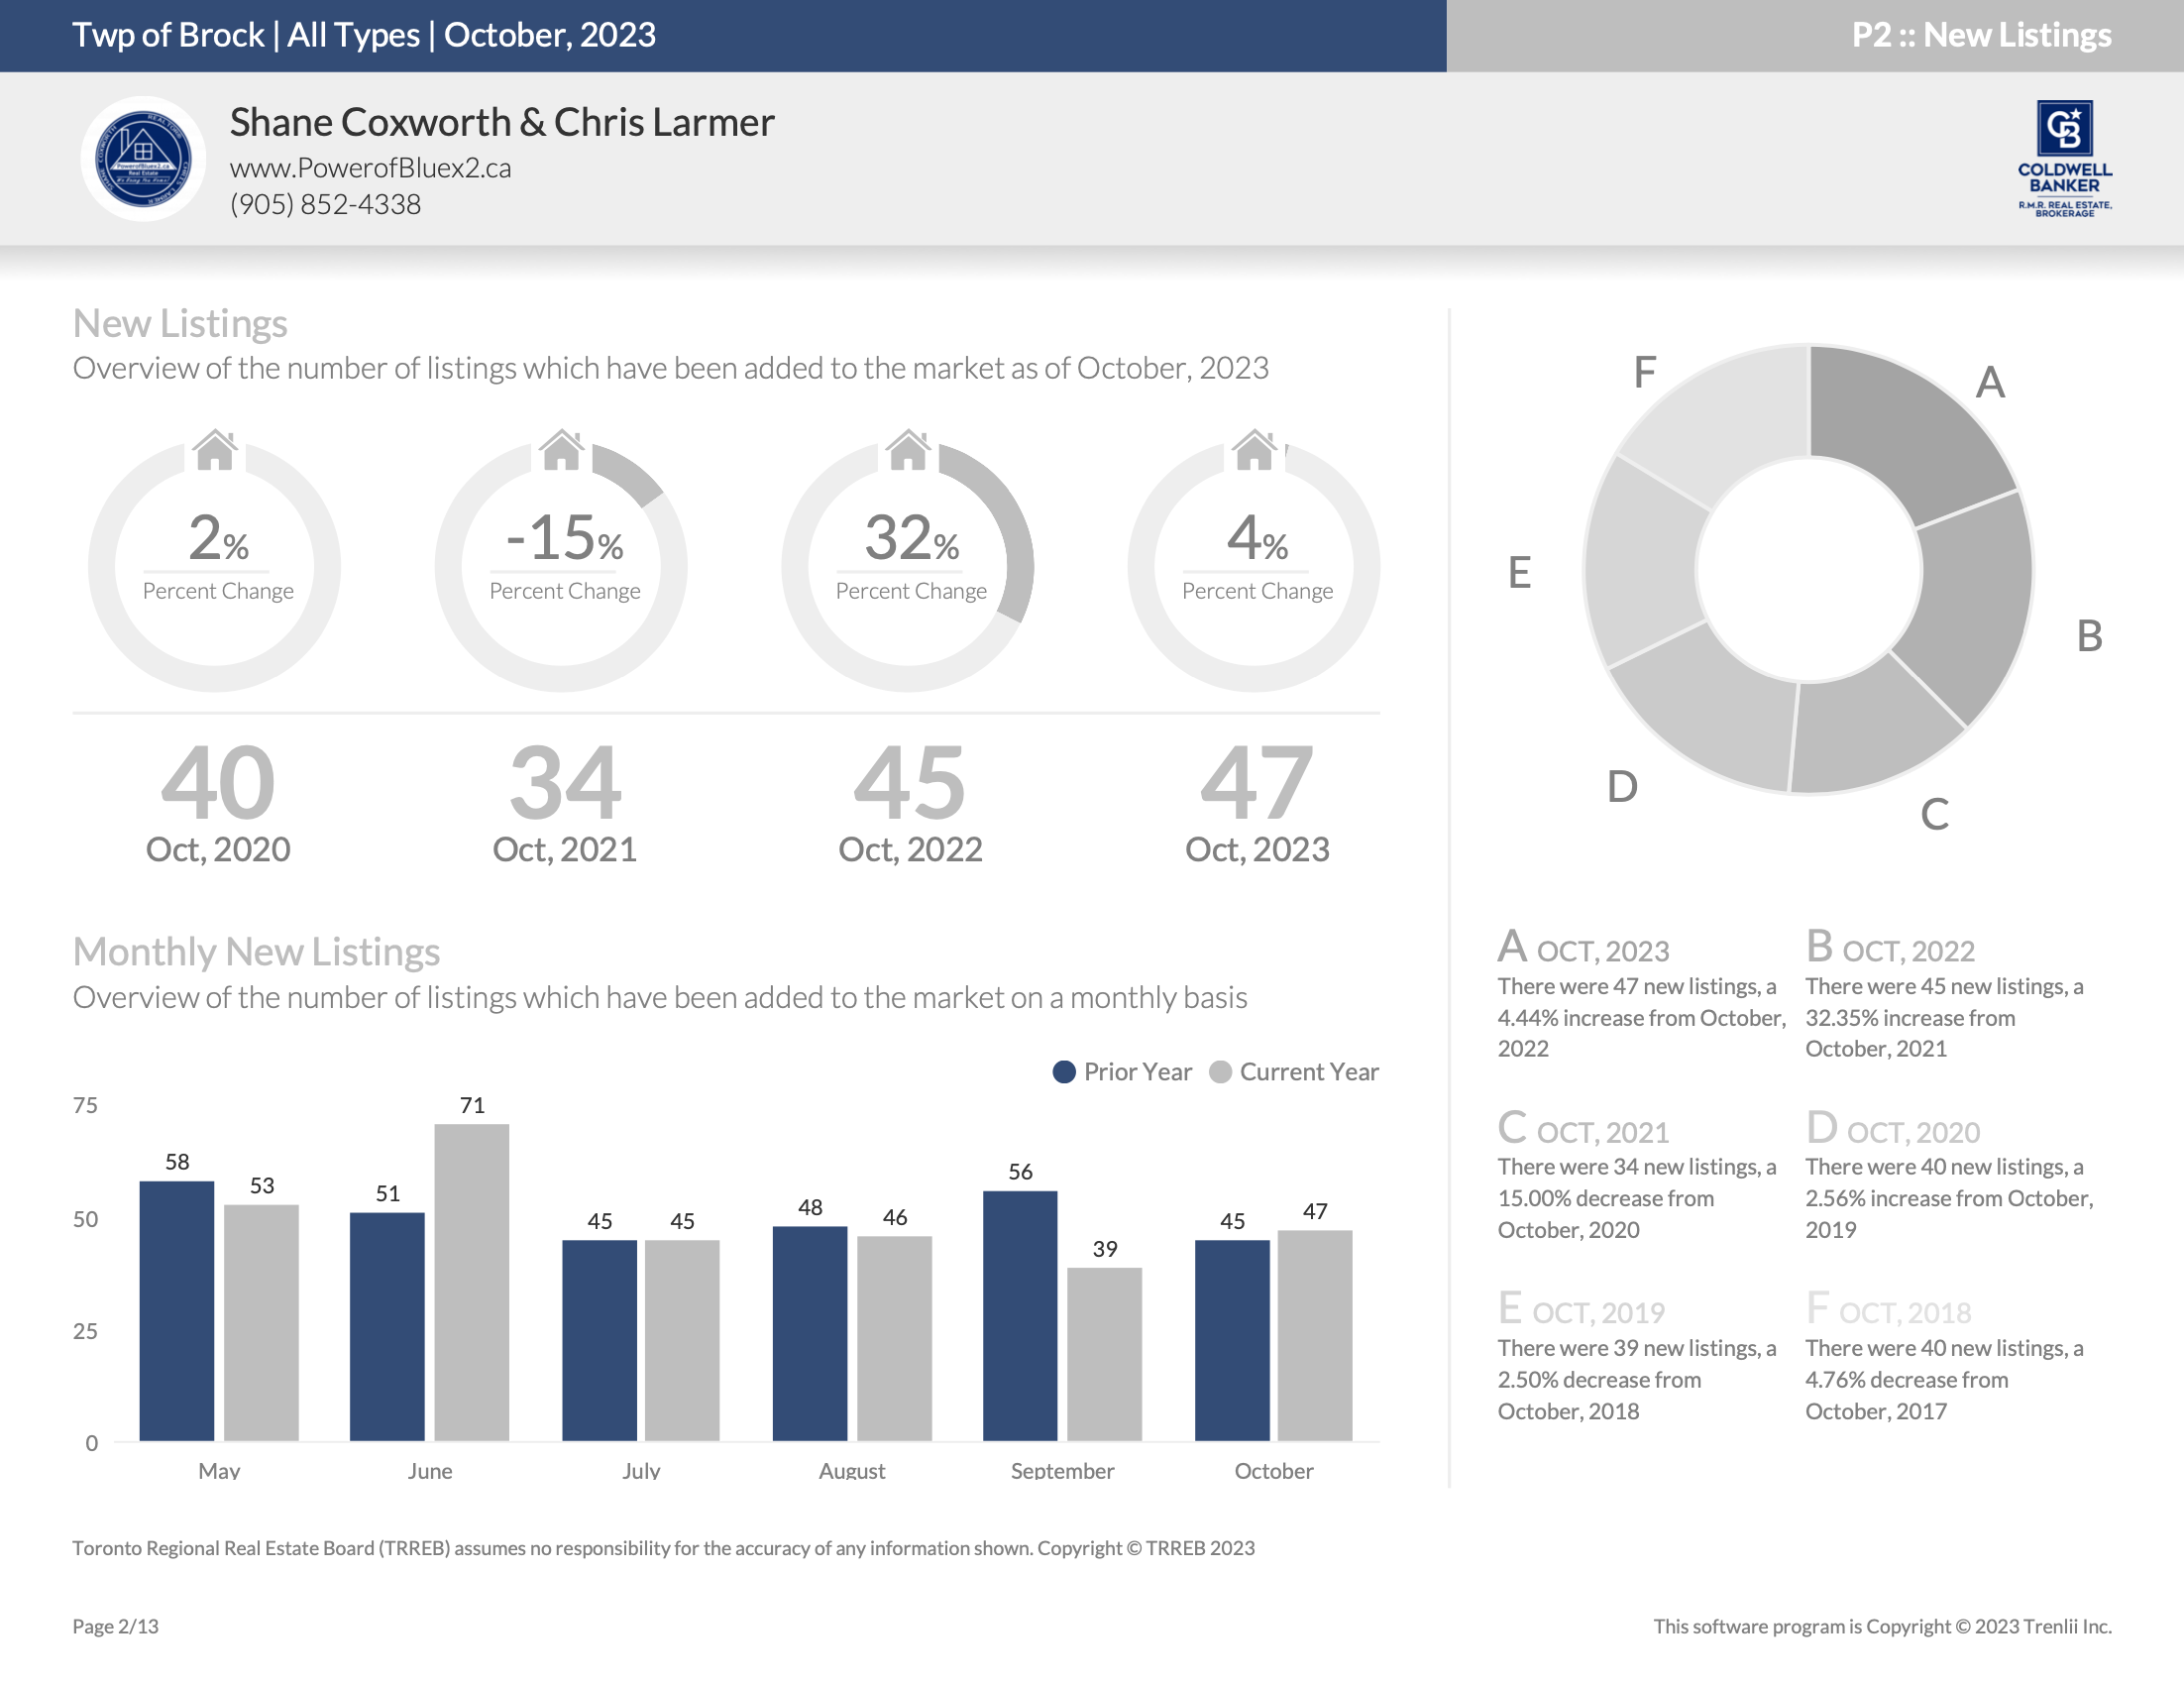
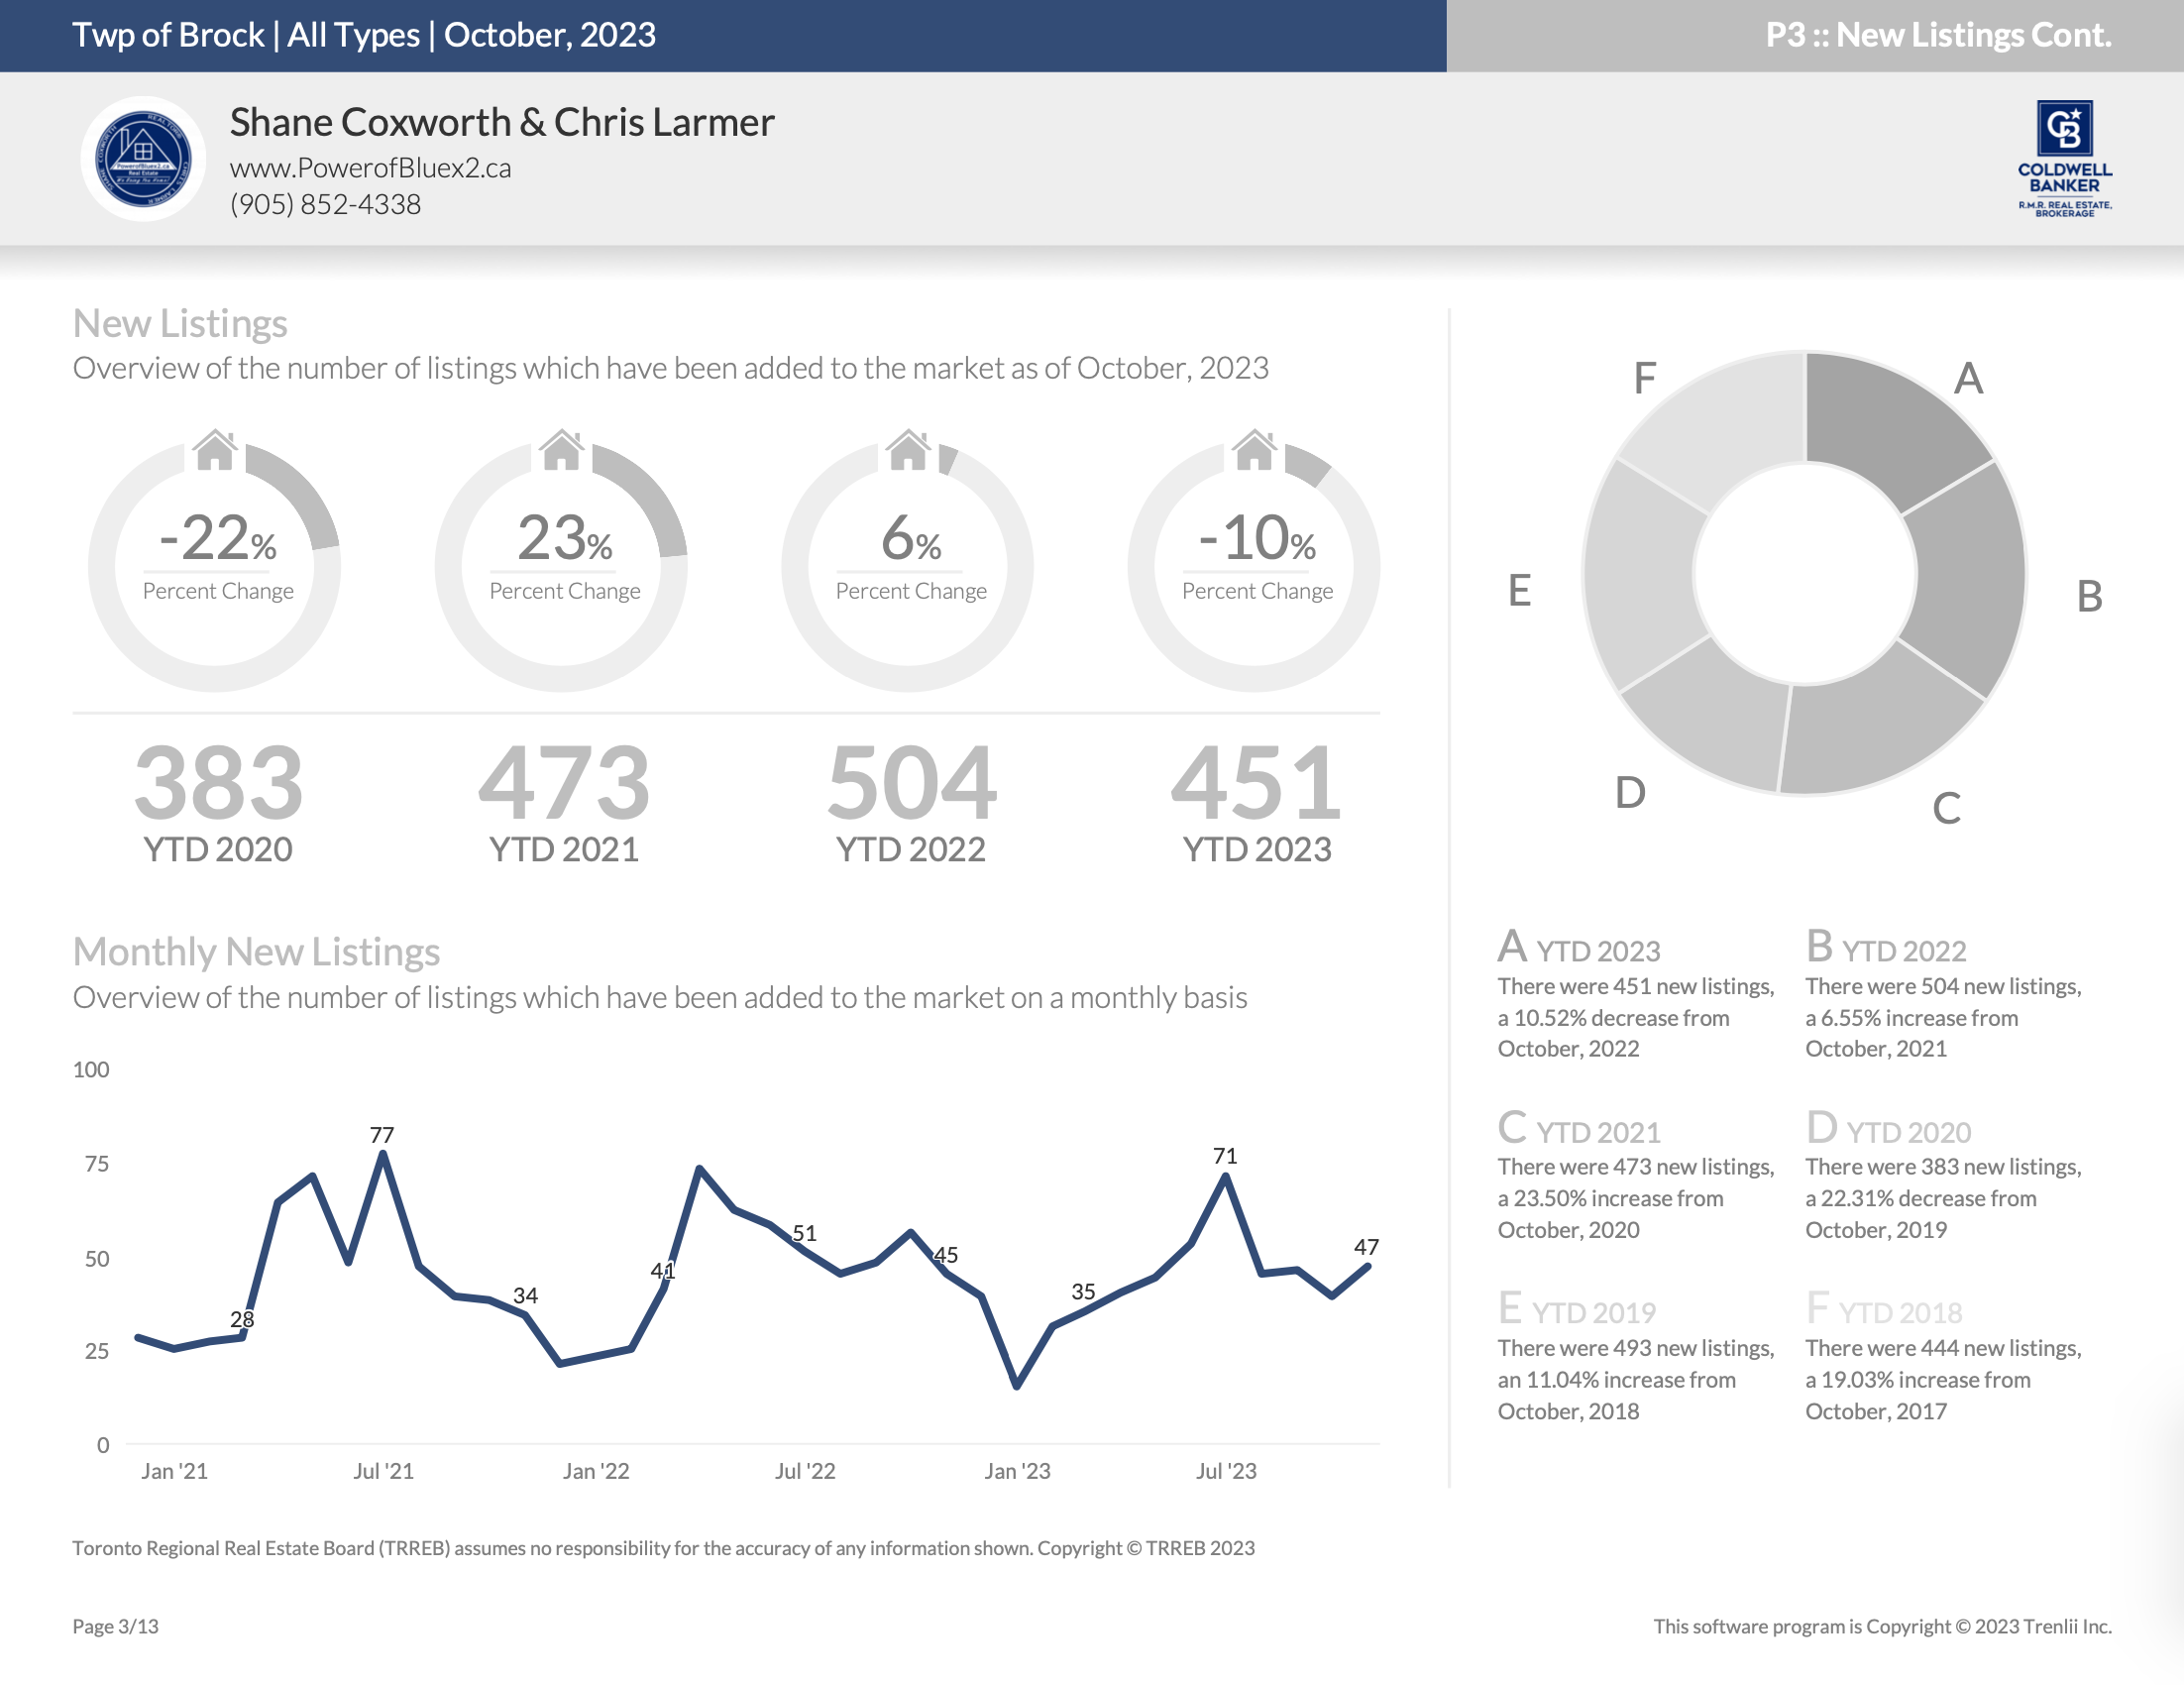
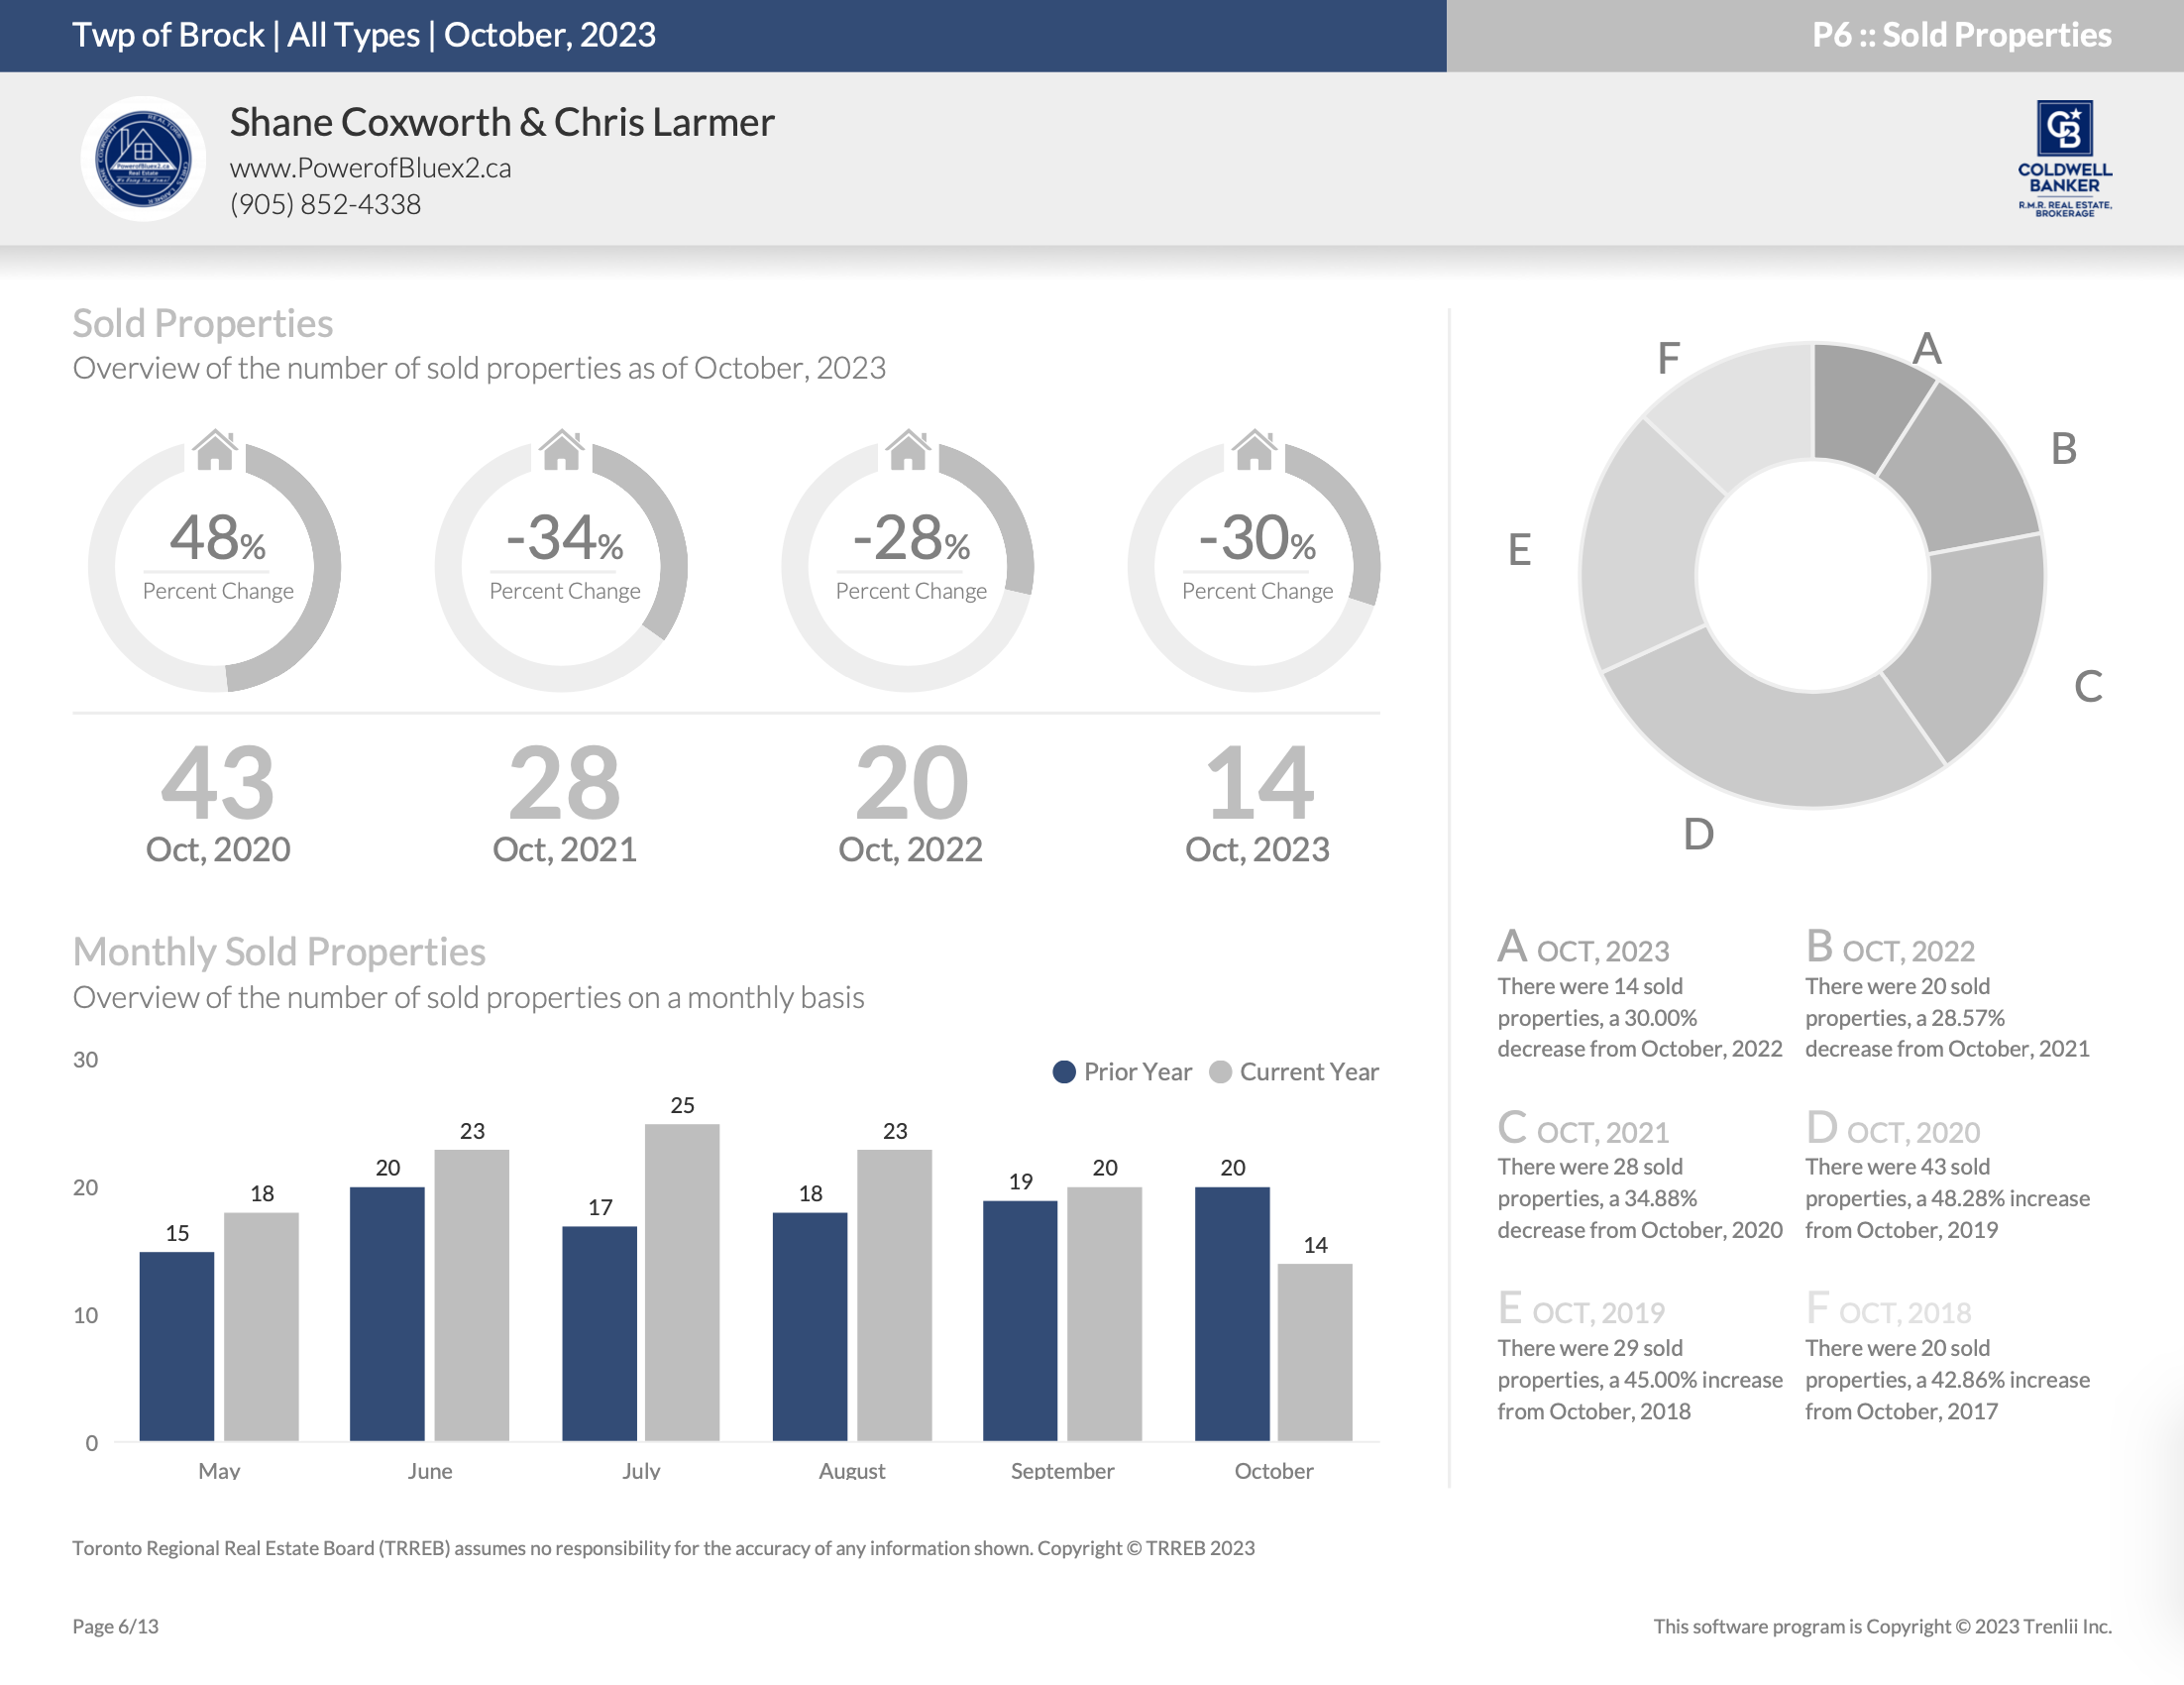
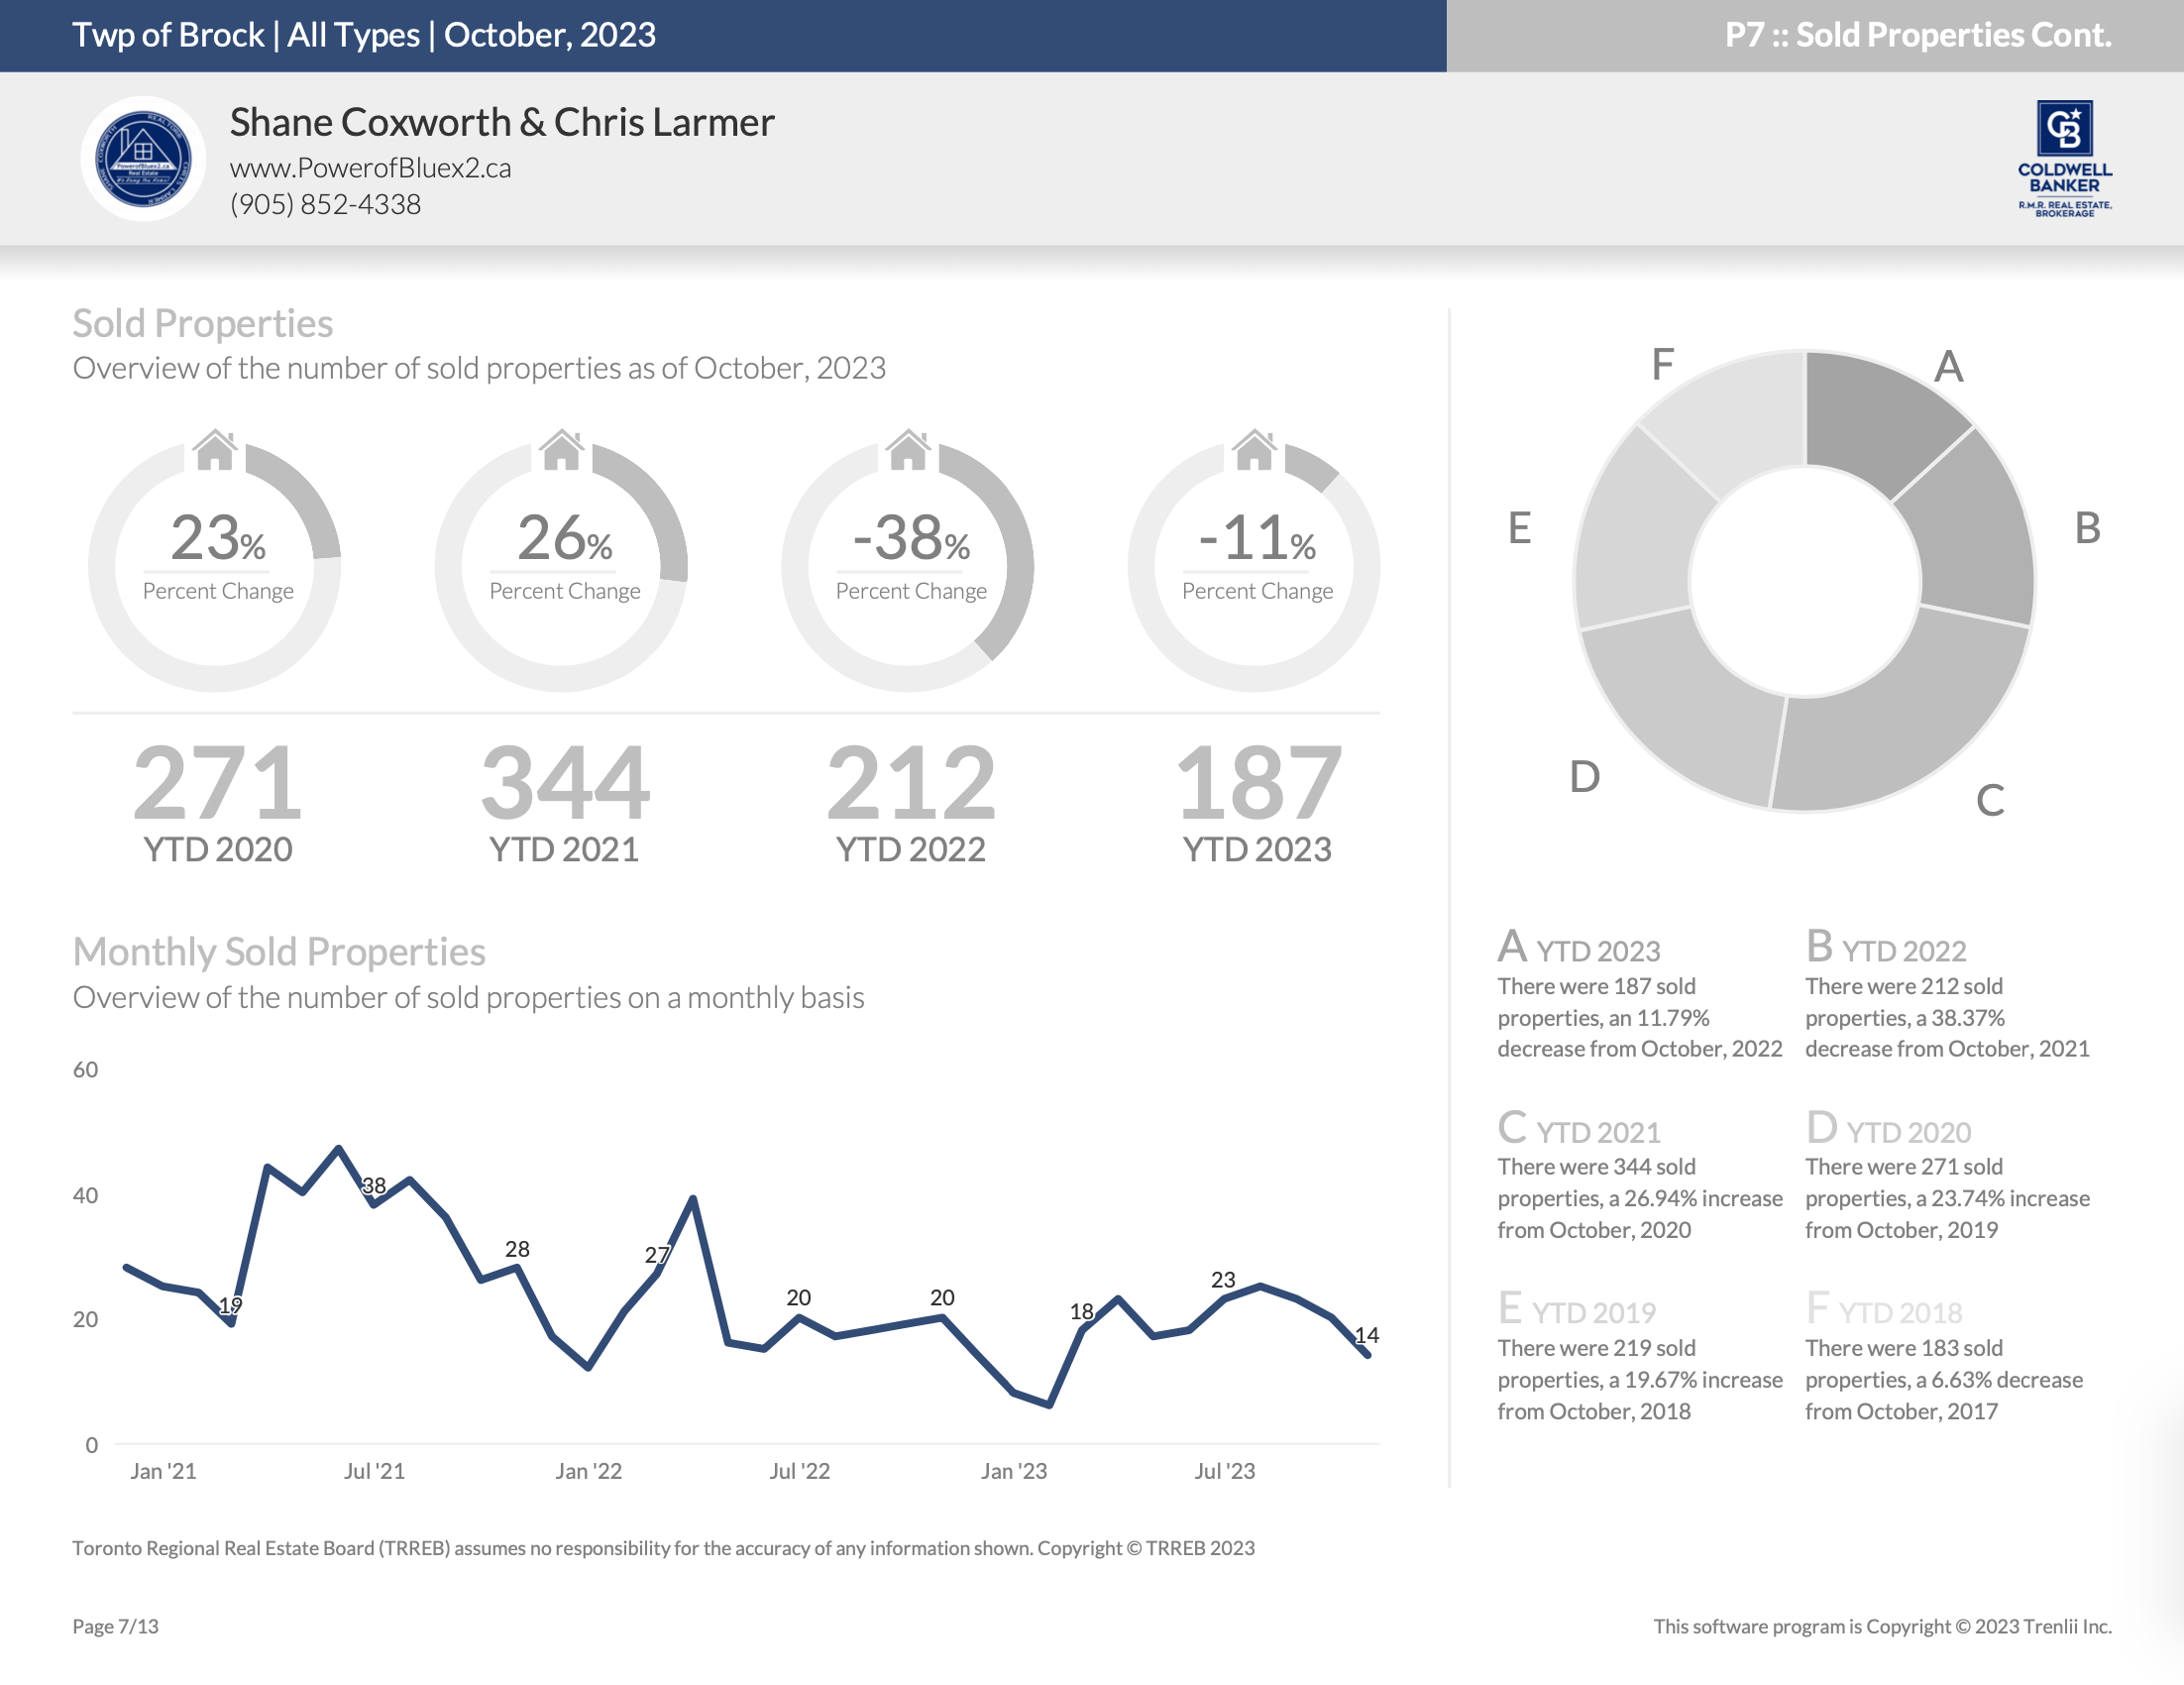
In October, 2023, we have seen 47 properties listed which has resulted in a 4.44% increase from October, 2022 in which 45 properties were listed; We have seen a year to date volume of 451 in 2023 and 504 in 2022 resulting in a 10.52% decrease. There were 14 sold properties which has resulted in a 30.00% decrease from October, 2022 in which 20 listings were sold; We have seen a year to date volume of 187 in 2023 and 212 in 2022 resulting in an 11.79% decrease.
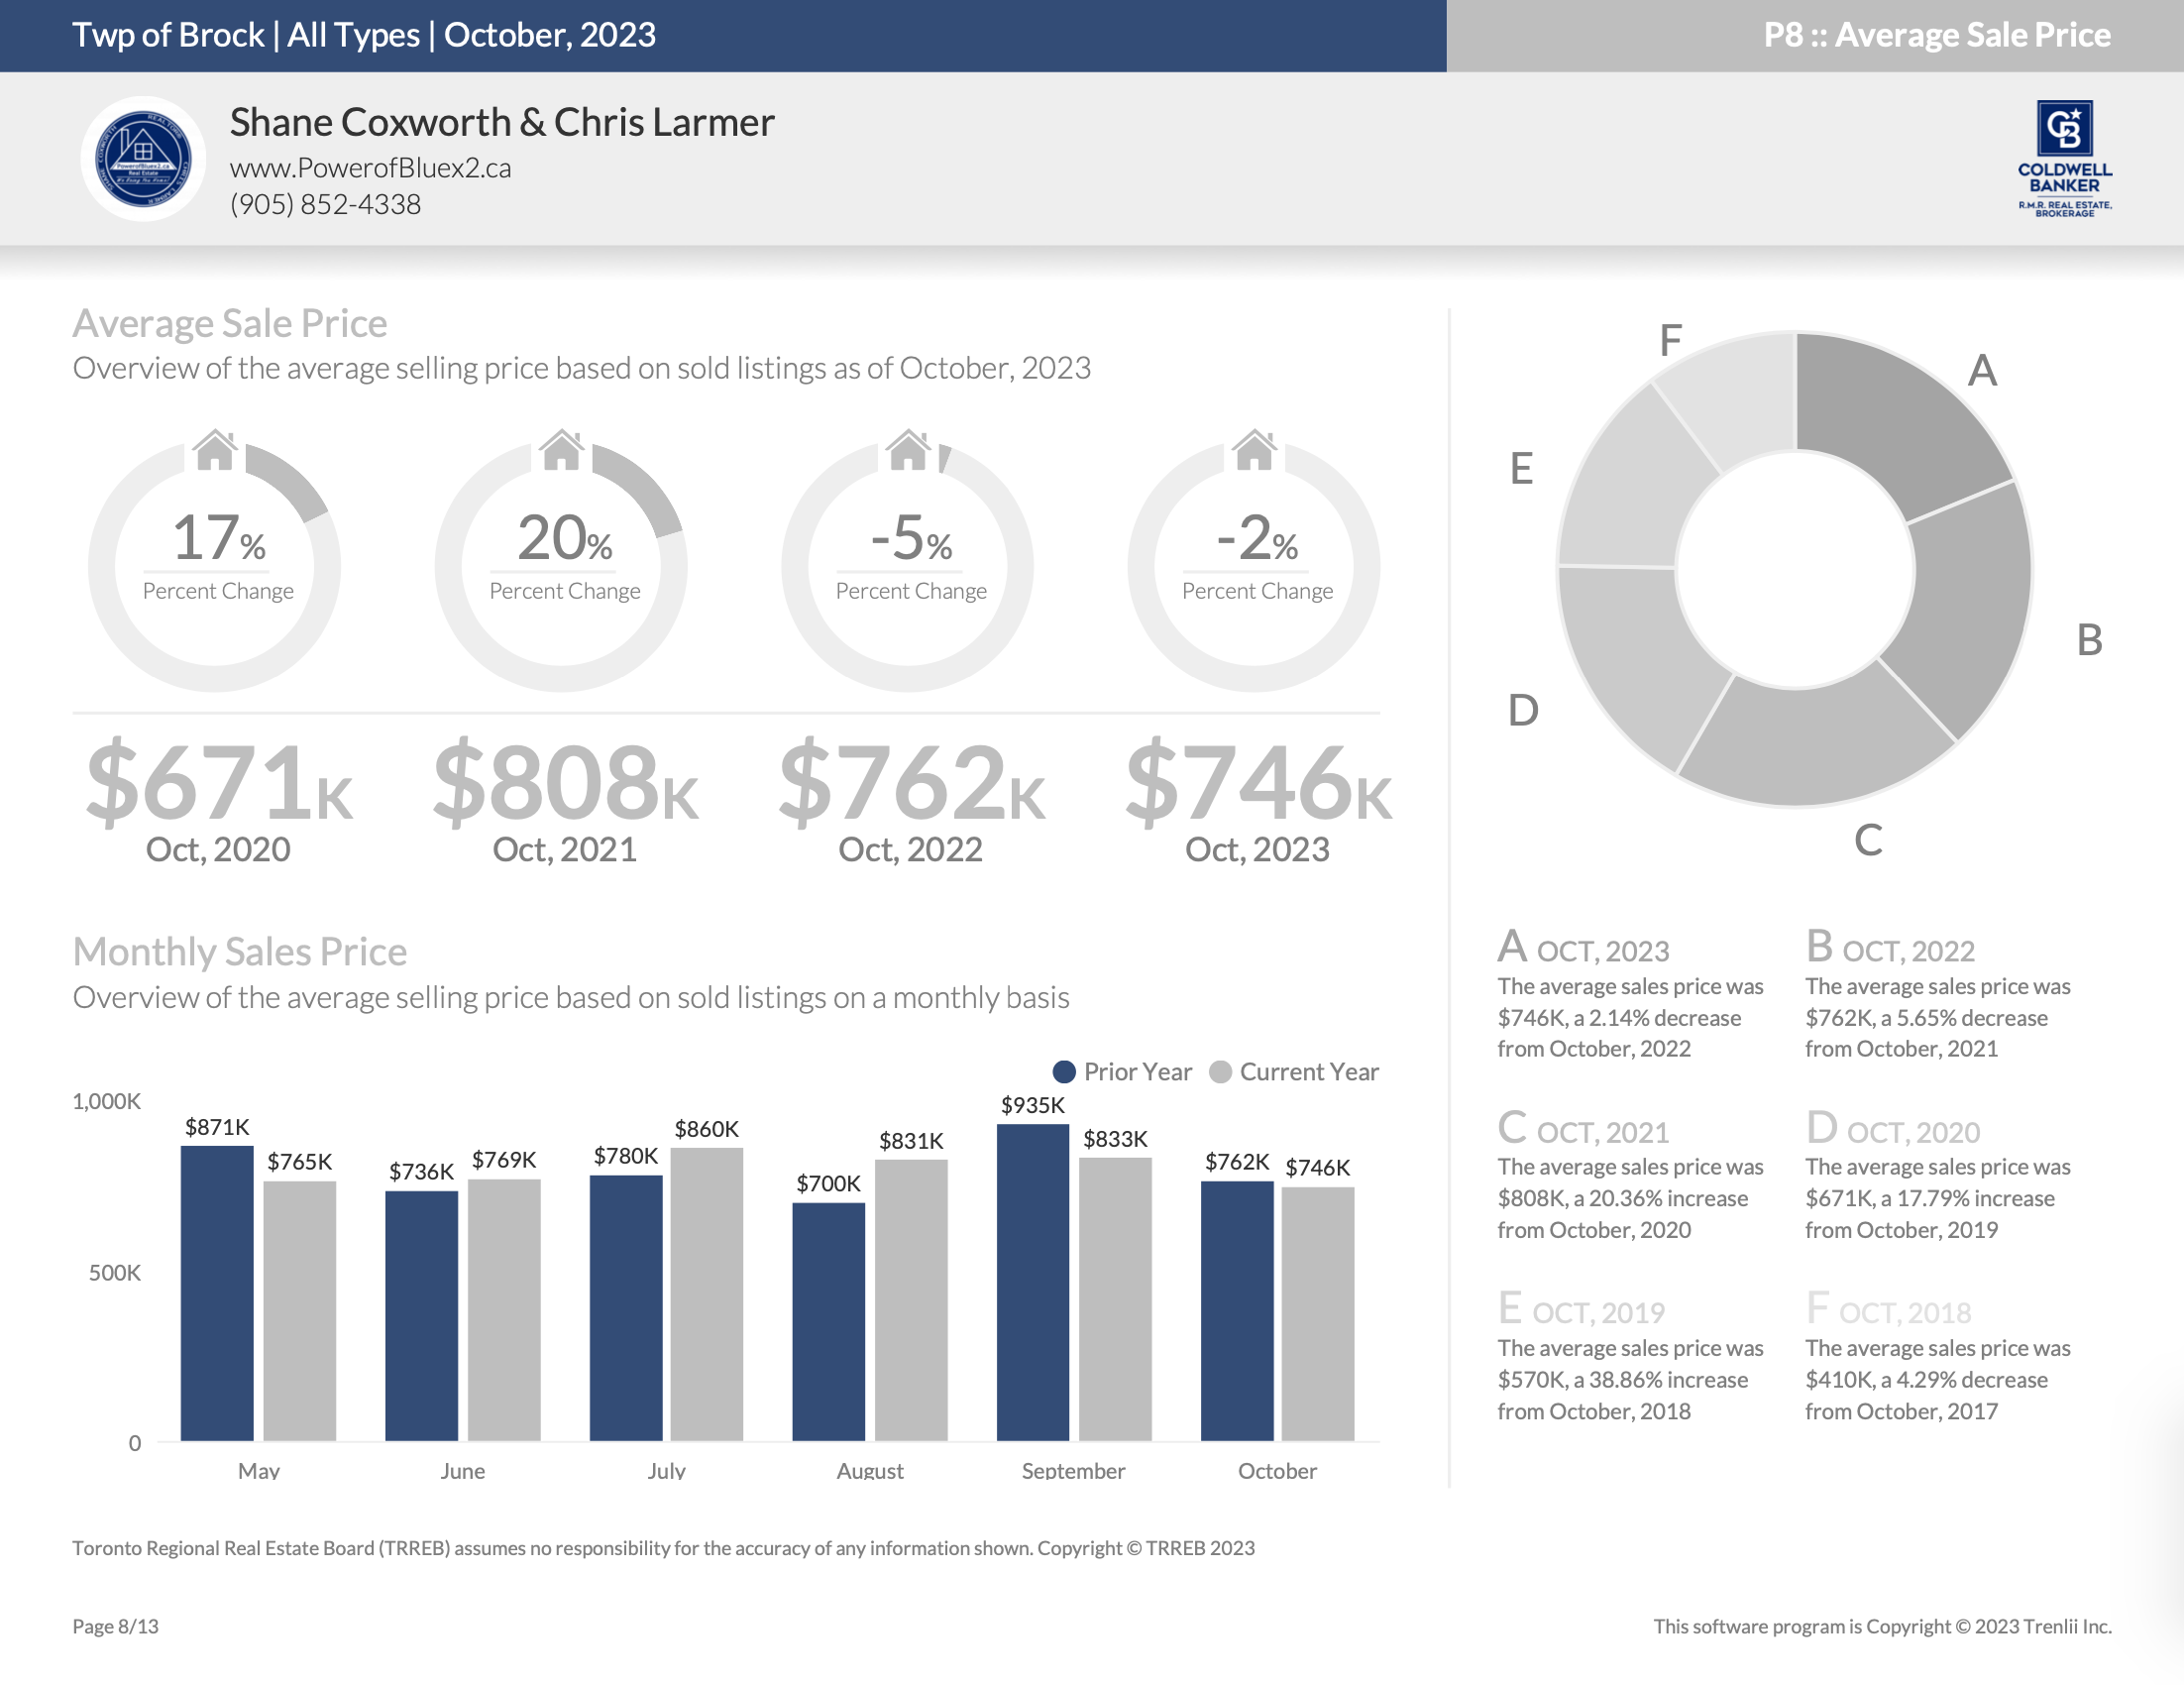
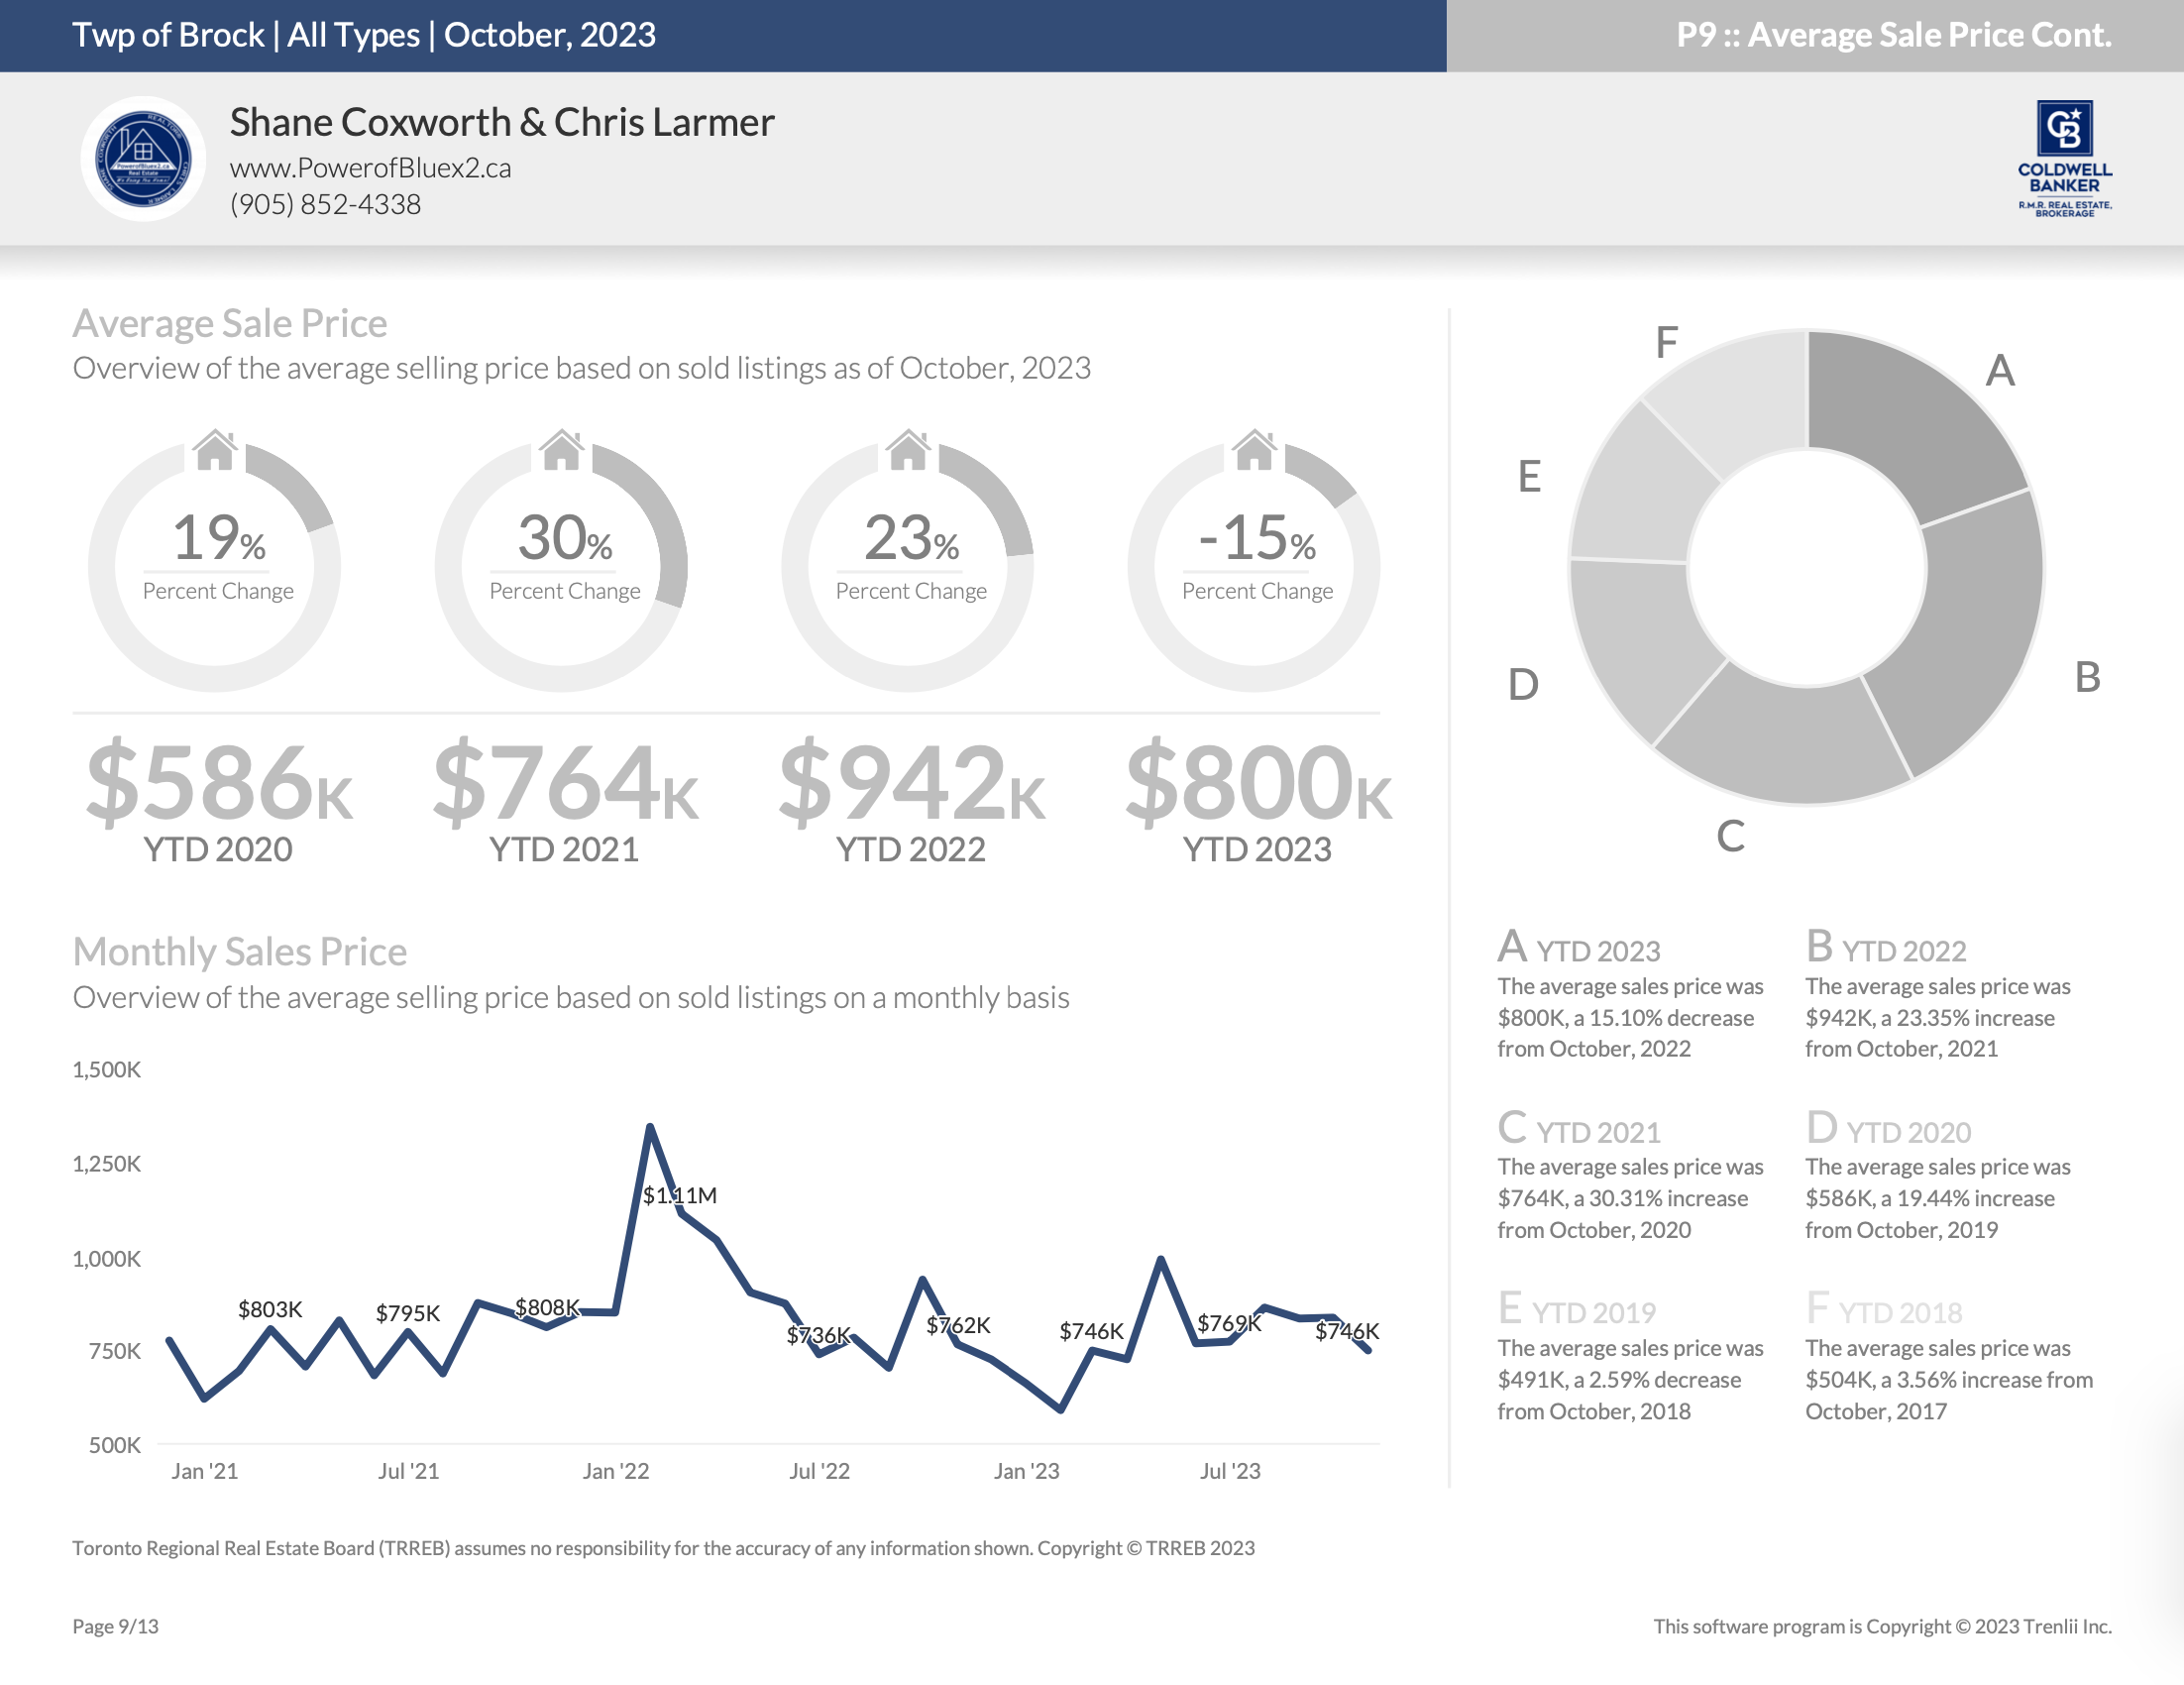
The average sales price in October, 2023 is $746K, a 2.14% decrease from October, 2022. The average sales price of October, 2022 was $762K. We have seen a year to date average sales price of $800K in 2023 and $942K in 2022 resulting in a 15.10% decrease.
Quick Review

New Listings – October 2023
New Listings – Year-To-Date
Average Asking Price – October 2023
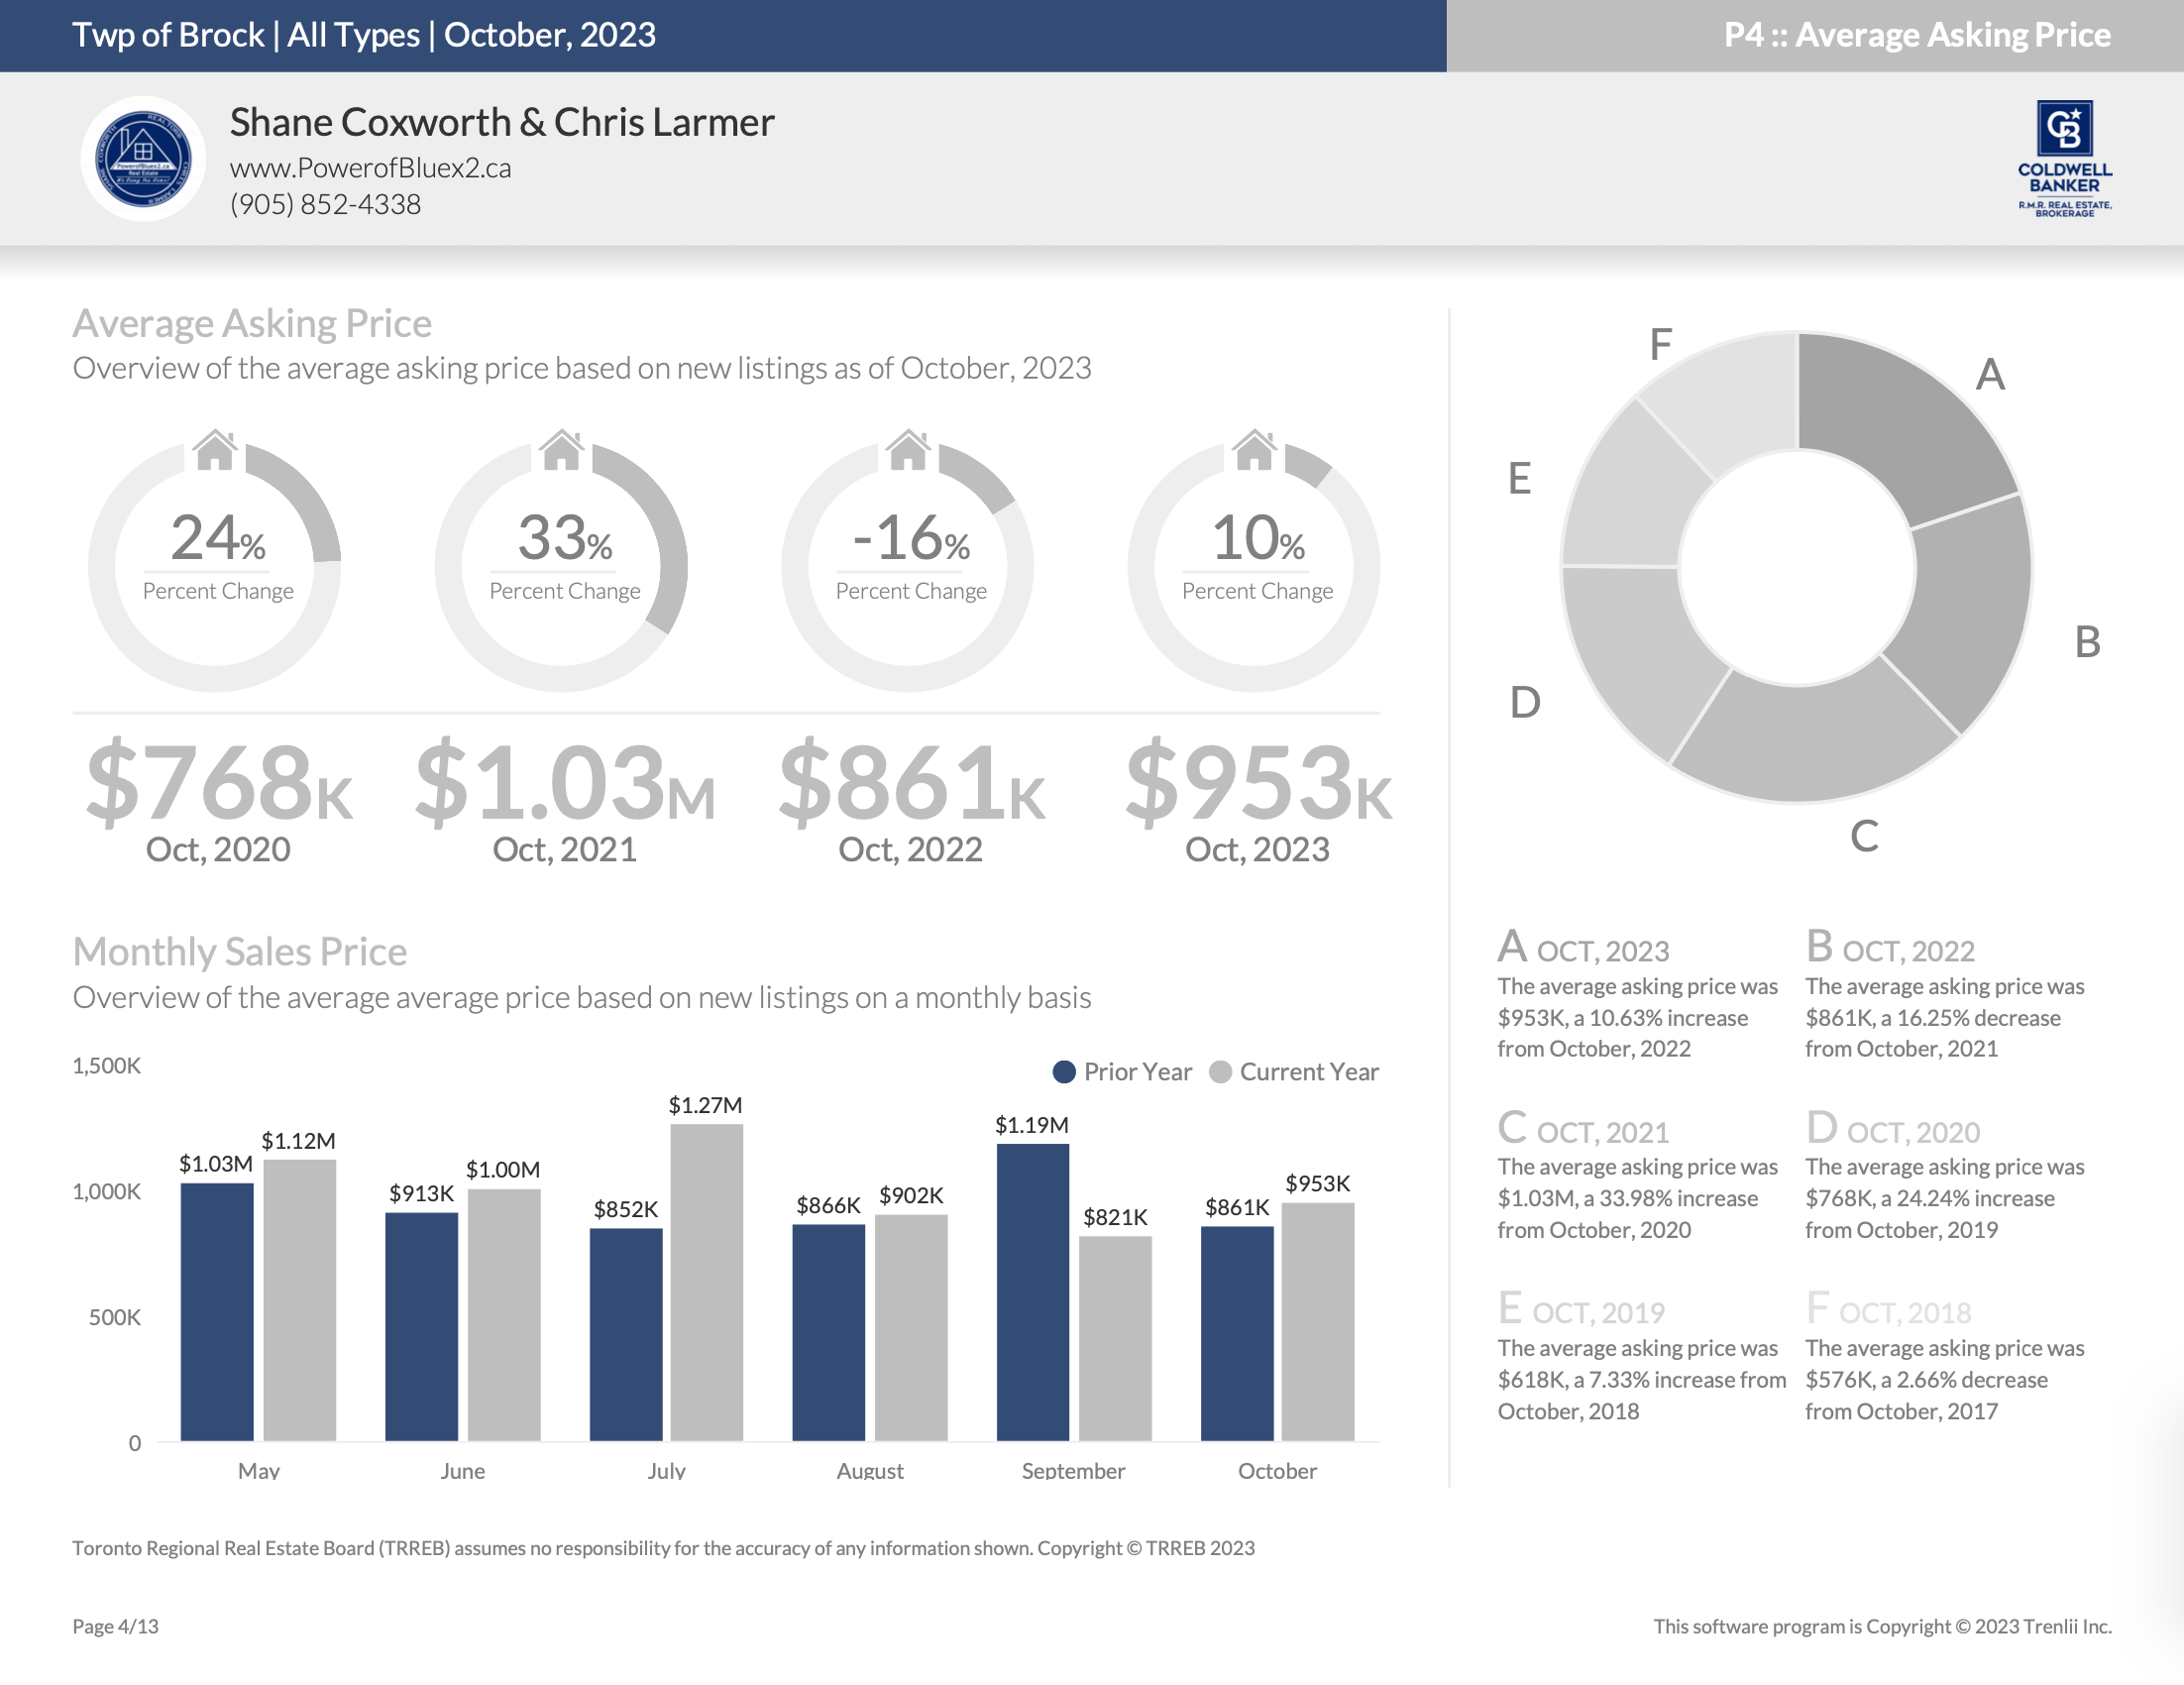
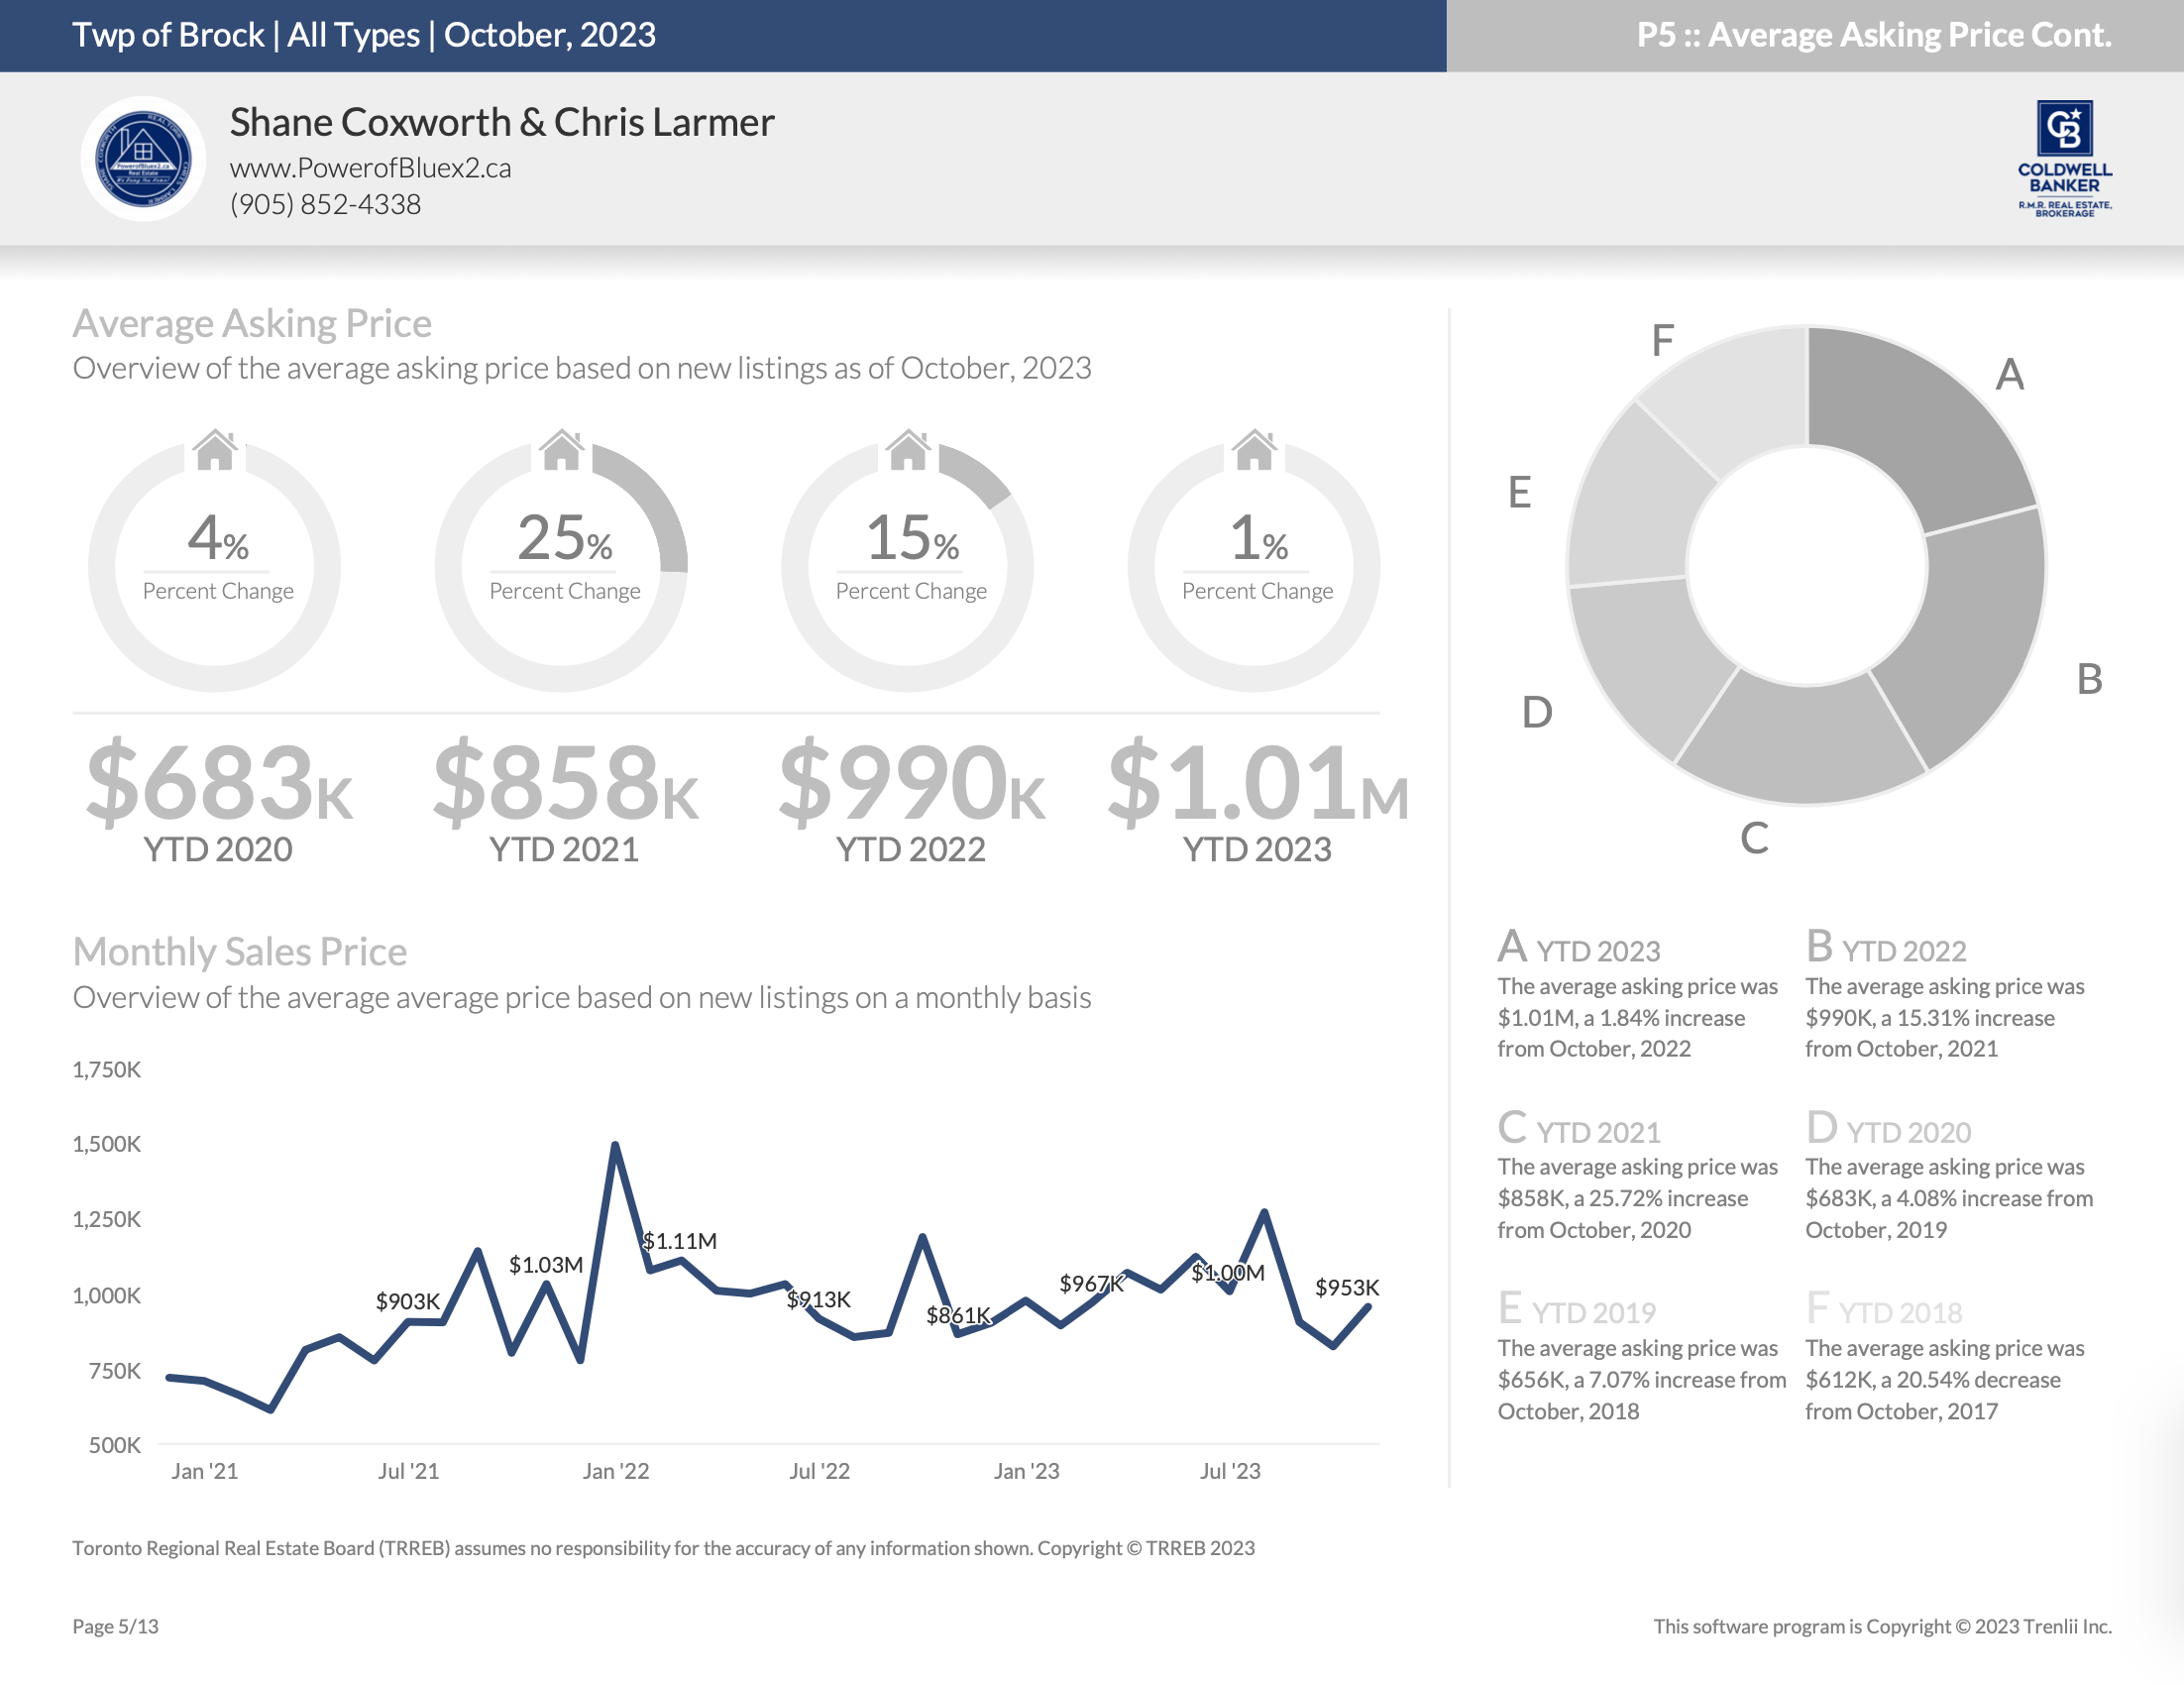
Average Asking Price – Year-to-Date
Number of Properties Sold – October 2023
Number of Properties Sold – Year-to-Date
Average Sold Price – October 2023
Average Sold Price – Year-to-Date
Days on Market – October 2023
Days on Market – Year-to-Date
Average List Price to Sell Price Ratio – October 2023
Average List Price to Sell Price Ratio – Year-to-Date
*Information is believed to be accurate at time of posting but is not guaranteed to be correct
Not intended as a solicitation if your property is already listed by another broker. Affiliated real estate agents are independent contractor sales associates, not employees. ©2021 Coldwell Banker. All Rights Reserved. Coldwell Banker and the Coldwell Banker logos are trademarks of Coldwell Banker Real Estate LLC. The Coldwell Banker® System is comprised of company owned offices which are owned by a subsidiary of Realogy Brokerage Group LLC and franchised offices which are independently owned and operated. The Coldwell Banker System fully supports the principles of the Fair Housing Act and the Equal Opportunity Act.
Click below for more reports
Scugog Housing October 2023
Scugog Housing October 2023
![]()
Housing Market Report for October 2023
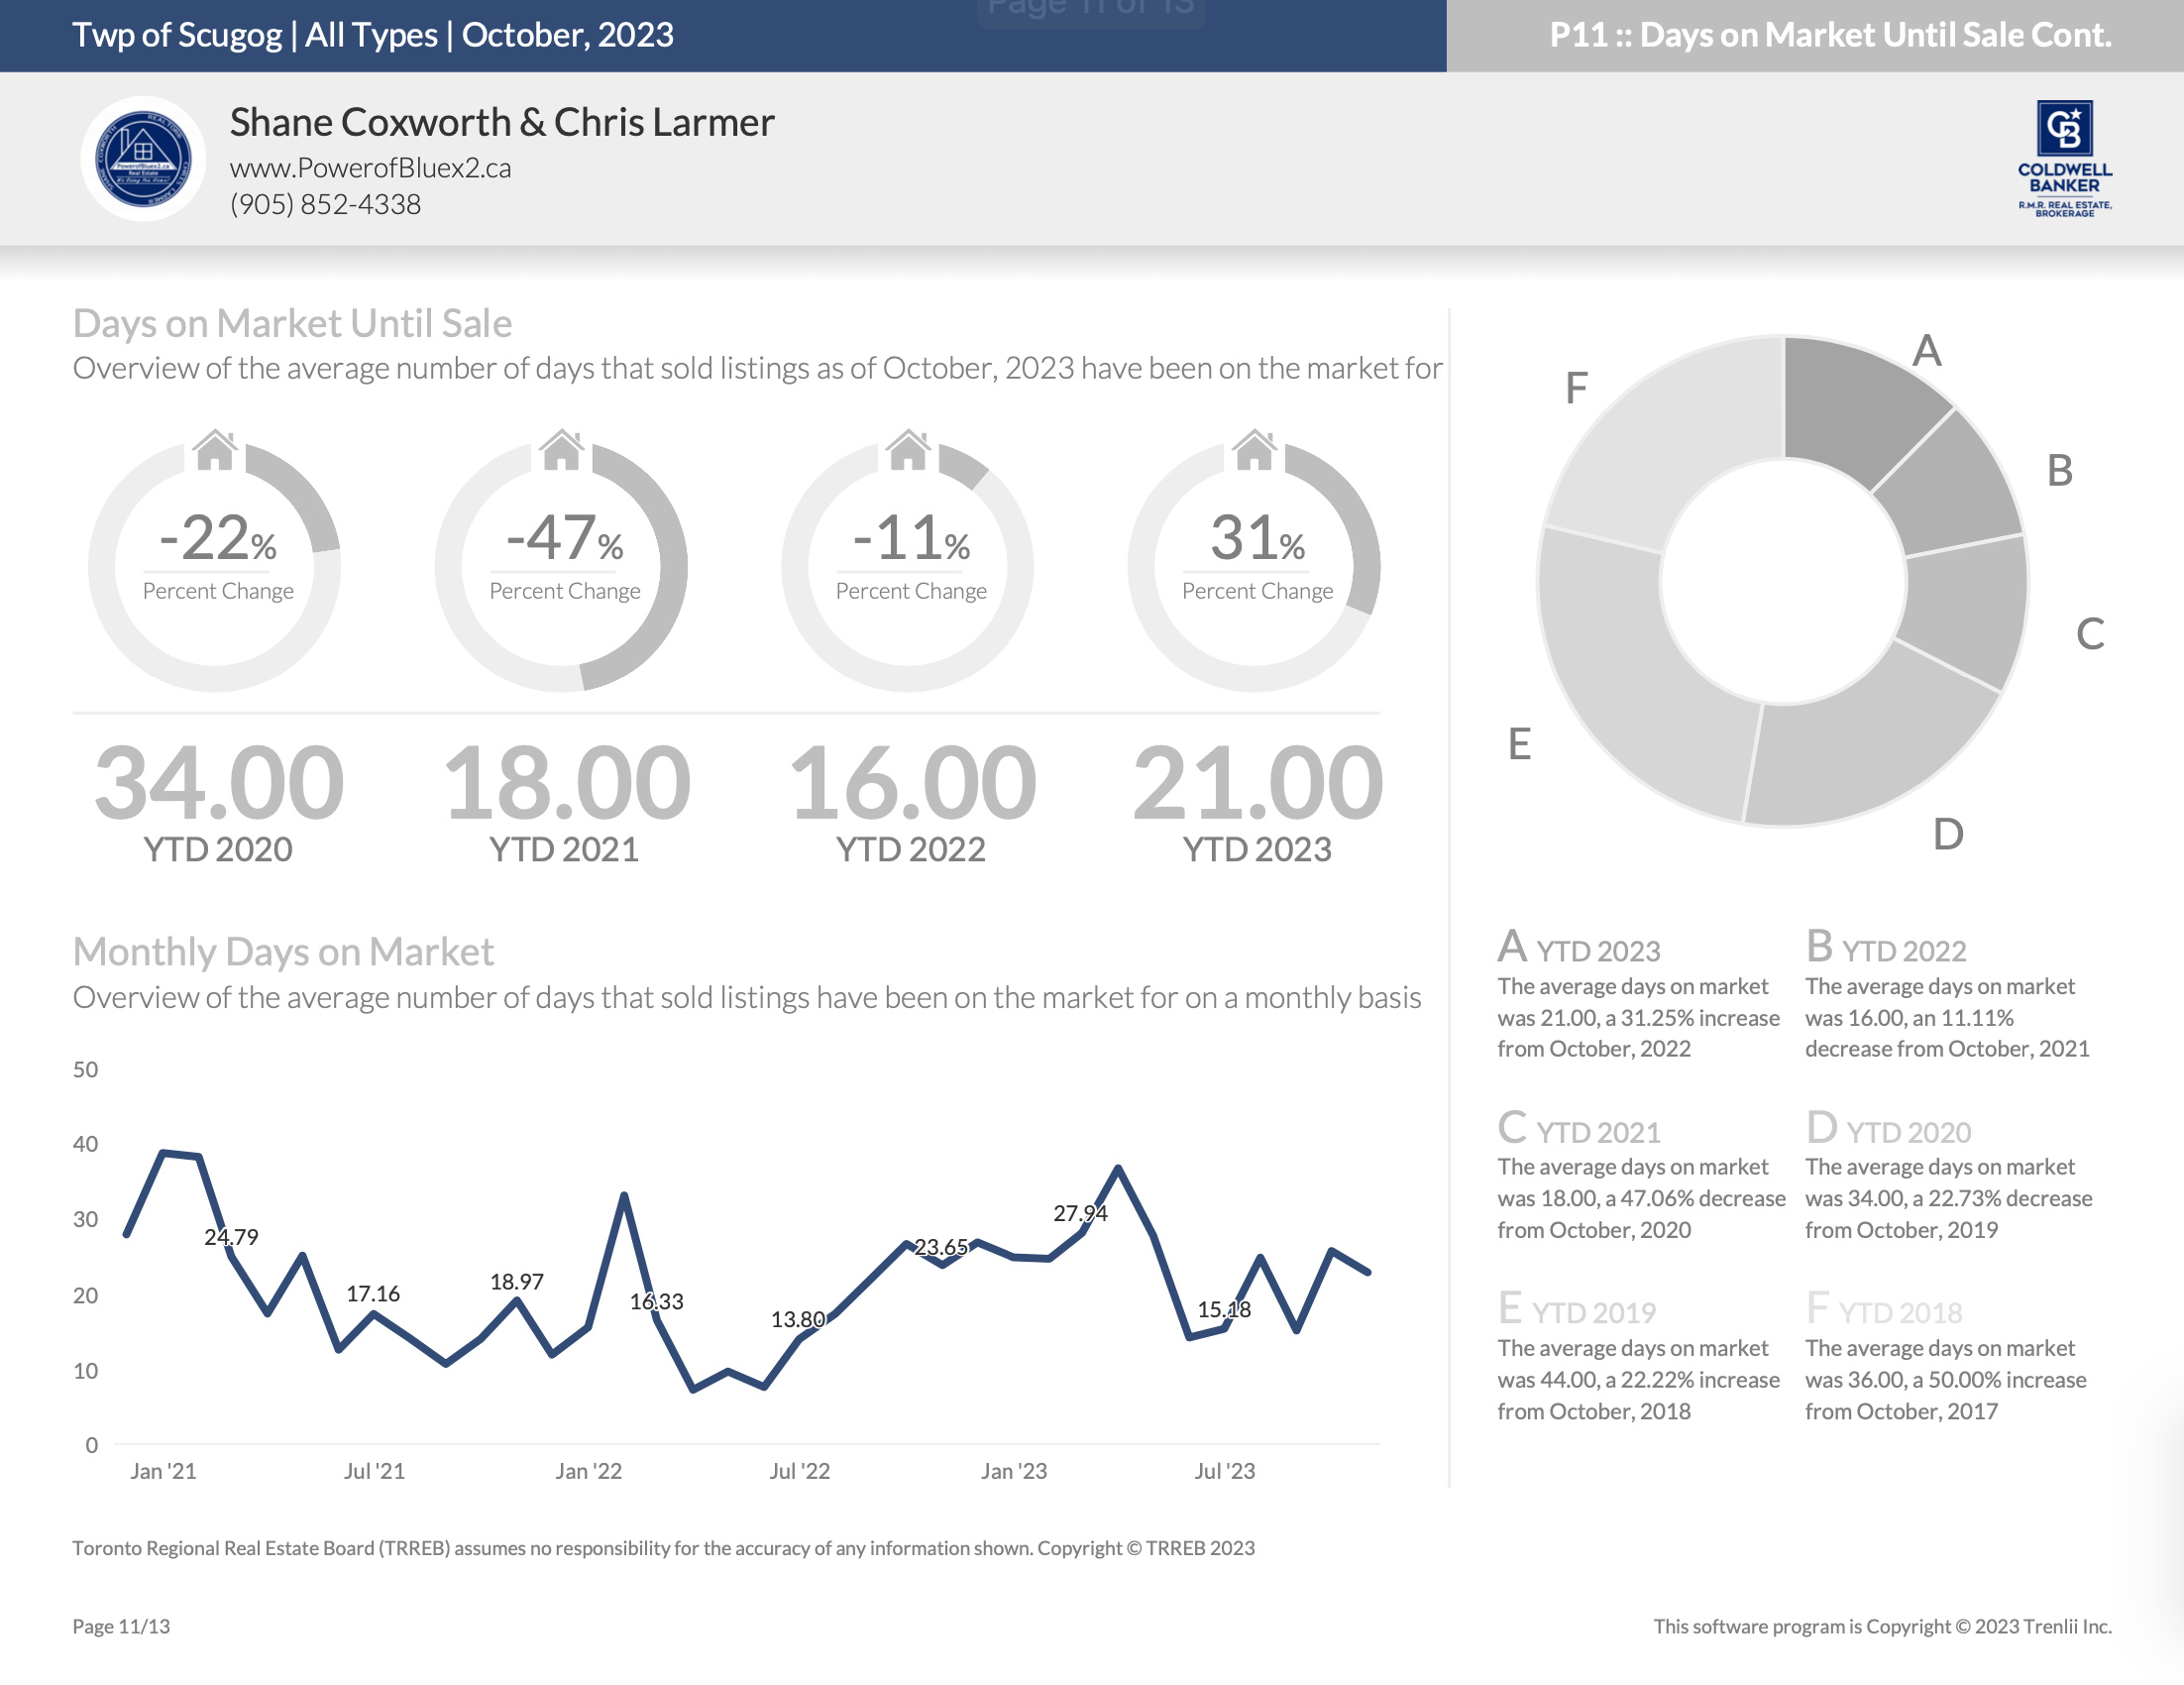
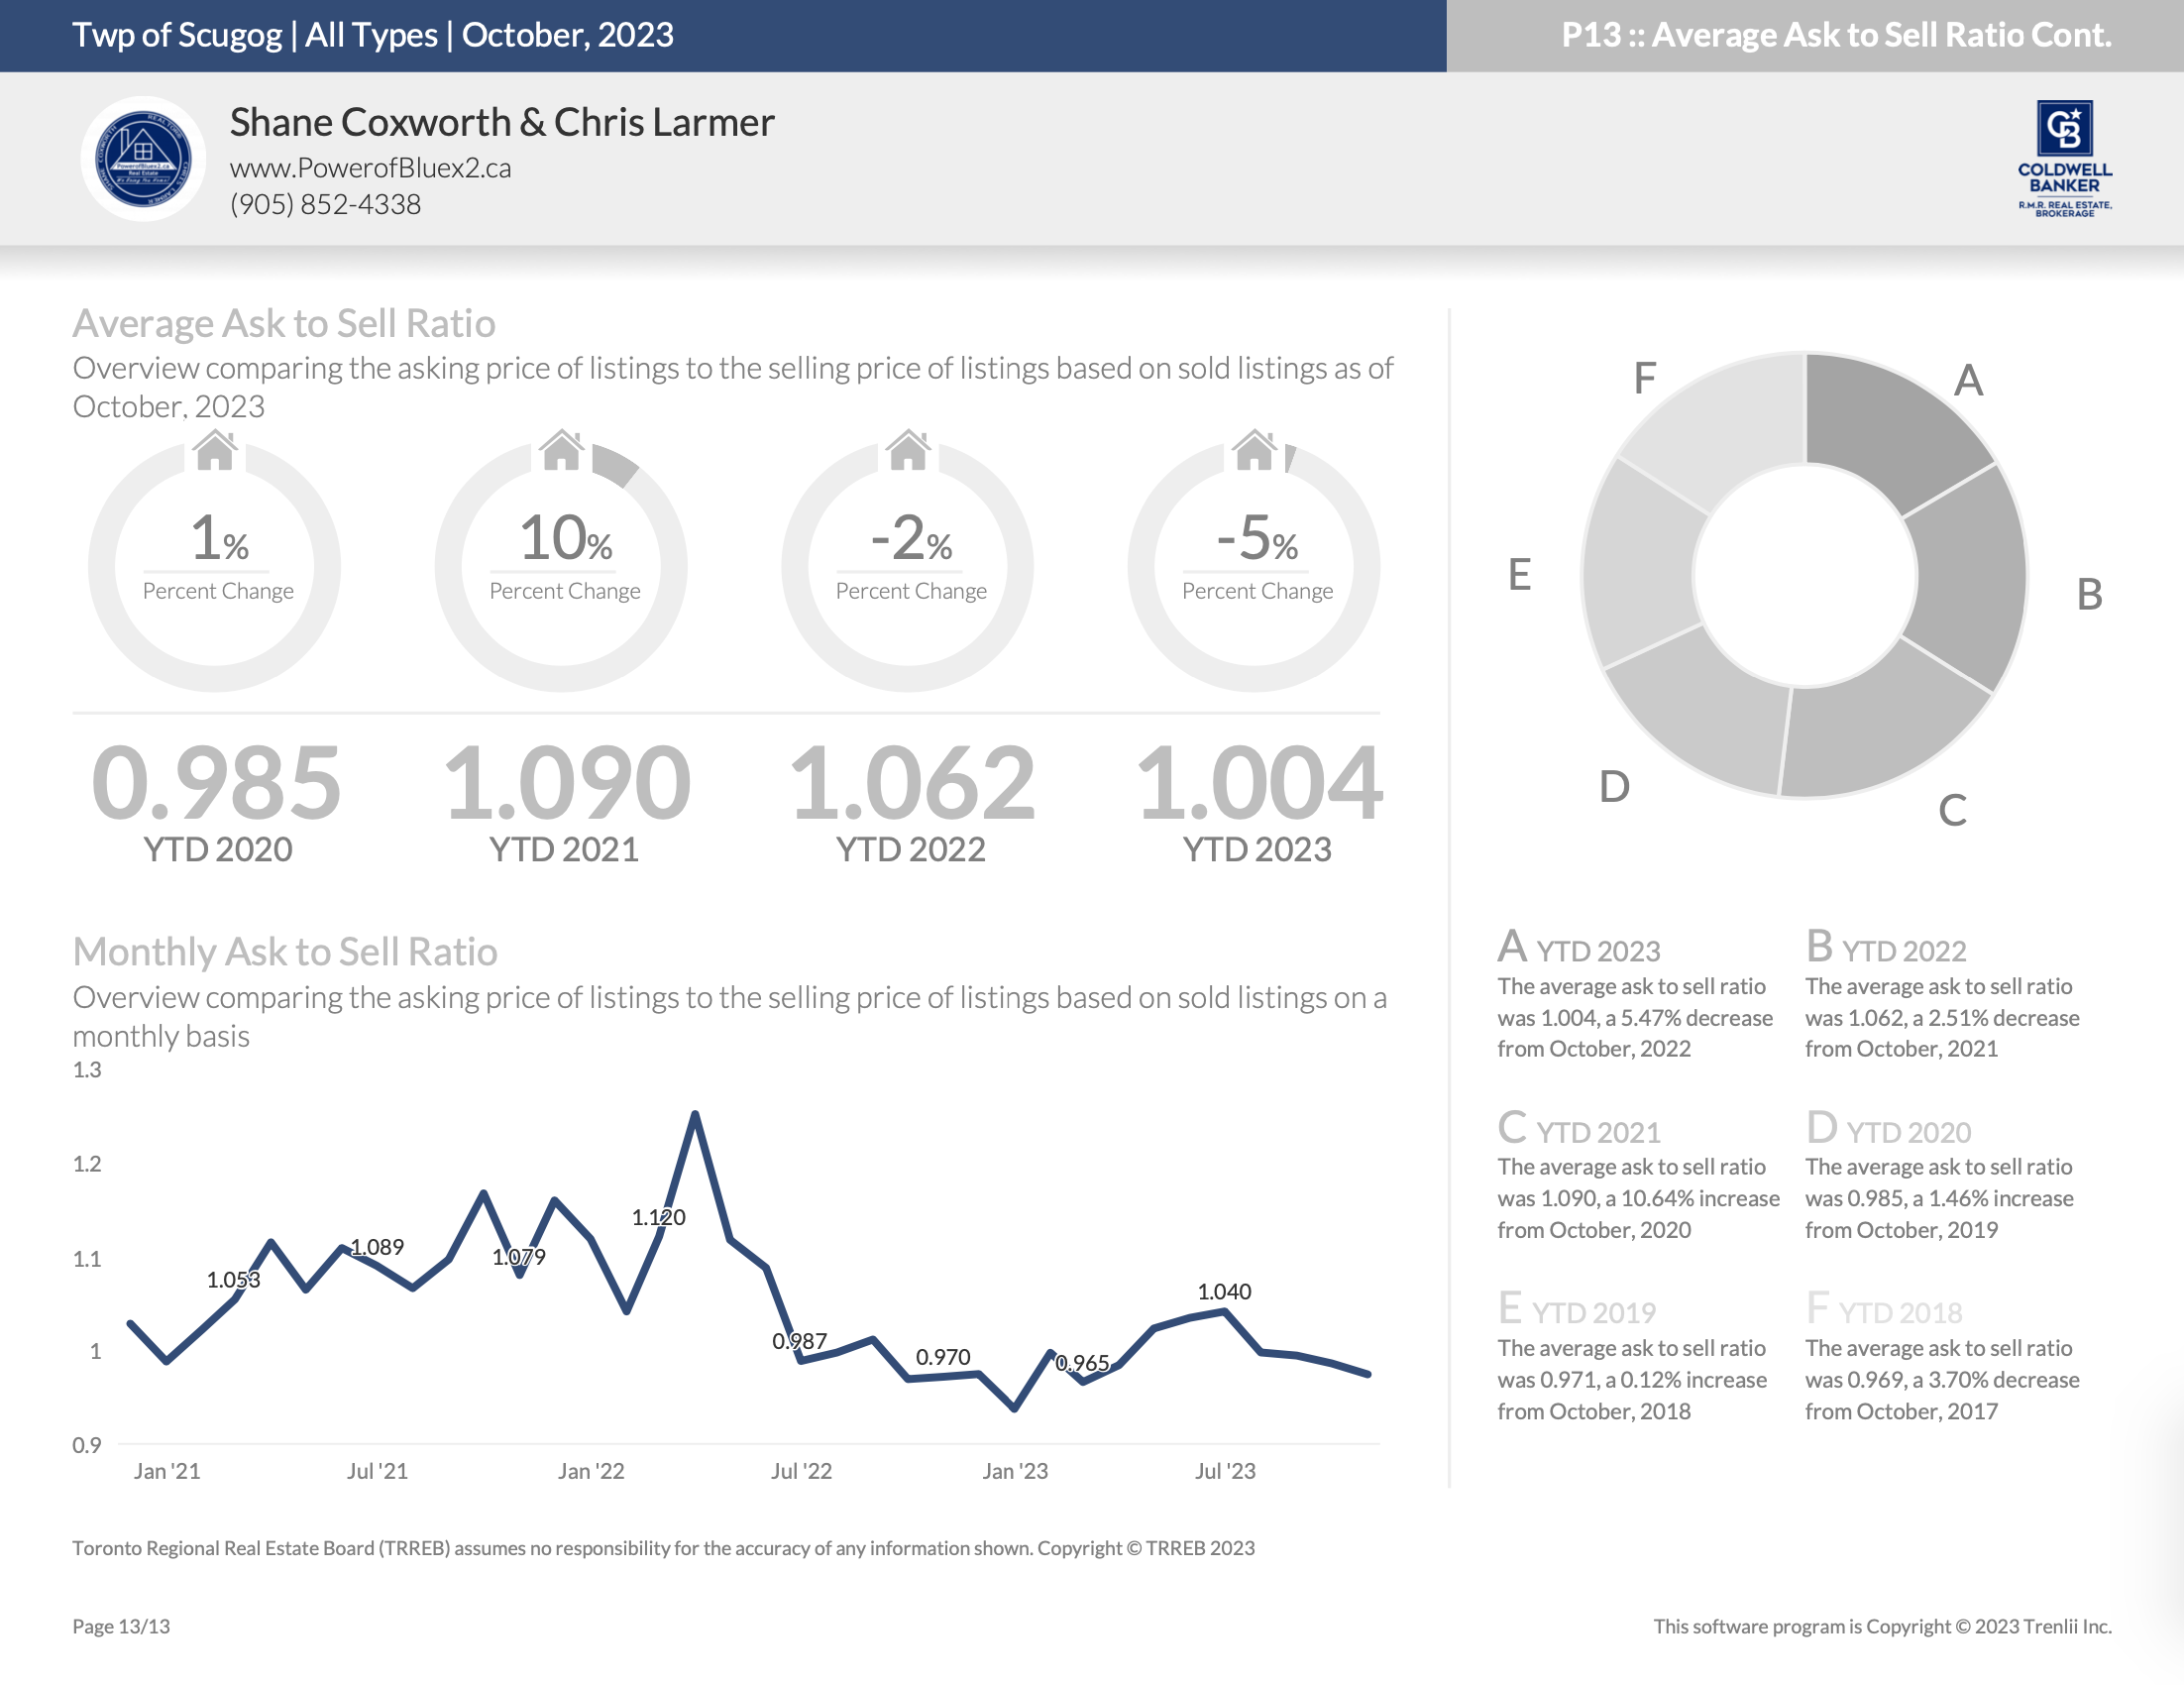
Here is the Township of Scugog Housing October 2023 report (all housing types), with reports from the Toronto Regional Real Estate Board and the Central Lakes Association of REALTORS® included.
This housing report for Township of Scugog includes the number of new listings, average list price, number of properties sold, average selling price, average days on market and average asking price to selling price ratio for all property types within the Township of Scugog.
Scroll to the bottom for links to take you to the housing market reports for Durham, Uxbridge, Brock and the Kawartha Lakes
![]()
CREA HOUSING MARKET REPORT – NOVEMBER 2023
![]()
TRREB Housing Market Charts October 2023
Read the Toronto Regional Real Estate Board Market Watch Report
![]()
Read the Durham Association of REALTORS® FULL Real Estate Report
![]()
Township of Scugog Full Report
*Some values may vary slightly based on the exact date and time the reports were generated.
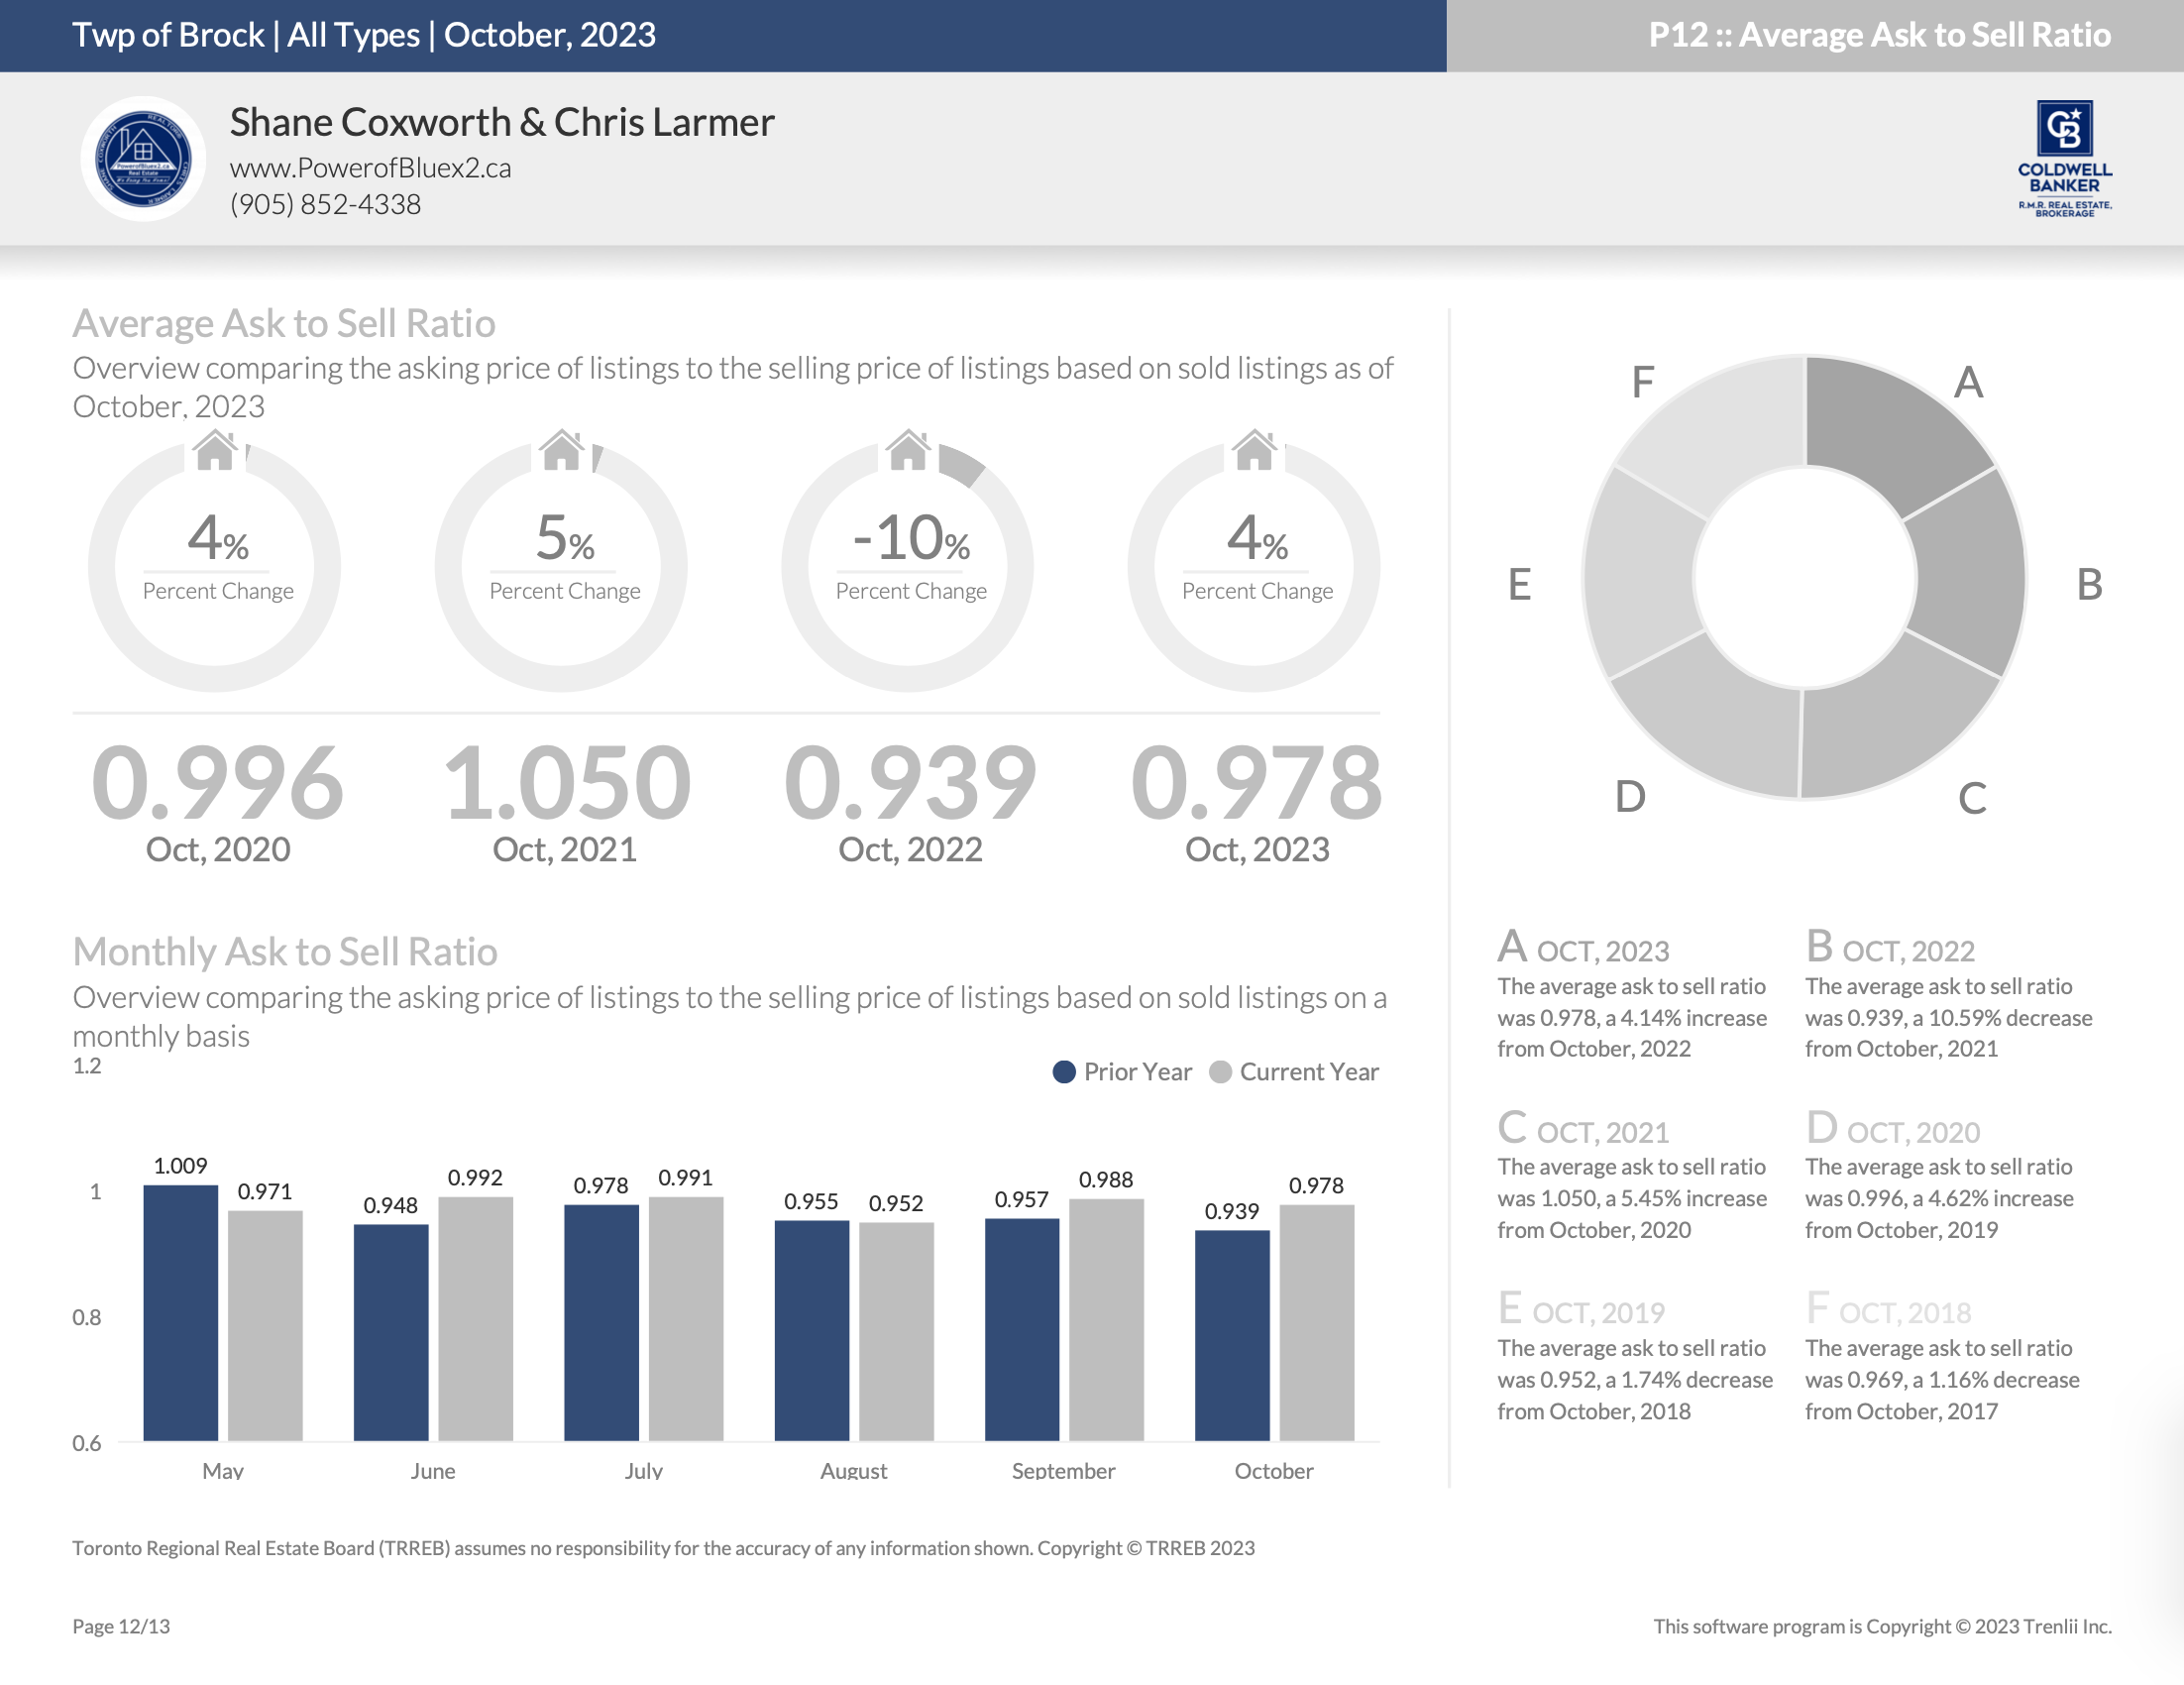
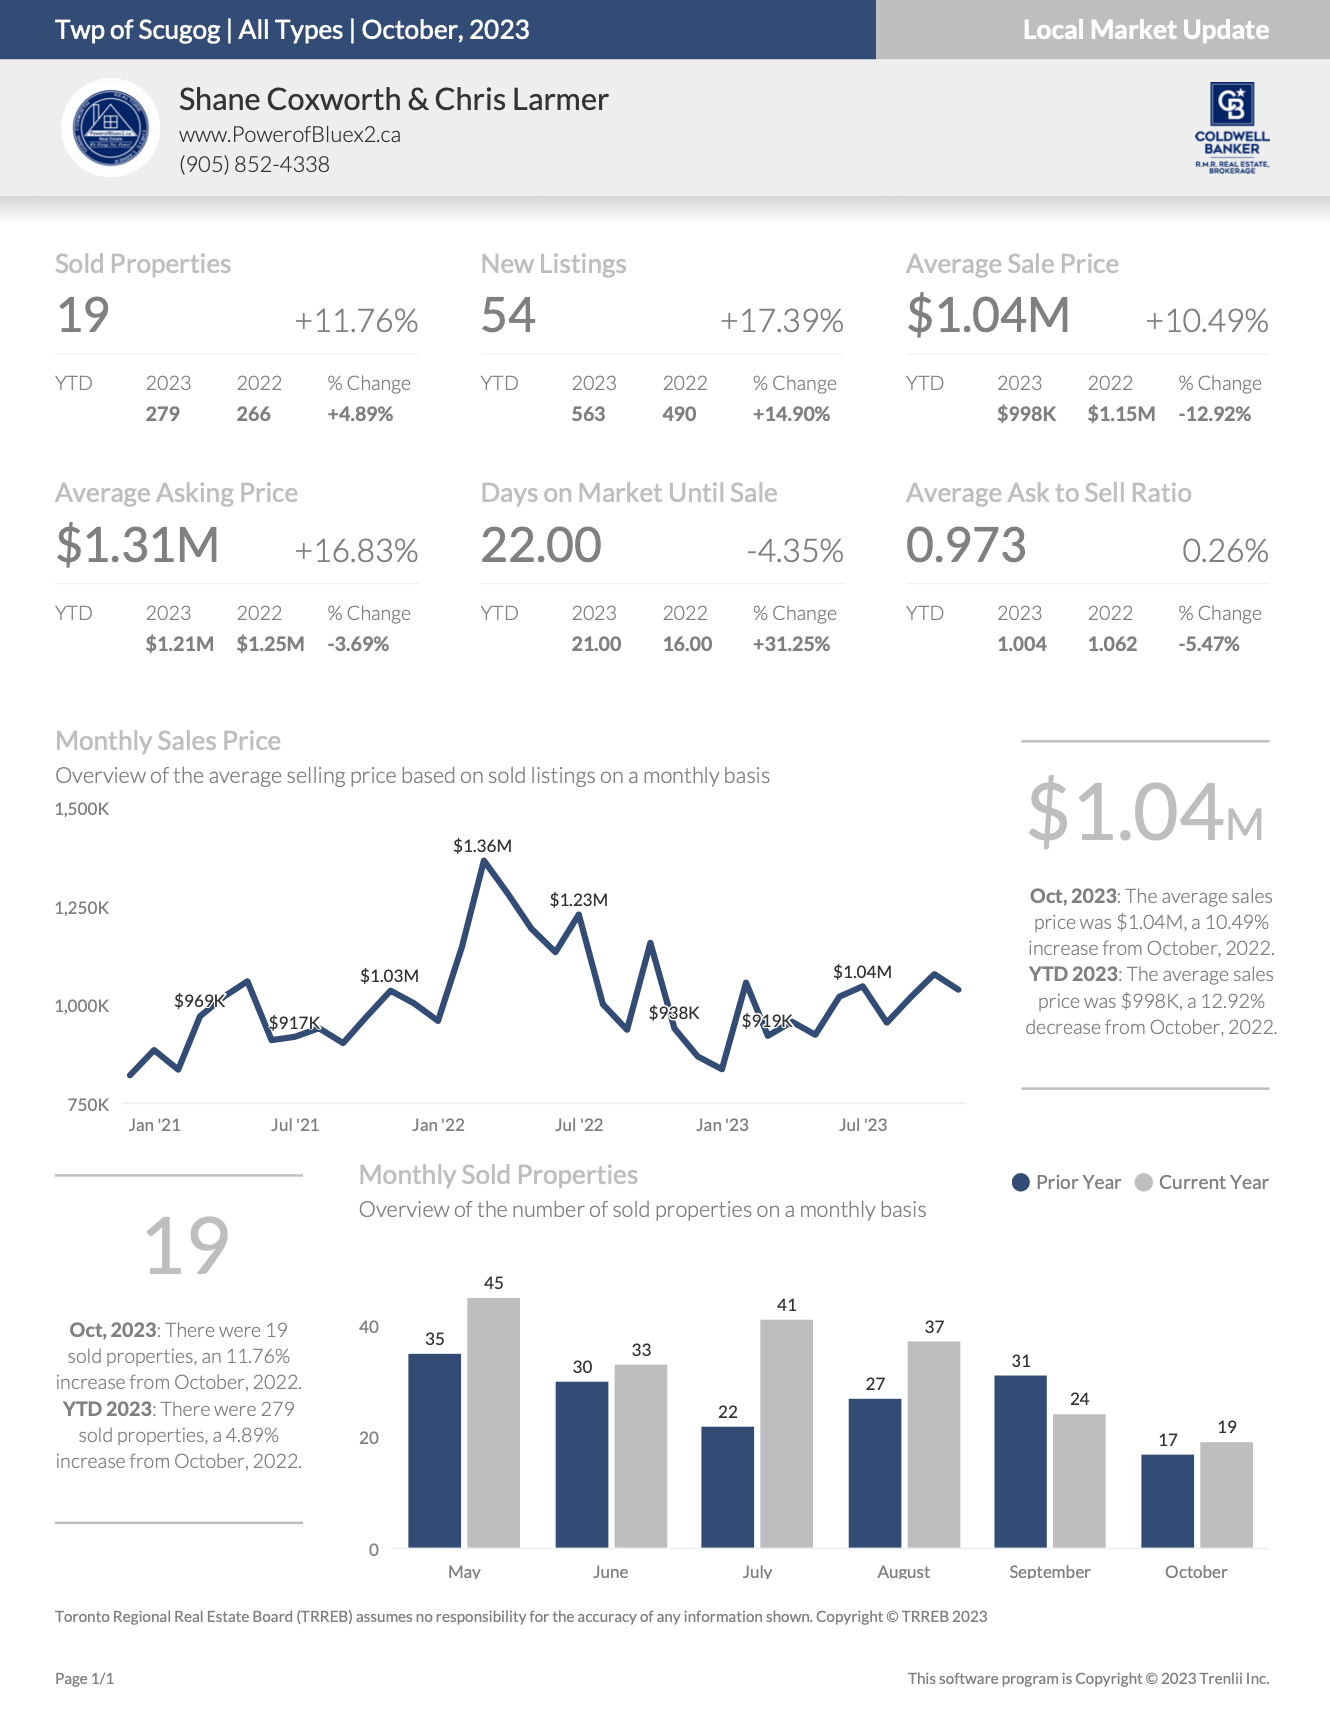
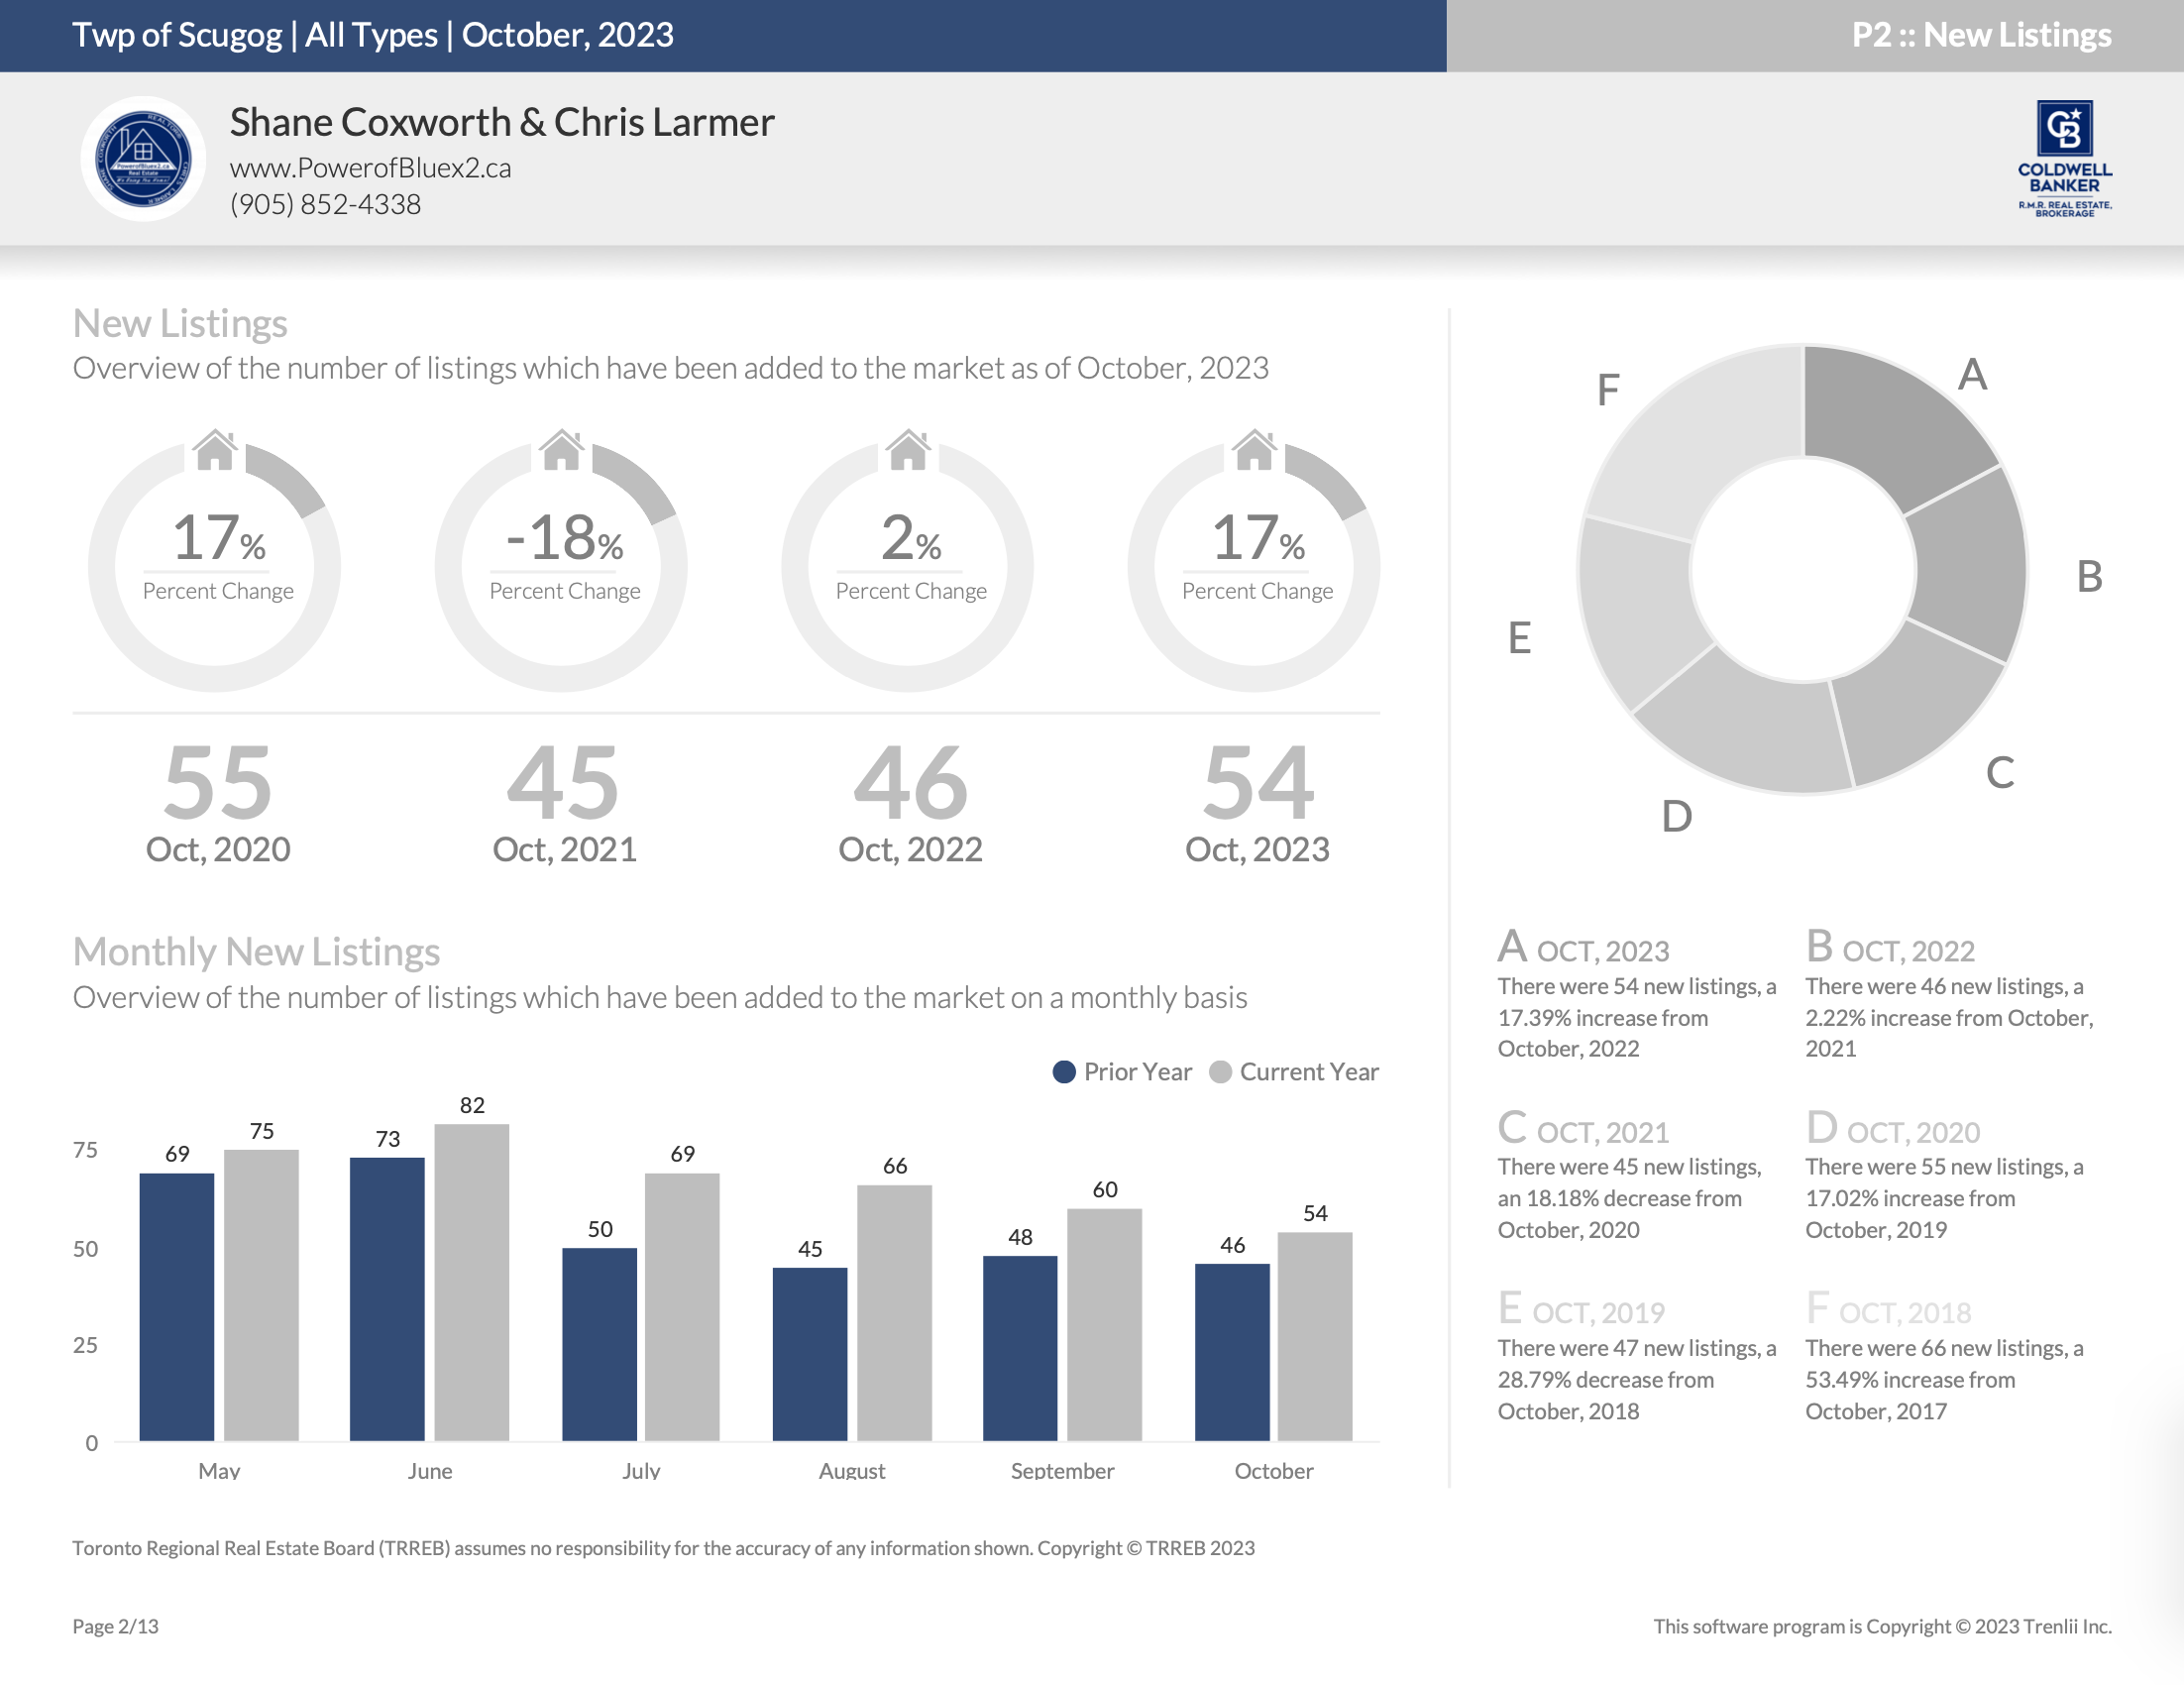
In October, 2023, we have seen 54 properties listed which has resulted in a 17.39% increase from October, 2022 in which 46 properties were listed; We have seen a year to date volume of 563 in 2023 and 490 in 2022 resulting in a 14.90% increase. There were 19 sold properties which has resulted in an 11.76% increase from October, 2022 in which 17 listings were sold; We have seen a year to date volume of 279 in 2023 and 266 in 2022 resulting in a 4.89% increase.
The average sales price in October, 2023 is $1.04 million, a 10.49% increase from October, 2022. The average sales price of October, 2022 was $938 thousand. We have seen a year to date average sales price of $998 thousand in 2023 and $1.15 million in 2022 resulting in a 12.92% decrease.
Quick Review

New Listings – October 2023
New Listings – Year-To-Date

Average Asking Price – October 2023
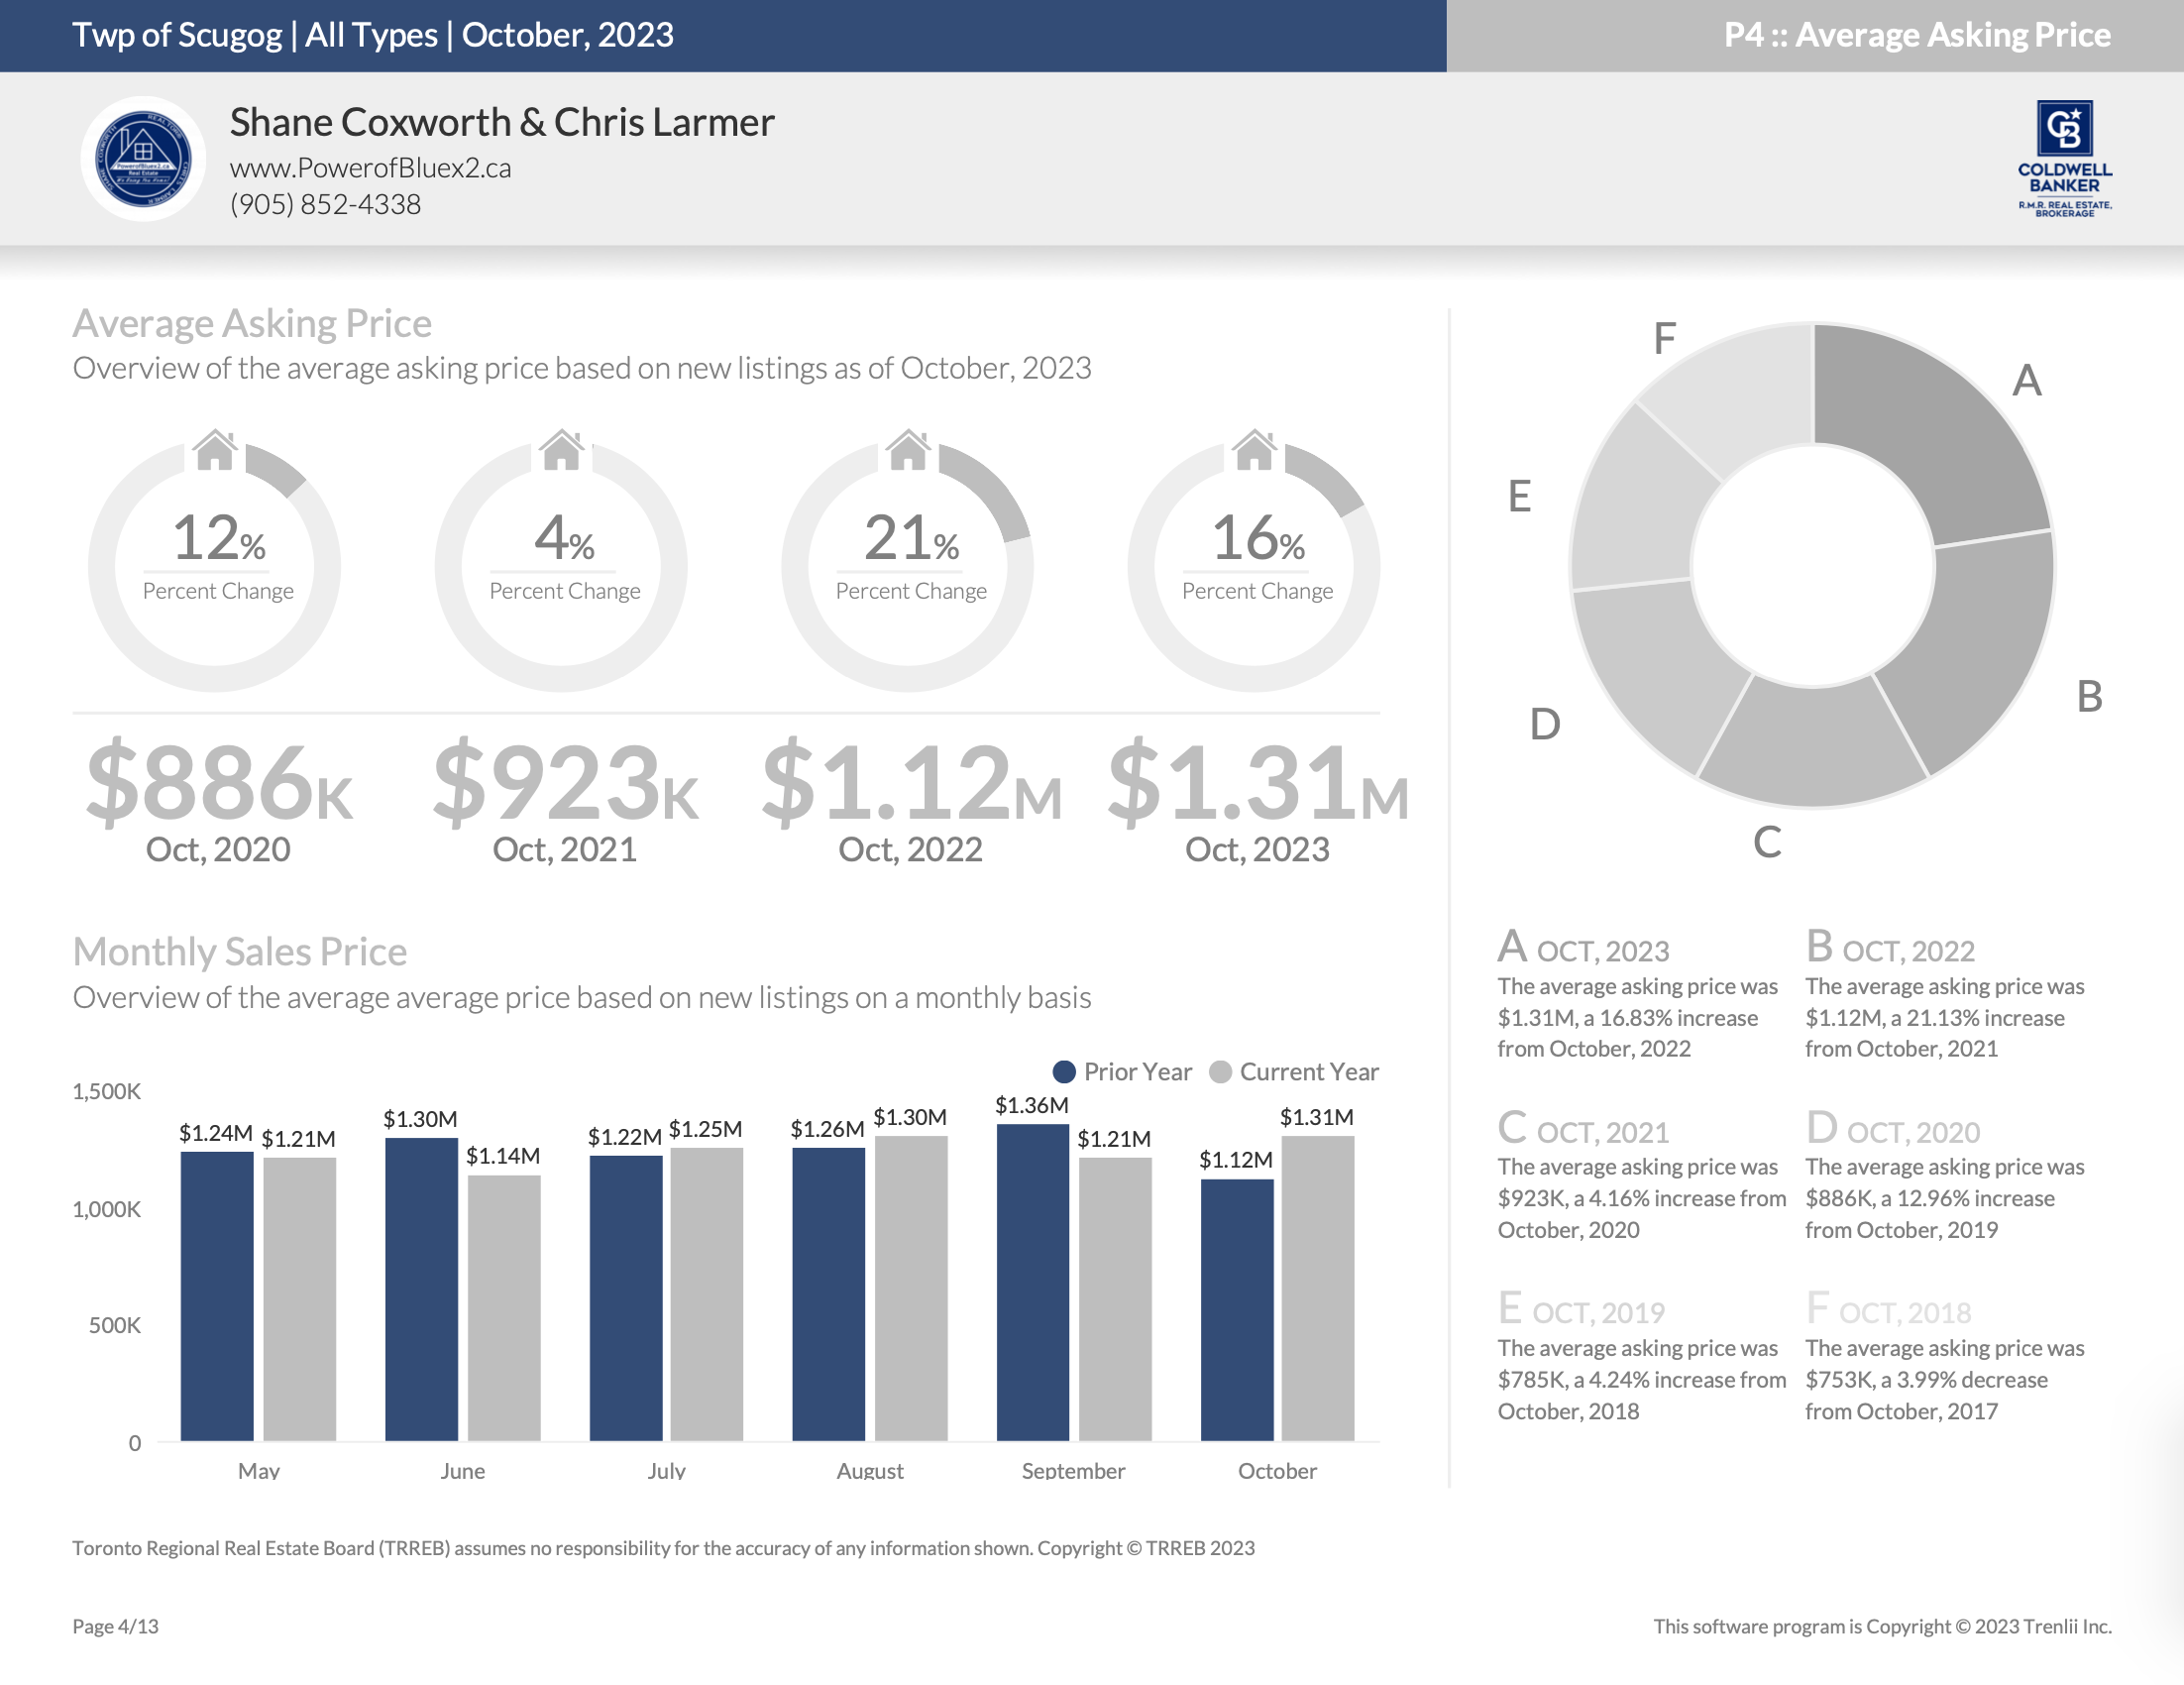
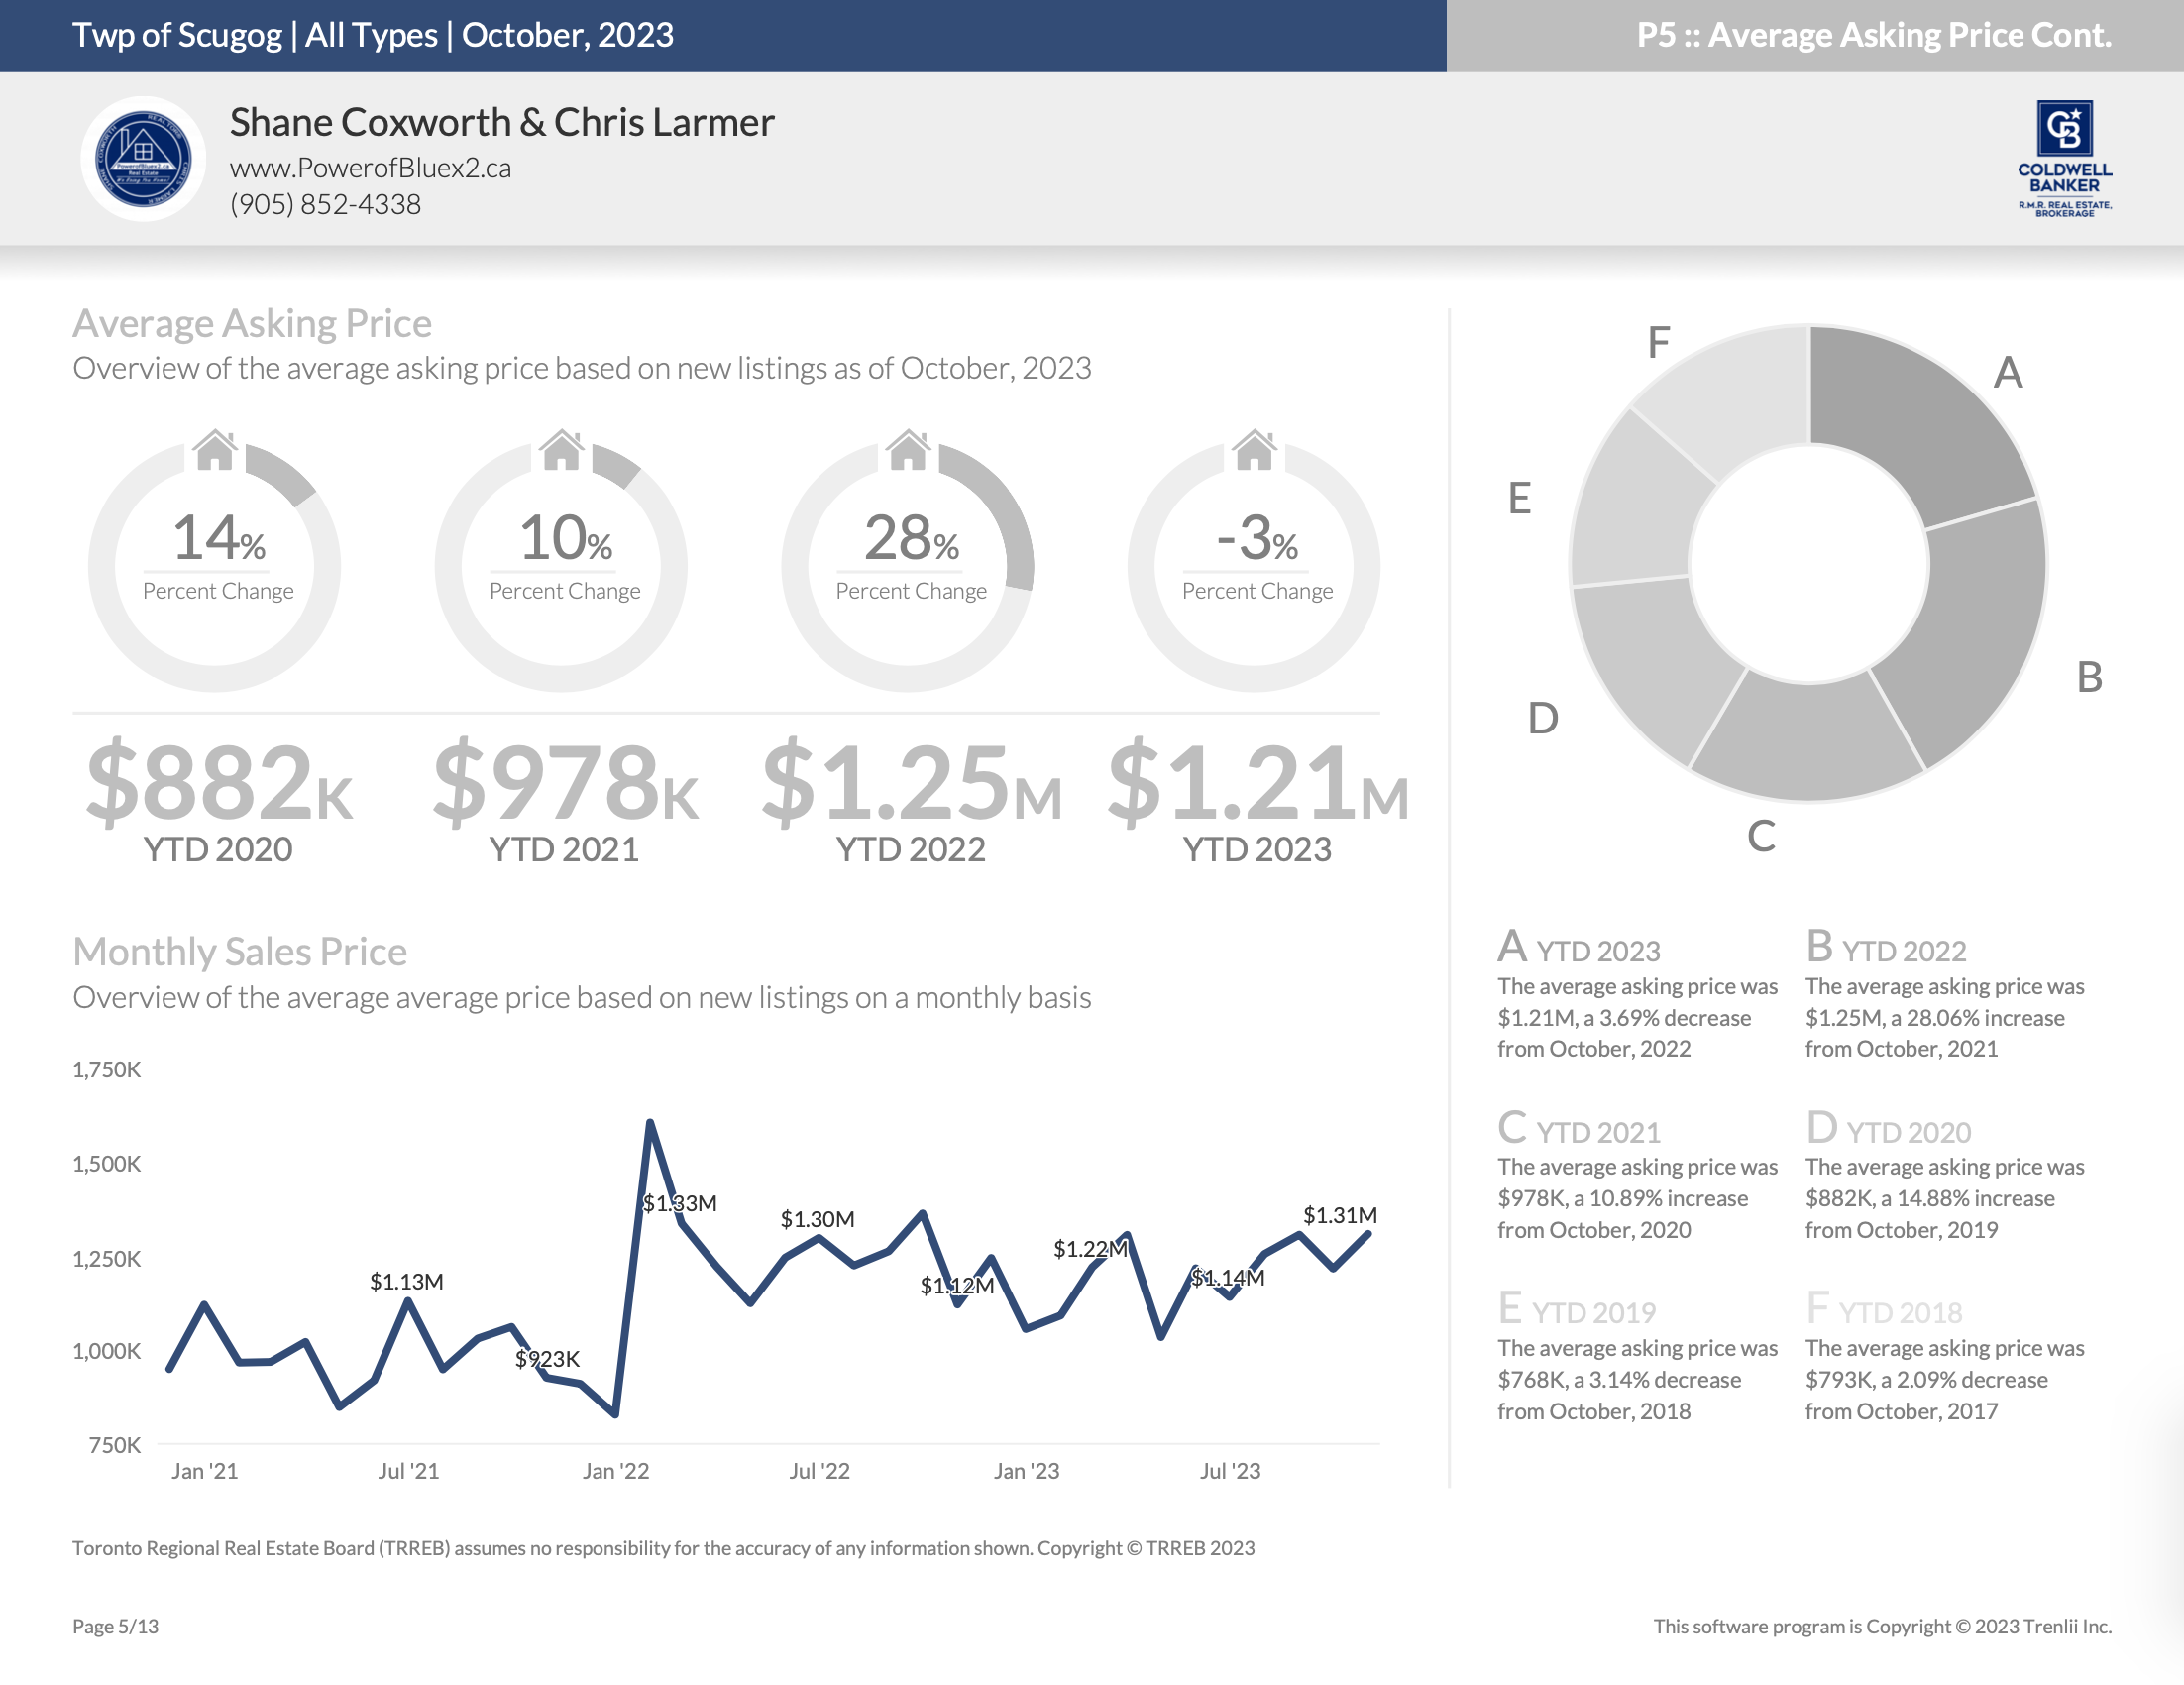
Average Asking Price – Year-to-Date
Number of Properties Sold – October 2023
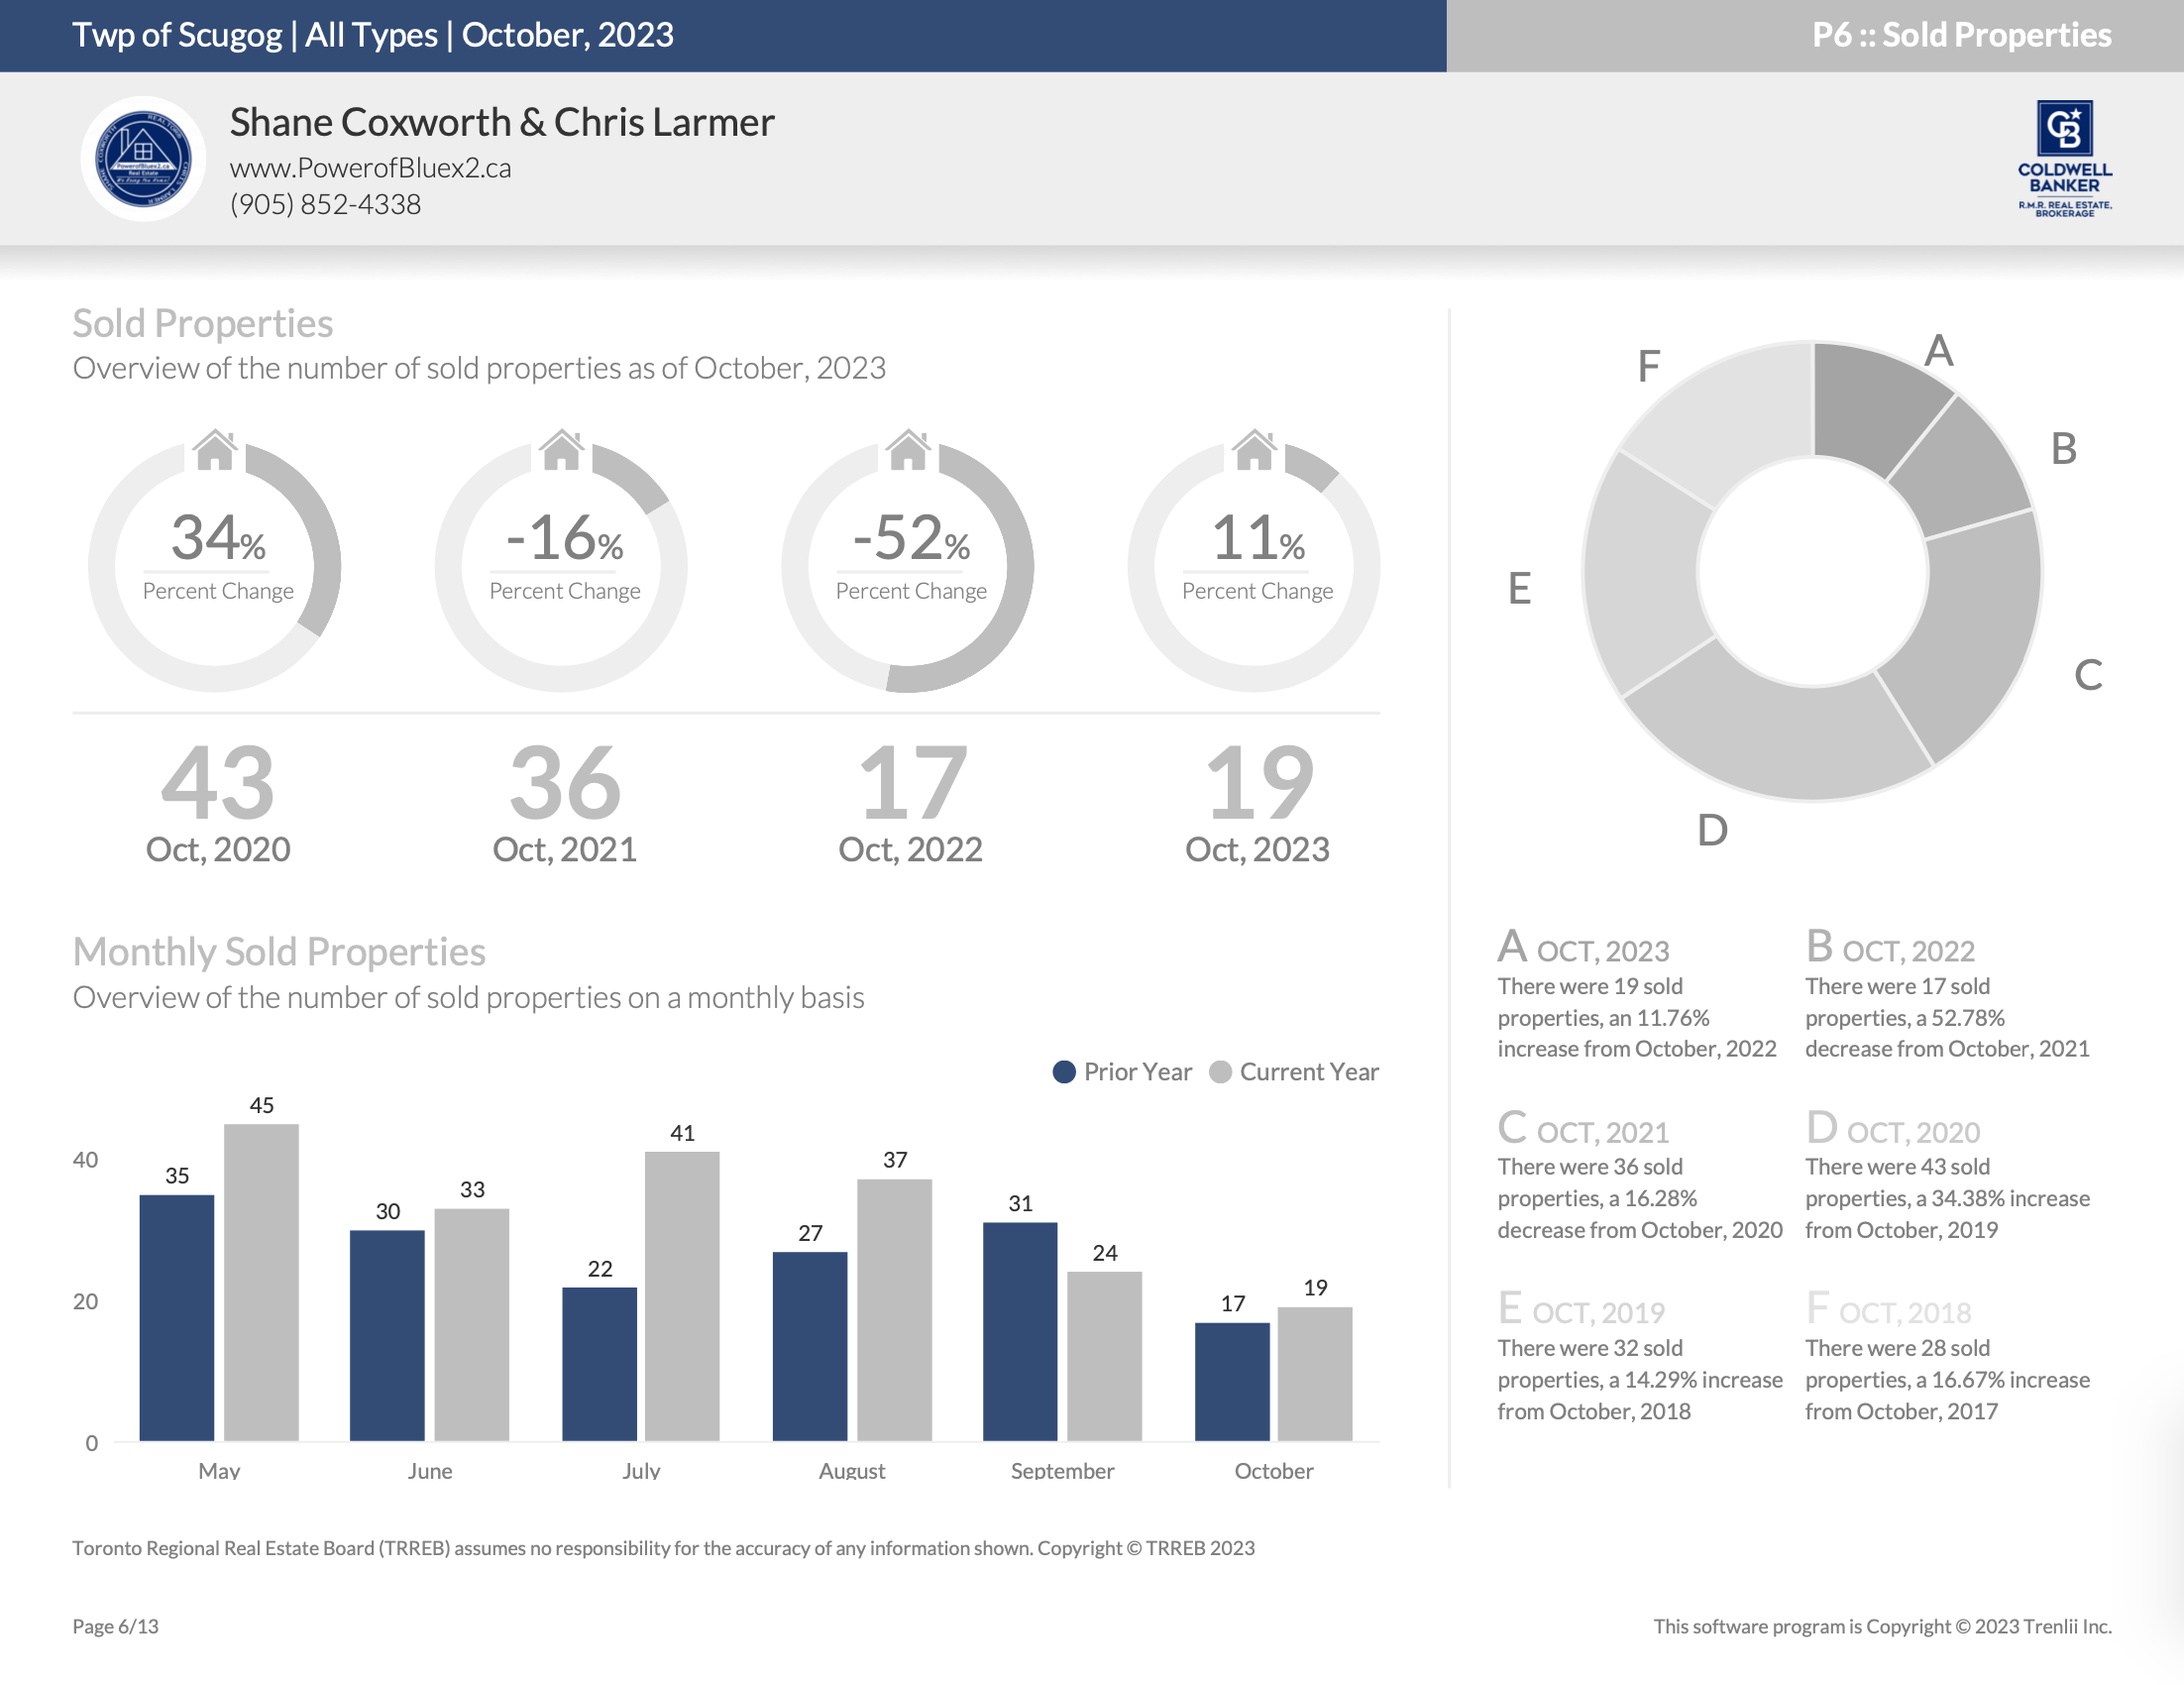
Number of Properties Sold – Year-to-Date

Average Sold Price – October 2023
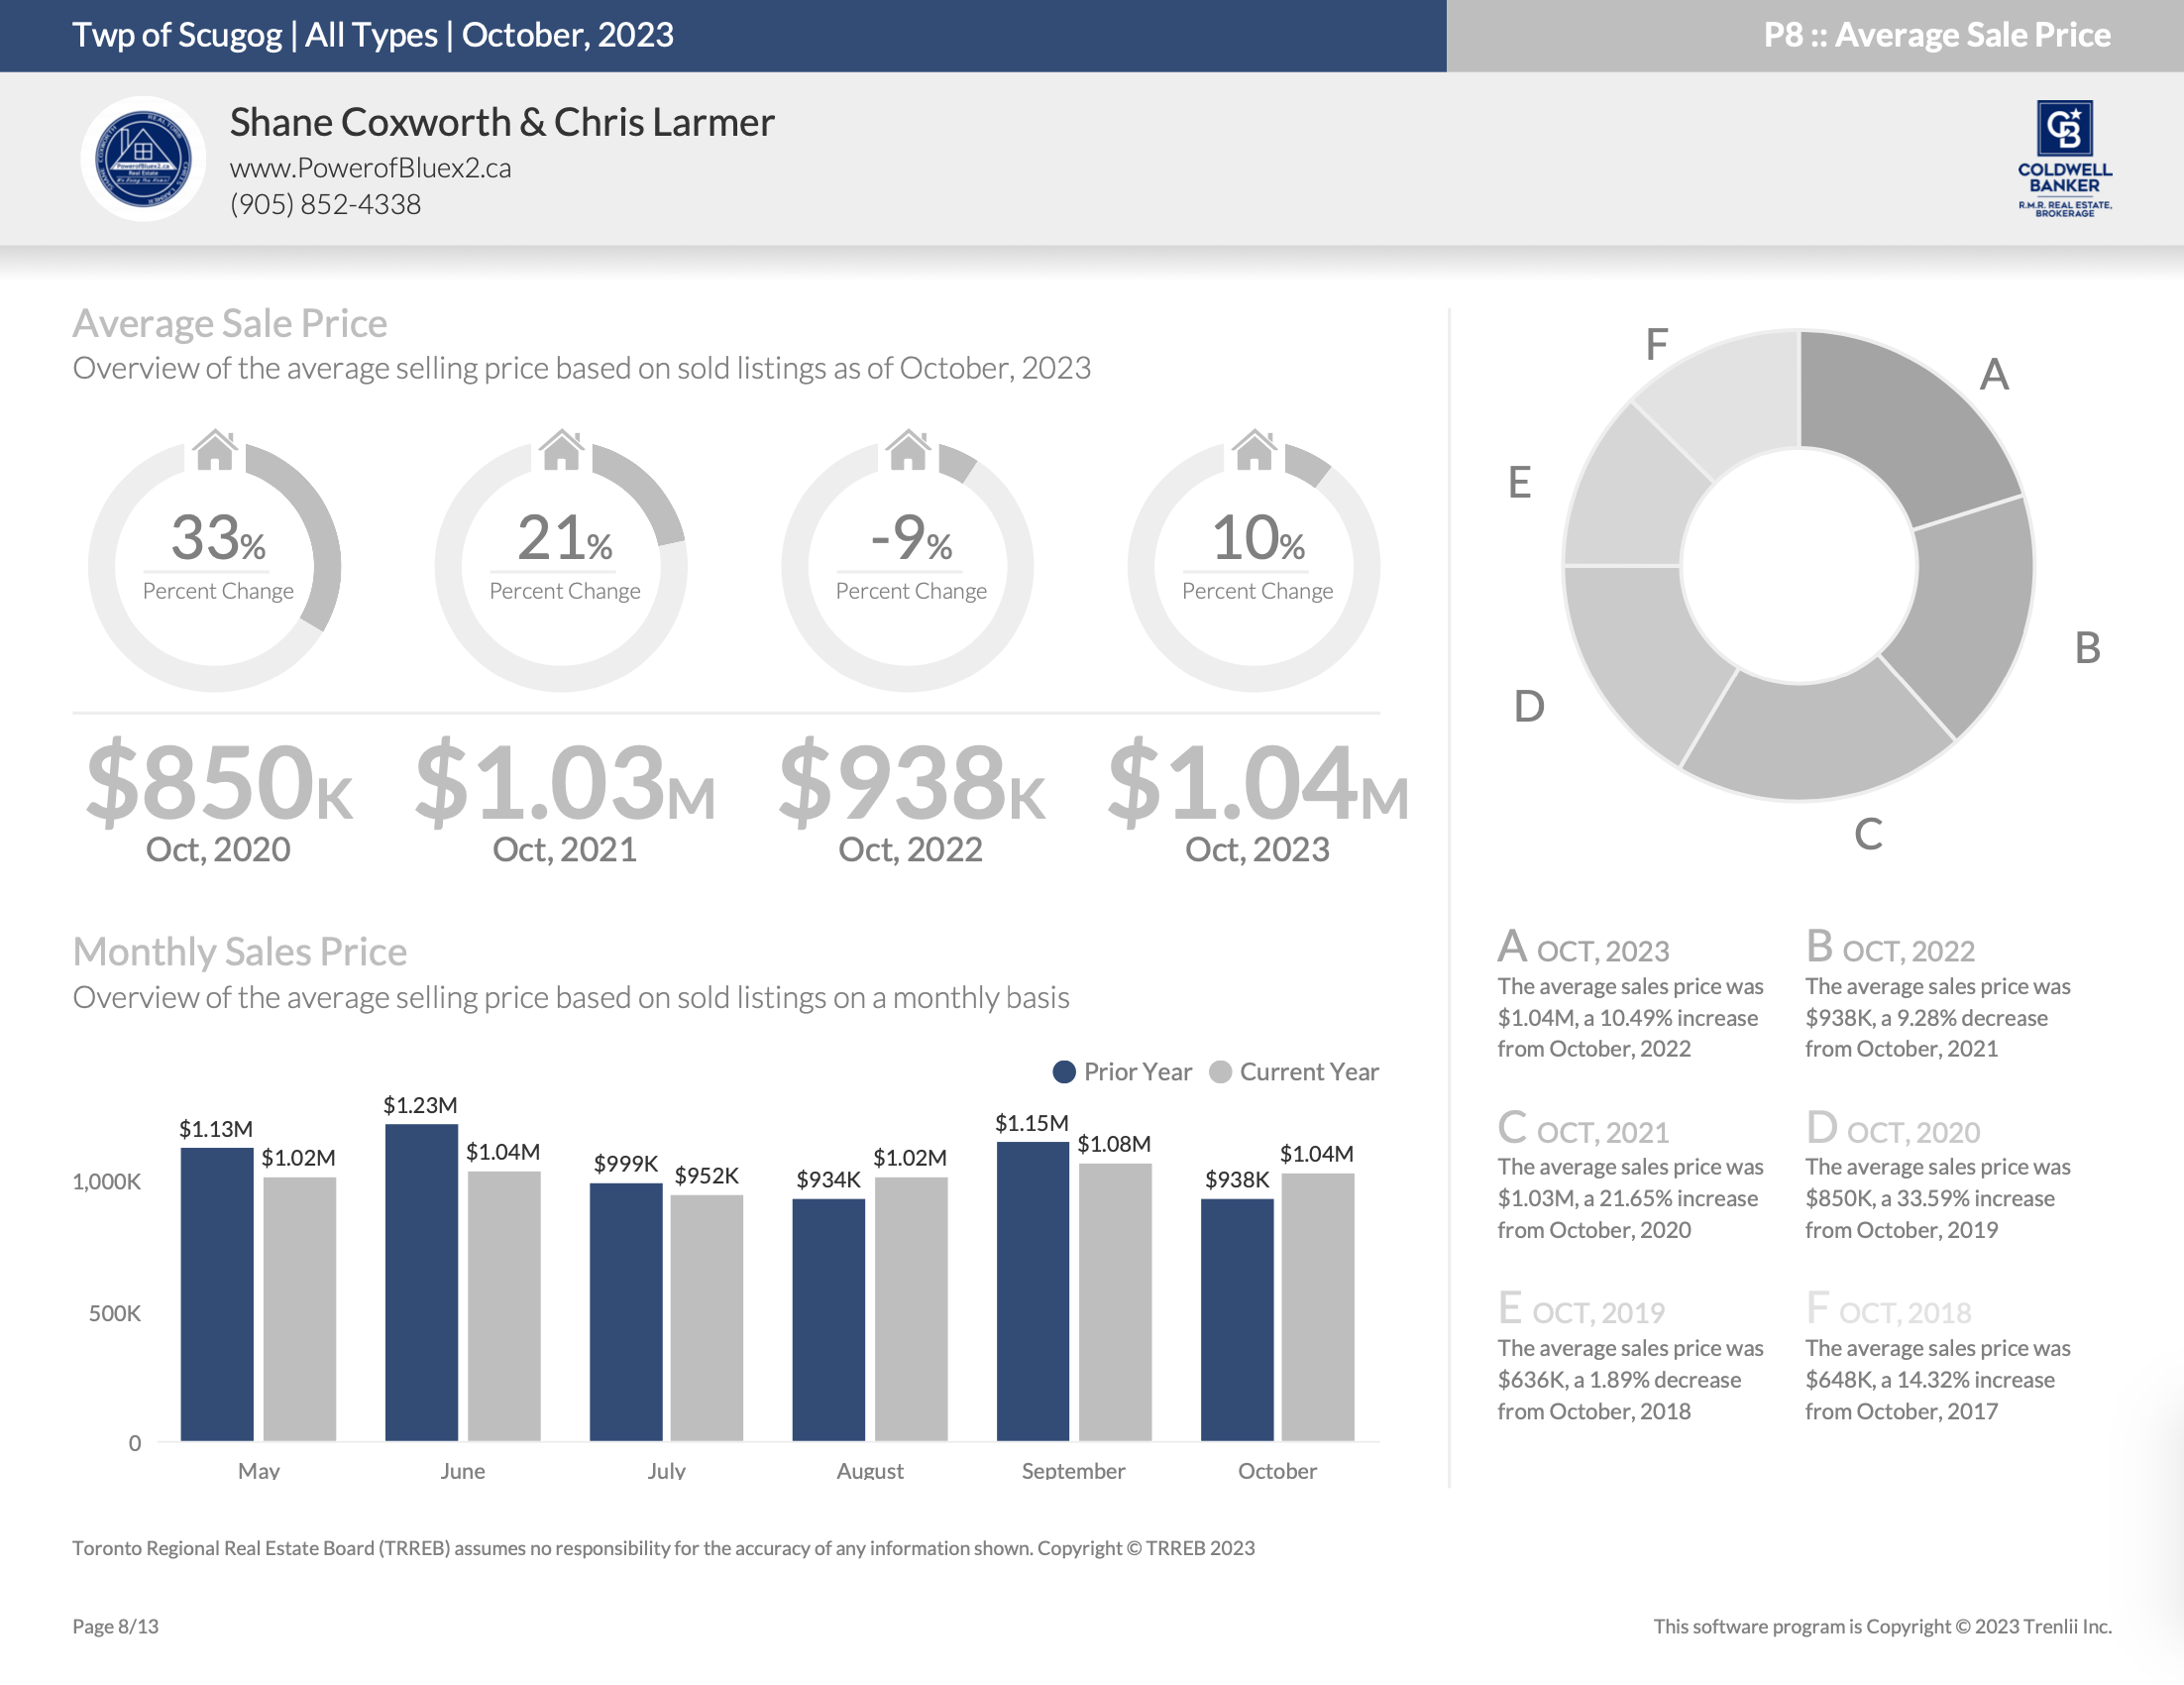
Average Sold Price – Year-to-Date

Days on Market – October 2023
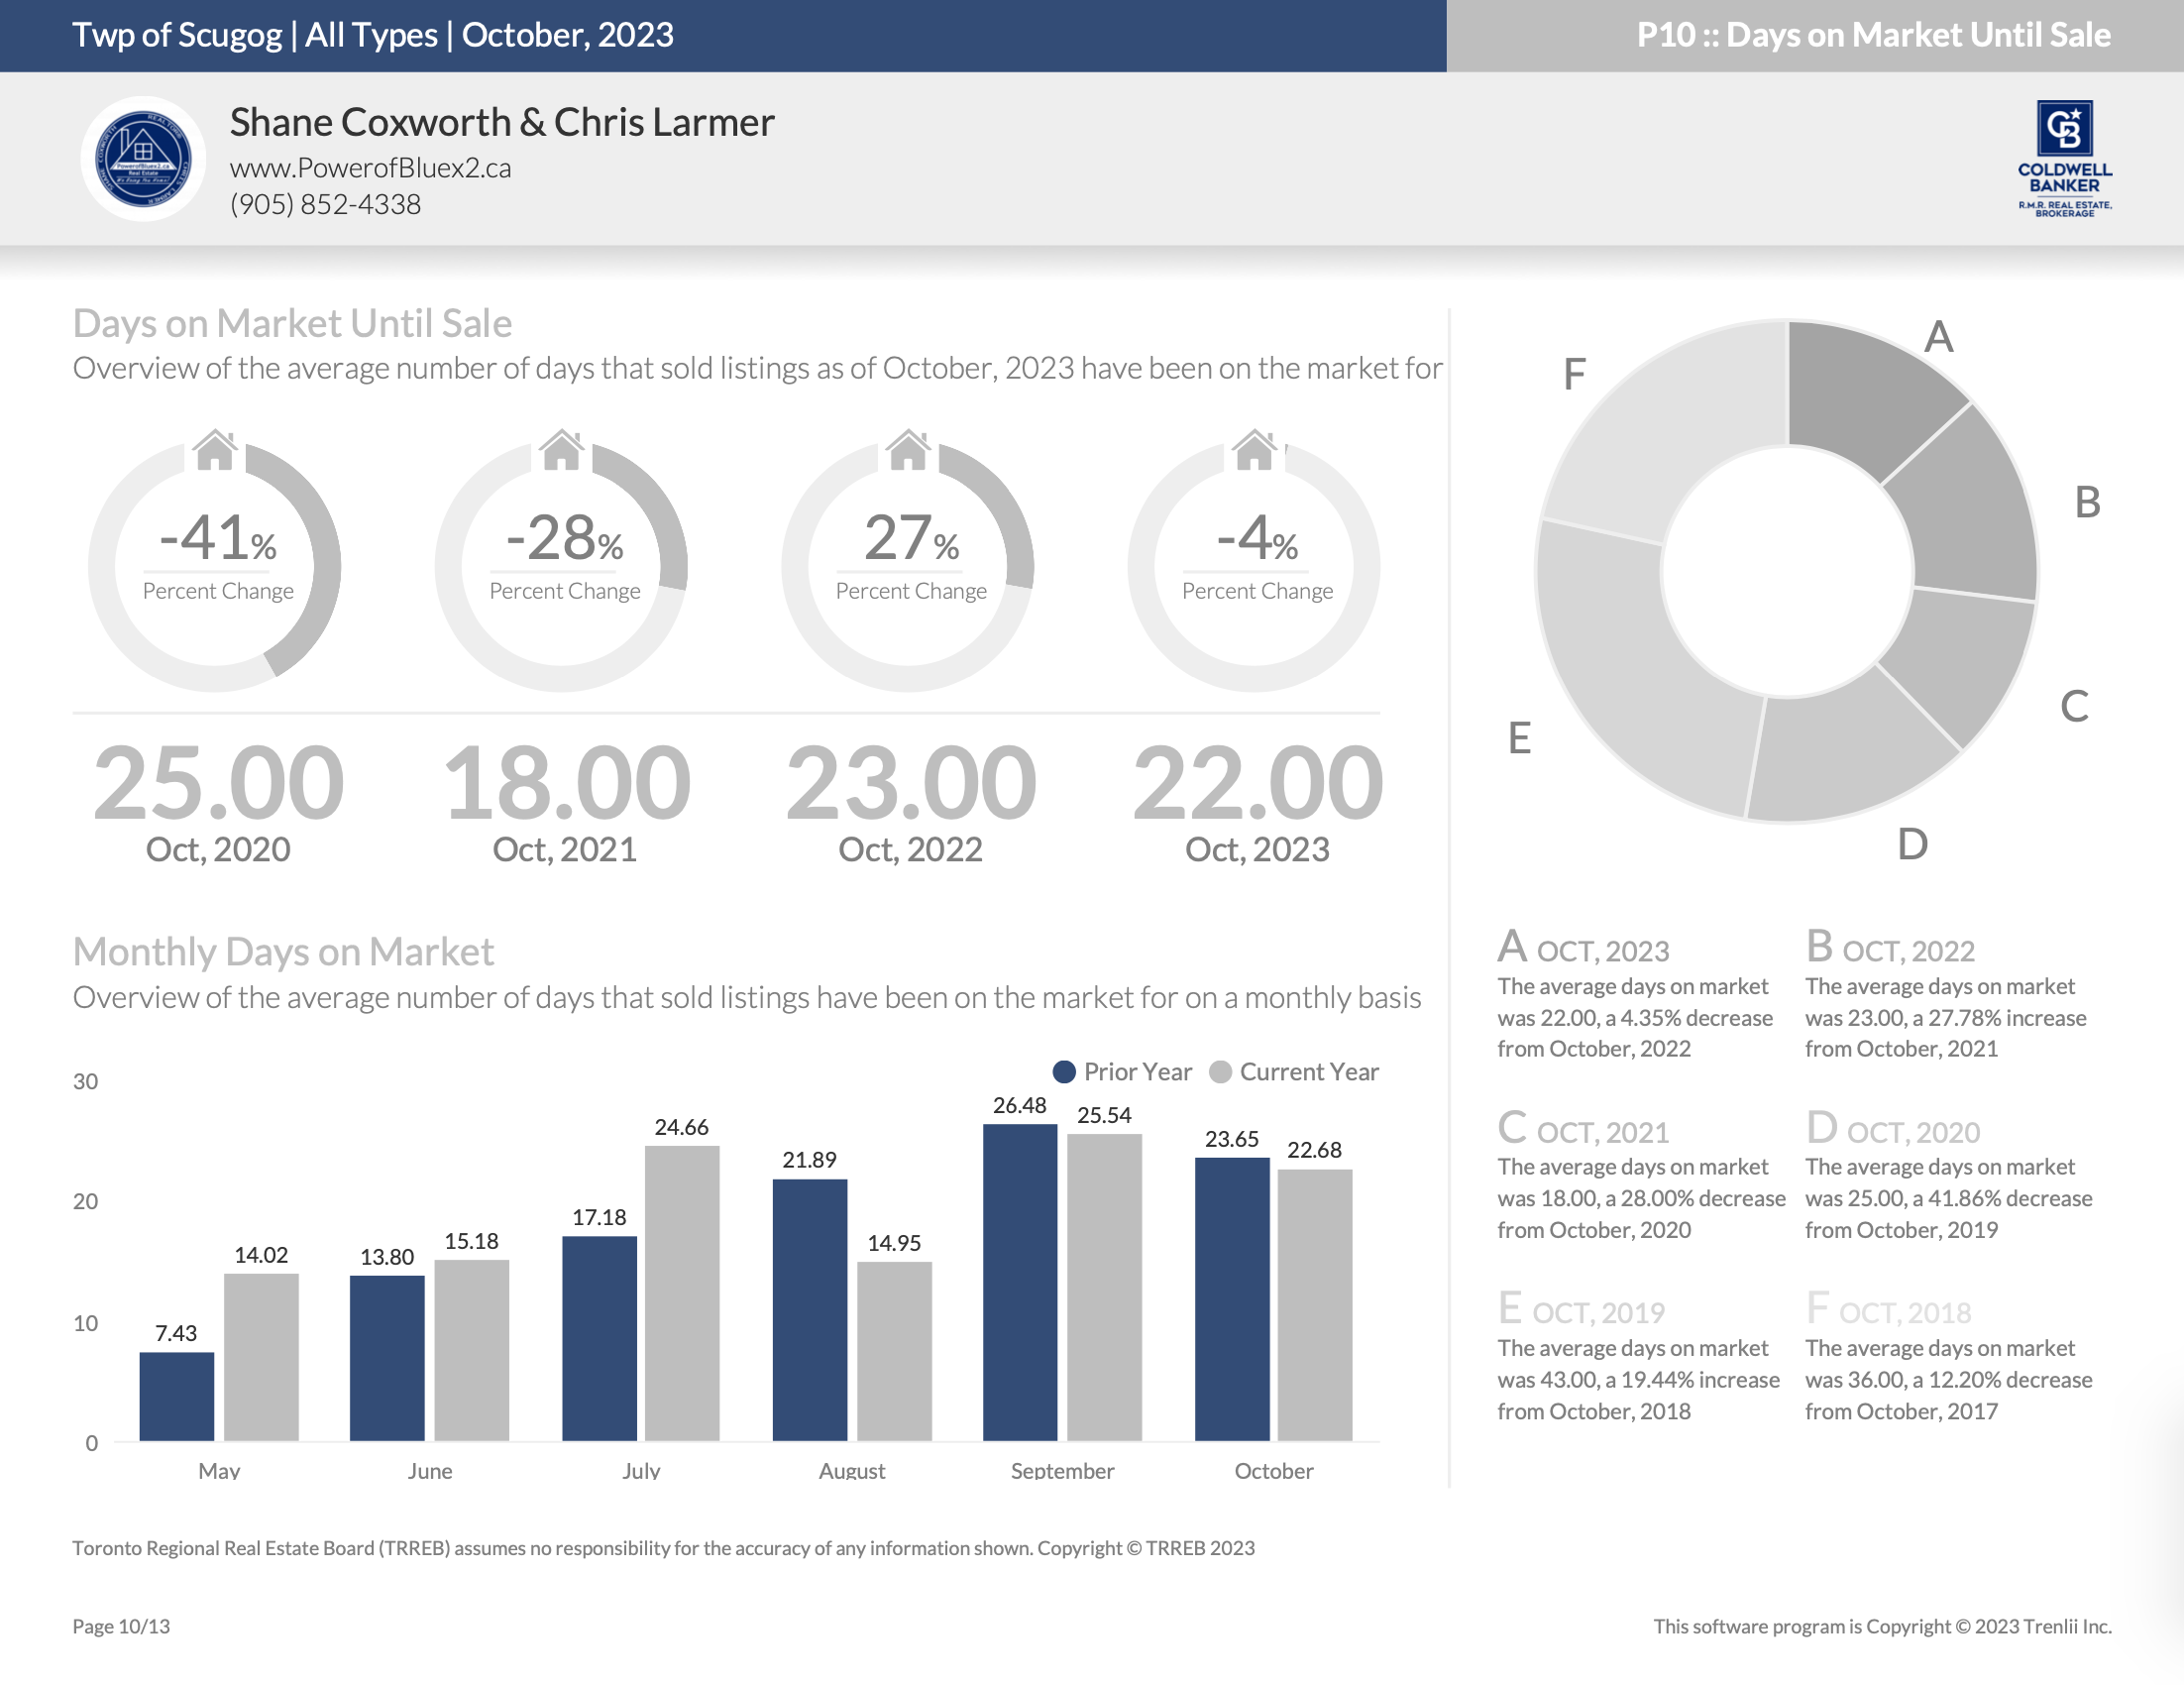
Days on Market – Year-to-Date
Average List Price to Sell Price Ratio – October 2023
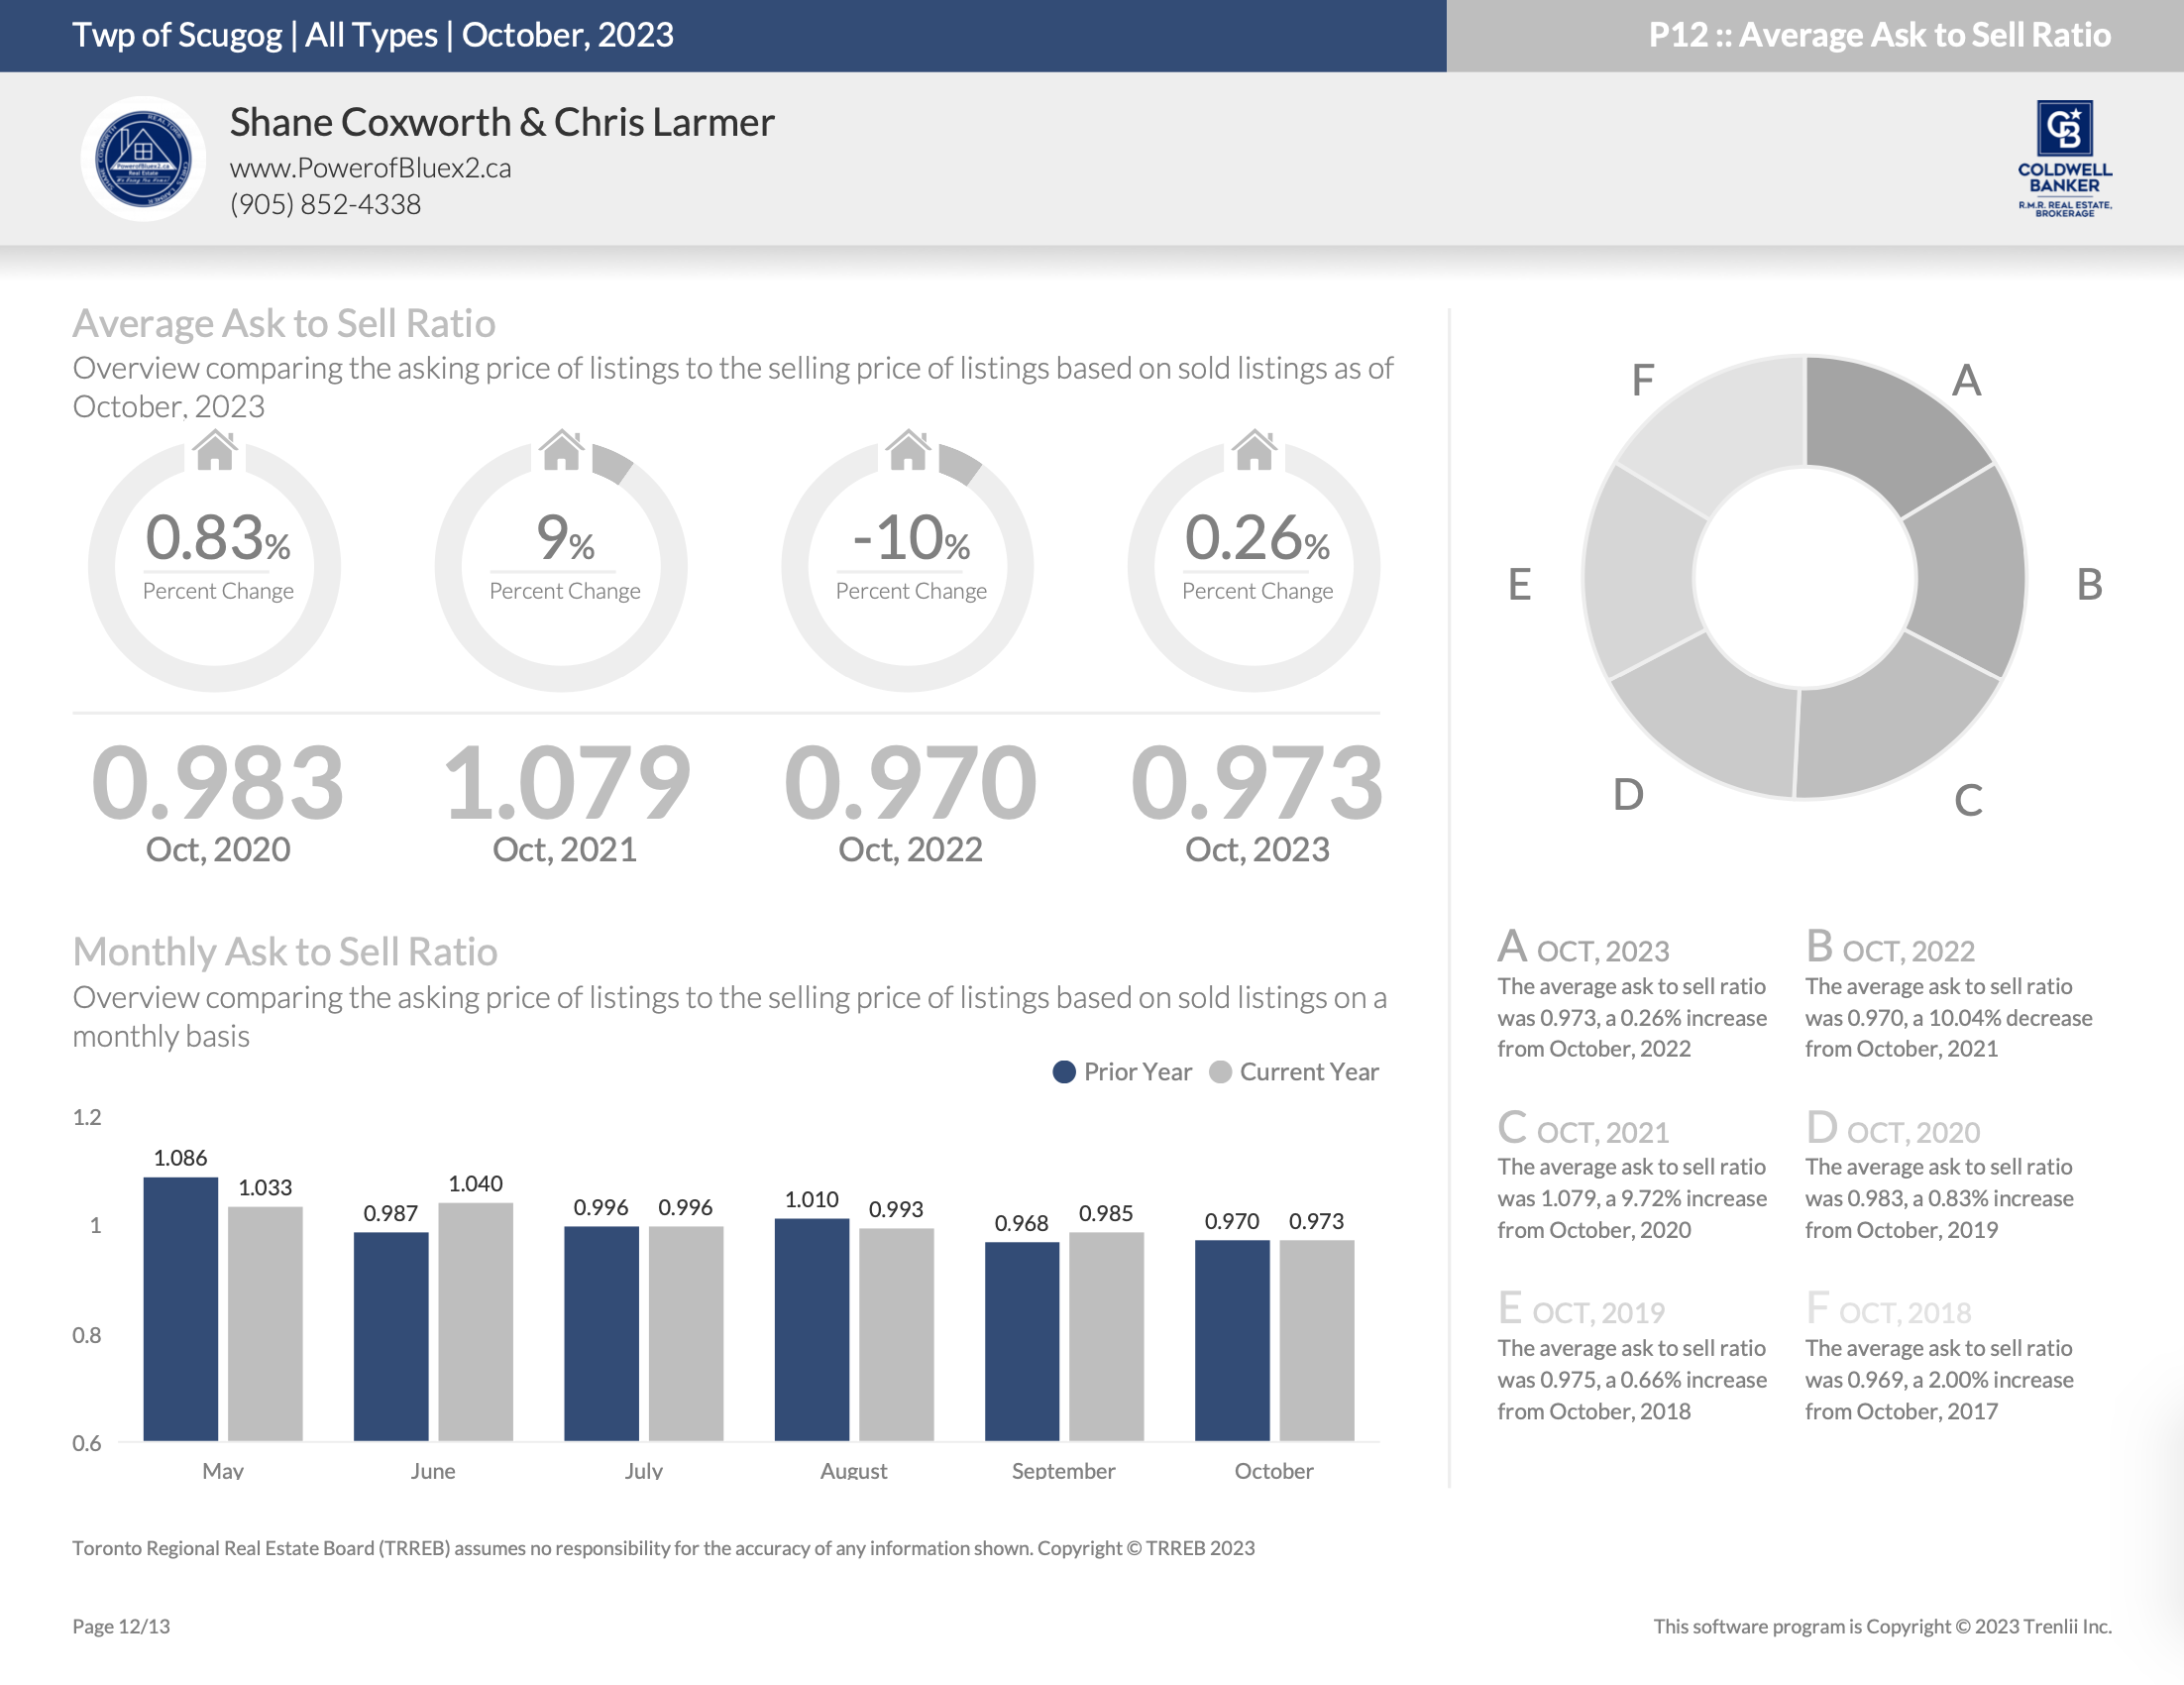
Average List Price to Sell Price Ratio – Year-to-Date
*Information is believed to be accurate at time of posting but is not guaranteed to be correct
Not intended as a solicitation if your property is already listed by another broker. Affiliated real estate agents are independent contractor sales associates, not employees. ©2021 Coldwell Banker. All Rights Reserved. Coldwell Banker and the Coldwell Banker logos are trademarks of Coldwell Banker Real Estate LLC. The Coldwell Banker® System is comprised of company owned offices which are owned by a subsidiary of Realogy Brokerage Group LLC and franchised offices which are independently owned and operated. The Coldwell Banker System fully supports the principles of the Fair Housing Act and the Equal Opportunity Act.
Click below for more reports
Uxbridge Housing October 2023
Uxbridge Housing October 2023
![]()
Housing Market Report for October 2023
Here is the Township of Uxbridge Housing October 2023 report (all housing types), with reports from the Toronto Regional Real Estate Board and the Central Lakes Association of REALTORS® included.
This housing report for Township of Uxbridge includes the number of new listings, average list price, number of properties sold, average selling price, average days on market and average asking price to selling price ratio for all property types within the Township of Uxbridge.
Scroll to the bottom for links to take you to the housing market reports for Durham, Scugog, Brock and the Kawartha Lakes.
![]()
CREA HOUSING MARKET REPORT – NOVEMBER 2023
![]()
From Toronto Regional Real Estate Board
Toronto Regional Real Estate Board – Market Stats At A Glance – October 2023
Read the Toronto Regional Real Estate Board Market Watch Report
![]()
Durham REALTORS® Report October 2023 Housing Statistics
Read the Durham Association of REALTORS® FULL Real Estate Report
![]()
Township of Uxbridge Full Report
*Some values may vary slightly based on the exact date and time the reports were generated.
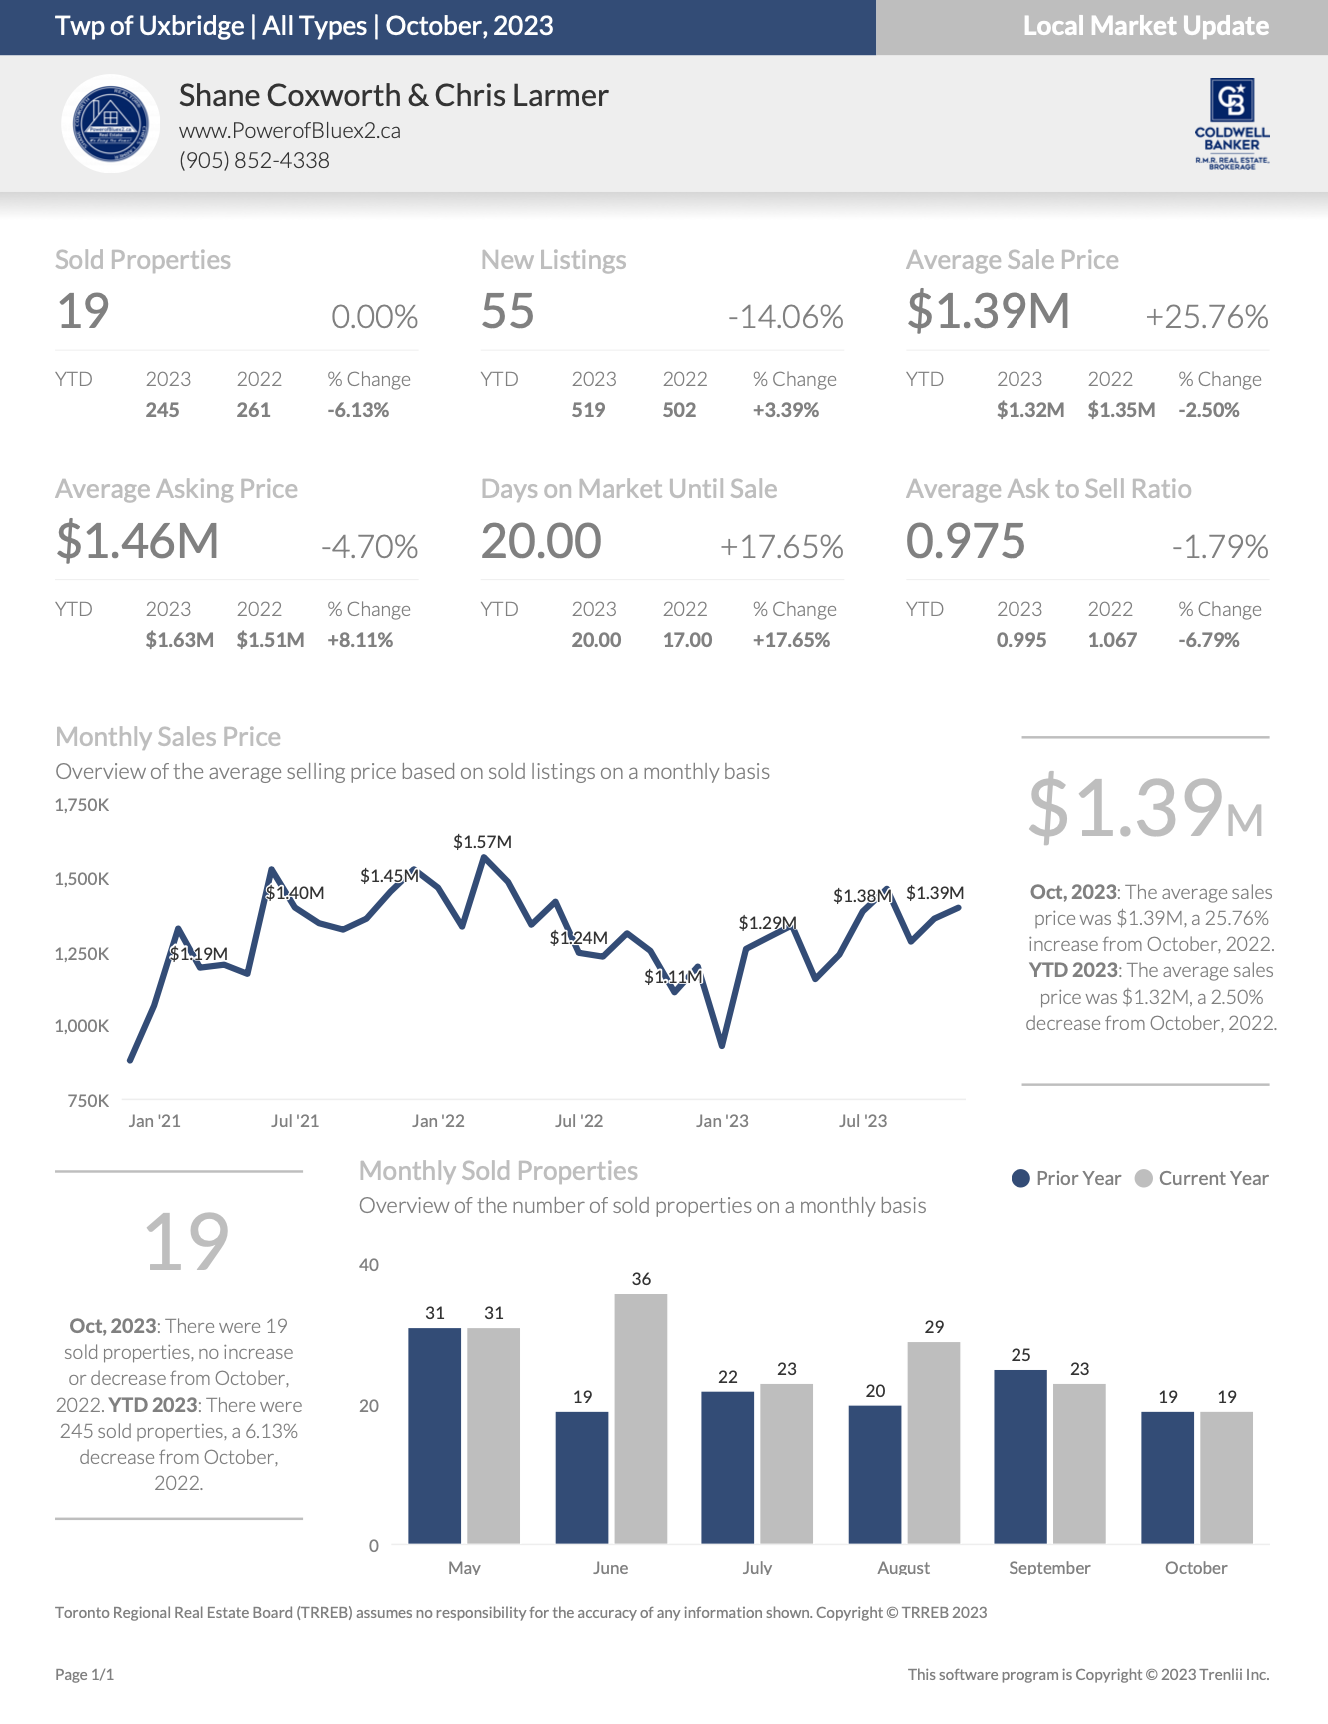
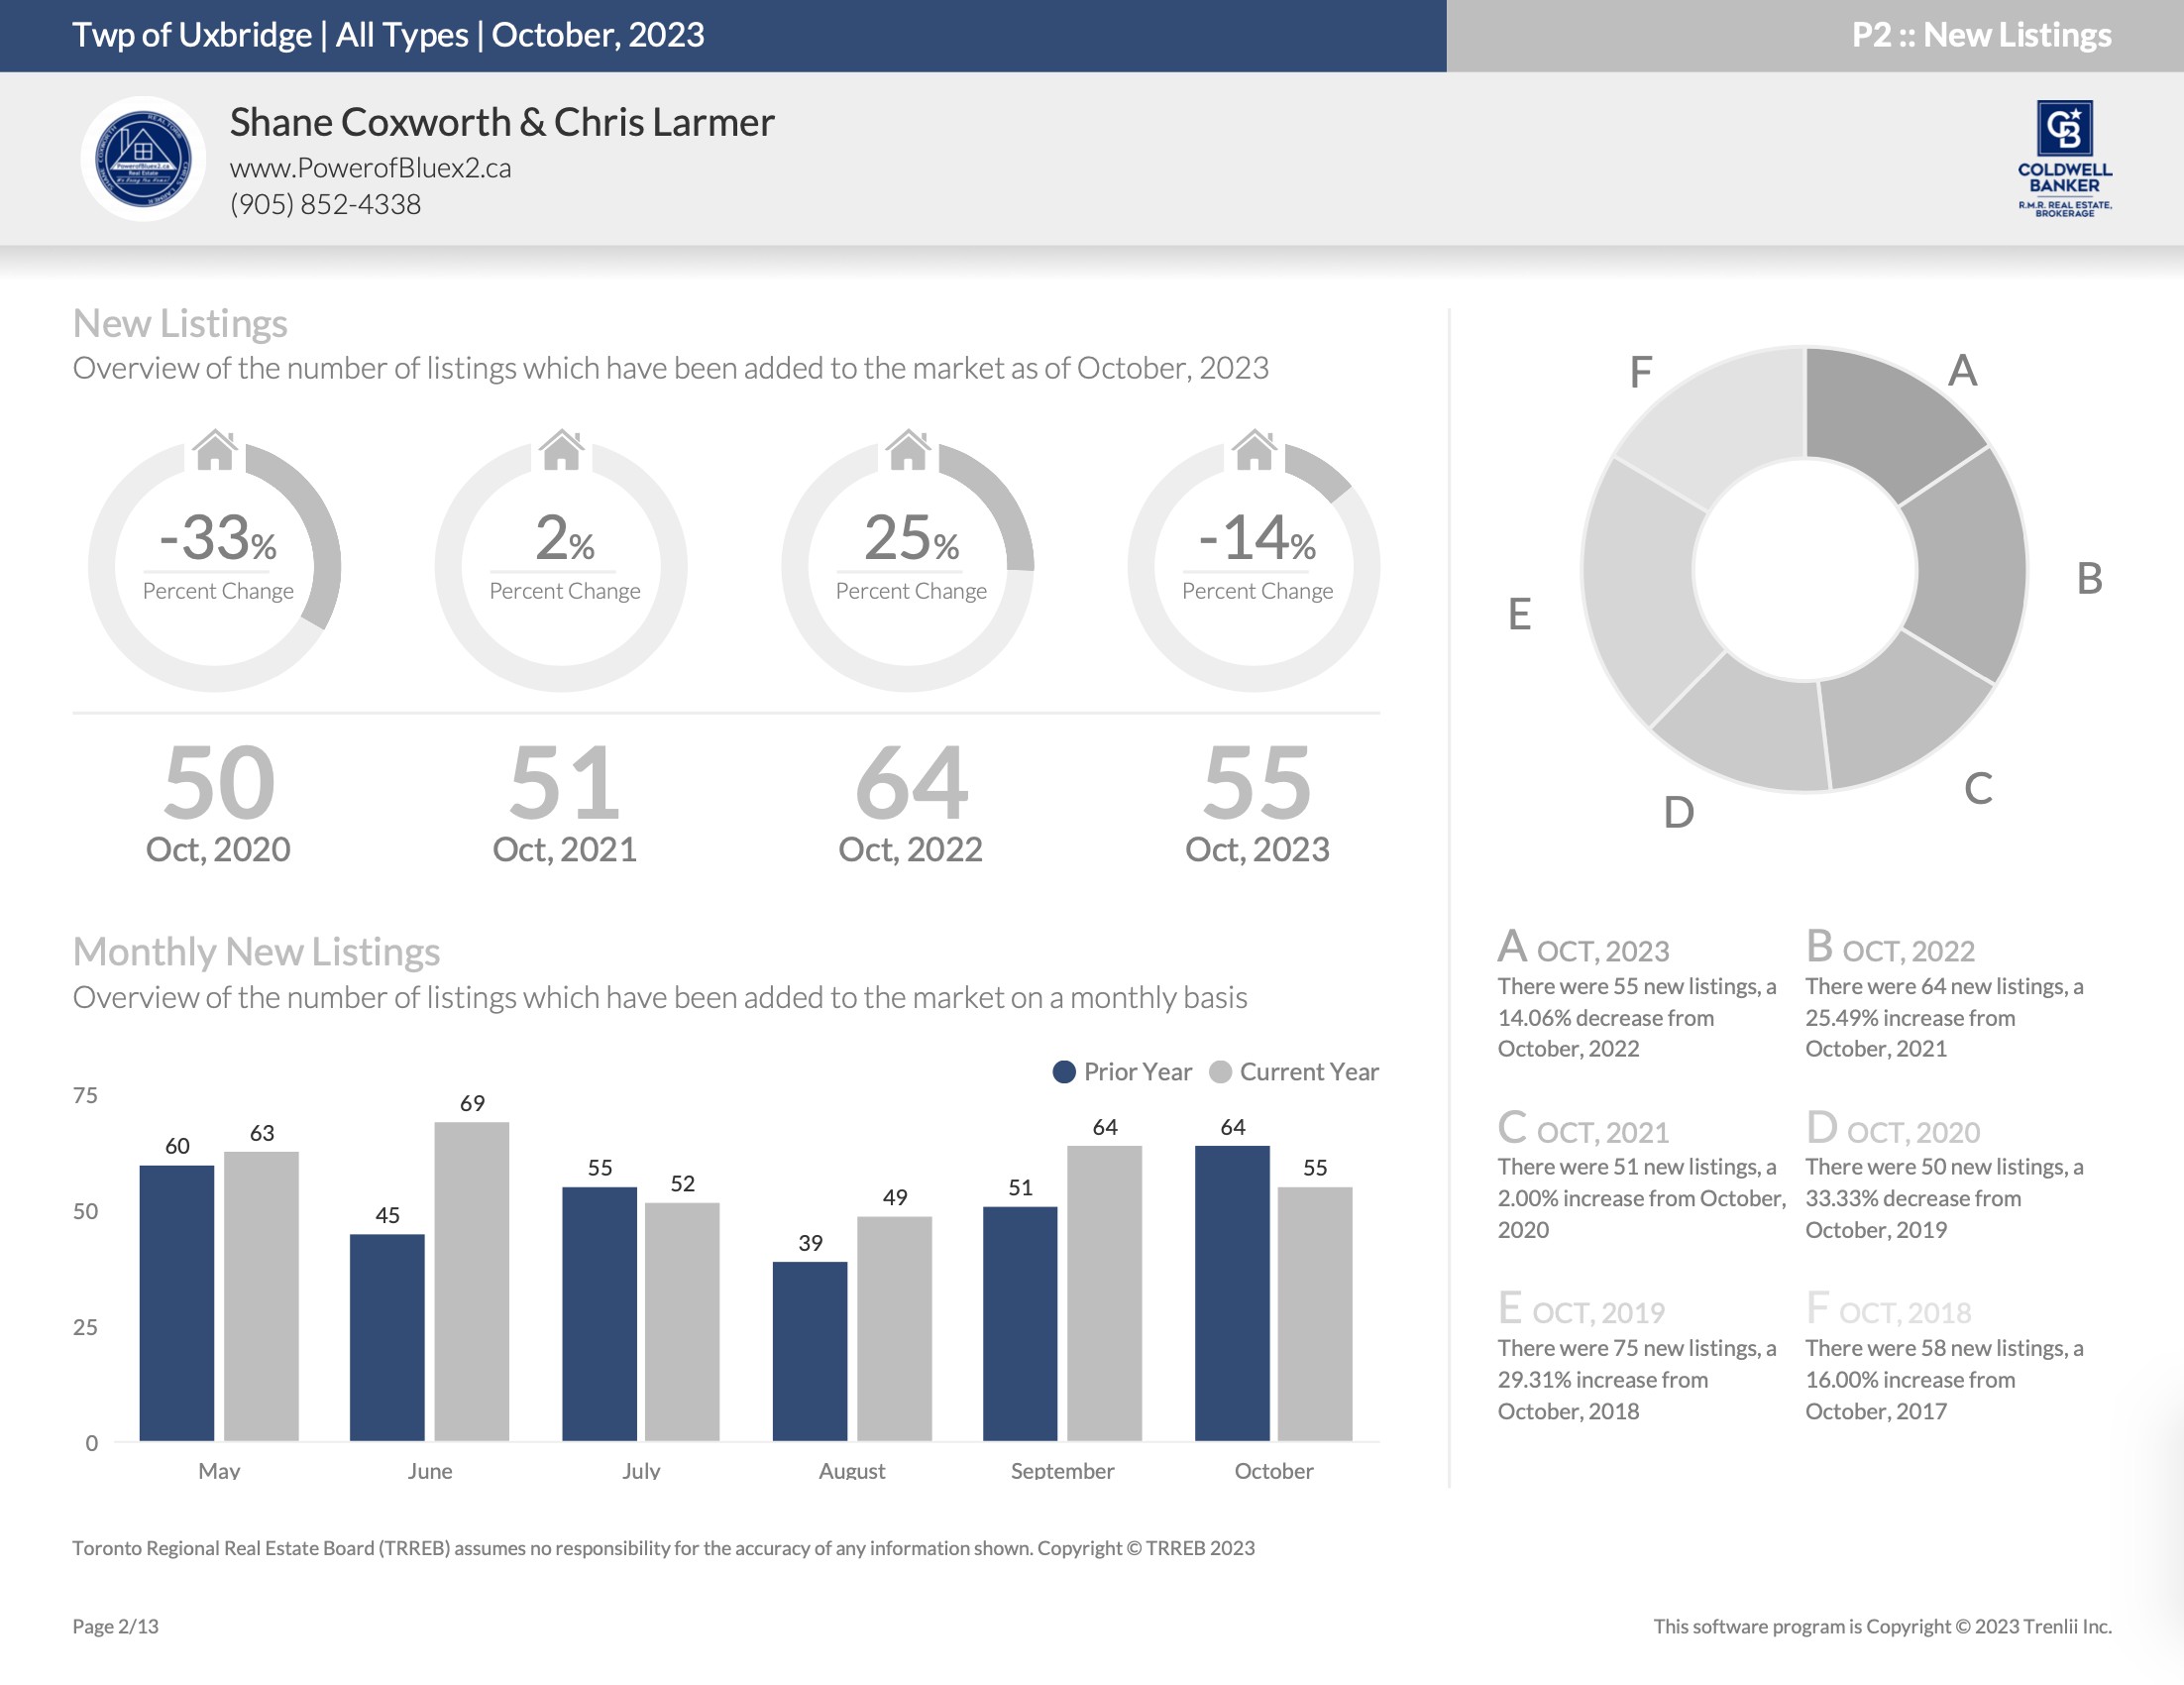
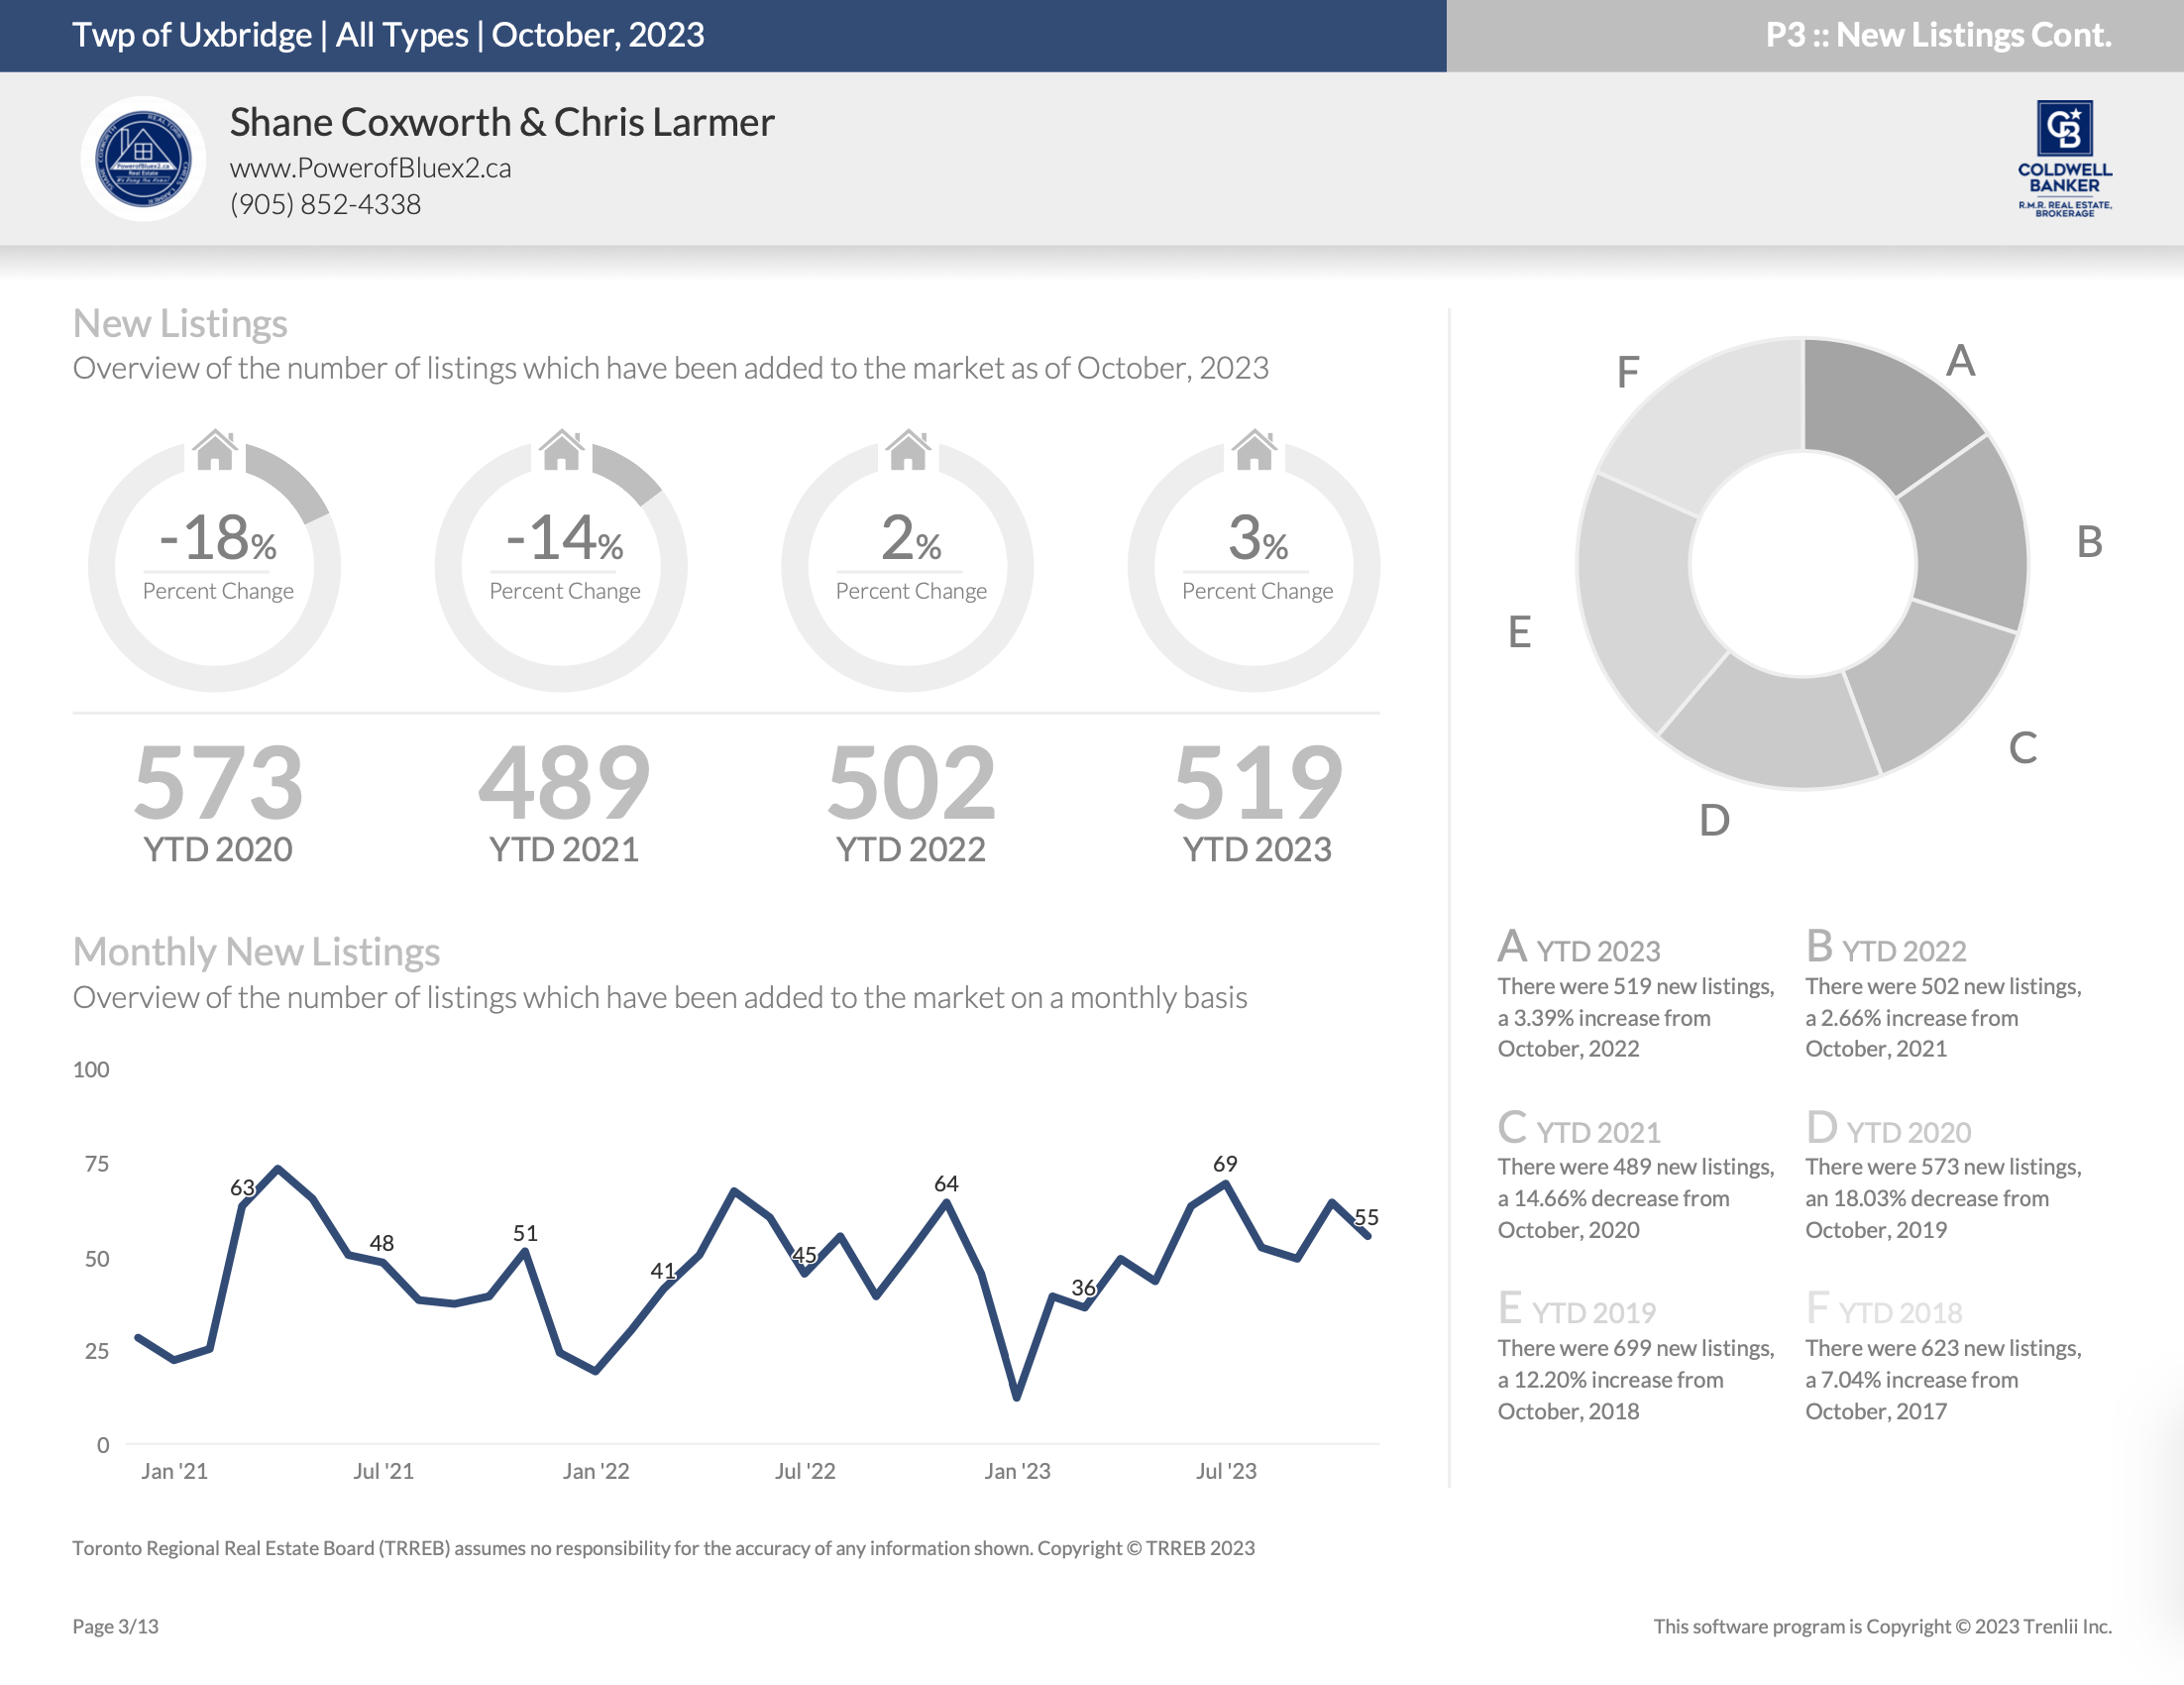
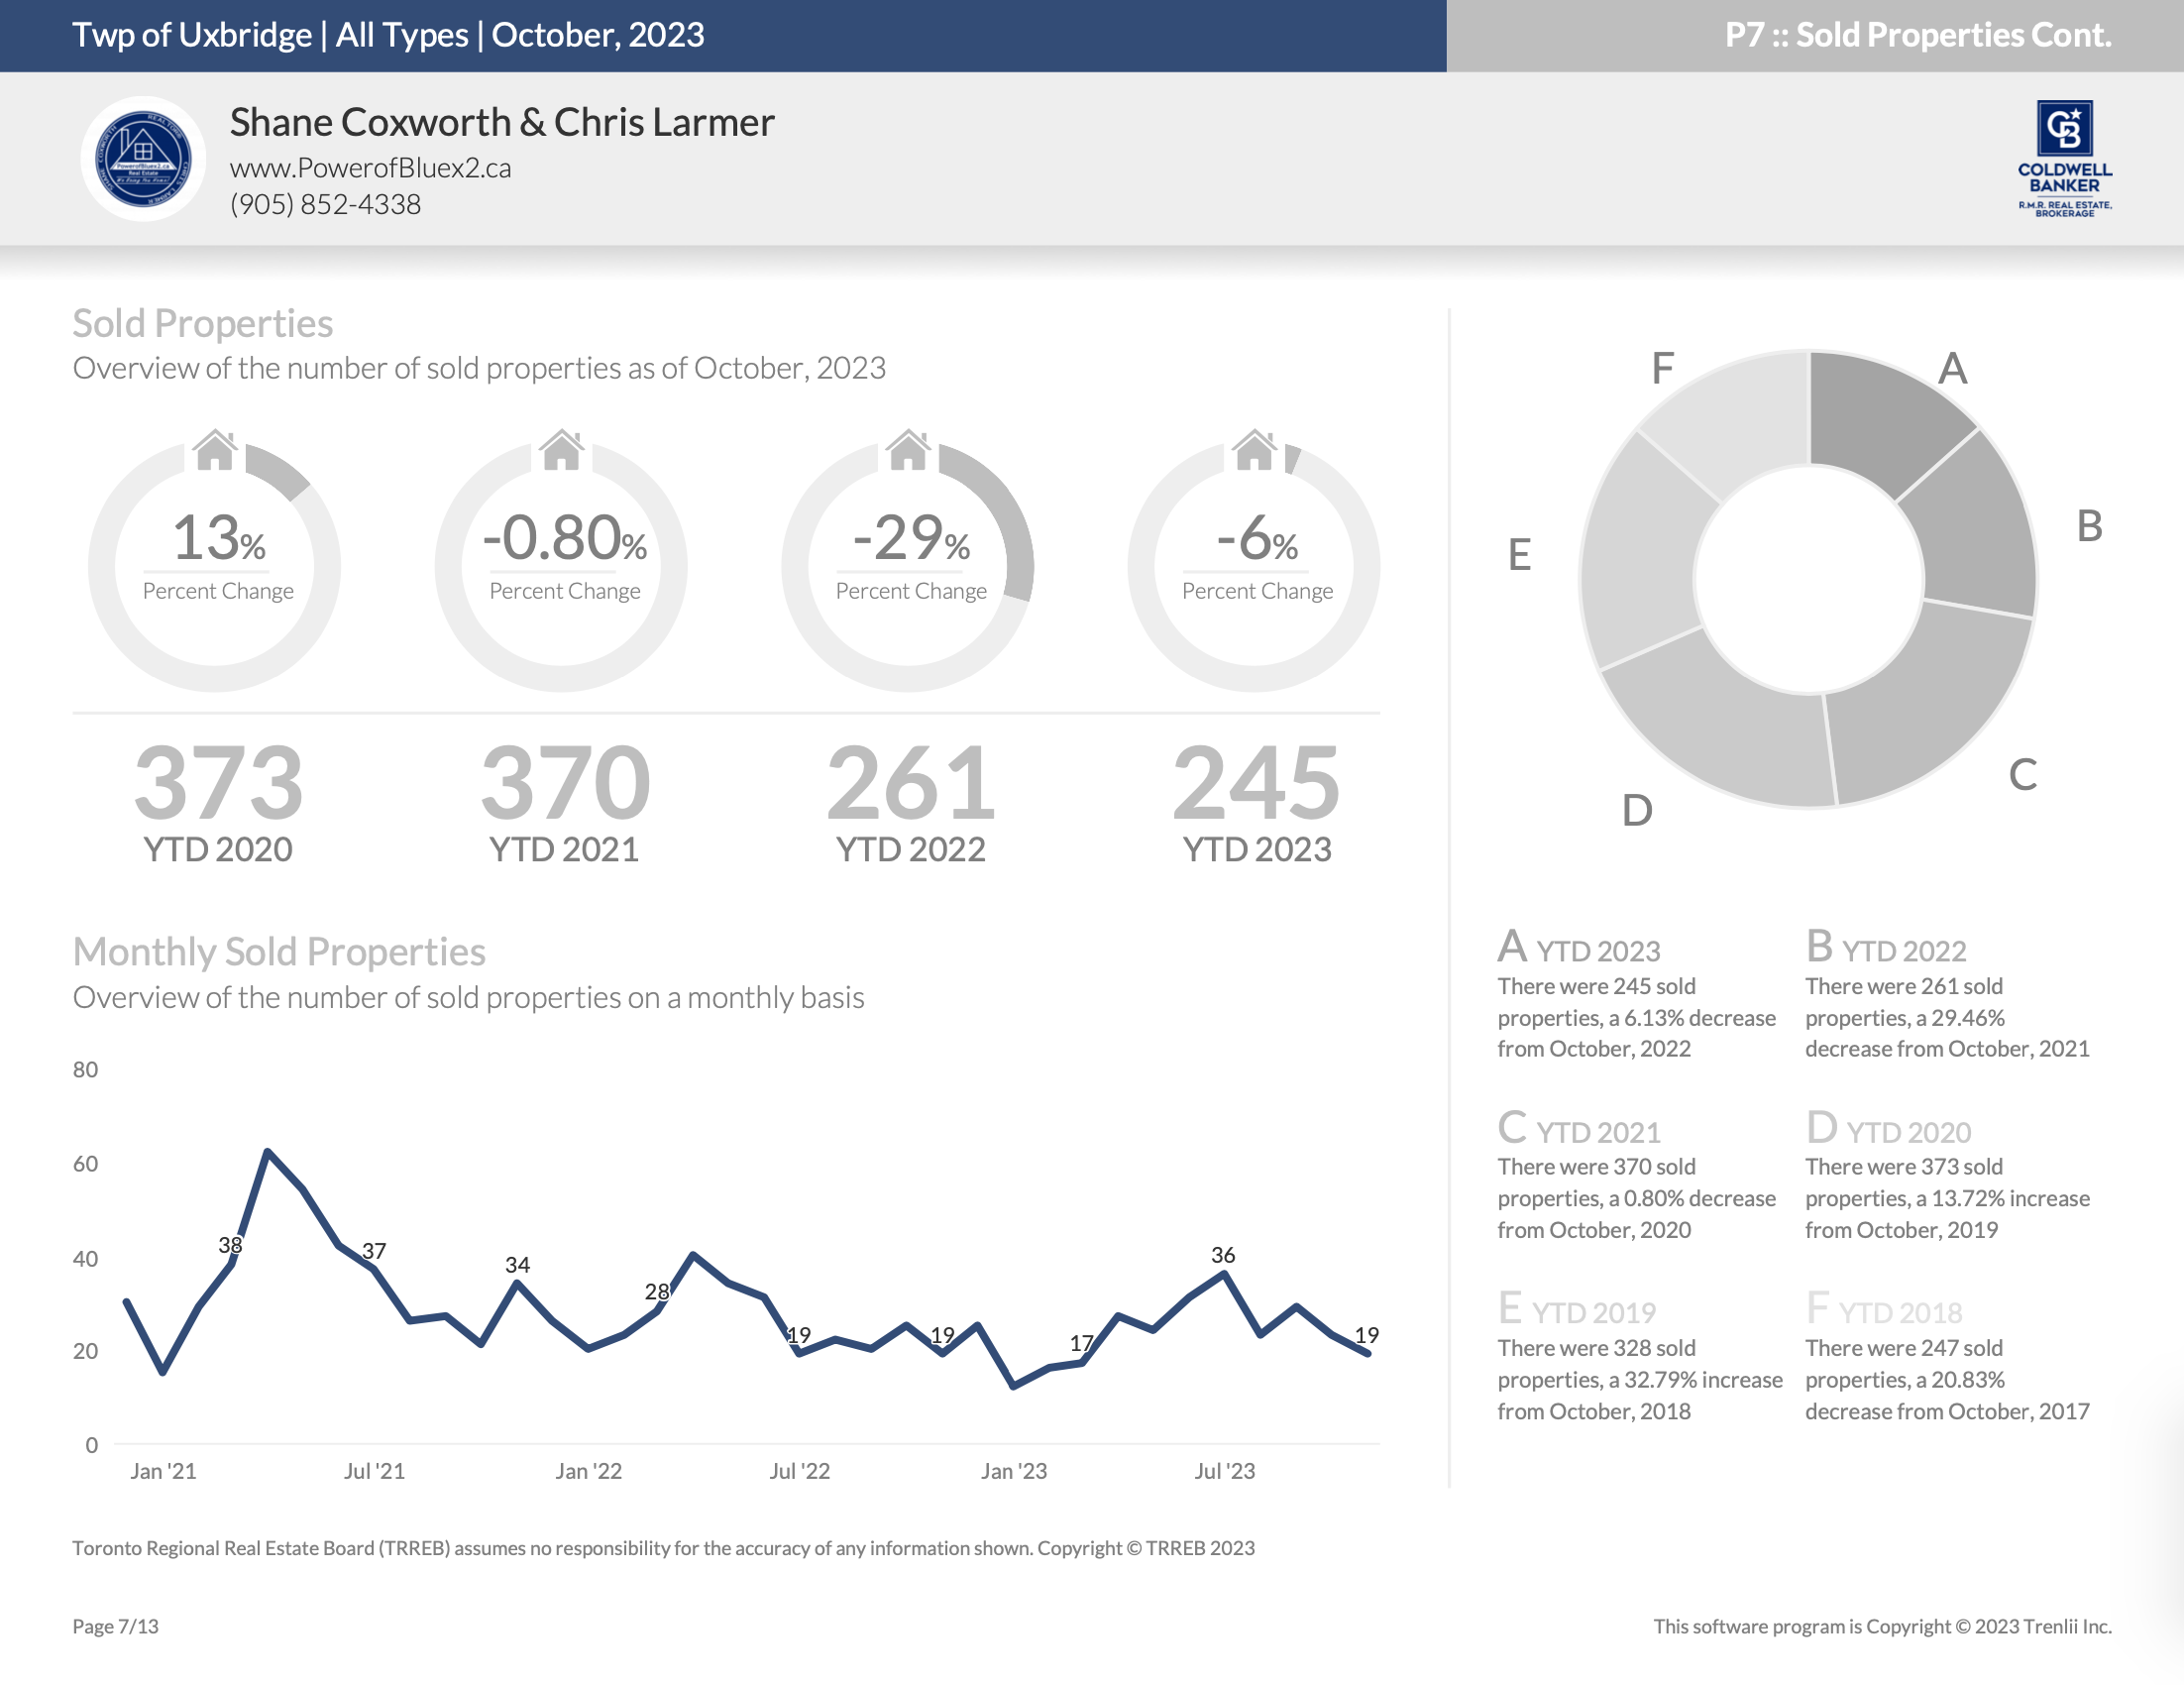
In October, 2023, we have seen 55 properties listed which has resulted in a 14.06% decrease from October, 2022 in which 64 properties were listed; We have seen a year to date volume of 519 in 2023 and 502 in 2022 resulting in a 3.39% increase. There were 19 sold properties which has not increased or decreased from October, 2022 in which 19 listings were sold; We have seen a year to date volume of 245 in 2023 and 261 in 2022 resulting in a 6.13% decrease.
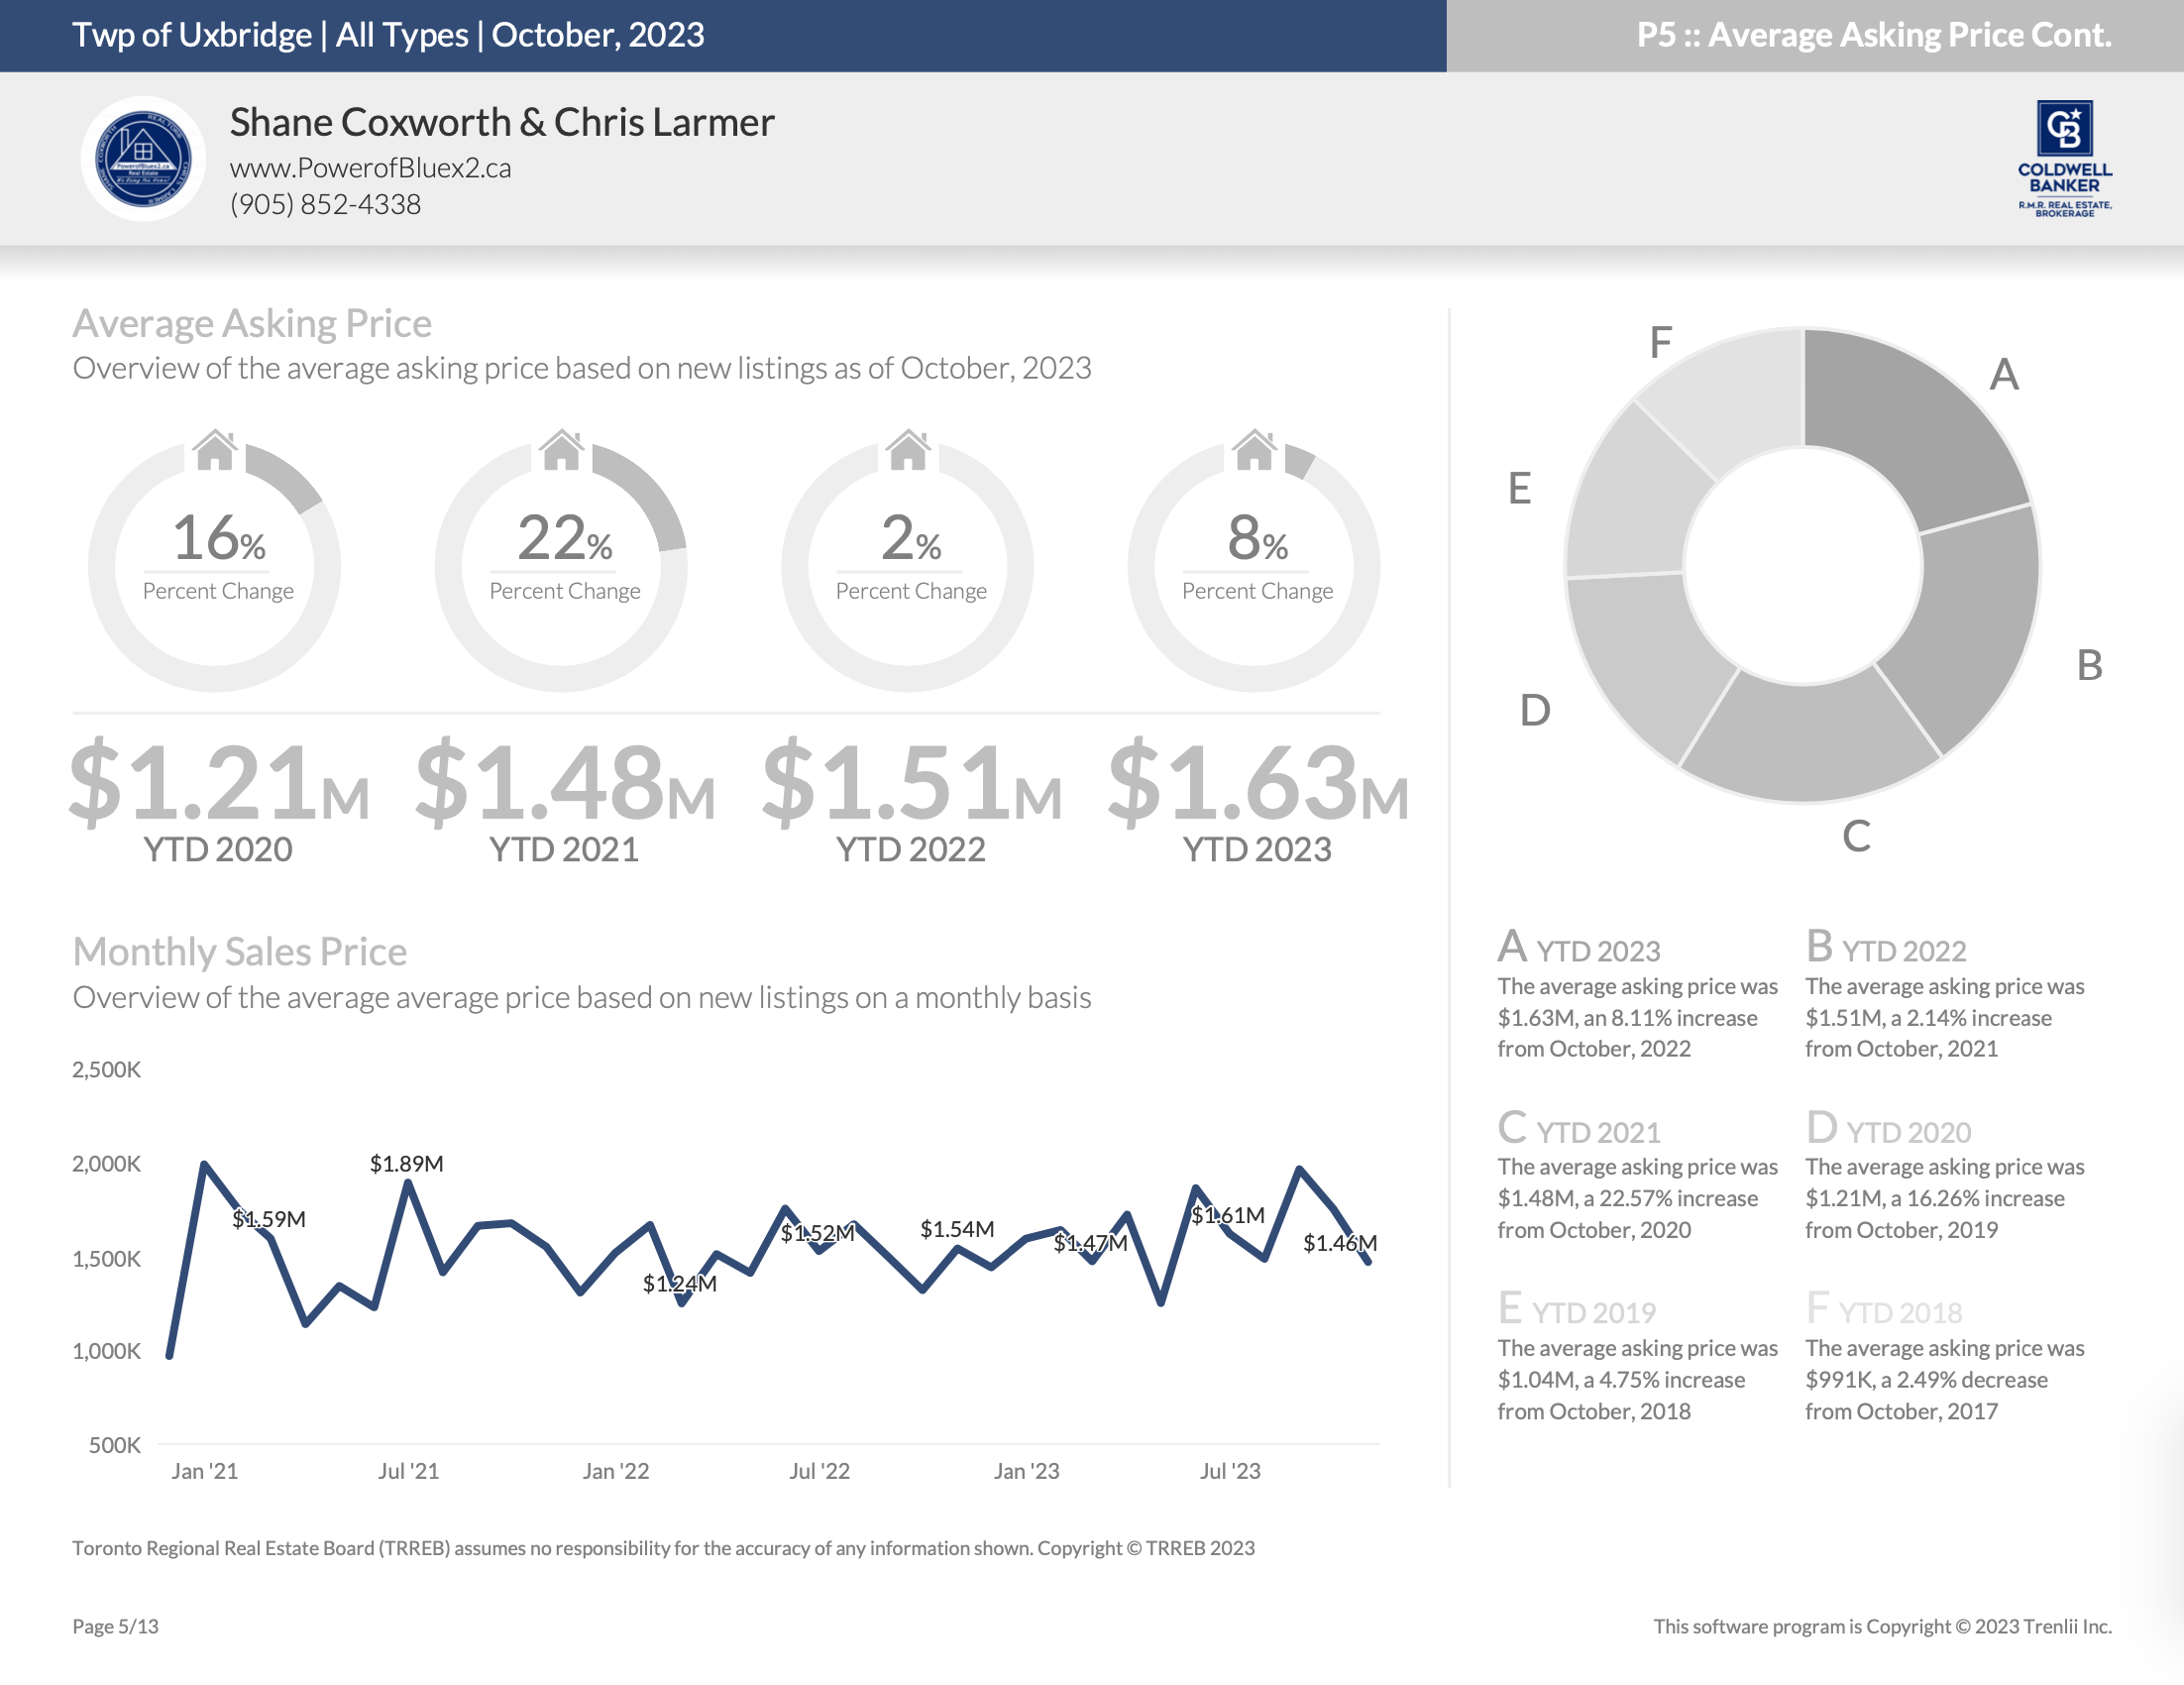
The average sales price in October, 2023 is $1.39 million, a 25.76% increase from October, 2022. The average sales price of October, 2022 was $1.11 million. We have seen a year to date average sales price of $1.32 million in 2023 and $1.35 million in 2022 resulting in a 2.50% decrease.
Quick Review

New Listings – October 2023
New Listings – Year-To-Date
Average Asking Price – October 2023
Average Asking Price – Year-to-Date
Number of Properties Sold – October 2023
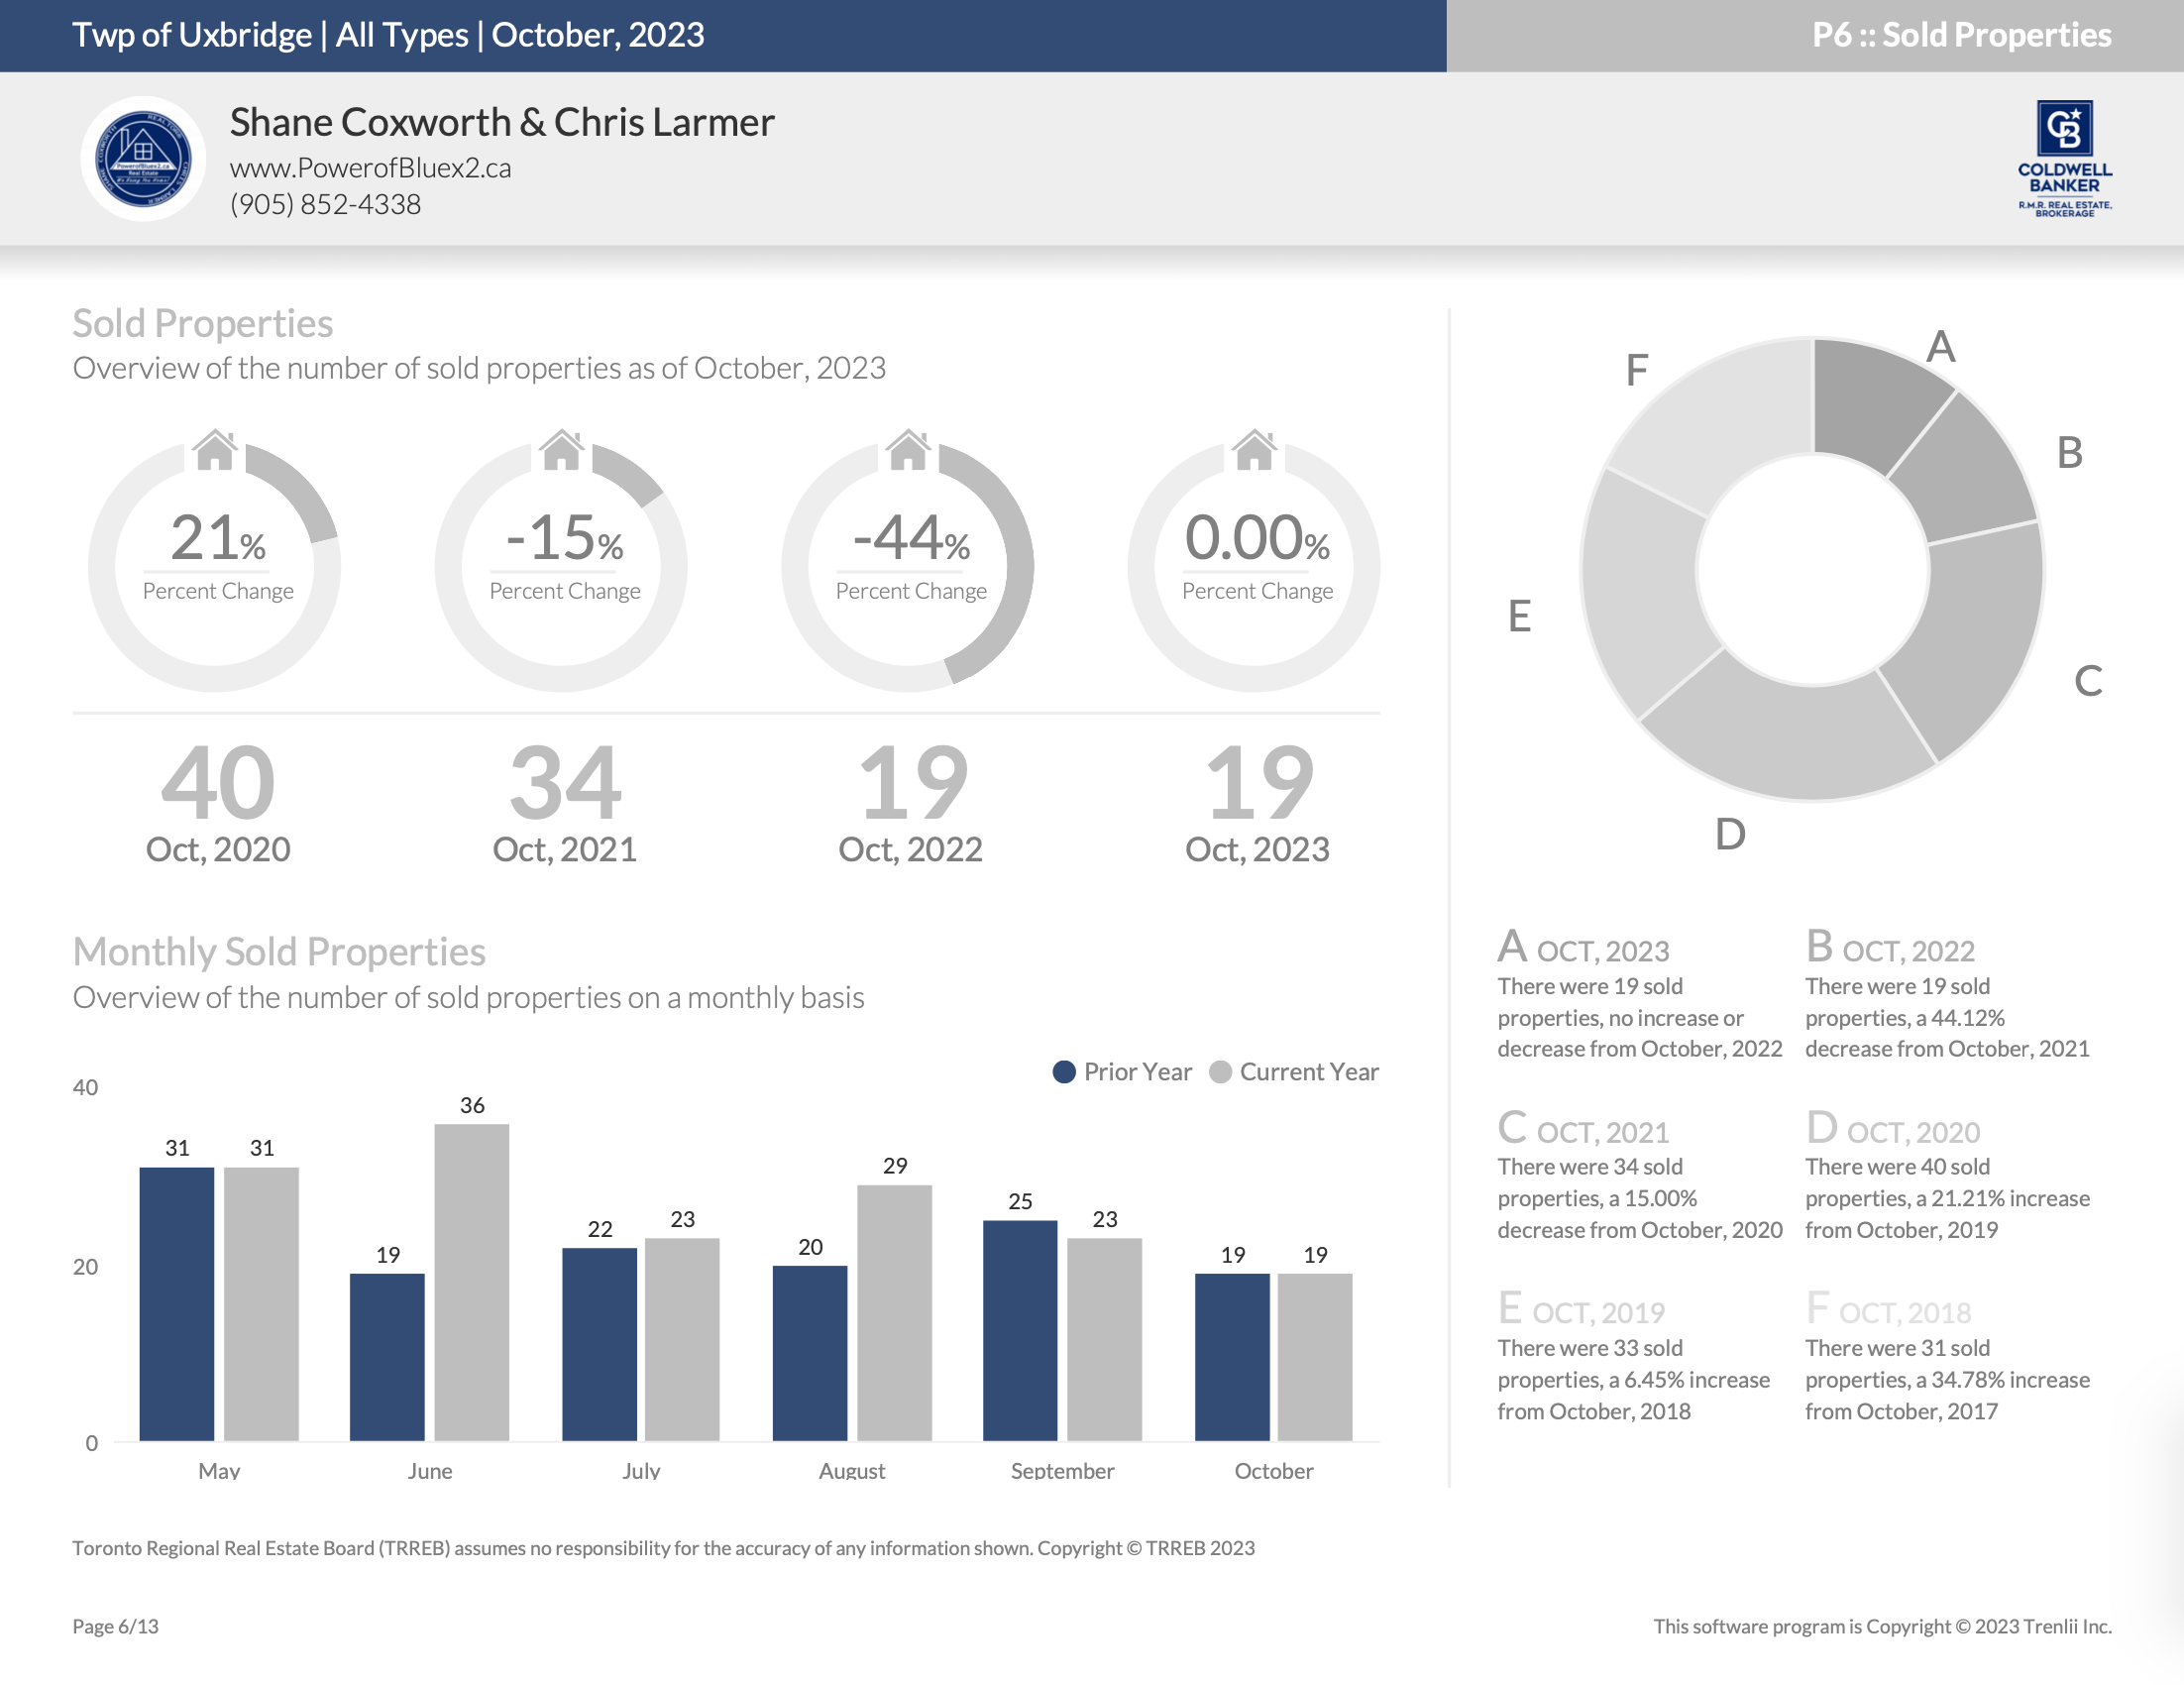
Number of Properties Sold – Year-to-Date
Average Sold Price – October 2023
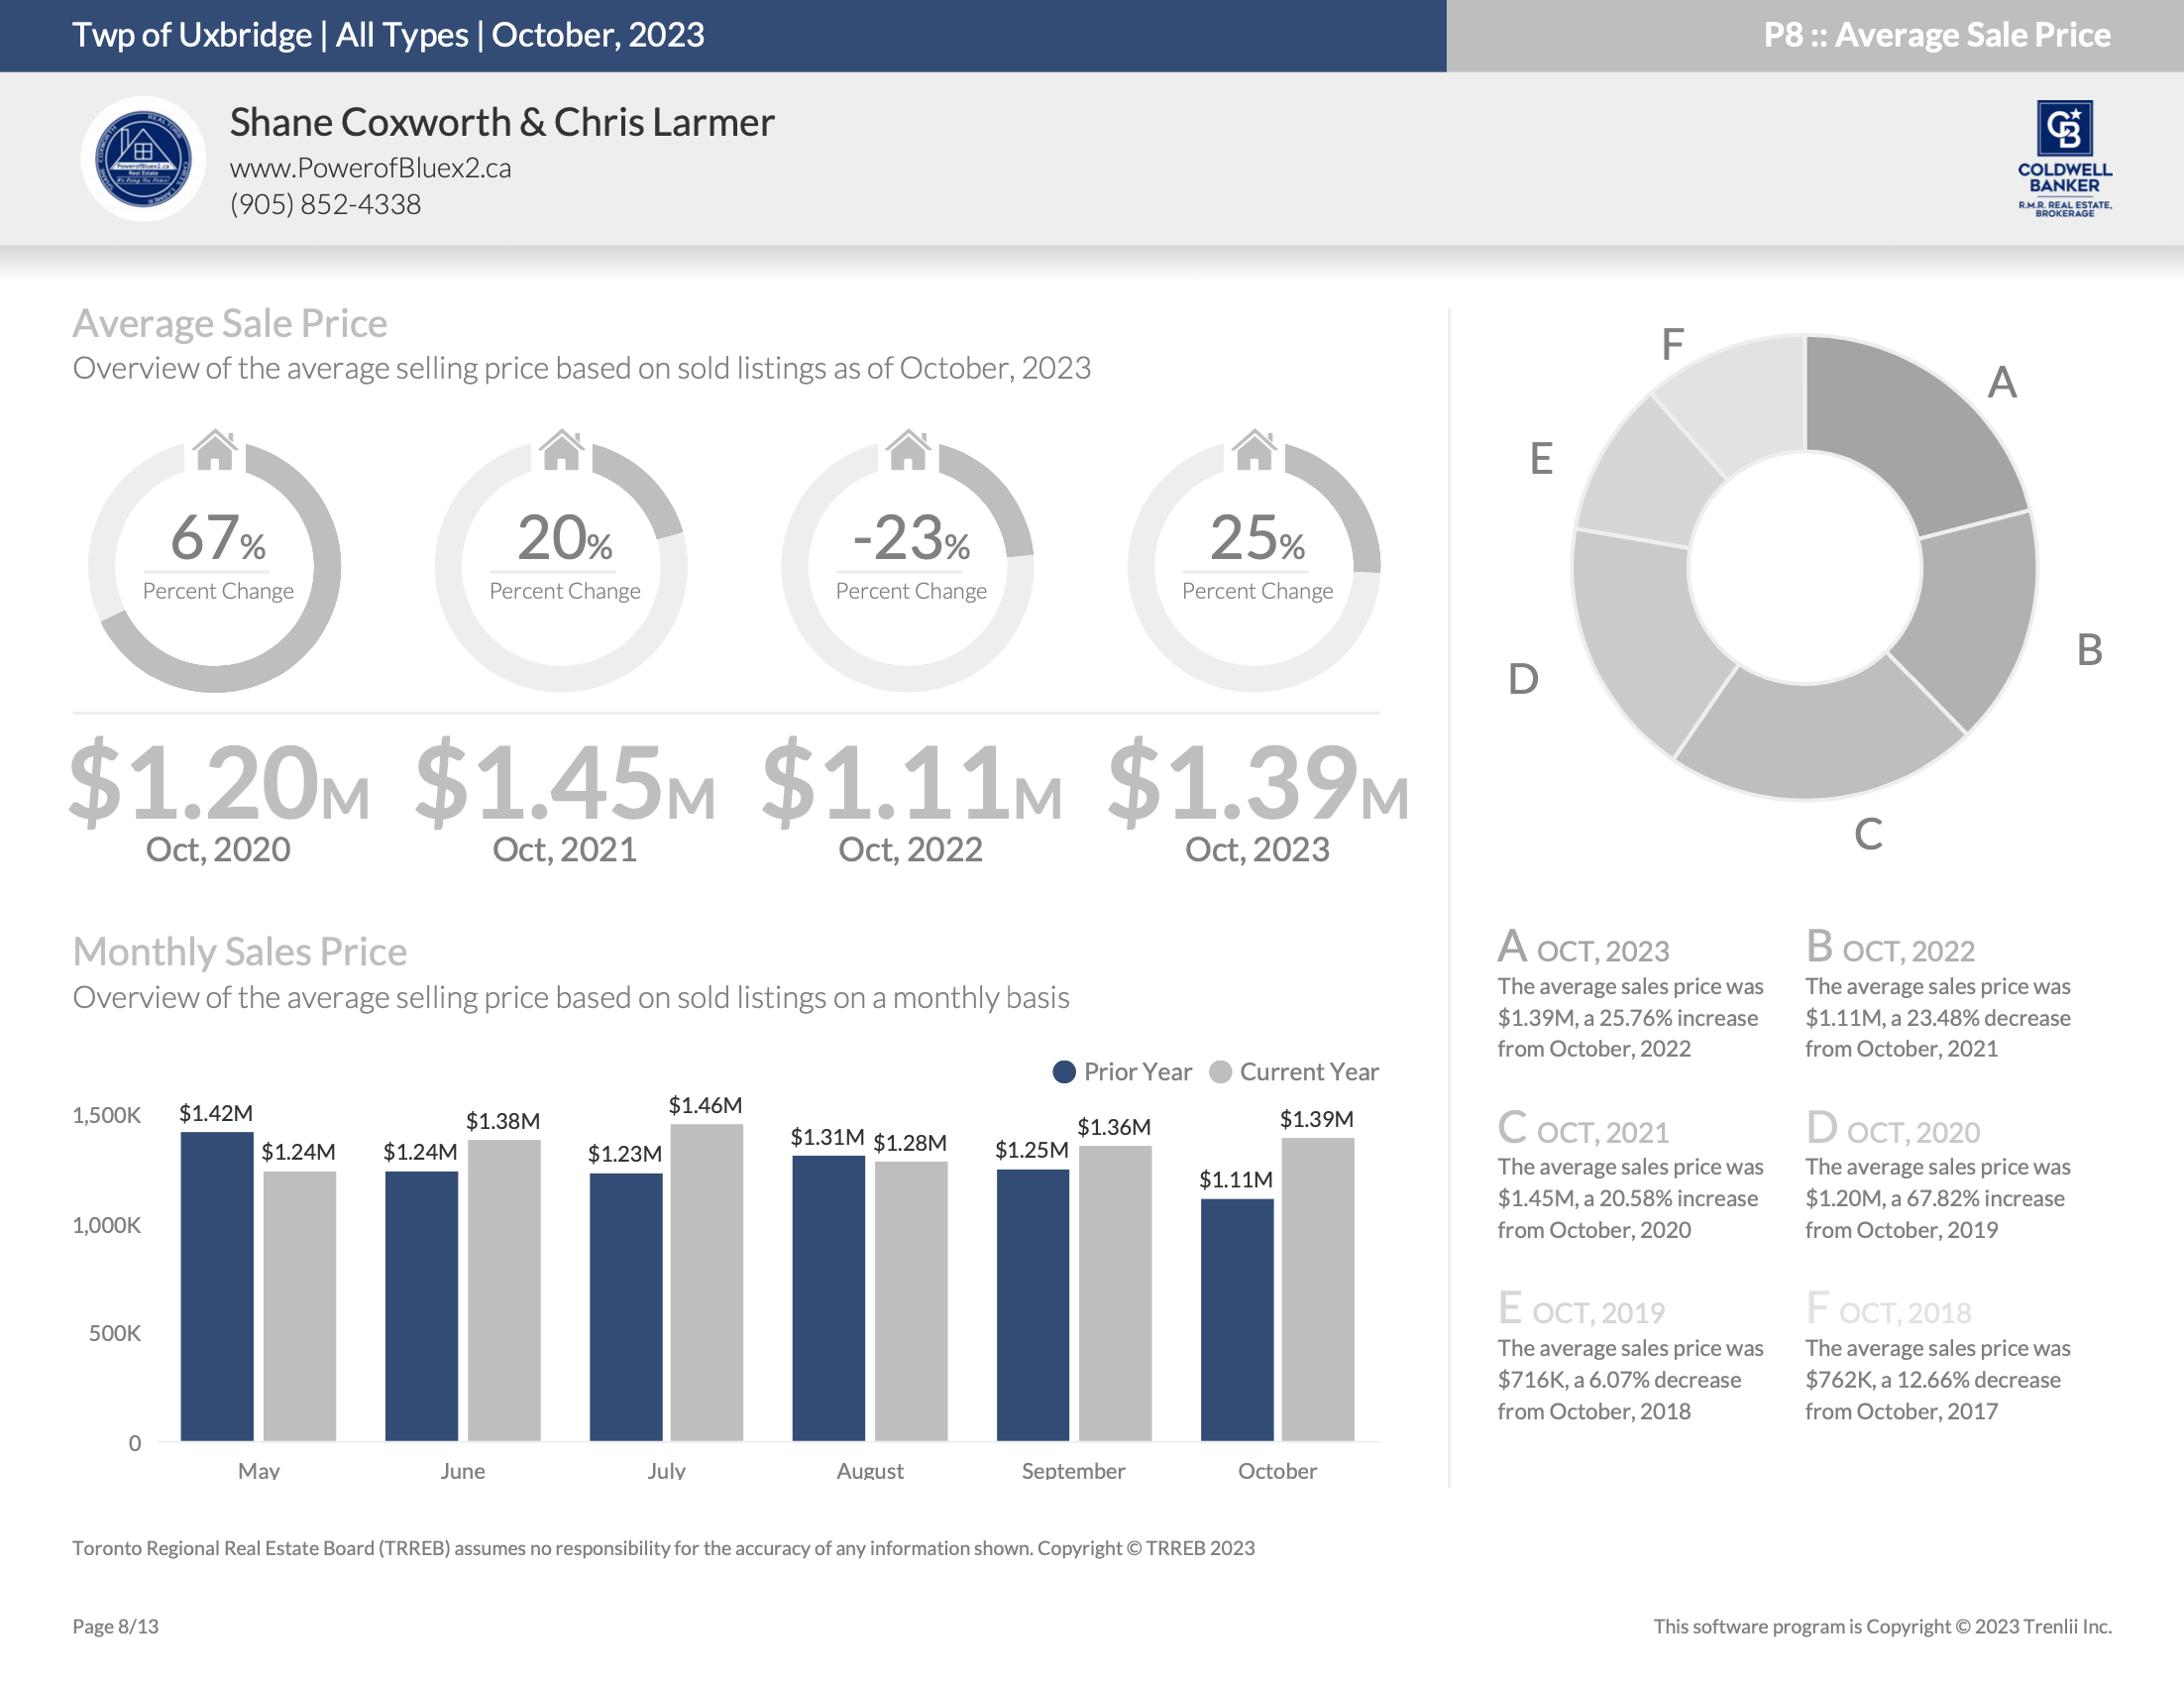
Average Sold Price – Year-to-Date

Days on Market – October 2023
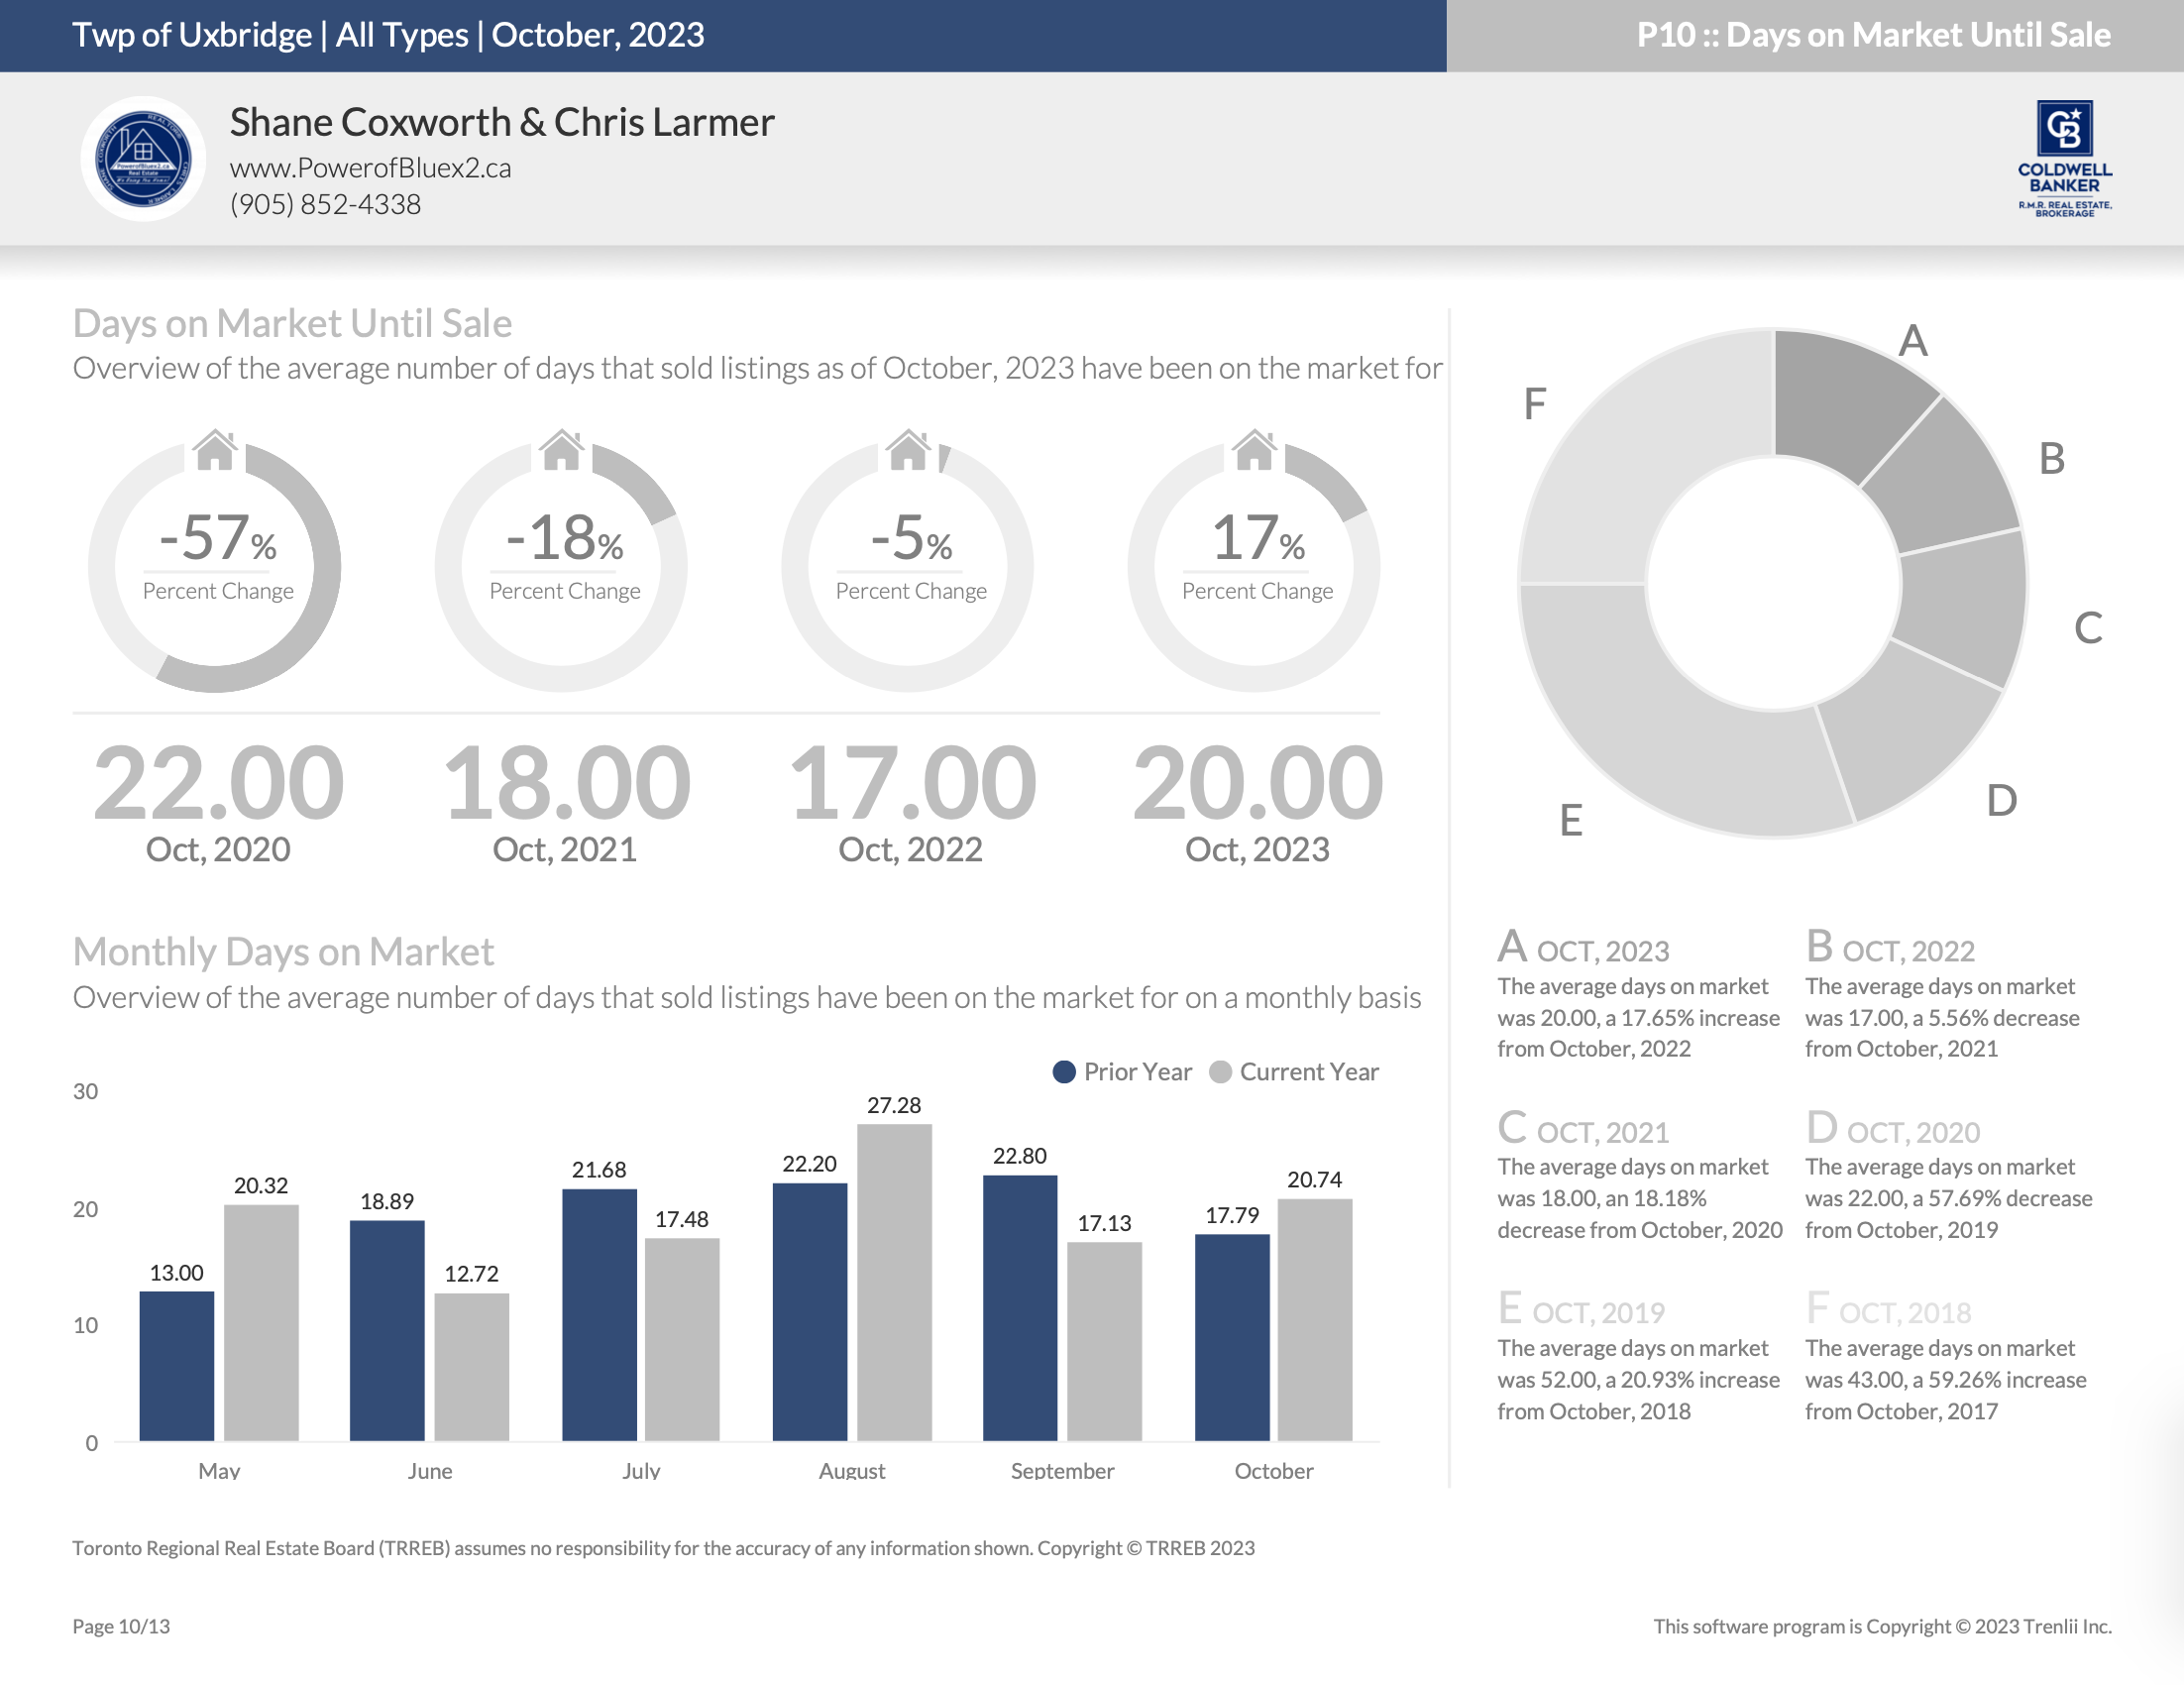
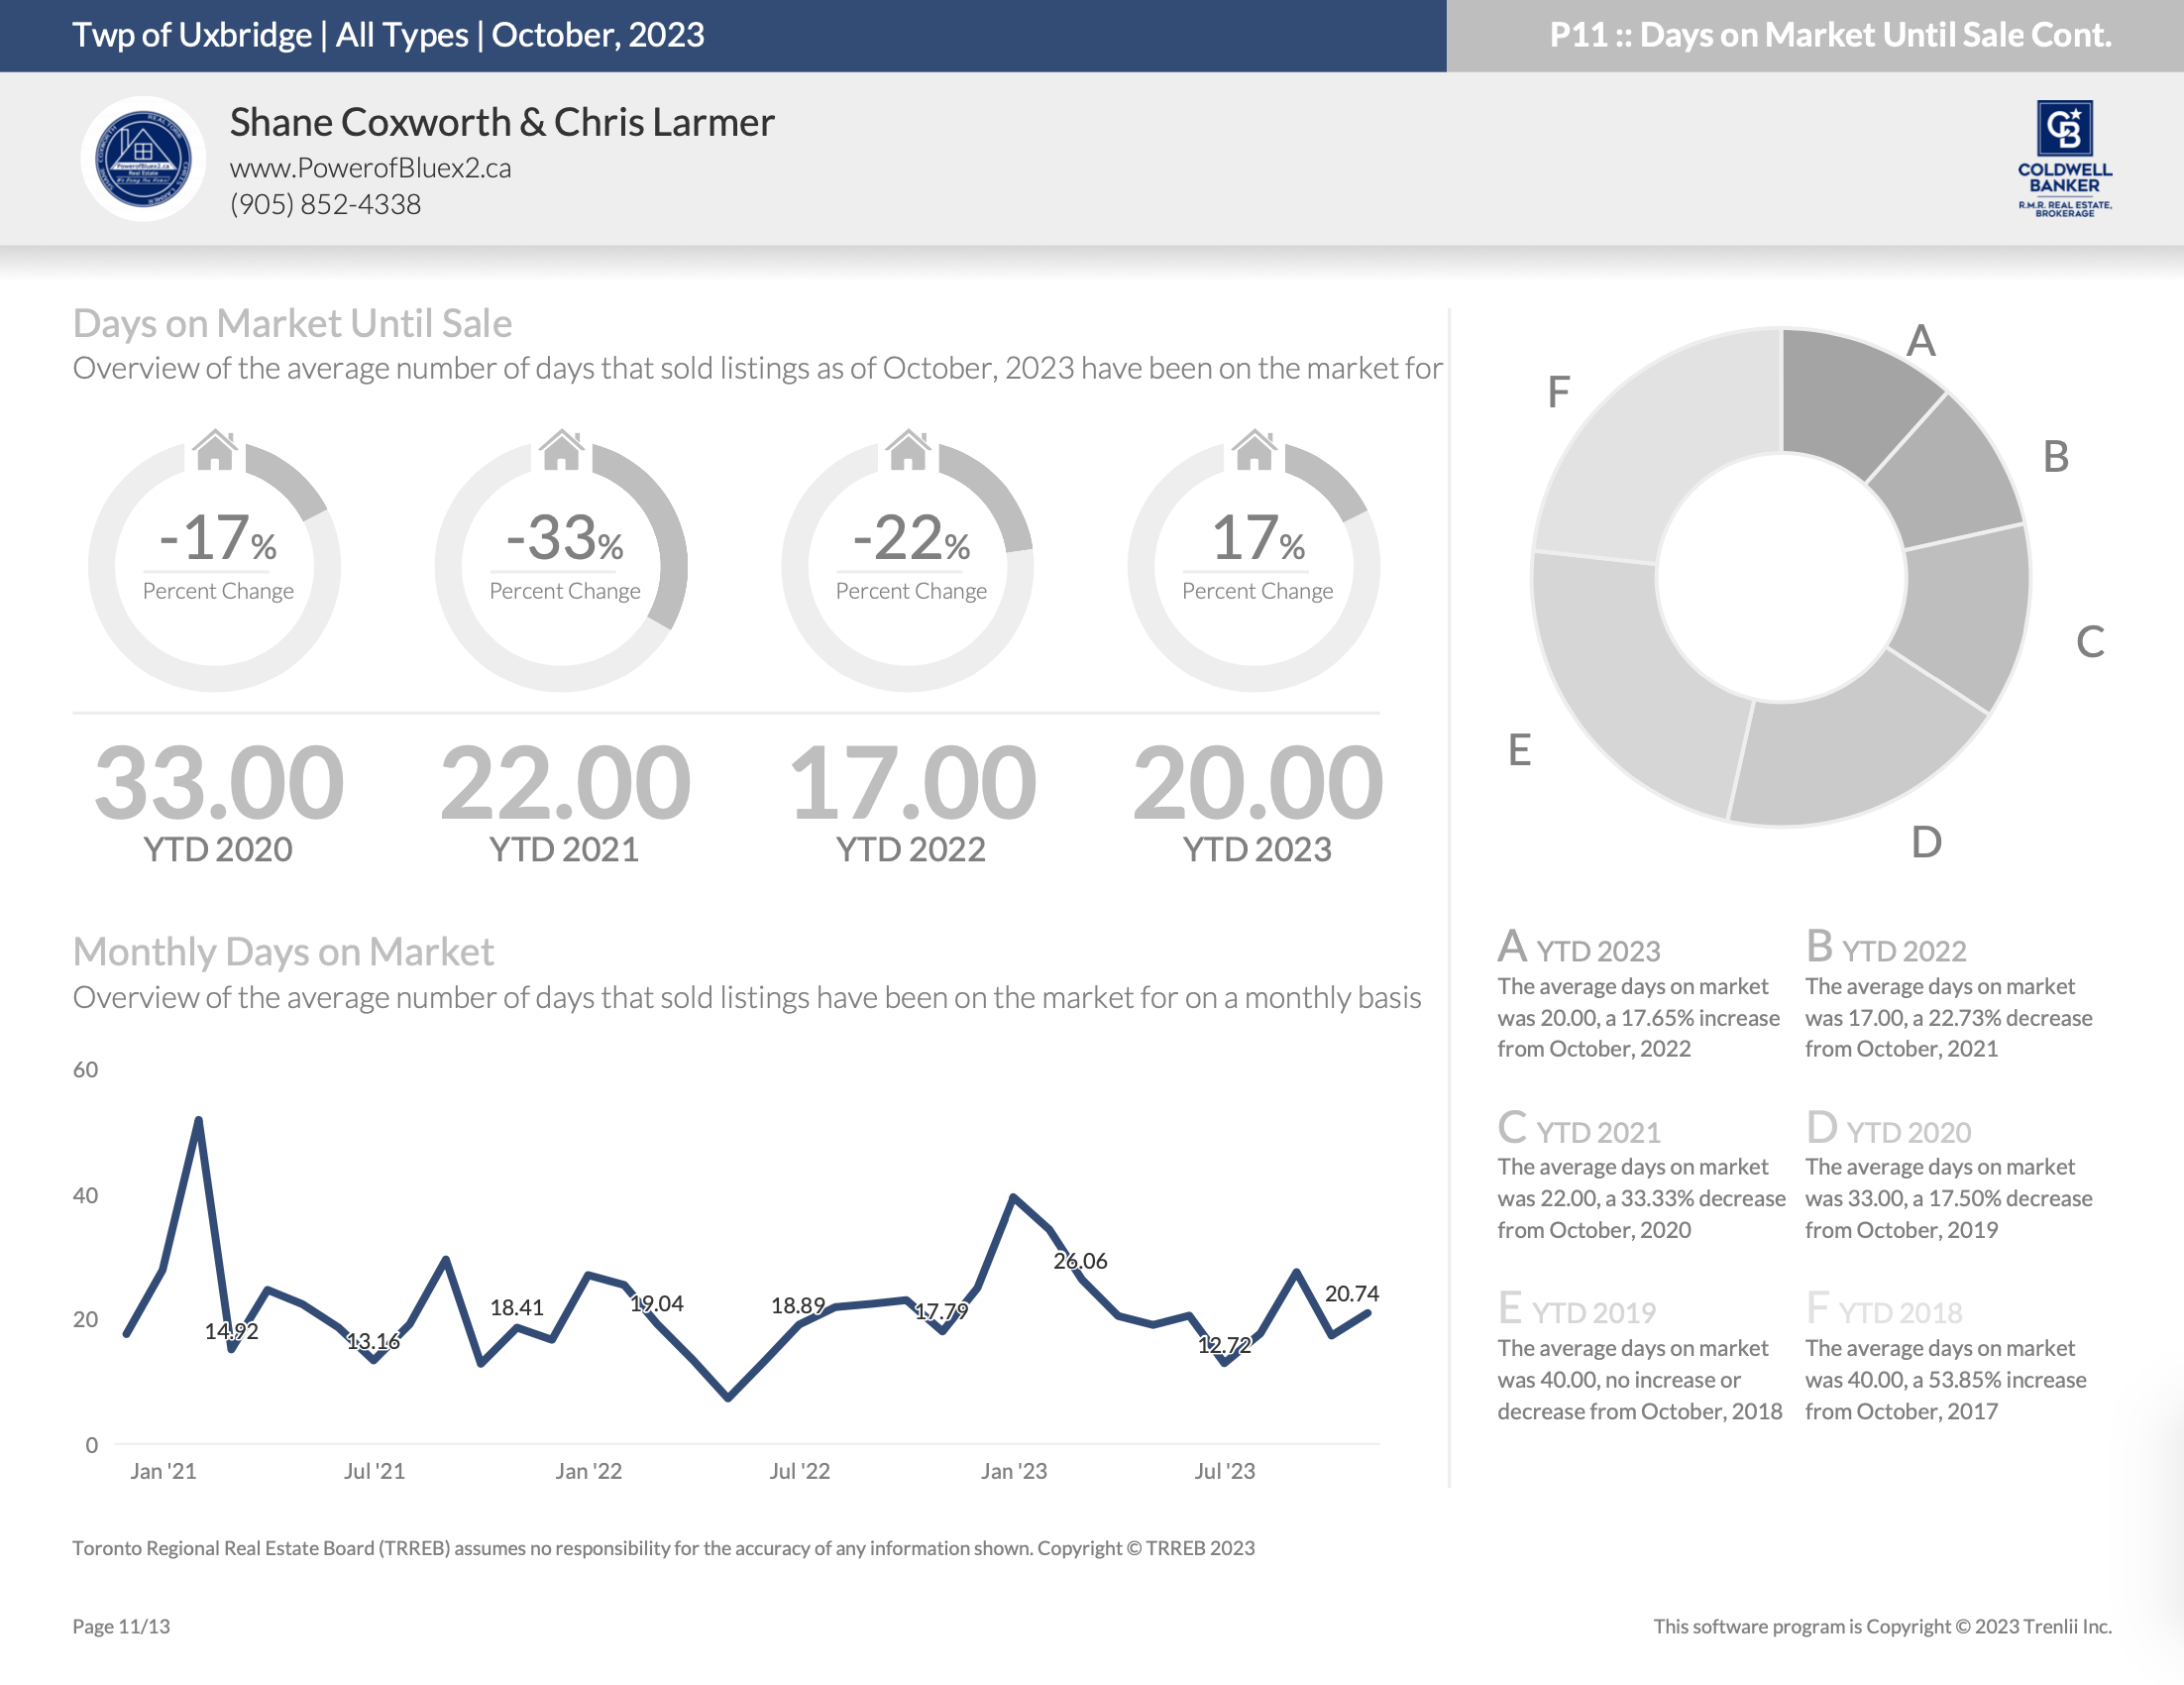
Days on Market – Year-to-Date
Average List Price to Sell Price Ratio – October 2023
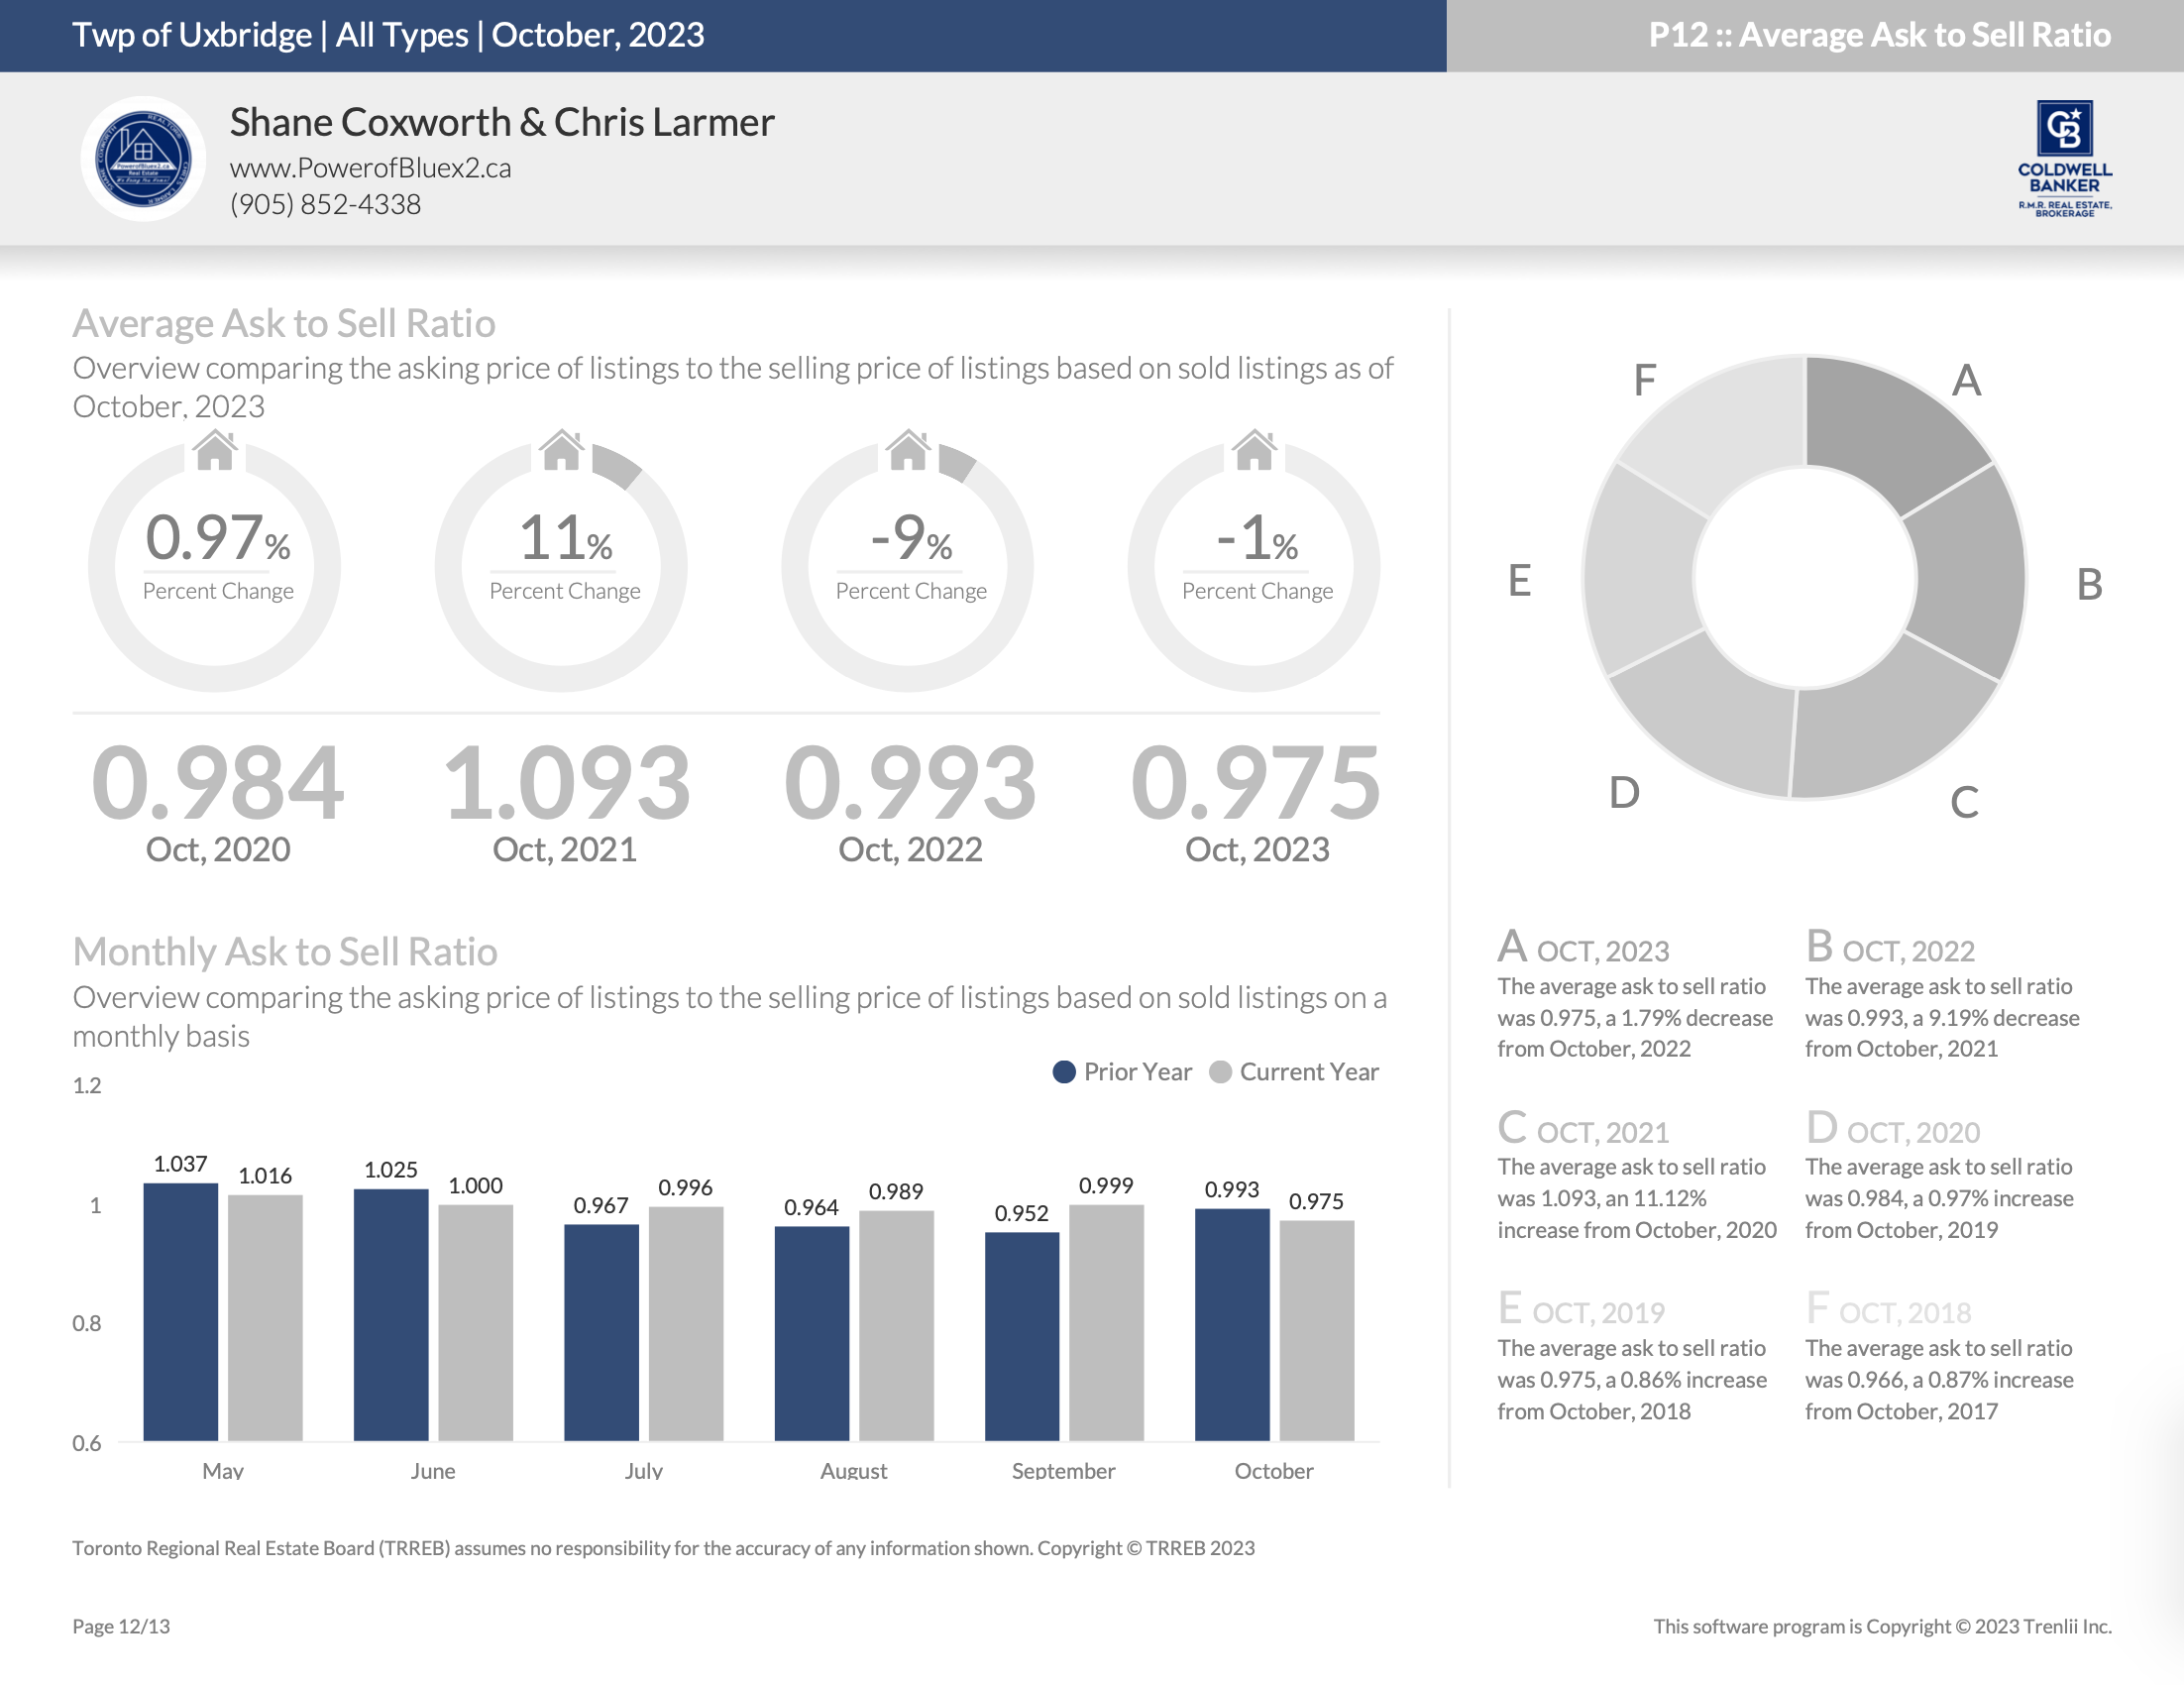
Average List Price to Sell Price Ratio – Year-to-Date

*Information is believed to be accurate at time of posting but is not guaranteed to be correct
Not intended as a solicitation if your property is already listed by another broker. Affiliated real estate agents are independent contractor sales associates, not employees. ©2021 Coldwell Banker. All Rights Reserved. Coldwell Banker and the Coldwell Banker logos are trademarks of Coldwell Banker Real Estate LLC. The Coldwell Banker® System is comprised of company owned offices which are owned by a subsidiary of Realogy Brokerage Group LLC and franchised offices which are independently owned and operated. The Coldwell Banker System fully supports the principles of the Fair Housing Act and the Equal Opportunity Act.
Click below for more reports
Durham Region Housing October 2023
Durham Region Housing October 2023
![]()
Housing Market Report for October 2023
Here is the Region of Durham Housing October 2023 report (all housing types), with reports from the Canadian Real Estate Association, Toronto Regional Real Estate Board and the Durham Association of REALTORS® included.
This housing report for Durham Region includes the number of new listings, average list price, number of properties sold, average selling price, average days on market and average asking price to selling price ratio for all property types within the Region of Durham.
Scroll to the bottom for links to take you to the housing market reports for Uxbridge, Scugog, Brock and the Kawartha Lakes.
![]()
CREA HOUSING MARKET REPORT – NOVEMBER 2023
![]()
From Toronto Regional Real Estate Board
Toronto Regional Real Estate Board – Market Stats At A Glance – October 2023
Read the Toronto Regional Real Estate Board Market Watch Report
![]()
Durham REALTORS® Report October 2023 Housing Statistics
Read the Durham Association of REALTORS® FULL Real Estate Report
![]()
Durham Region Full Report
*Some values may vary slightly based on the exact date and time the reports were generated.
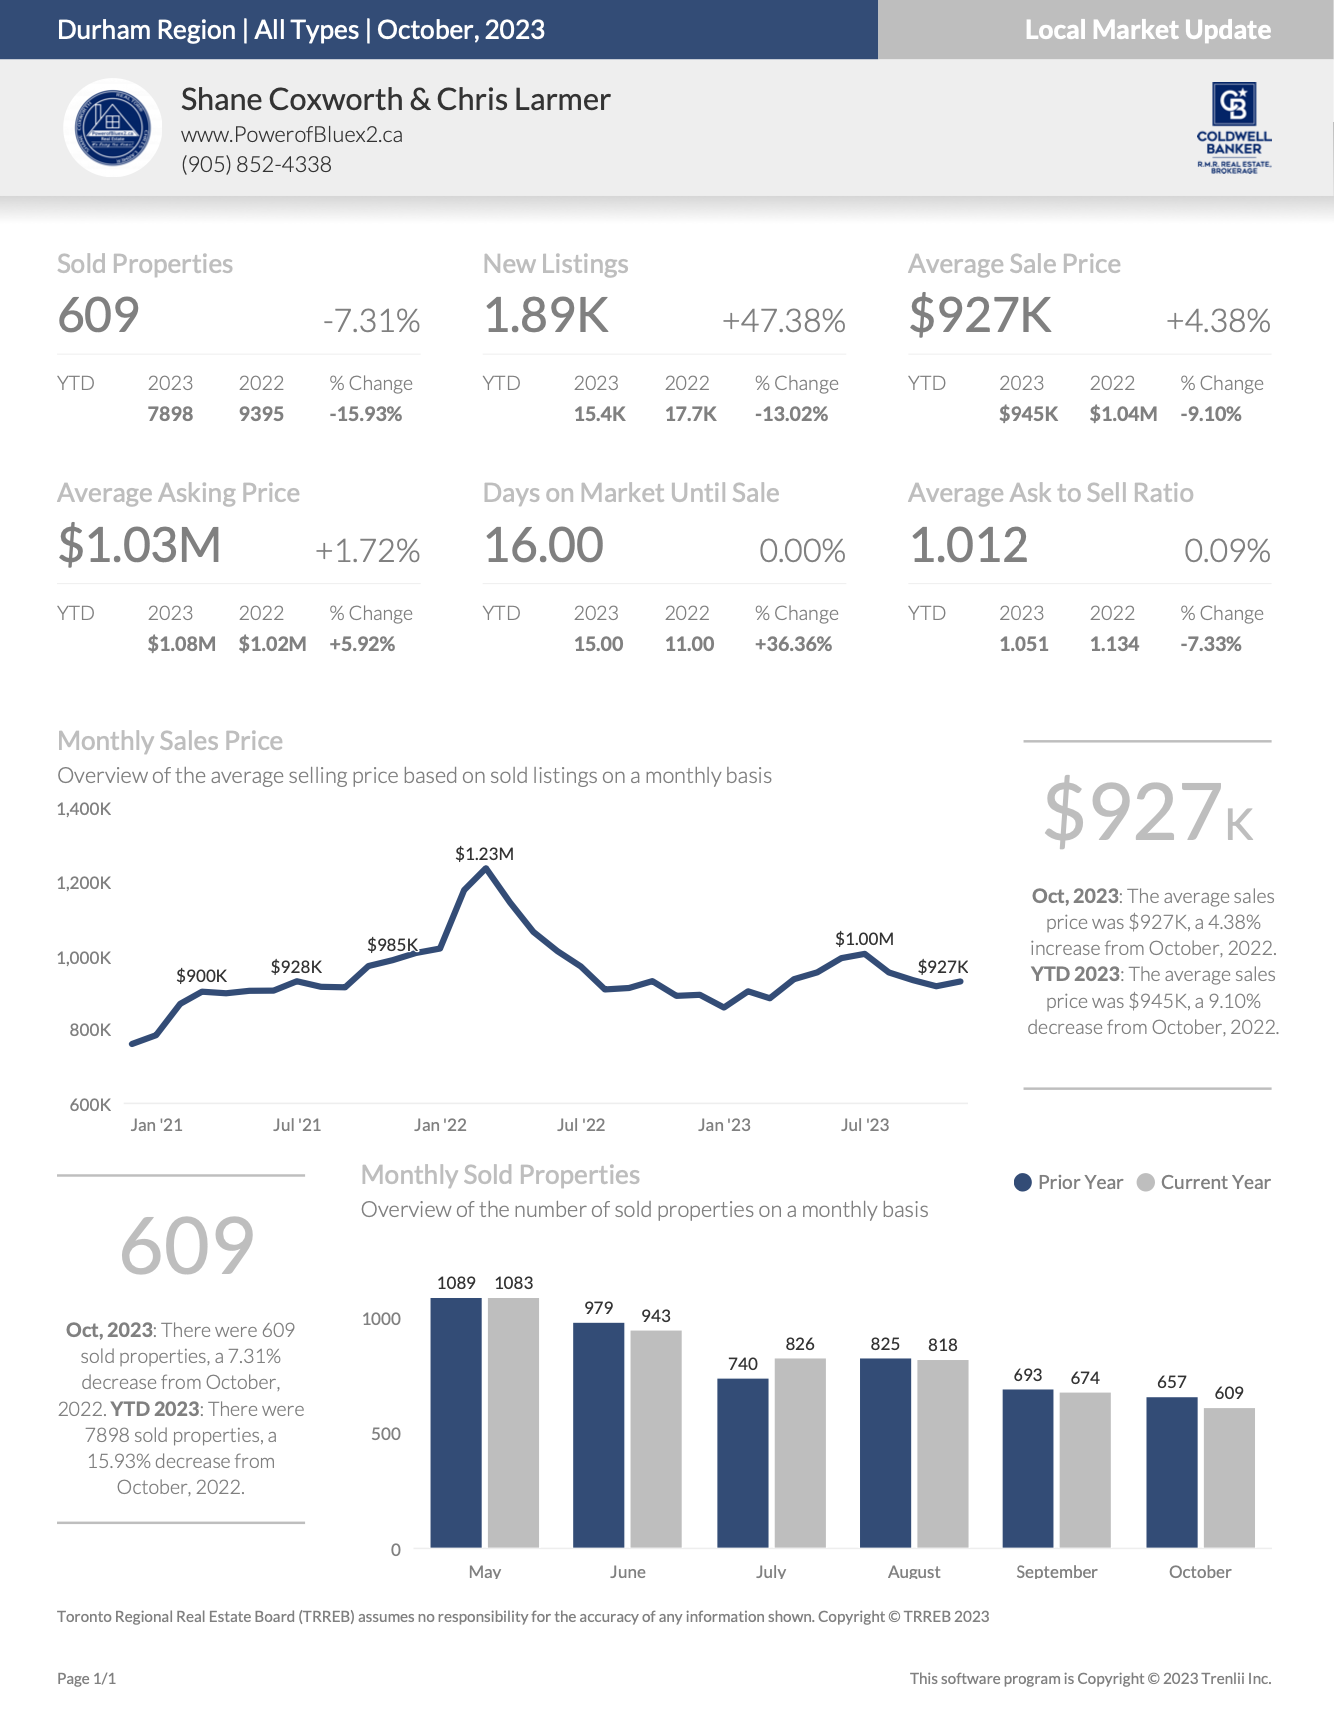
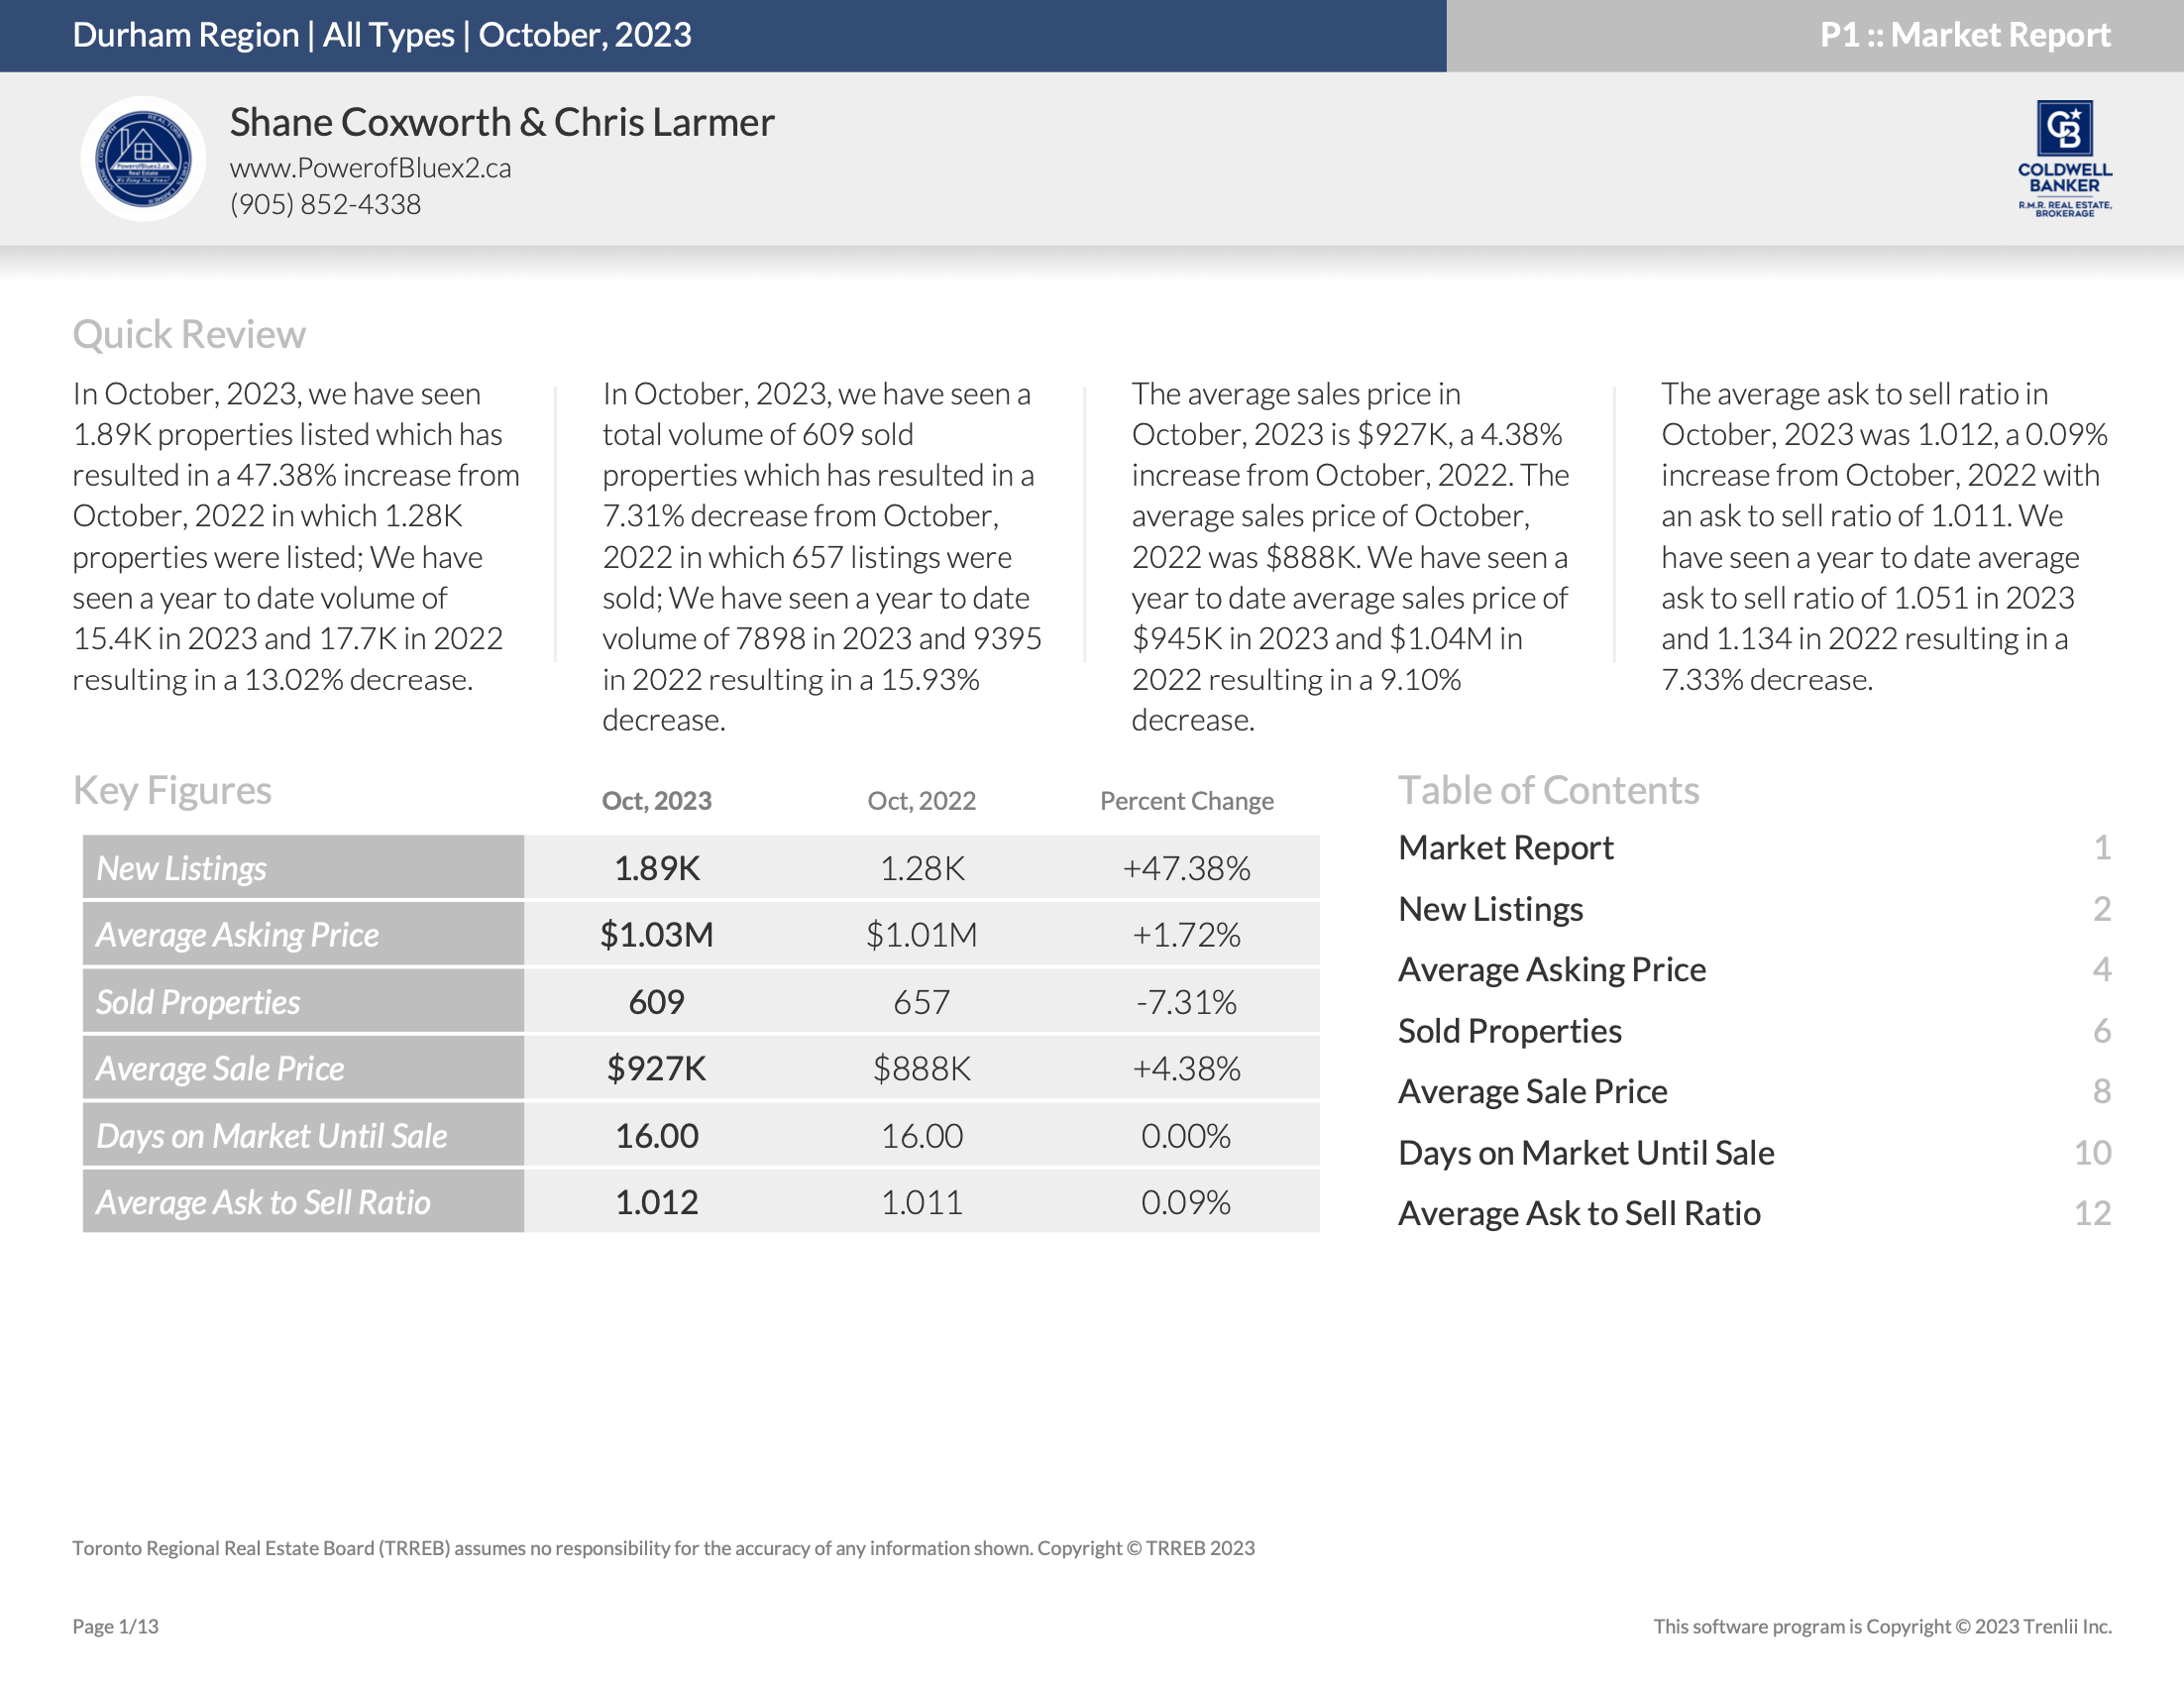
The real estate market in Durham Region has shown interesting trends throughout 2023. The average sale price, which started the year at $886,849 in January, experienced a modest increase in the spring before levelling off and reaching $931,548 in October. Active listings have steadily risen since January, providing more options for potential buyers. In terms of days on market, we observed a dip during the spring, which is a typical pattern, followed by a gradual increase, averaging 26 days on the market in October. January saw 394 sales, with the number of sales peaking in May and subsequently declining to 588 in October. However, despite the drop in sales volume, the sales price has remained relatively stable. In October, there were 3.01 months of inventory, indicating that the market is in a balanced state. While the number of sales has decreased, there hasn’t been a dramatic impact on property prices, making Durham Region an attractive and resilient market for both buyers and sellers.
Quick Review
New Listings – October 2023

New Listings – Year-To-Date
Average Asking Price – October 2023
Average Asking Price – Year-to-Date
Number of Properties Sold – October 2023
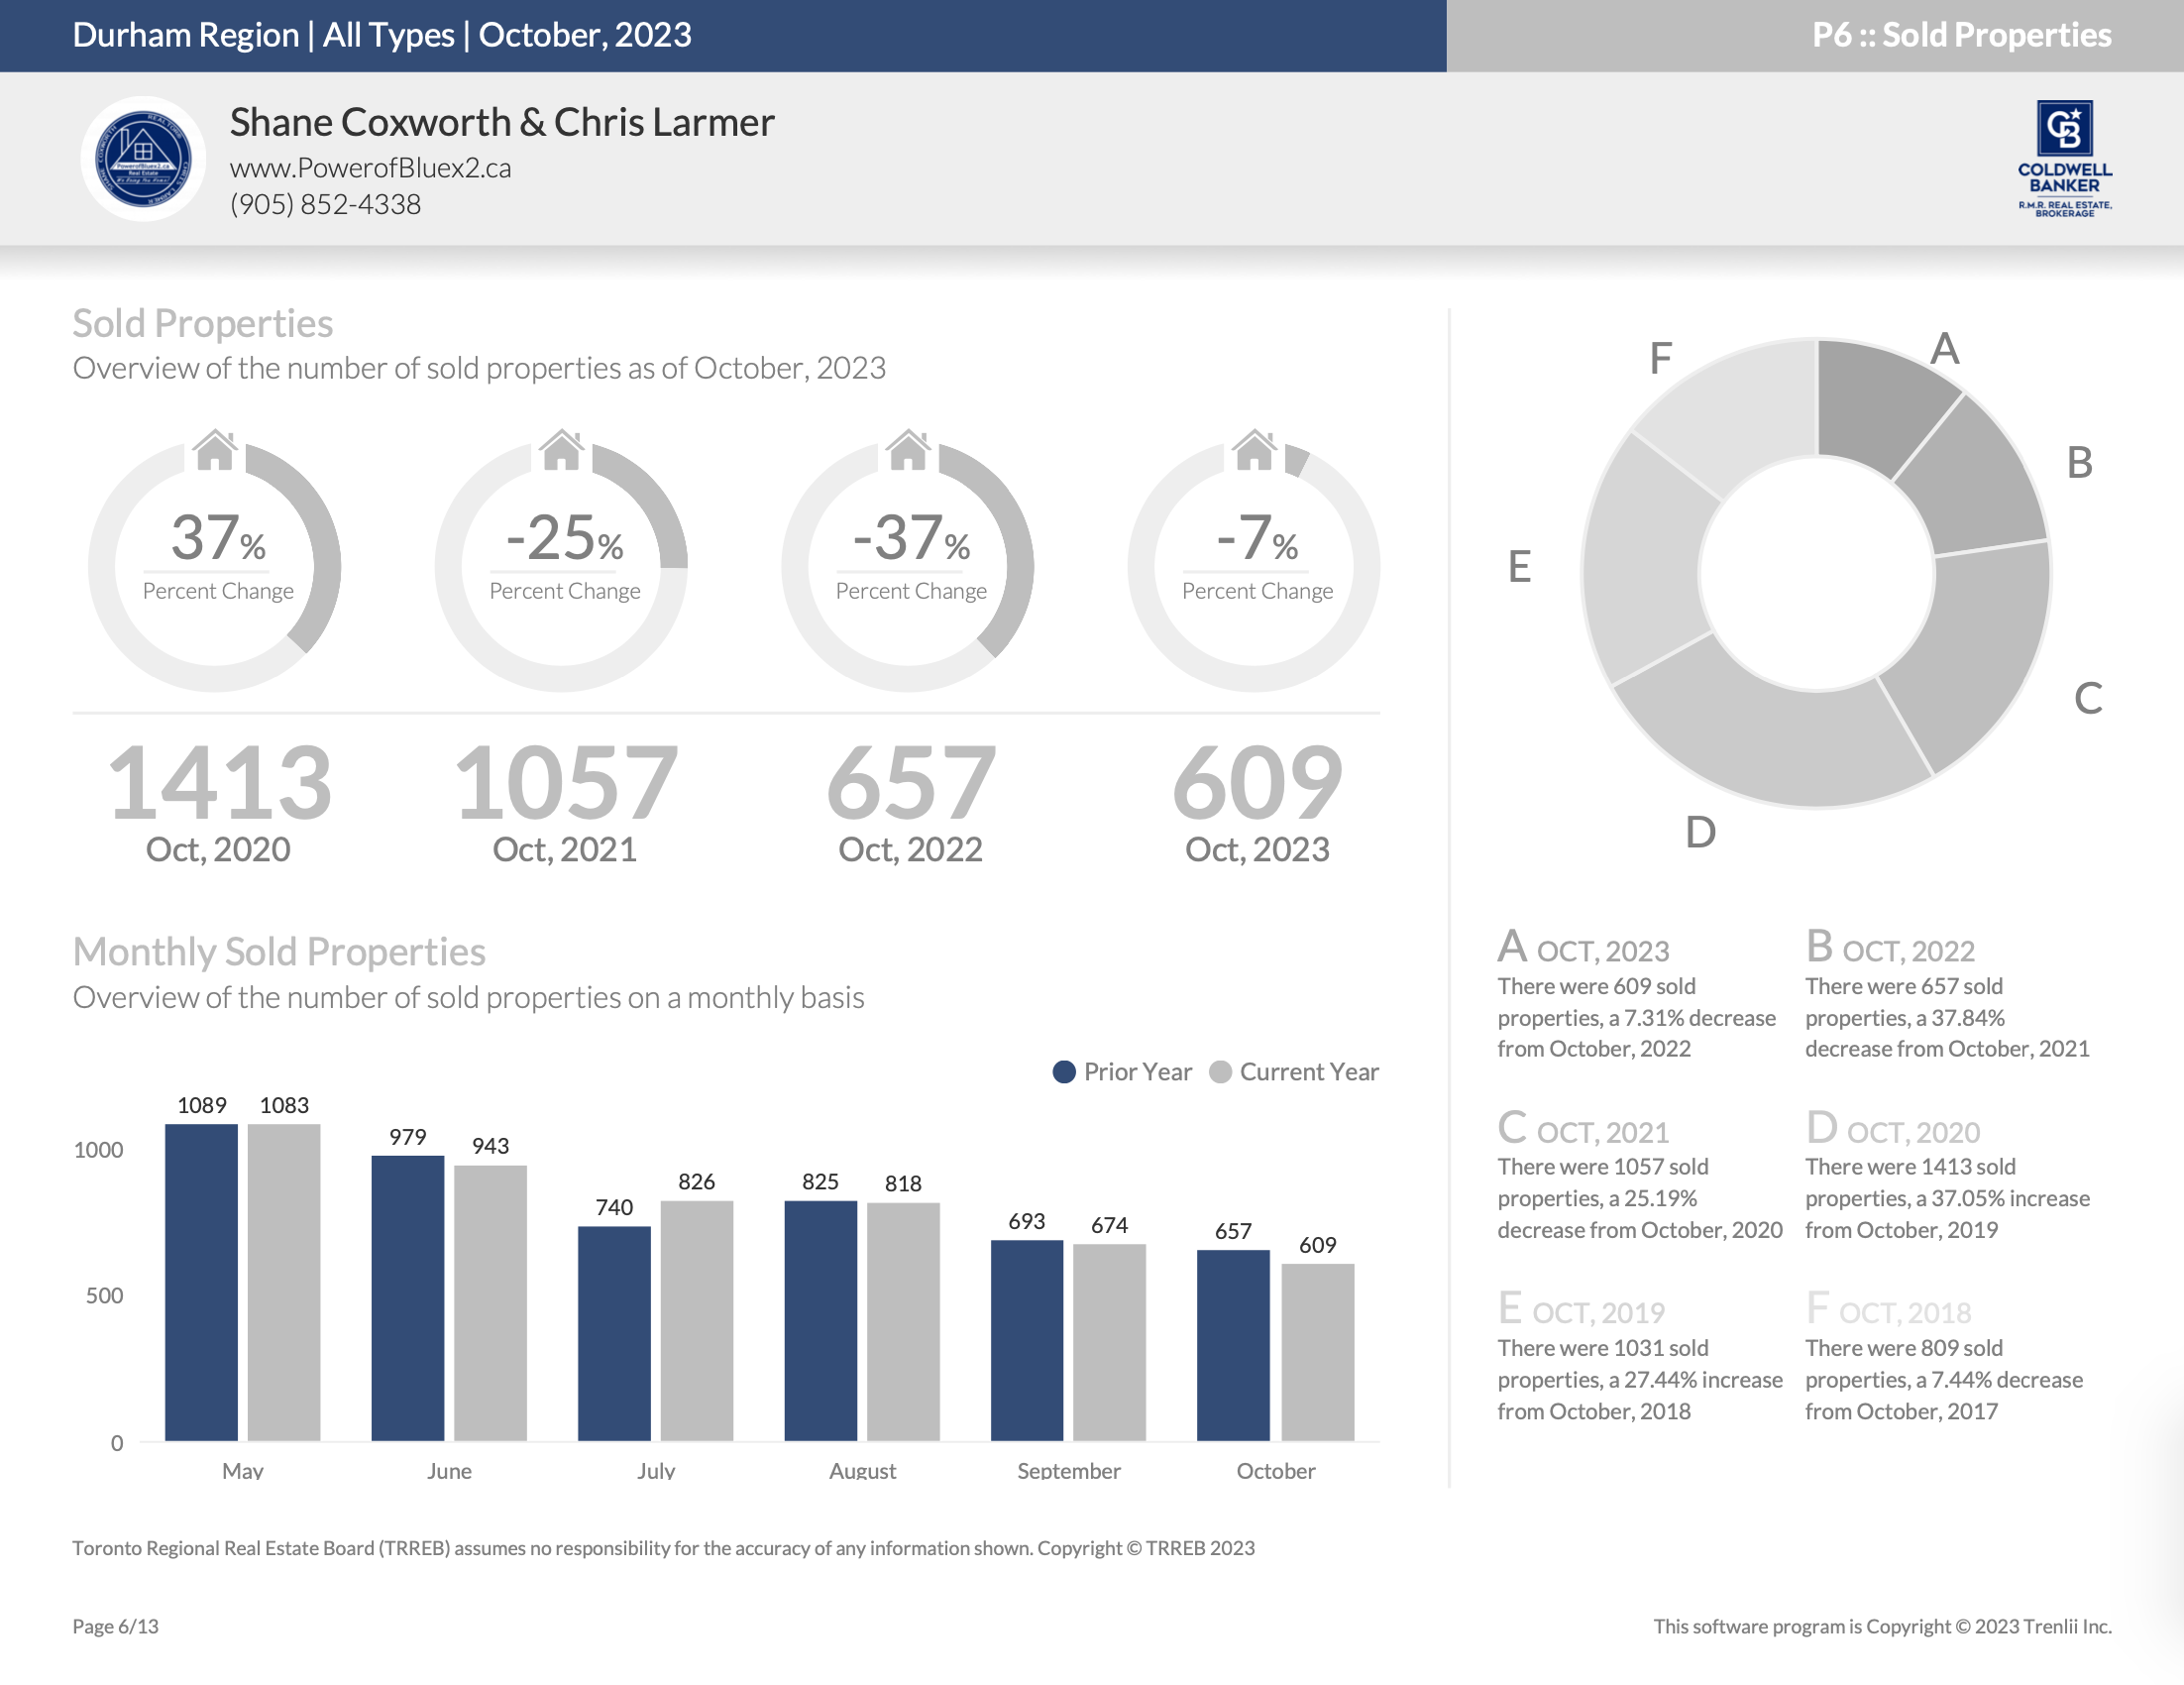
Number of Properties Sold – Year-to-Date

Average Sold Price – October 2023
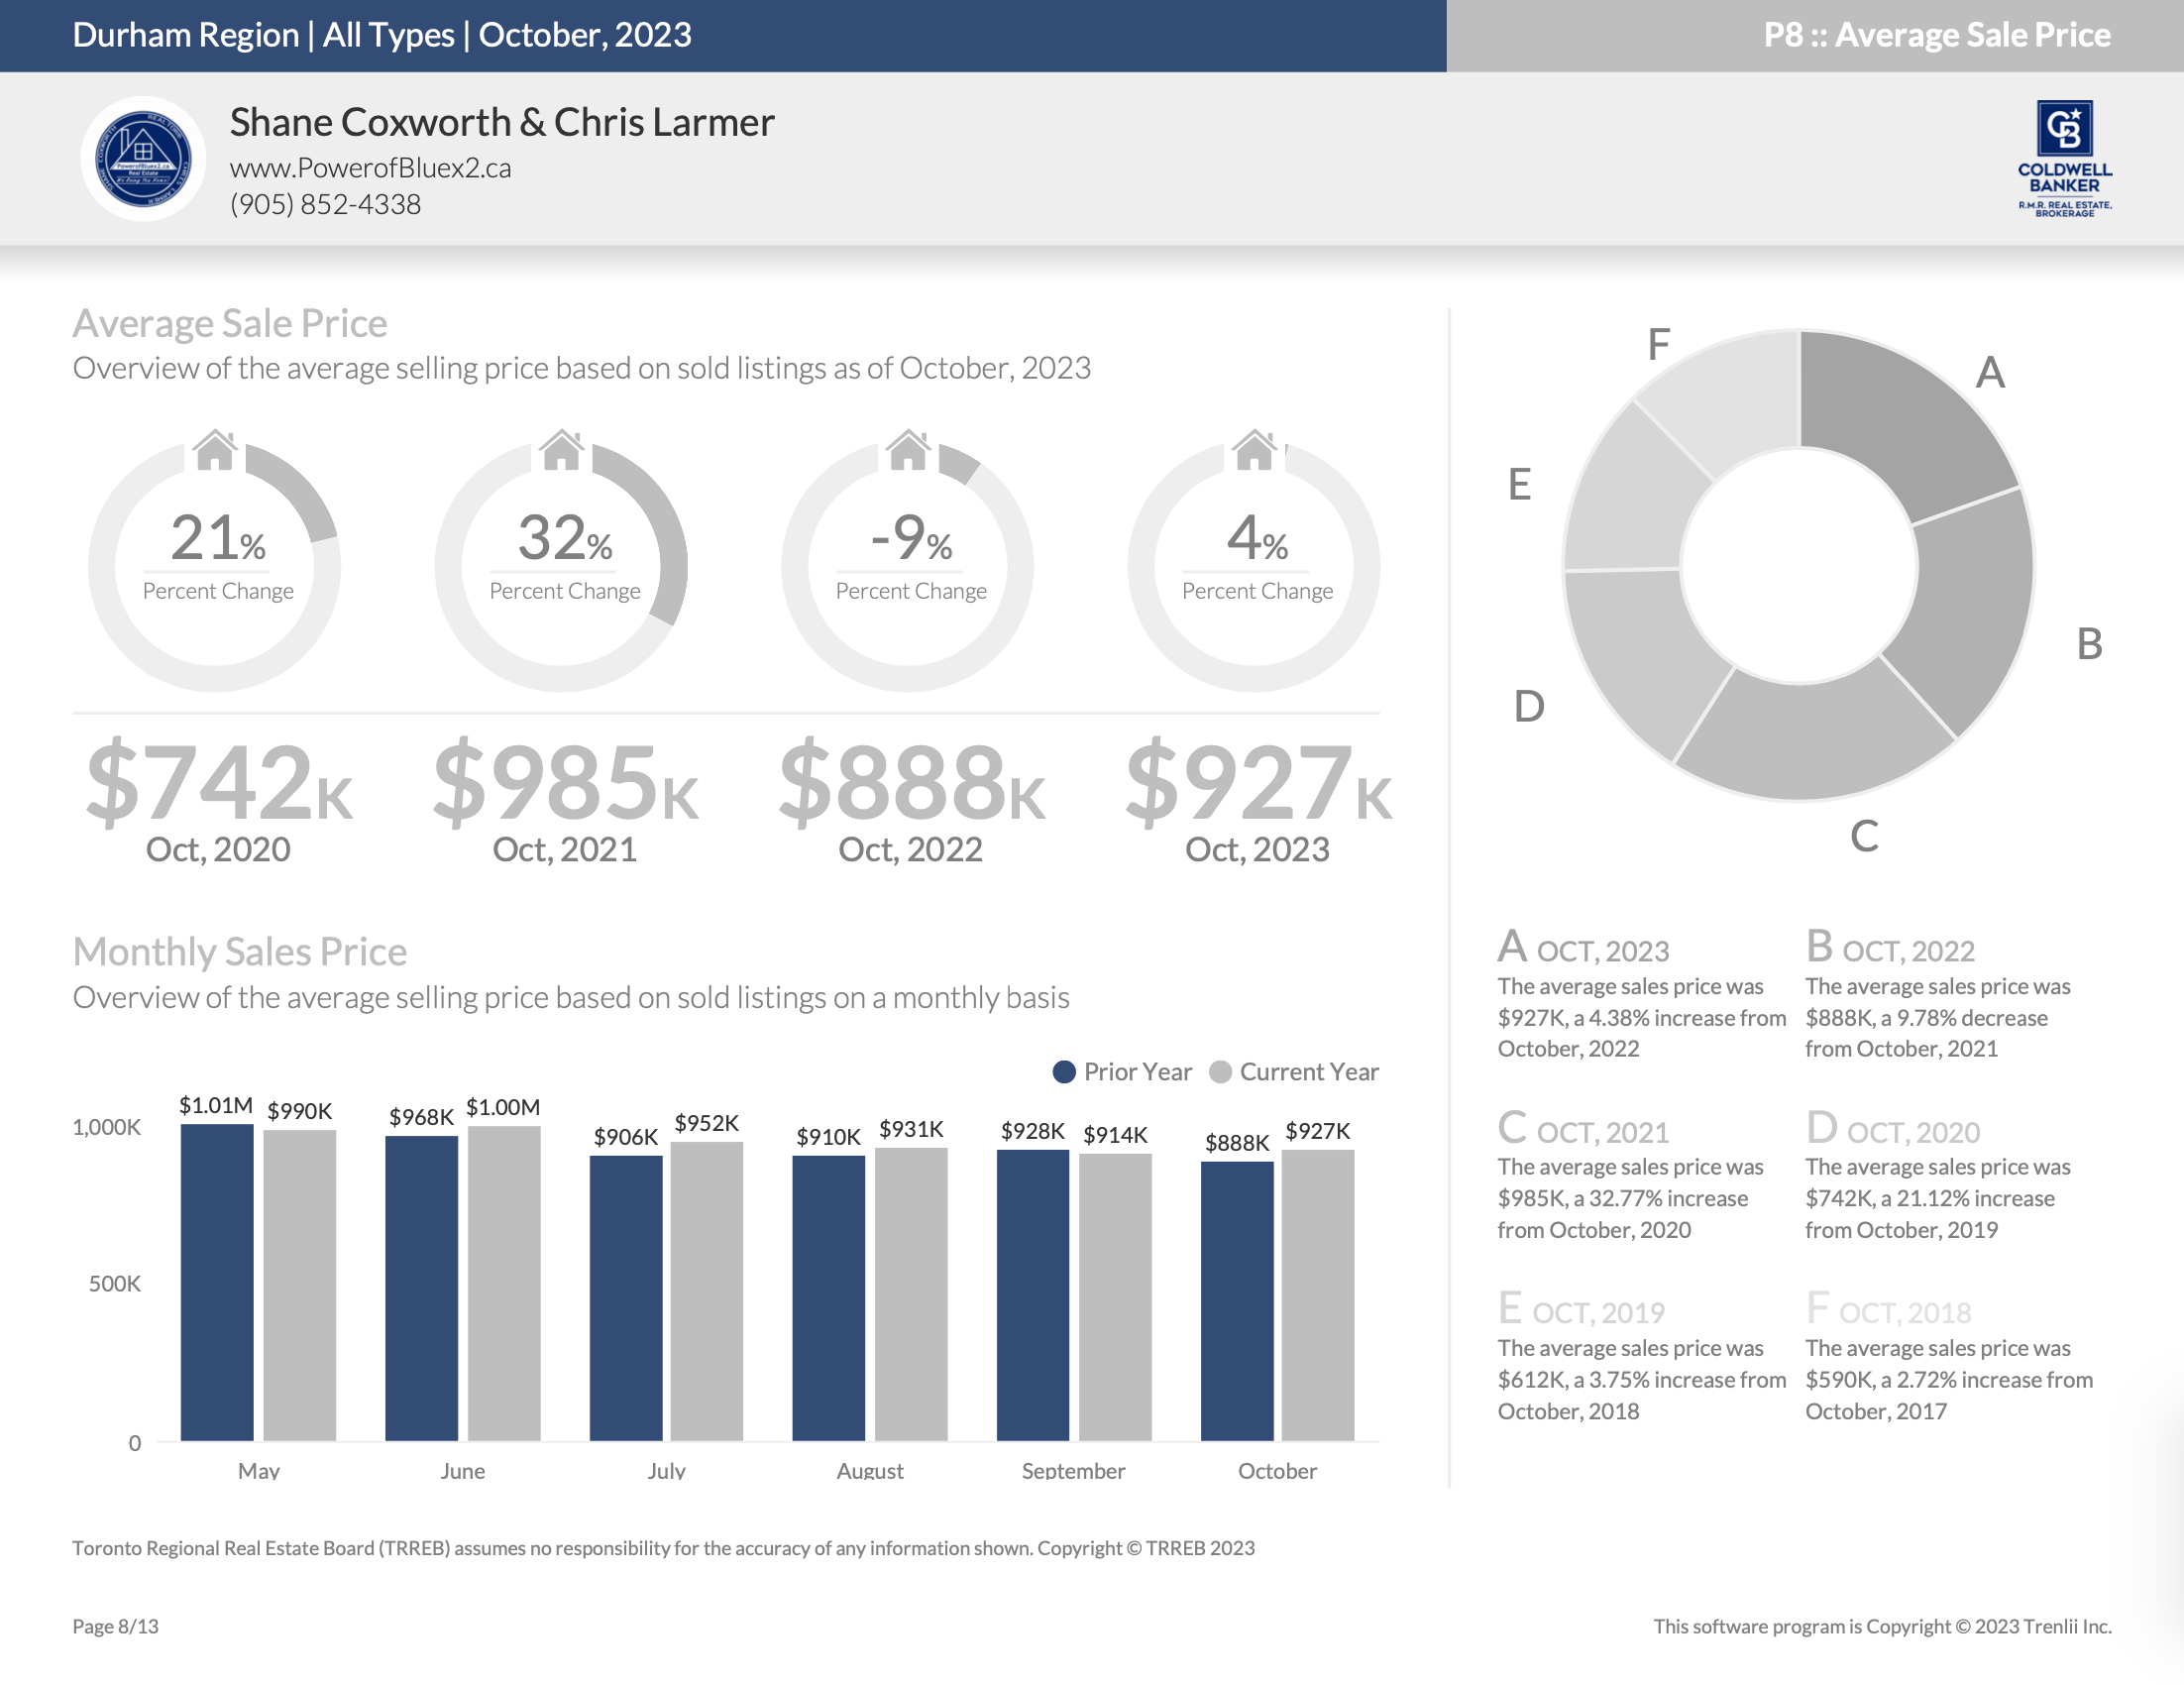
Average Sold Price – Year-to-Date

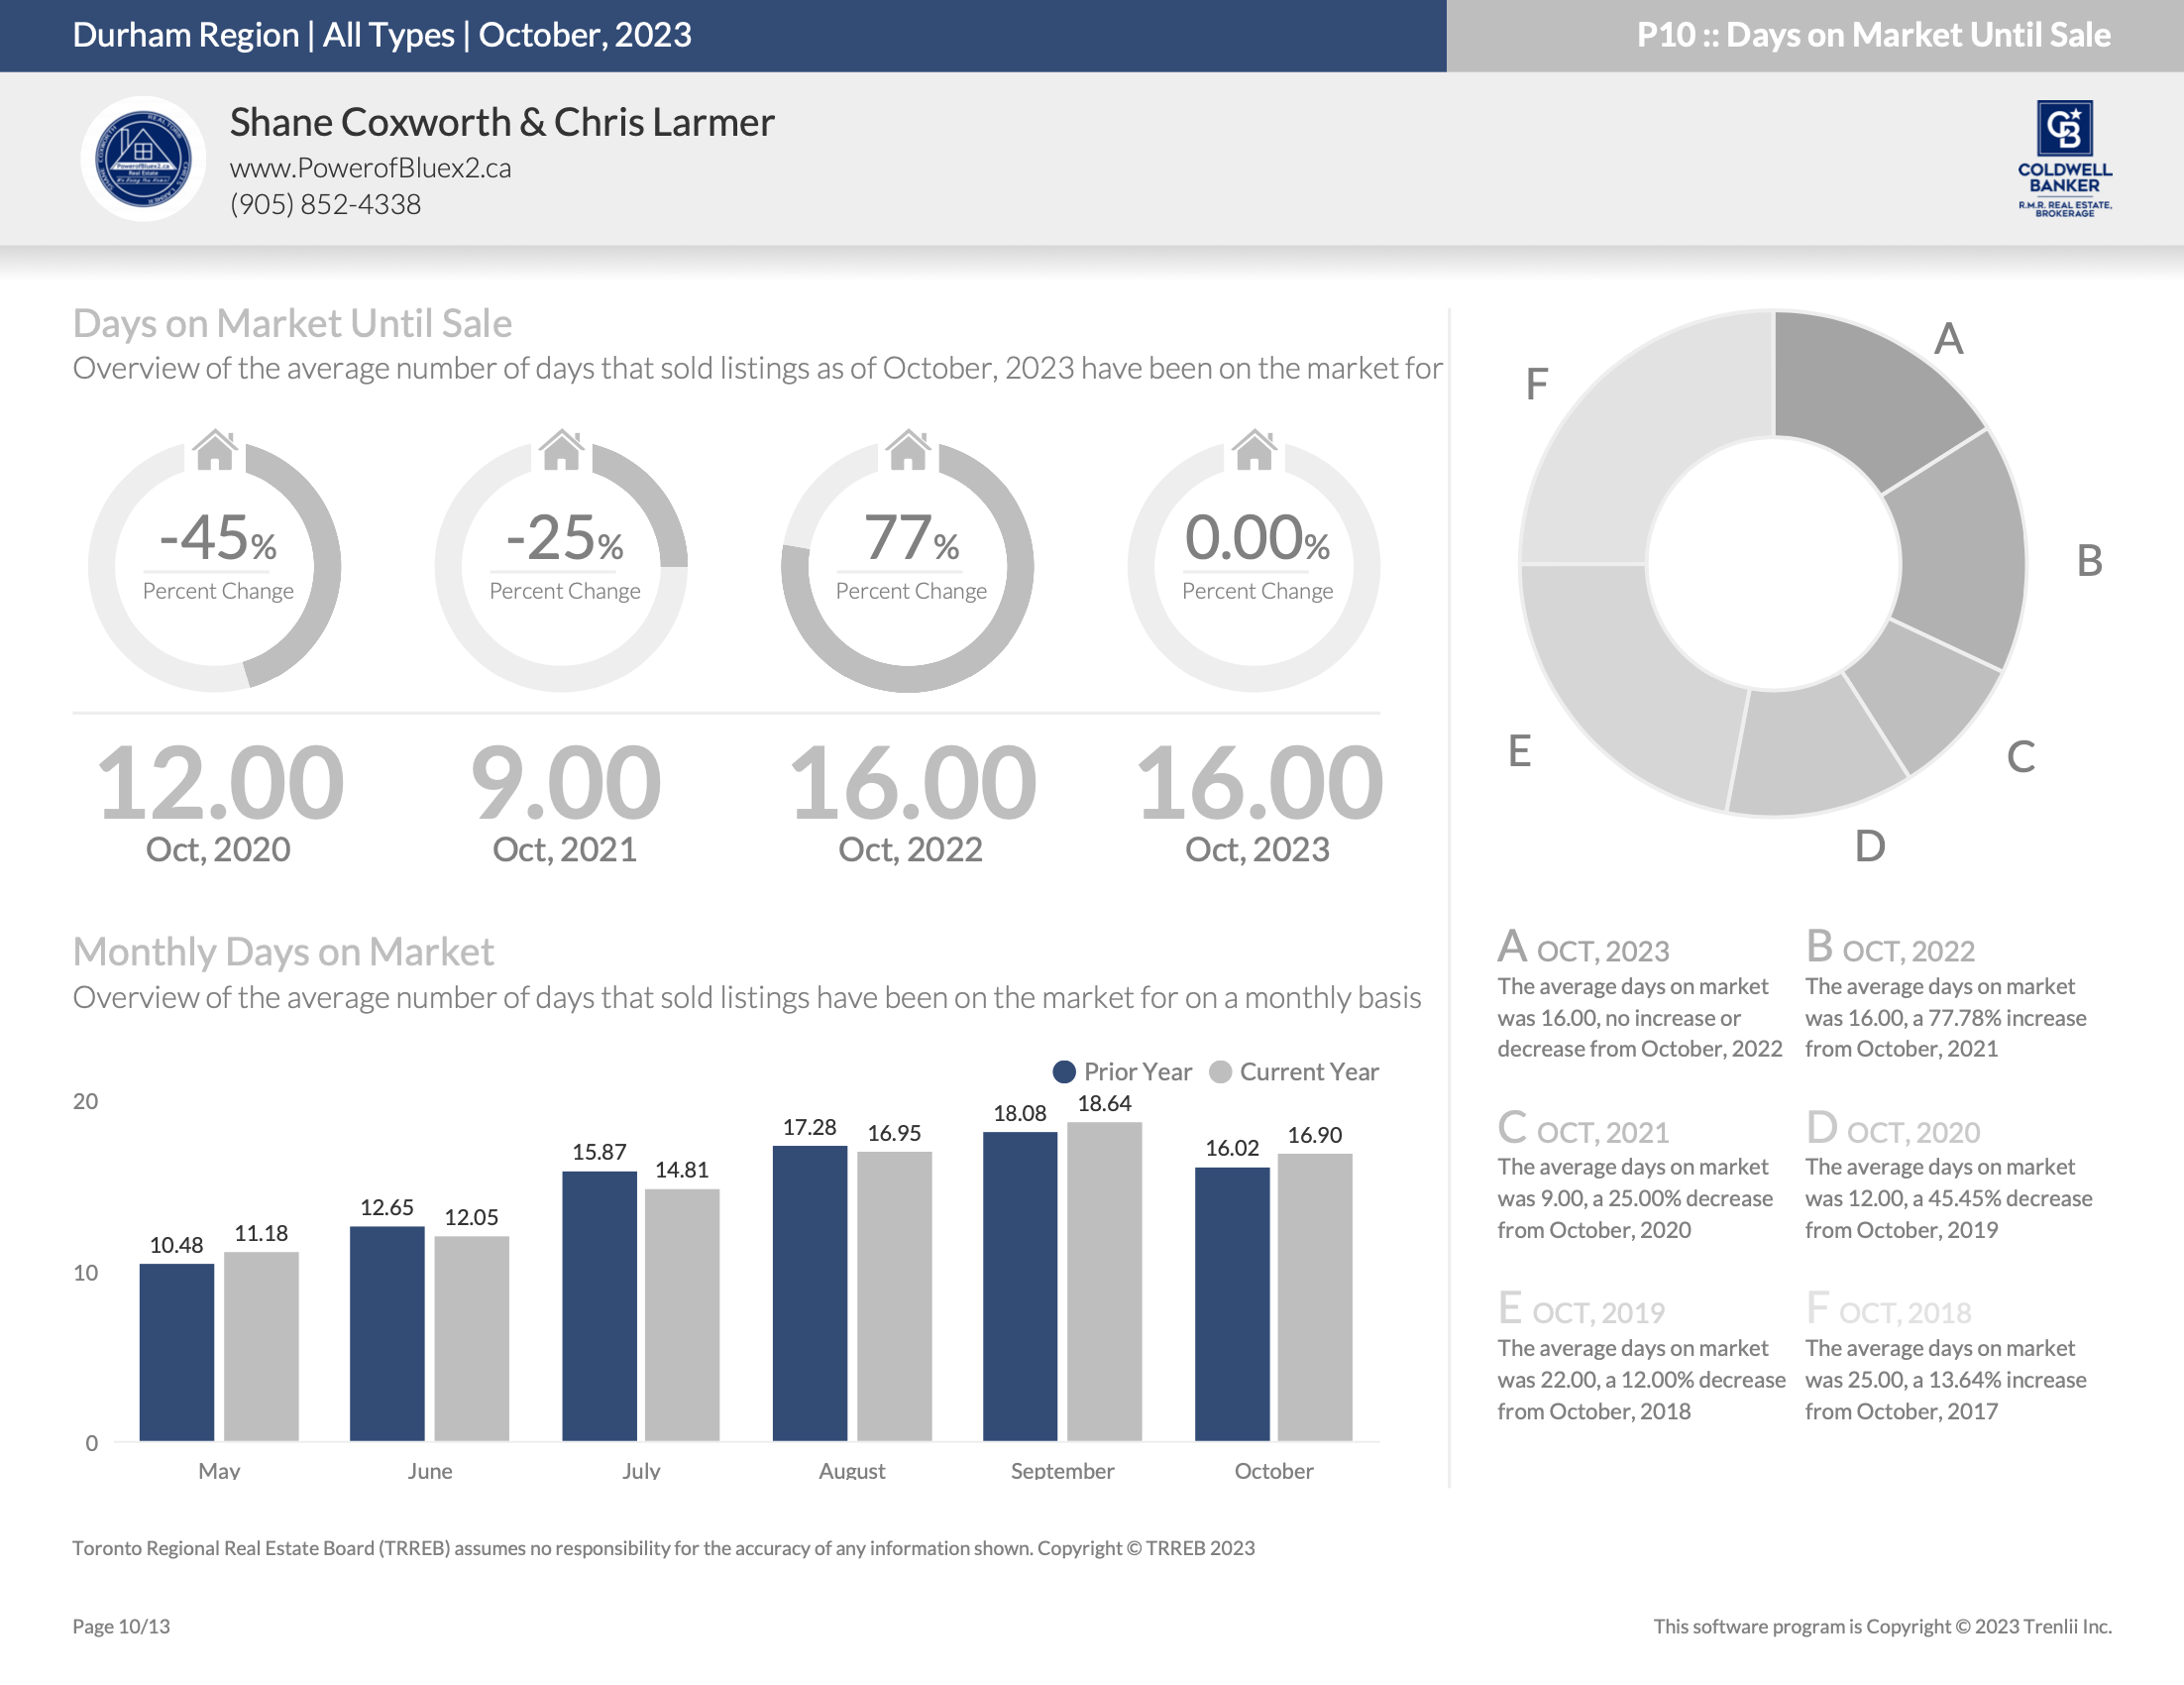
Days on Market – October 2023
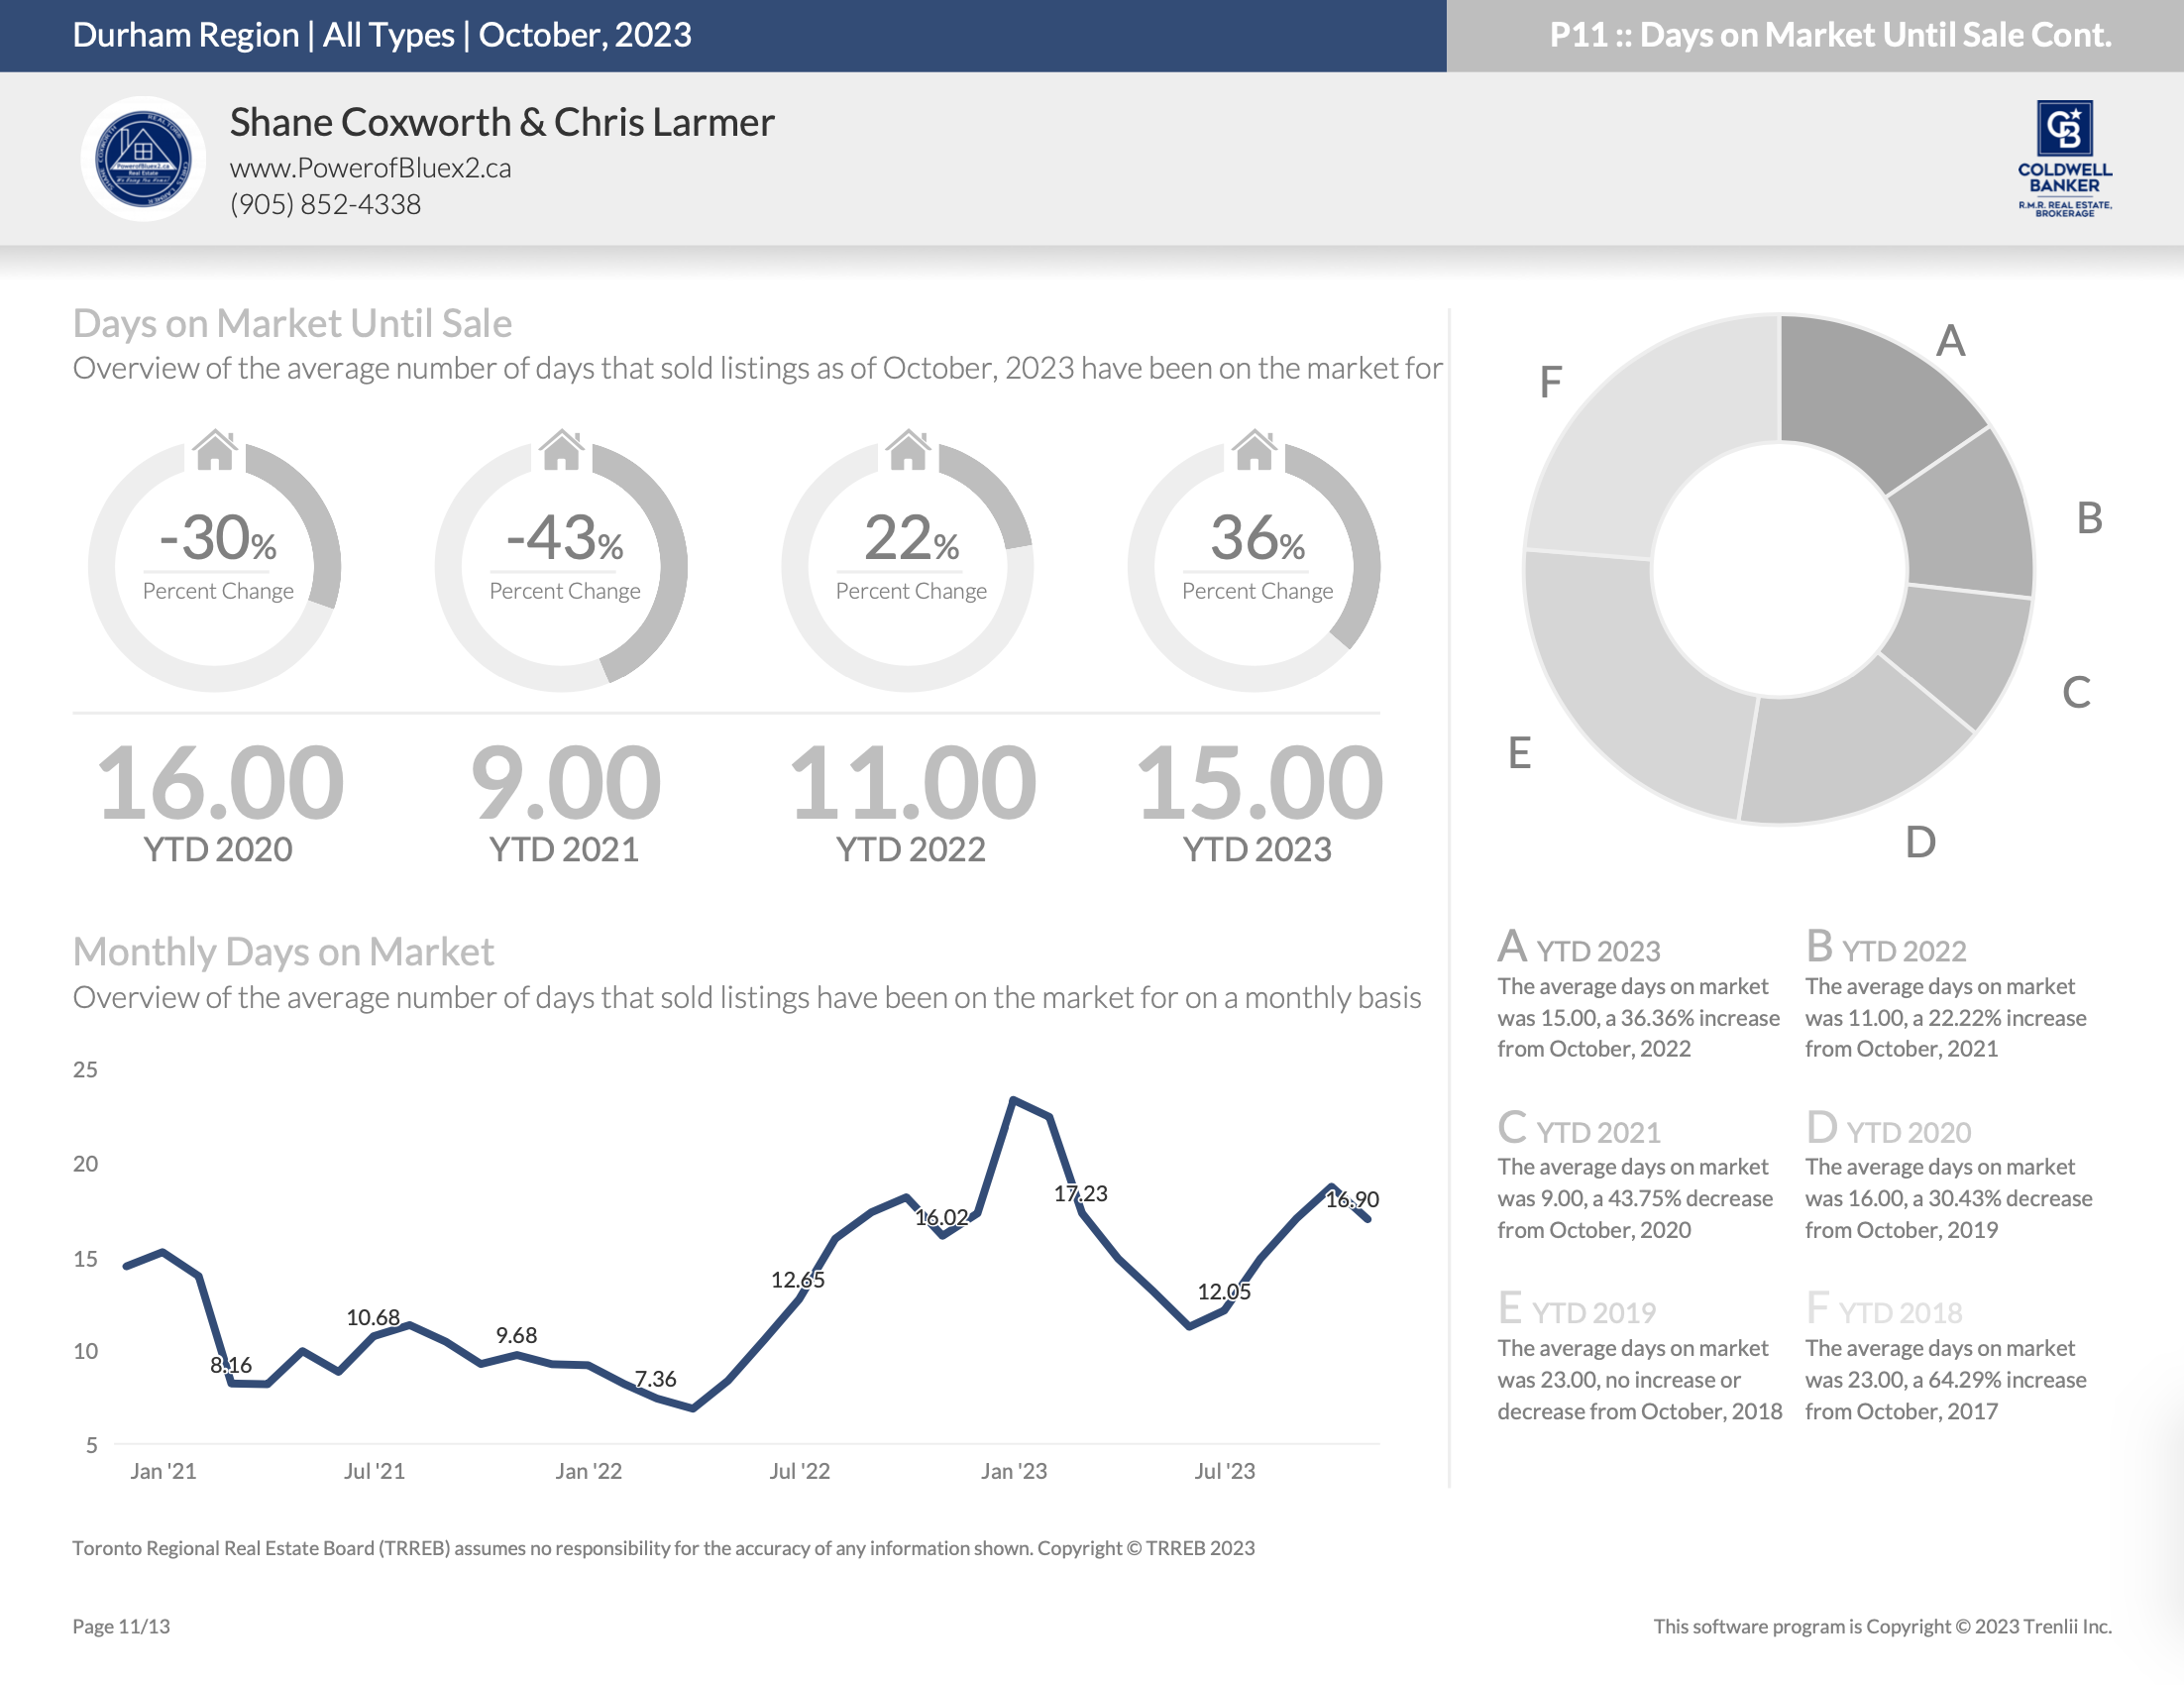
Days on Market – Year-to-Date
Average List Price to Sell Price Ratio – October 2023
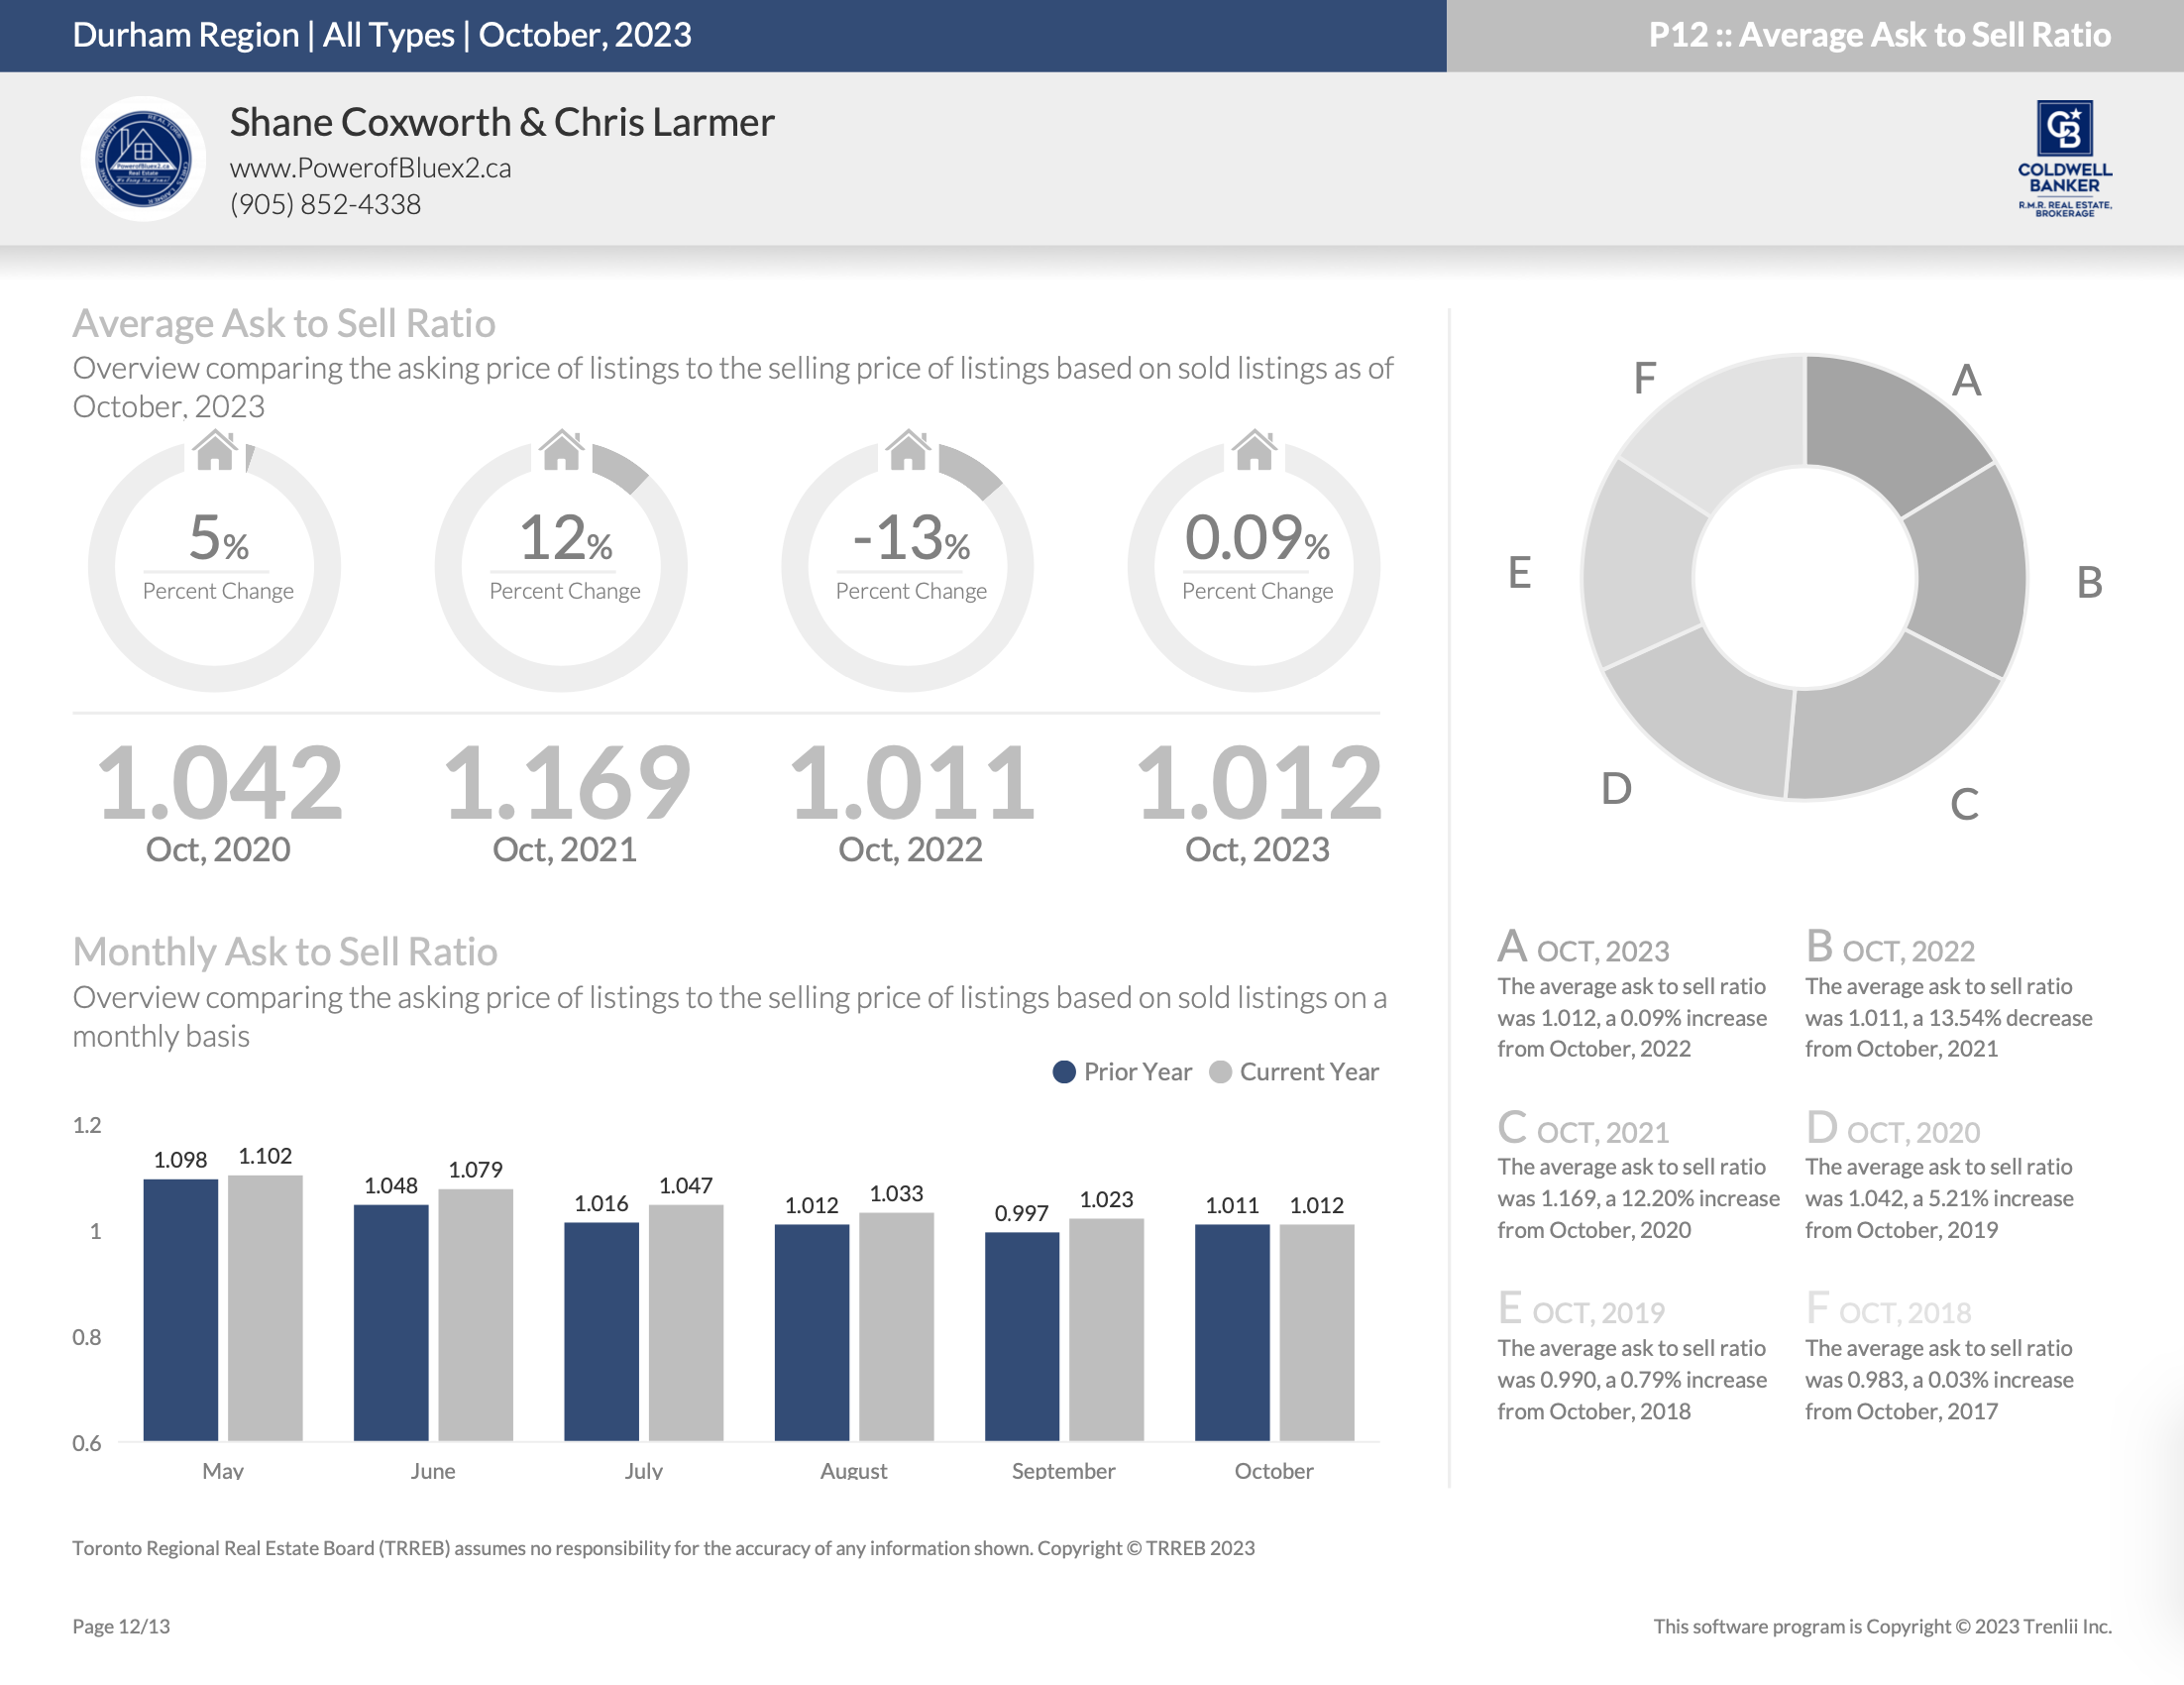
Average List Price to Sell Price Ratio – Year-to-Date

*Information is believed to be accurate at time of posting but is not guaranteed to be correct
Not intended as a solicitation if your property is already listed by another broker. Affiliated real estate agents are independent contractor sales associates, not employees. ©2021 Coldwell Banker. All Rights Reserved. Coldwell Banker and the Coldwell Banker logos are trademarks of Coldwell Banker Real Estate LLC. The Coldwell Banker® System is comprised of company owned offices which are owned by a subsidiary of Realogy Brokerage Group LLC and franchised offices which are independently owned and operated. The Coldwell Banker System fully supports the principles of the Fair Housing Act and the Equal Opportunity Act.
Click below for more reports


