

 Facebook
 X
 Pinterest
 Copy Link
Uxbridge Housing July 2026

Uxbridge Housing July 2026

Each office is independently owned and operated


Housing Market Report for July 2026
Here is the Township of Uxbridge Housing July 2026 report (all housing types), with reports from the Canadian Real Estate Association, and Toronto Regional Real Estate Board included.
This housing report for Durham Region includes the number of new listings, average list price, number of properties sold, average selling price, average days on market and average asking price to selling price ratio for all property types within the Region of Durham.
Scroll to the bottom for links to take you to the housing market reports for Durham Region, Scugog and Brock.


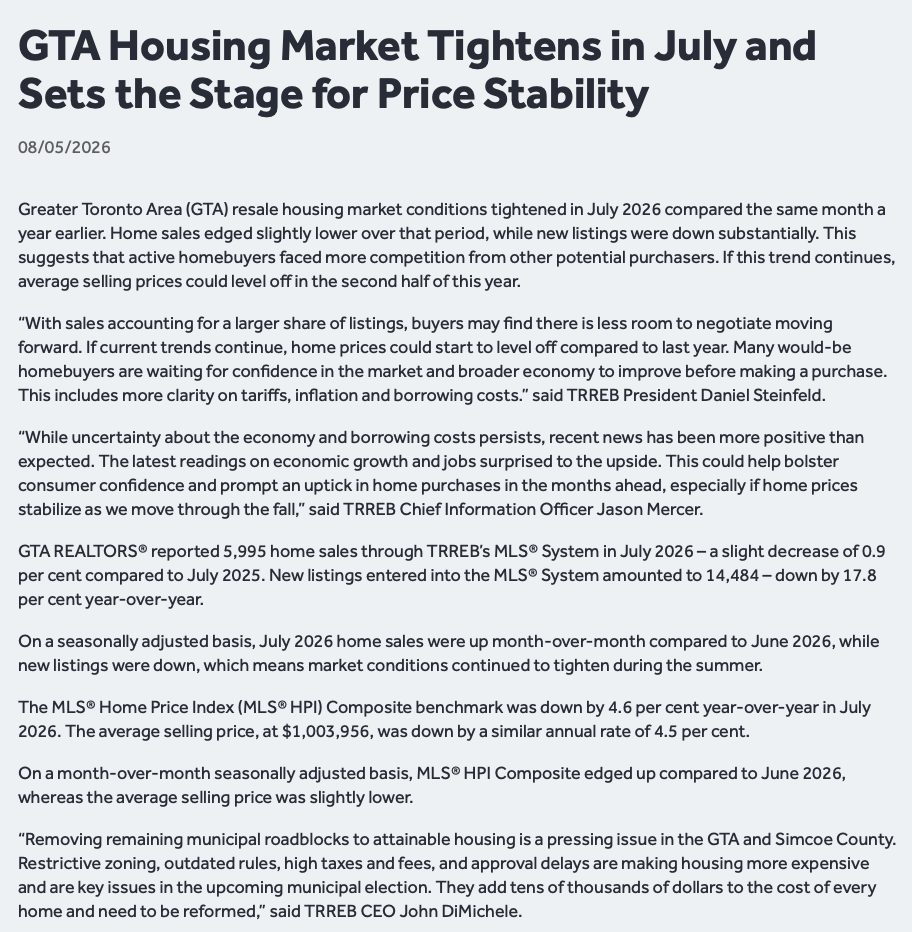
From Toronto Regional Real Estate Board
Please note: The PropTx MLS® System, of which TRREB is a part, has added a number of new client boards over the last year. Many of these boards’ Members trade within the Greater Toronto Area and broader Greater Golden Horseshoe regions. As a result, historic data have been updated to reflect the addition of these boards’ listings and transactions. This means historic data have changed relative to previously published static reports. To view updated historic data, click here.
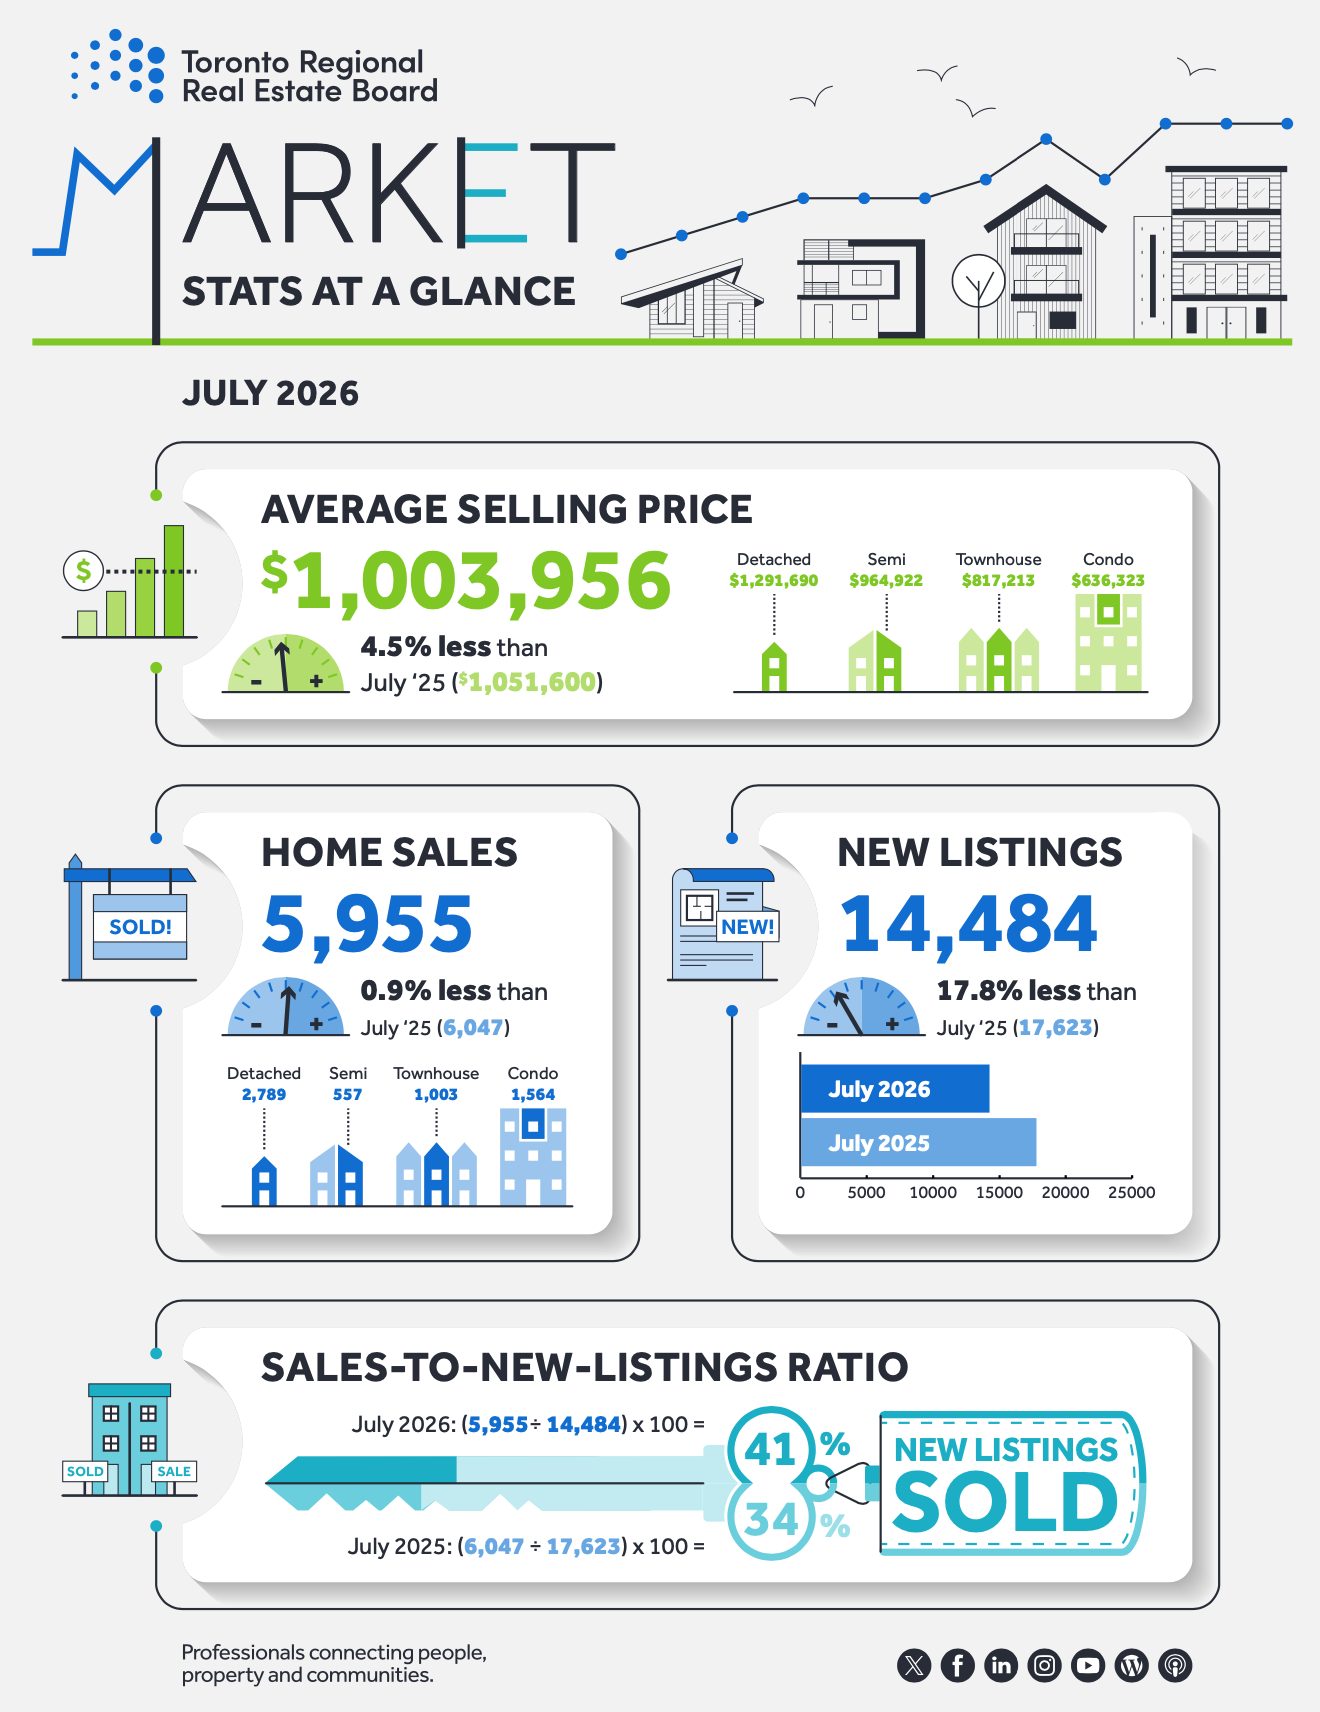
Toronto Regional Real Estate Board – Market Stats At A Glance – July 2026
Read the Toronto Regional Real Estate Board Market Watch Report

Uxbridge Township Real Estate Market Analysis – July 2026
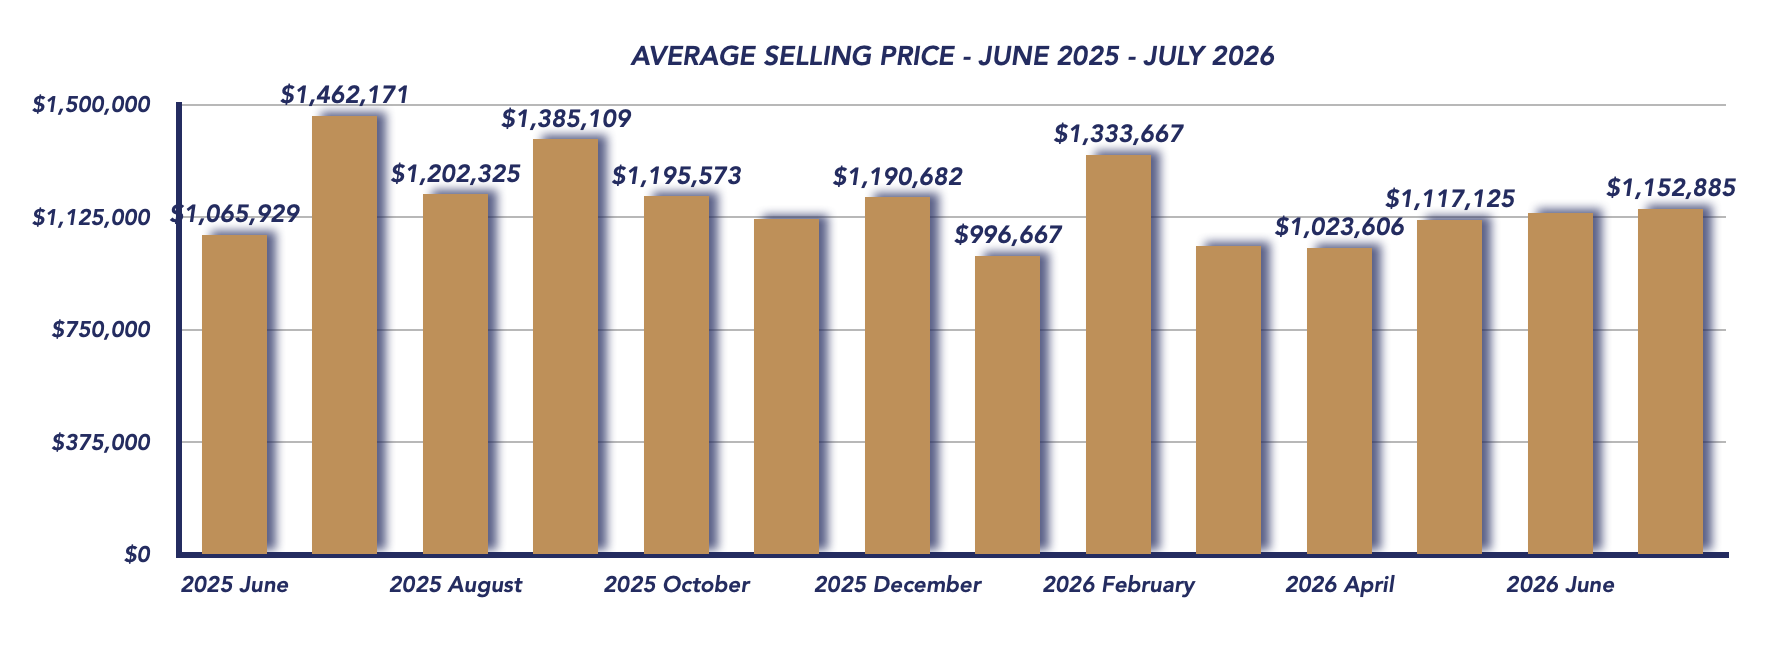
The Uxbridge real estate market remained in balanced territory in July 2026, although sales activity slowed from June and inventory levels increased. The average sale price reached $1,152,885, up a modest 1.1% from June’s $1,140,111, but down 21.2% compared to July 2025’s $1,462,171.
The large year-over-year difference in average price is worth putting into perspective. Uxbridge is a relatively small market, so the average sale price can fluctuate considerably depending on the types and price ranges of properties sold in any given month. July 2025 had an unusually strong concentration of higher-priced transactions, which pushed that month’s average to $1,462,171. As a result, the 21.2% year-over-year decline should not necessarily be interpreted as an equivalent drop in individual property values.
July 2026
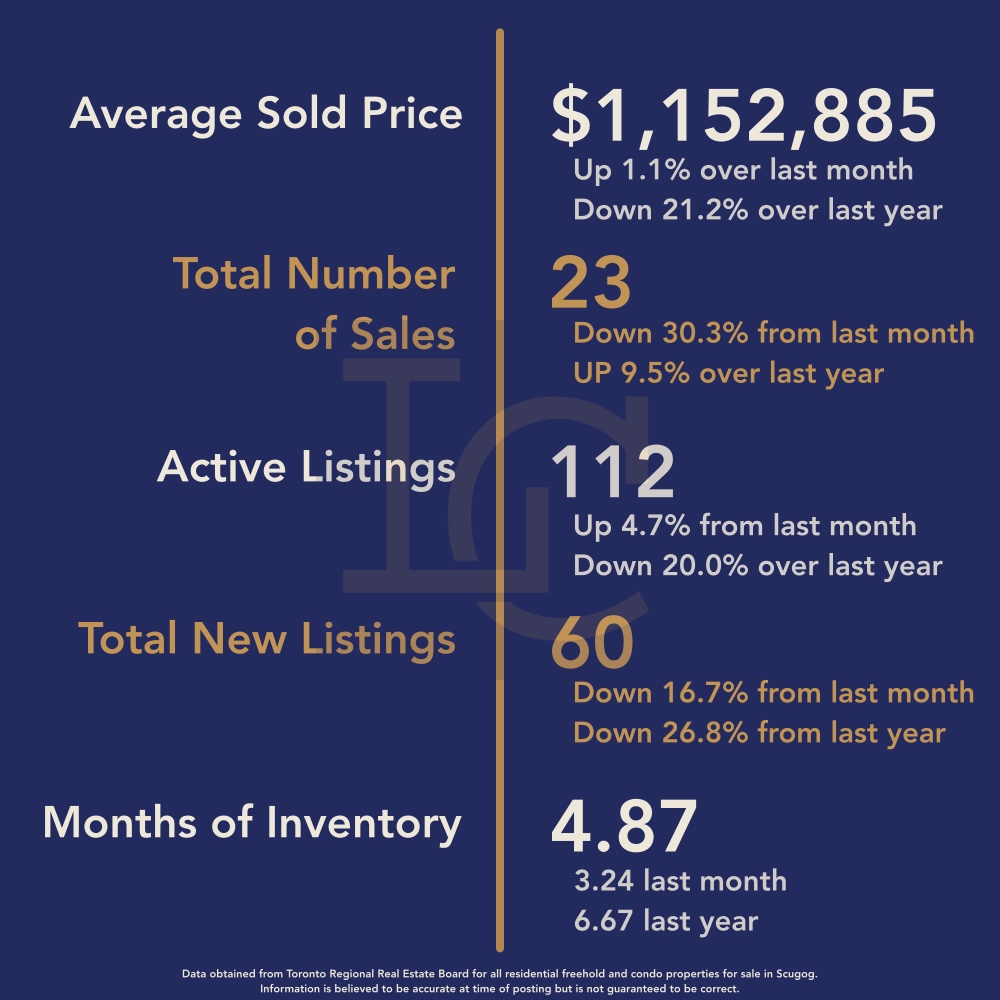
June 2026
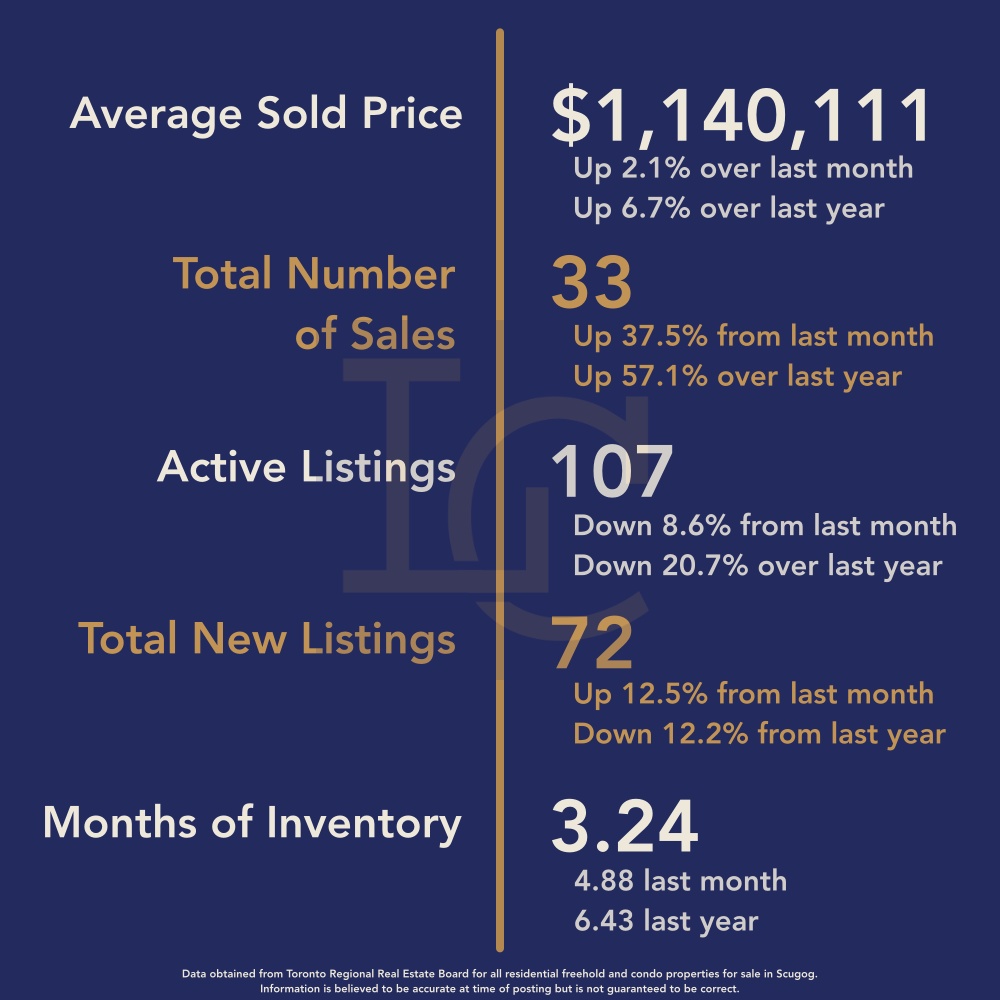
Average Sales Price
The average selling price in July was $1,152,885, compared with $1,140,111 in June, representing a 1.1% month-over-month increase.
Compared with July 2025’s average of $1,462,171, however, the average price was down 21.2%. Last July’s results were heavily influenced by higher-end sales, illustrating why it is important to consider the mix of properties sold when comparing monthly averages in Uxbridge.
The modest increase from June suggests that pricing remained relatively stable heading into the summer market.
Sales Activity
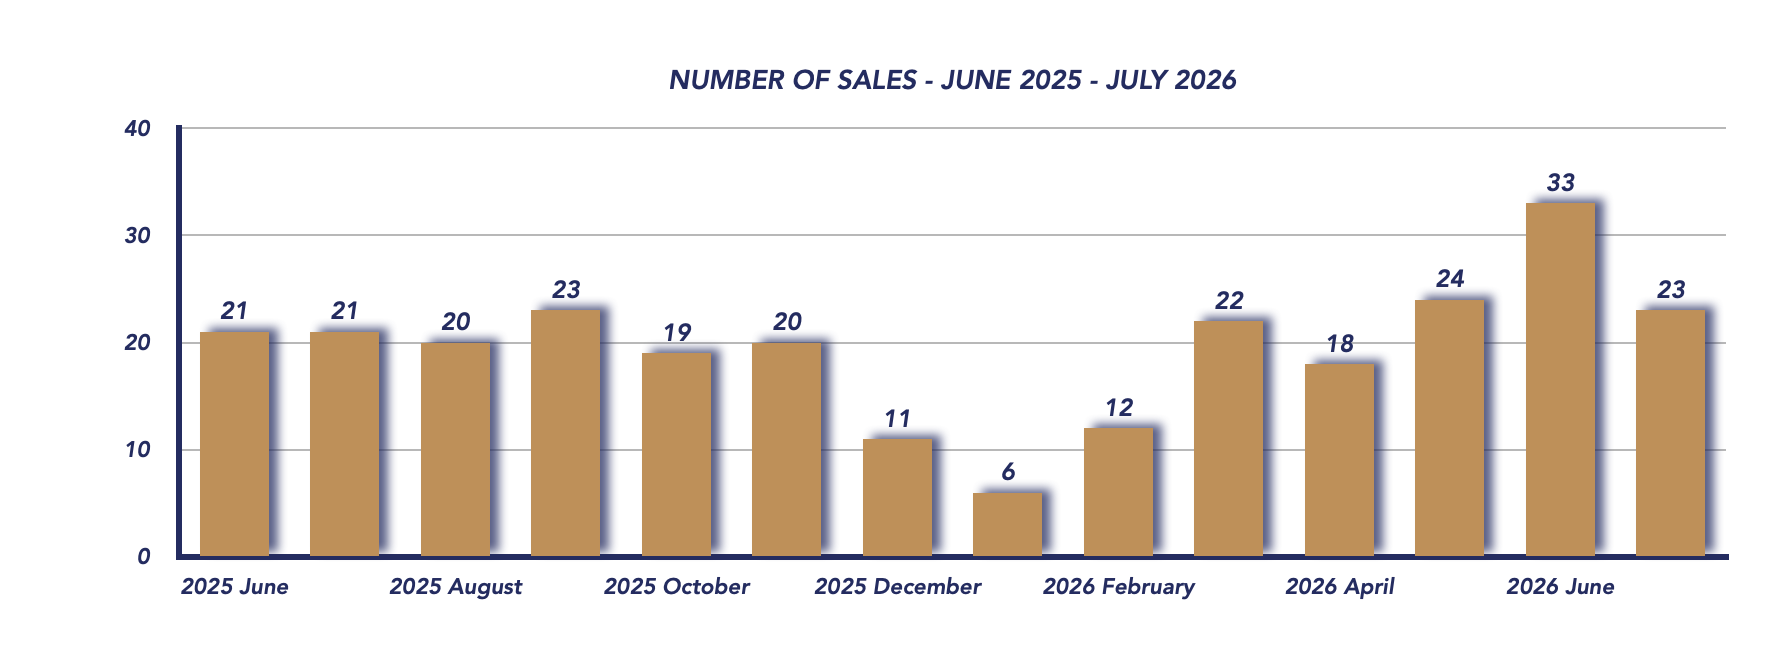
There were 23 properties sold in July, down from the strong 33 sales recorded in June. However, sales were actually higher than the 21 transactions recorded in July 2025.
June was an especially active month, so some month-over-month cooling isn’t unexpected. More importantly, July still managed to outperform the same month last year in terms of the number of properties sold.
This suggests that while buyer activity slowed from June’s pace, demand has not disappeared.
Sale-to-List Price Ratio
The sale-to-list price ratio increased to 98%, up from 97% in June and matching the 98% recorded in July 2025.
This is a positive indicator for sellers. Despite more inventory and fewer sales than June, properties that successfully sold were achieving prices relatively close to their asking price.
In a balanced market, accurate pricing remains particularly important. Buyers have choices and negotiating room, but homes positioned appropriately for their condition, location and competition can still attract strong offers.
New Listings
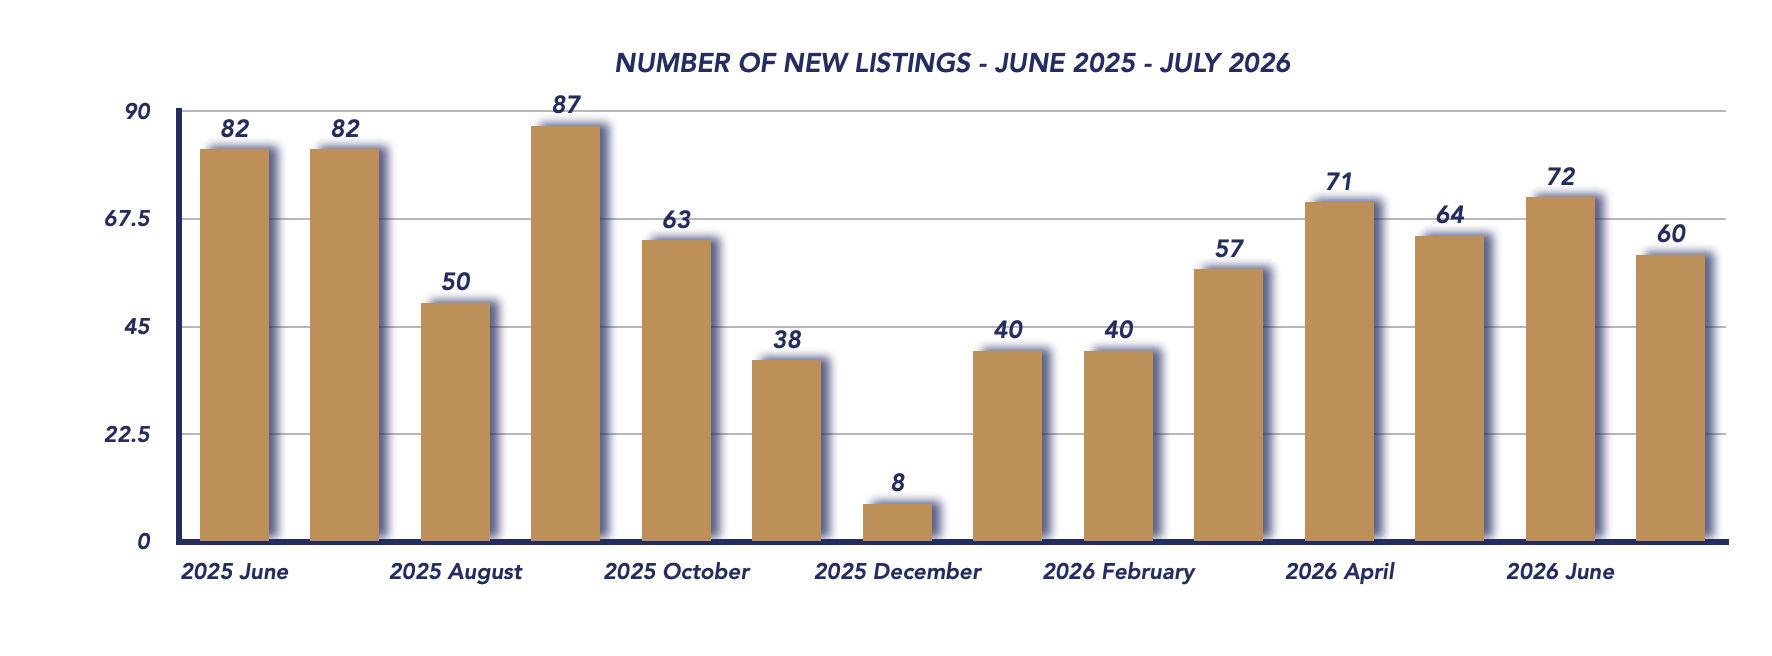
There were 60 new listings in July, down from 72 in June and considerably below the 82 new listings recorded in July 2025.
The slowdown in new listings is not unusual as the market moves deeper into summer. Some sellers choose to wait until the fall market, while others may have already listed during the busier spring months.
Fewer new listings could help prevent inventory from building too quickly if buyer activity remains steady through the remainder of the summer.
Days on Market
Properties spent an average of 50 days on the market in July, compared with 47 days in June. Although homes took slightly longer to sell month-over-month, this was a significant improvement from the 65 days recorded in July 2025.
The increase of only three days from June suggests the market remains relatively stable. Buyers have enough inventory available to take their time, but attractive and appropriately priced properties are still finding purchasers.
Months of Inventory
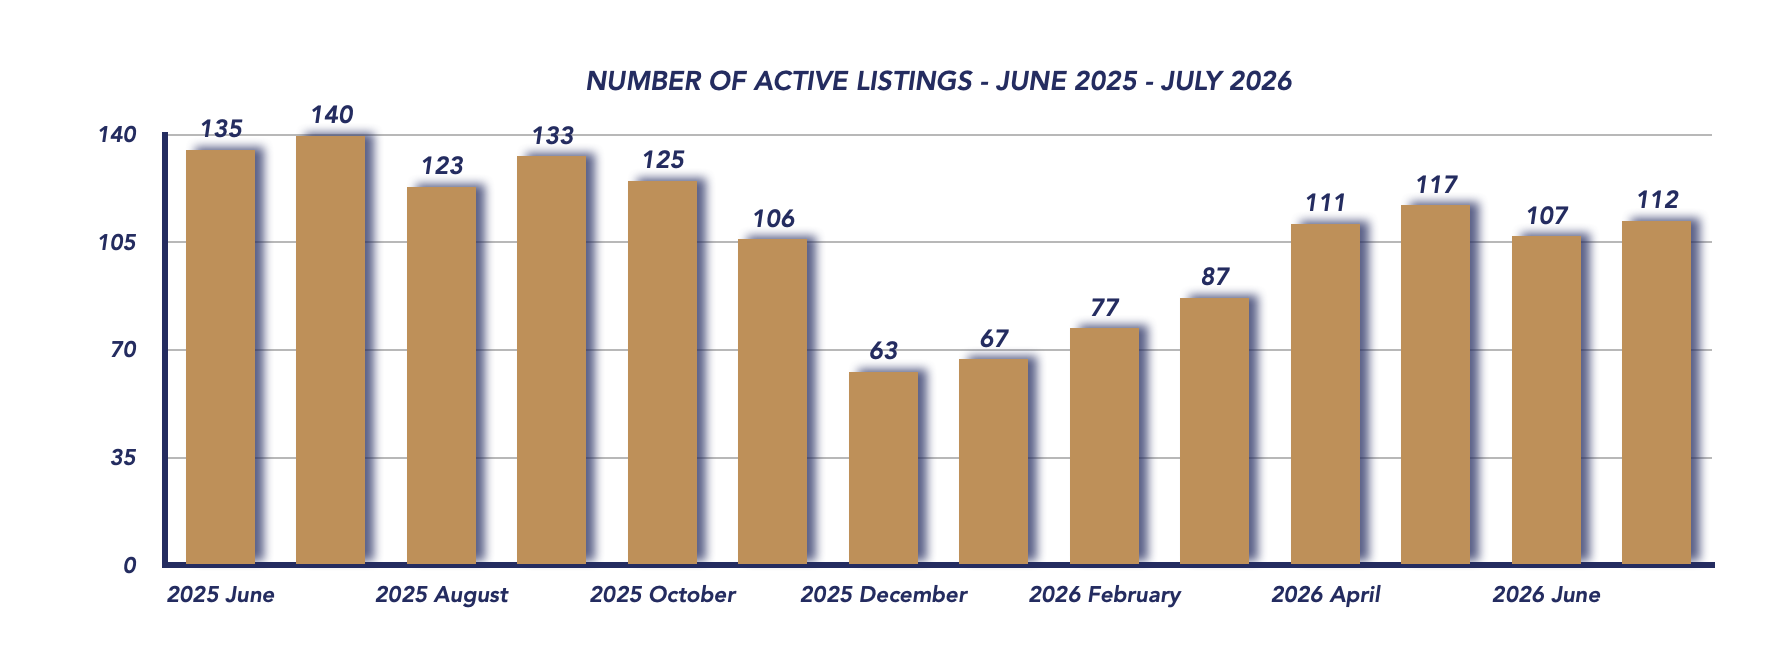
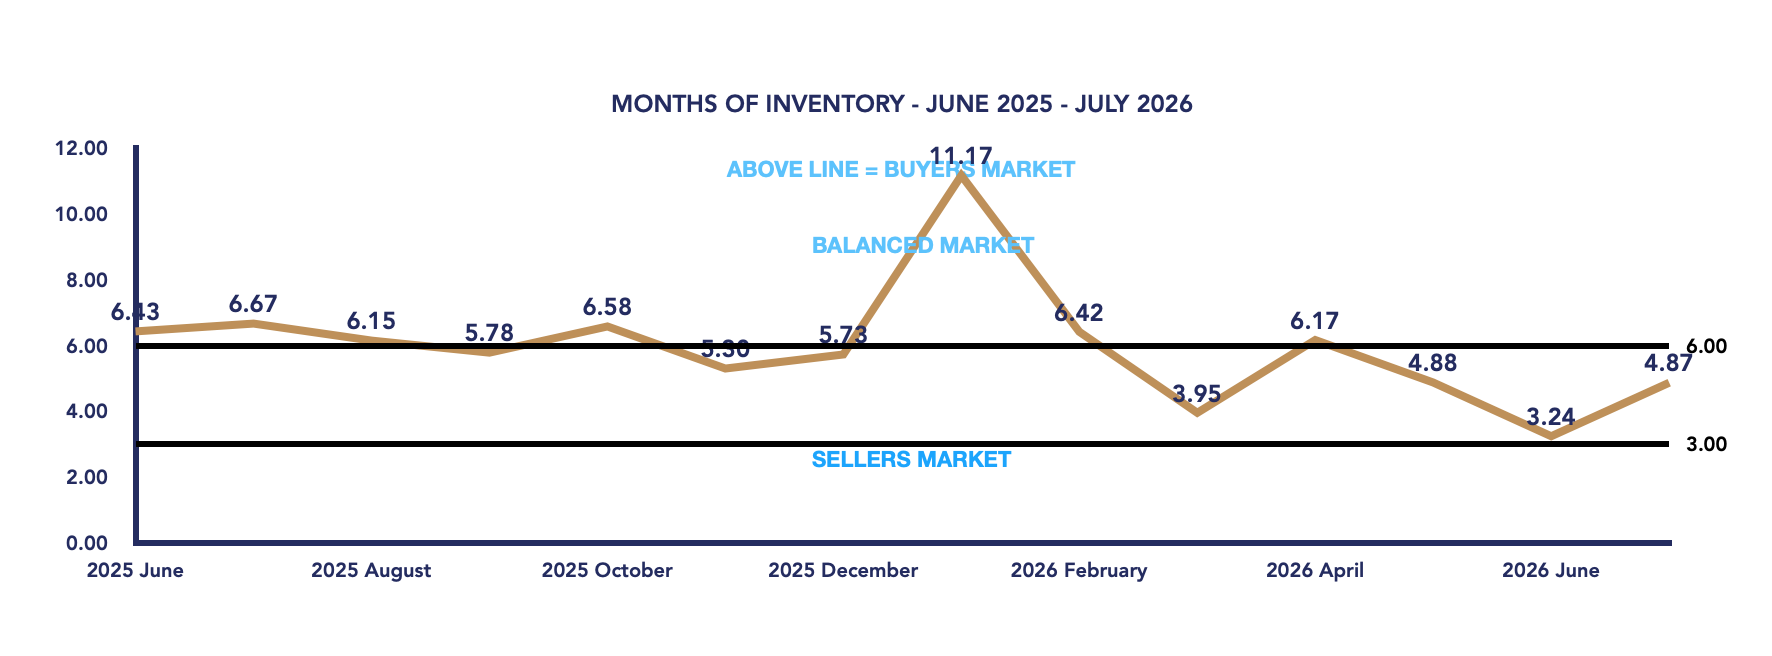
Months of inventory increased to 4.87, up from 3.24 in June. Despite this increase, Uxbridge remains within balanced market territory.
There has also been a significant improvement compared with July 2025, when months of inventory stood at 6.67, placing the market in buyer-favourable territory.
The month-over-month increase primarily reflects the slowdown from June’s exceptionally strong sales activity. At 4.87 months of inventory, supply and demand remain reasonably well matched, giving neither buyers nor sellers an overwhelming advantage.
Conclusion
July 2026 presented a more moderate but balanced Uxbridge housing market following a particularly active June. The average sale price increased slightly month-over-month, the sale-to-list ratio improved to 98%, and sales remained ahead of July last year.
At the same time, the drop from 33 sales in June to 23 in July pushed months of inventory higher, giving buyers more breathing room and selection. However, conditions remain considerably more balanced than they were at this time last year.
The 21.2% year-over-year decline in average price requires some context, as July 2025’s average was elevated by a concentration of higher-priced sales. In a smaller and diverse market such as Uxbridge, changes in the types of properties sold can have a substantial effect on monthly averages.
As we move through the remainder of summer, the key indicators to watch will be sales activity, inventory levels and the number of new properties entering the market. For now, Uxbridge remains in a balanced environment where realistic pricing is important for sellers and buyers continue to have a reasonable amount of choice.
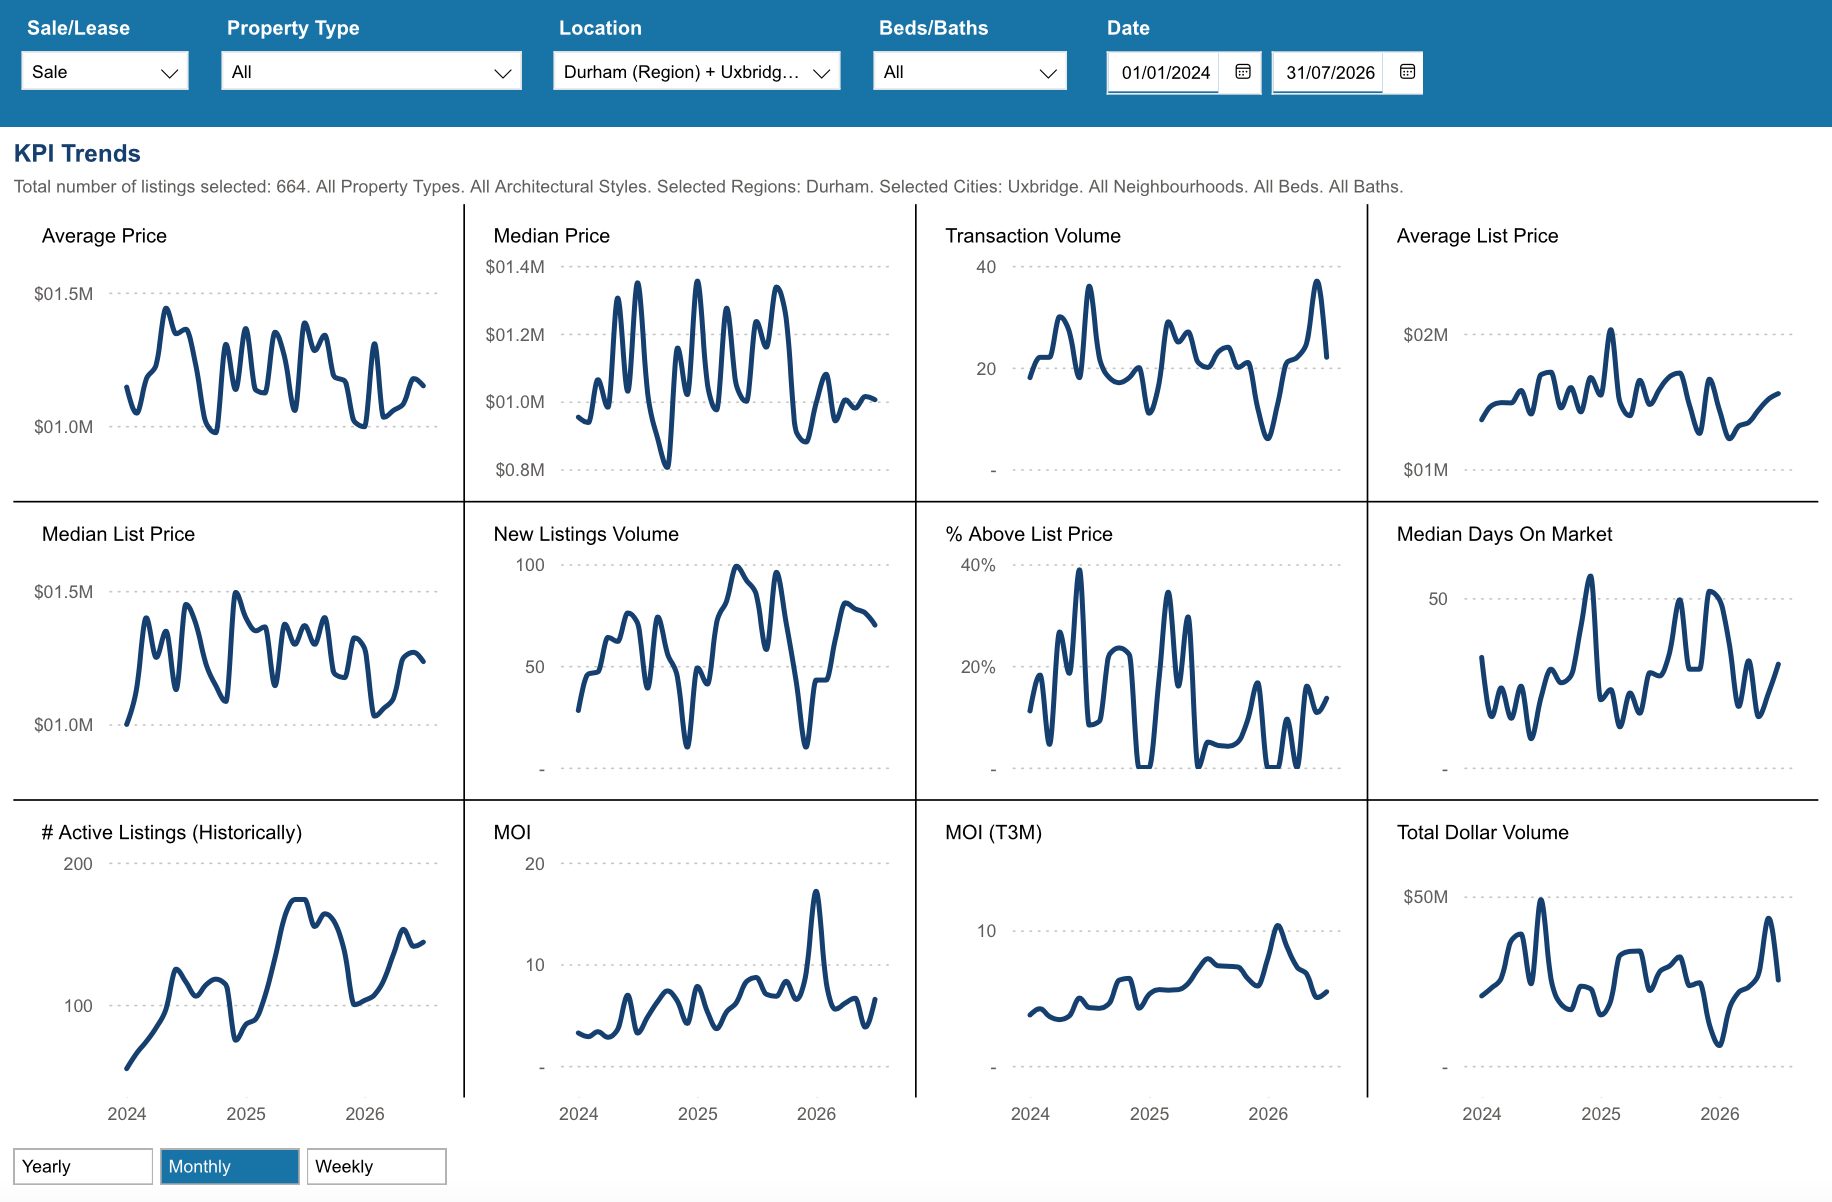
Key Performance Indicators (KPIs) from January 2024 through July 2026 provide a clear snapshot of how the Township of Uxbridge real estate market has evolved across all property types, architectural styles, and home configurations
*Information is believed to be accurate at time of posting but is not guaranteed to be correct. Some values may vary slightly based on the exact date and time the reports were generated. Market stats are provided by TRREB (Toronto Regional Real Estate Board) and are based on sales for the month of Attached/Row/Townhouses, Condo Apartments, Condo Townhouses, Detached, Detached with Common Elements, Link Homes and Semi-detached. *Some values may vary slightly based on the exact date and time the reports were generated.
Not intended as a solicitation if your property is already listed by another broker. Affiliated real estate agents are independent contractor sales associates, not employees. ©2021 Coldwell Banker. All Rights Reserved. Coldwell Banker and the Coldwell Banker logos are trademarks of Coldwell Banker Real Estate LLC. The Coldwell Banker® System is comprised of company owned offices which are owned by a subsidiary of Realogy Brokerage Group LLC and franchised offices which are independently owned and operated. The Coldwell Banker System fully supports the principles of the Fair Housing Act and the Equal Opportunity Act.
Click below for more reports
Check out our Uxbridge and Scugog Events Pages to keep up to date on whats going on around town. Click the links or scan the Code with your phone to take you directly there.

UXBRIDGE EVENTS

SCUGOG EVENTS

Scugog Housing July 2026

Scugog Housing July 2026
Each office is independently owned and operated


Housing Market Report for July 2026
Here is the Township of Scugog Housing July 2026 report (all housing types), with reports from the Canadian Real Estate Association, and Toronto Regional Real Estate Board included.
This housing report for Durham Region includes the number of new listings, average list price, number of properties sold, average selling price, average days on market and average asking price to selling price ratio for all property types within the Region of Durham.
Scroll to the bottom for links to take you to the housing market reports for Durham Region, Uxbridge and Brock.
From Toronto Regional Real Estate Board
Please note: The PropTx MLS® System, of which TRREB is a part, has added a number of new client boards over the last year. Many of these boards’ Members trade within the Greater Toronto Area and broader Greater Golden Horseshoe regions. As a result, historic data have been updated to reflect the addition of these boards’ listings and transactions. This means historic data have changed relative to previously published static reports. To view updated historic data, click here.
Toronto Regional Real Estate Board – Market Stats At A Glance – July 2026
Read the Toronto Regional Real Estate Board Market Watch Report
Scugog Township Real Estate Market Analysis – July 2026
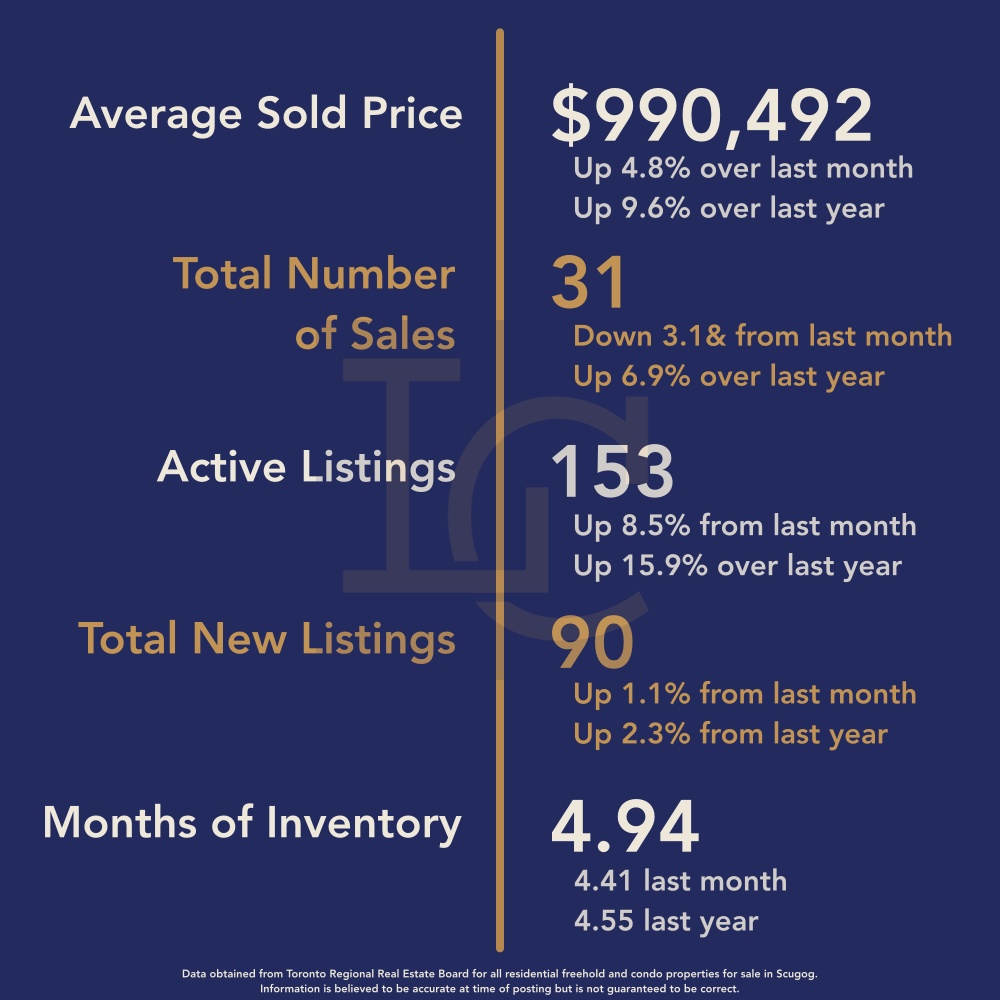
The Township of Scugog real estate market remained balanced in July 2026, with sales holding steady, average prices improving considerably from a year ago, and fewer new listings coming onto the market. While the average sale price pulled back from June, the year-over-year increase paints a more positive picture of where local prices stand compared with last summer.
July 2026
June 2026
Average Sales Price
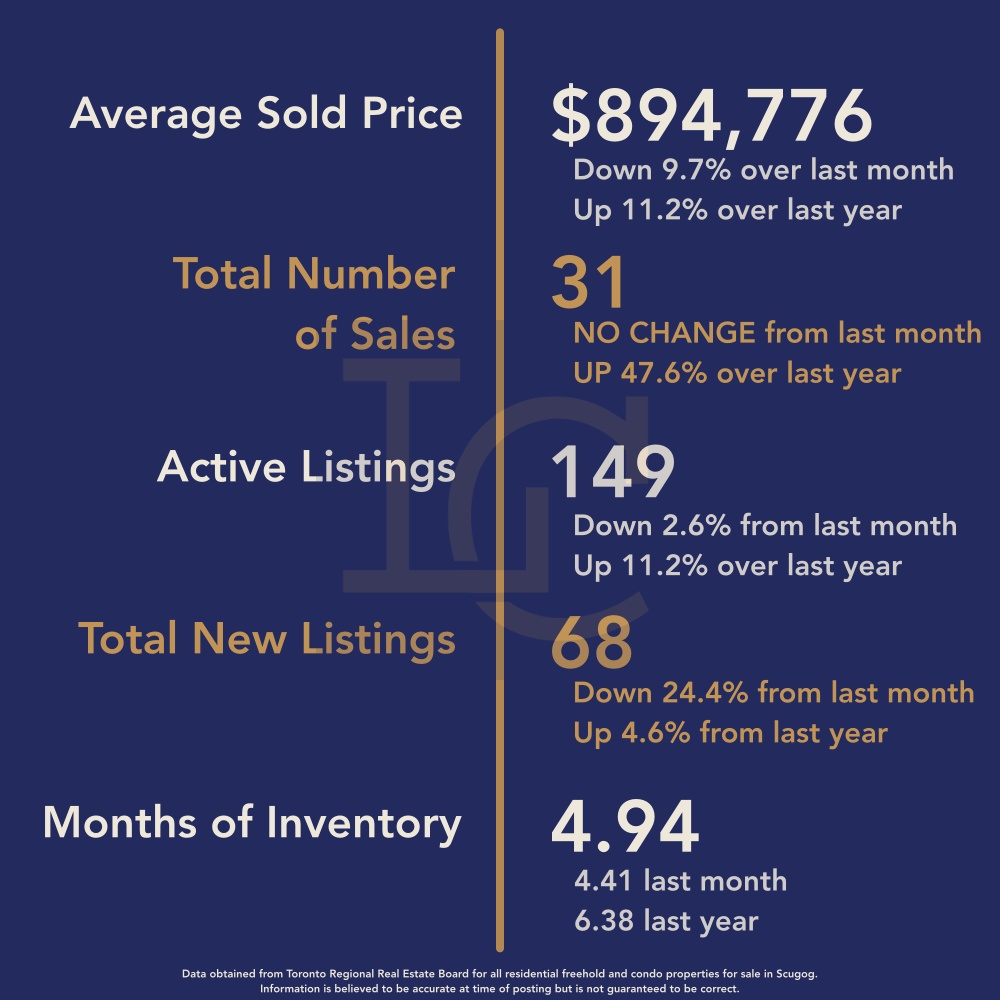
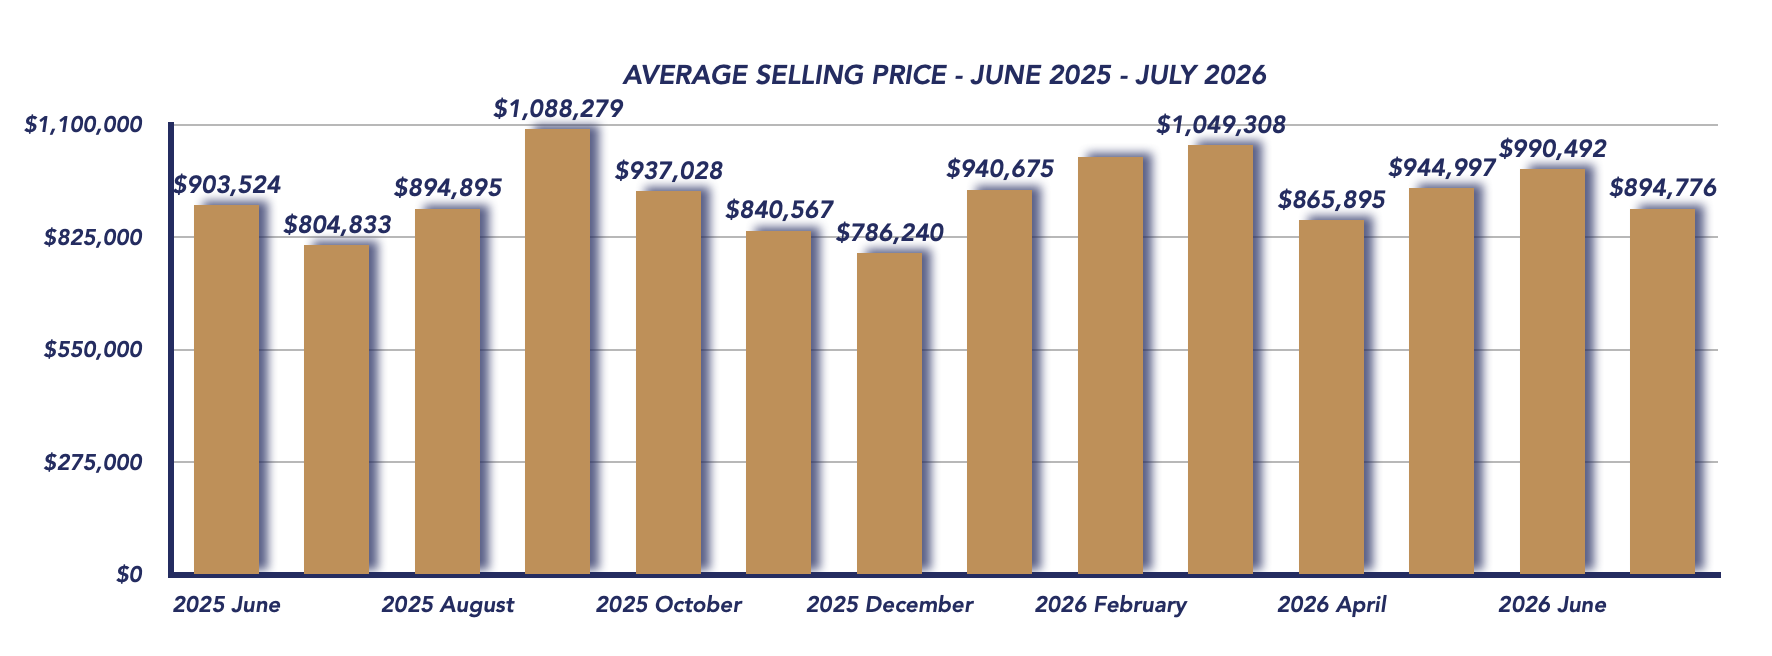
The average selling price in July 2026 was $894,776, representing an 11.2% increase year-over-year from $804,833 in July 2025.
Month-over-month, however, the average declined 9.7% from $990,492 in June 2026.
Monthly average prices in a smaller market such as Scugog can fluctuate considerably depending on the types and price ranges of properties sold. For that reason, the month-over-month decline shouldn’t necessarily be interpreted as an equivalent decline in individual property values.
The year-over-year comparison is encouraging, with July’s average almost $90,000 higher than the same month last year. Looking at several months of data rather than one month’s average provides a better indication of the overall direction of the local market.
Sales Activity
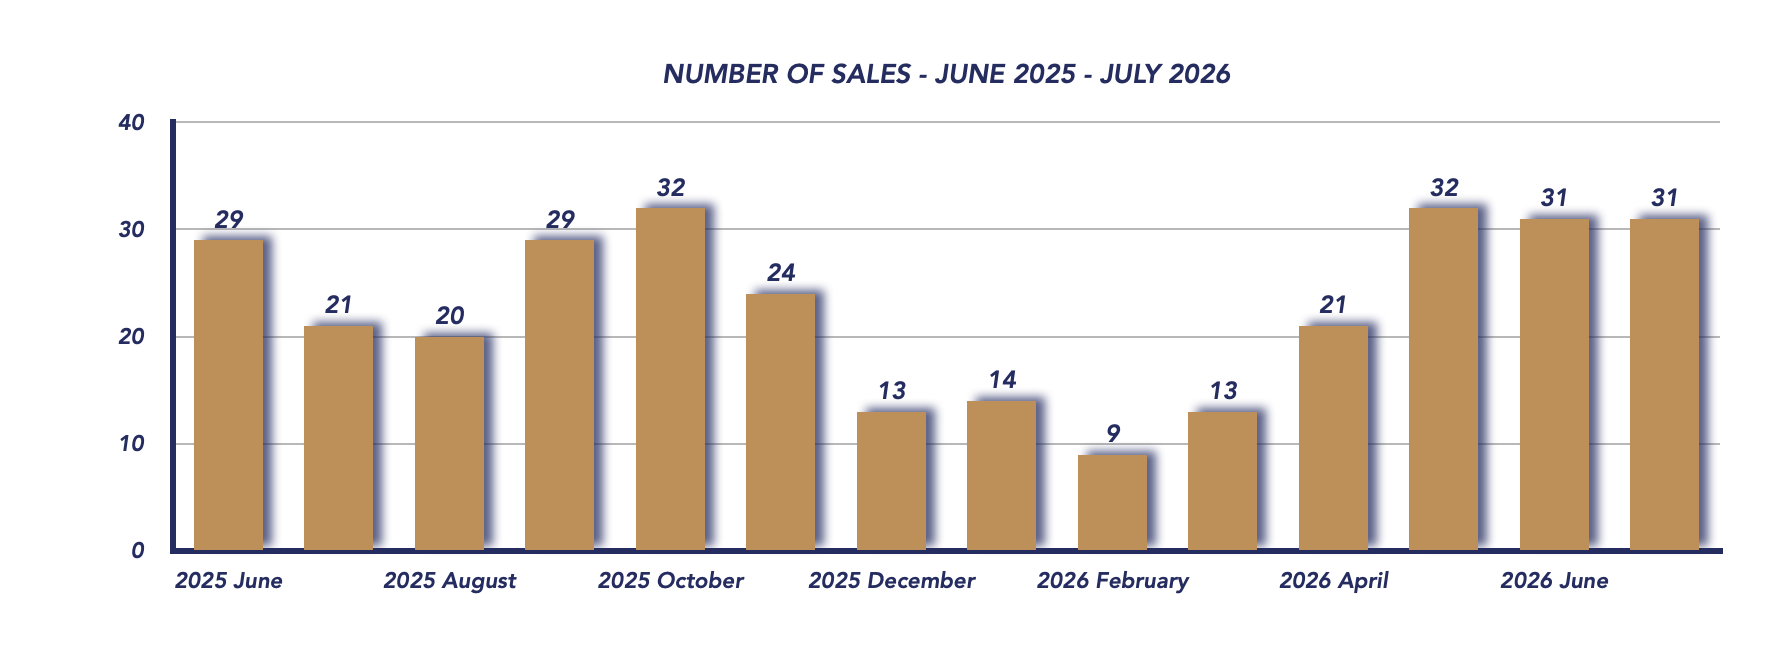
A total of 31 properties sold in July, unchanged from the 31 sales recorded in June and up from 29 sales in July 2025.
Holding sales steady from June is a positive sign, particularly as the market moves from the busy spring period into the summer months. The year-over-year improvement also indicates that buyer activity remains healthy.
The sale-to-list price ratio eased to 97%, down from 99% in June but matching the 97% recorded in July 2025.
This suggests buyers had slightly more negotiating room than they did last month. With homes selling for an average of 97% of their asking price, accurate pricing continues to be important for sellers hoping to generate strong interest and achieve a successful sale.
New Listings
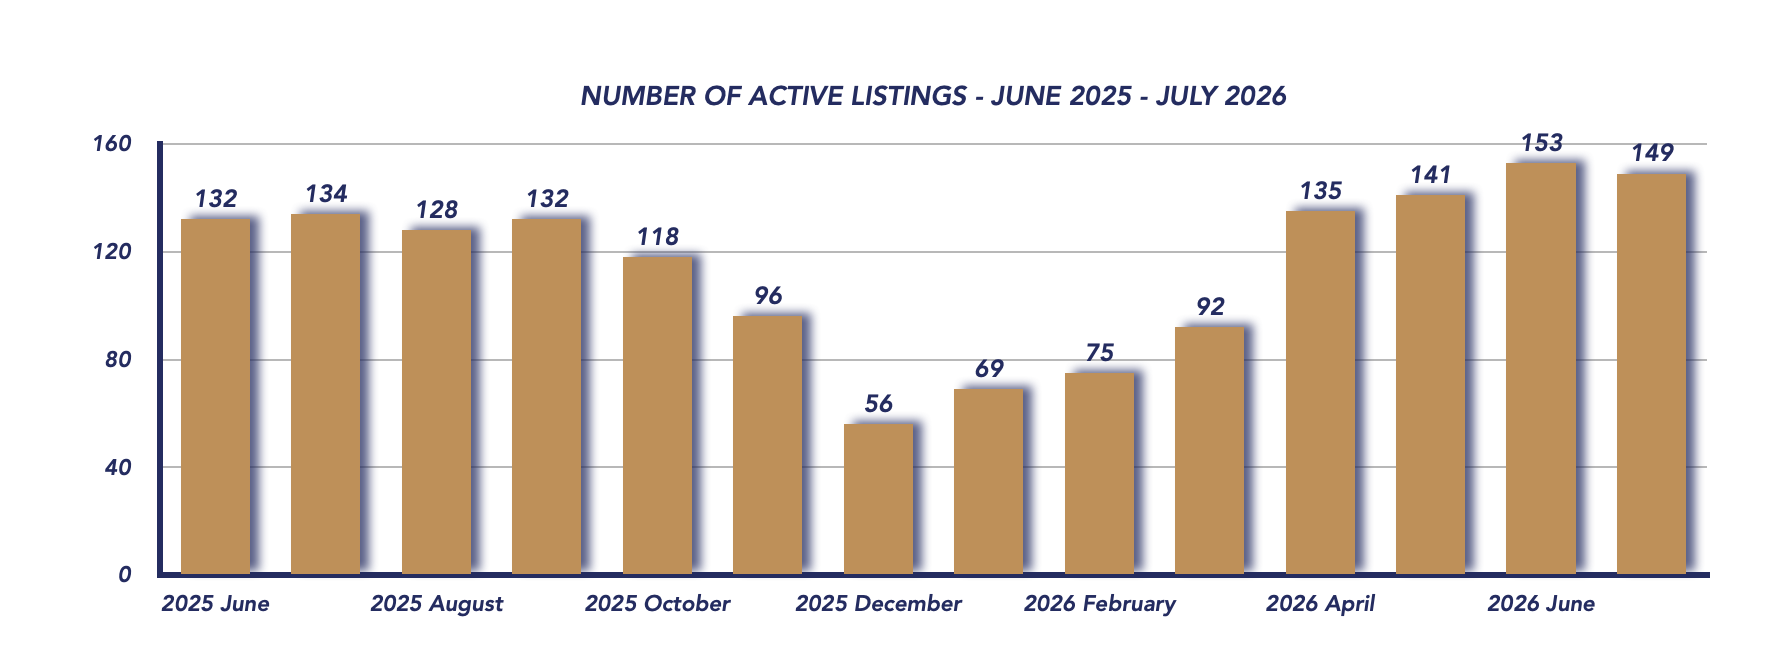
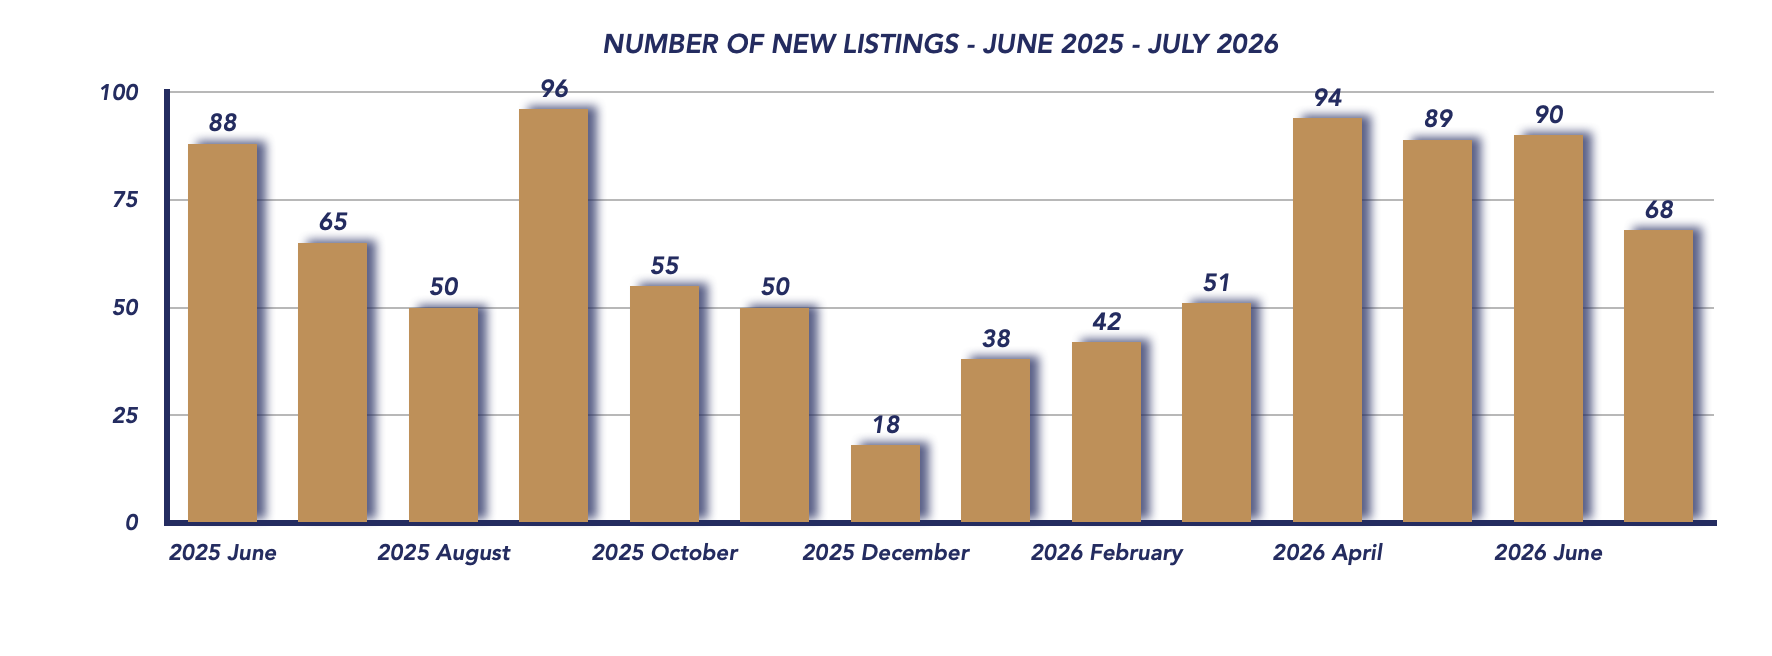
There were 68 new listings in Scugog during July, a noticeable decline from the 90 properties listed in June. New listings were, however, slightly higher than the 65 recorded in July 2025.
The month-over-month reduction isn’t unusual as the market transitions from spring into the summer months. Fewer new properties entering the market can also help prevent inventory from building too quickly when sales remain consistent.
With 31 sales and 68 new listings during July, buyers continued to have a good selection of properties while sellers faced competition from other available homes.
Days on Market
Properties that sold in July spent an average of 48 days on the market, an improvement from 55 days in June and 54 days in July 2025.
The shorter selling time is noteworthy given that Scugog remains a balanced market. It suggests buyers are actively responding to properties that are priced appropriately for current conditions.
For sellers, the numbers reinforce the importance of entering the market at a realistic price. Buyers have options and are likely to compare properties carefully, but attractive homes offering good value can still move relatively quickly.
Months of Inventory
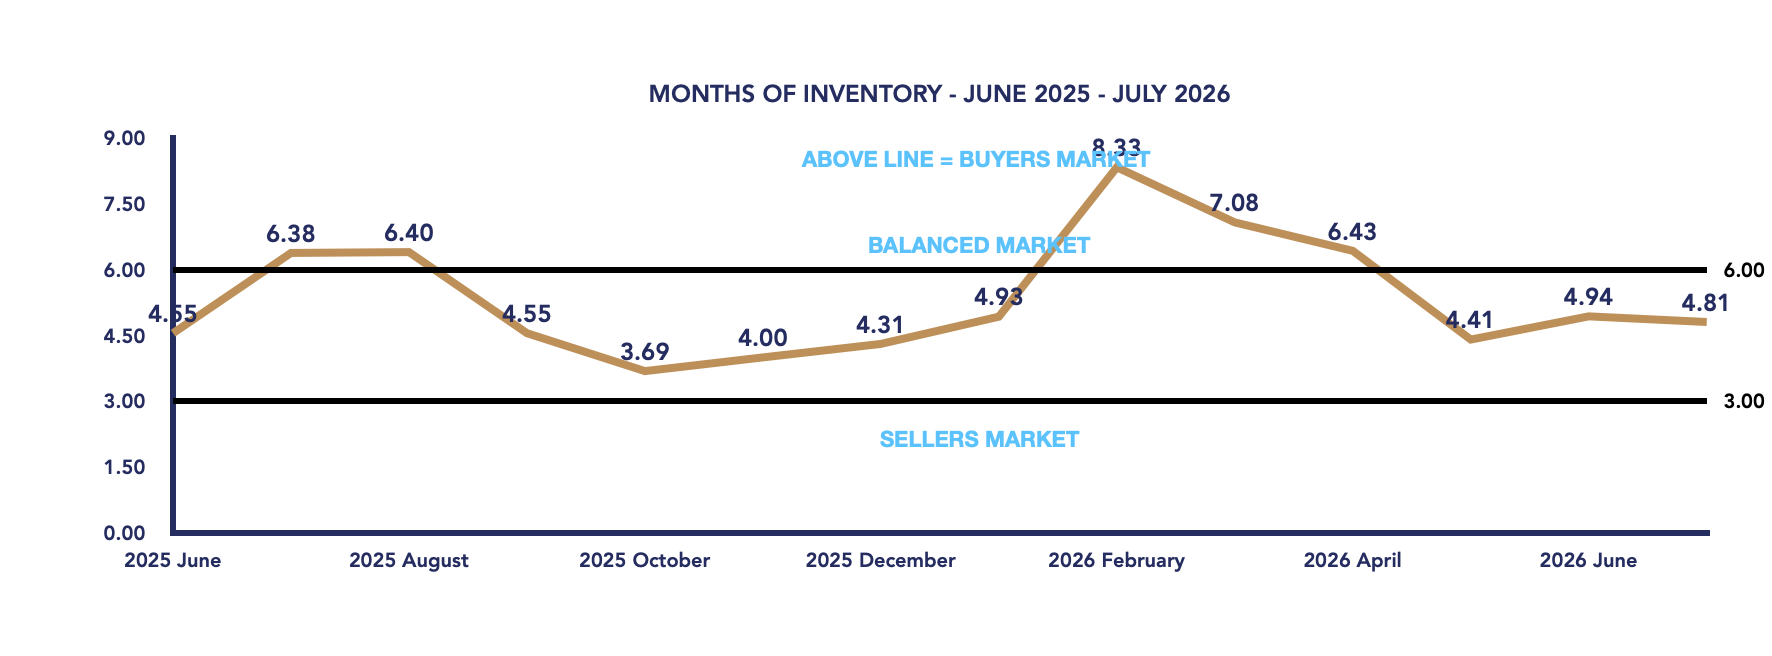
Scugog had 4.81 months of inventory in July, edging down from 4.94 months in June and considerably below the 6.38 months recorded in July 2025.
At 4.81 months, the Township of Scugog remains in balanced market territory, meaning neither buyers nor sellers have a significant overall advantage.
The year-over-year improvement is particularly interesting. Last July, more than six months of inventory created considerably more buyer-friendly conditions. This July, stronger sales and tighter supply have created a healthier balance between available homes and buyer demand.
Key Takeaways
- Average selling price reached $894,776, up 11.2% from July 2025 but down 9.7% from June.
- 31 properties sold, unchanged from June and slightly ahead of last July.
- The sale-to-list price ratio was 97%, giving buyers more negotiating room than in June.
- New listings declined to 68, down substantially from 90 in June.
- Days on market improved to 48, compared with 55 days last month and 54 days last year.
- Months of inventory declined to 4.81, keeping Scugog in balanced market territory and well below last July’s 6.38 months.
Market Outlook
July’s numbers point to a stable and balanced Scugog real estate market as we move through the summer of 2026. Although the average selling price declined from June, it remains substantially higher than it was a year ago. At the same time, sales are holding steady and homes are selling faster than both last month and last year.
For buyers, balanced conditions continue to provide choice and some negotiating room, particularly with the sale-to-list ratio returning to 97%. For sellers, steady sales and fewer new listings are encouraging, but correct pricing remains essential.
As we move toward the late-summer and fall markets, inventory will be an important indicator to watch. If new listings remain lower while sales continue at their current pace, conditions could tighten further. For now, Scugog remains in a balanced position, providing opportunities for both buyers and sellers.
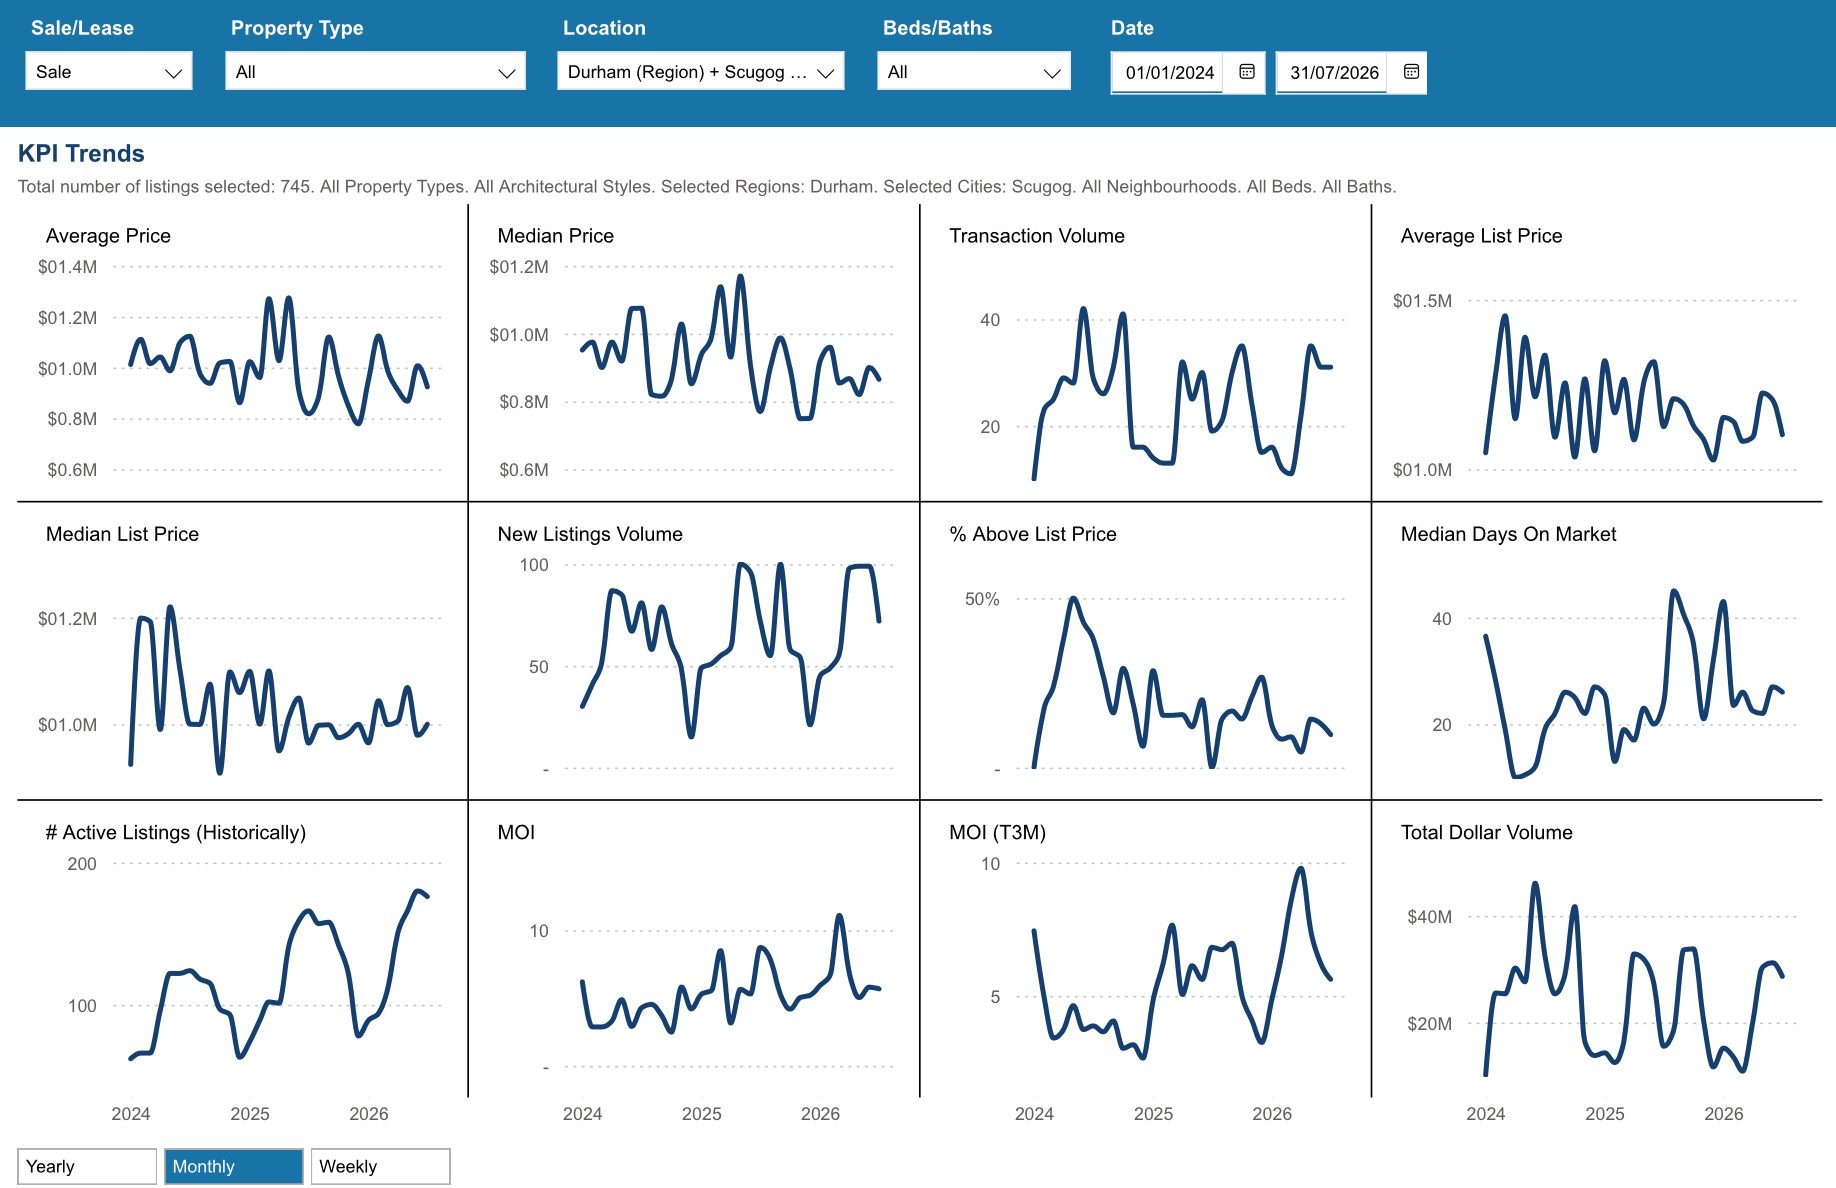
Key Performance Indicators (KPIs) from January 2024 through July 2026 provide a clear snapshot of how the Township of Scugog real estate market has evolved across all property types, architectural styles, and home configurations
*Information is believed to be accurate at time of posting but is not guaranteed to be correct. Some values may vary slightly based on the exact date and time the reports were generated. Market stats are provided by TRREB (Toronto Regional Real Estate Board) and are based on sales for the month of Attached/Row/Townhouses, Condo Apartments, Condo Townhouses, Detached, Detached with Common Elements, Link Homes and Semi-detached. *Some values may vary slightly based on the exact date and time the reports were generated.
Not intended as a solicitation if your property is already listed by another broker. Affiliated real estate agents are independent contractor sales associates, not employees. ©2021 Coldwell Banker. All Rights Reserved. Coldwell Banker and the Coldwell Banker logos are trademarks of Coldwell Banker Real Estate LLC. The Coldwell Banker® System is comprised of company owned offices which are owned by a subsidiary of Realogy Brokerage Group LLC and franchised offices which are independently owned and operated. The Coldwell Banker System fully supports the principles of the Fair Housing Act and the Equal Opportunity Act.
Click below for more reports
Check out our Uxbridge and Scugog Events Pages to keep up to date on whats going on around town. Click the links or scan the Code with your phone to take you directly there.
UXBRIDGE EVENTS
SCUGOG EVENTS
Brock Housing July 2026

Brock Housing July 2026
Each office is independently owned and operated

Housing Market Report for July 2026
Here is the Township of Brock Housing July 2026 report (all housing types), with reports from the Canadian Real Estate Association, and Toronto Regional Real Estate Board included.
This housing report for Durham Region includes the number of new listings, average list price, number of properties sold, average selling price, average days on market and average asking price to selling price ratio for all property types within the Region of Durham.
Scroll to the bottom for links to take you to the housing market reports for Durham Region, Uxbridge and Scugog.
From Toronto Regional Real Estate Board
Please note: The PropTx MLS® System, of which TRREB is a part, has added a number of new client boards over the last year. Many of these boards’ Members trade within the Greater Toronto Area and broader Greater Golden Horseshoe regions. As a result, historic data have been updated to reflect the addition of these boards’ listings and transactions. This means historic data have changed relative to previously published static reports. To view updated historic data, click here.
Toronto Regional Real Estate Board – Market Stats At A Glance – July 2026
Read the Toronto Regional Real Estate Board Market Watch Report
Brock Township Real Estate Market Analysis – July 2026
The Township of Brock real estate market shifted back toward buyer-friendly conditions in July 2026. Average selling prices edged higher from June, but sales activity slowed considerably and months of inventory climbed. At the same time, homes that did sell moved more quickly, showing that buyers remain active when properties are priced appropriately.
July 2026
June 2026
Average Selling Price Edges Higher
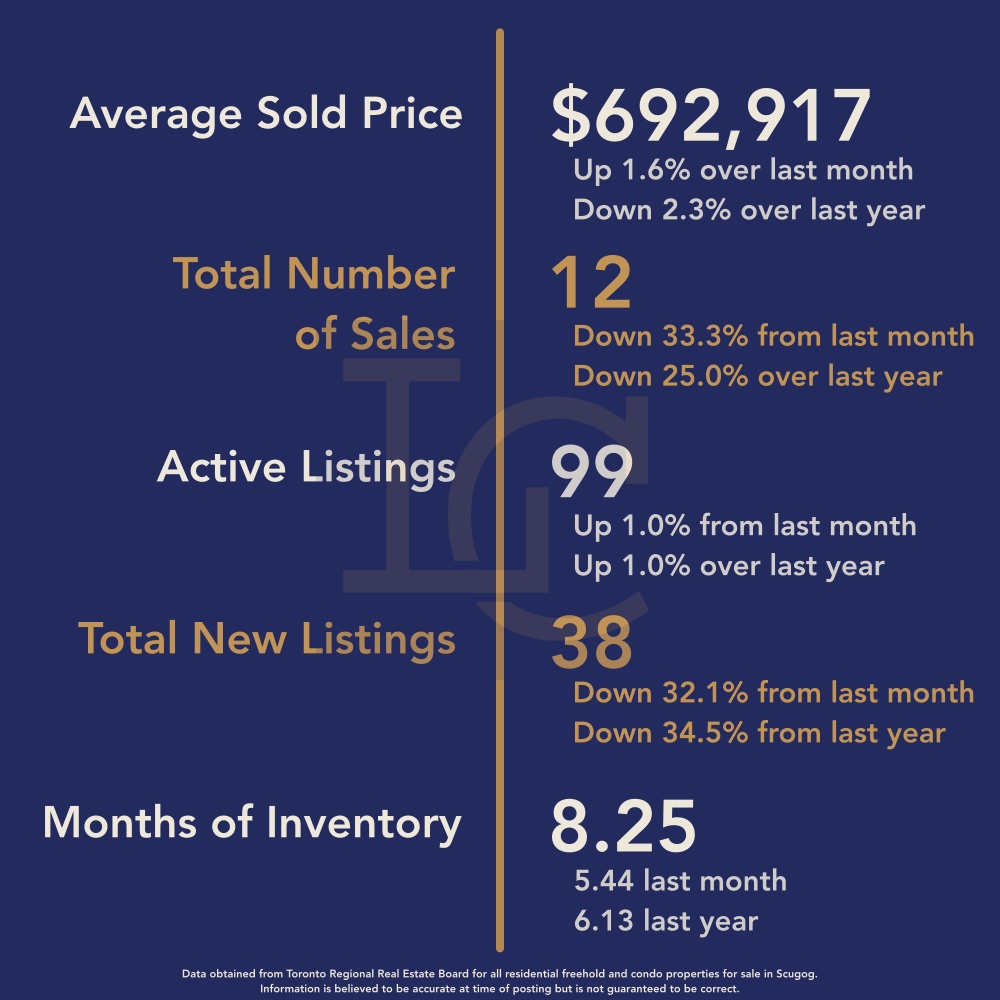
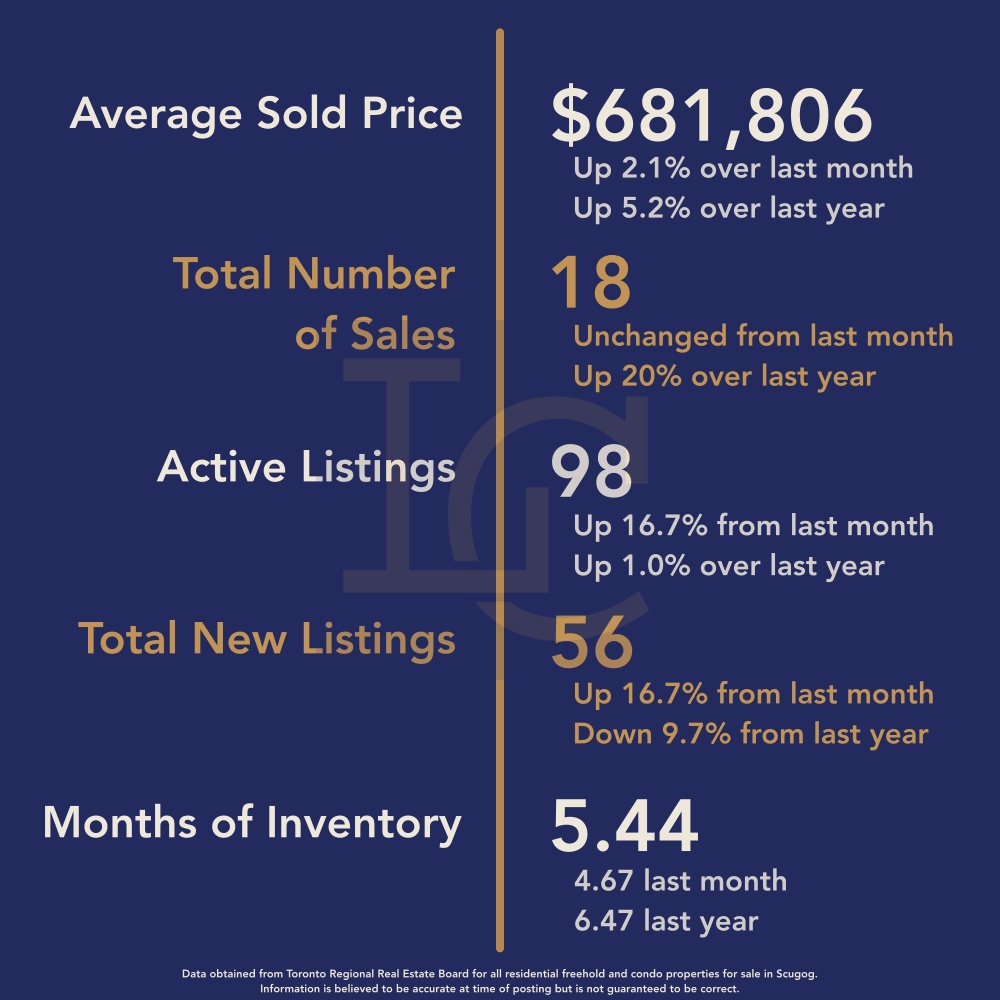
The average selling price in July 2026 was $692,917, representing a:
- 1.6% increase from June 2026 ($681,806)
- 2.2% decrease from July 2025 ($708,738)
The month-over-month increase continues the relatively steady pricing trend seen over the past few months. However, with the average still slightly below last July, the year-over-year numbers suggest that prices remain relatively stable rather than showing significant appreciation.
As always in a smaller market such as Brock Township, monthly averages can fluctuate depending on the mix and price range of properties sold, so looking at several indicators together provides a better picture of overall market conditions.
v
Sales Activity Slows
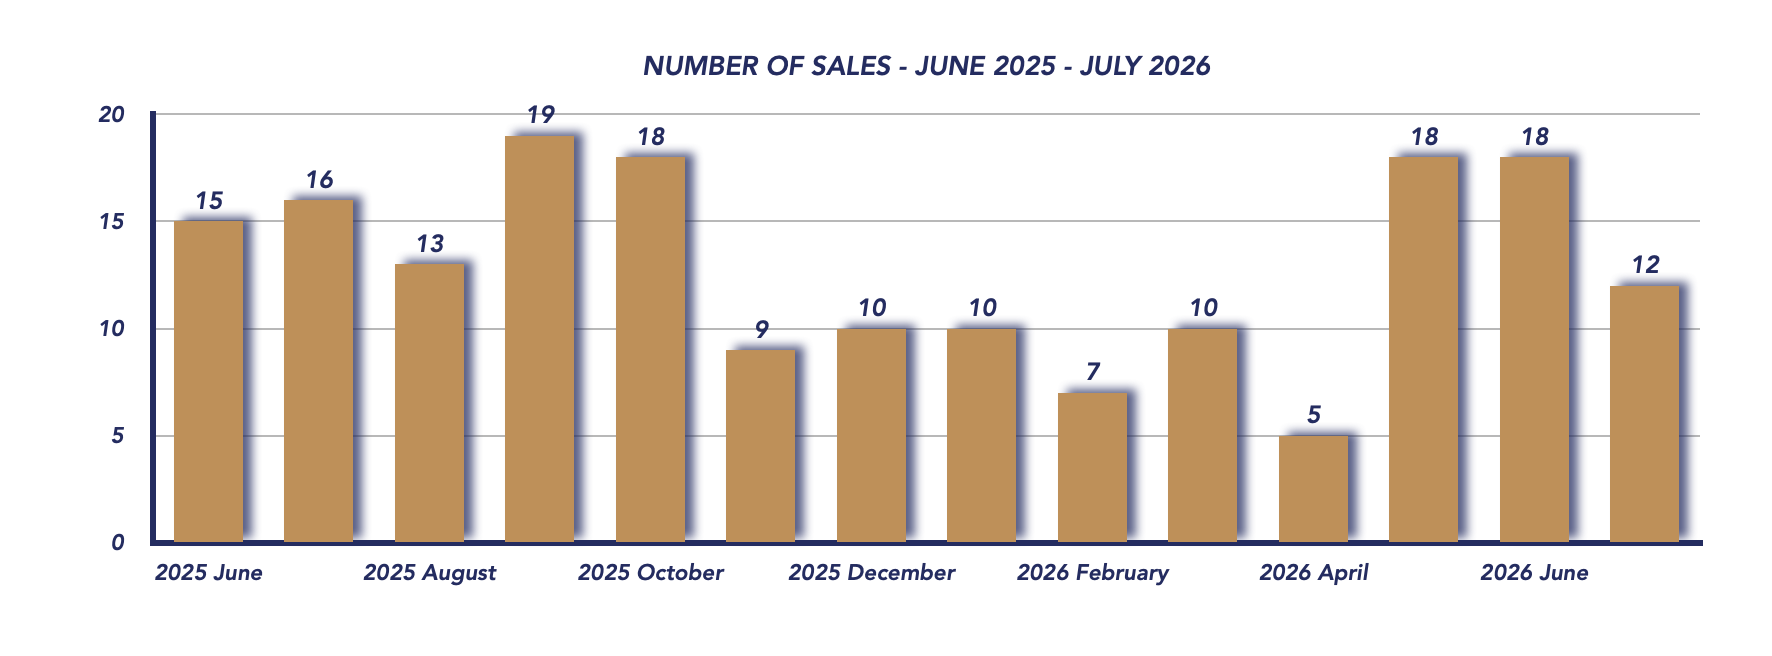
A total of 12 properties sold in July, down from 18 sales in June and 16 sales in July 2025.
The decline in transactions is an important part of this month’s story. While prices remained relatively stable, fewer buyers completed purchases. This slowdown in sales, combined with available inventory, contributed to the significant increase in months of inventory.
Sale-to-List Price Ratio Slips Slightly
The sale-to-list price ratio was 96% in July, down from 97% in June and matching the 96% recorded in July 2025.
On average, properties are selling about 4% below their asking price. This suggests buyers continue to have some room to negotiate, particularly as market conditions shift in their favour.
For sellers, accurate pricing remains especially important. With buyers having more choice, properties that are priced above current market expectations may have difficulty attracting offers.
New Listings Decline
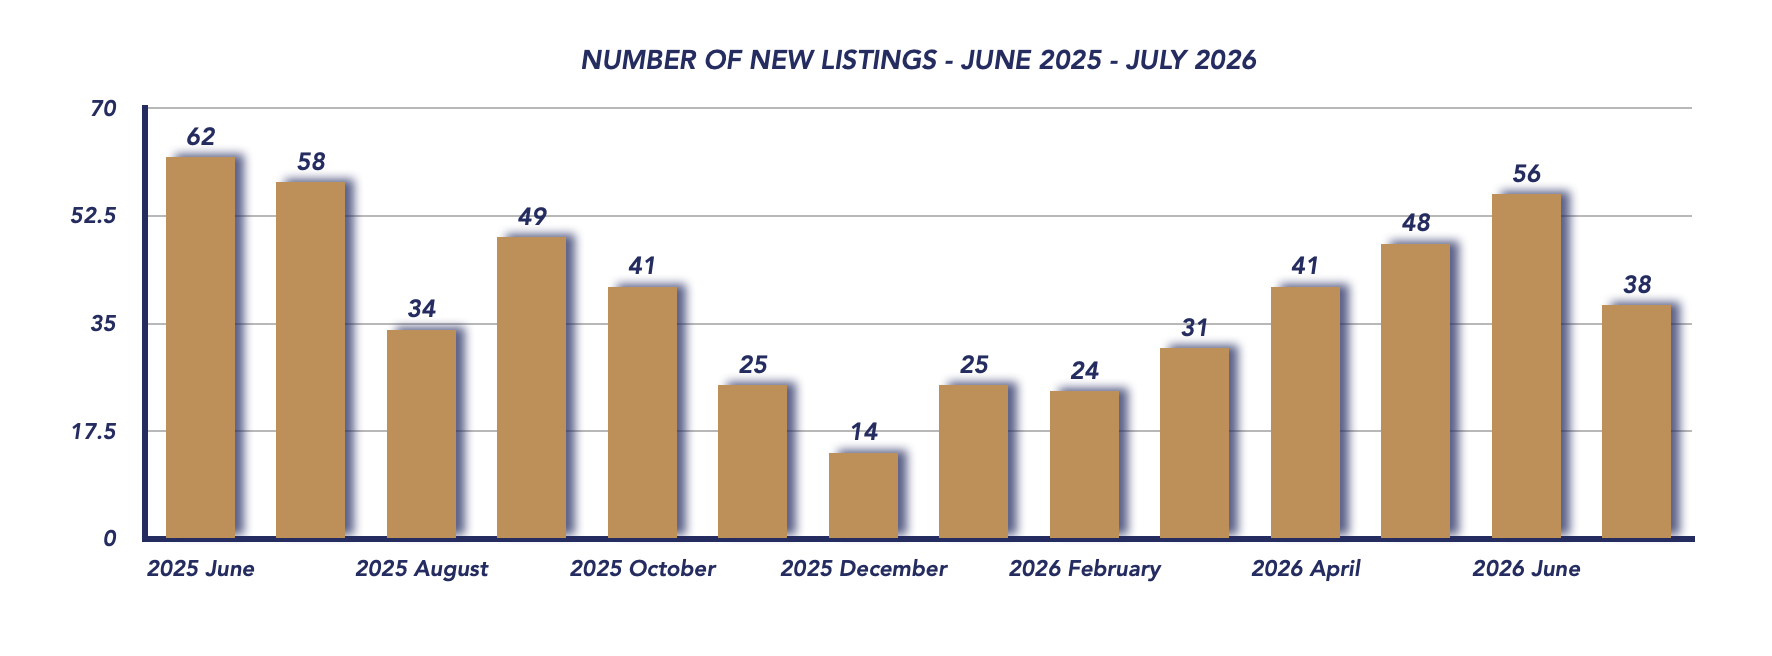
There were 38 new listings in July, compared with:
- 56 new listings in June 2026
- 58 new listings in July 2025
The decline in new listings could be partly seasonal as the market moves deeper into summer. While fewer properties came onto the market, slower sales meant existing inventory took longer to be absorbed.
This highlights an important distinction: fewer new listings don’t necessarily mean a tighter market when the pace of sales is also declining.
Homes Sell Faster
One positive indicator in July was the improvement in property days on market, which fell to 39 days, compared with 52 days in June and 47 days in July 2025.
Despite the overall market shifting toward buyers, properties that successfully sold did so more quickly. This suggests there is still solid demand for homes that show well and are priced appropriately for current conditions.
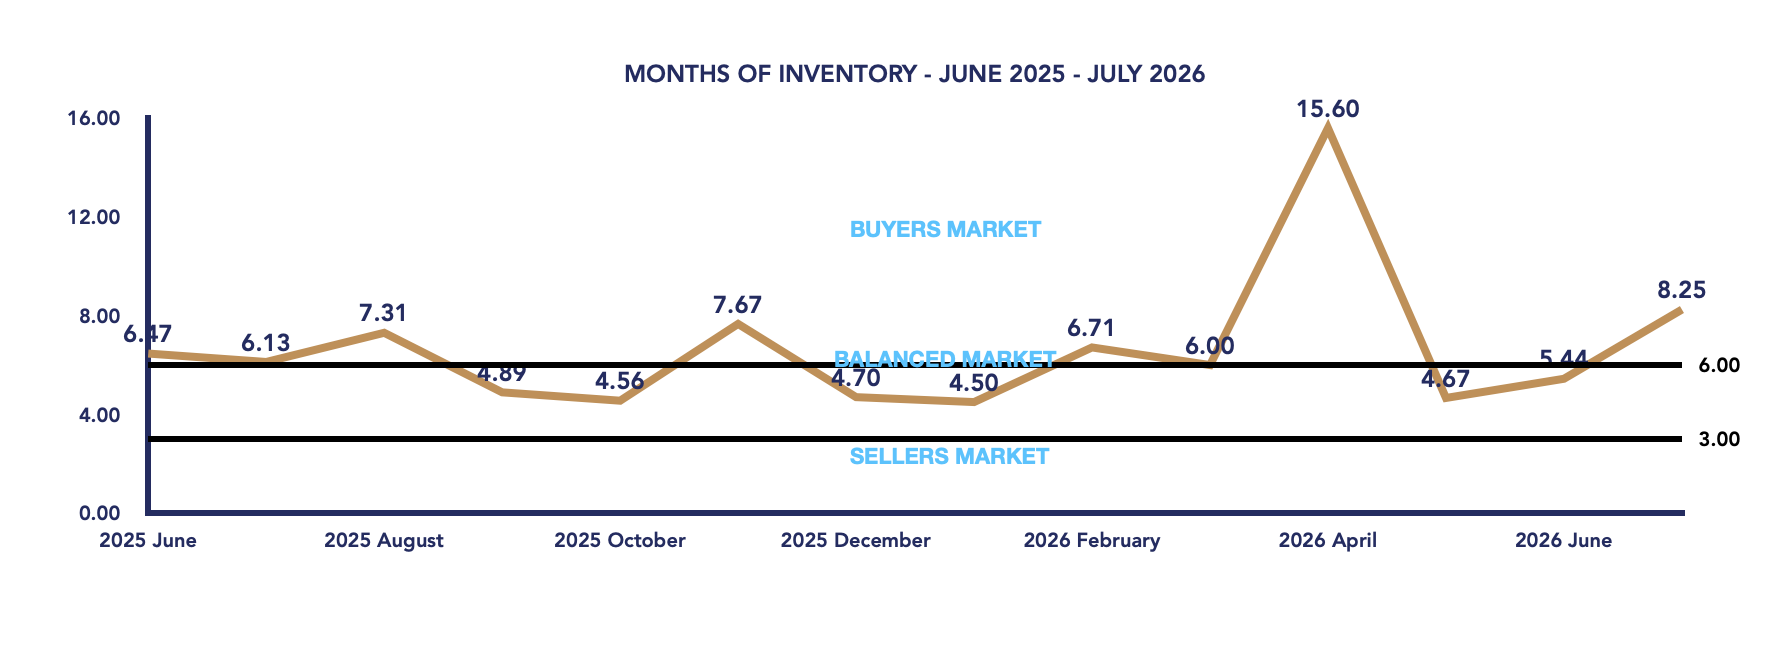
Months of Inventory Climbs Into Buyer’s Market Territory
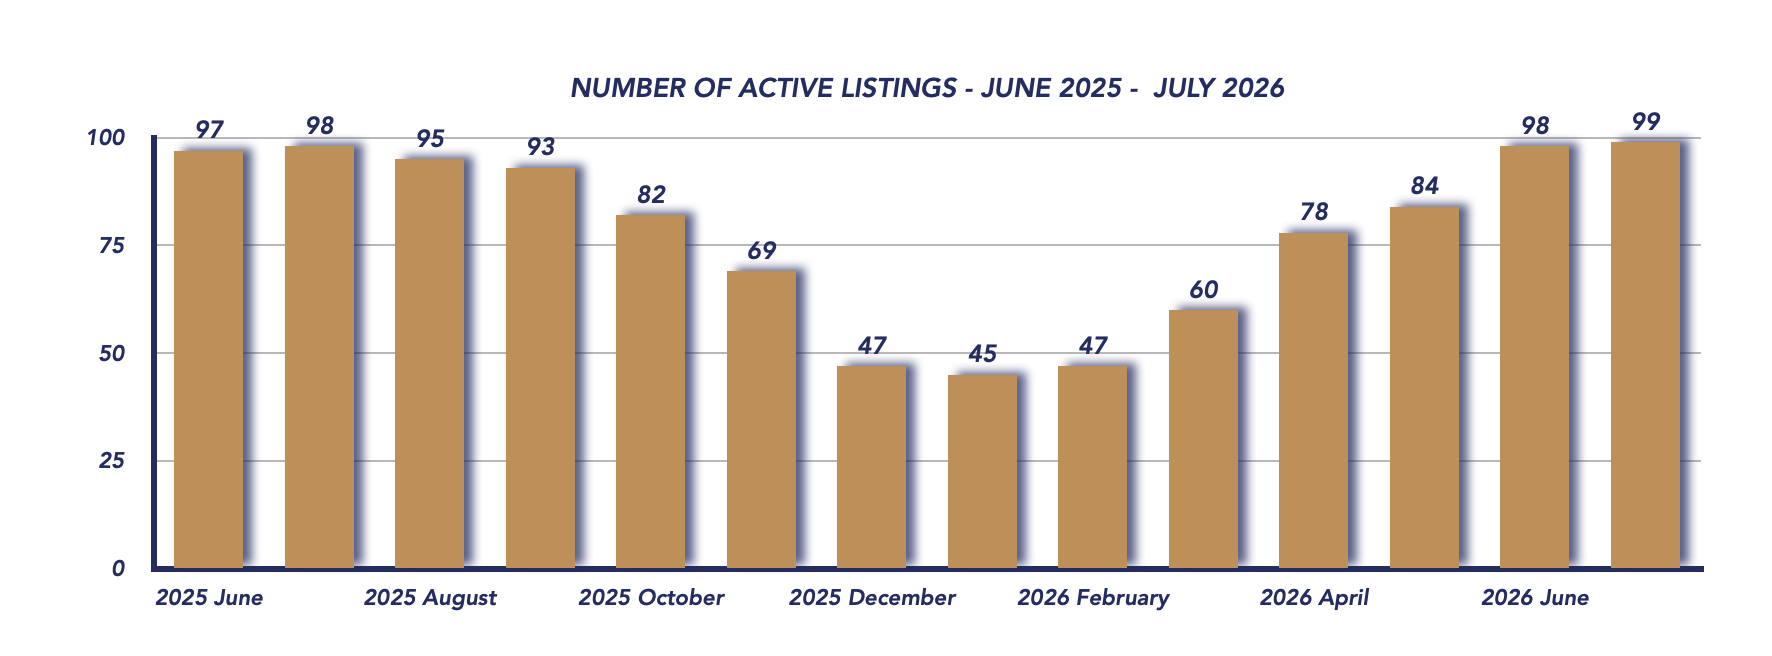
The biggest shift in July was months of inventory, which climbed to 8.25 months, compared with:
- 5.44 months in June 2026
- 6.13 months in July 2025
This moves Brock Township back into buyer’s market territory after spending June near the upper end of a balanced market.
The increase was driven largely by the slowdown in sales. With only 12 properties selling during the month, existing inventory is being absorbed at a slower rate.
For buyers, this means more selection, less urgency and potentially greater negotiating power. For sellers, it reinforces the importance of realistic pricing and ensuring their property stands out from competing listings.
Conclusion
July 2026 brought mixed signals to the Brock Township housing market. The average selling price increased modestly to $692,917, and homes that sold spent fewer days on the market. At the same time, total sales declined and months of inventory climbed substantially, shifting conditions back in favour of buyers.
The numbers suggest that buyers are still willing to act when they see the right property at the right price, but they don’t necessarily feel pressured to make quick decisions when they have more options available.
As we head through the remainder of the summer and toward the fall market, sales activity and inventory levels will be important indicators to watch. If sales pick up, Brock could move back toward balanced conditions. If demand remains slower while inventory stays elevated, buyers may continue to hold the advantage.
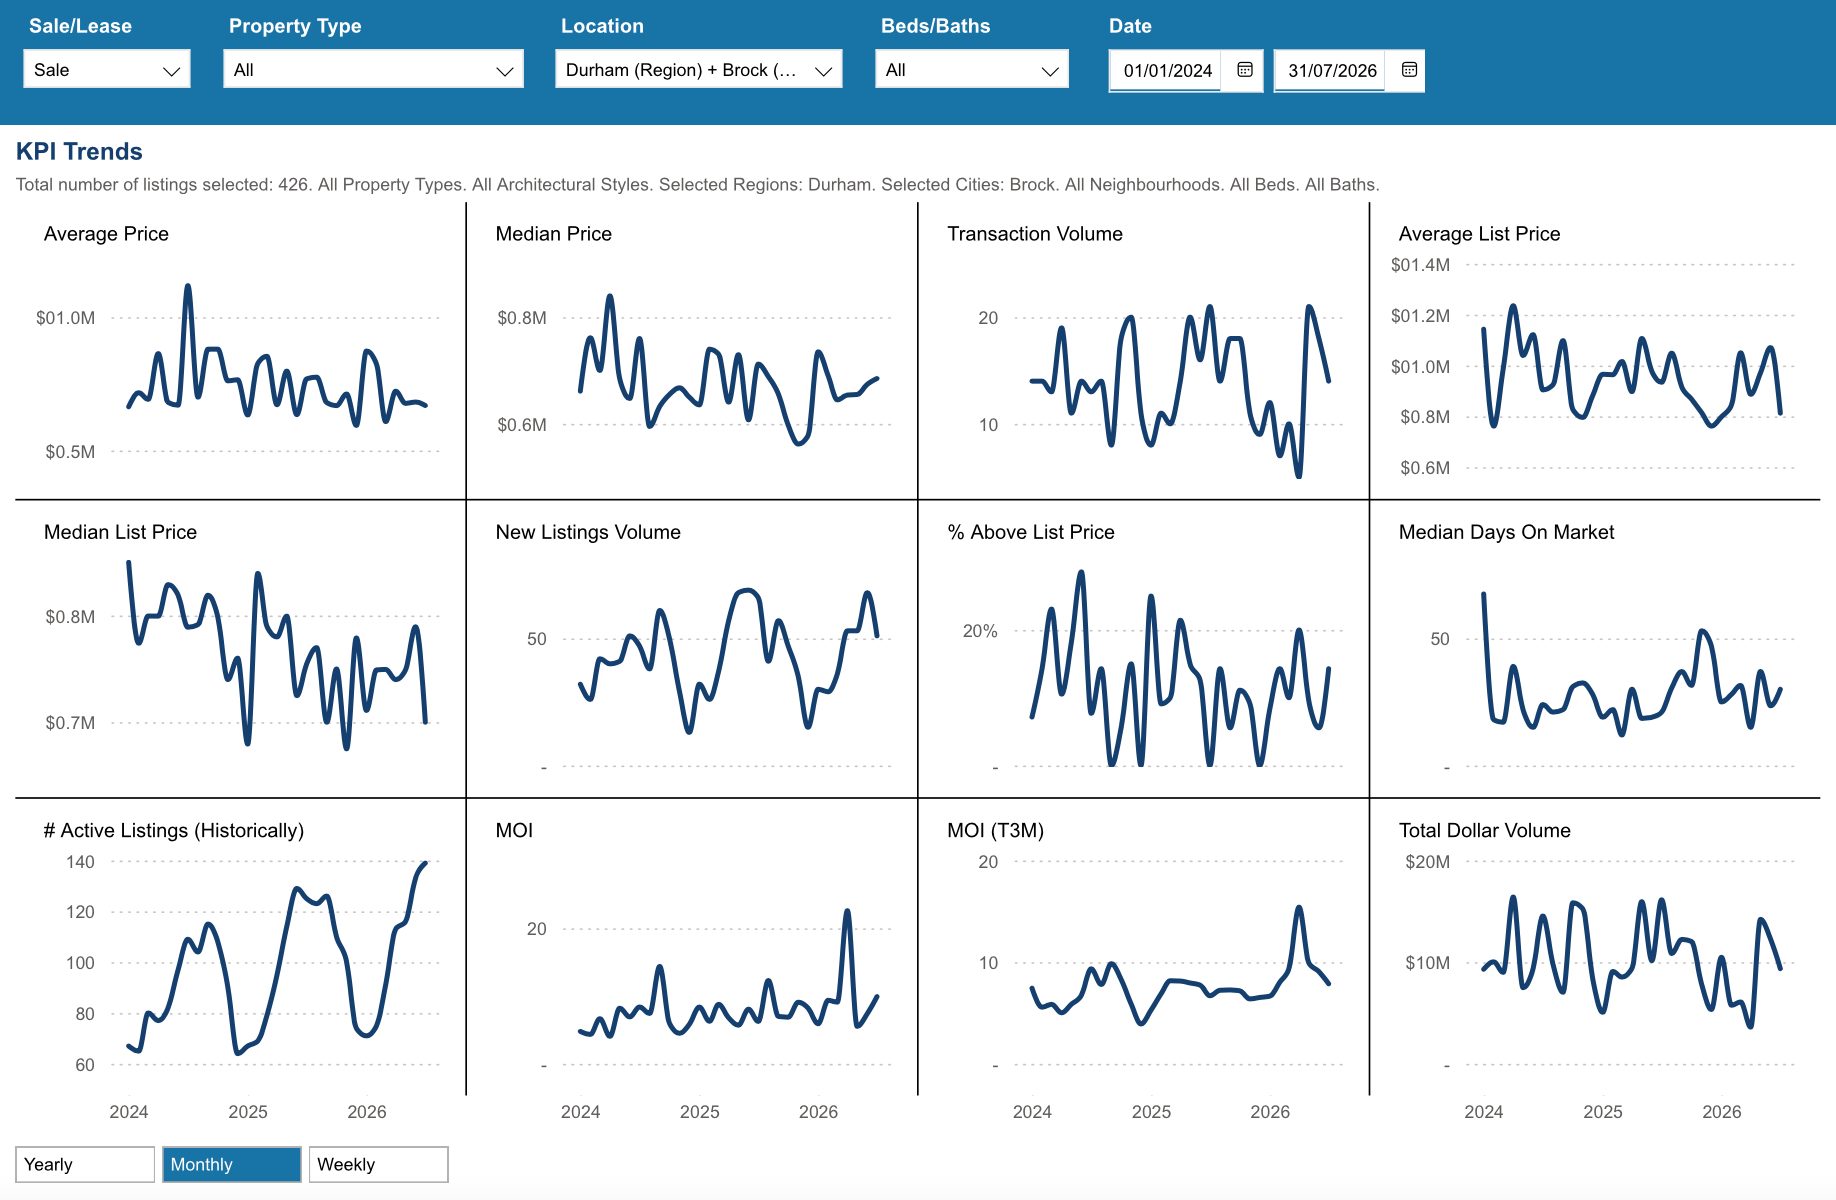
Key Performance Indicators (KPIs) from January 2024 through July 2026 provide a clear snapshot of how the Township of Brock real estate market has evolved across all property types, architectural styles, and home configurations
*Information is believed to be accurate at time of posting but is not guaranteed to be correct. Some values may vary slightly based on the exact date and time the reports were generated. Market stats are provided by TRREB (Toronto Regional Real Estate Board) and are based on sales for the month of Attached/Row/Townhouses, Condo Apartments, Condo Townhouses, Detached, Detached with Common Elements, Link Homes and Semi-detached. *Some values may vary slightly based on the exact date and time the reports were generated.
Not intended as a solicitation if your property is already listed by another broker. Affiliated real estate agents are independent contractor sales associates, not employees. ©2021 Coldwell Banker. All Rights Reserved. Coldwell Banker and the Coldwell Banker logos are trademarks of Coldwell Banker Real Estate LLC. The Coldwell Banker® System is comprised of company owned offices which are owned by a subsidiary of Realogy Brokerage Group LLC and franchised offices which are independently owned and operated. The Coldwell Banker System fully supports the principles of the Fair Housing Act and the Equal Opportunity Act.
Click below for more reports
Check out our Uxbridge and Scugog Events Pages to keep up to date on whats going on around town. Click the links or scan the Code with your phone to take you directly there.
UXBRIDGE EVENTS
SCUGOG EVENTS
Durham Region Housing July 2026

Durham Region Housing July 2026
Each office is independently owned and operated

Housing Market Report for July 2026
Here is the Region of Durham Housing July 2026 report (all housing types), with reports from the Canadian Real Estate Association, and Toronto Regional Real Estate Board included.
This housing report for Durham Region includes the number of new listings, average list price, number of properties sold, average selling price, average days on market and average asking price to selling price ratio for all property types within the Region of Durham.
Scroll to the bottom for links to take you to the housing market reports for Uxbridge, Scugog and Brock.
From Toronto Regional Real Estate Board
Please note: The PropTx MLS® System, of which TRREB is a part, has added a number of new client boards over the last year. Many of these boards’ Members trade within the Greater Toronto Area and broader Greater Golden Horseshoe regions. As a result, historic data have been updated to reflect the addition of these boards’ listings and transactions. This means historic data have changed relative to previously published static reports. To view updated historic data, click here.
Toronto Regional Real Estate Board – Market Stats At A Glance – July 2026
Read the Toronto Regional Real Estate Board Market Watch Report
Durham Region Real Estate Market Analysis – July 2026
The Durham Region real estate market cooled somewhat in July 2026, following several months of improving spring activity. Home prices moved lower, sales slowed, and properties took longer to sell. At the same time, fewer new listings entered the market, helping keep overall inventory within balanced market territory. The July numbers suggest buyers are taking a more cautious approach as the market moves through the summer months.
July 2026
June 2026
Average Sale Price Pulls Back in July
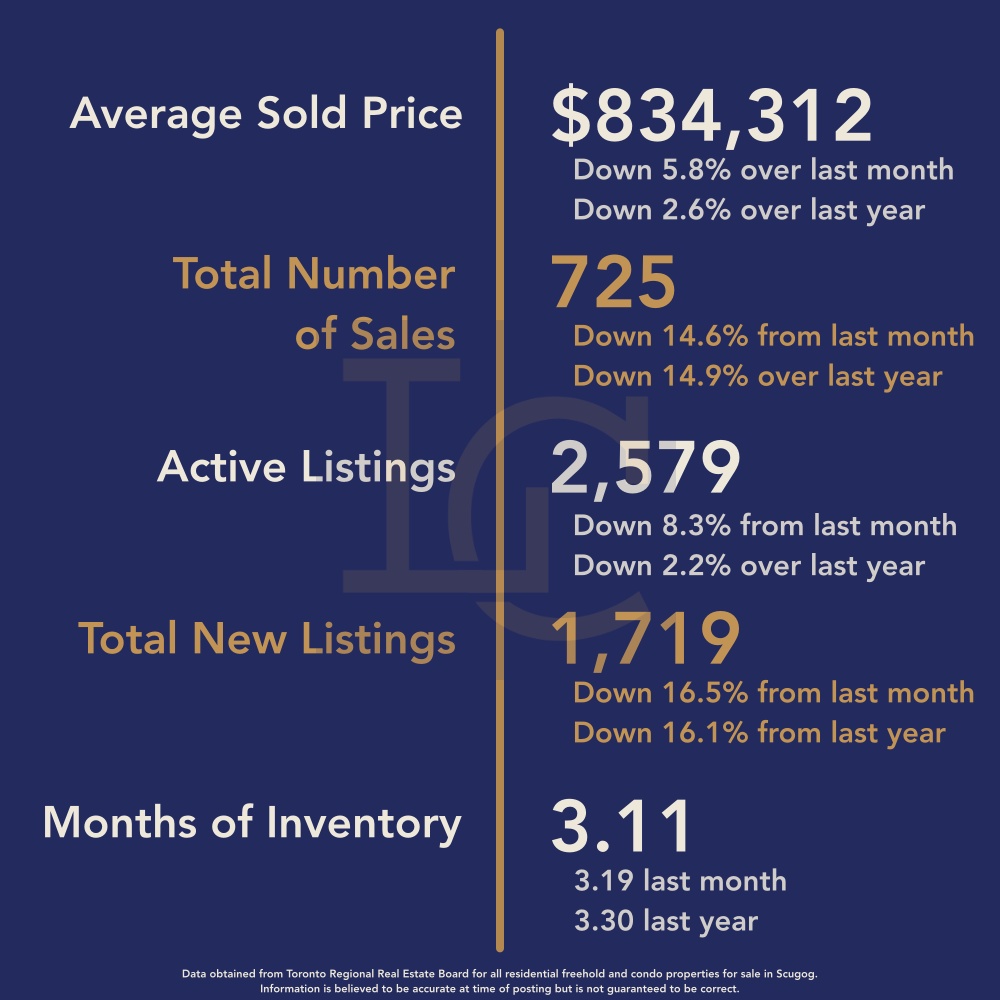
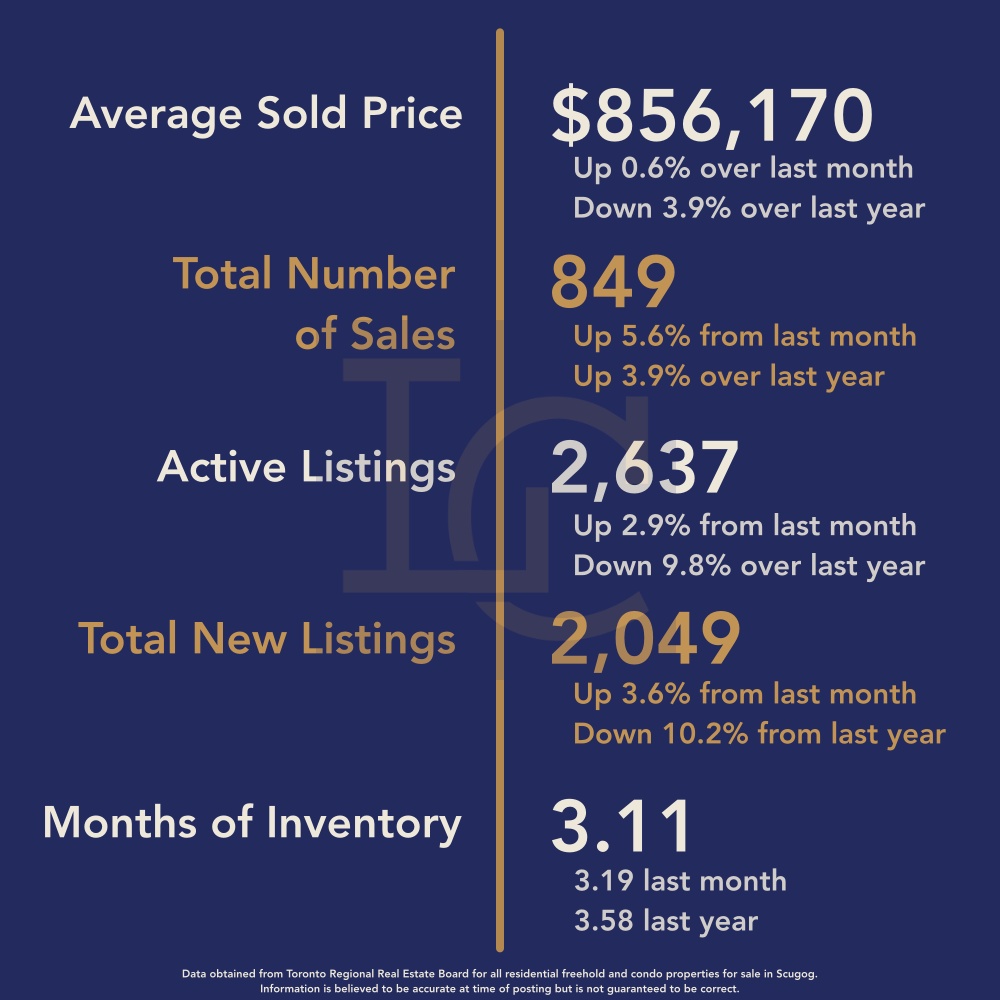
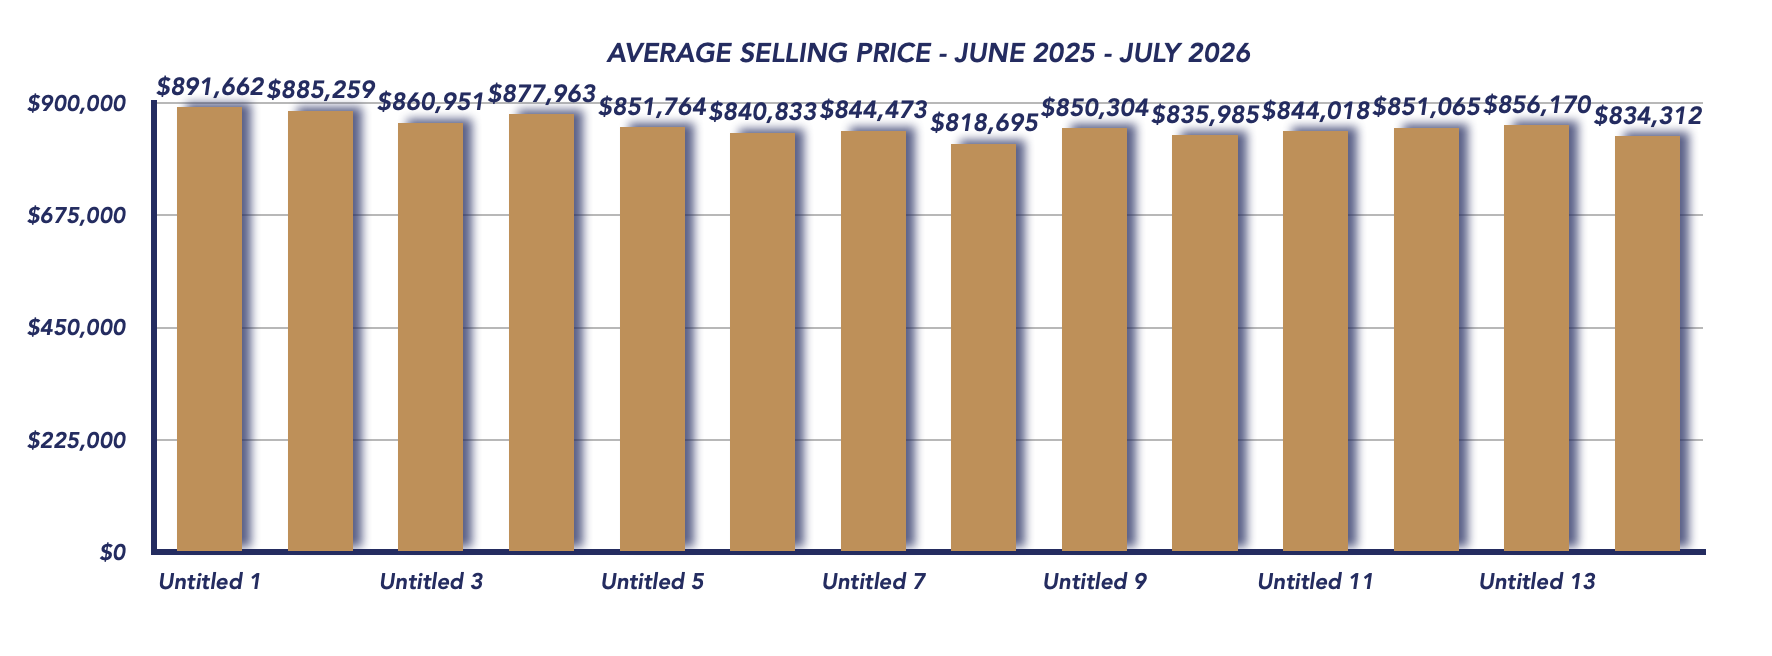
The average selling price in July was $834,312, down 2.6% from June’s $856,170 and 5.76% below July 2025’s $885,259.
After three consecutive months of modest price gains from April through June, July reversed some of that momentum. The year-over-year decline also shows that affordability and buyer confidence continue to influence pricing across Durham Region.
While one month does not establish a new trend, the July decline will be worth watching as we move through the remainder of the summer and into the fall market.
Sale-to-List Price Ratio Falls to 98%
The sale-to-list price ratio declined to 98%, compared with 99% in June and 99% in July 2025.
On average, this means properties sold for approximately 98% of their asking price. Buyers have more room to negotiate, and sellers need to pay close attention to pricing from the moment their property reaches the market.
In today’s environment, buyers have more time to compare properties and are less likely to overlook an overpriced listing. Homes that are presented well and priced according to current market conditions are better positioned to attract serious interest.
Sales Activity Slows After a Stronger June
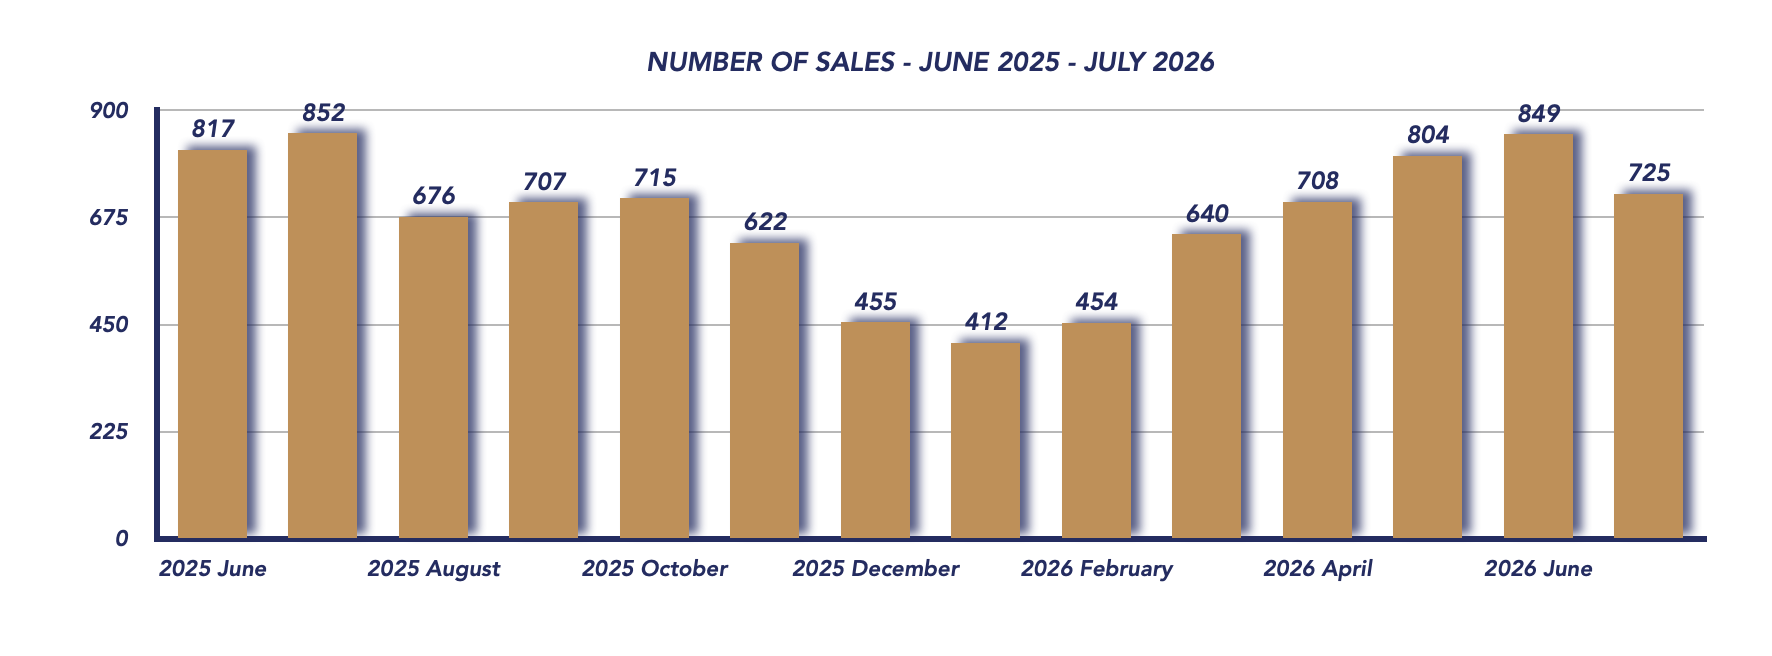
Durham Region recorded 725 sales in July, down from 849 in June and below the 852 transactions recorded in July 2025.
The month-over-month decline represents a noticeable slowdown following stronger spring activity. Sales were also approximately 14.9% lower year-over-year, indicating that buyer activity remains more subdued than it was at this time last year.
This is an important contrast to June, when sales had moved ahead of the previous year’s level. We’ll be watching closely to see whether July’s decline is primarily a summer pause or the beginning of a softer trend heading into the fall.
Homes Take Longer to Sell
The average property days on market increased to 43 days, compared with 36 days in June and 39 days in July 2025.
This is another indication that buyers are becoming more deliberate. Properties are taking longer to secure an accepted offer, making accurate pricing, presentation, and marketing increasingly important for sellers.
For buyers, longer selling times can create opportunities to negotiate, particularly when a home has been available for several weeks or the seller is motivated.
New Listings Decline Alongside Sales
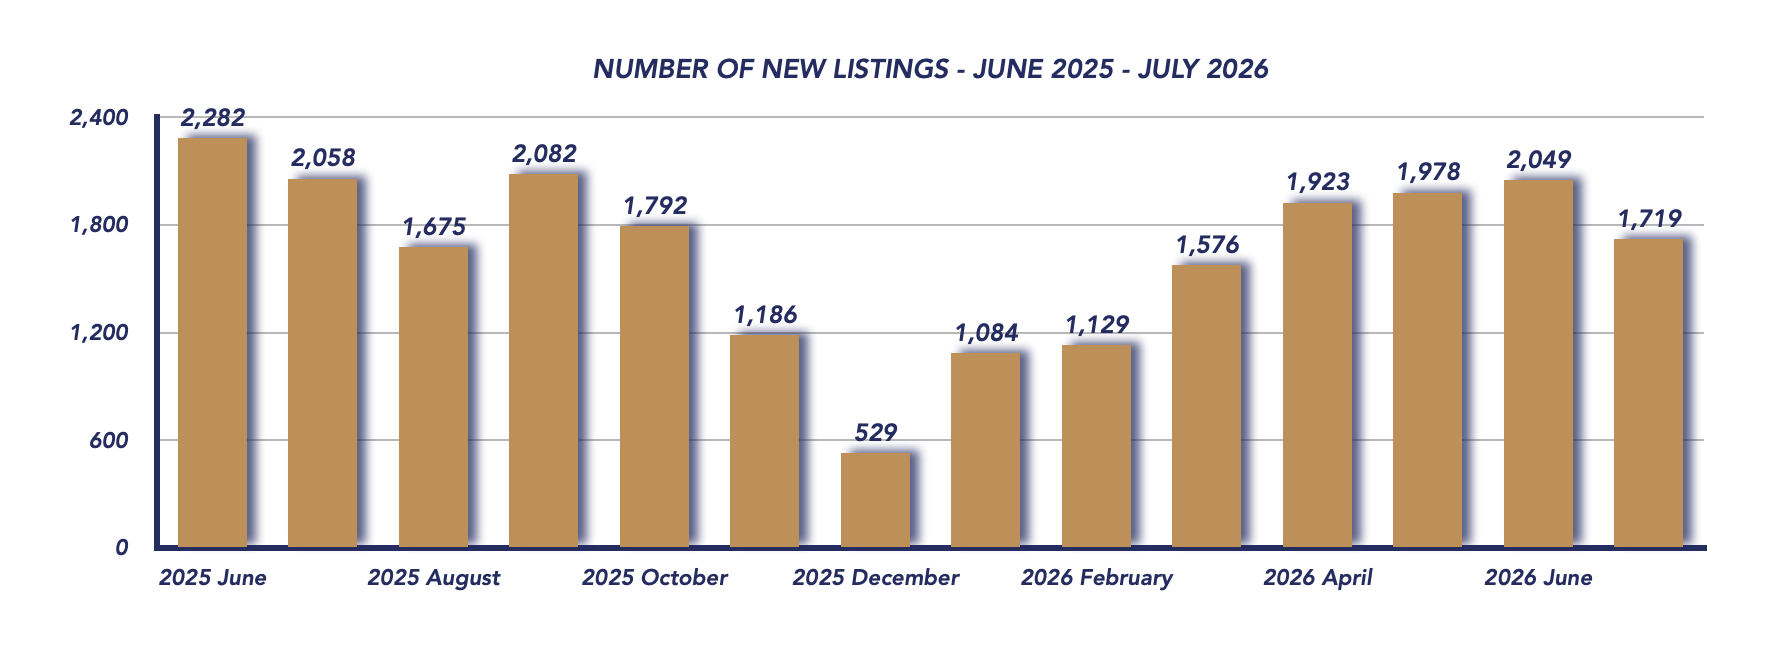
There were 1,719 new listings in July, down from 2,049 in June and 2,058 in July 2025.
The decline in new listings helped offset some of the impact of slower sales. Had listings continued to arrive at June’s pace while sales declined, inventory could have increased more substantially.
For buyers, there is still a reasonable selection of properties available, but fewer new homes coming to market may limit choice in certain neighbourhoods, property types, and price ranges.
Inventory Rises but Remains Balanced
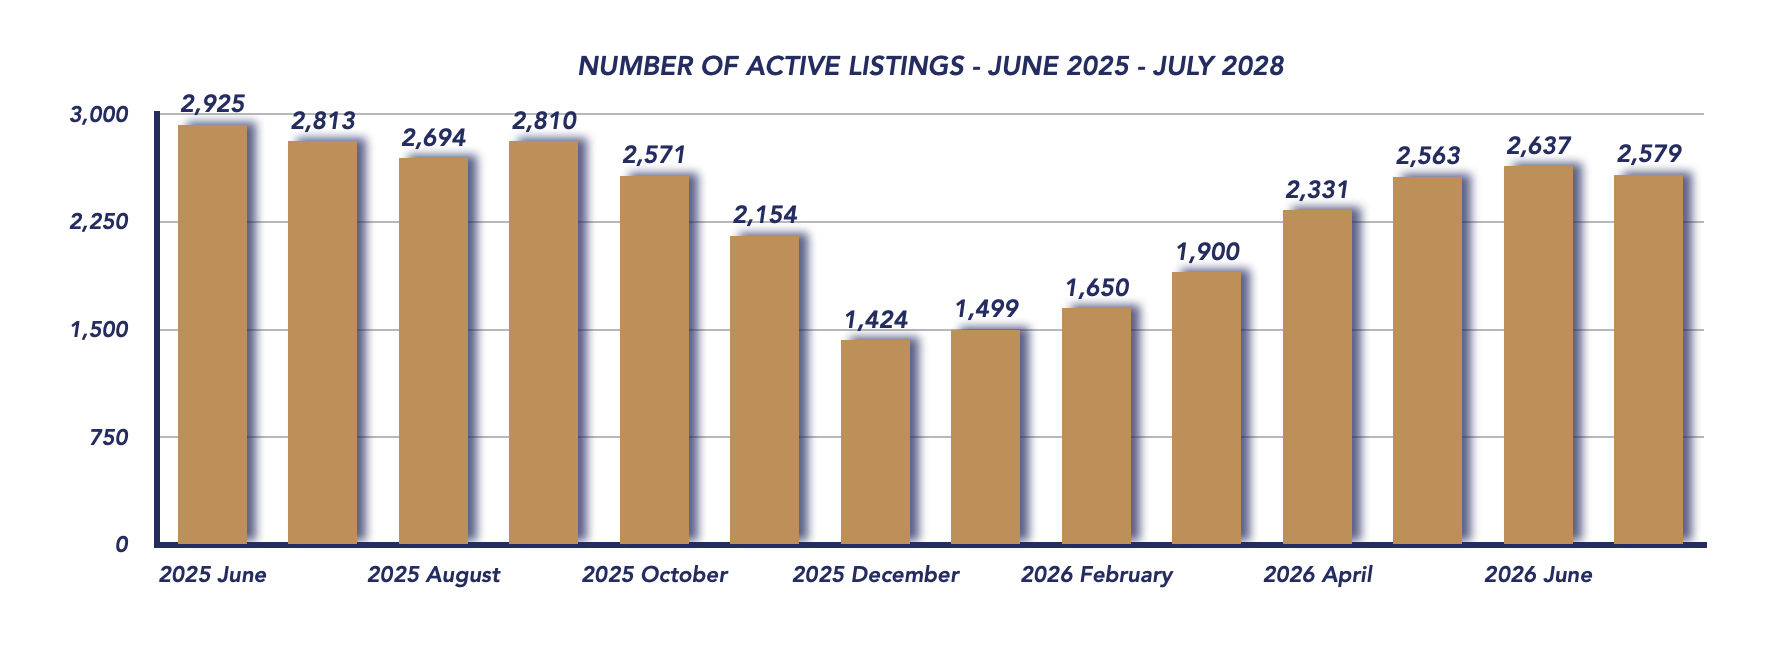
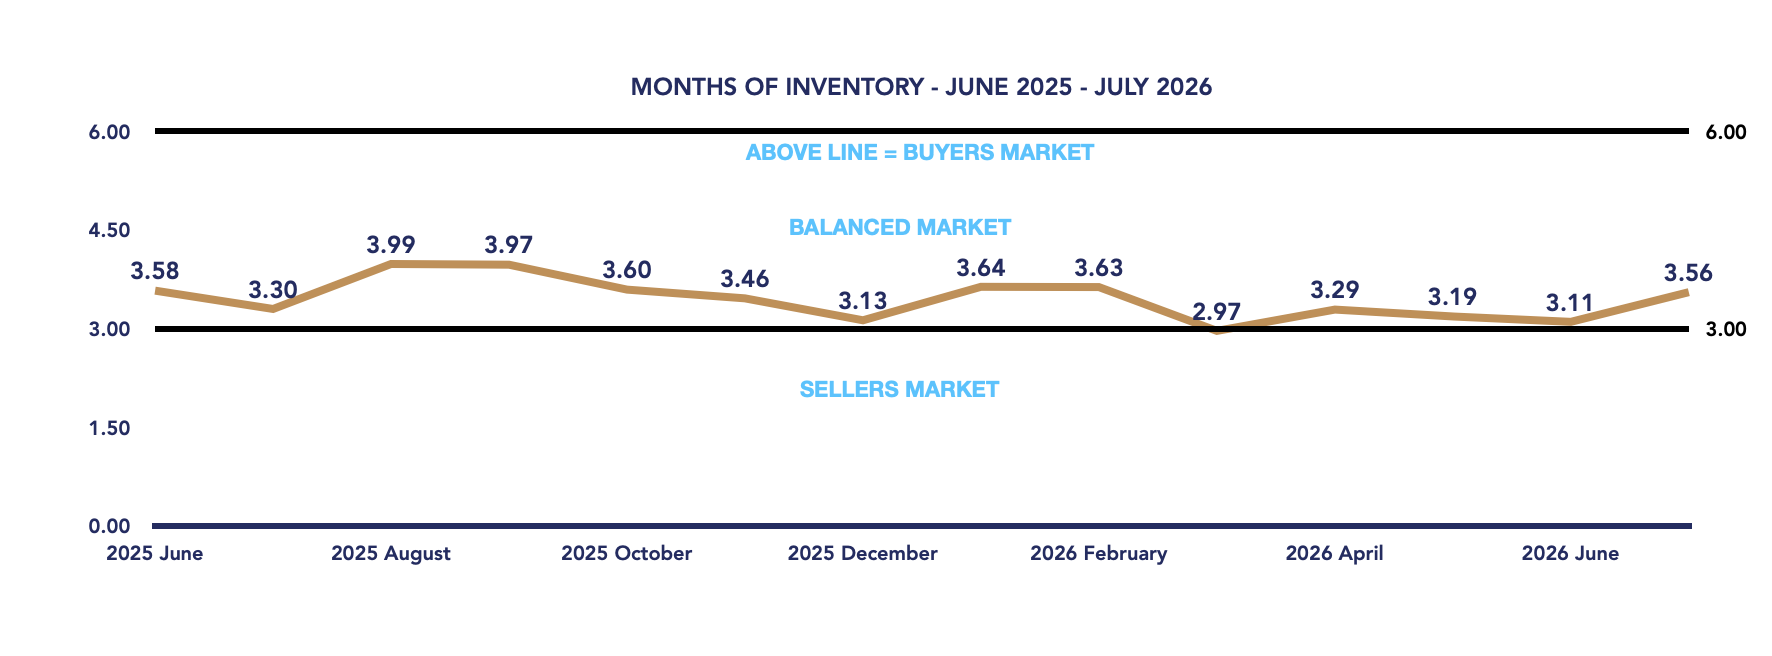
Months of inventory increased to 3.56, up from 3.11 in June and 3.30 in July 2025.
Despite the increase, Durham Region remains within balanced market territory. Supply and demand are still relatively well matched, although July’s movement indicates that conditions became somewhat more favourable for buyers compared with June.
The combination of slower sales, longer selling times, and a 98% sale-to-list ratio reinforces the importance of looking beyond any single statistic when assessing current market conditions.
Market Outlook
July interrupted some of the positive momentum we saw during the spring. Prices declined, sales slowed, homes took longer to sell, and months of inventory increased. At the same time, the number of new listings also fell significantly, preventing inventory from moving too far in favour of buyers.
The next few months should provide a clearer picture of where the Durham Region market is heading. Summer can naturally bring a change in activity as vacations and seasonal routines affect both buyers and sellers. The real test may come with the traditional fall market, when we see whether buyers return in greater numbers and whether sellers bring more inventory to market.
For now, Durham Region remains balanced, but July’s numbers suggest buyers have gained some additional negotiating power compared with earlier in the spring.
What This Means for Buyers vs. Sellers
For Buyers
July’s market offers buyers more breathing room. Homes are taking longer to sell, the average sale-to-list ratio has dropped to 98%, and inventory remains balanced. That can mean more time to consider options, conduct proper due diligence, and negotiate on price and terms.
However, fewer new listings came to market in July, so buyers shouldn’t assume every property will face the same conditions. Desirable homes that are priced correctly can still attract attention.
For Sellers
July reinforces the importance of pricing for today’s market rather than yesterday’s market. With sales lower, days on market higher, and homes selling below asking price on average, starting too high can make it difficult to generate momentum.
Sellers who understand their local competition, prepare their property carefully, and price strategically will be in a stronger position to stand out among available inventory.
The Bottom Line
The Durham Region housing market in July 2026 remains balanced, but conditions softened compared with June. Buyers have gained some negotiating leverage, while sellers need to be increasingly strategic about price and presentation.
As we move through the remainder of the summer, the key question will be whether July represents a seasonal pause or whether softer conditions carry into the fall market.
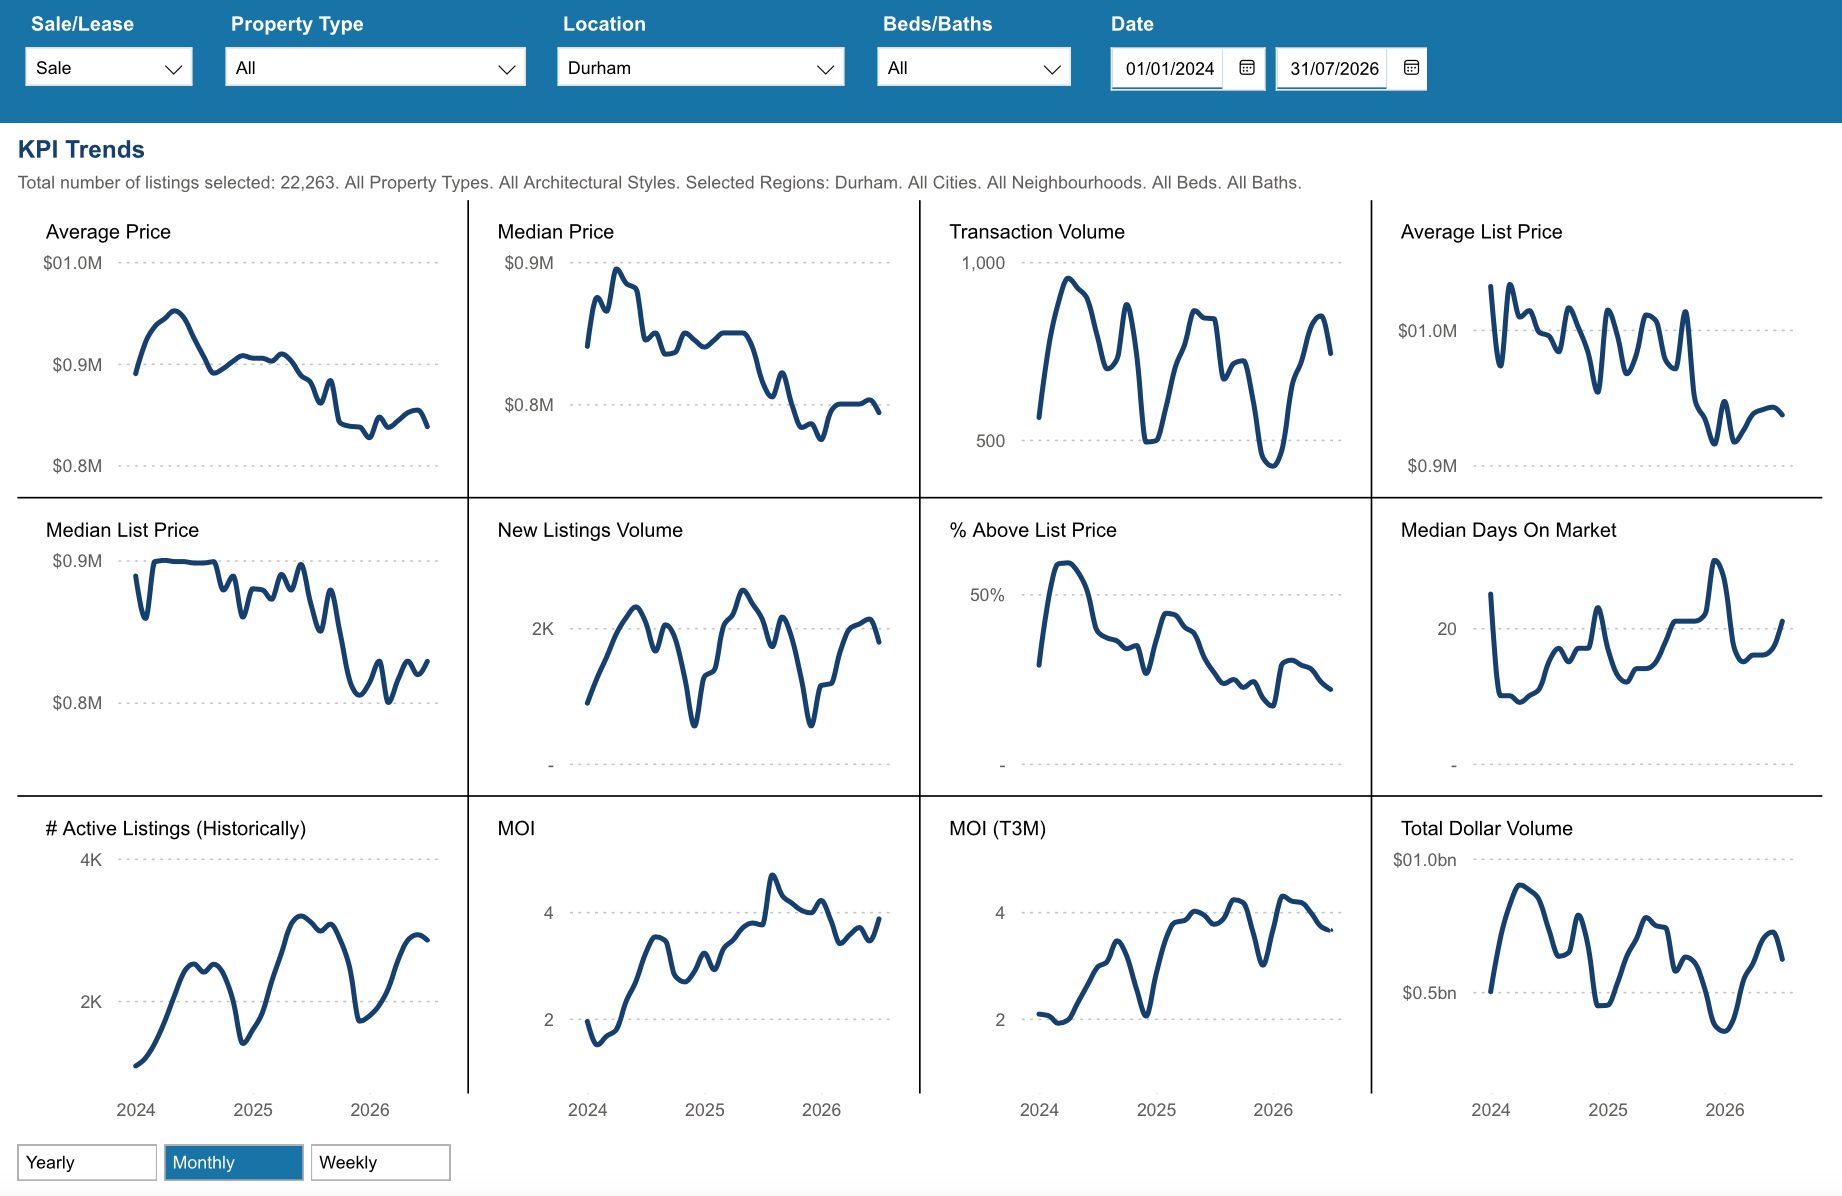
Key Performance Indicators (KPIs) from January 2024 through July 2026 provide a clear snapshot of how the Durham Region real estate market has evolved across all property types, architectural styles, and home configurations
*Information is believed to be accurate at time of posting but is not guaranteed to be correct. Some values may vary slightly based on the exact date and time the reports were generated. Market stats are provided by TRREB (Toronto Regional Real Estate Board) and are based on sales for the month of Attached/Row/Townhouses, Condo Apartments, Condo Townhouses, Detached, Detached with Common Elements, Link Homes and Semi-detached. *Some values may vary slightly based on the exact date and time the reports were generated.
Not intended as a solicitation if your property is already listed by another broker. Affiliated real estate agents are independent contractor sales associates, not employees. ©2021 Coldwell Banker. All Rights Reserved. Coldwell Banker and the Coldwell Banker logos are trademarks of Coldwell Banker Real Estate LLC. The Coldwell Banker® System is comprised of company owned offices which are owned by a subsidiary of Realogy Brokerage Group LLC and franchised offices which are independently owned and operated. The Coldwell Banker System fully supports the principles of the Fair Housing Act and the Equal Opportunity Act.
Click below for more reports
Check out our Uxbridge and Scugog Events Pages to keep up to date on whats going on around town. Click the links or scan the Code with your phone to take you directly there.
UXBRIDGE EVENTS
SCUGOG EVENTS


