Facebook
 X
X
 Pinterest
 Copy Link

Uxbridge Housing October 2025

Each office is independently owned and operated
![]()

![]()
Housing Market Report for October 2025
Here is the Township of Uxbridge Housing October 2025 report (all housing types), with reports from the Canadian Real Estate Association, and Toronto Regional Real Estate Board included.
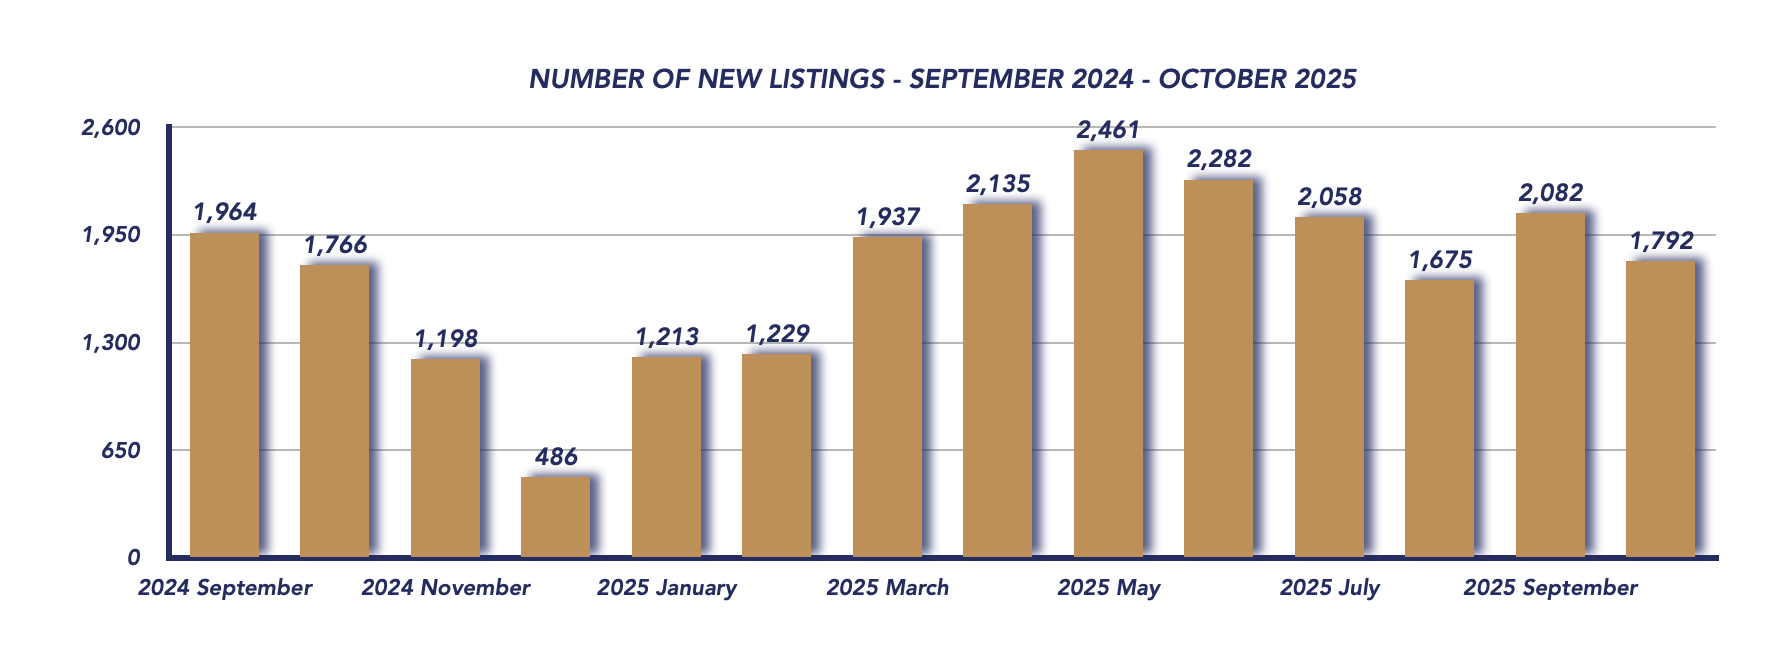
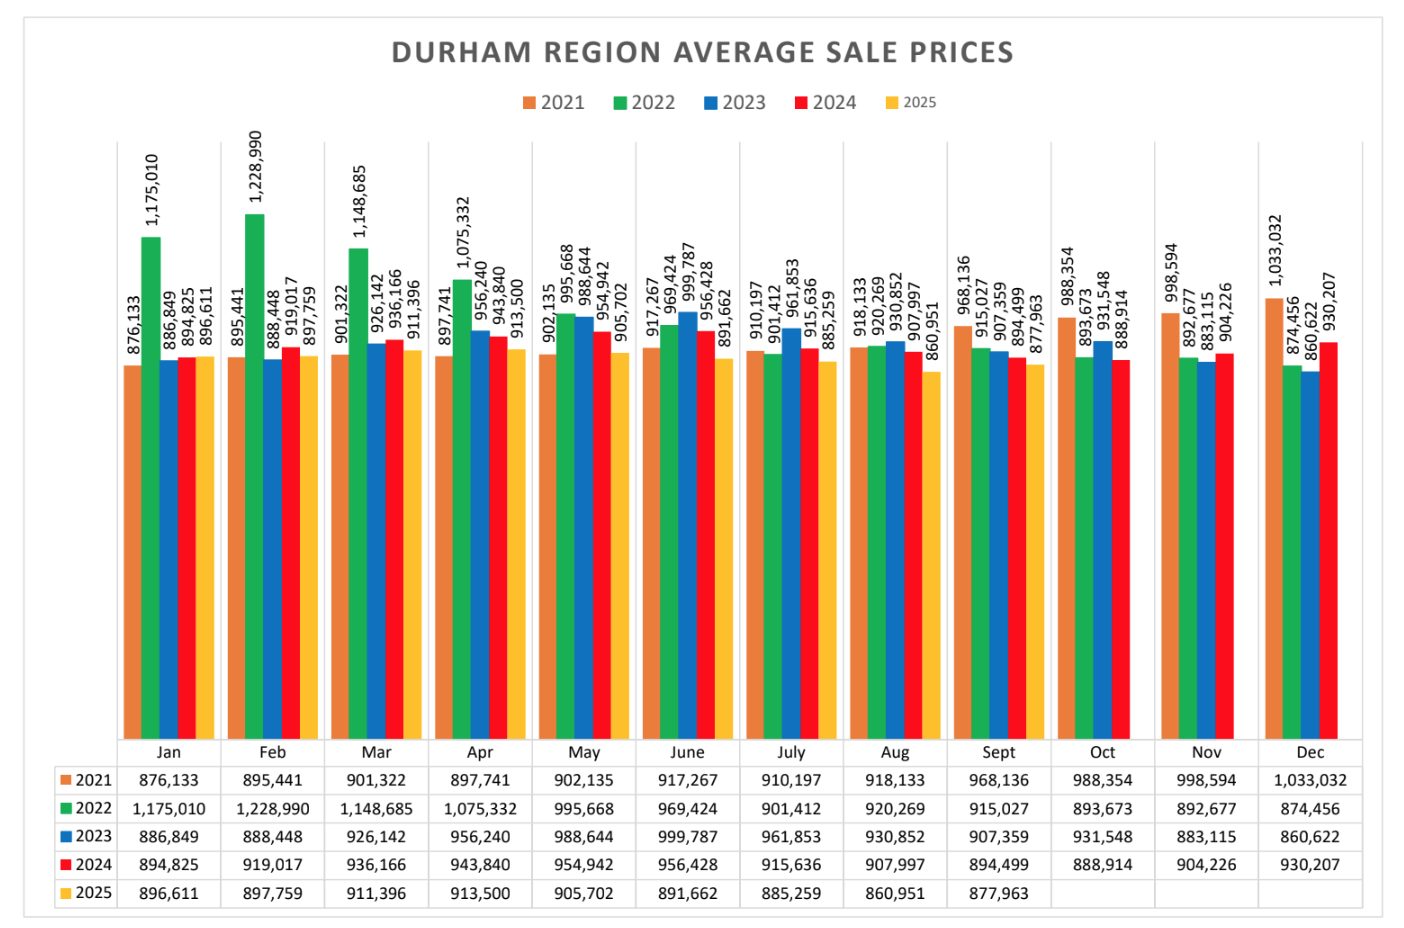
This housing report for Durham Region includes the number of new listings, average list price, number of properties sold, average selling price, average days on market and average asking price to selling price ratio for all property types within the Region of Durham.
Scroll to the bottom for links to take you to the housing market reports for Durham Region, Scugog and Brock.
![]()
![]()

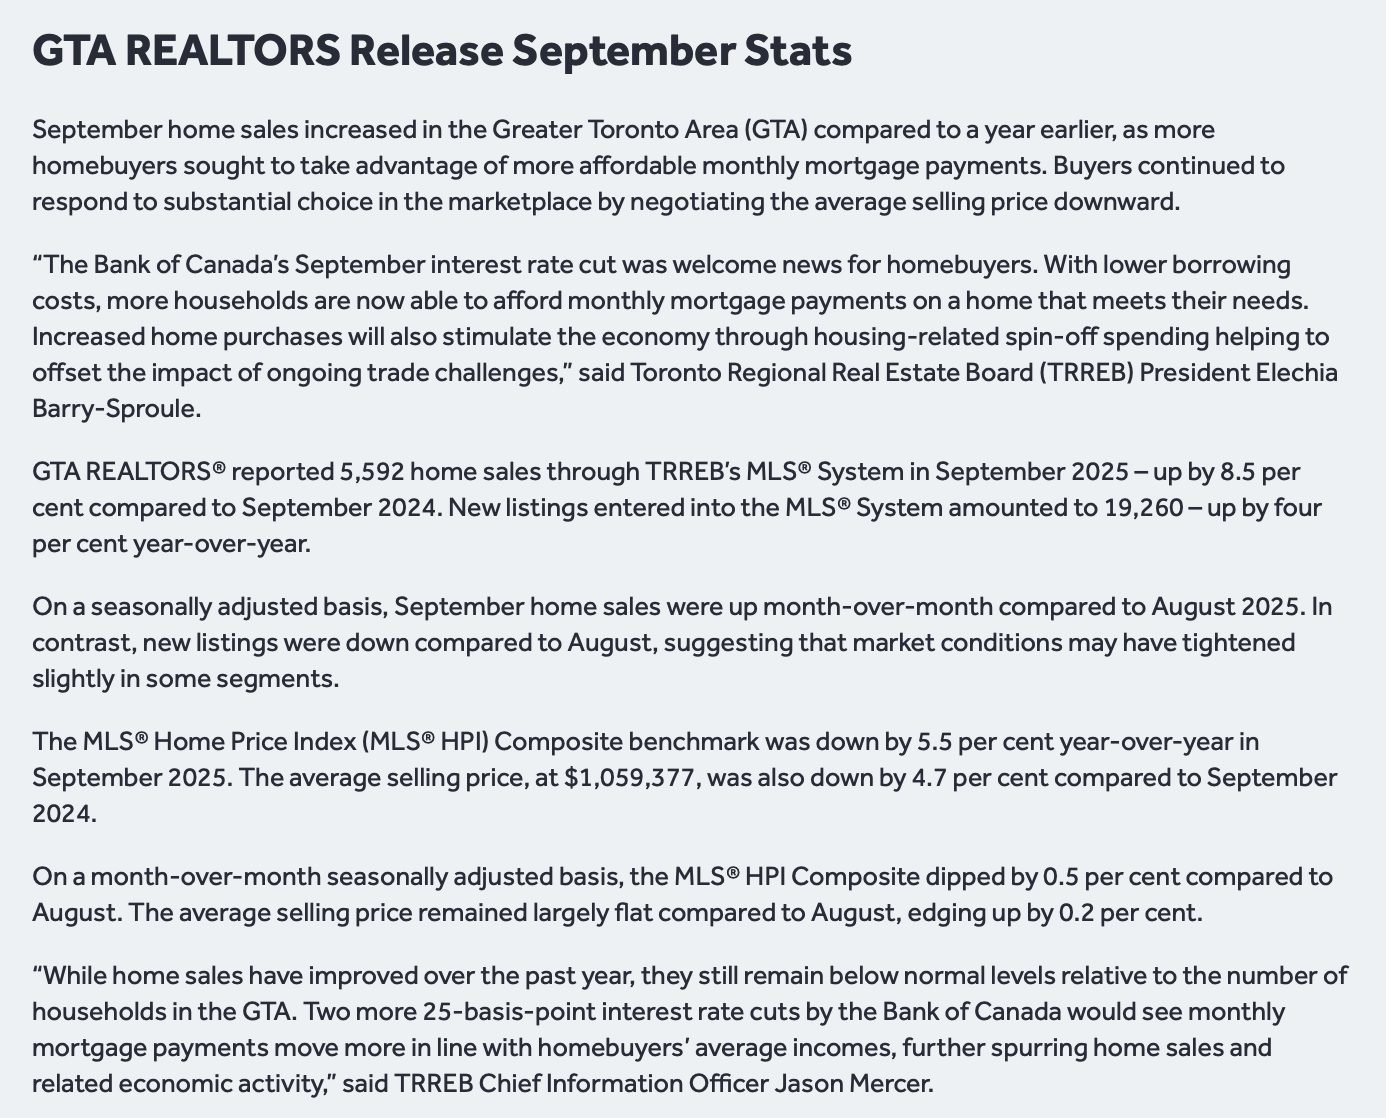
From Toronto Regional Real Estate Board
Please note: The PropTx MLS® System, of which TRREB is a part, has added a number of new client boards over the last year. Many of these boards’ Members trade within the Greater Toronto Area and broader Greater Golden Horseshoe regions. As a result, historic data have been updated to reflect the addition of these boards’ listings and transactions. This means historic data have changed relative to previously published static reports. To view updated historic data, click here.
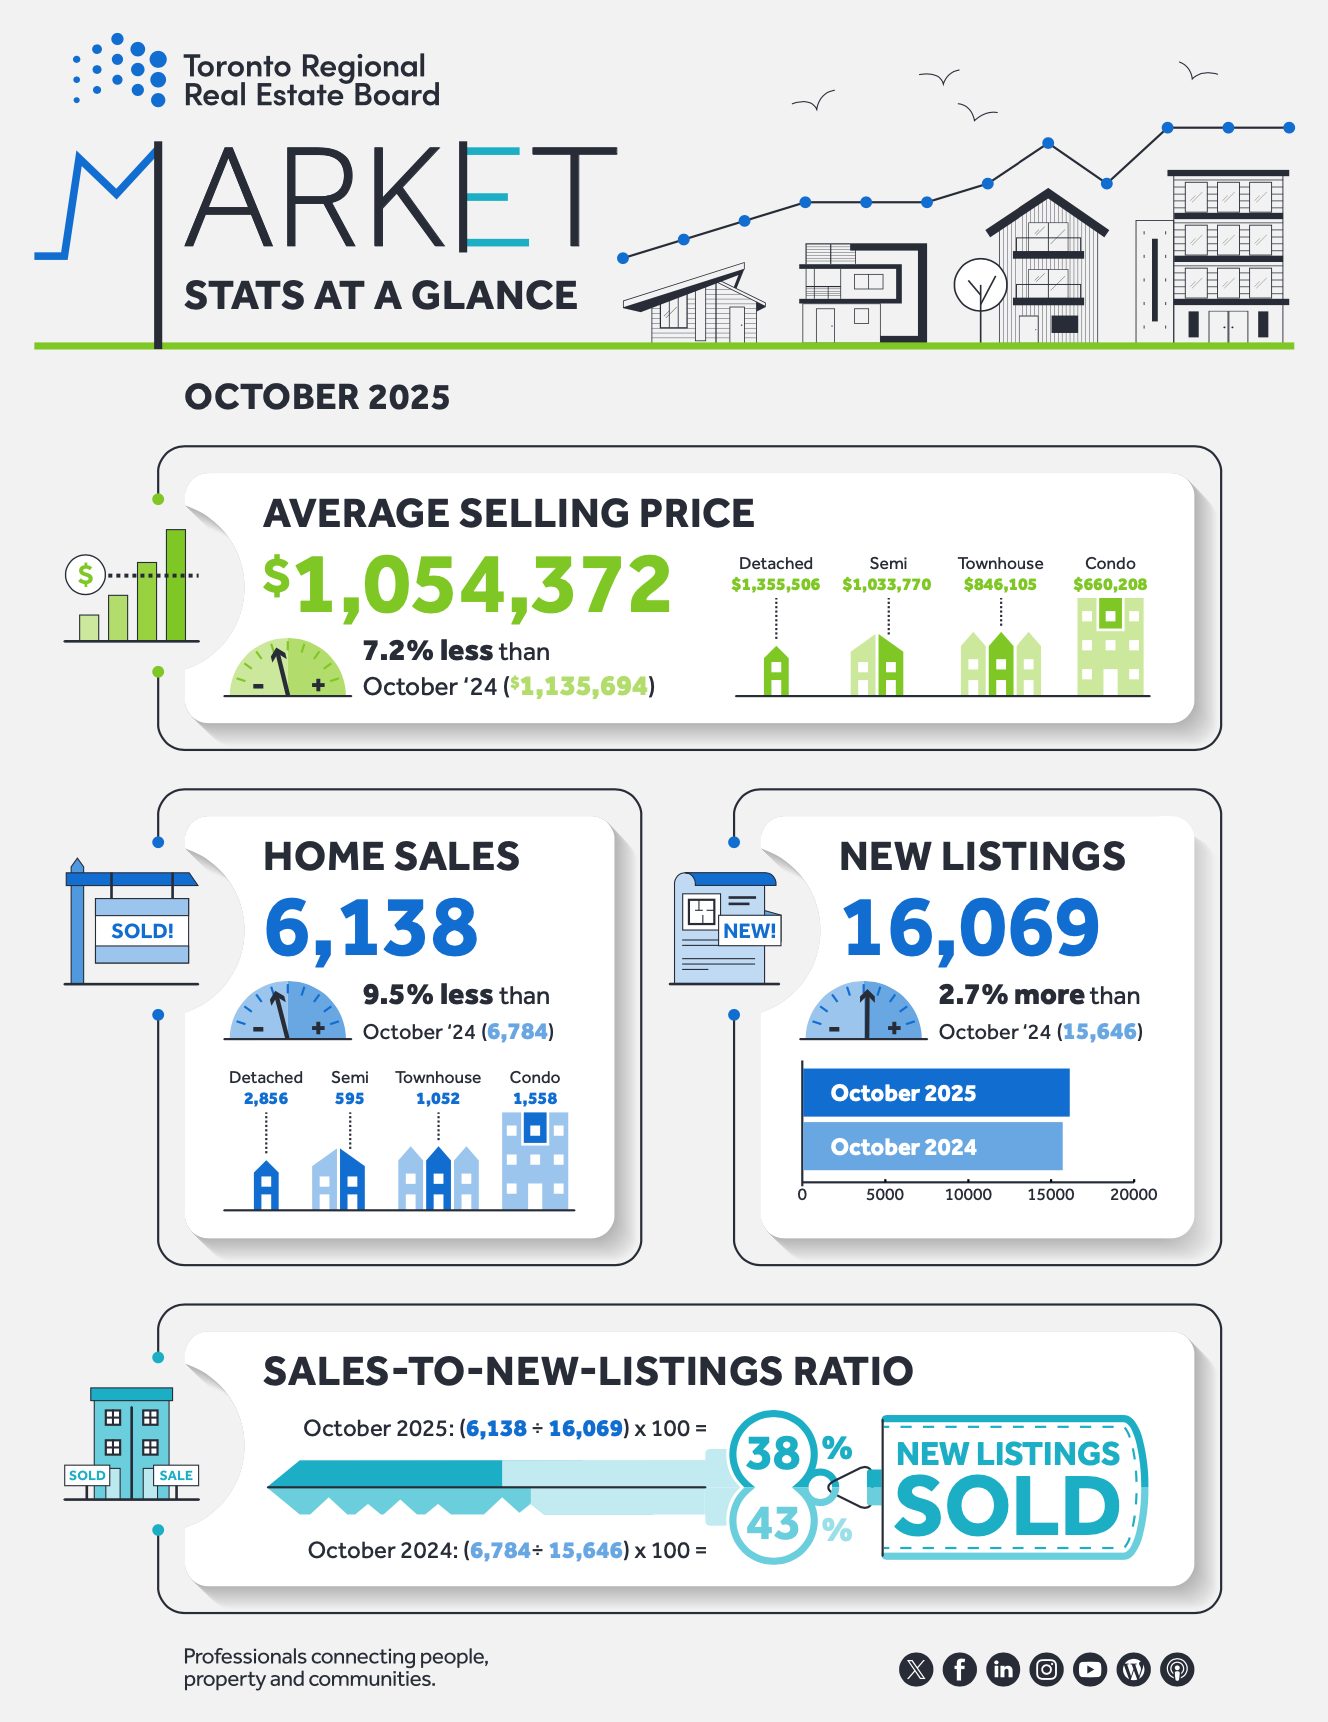
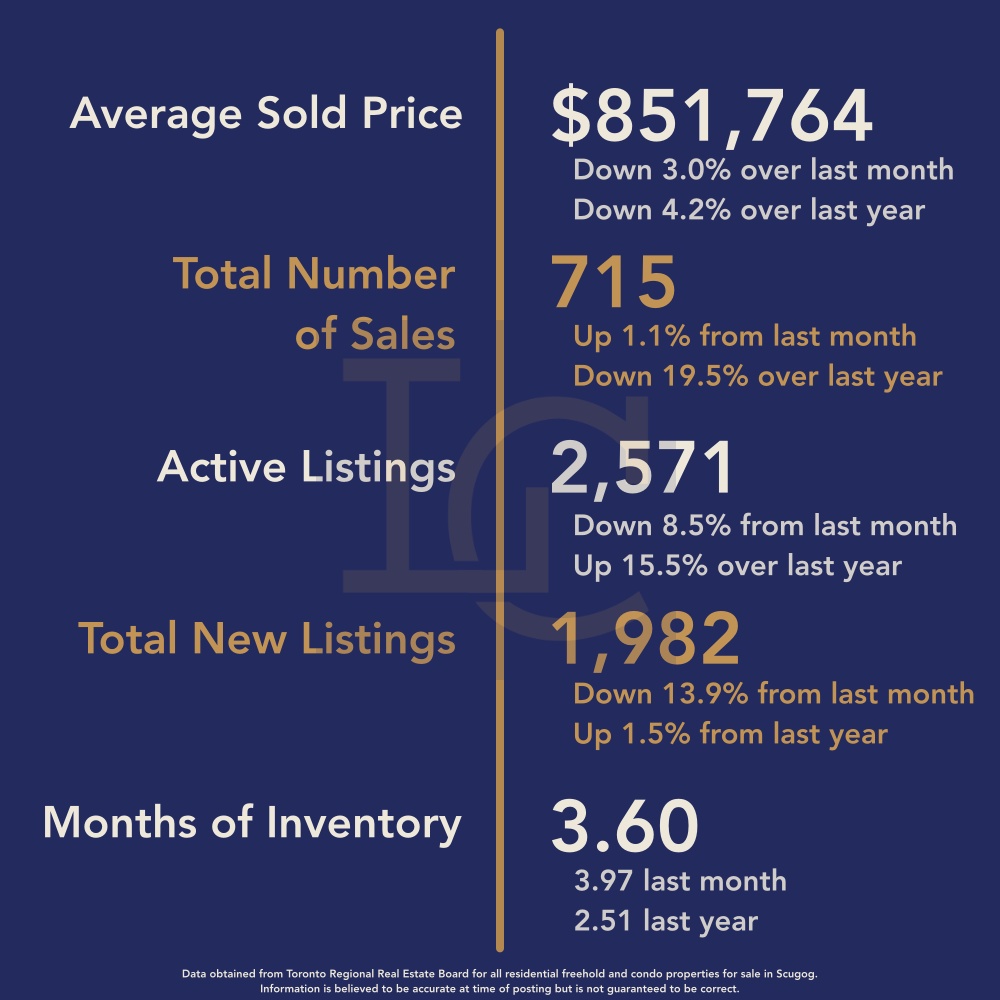
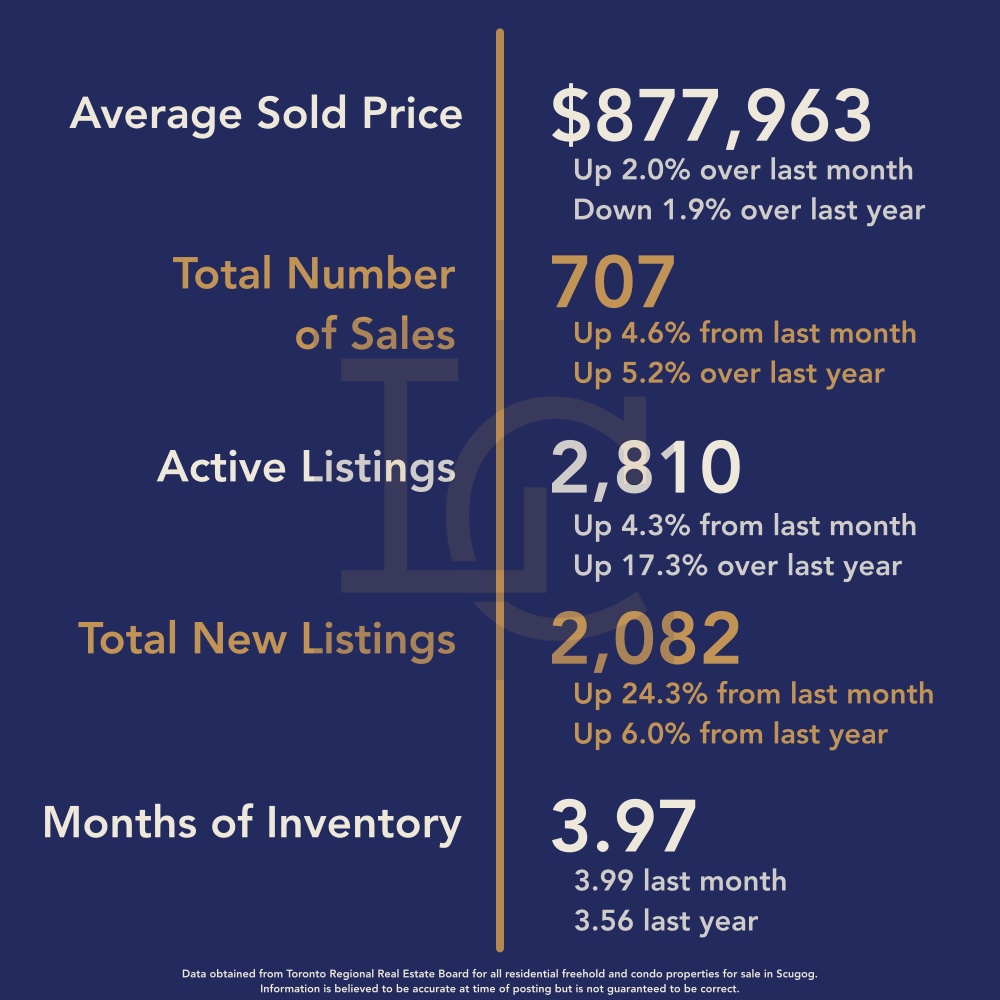
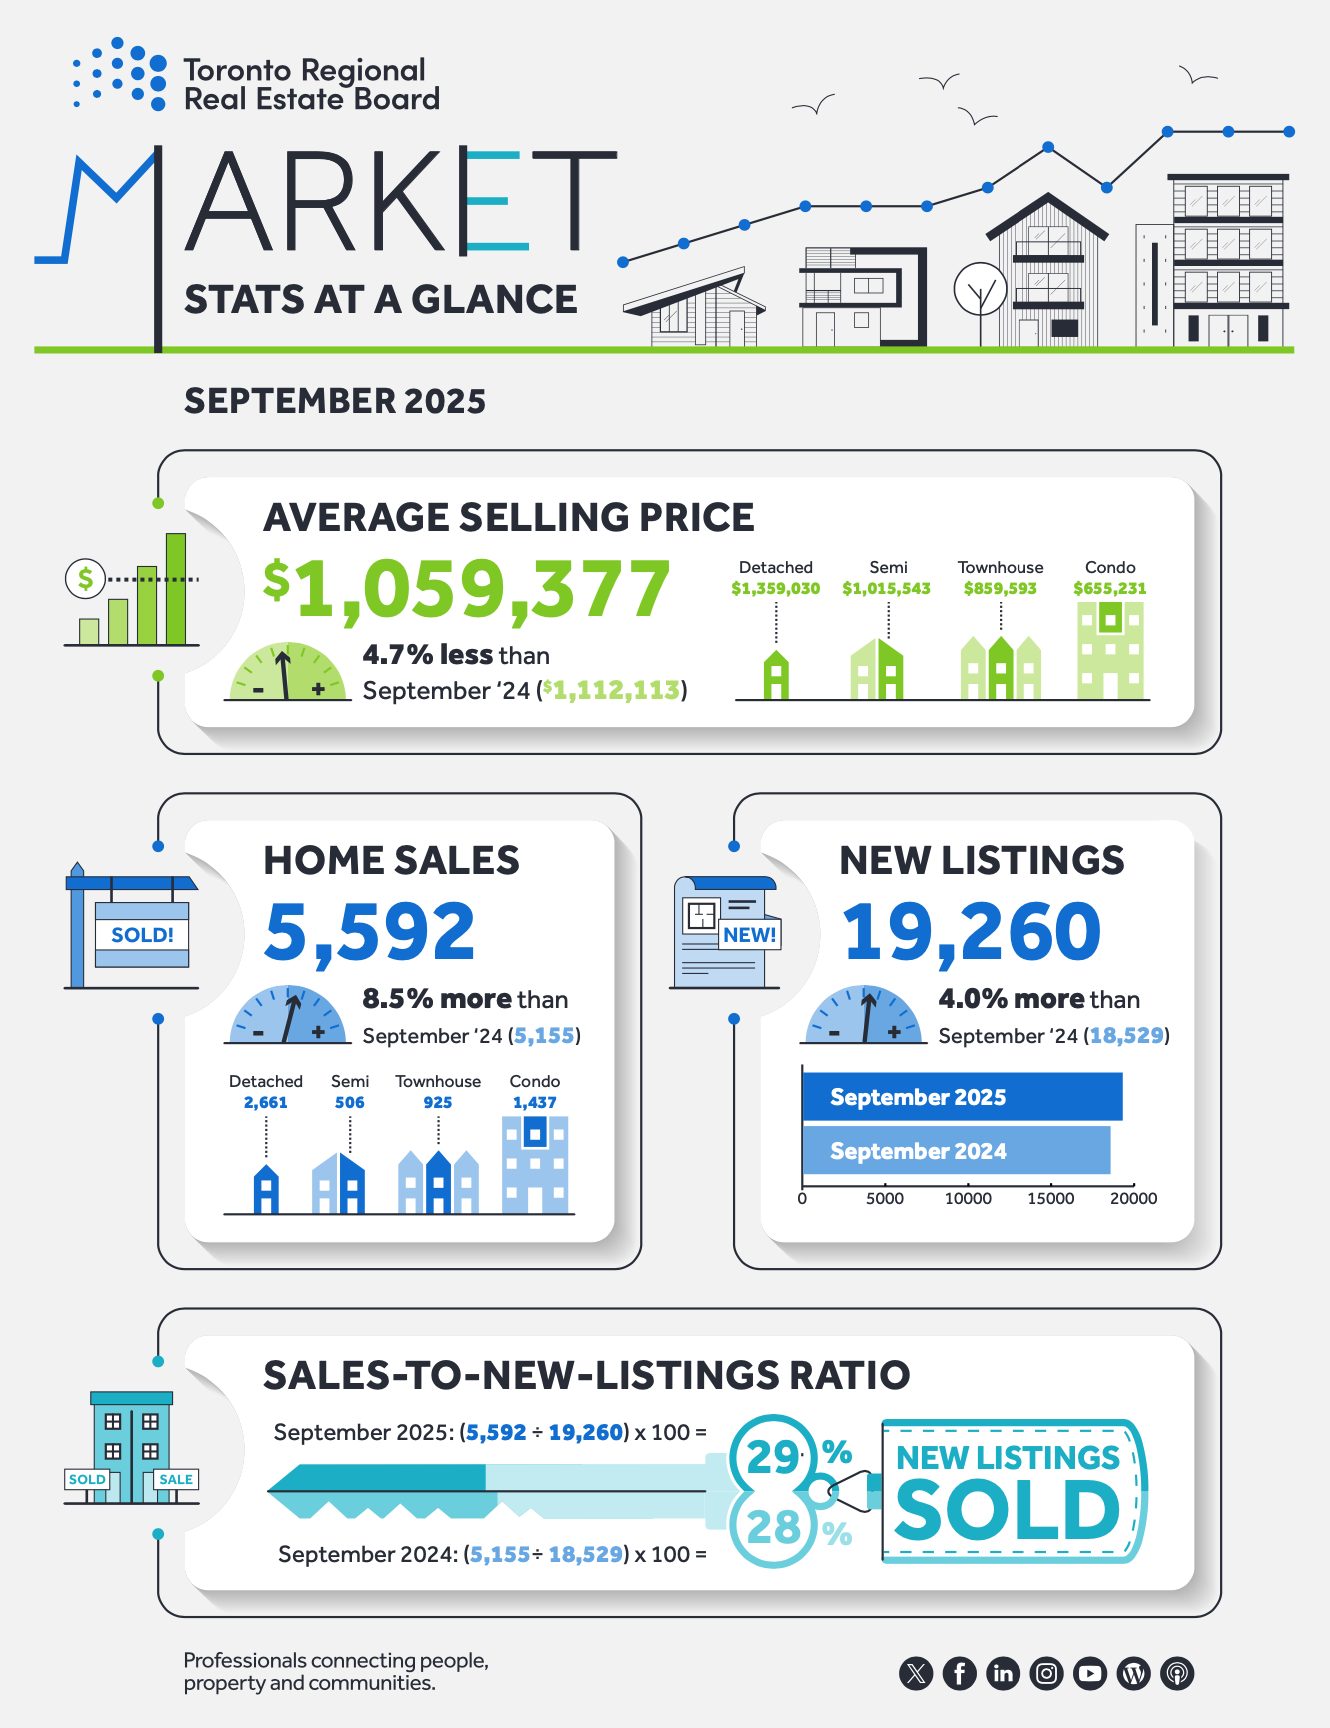
Toronto Regional Real Estate Board – Market Stats At A Glance – October 2025
Read the Toronto Regional Real Estate Board Market Watch Report
![]()
Uxbridge Township Real Estate Market Analysis
October 2025
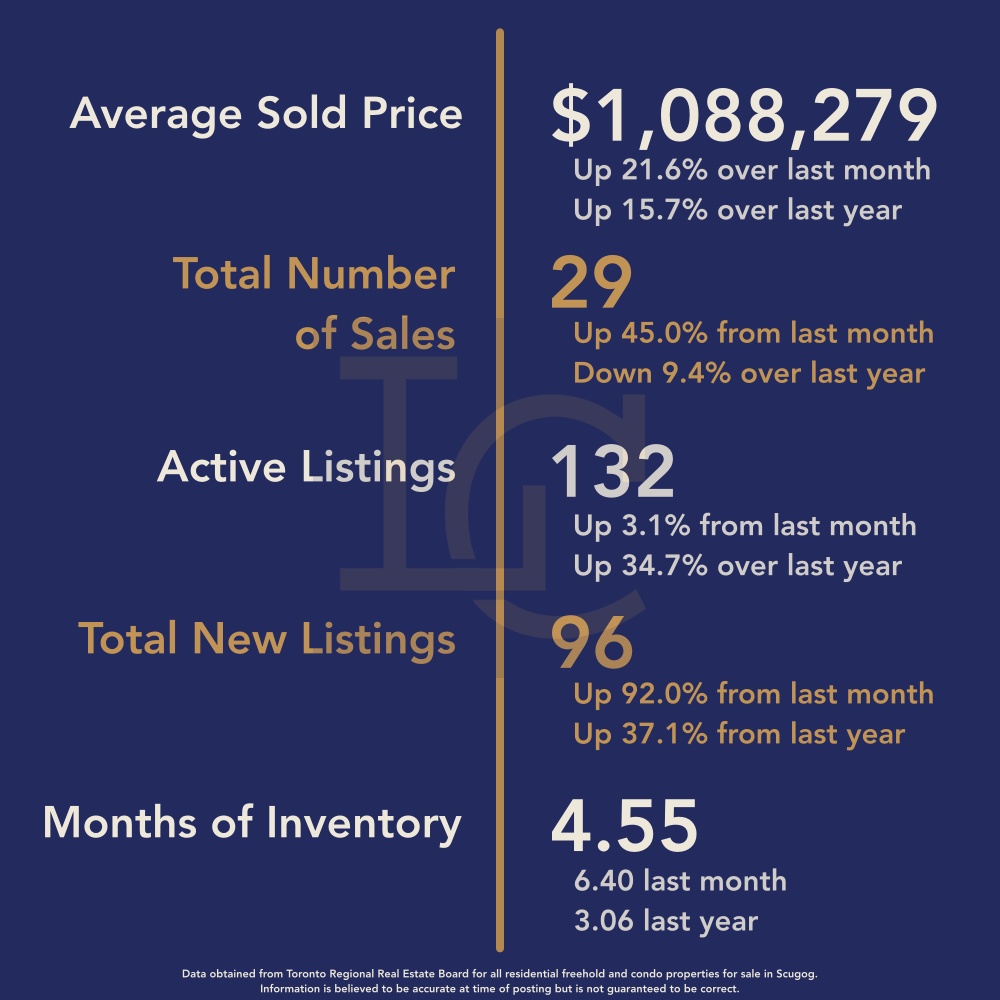
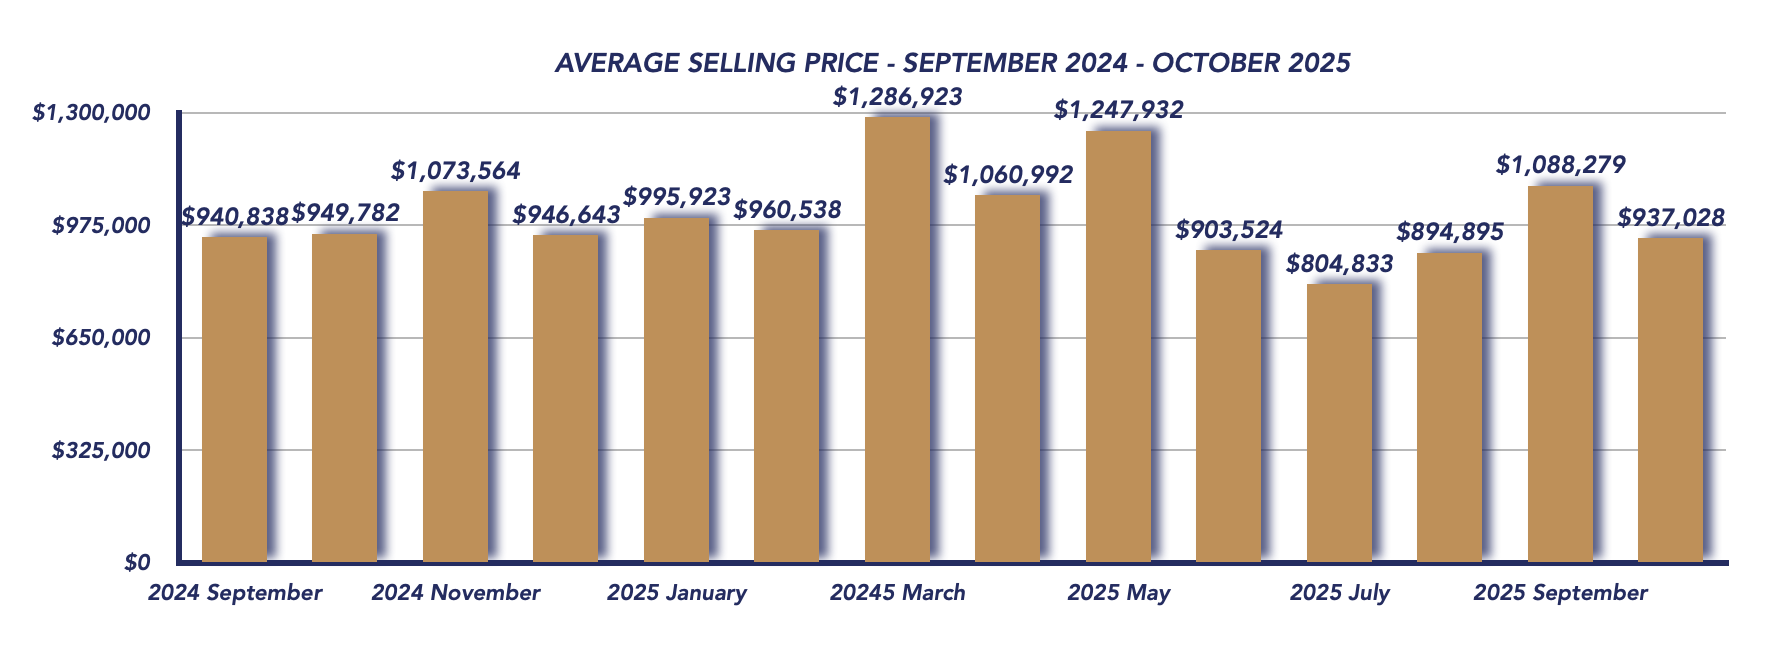
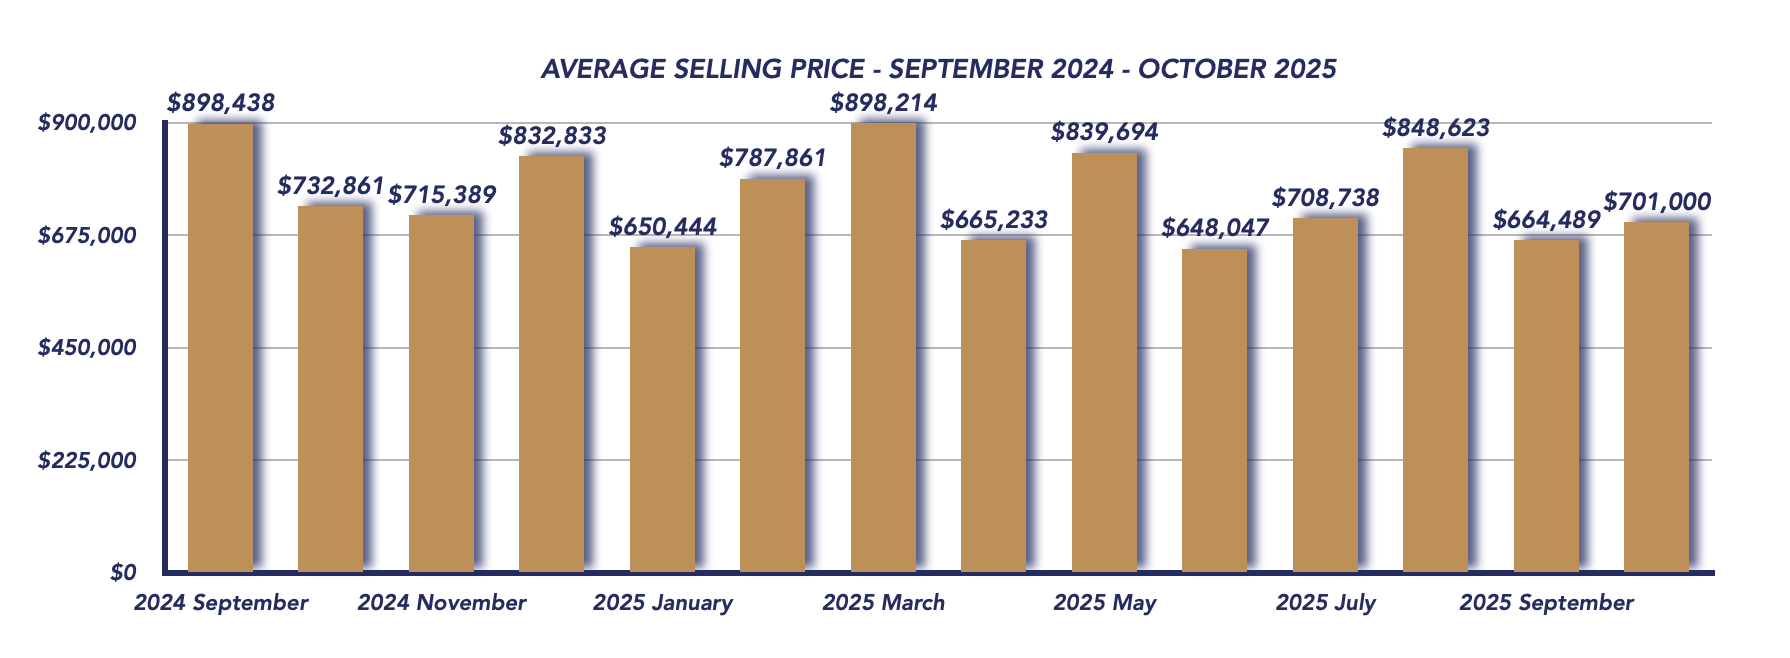
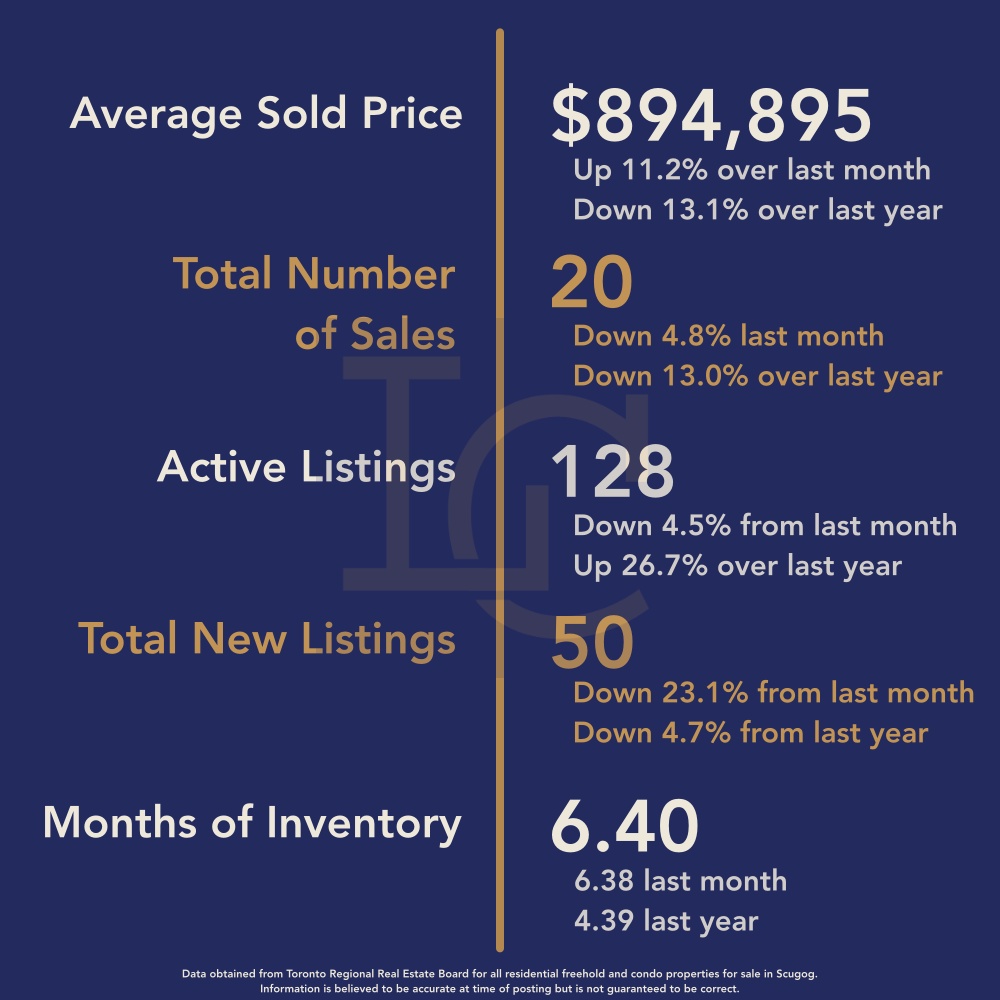
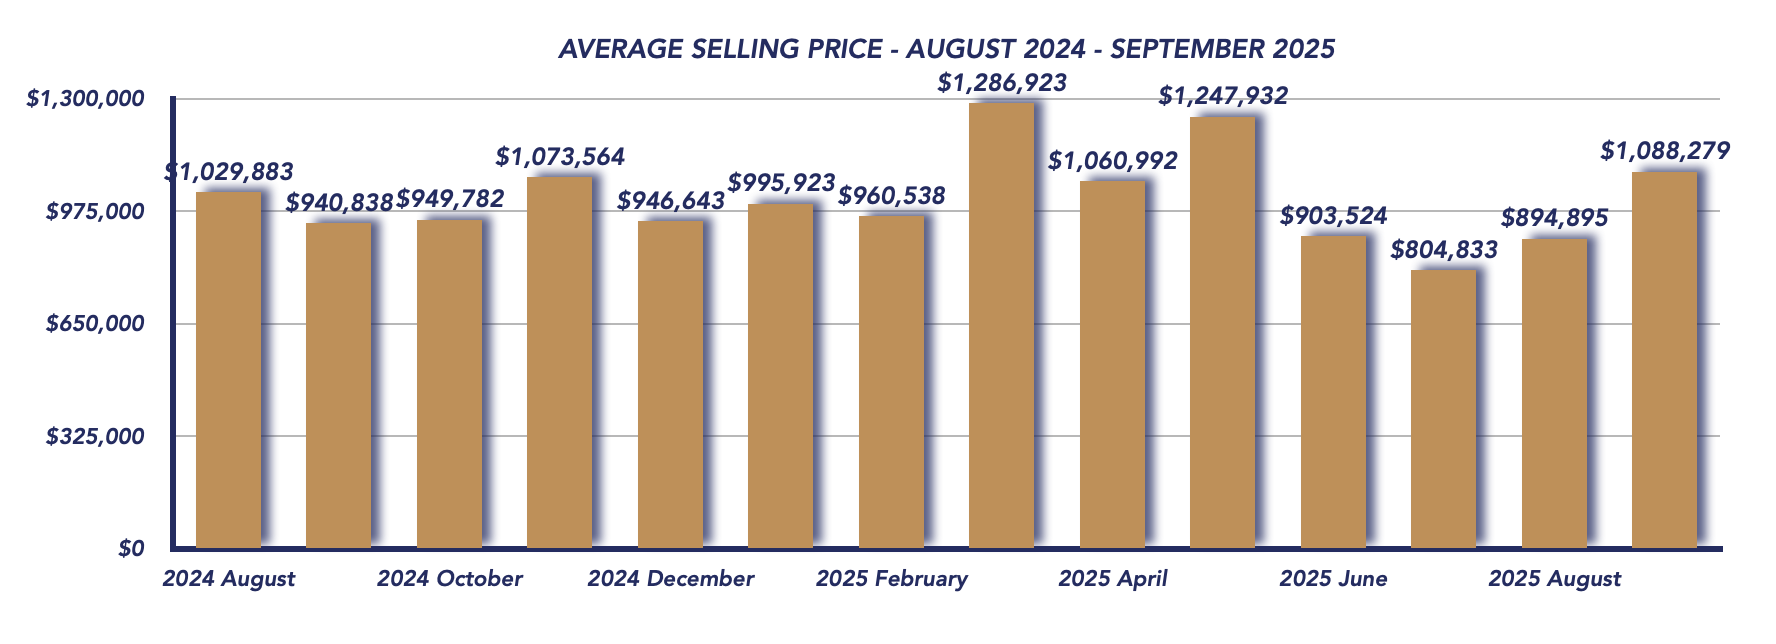
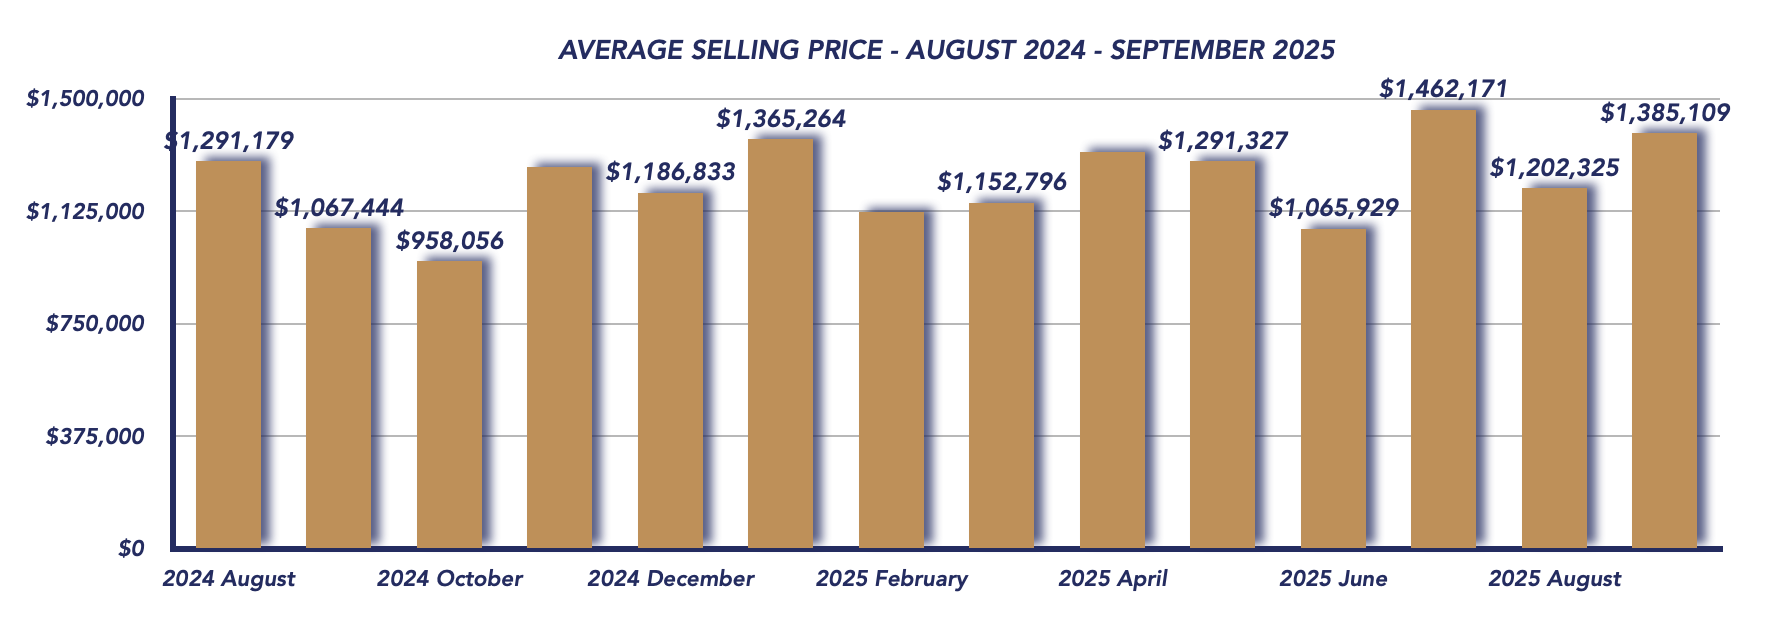
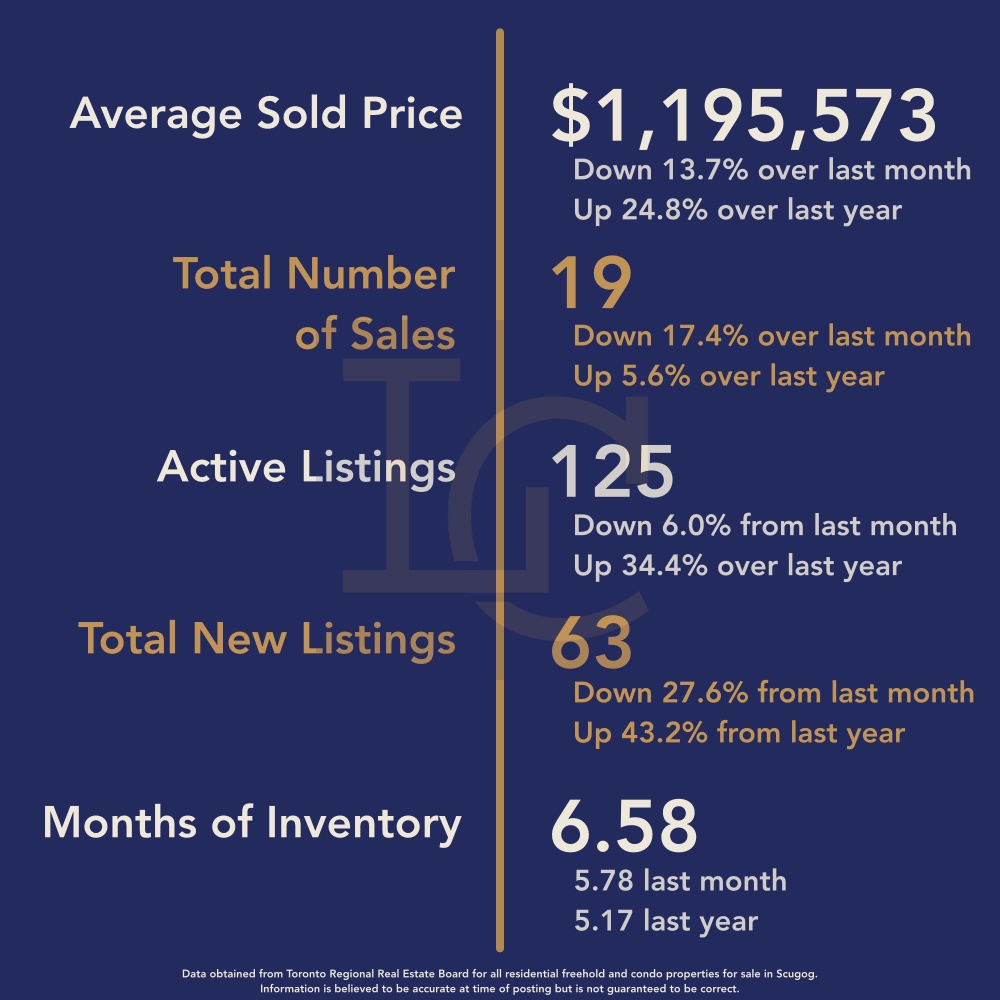
The Uxbridge housing market experienced a moderate cooldown in October 2025, following September’s surge in higher-end sales. The average sale price dropped to $1,195,573, down 13.7% from September’s $1,385,109, yet still up a significant 24.8% compared to October 2024’s $958,056.
October 2025
September 2025
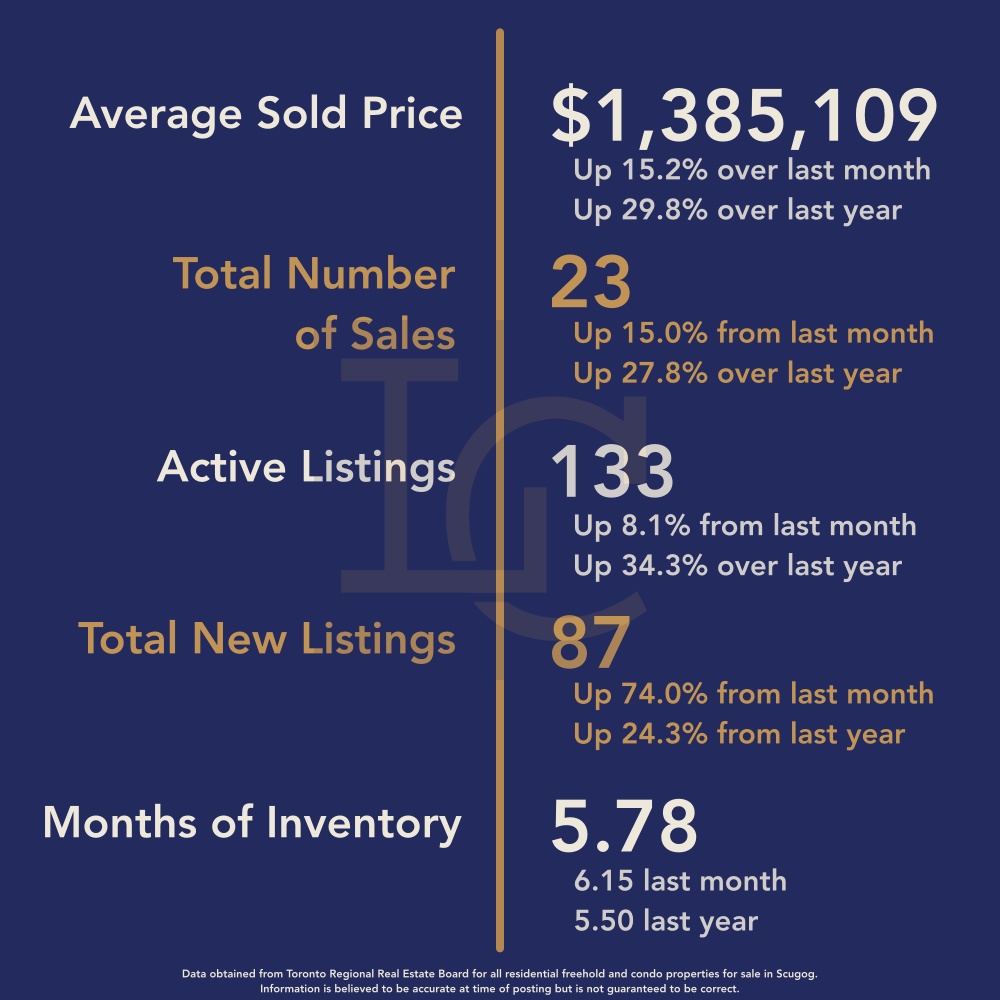
This month’s price decline reflects a shift in the composition of sales, with fewer luxury homes changing hands and more mid- to lower-priced properties contributing to the average. In September, there were two homes sold over $2 million and eight between $1.5M–$2M, while in October, just one property sold above $2 million, three sold between $1.5M–$2M, nine between $1M–$1.5M, and seven homes sold under $800,000.
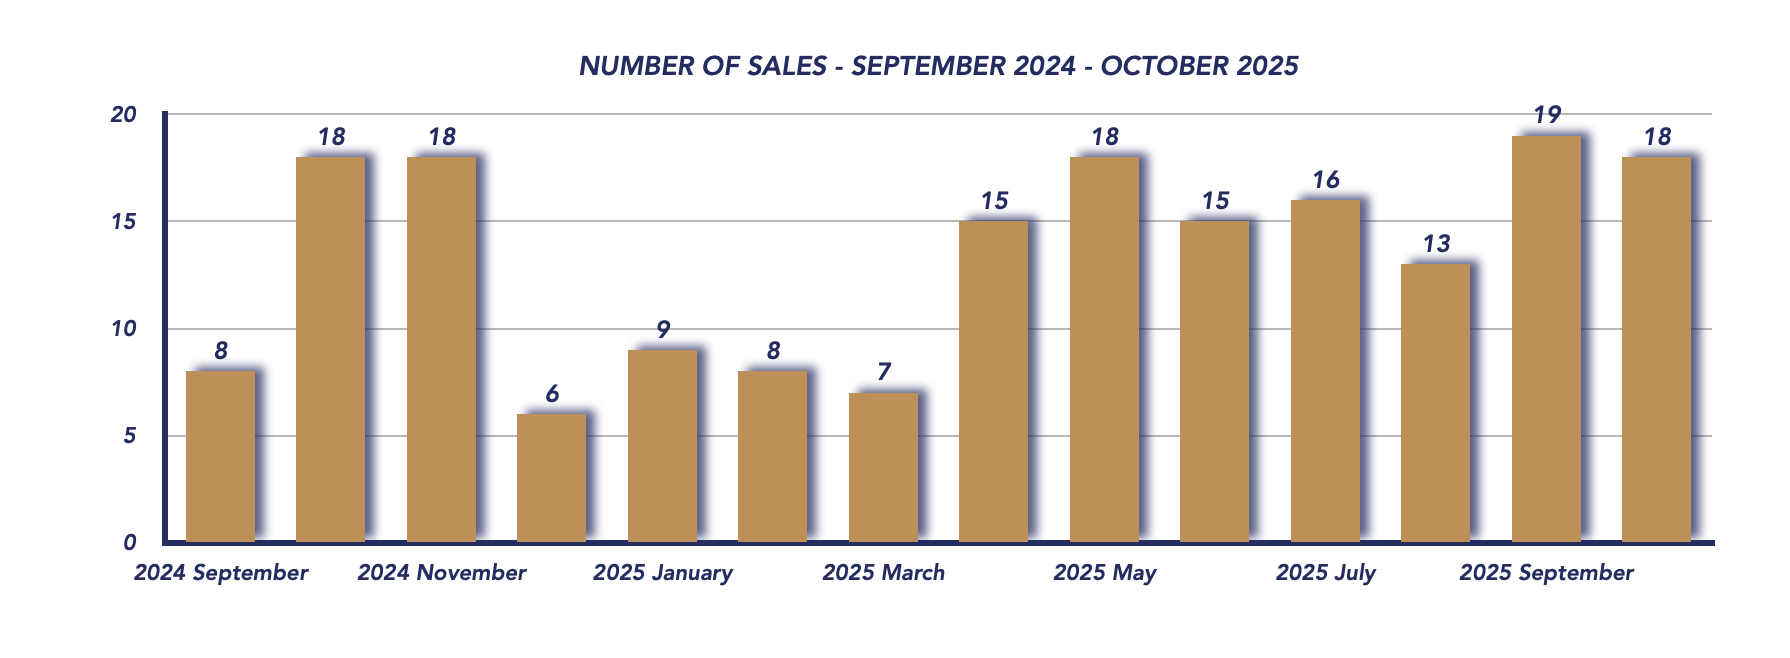
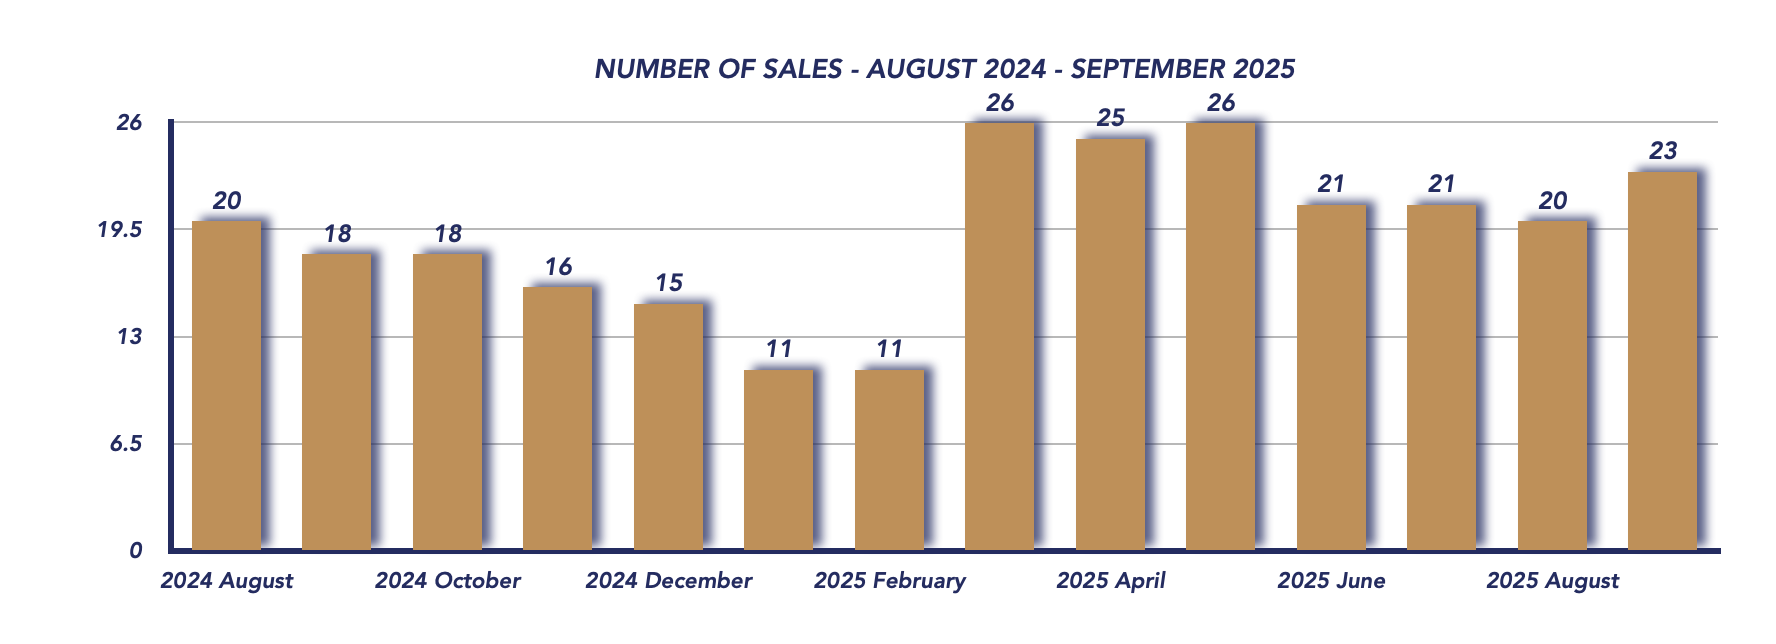
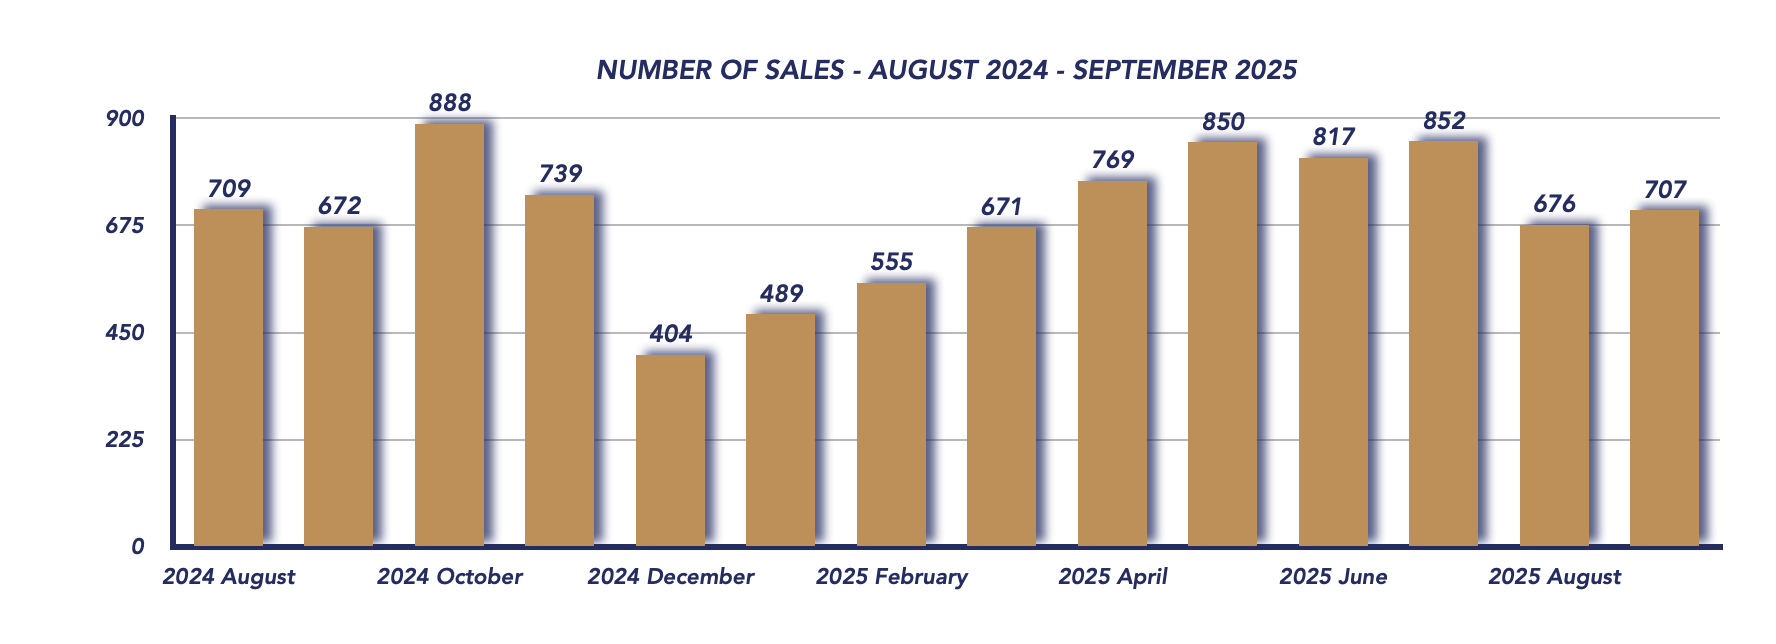
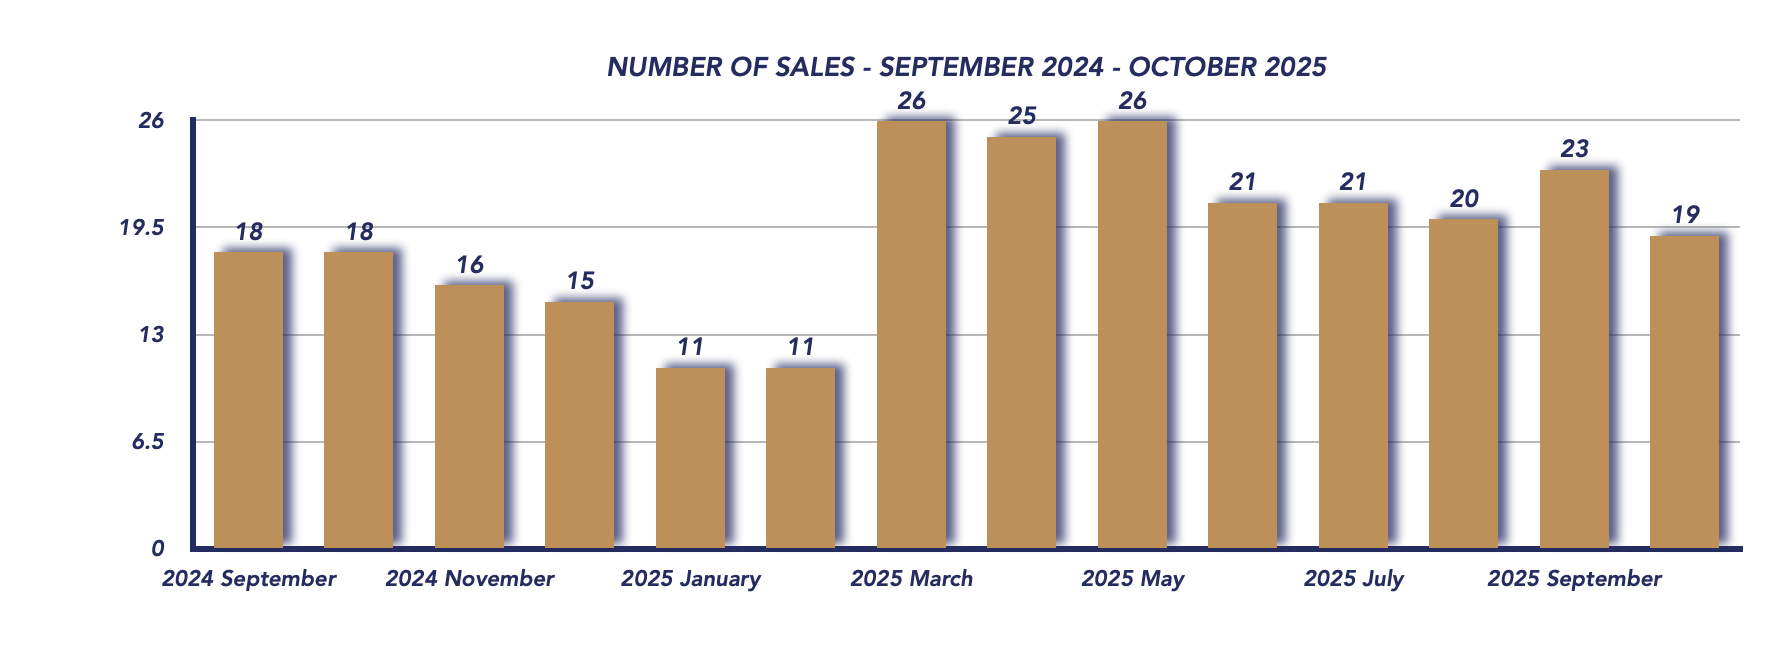
Sales Activity
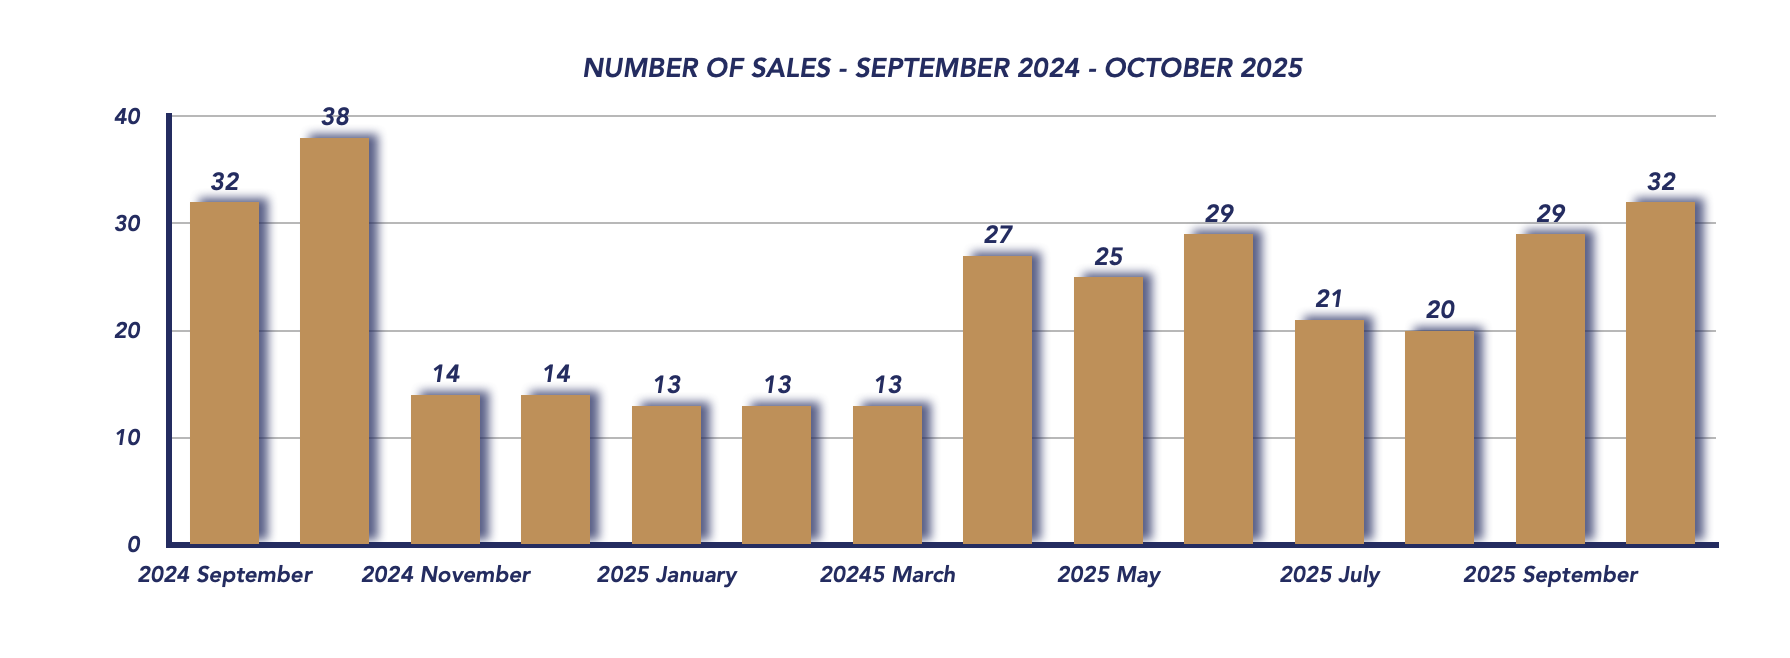
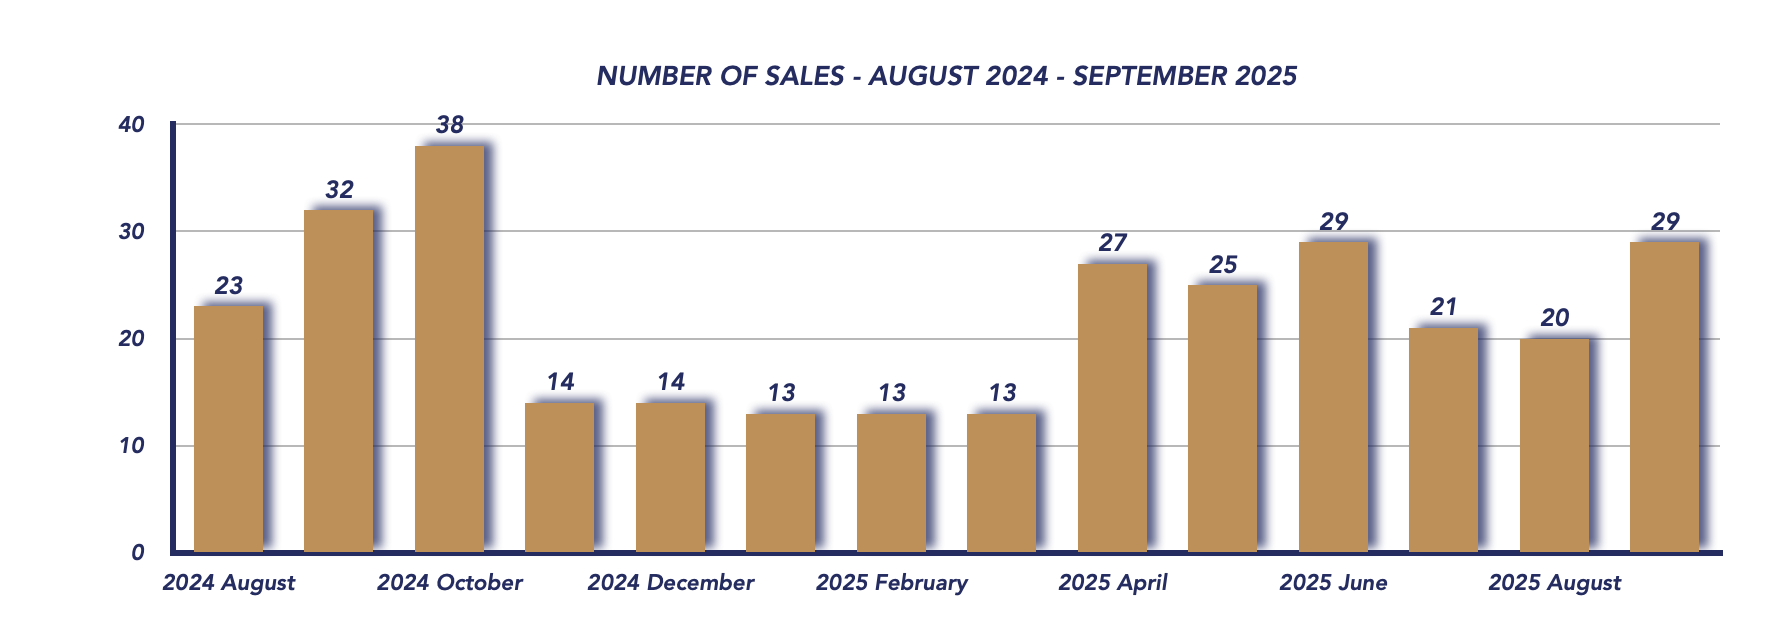
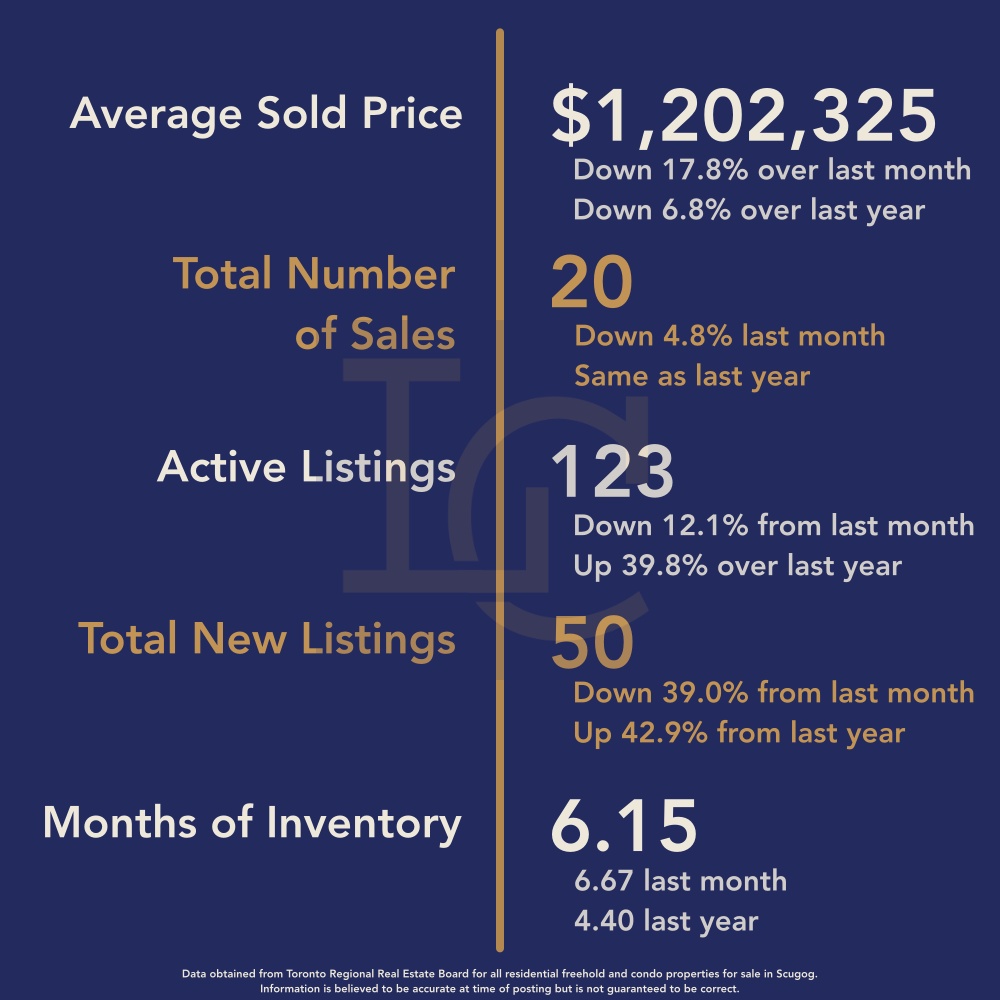
There were 19 home sales in October, down from 23 in September, but close to October 2024’s total of 18. While this represents a modest dip in monthly activity, the year-over-year consistency shows that buyer interest remains steady, even as affordability challenges persist.
Sale-to-List Price Ratio
The sale-to-list price ratio held steady at 96%, the same as last month. This consistency signals that sellers are continuing to adjust their expectations in line with market conditions, and buyers are still negotiating effectively in a more balanced-to-buyer-leaning market.
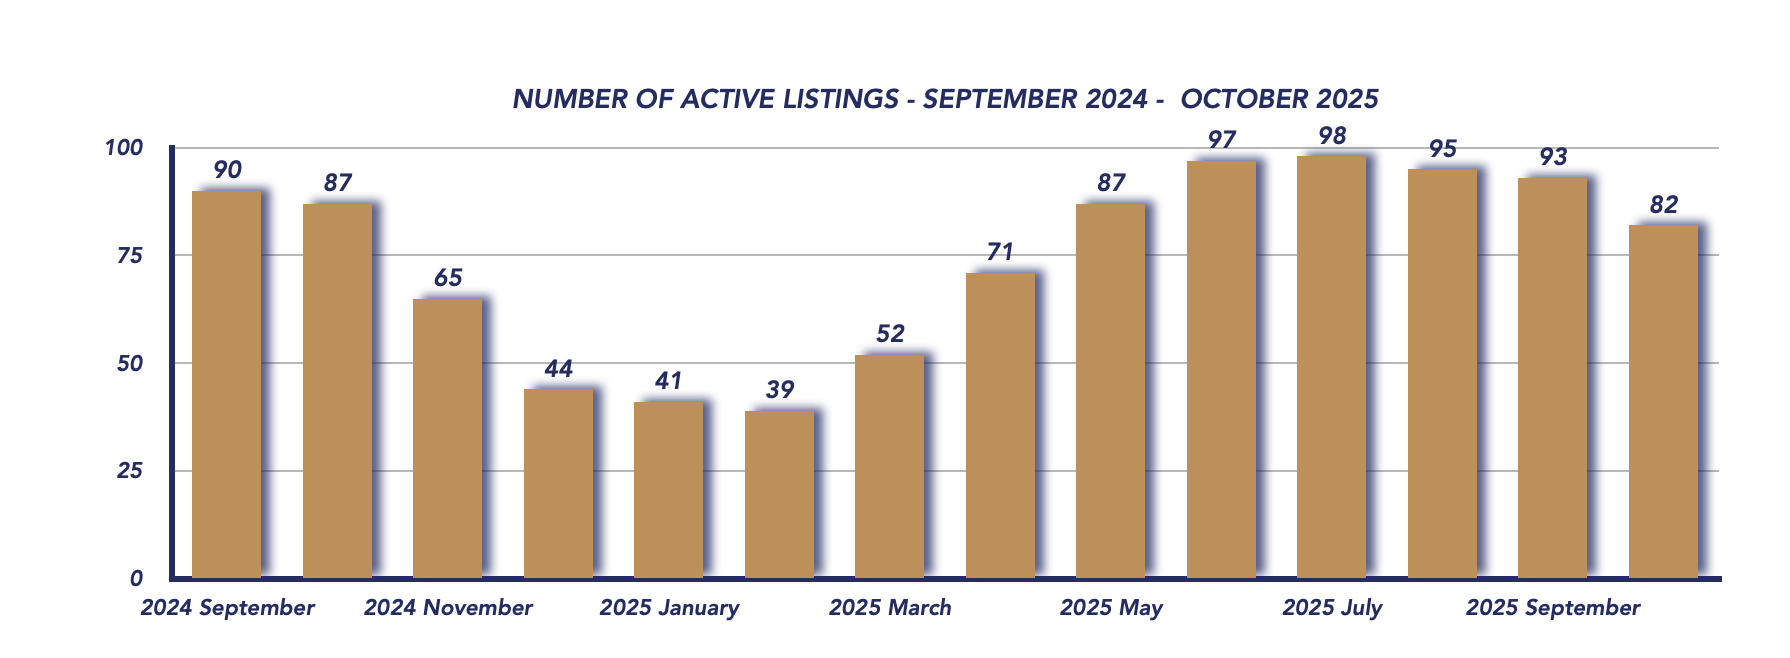
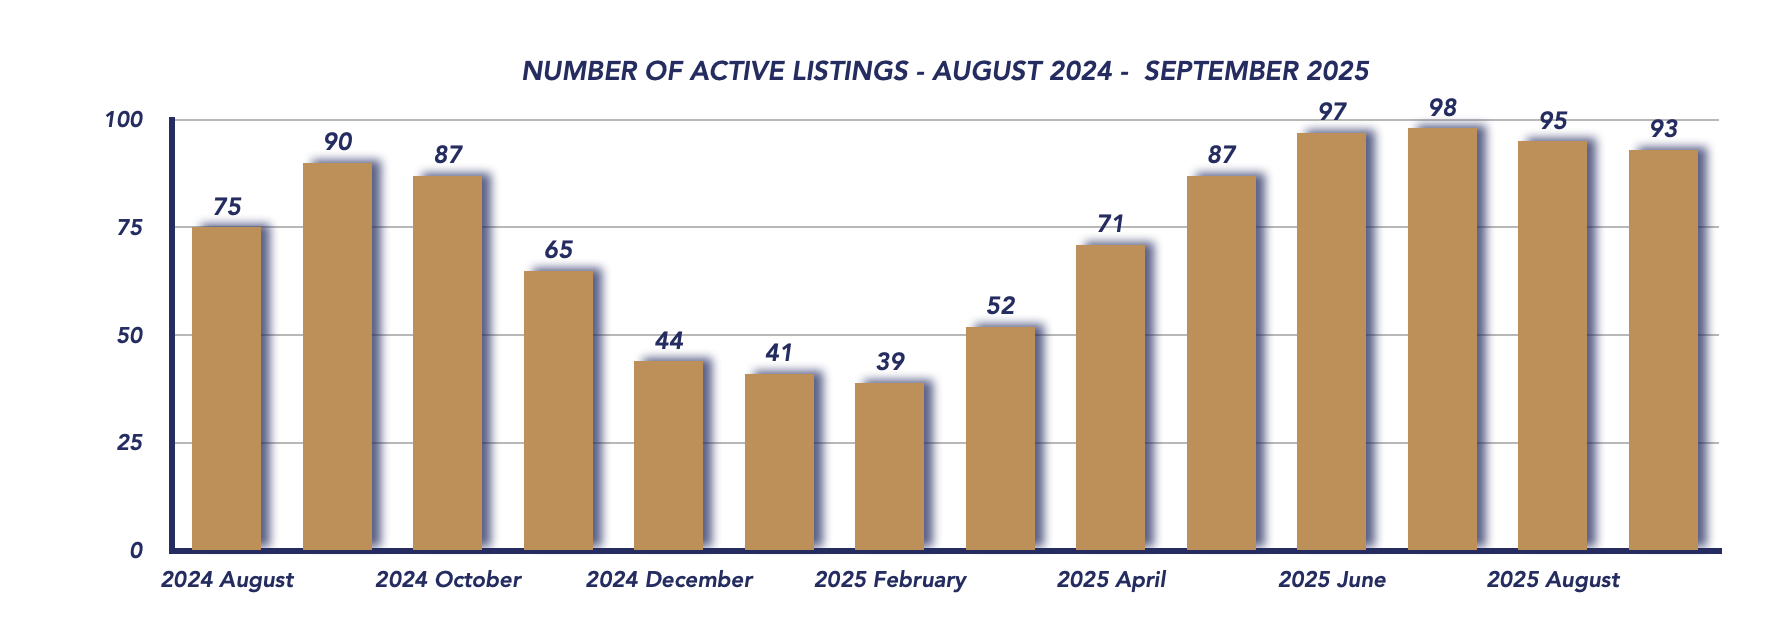
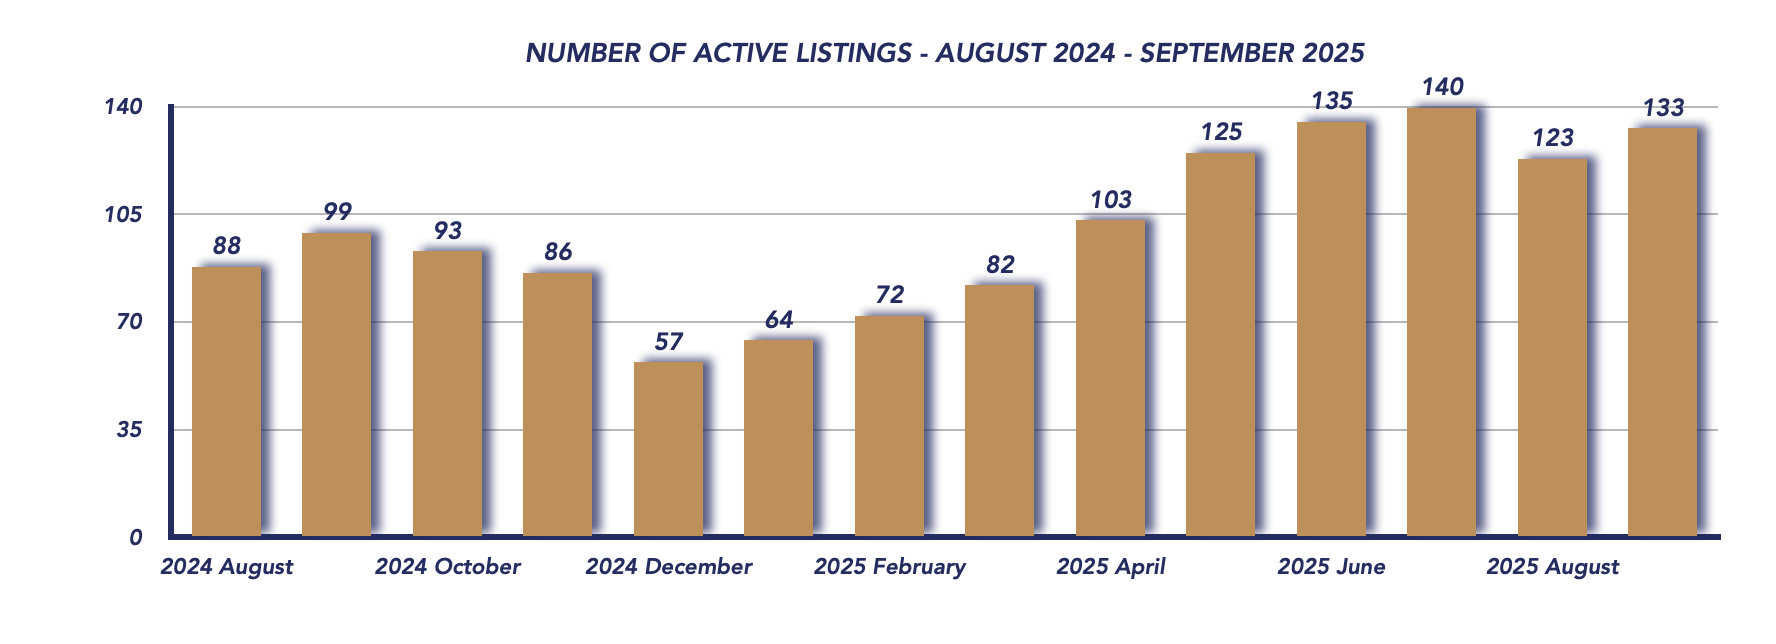
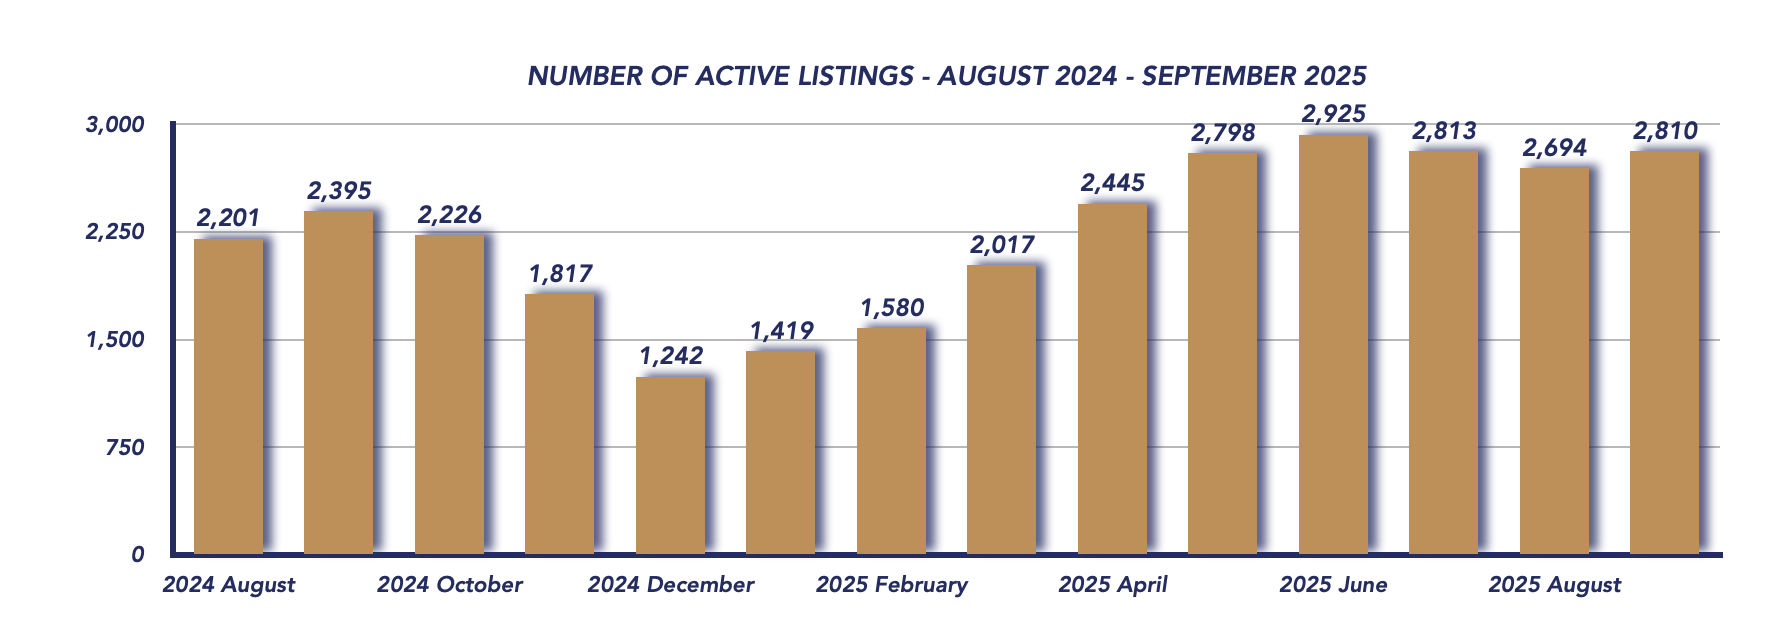
Active Listings
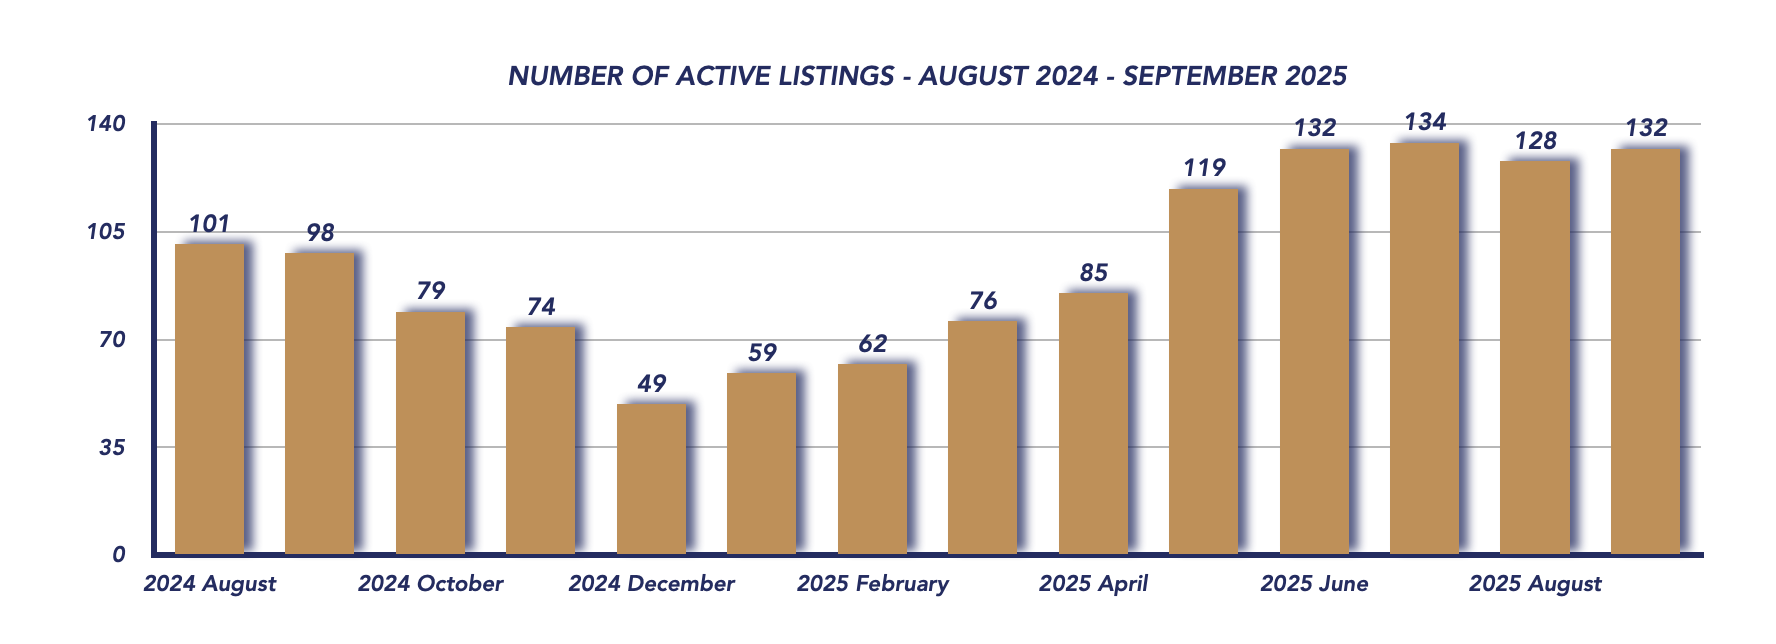
Active listings eased slightly to 125, down from 133 in September, but higher than 93 listings in October 2024. Despite a small month-over-month decline, the level of available inventory remains healthy, ensuring buyers have a variety of options across different price points.

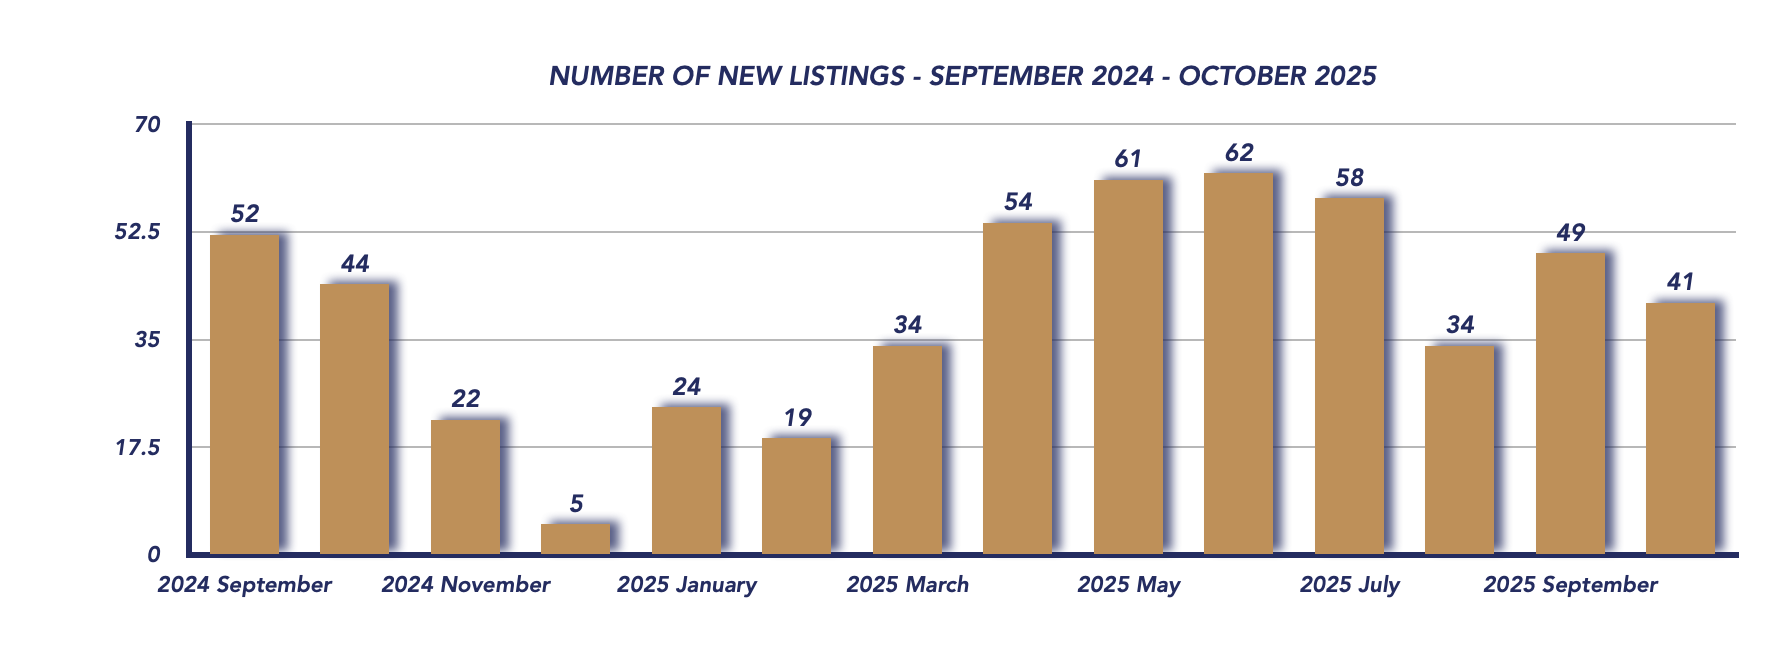
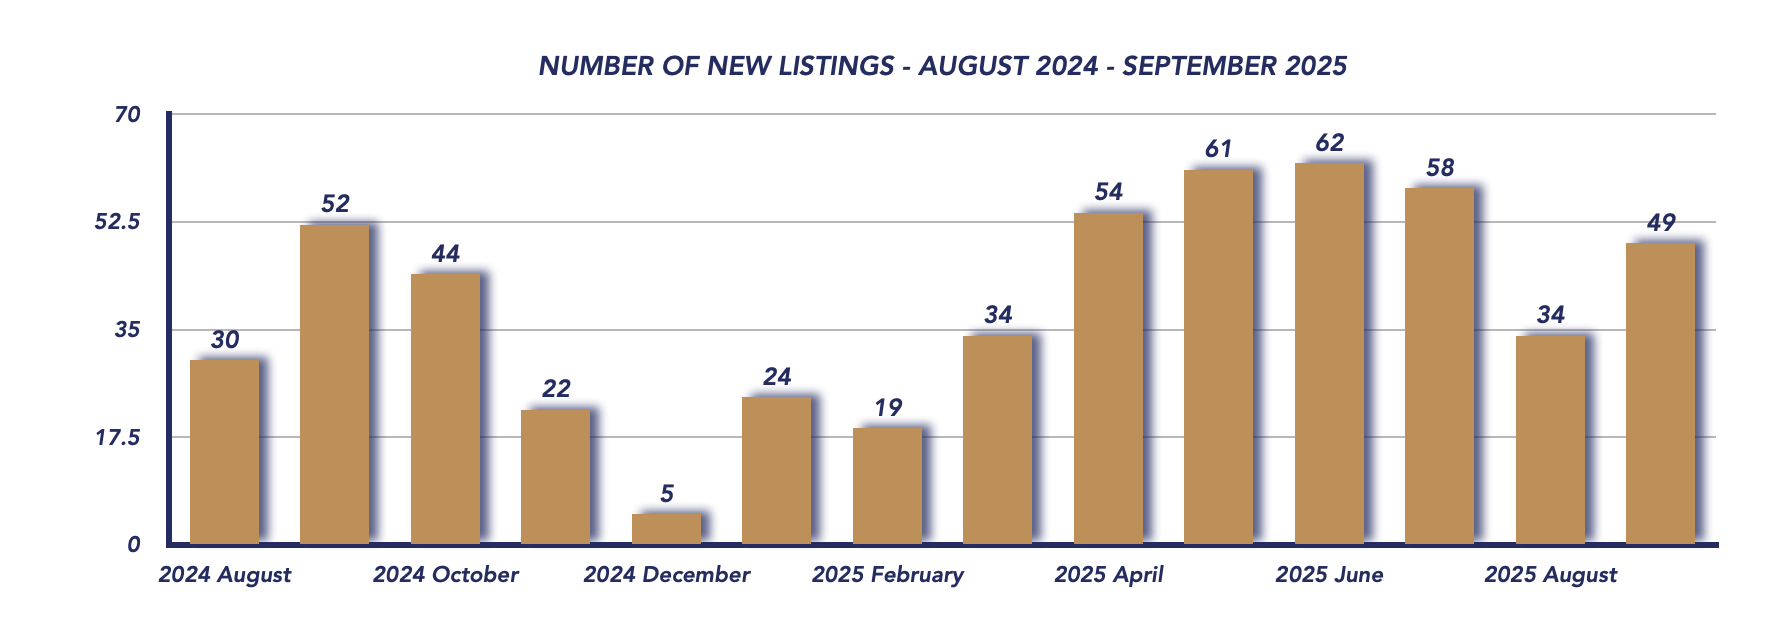
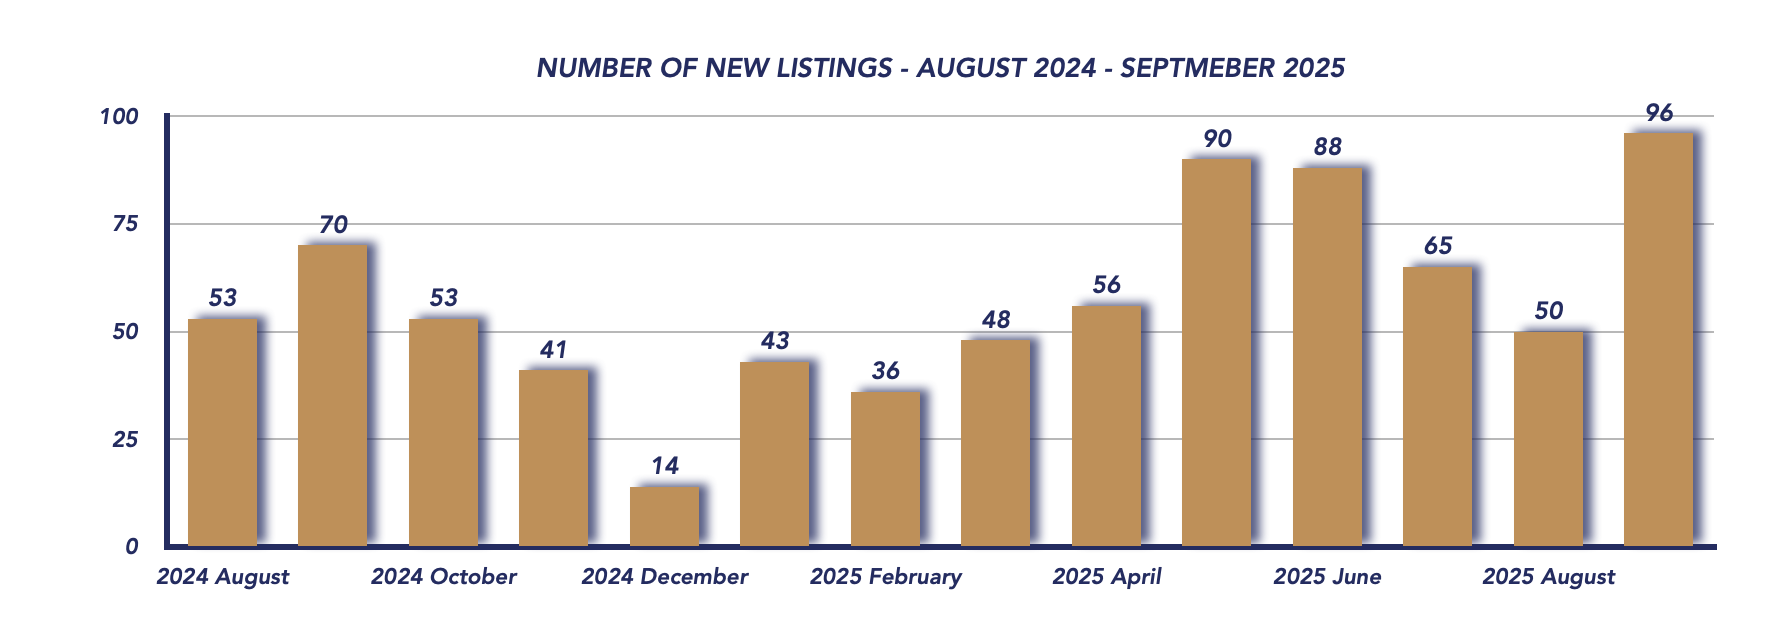
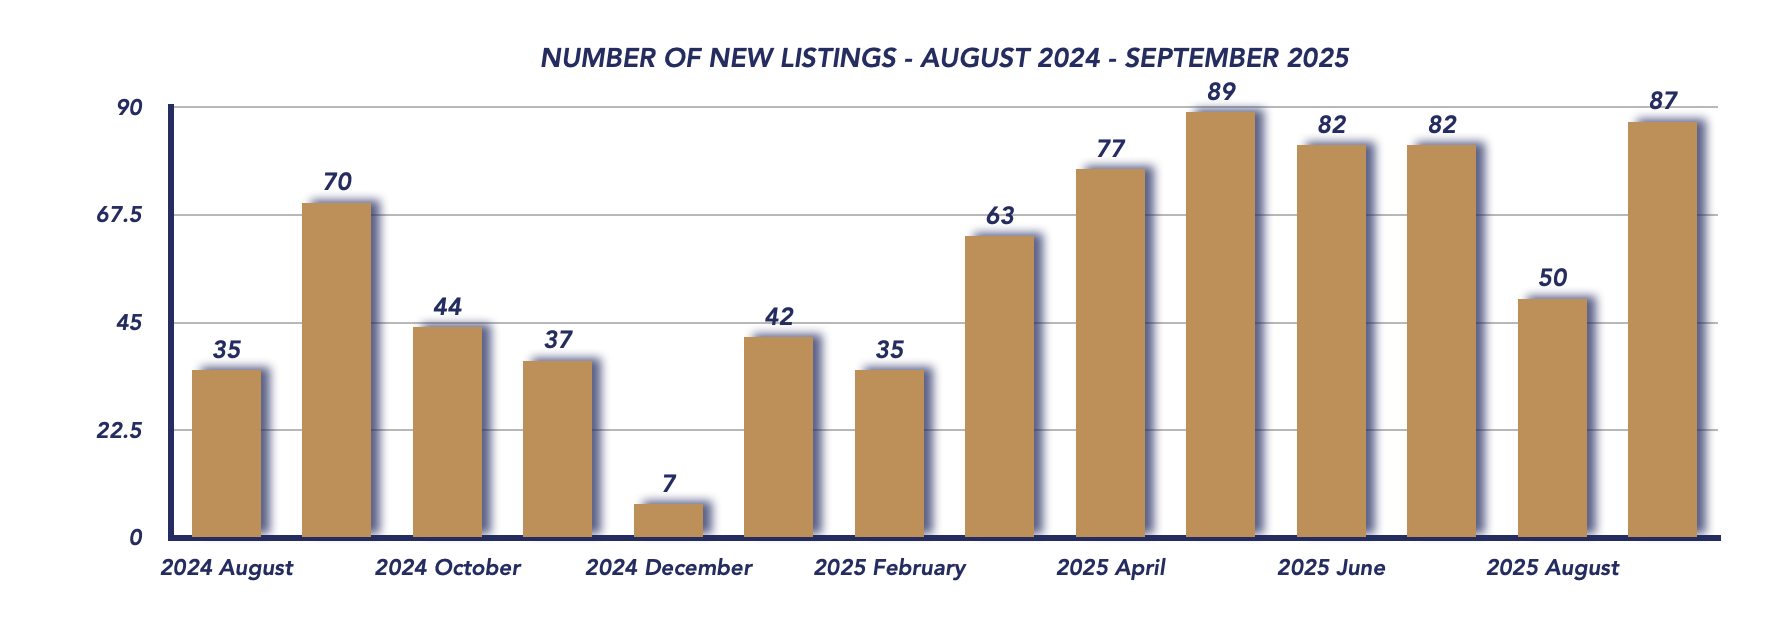
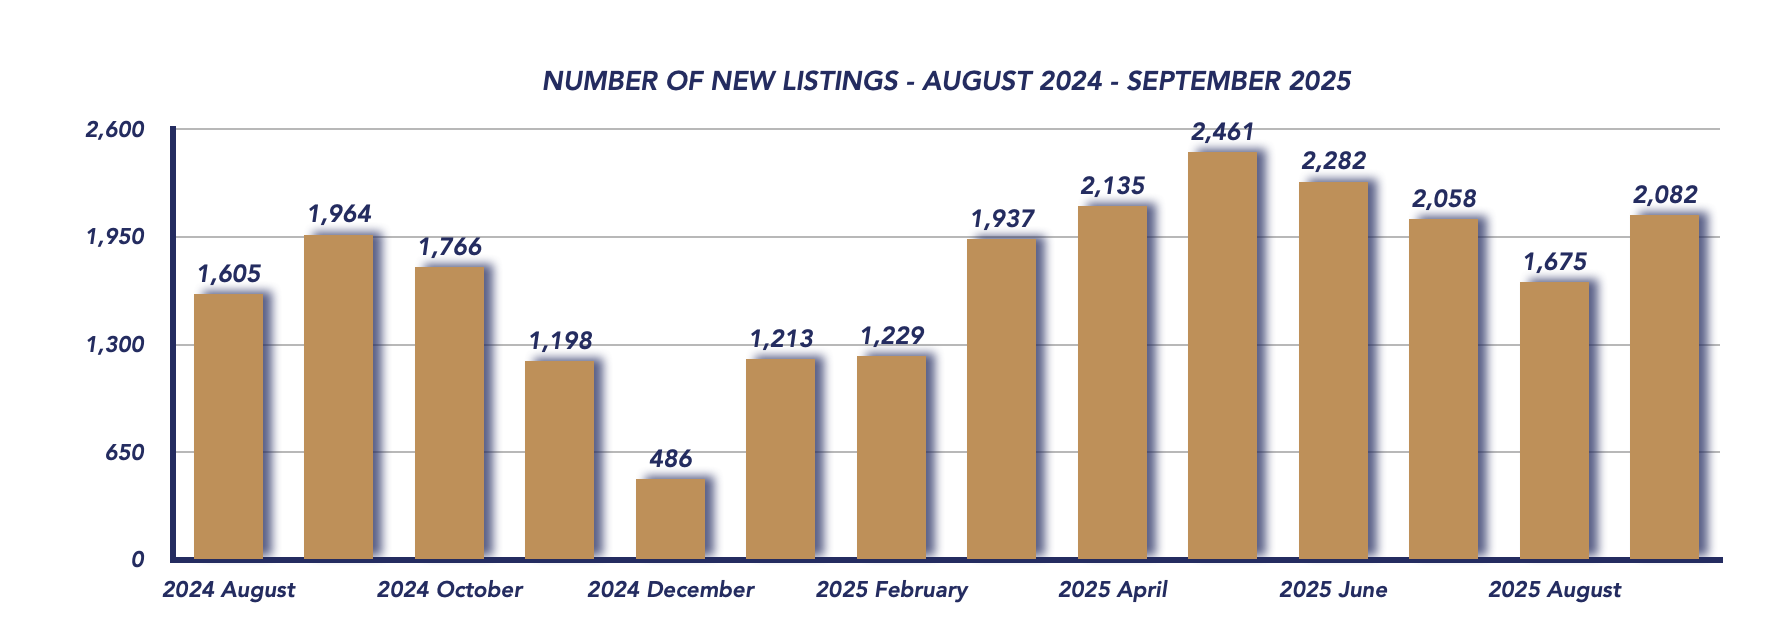
New Listings
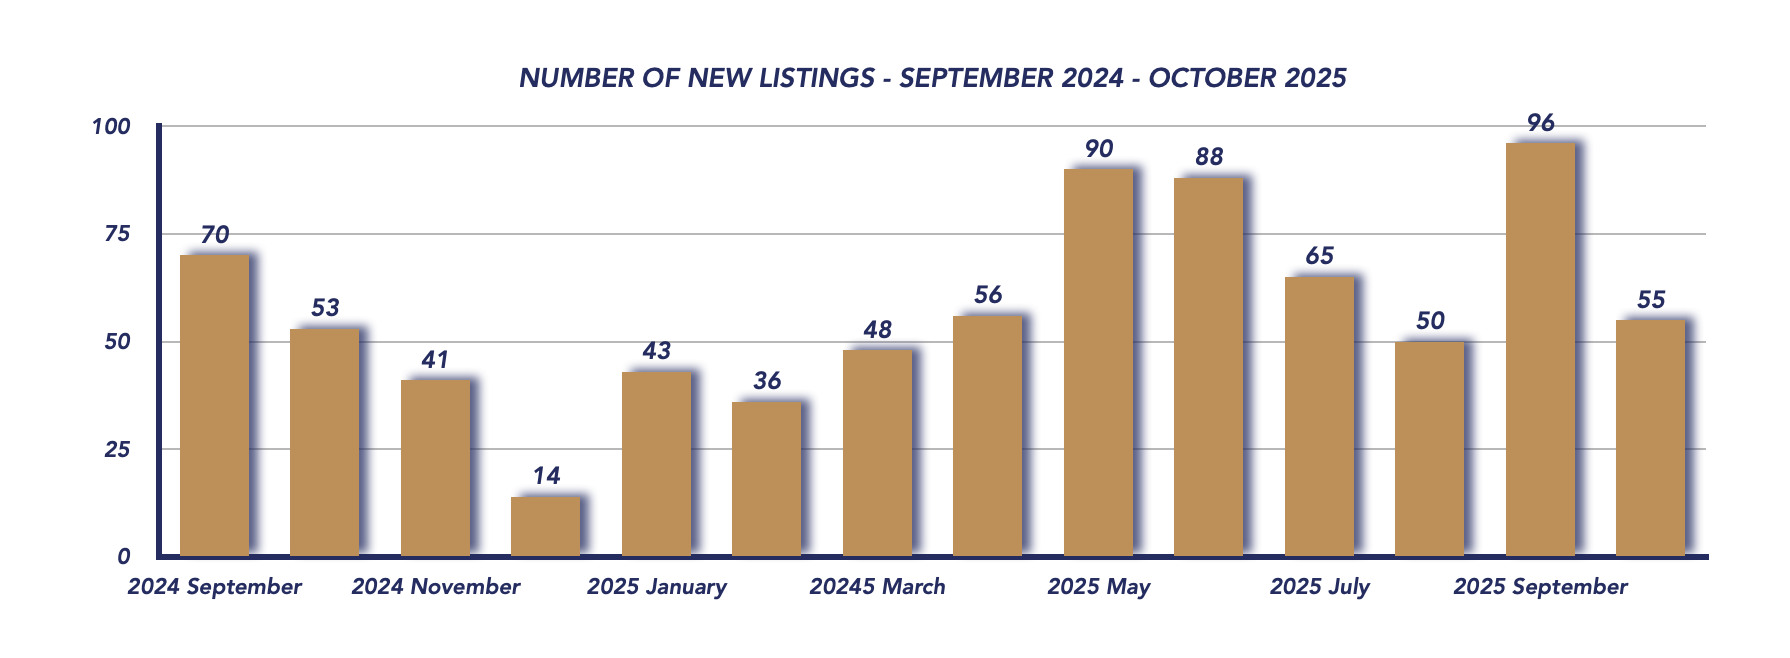
The number of new listings dropped to 63, compared to 87 in September, but up from 44 last October. This slowdown in new listings heading into the fall is typical for the season, though it may also indicate that some sellers are holding off until market conditions improve or interest rates stabilize.

Days on Market
Properties took an average of 64 days to sell, a slight improvement from 73 days in September. This suggests that while overall activity has softened, well-priced homes are still moving relatively efficiently, particularly those under $1.5 million.
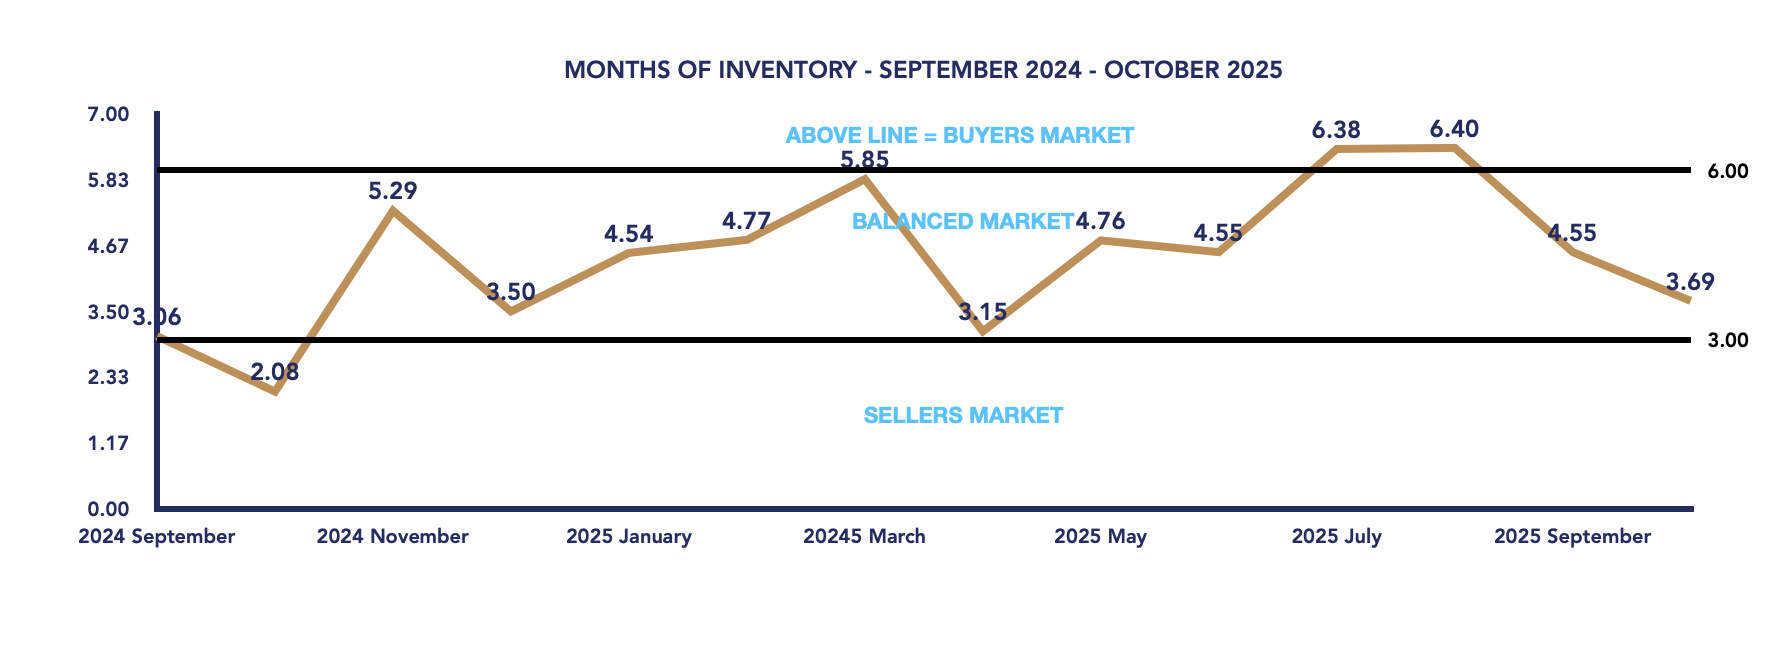
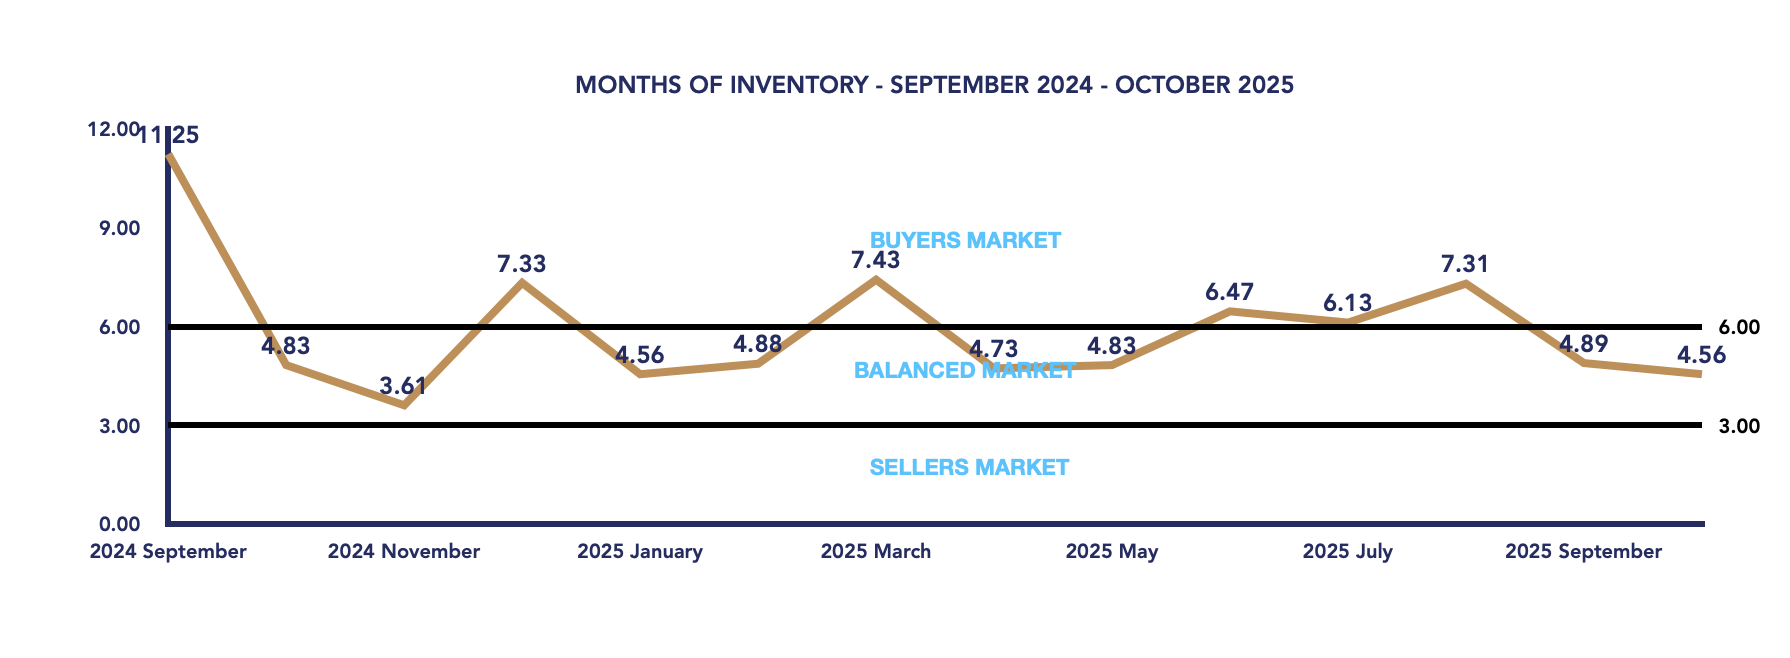
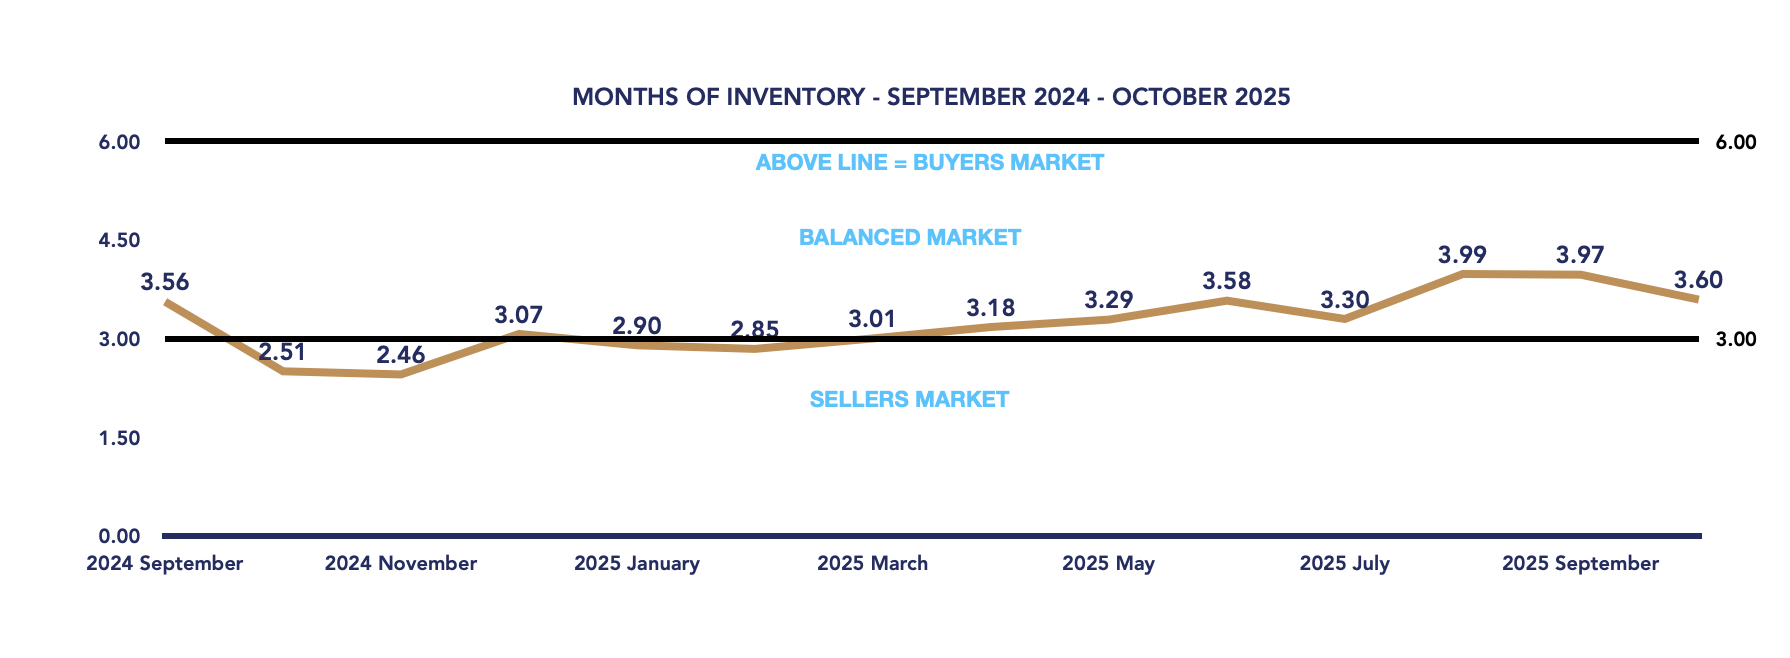
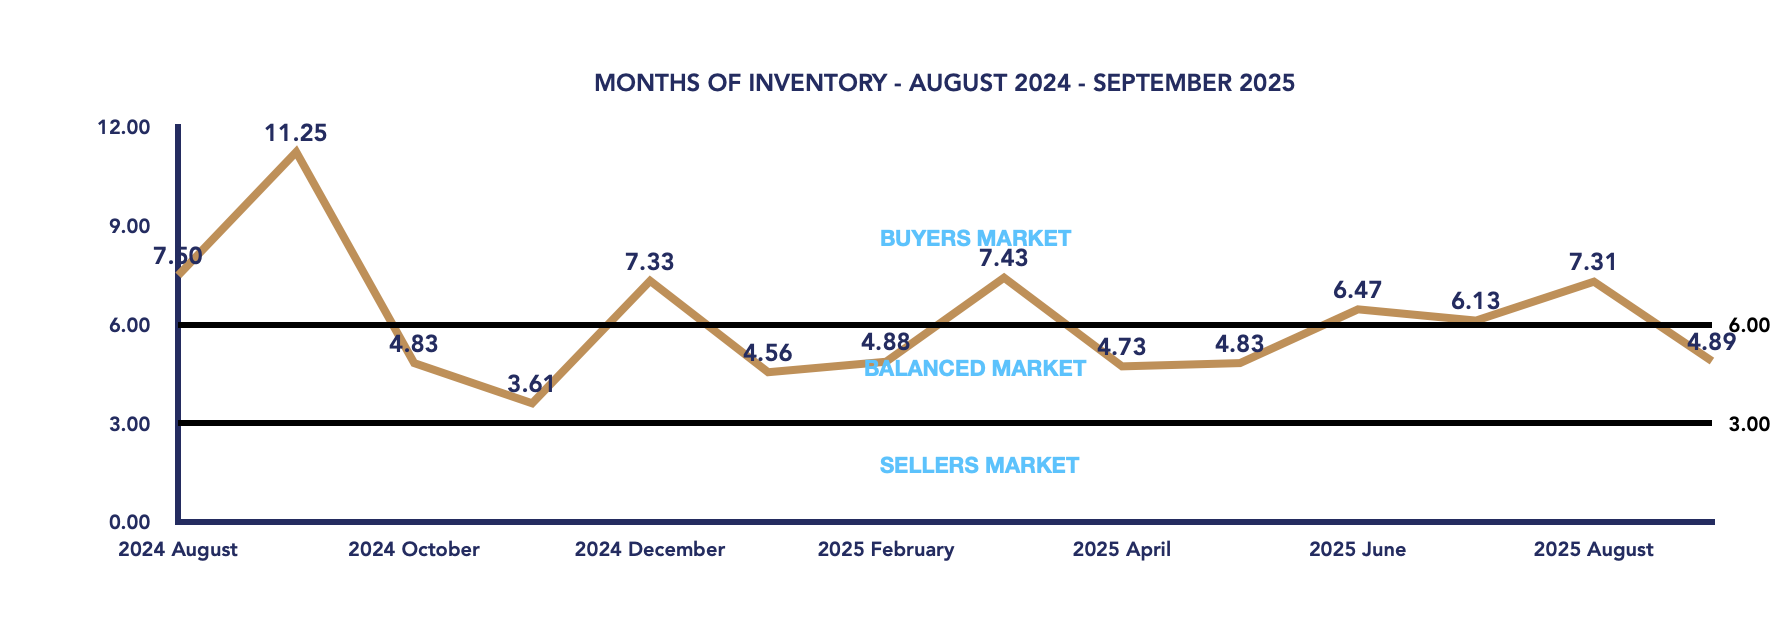
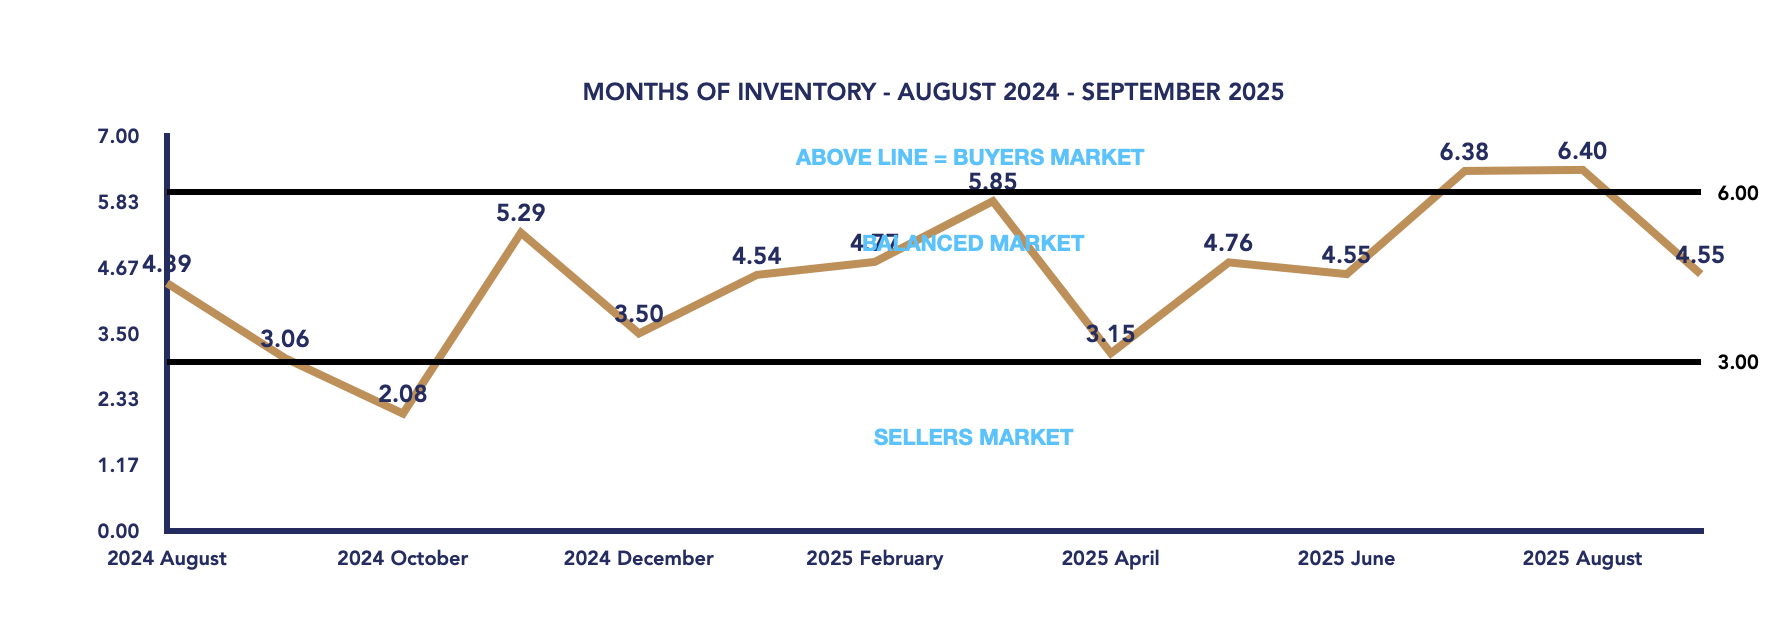
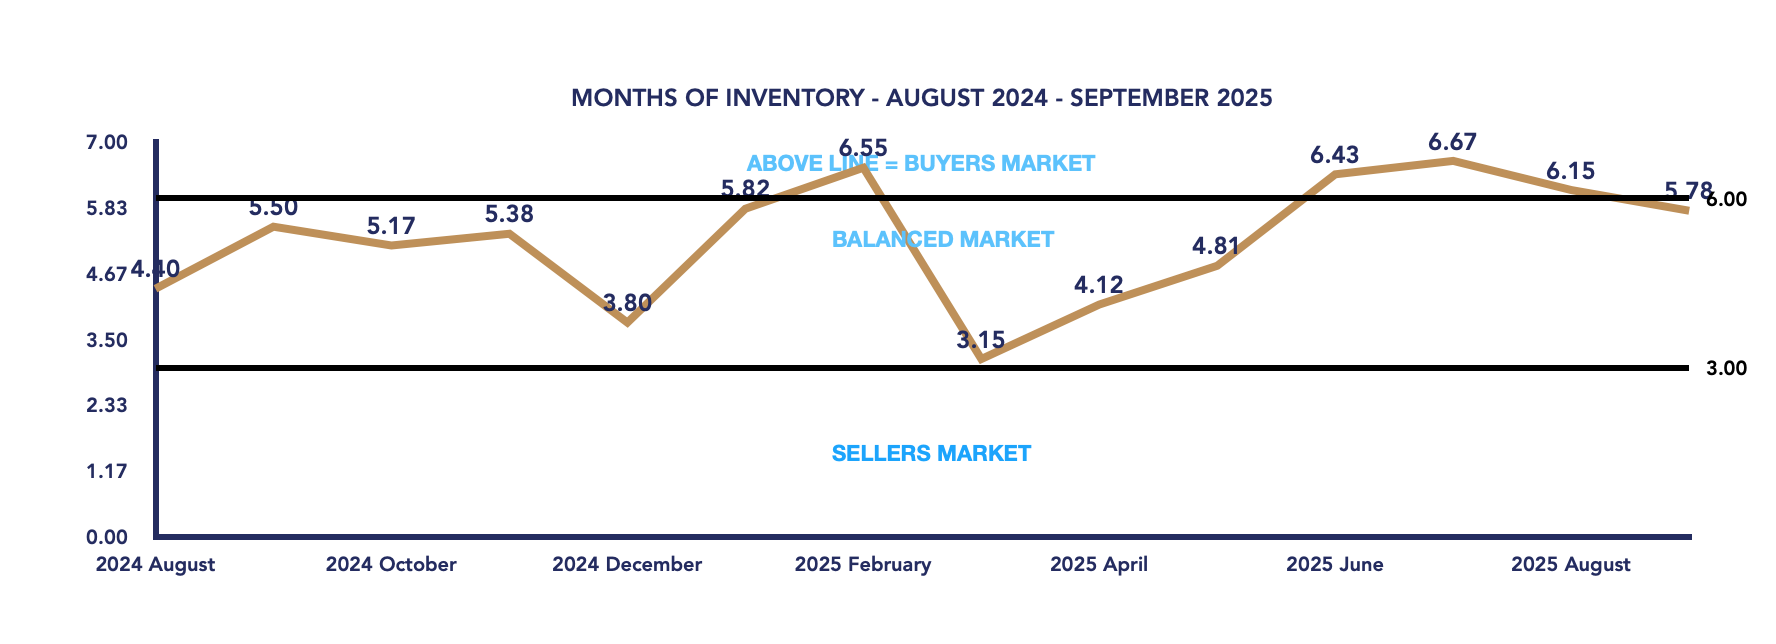
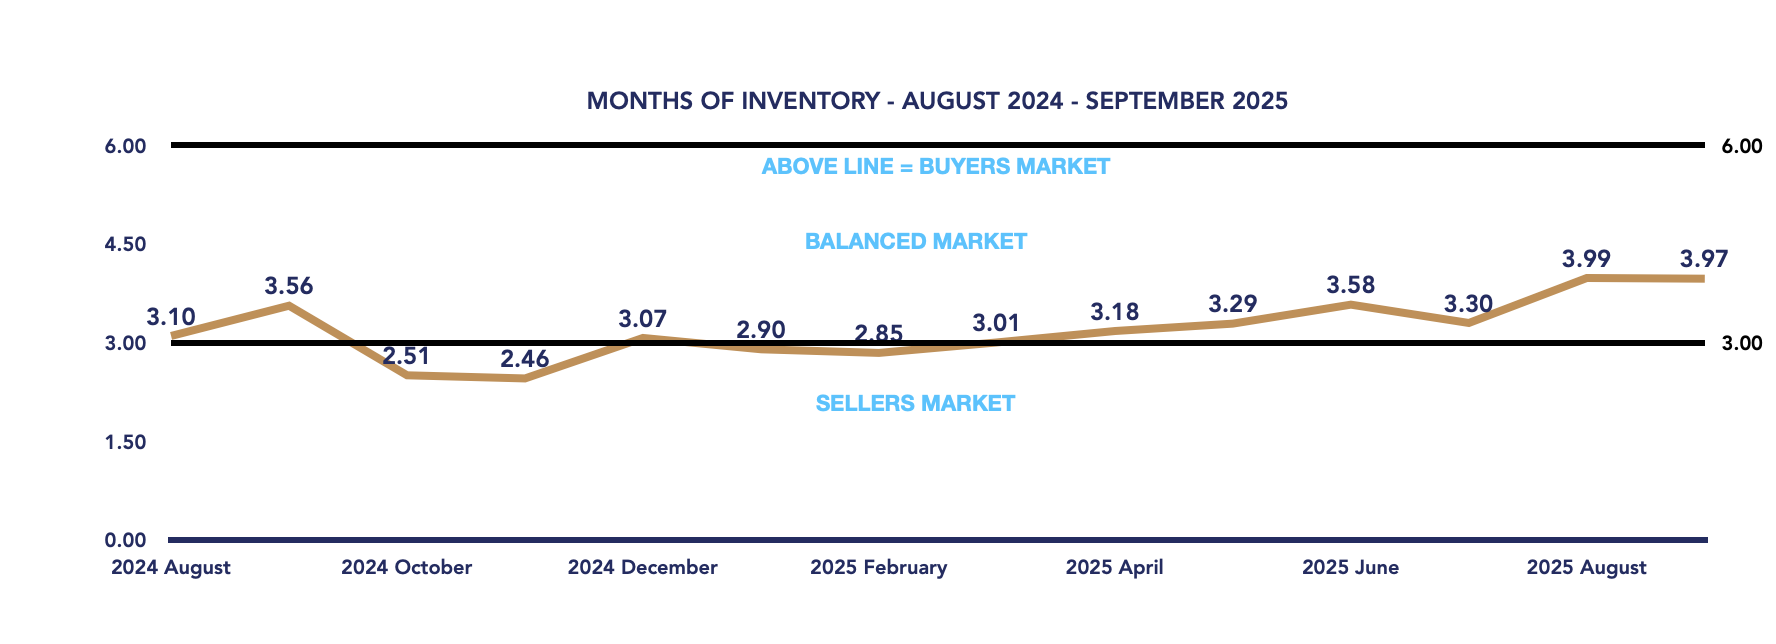
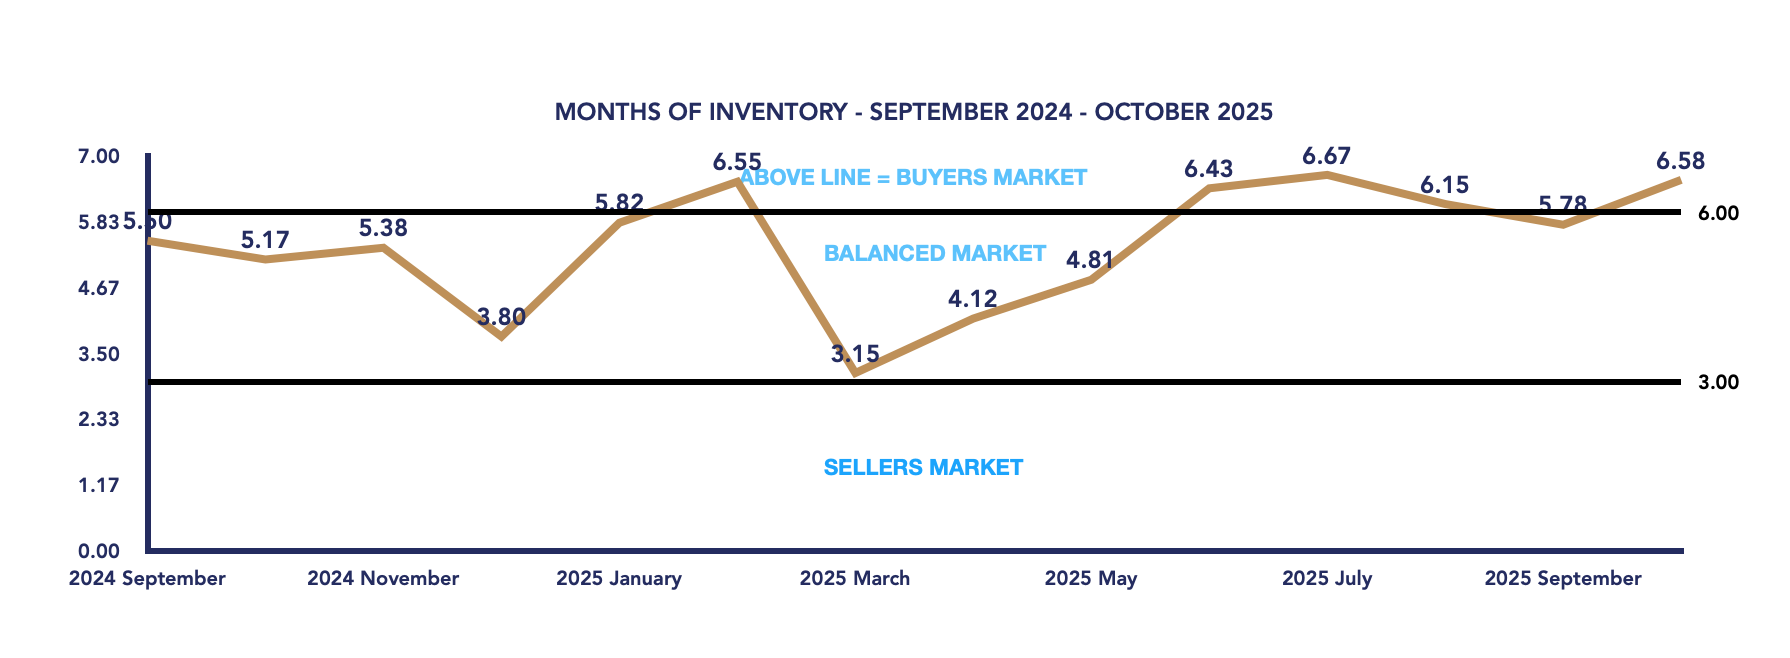
Months of Inventory
The months of inventory increased to 6.58, up from 5.78 in September, marking a return to buyer’s market territory. This rise reflects both fewer sales and a steady flow of active listings, giving buyers more leverage and time to make purchasing decisions.
Conclusion
October 2025 brought a measured correction in the Uxbridge real estate market, following September’s high-value sales spike. Although the average price declined month-over-month, it remains well above last year’s levels, underscoring ongoing demand and stable fundamentals.
With inventory slightly higher and months of supply tipping back toward a buyer’s market, conditions continue to favor those looking to purchase. Sellers, however, can still find success with strategic pricing and realistic expectations. As we move deeper into fall, the market is likely to maintain this steady, balanced tone, setting the stage for a potentially more active start to 2026.
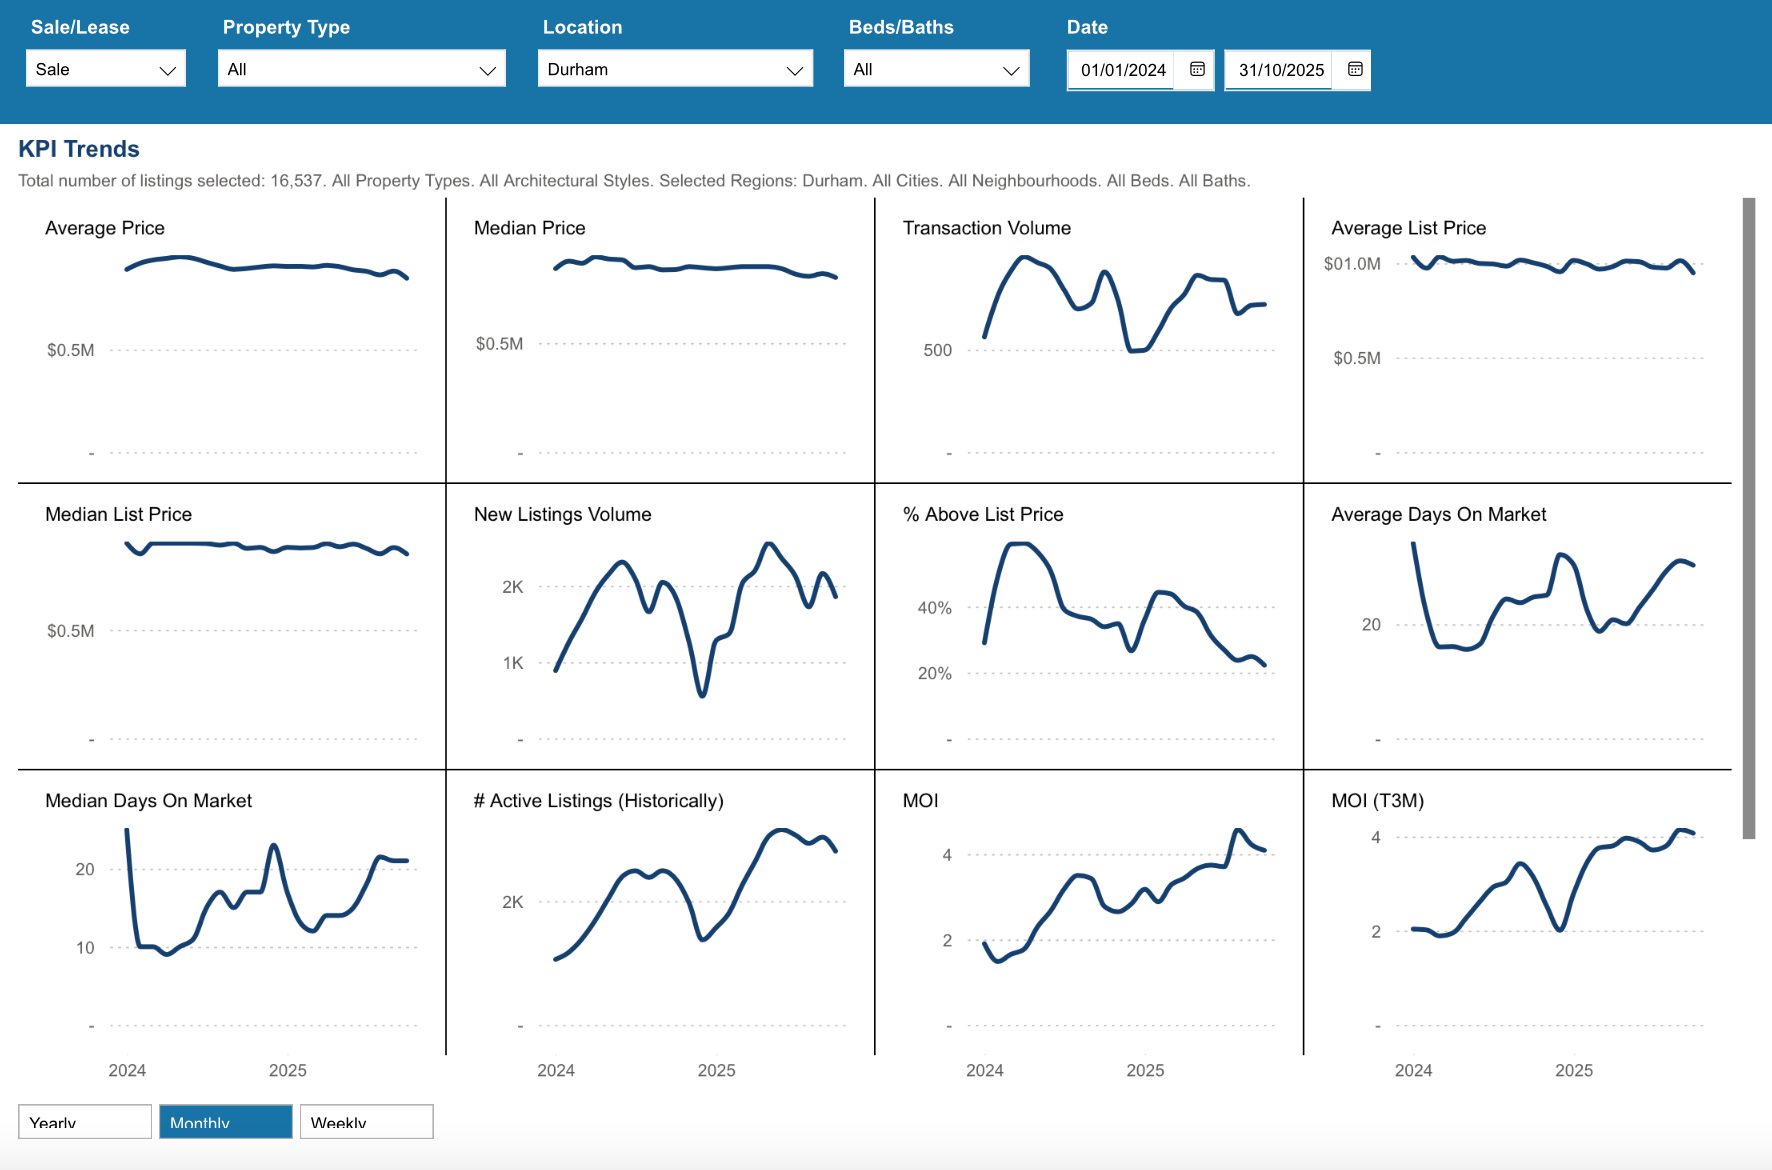
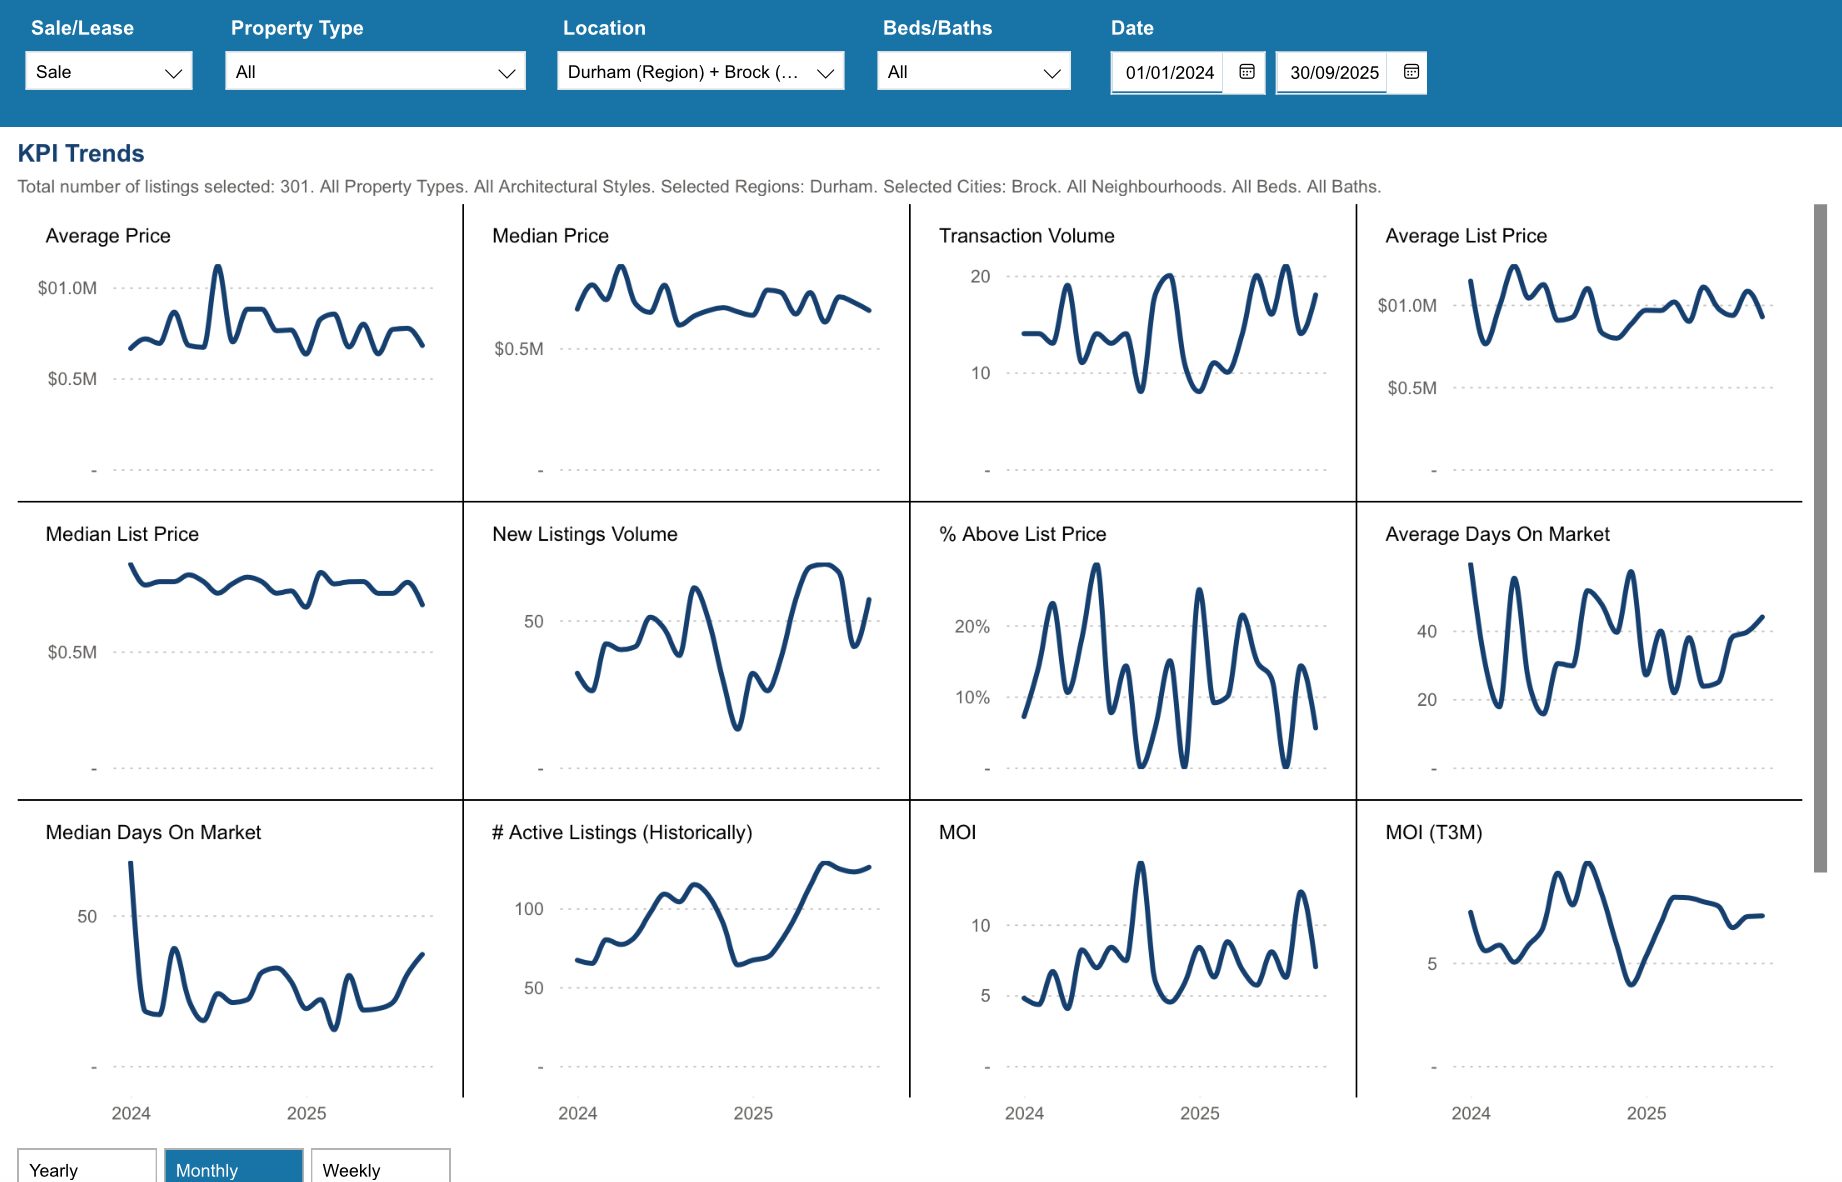
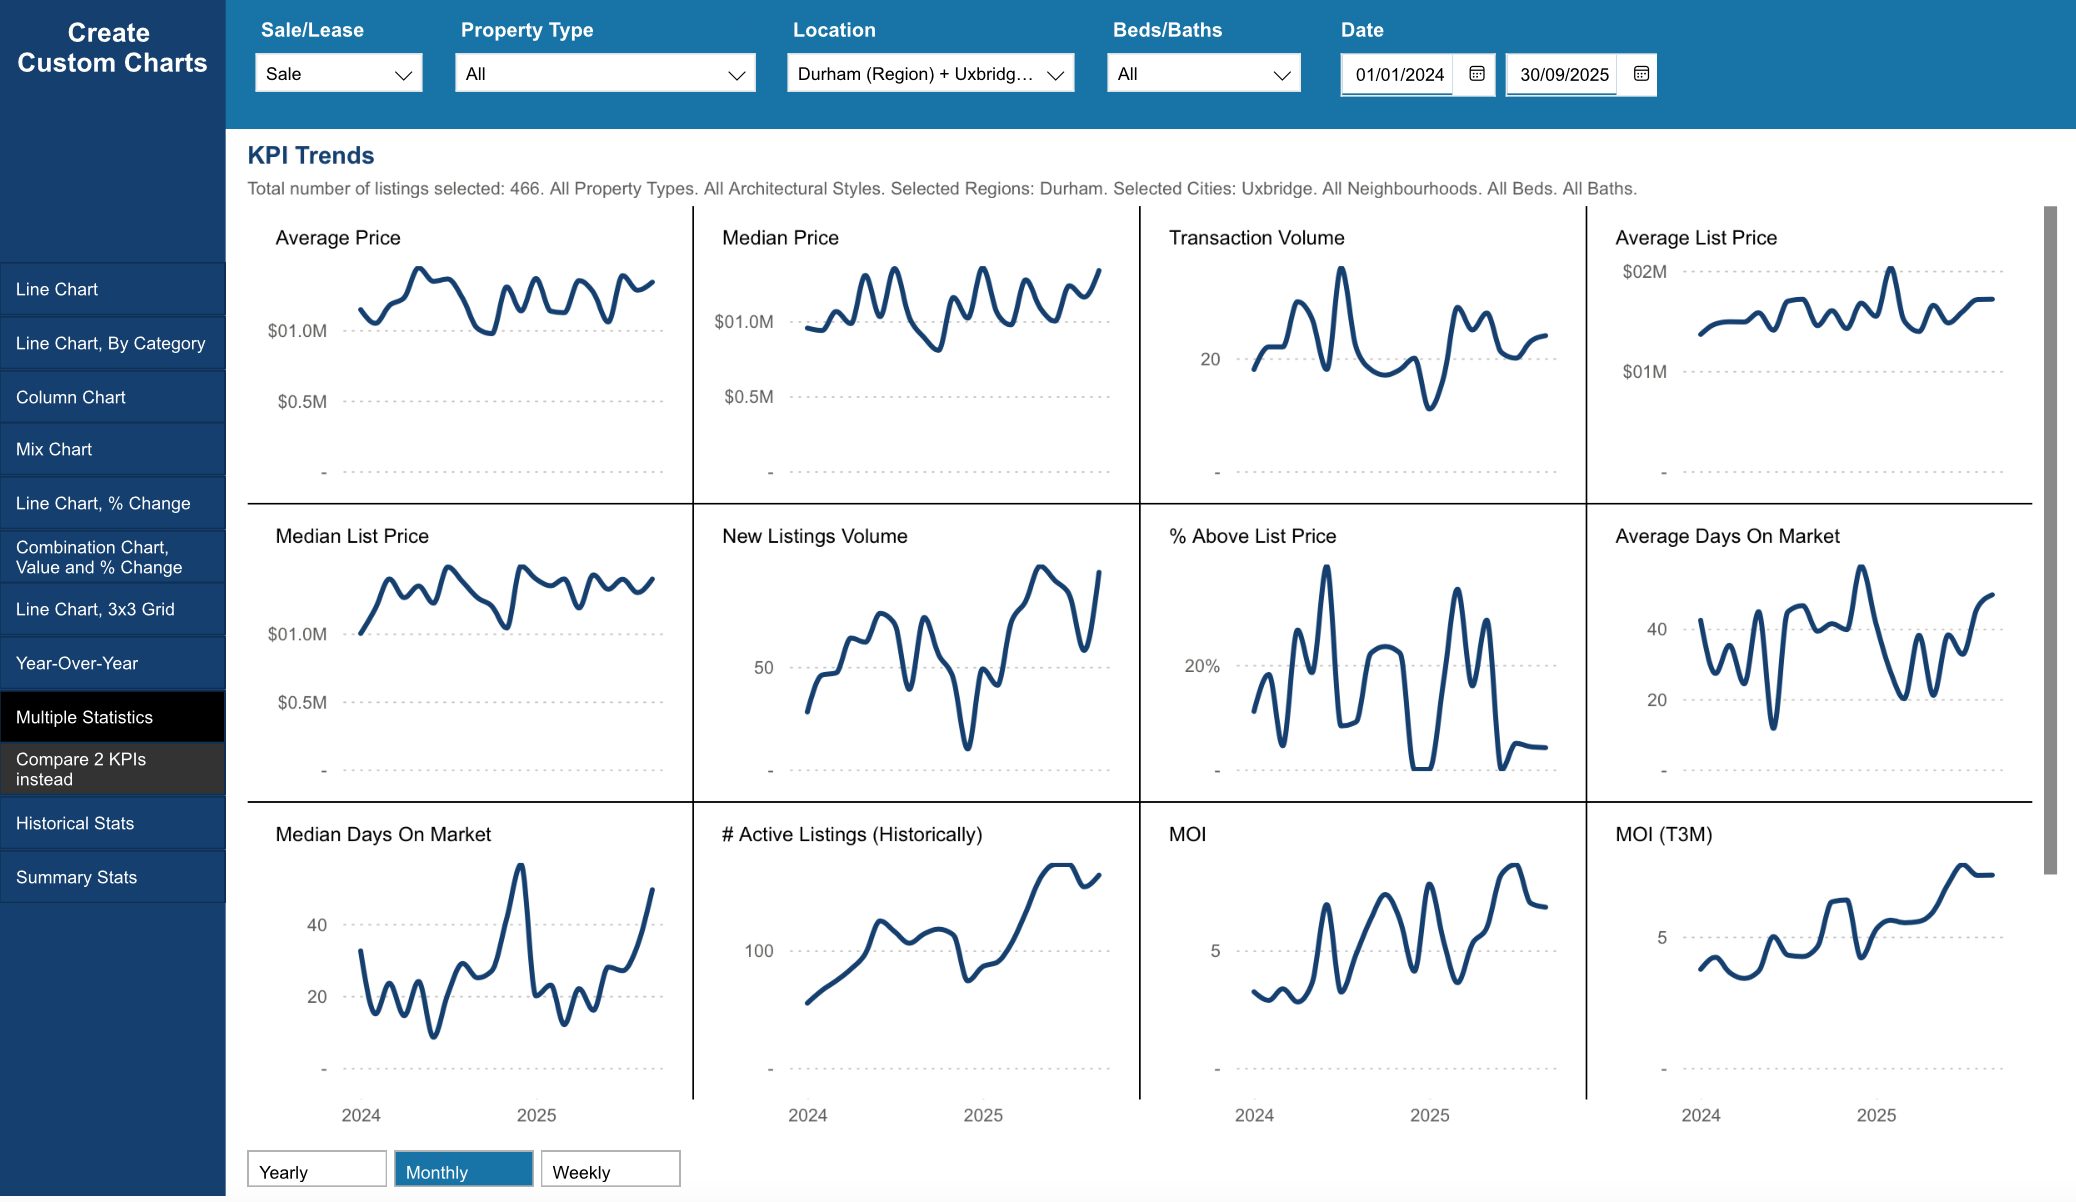
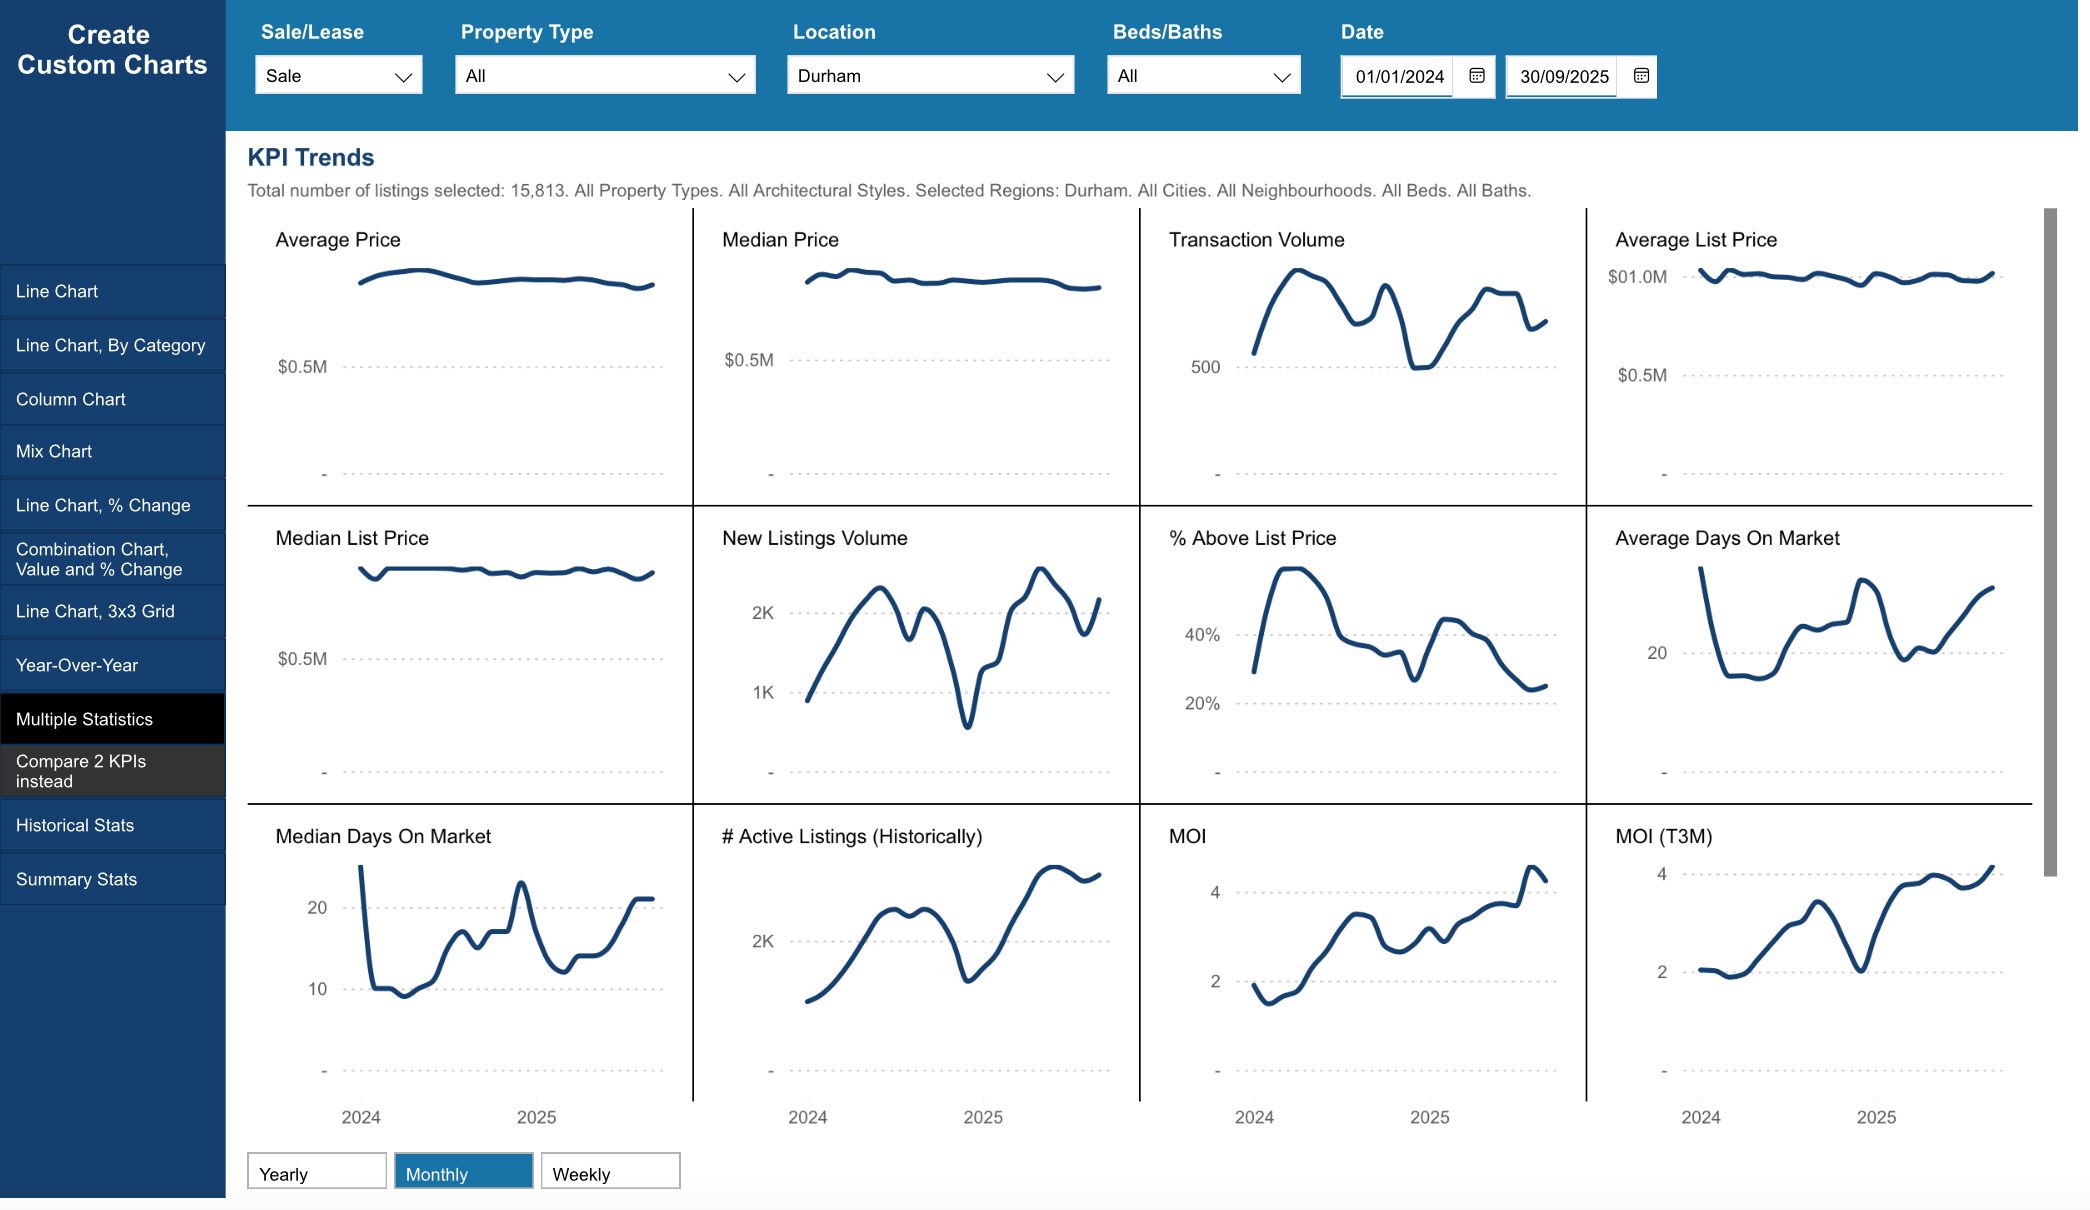
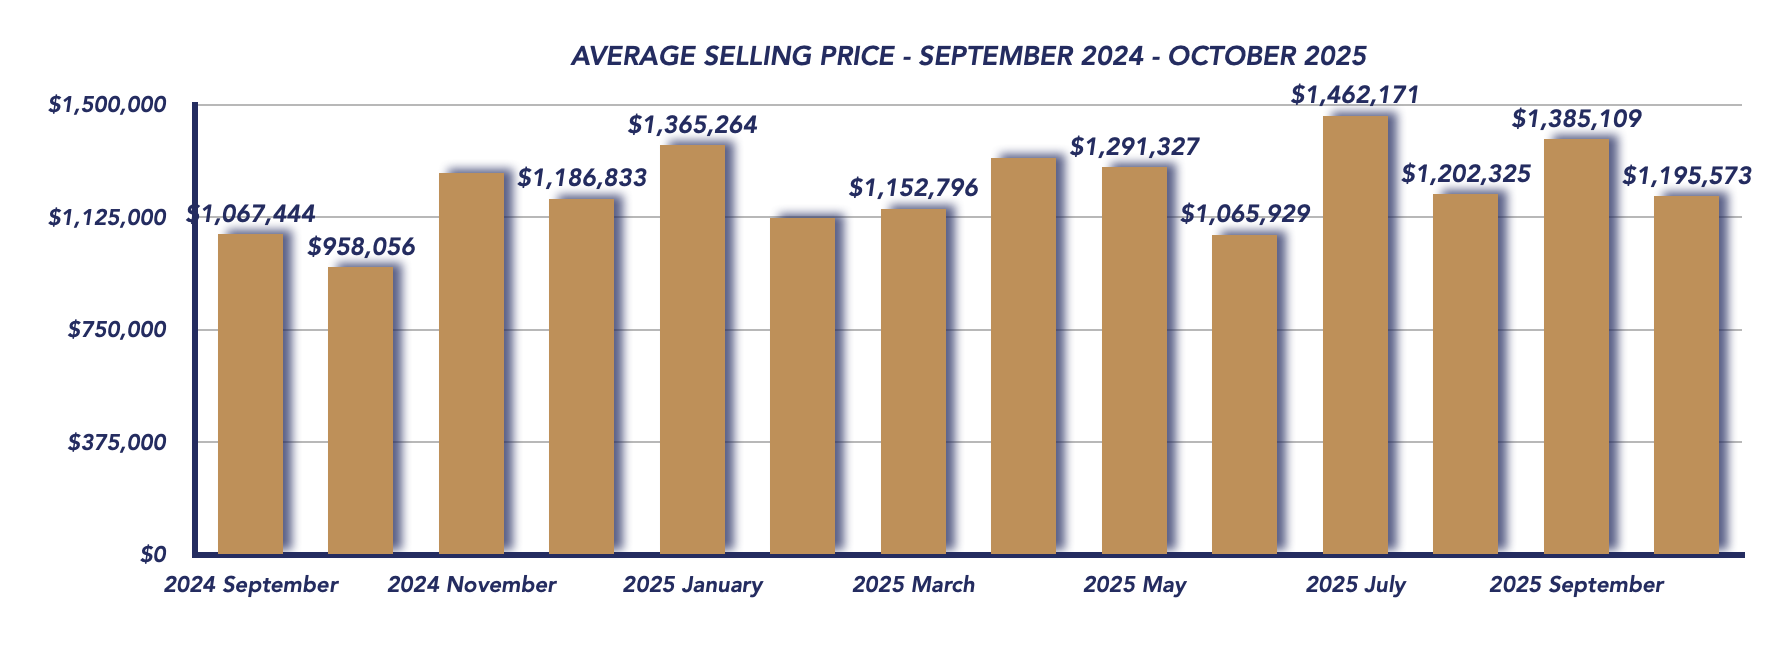
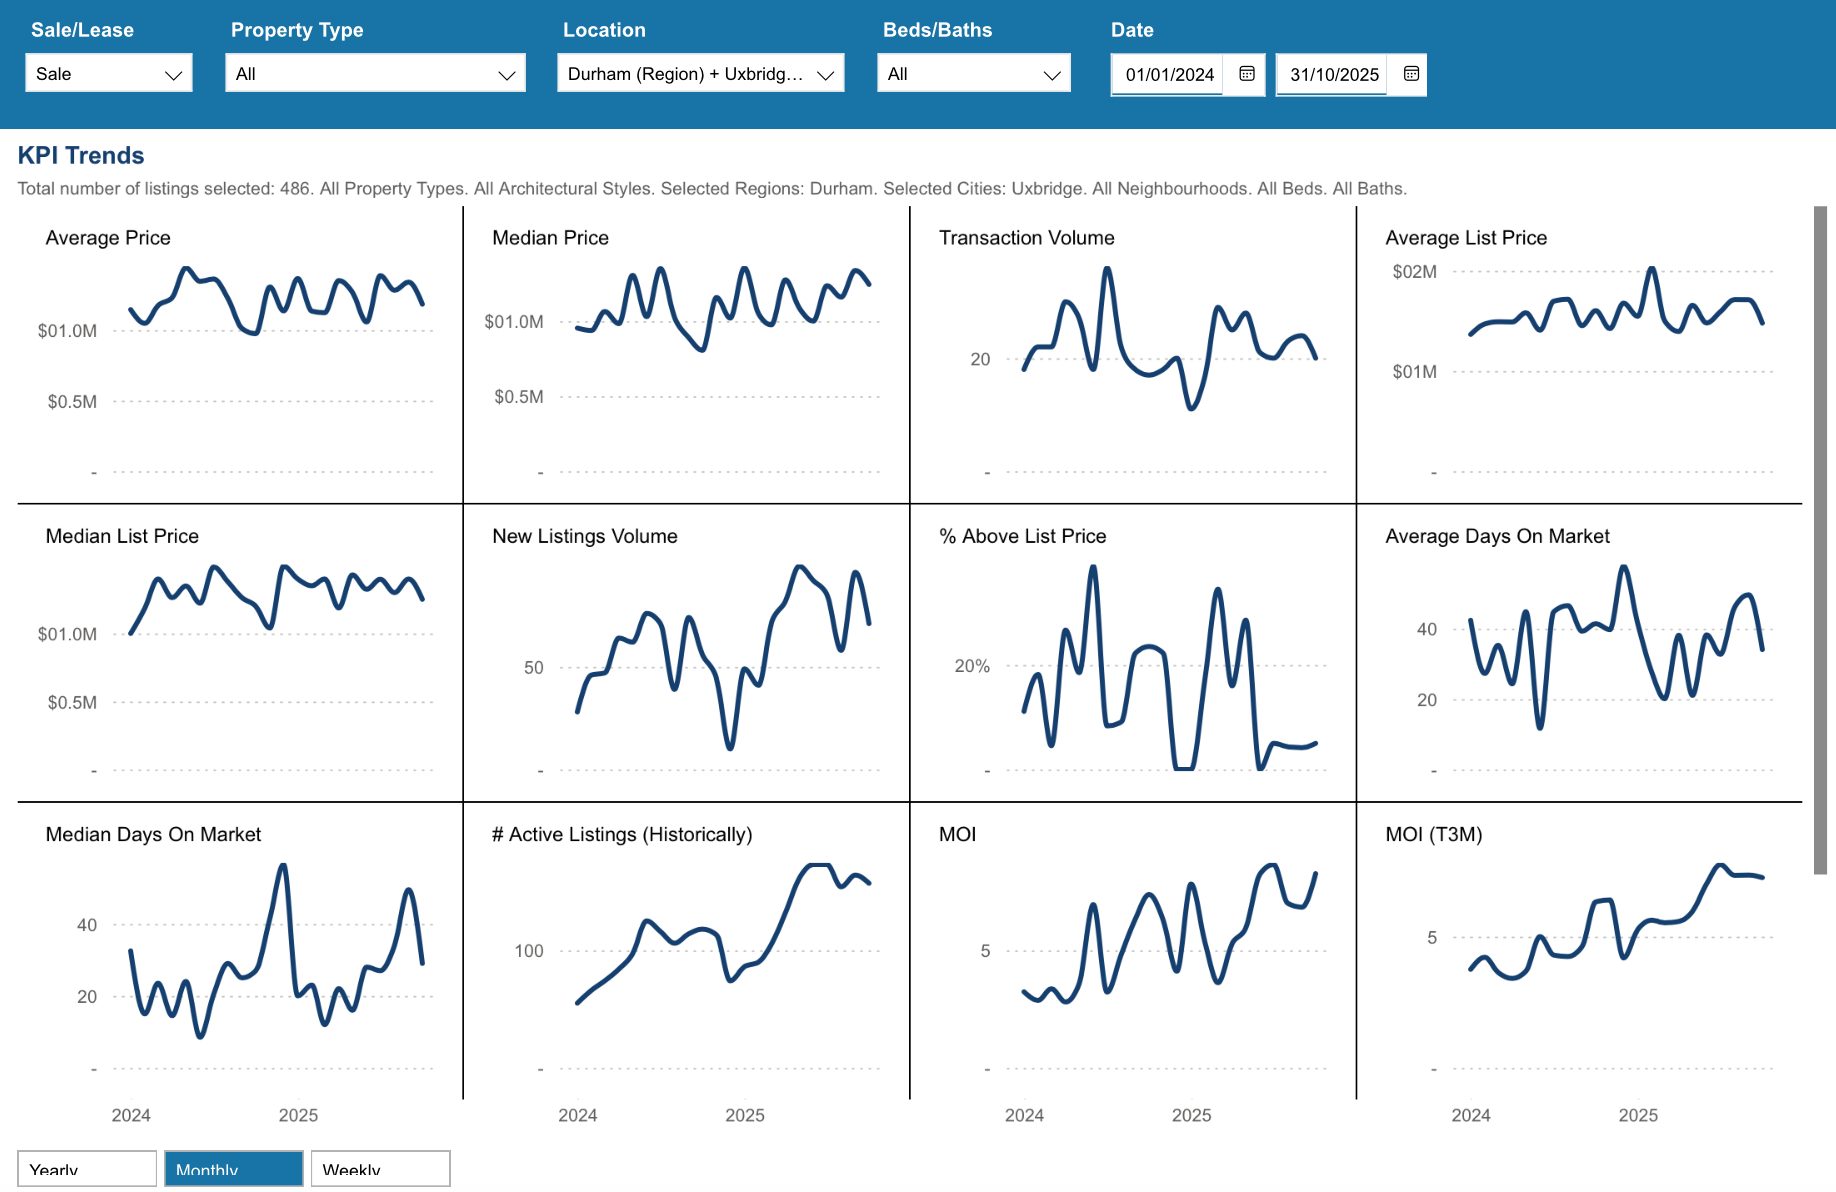
Key Performance Indicators (KPIs) from January 2024 through October 2025 provide a clear snapshot of how the Township of Uxbridge real estate market has evolved across all property types, architectural styles, and home configurations
WATCH OUR MONDAY MARKET MINUTES
*Information is believed to be accurate at time of posting but is not guaranteed to be correct. Some values may vary slightly based on the exact date and time the reports were generated. Market stats are provided by TRREB (Toronto Regional Real Estate Board) and are based on sales for the month of Attached/Row/Townhouses, Condo Apartments, Condo Townhouses, Detached, Detached with Common Elements, Link Homes and Semi-detached. *Some values may vary slightly based on the exact date and time the reports were generated.
Not intended as a solicitation if your property is already listed by another broker. Affiliated real estate agents are independent contractor sales associates, not employees. ©2021 Coldwell Banker. All Rights Reserved. Coldwell Banker and the Coldwell Banker logos are trademarks of Coldwell Banker Real Estate LLC. The Coldwell Banker® System is comprised of company owned offices which are owned by a subsidiary of Realogy Brokerage Group LLC and franchised offices which are independently owned and operated. The Coldwell Banker System fully supports the principles of the Fair Housing Act and the Equal Opportunity Act.
Click below for more reports
Check out our Uxbridge and Scugog Events Pages to keep up to date on whats going on around town. Click the links or scan the Code with your phone to take you directly there.

UXBRIDGE EVENTS

SCUGOG EVENTS