Monday Market Minute – Uxbridge & Scugog Real Estate Update Week of September 14 to September 20
The fall market is in full swing across Uxbridge and Scugog, and this week’s numbers show buyers and sellers staying active as we move deeper into September.
Weekly Real Estate Market Minute for the Townships of Uxbridge and Scugog
Uxbridge
New Listings: 10 (same as last week)
Back on Market: 10 properties returned to the market
Price Adjustments: 14 (down from 16)
Sales: 4 sold conditionally and 4 sold firm (same firm sales as last week)
Total Inventory: 168 properties, up from 158
Notables: 19 vacant land properties and 7 condominiums are currently listed.
Scugog
New Listings: 6 (down from 10)
Back on Market: 9 properties returned to the market
Price Adjustments: 16 (slightly down from 19)
Sales: 3 sold conditionally and 6 sold firm (up from 5 firm sales last week)
Total Inventory: 158 properties, just slightly down from 160
Notables: 10 vacant land properties and 4 condominiums are on the market.
What This Means
Inventory in Uxbridge continues to climb, offering buyers more choice, while Scugog remains steady with balanced activity. The steady pace of new listings and price adjustments highlights motivated sellers and opportunities for buyers as we head into the cooler months.
Thinking of buying or selling this fall? Let’s talk about how these trends affect your next move.
Check out our Uxbridge and Scugog Events Pages to keep up to date on whats going on around town. Click the links or scan the Code with your phone to take you directly there.
The History of Uxbridge’s Former Free Methodist Building
.
From Sanctuary to Suites: The Story of Uxbridge’s Former Free Methodist Church
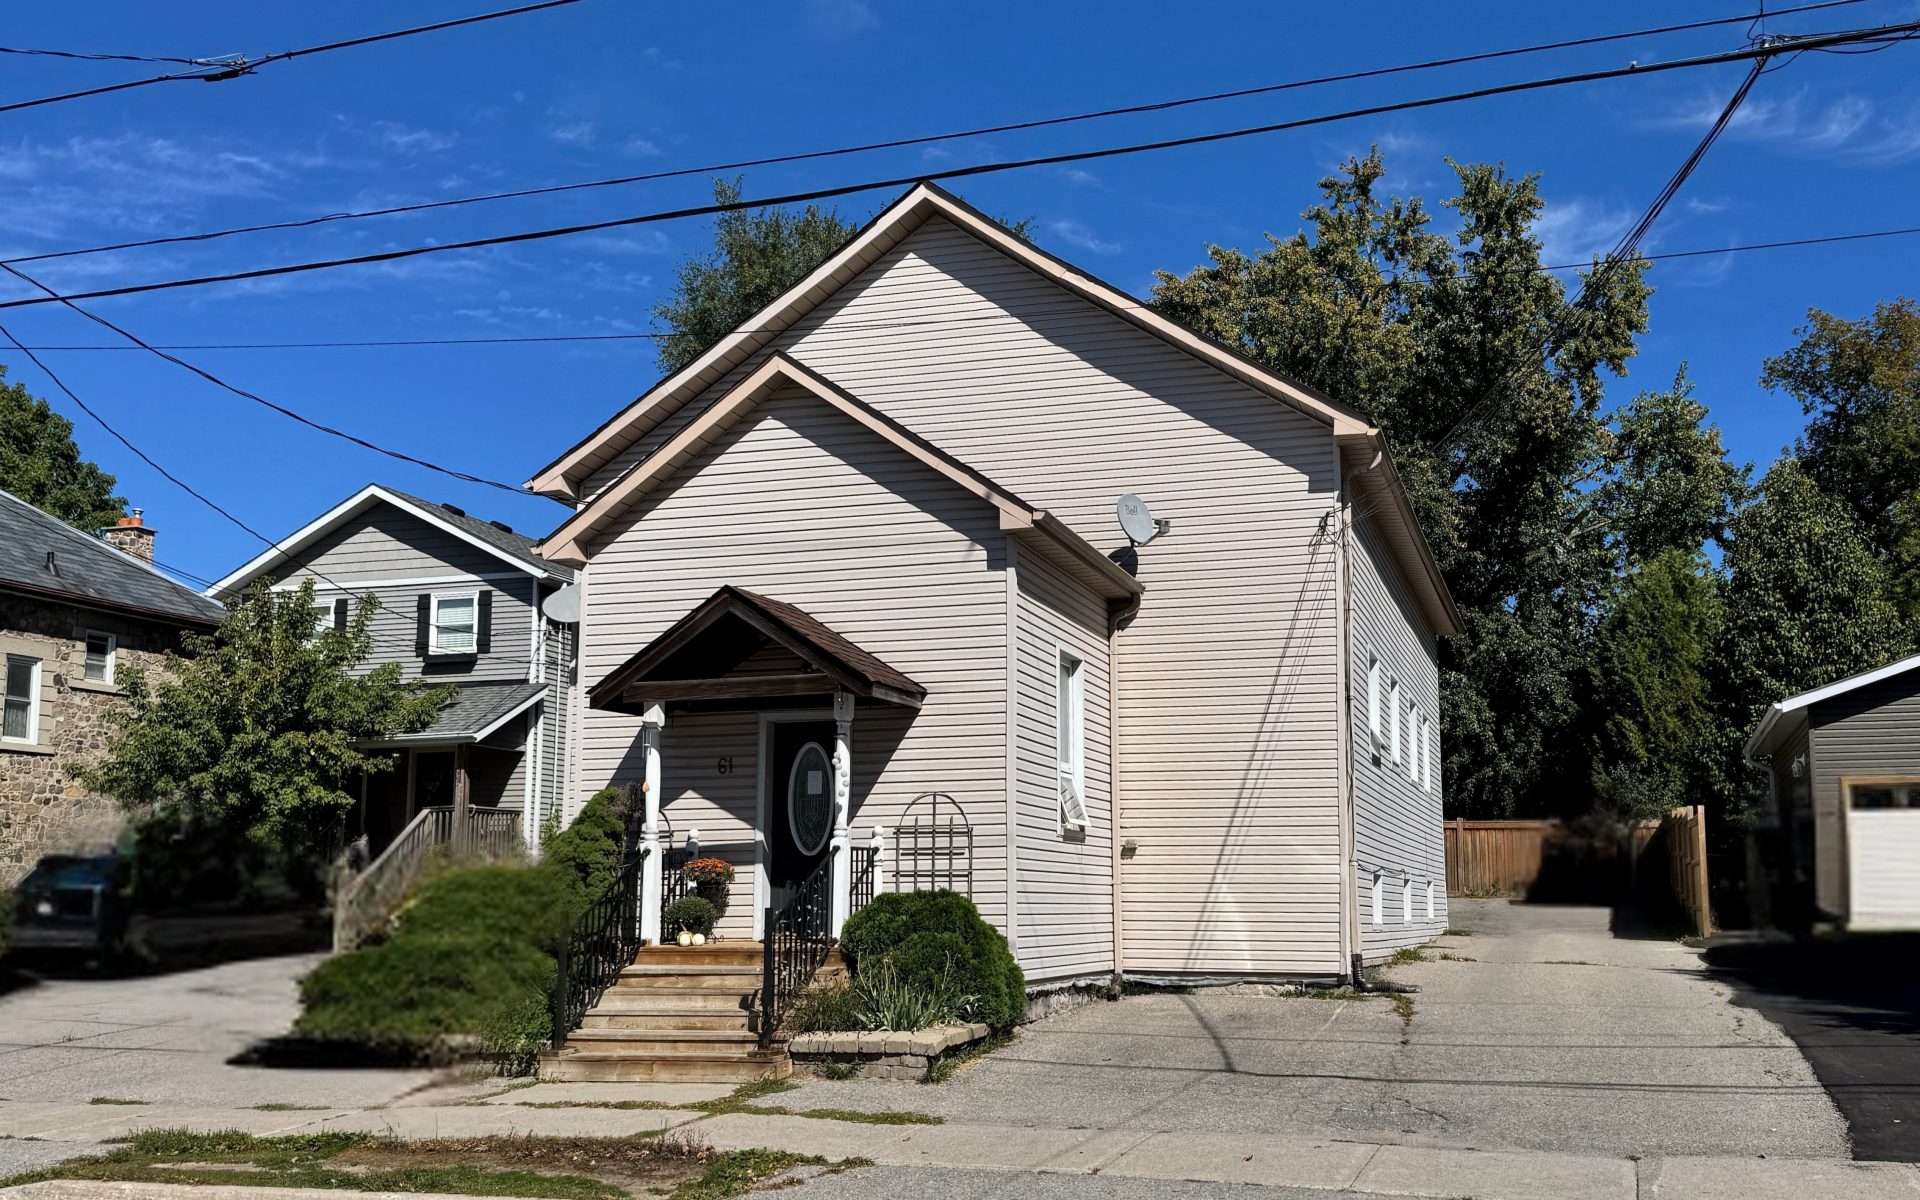
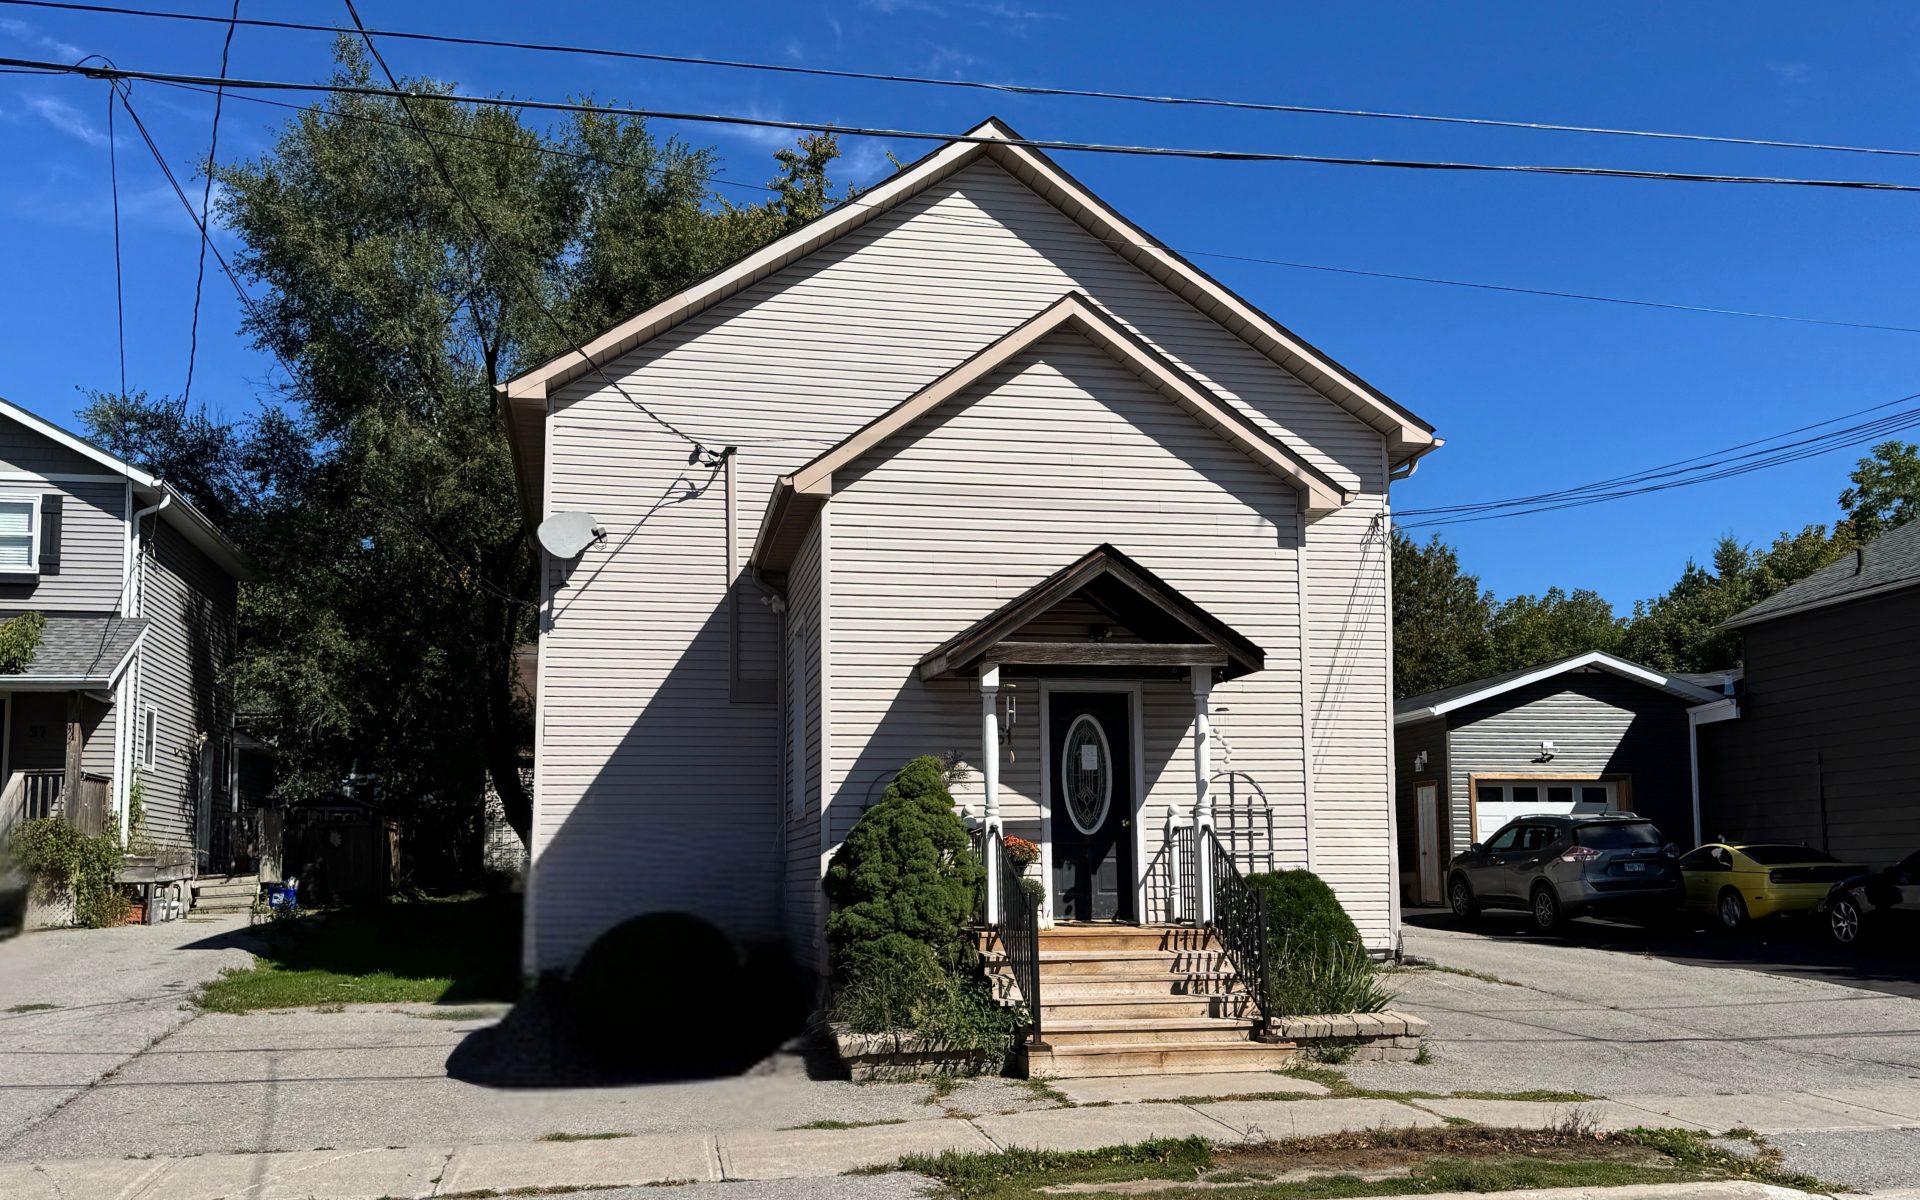
At 61 Main Street South in Uxbridge stands a building that quietly blends history with modern living. Today it’s a fourplex with four private residences, but its walls tell a story that reaches back nearly 150 years.
.
.
Beginnings on Bascom Street
This structure was originally built as a Methodist Episcopal Church on Bascom Street. In 1878—long before modern machinery—Uxbridge residents undertook the remarkable task of moving the entire church to its current location on Main Street South. Such building relocations were feats of determination and community spirit, using rollers, horses, and sheer manpower.
Becoming the Free Methodist Church
After the move, the church became known as the Free Methodist Church, serving as a place of worship and fellowship for nearly a century. Generations of Uxbridge families gathered here for services, weddings, and community events, making it a spiritual anchor in the heart of town.
Preparing for a New Home
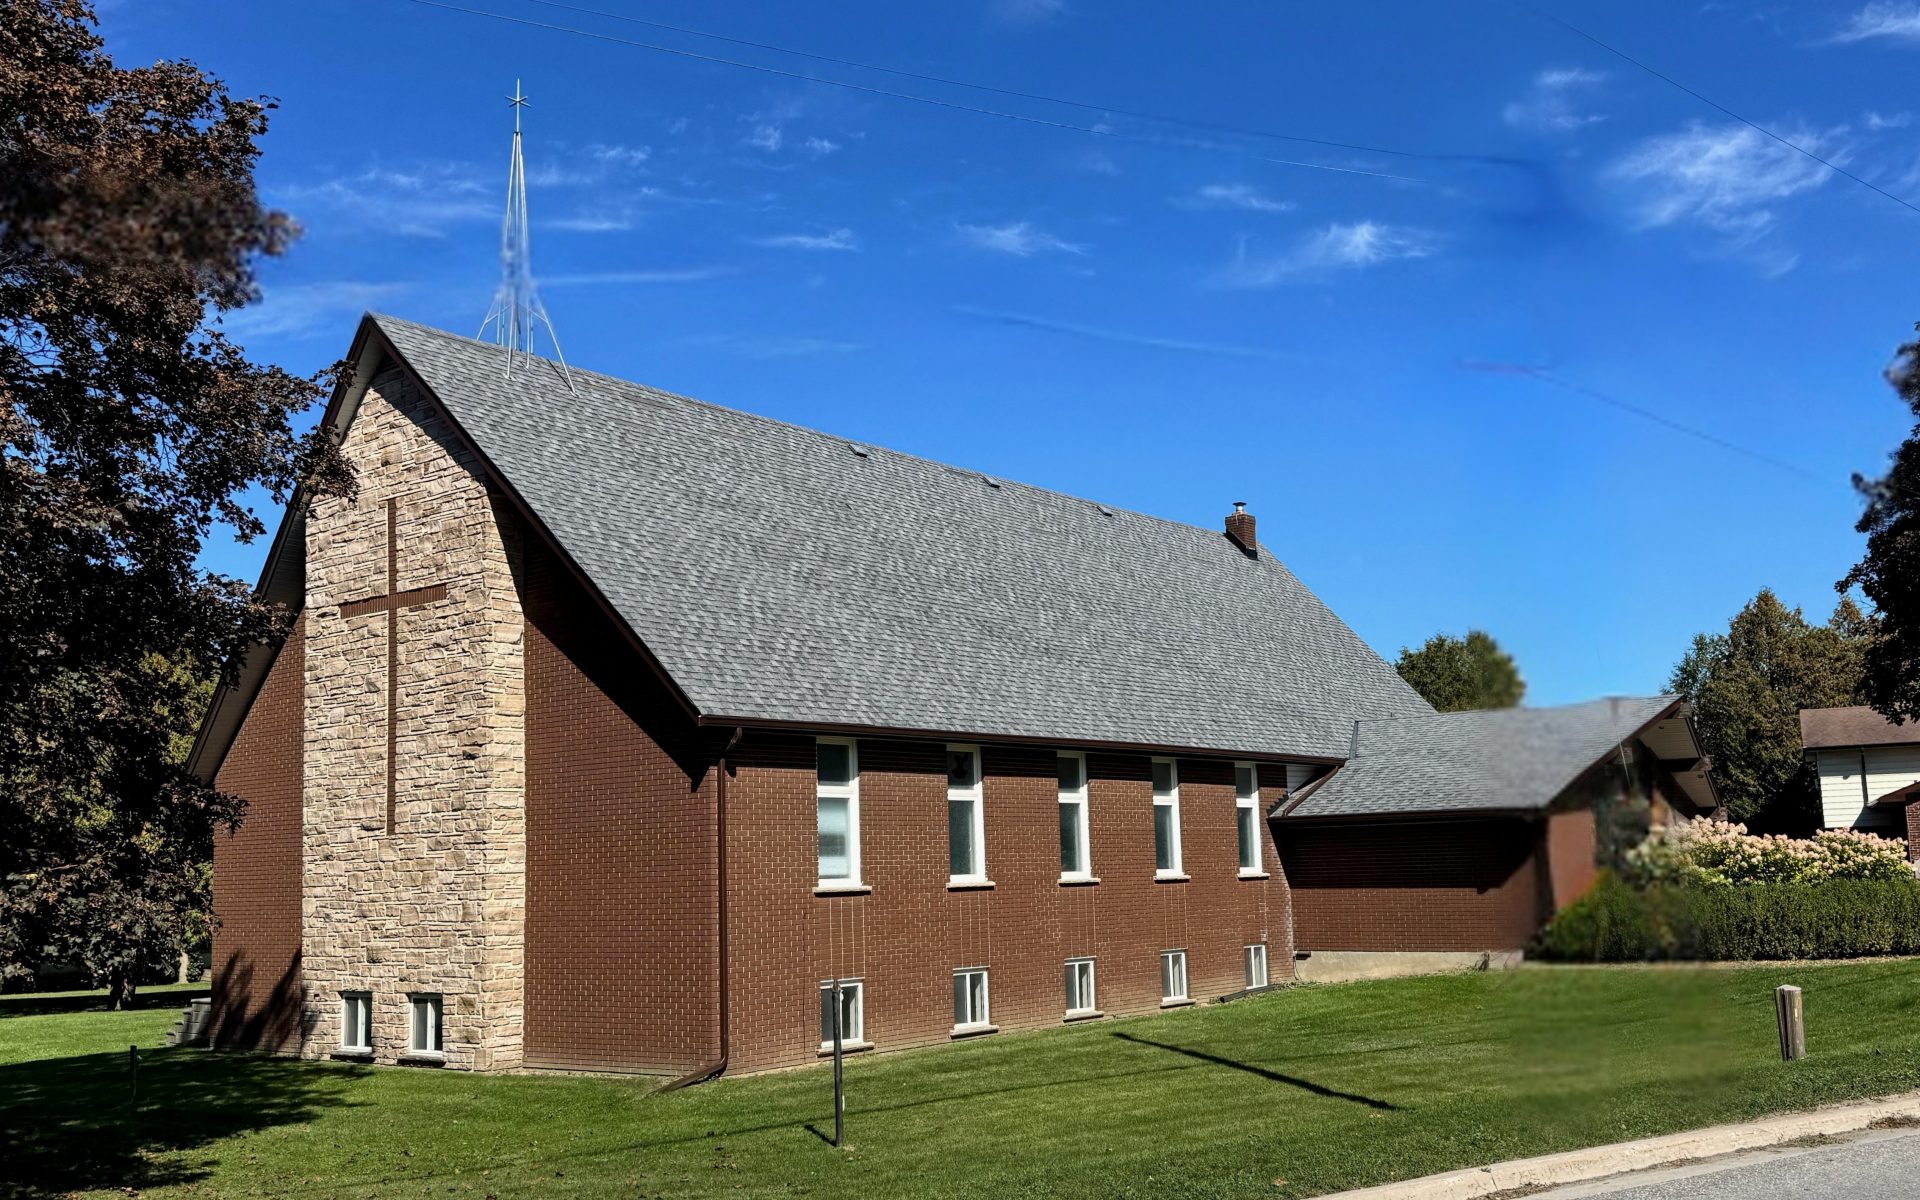
As the congregation grew, so did the need for a larger facility. In September 1963, the church purchased land on Reach Street with plans for a new, more spacious church. This forward-thinking decision paved the way for the next chapter of the congregation’s life.
A New Chapter in 1976
By 1976, the congregation had outgrown the space and built a new Free Methodist Church on the Reach St property. The original building was closed for worship, but its story didn’t end there. Rather than being demolished, it was thoughtfully converted into a fourplex, preserving its heritage while meeting a growing need for housing.
.
The Free Methodist Church on Reach Road
.
Historic Character Meets Modern Living
Even though its windows and exterior have been updated, the property still retains the proportions and overall silhouette of a traditional church, a quiet nod to its origins. Inside, the building now contains four fully self-contained units—three spacious two-bedroom suites and one well-appointed one-bedroom unit—each with its own private entrance, full four-piece bathroom, kitchen, and living area.
61 Main Street South is more than just a residence; it’s a testament to Uxbridge’s ability to adapt and preserve its history. Next time you pass by, take a moment to appreciate how this former house of worship continues to serve the community—just in a different way.
Check out our Uxbridge History Blog page to learn more about the history around Uxbridge
Check out our Uxbridge and Scugog Events Pages to keep up to date on whats going on around town. Click the links or scan the Code with your phone to take you directly there.
Monday Market Minute – Uxbridge & Scugog Real Estate Update Week of August 31 to September 6
As we move into September, the real estate markets in Uxbridge and Scugog continue to show steady activity. Inventory levels remain healthy, with both buyers and sellers adjusting to market conditions. Here’s a breakdown of what happened during the week of August 31 to September 6, 2025.
Weekly Real Estate Market Minute for the Townships of Uxbridge and Scugog
📍 Uxbridge Market Highlights
New Listings: 5 (up slightly from 4 last week)
Back on Market: 15 properties were relisted
Price Adjustments: 14 (compared to 8 last week)
Sales: 3 conditional and 4 firm (vs. 2 conditional and 5 firm last week)
Active Listings: 162 (down from 166 the week before)
Includes 17 vacant land properties and 8 condominiums
📊 Takeaway: Uxbridge held steady this week with a small increase in new listings but more price adjustments, showing sellers are adapting to shifting buyer expectations.
📍 Scugog Market Highlights
New Listings: 5 (down from 10 last week)
Back on Market: 4 properties were relisted
Price Adjustments: 3 (down sharply from 13 last week)
Sales: 4 conditional and 4 firm (vs. 1 conditional and 6 firm last week)
Active Listings: 166 (up slightly from 164 last week)
Includes 10 vacant land properties and 4 condominiums
📊 Takeaway: Scugog saw fewer new listings but stronger conditional sales activity compared to last week, while price adjustments dropped significantly — a sign of more stable pricing.
🏡 Final Thoughts
As we enter September, both Uxbridge and Scugog remain active with buyers still making moves and sellers adjusting pricing strategies to meet demand. Uxbridge’s inventory dipped slightly, while Scugog’s climbed just a bit. Overall, both markets show steady movement with a healthy mix of new and firm sales.
If you’re planning to buy or sell in Uxbridge, Scugog, or anywhere in Durham Region, we’d be happy to walk you through how these trends impact your real estate goals.
Check out our Uxbridge and Scugog Events Pages to keep up to date on whats going on around town. Click the links or scan the Code with your phone to take you directly there.
This housing report for Durham Region includes the number of new listings, average list price, number of properties sold, average selling price, average days on market and average asking price to selling price ratio for all property types within the Region of Durham.
Scroll to the bottom for links to take you to the housing market reports for Durham Region, Uxbridge and Scugog.
From Toronto Regional Real Estate Board
Please note: The PropTx MLS® System, of which TRREB is a part, has added a number of new client boards over the last year. Many of these boards’ Members trade within the Greater Toronto Area and broader Greater Golden Horseshoe regions. As a result, historic data have been updated to reflect the addition of these boards’ listings and transactions. This means historic data have changed relative to previously published static reports. To view updated historic data, click here.
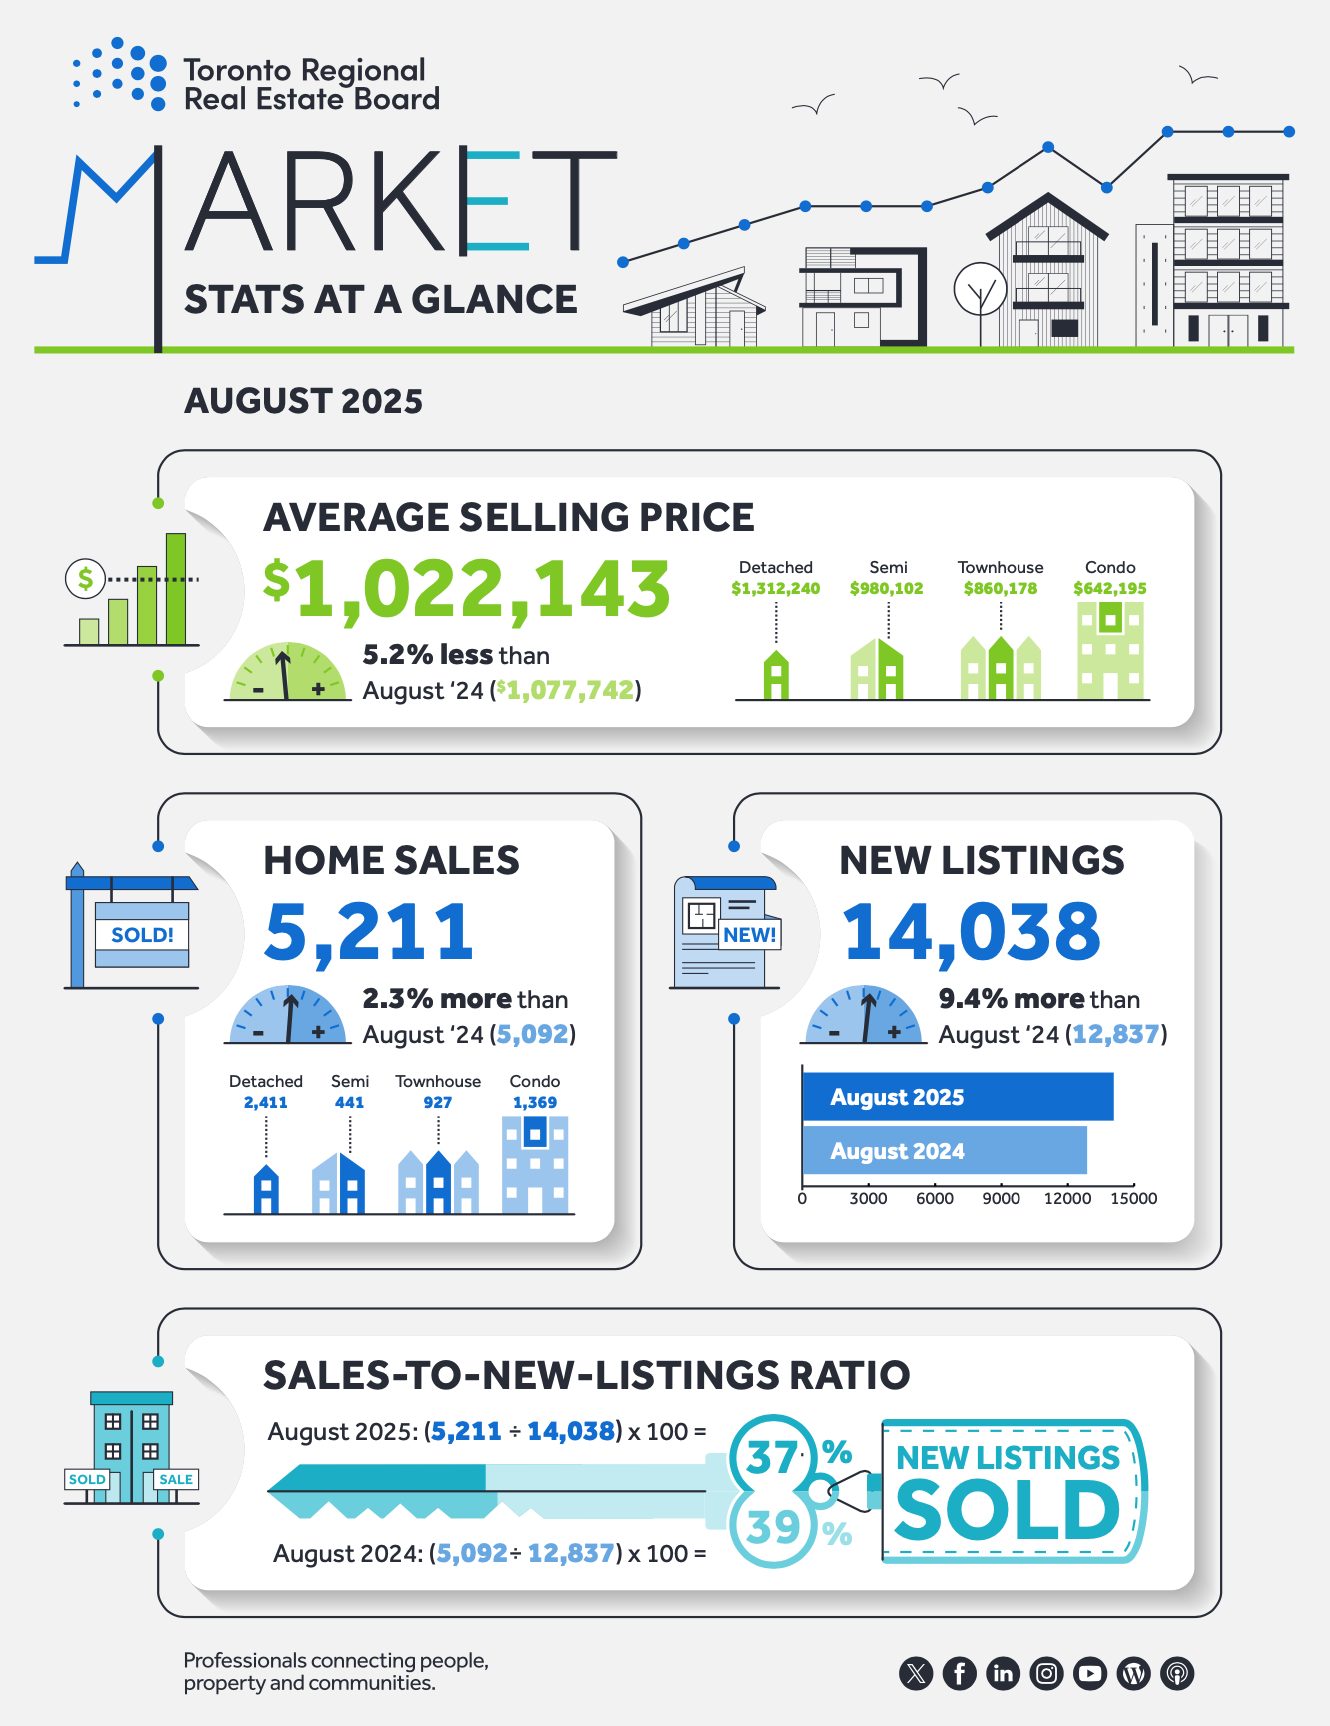
Toronto Regional Real Estate Board – Market Stats At A Glance – August 2025
Brock Township Real Estate Market Analysis – August 2025
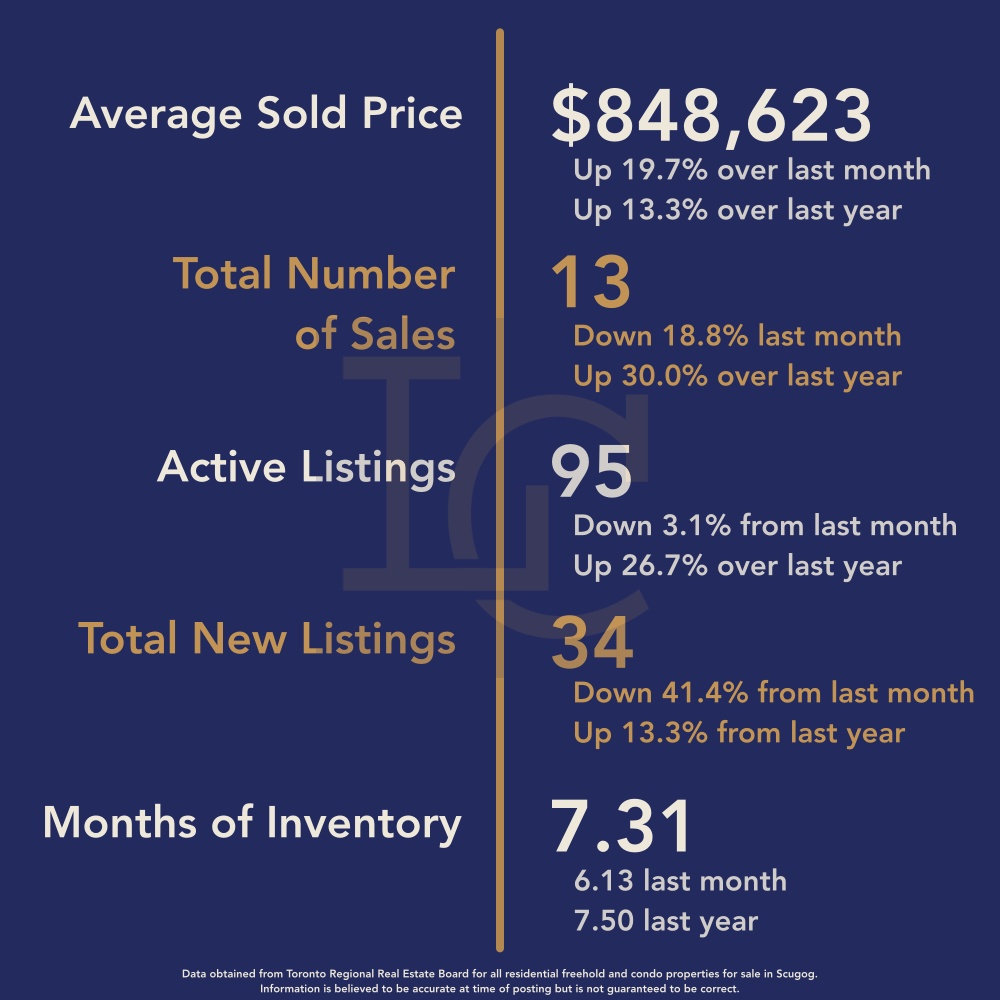
The Brock Township real estate market showed strong price growth in August 2025, even as sales activity eased slightly and inventory conditions tilted further into a buyer’s market. High-value transactions once again influenced average pricing, while overall demand remained steady.
August 2025
July 2025
Average Sale Price Jumps – Driven by Luxury Sales
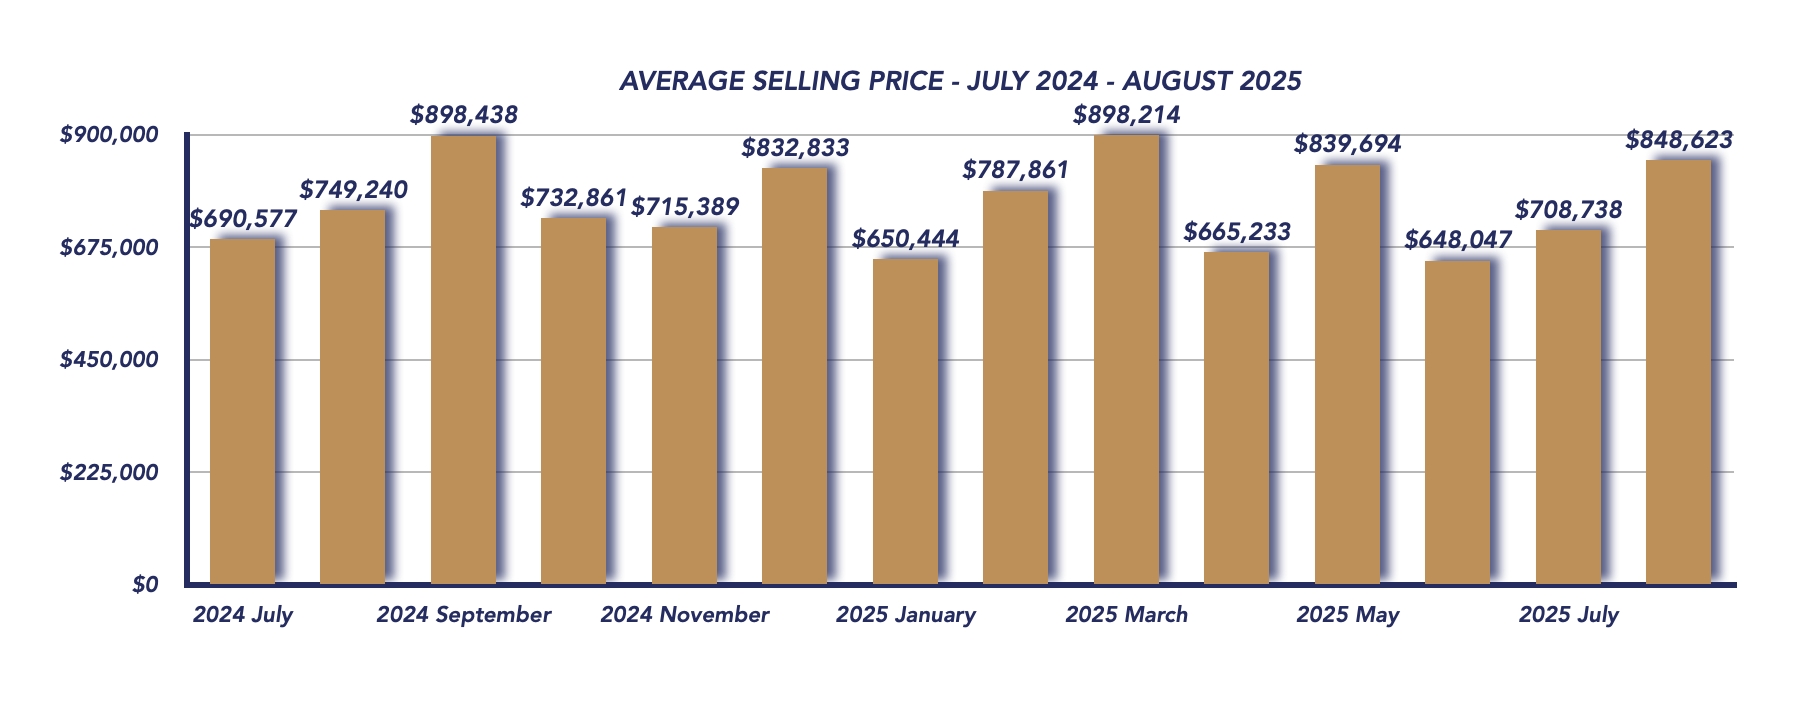
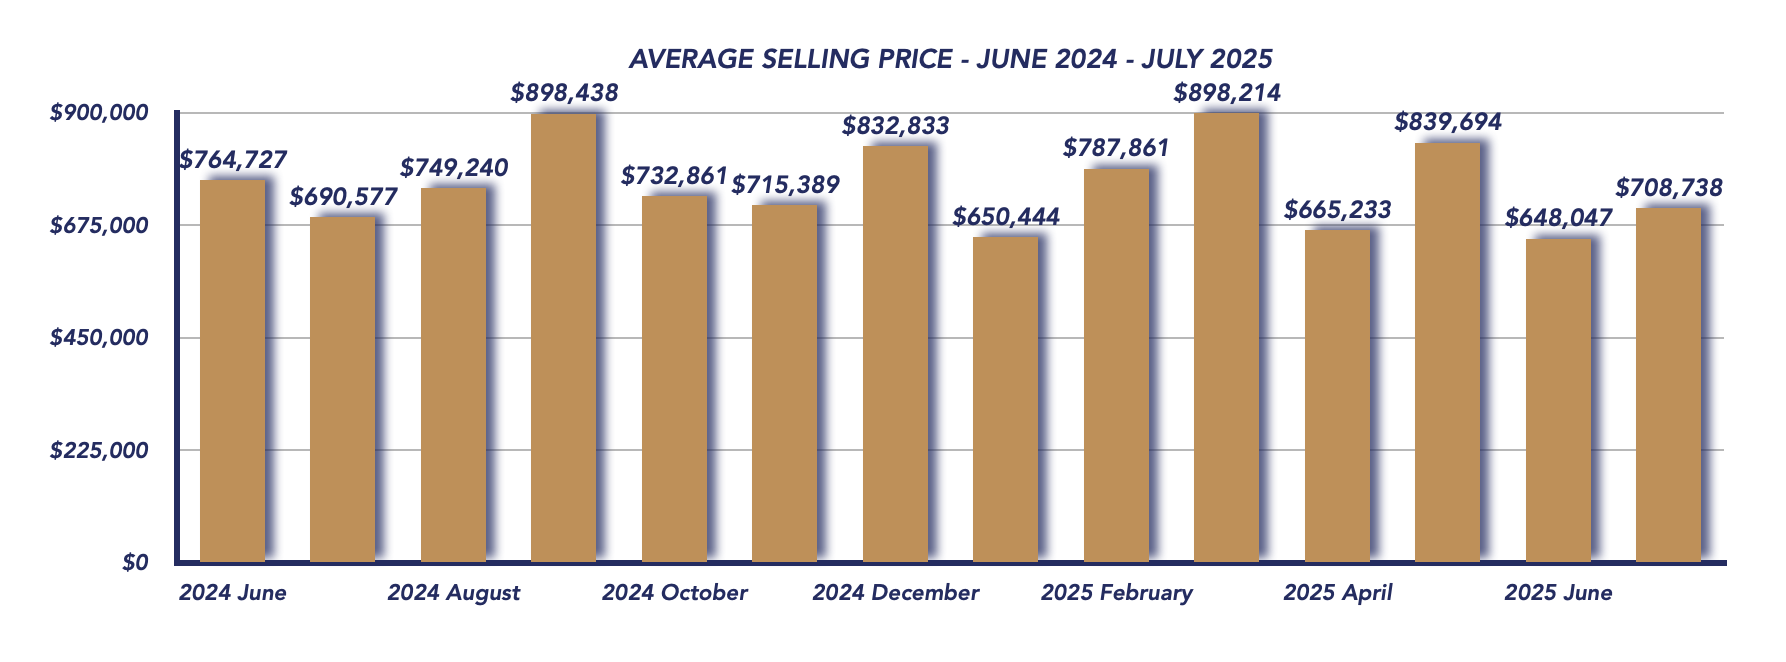
The average sale price in August 2025 climbed to $848,623, representing a 19.7% increase from July 2025 ($708,738) and a 13.3% rise year-over-year from $749,240 in August 2024.
However, this figure is skewed by the sale of two properties over $1.5 million, while the rest of the month’s transactions closed under $950,000. In July, a farm property sold for $1.3 million, but more than half of sales that month were under $800,000. This shows that while average prices are up, most homes in Brock continue to sell in a more moderate price range.
Sales Activity Slows Seasonally
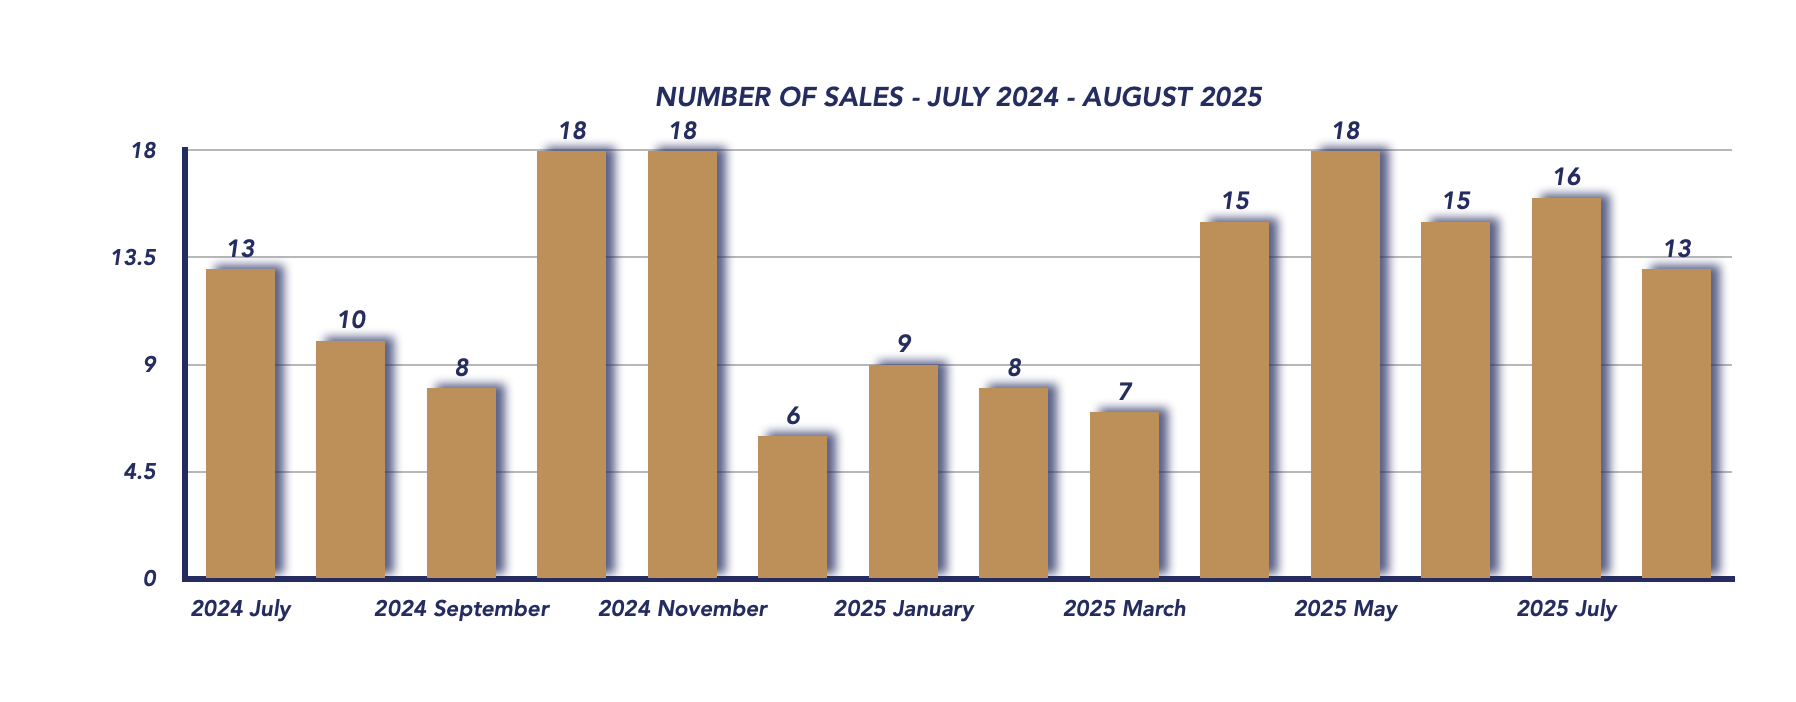
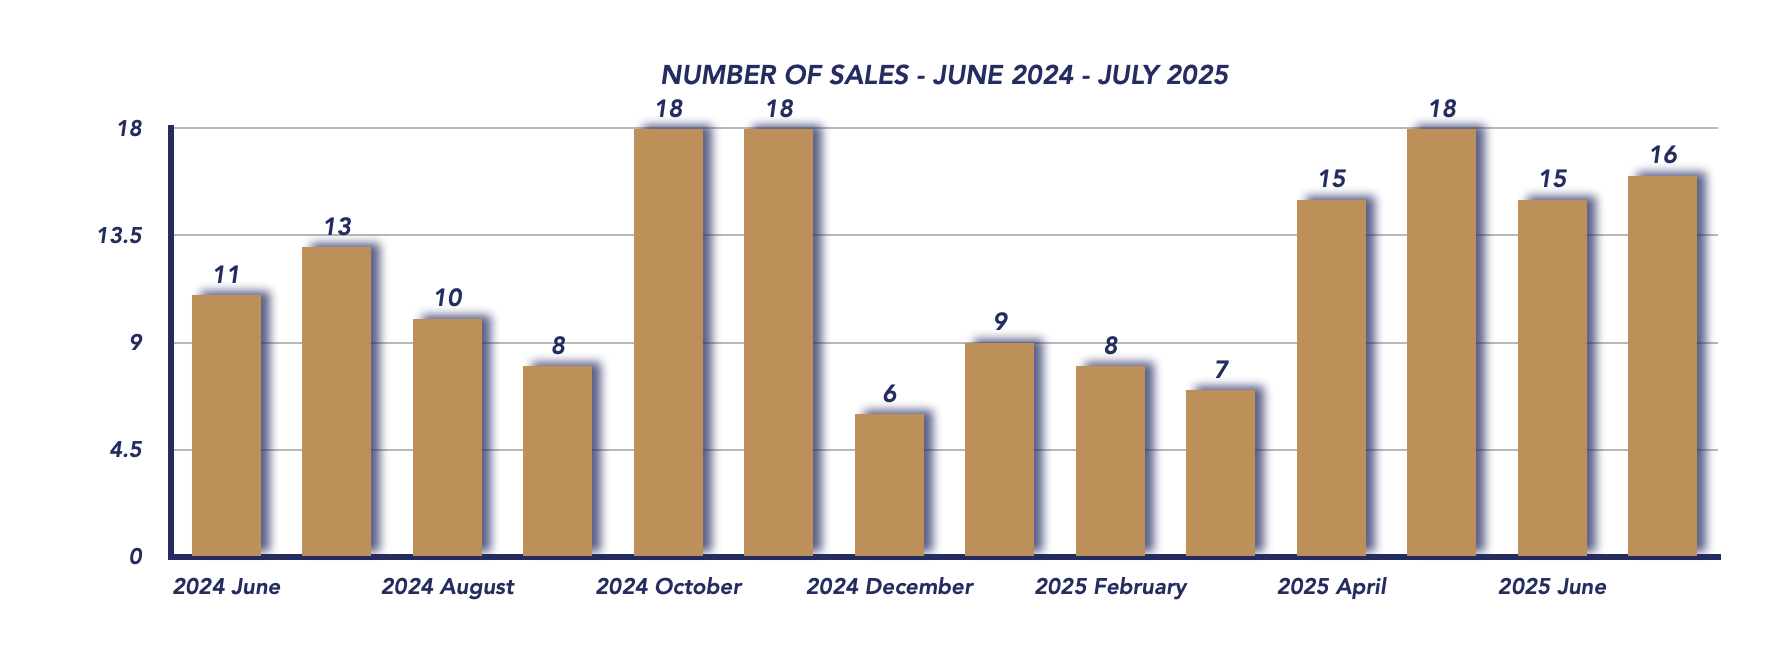
There were 13 home sales in August, down from 16 in July 2025, but still above the 10 sales recorded in August 2024. This dip reflects the usual late-summer slowdown, though year-over-year growth highlights that demand remains stronger than last year.
Sale-to-List Price Ratio Strengthens
Sellers enjoyed slightly more favourable conditions in August, with the sale-to-list price ratio improving to 98%, up from 96% in July and 97% last year. This suggests that buyers, despite more choices, are willing to pay close to asking prices for well-priced properties.
Inventory Remains Elevated
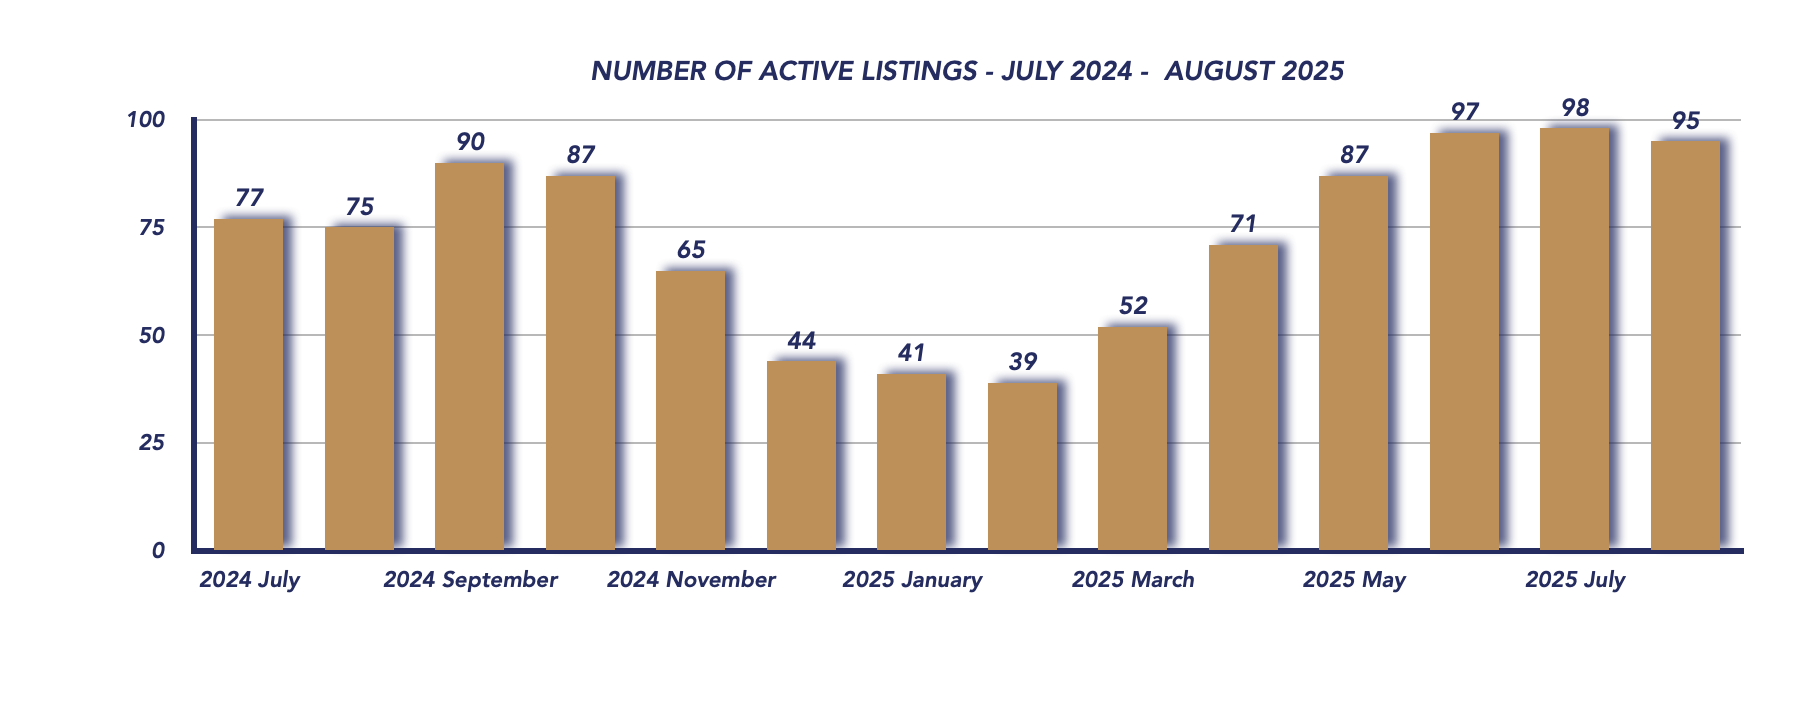
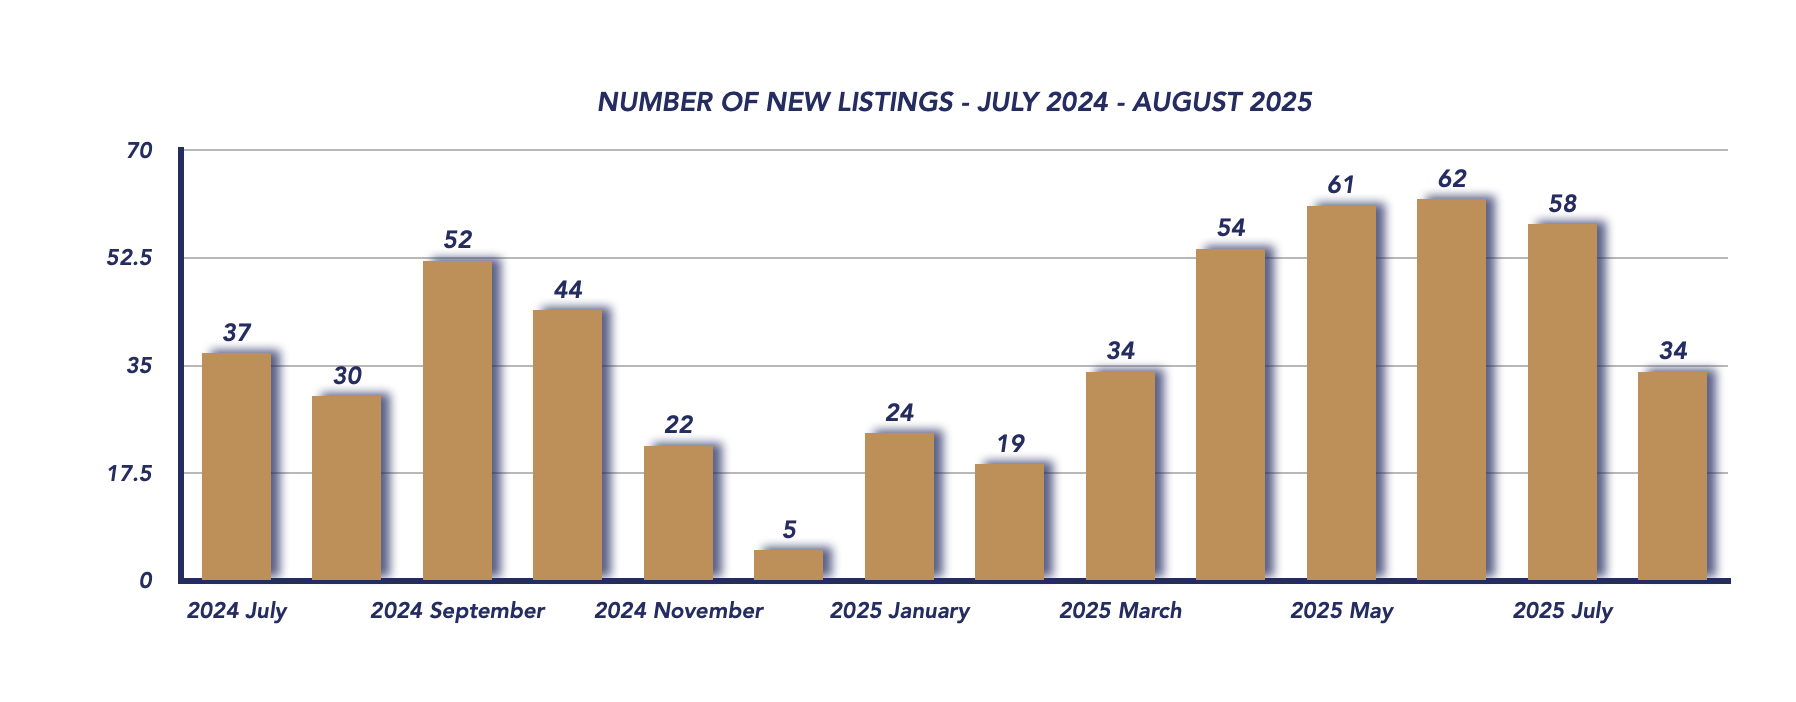
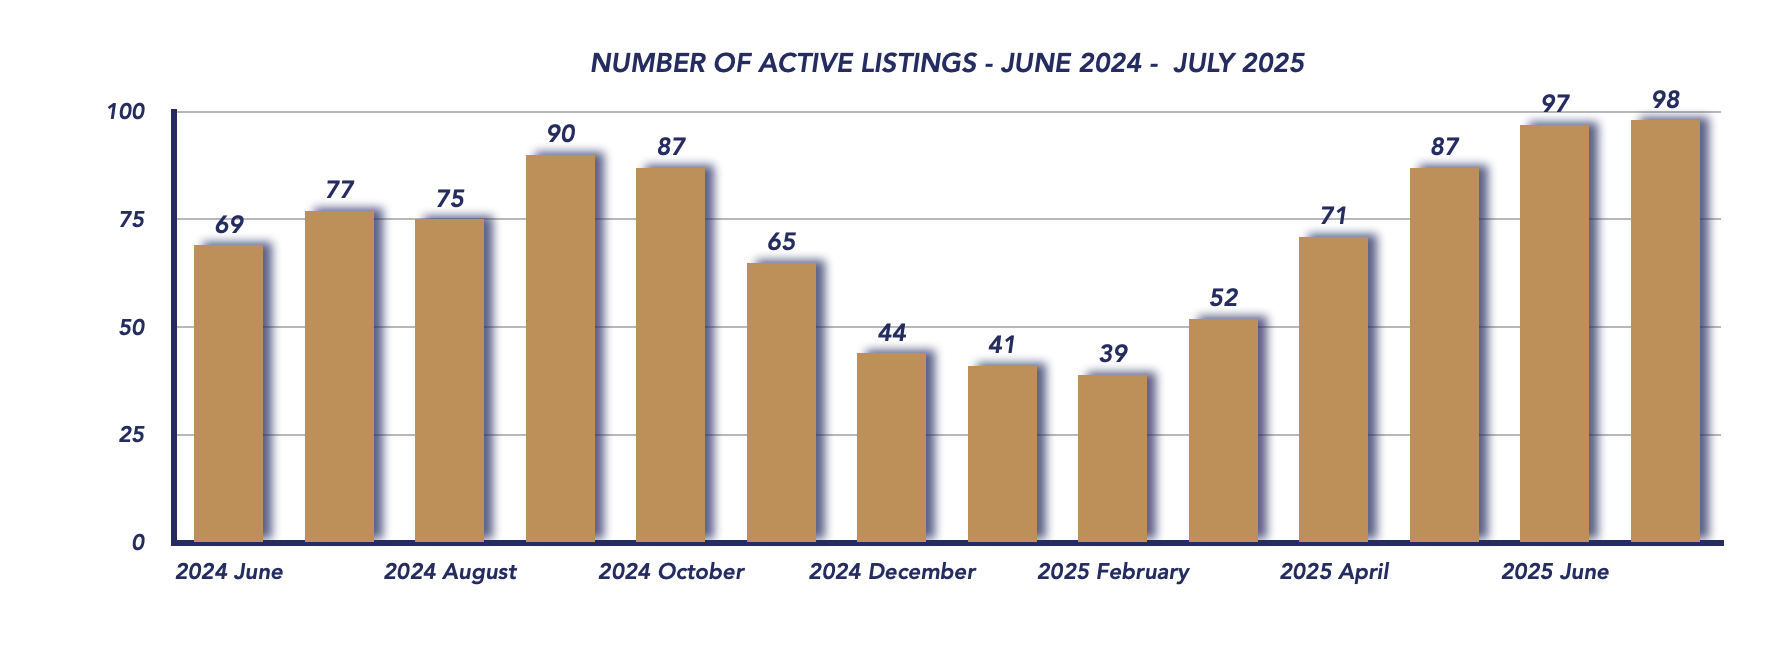
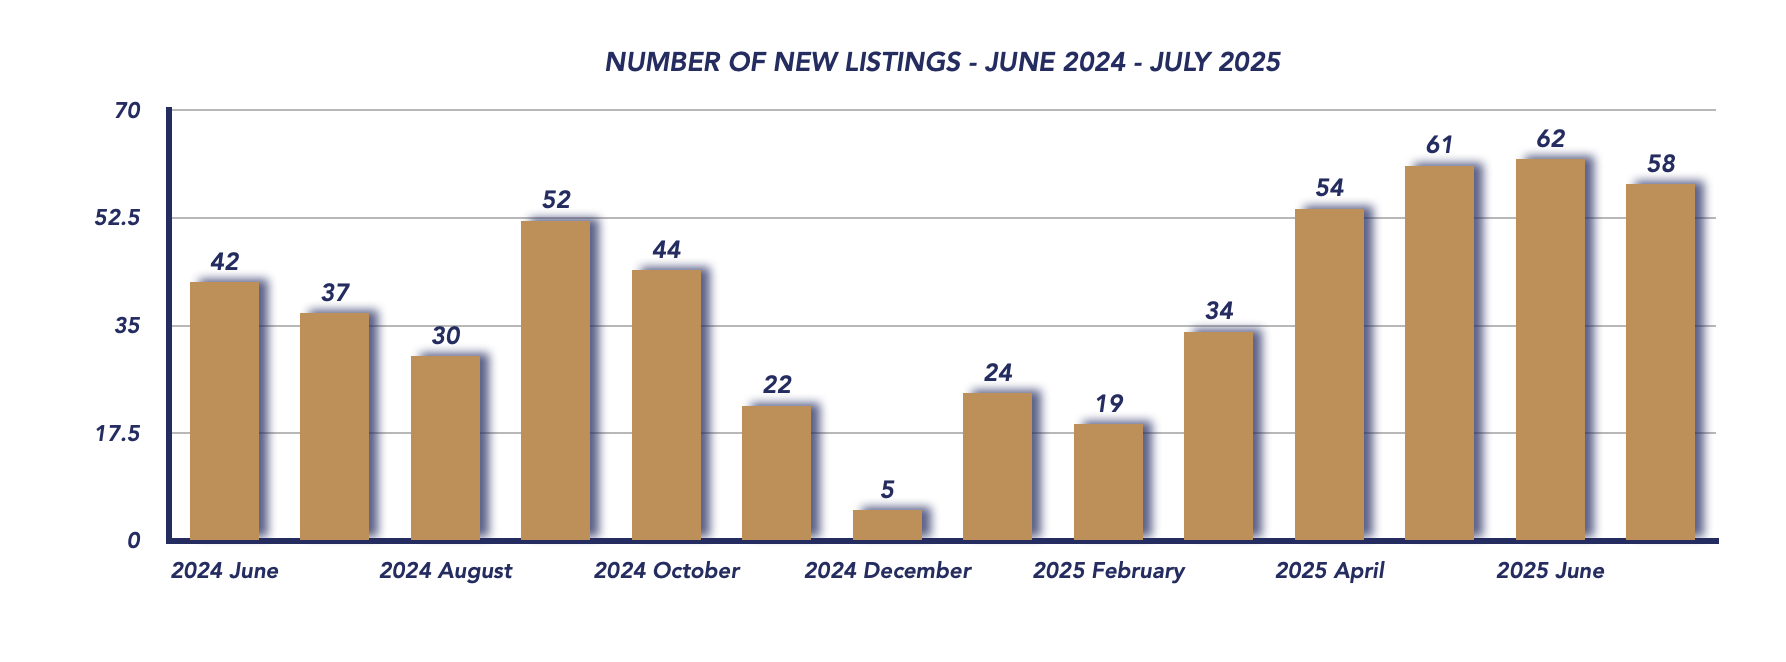
Active listings totaled 95, just below July’s 98, but well above the 75 listings recorded in August 2024. New listings, however, slowed to 34, compared to 58 in July, though still higher than the 30 new listings last year. This slight pullback may help temper supply growth heading into the fall.
Days on Market & Buyer’s Market Conditions
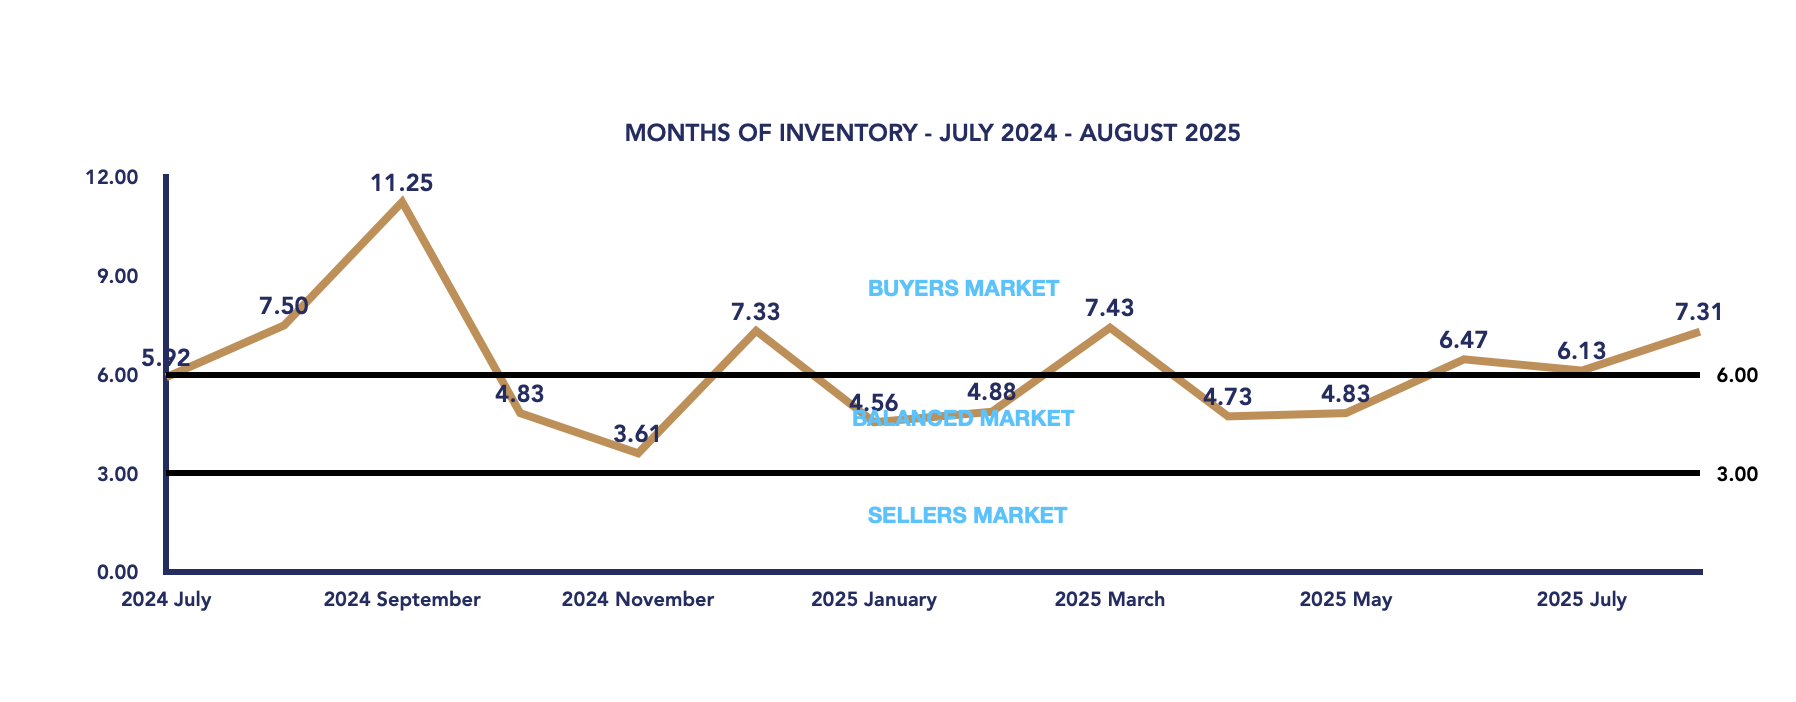
Homes took an average of 50 days to sell, reflecting longer selling times compared to earlier this year. Meanwhile, months of inventory increased to 7.31, up from 6.13 in July, pushing Brock Township further into buyer’s market territory. Buyers now have greater negotiating power, particularly in mid-range price brackets where inventory is deepest.
Conclusion
August 2025 was a month of contrasts for the Brock Township real estate market. While the average sale price rose sharply due to a handful of luxury transactions, the majority of homes sold at more typical price points. Sales activity cooled slightly, but remained stronger than last year, while elevated inventory continues to favor buyers. As the market transitions into the fall season, sellers will need to remain competitive on pricing and presentation, while buyers benefit from more choice and negotiating leverage.
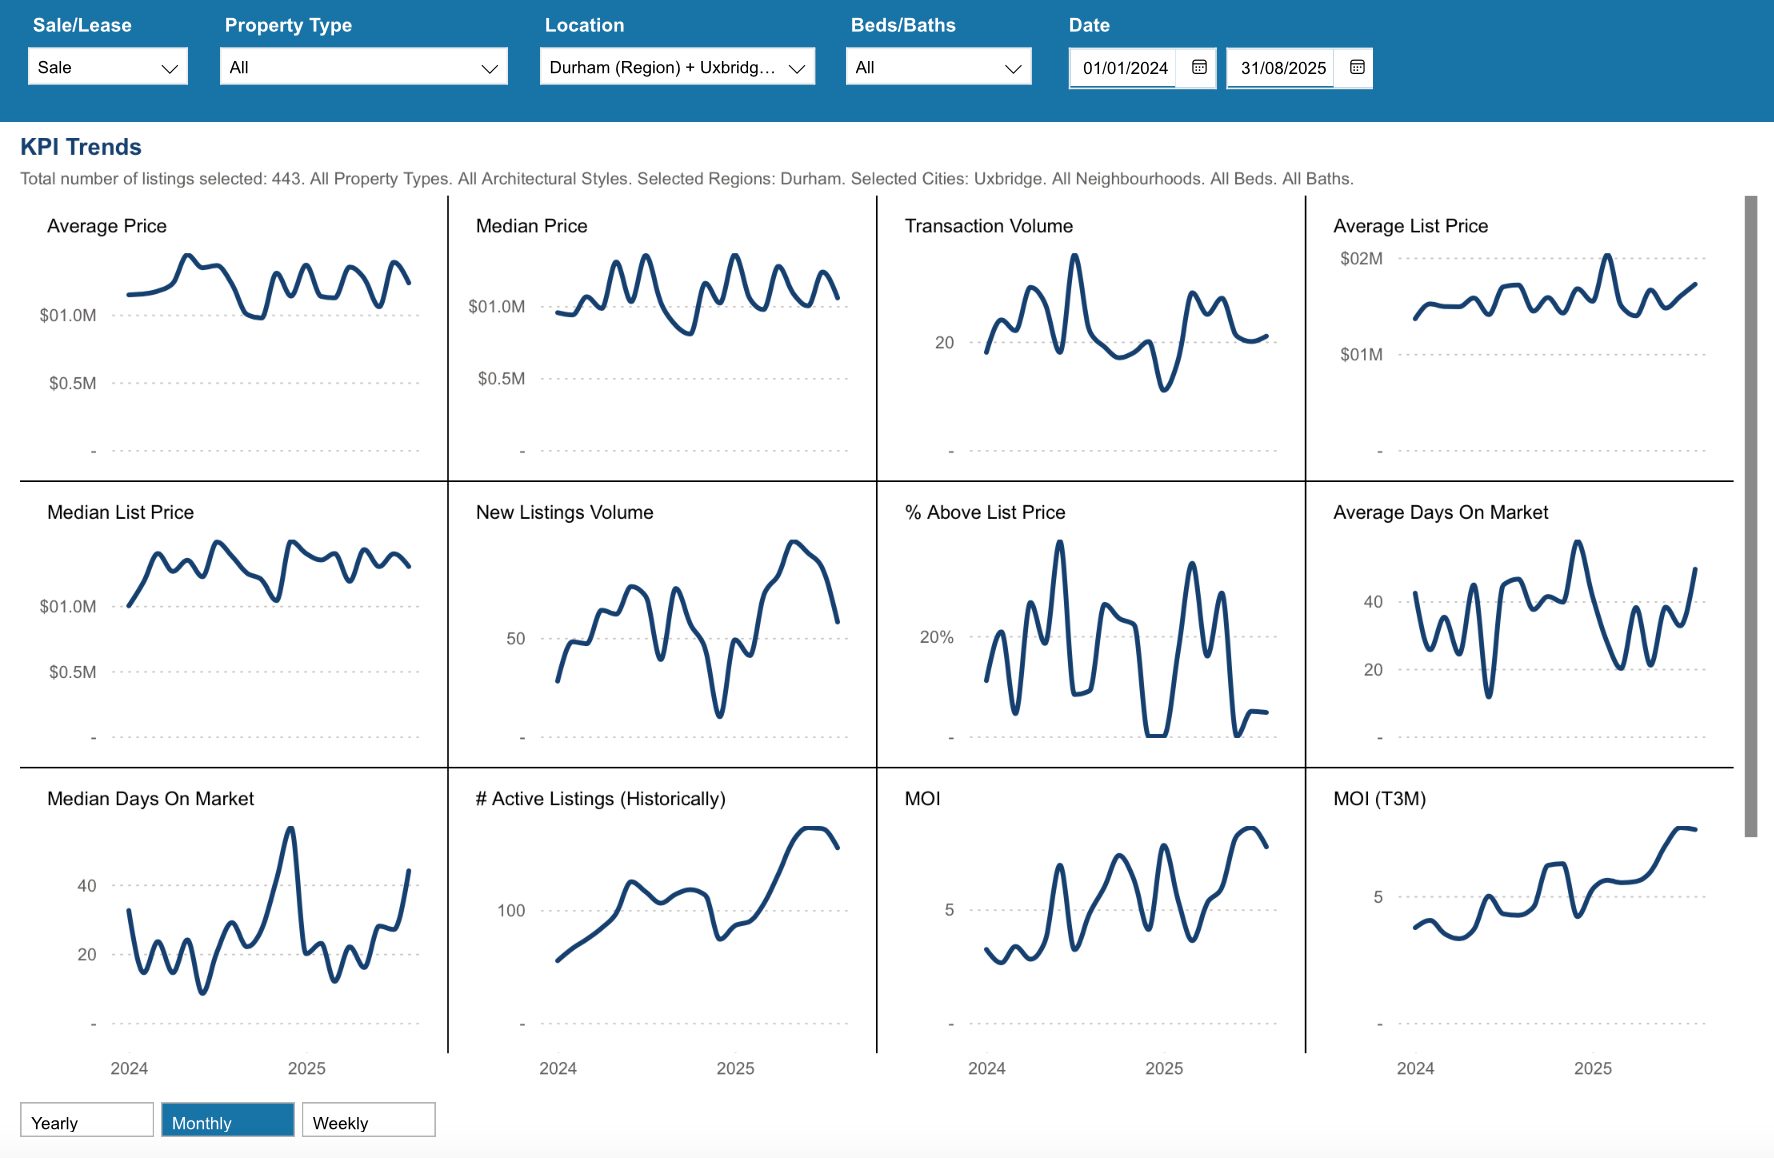
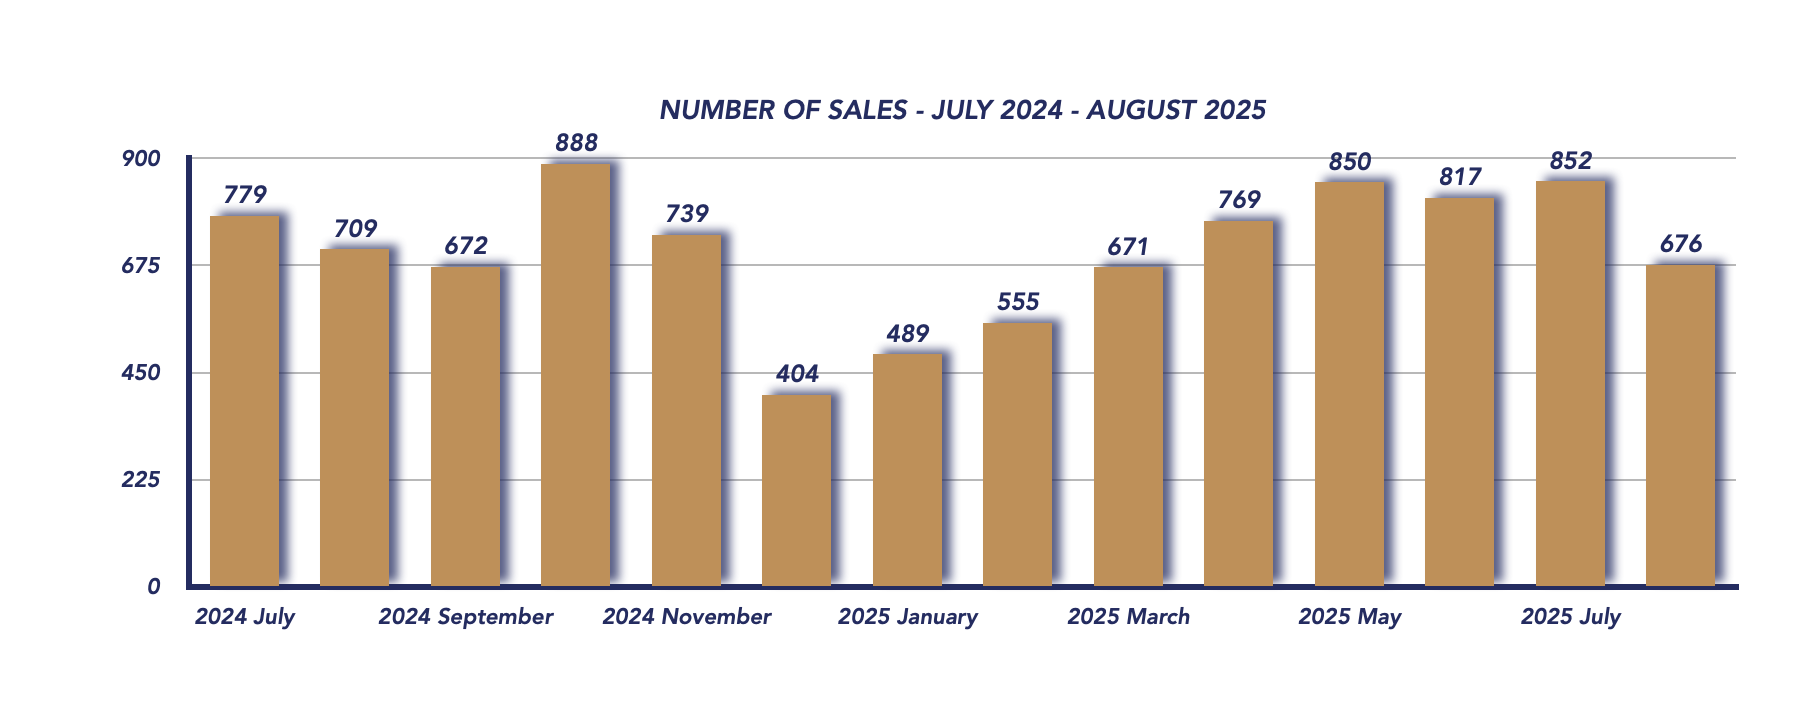
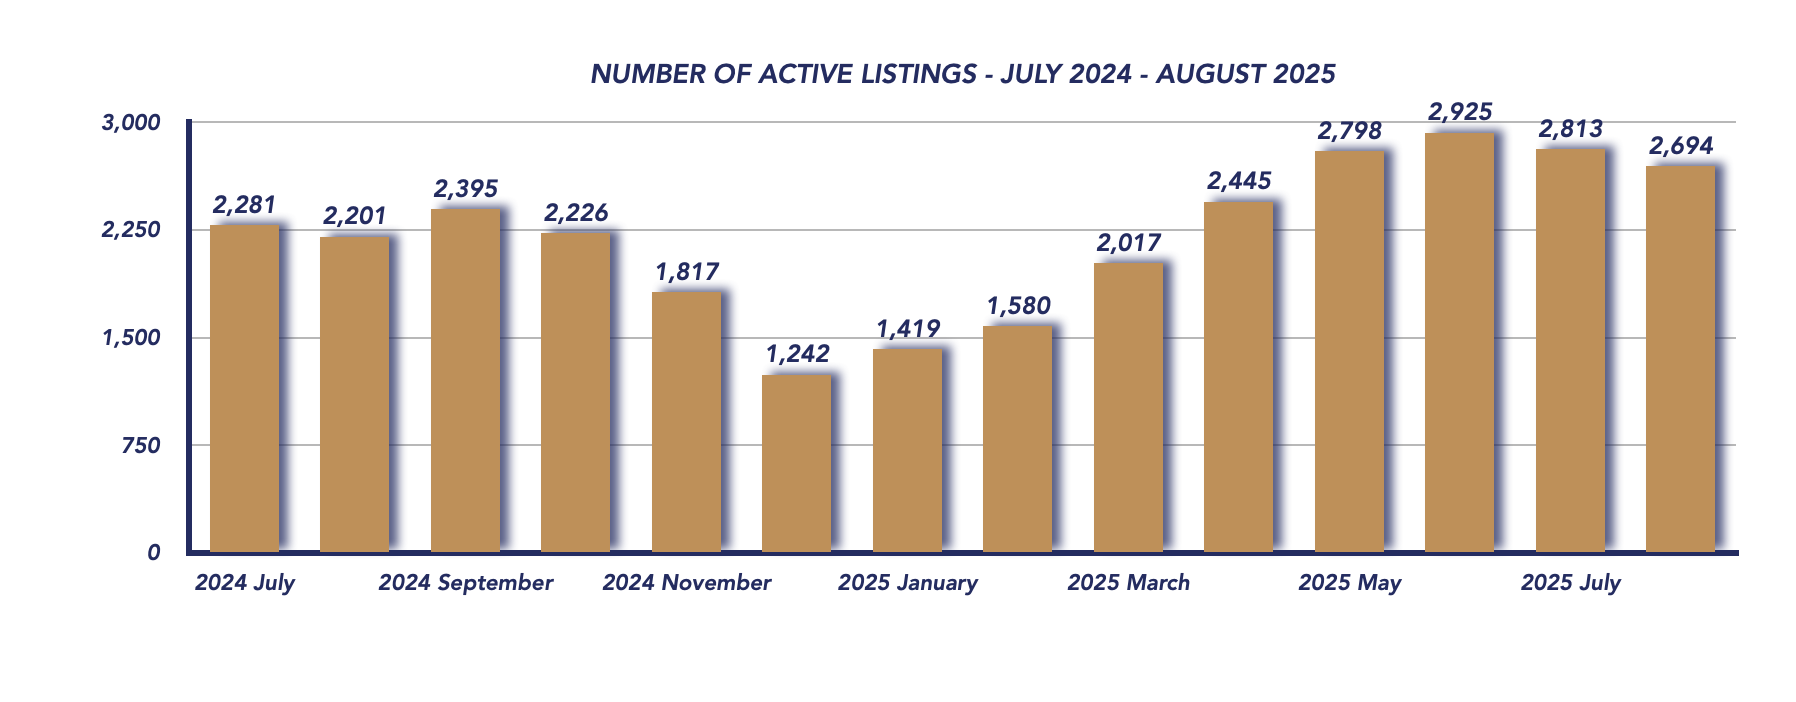
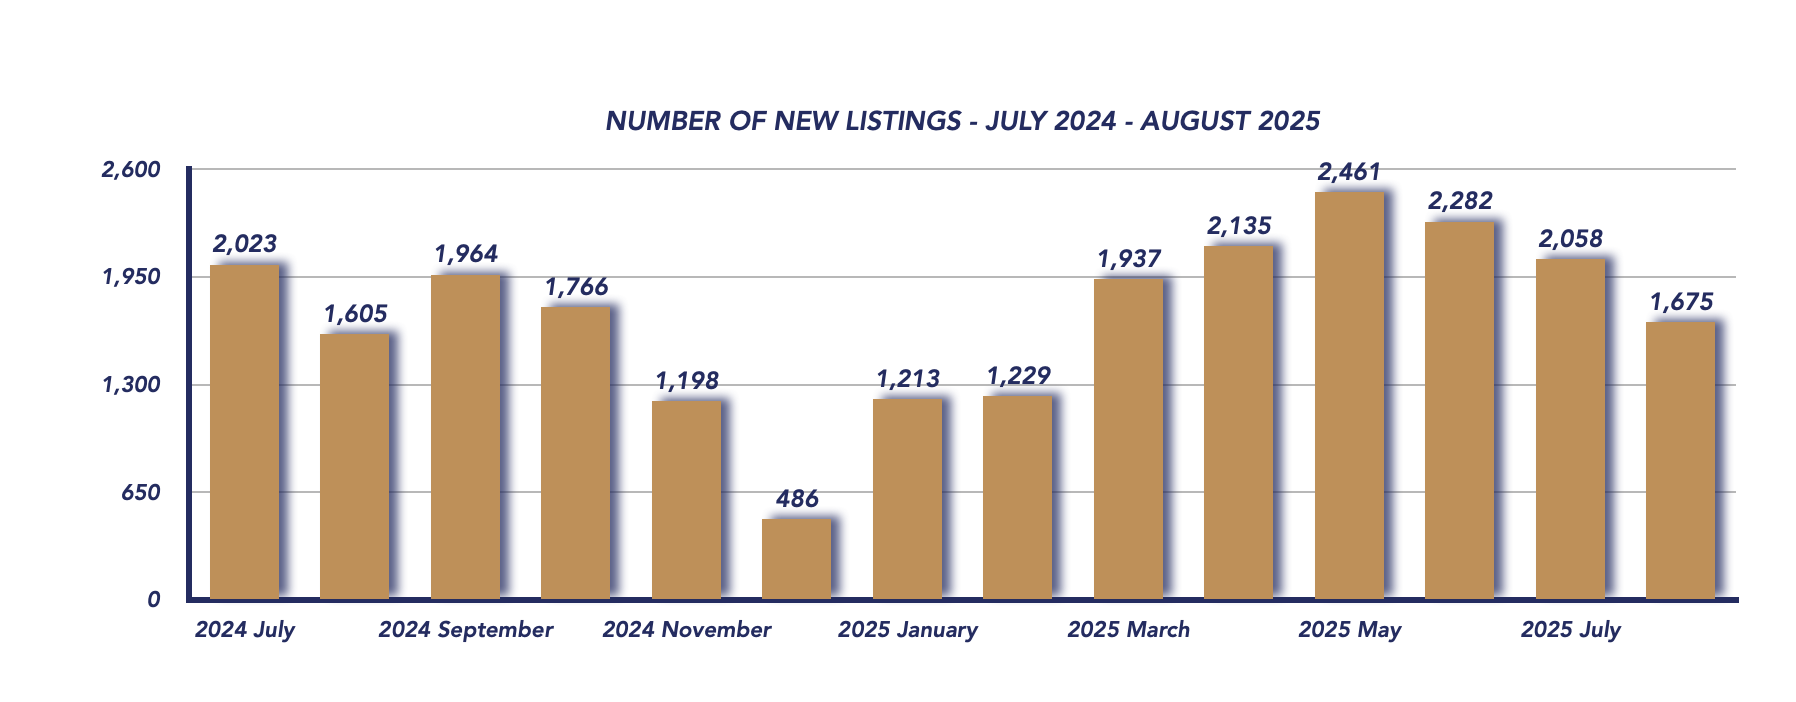
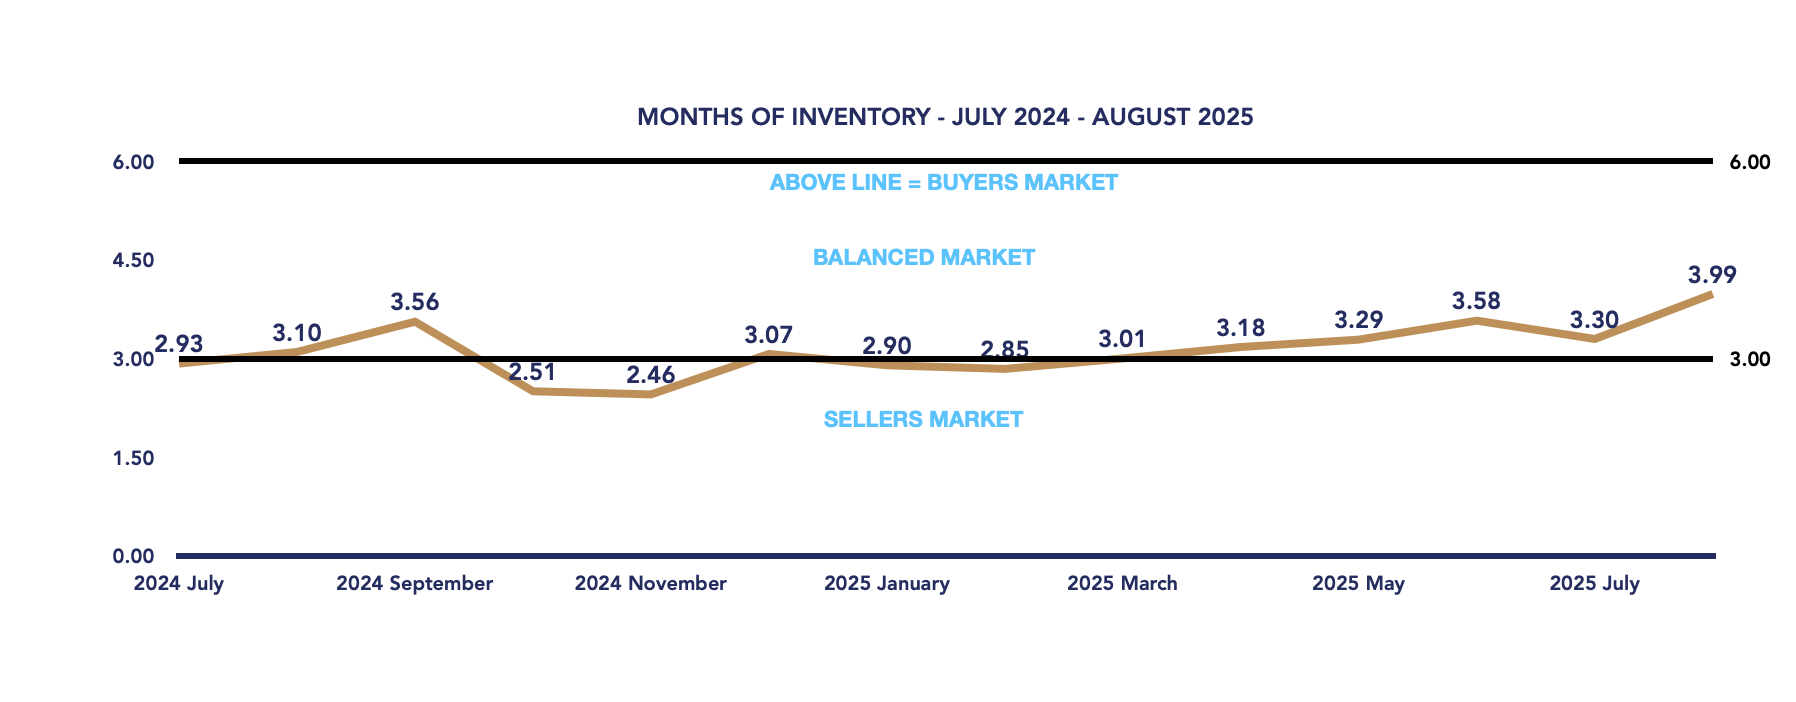
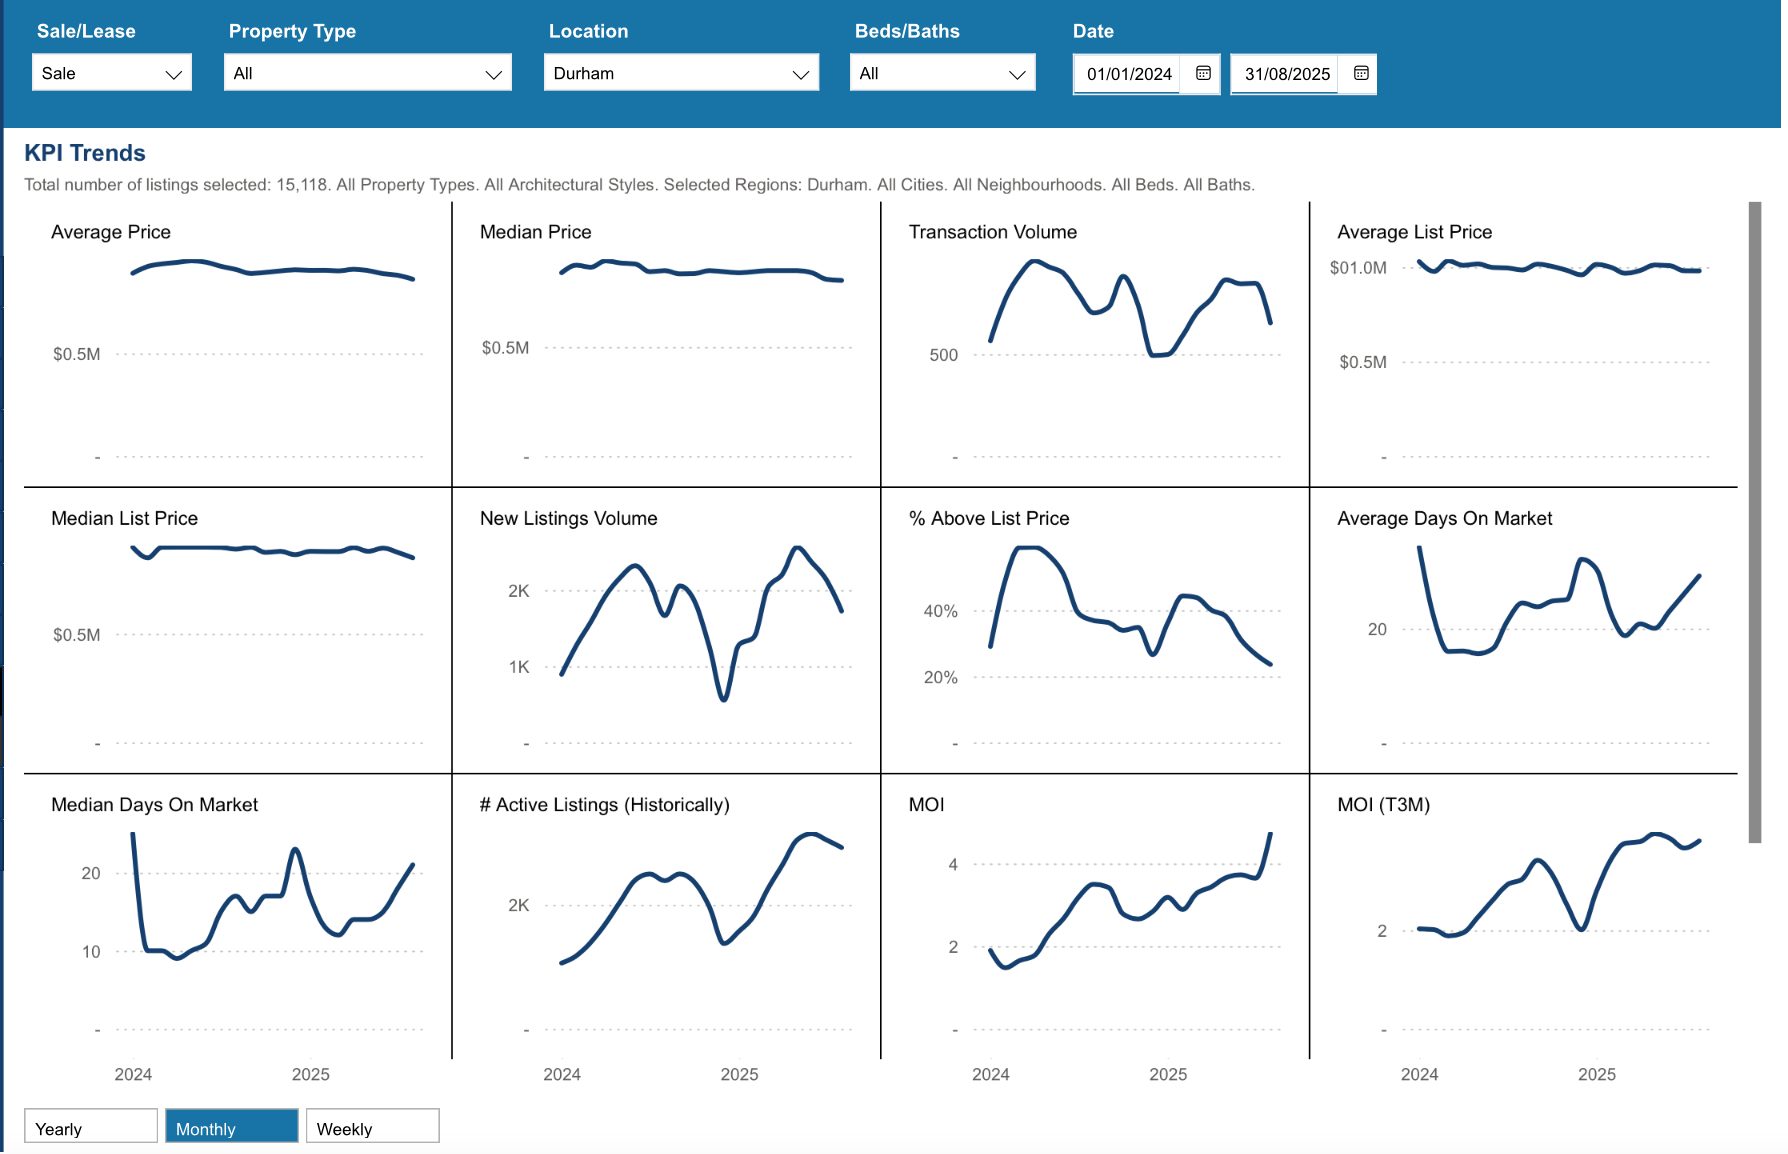
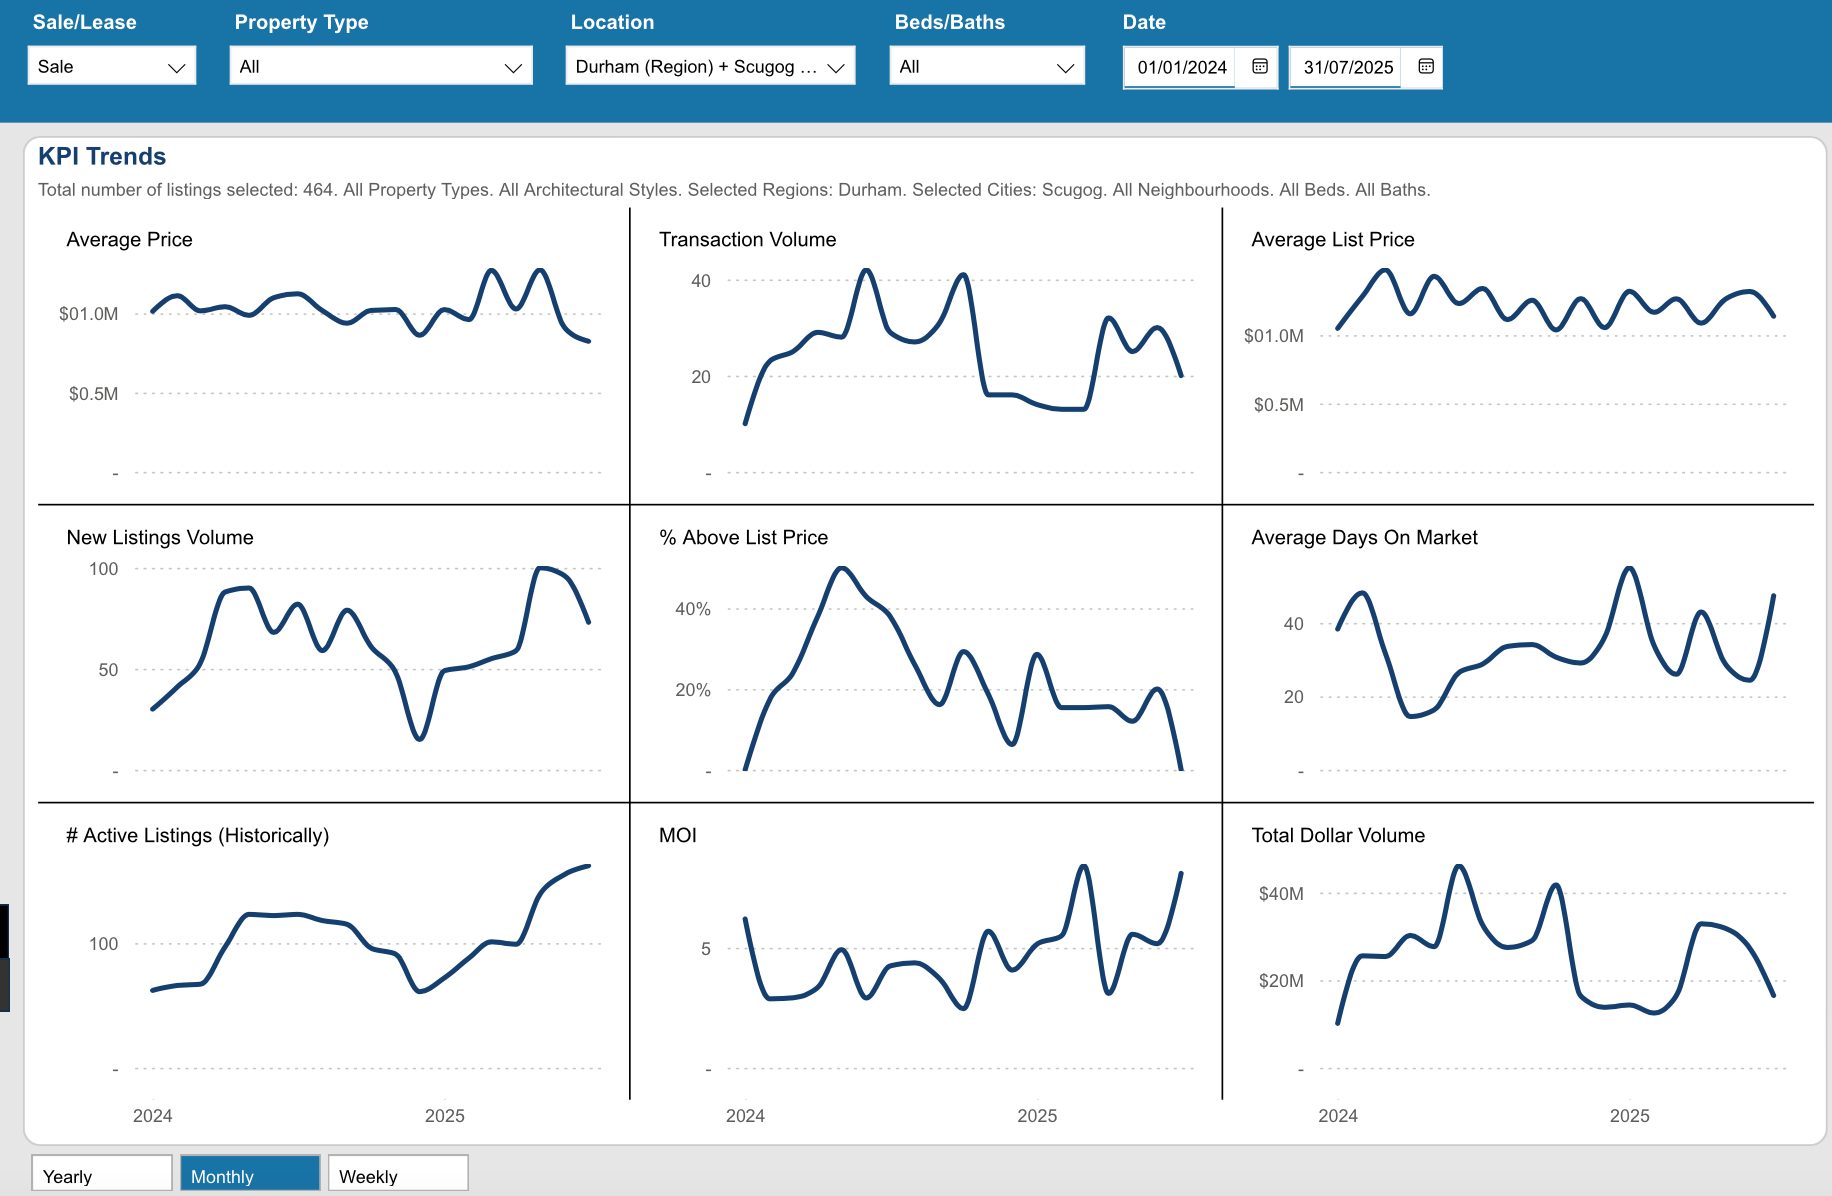
Key Performance Indicators (KPIs) from January 2024 through August 2025 provide a clear snapshot of how the Durham Region real estate market has evolved across all property types, architectural styles, and home configurations
*Information is believed to be accurate at time of posting but is not guaranteed to be correct. Some values may vary slightly based on the exact date and time the reports were generated. Market stats are provided by TRREB (Toronto Regional Real Estate Board) and are based on sales for the month of Attached/Row/Townhouses, Condo Apartments, Condo Townhouses, Detached, Detached with Common Elements, Link Homes and Semi-detached. *Some values may vary slightly based on the exact date and time the reports were generated.
Check out our Uxbridge and Scugog Events Pages to keep up to date on whats going on around town. Click the links or scan the Code with your phone to take you directly there.
This housing report for Durham Region includes the number of new listings, average list price, number of properties sold, average selling price, average days on market and average asking price to selling price ratio for all property types within the Region of Durham.
Scroll to the bottom for links to take you to the housing market reports for Durham Region, Uxbridge and Brock.
From Toronto Regional Real Estate Board
Please note: The PropTx MLS® System, of which TRREB is a part, has added a number of new client boards over the last year. Many of these boards’ Members trade within the Greater Toronto Area and broader Greater Golden Horseshoe regions. As a result, historic data have been updated to reflect the addition of these boards’ listings and transactions. This means historic data have changed relative to previously published static reports. To view updated historic data,click here.
Toronto Regional Real Estate Board – Market Stats At A Glance – August 2025
The Township of Scugog’s housing market saw a mix of ups and downs in August 2025, reflecting the balancing act between buyer demand and available supply.
August 2025
July 2025
Average Sales Price
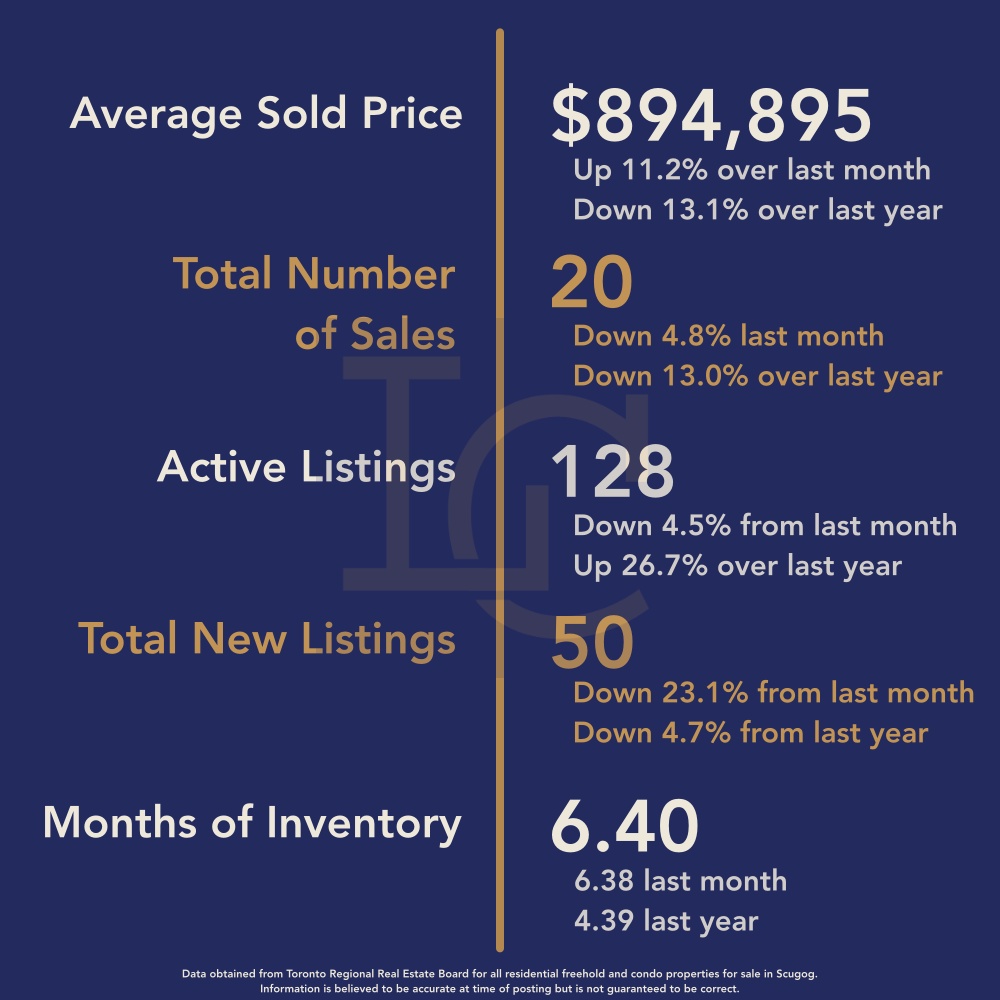
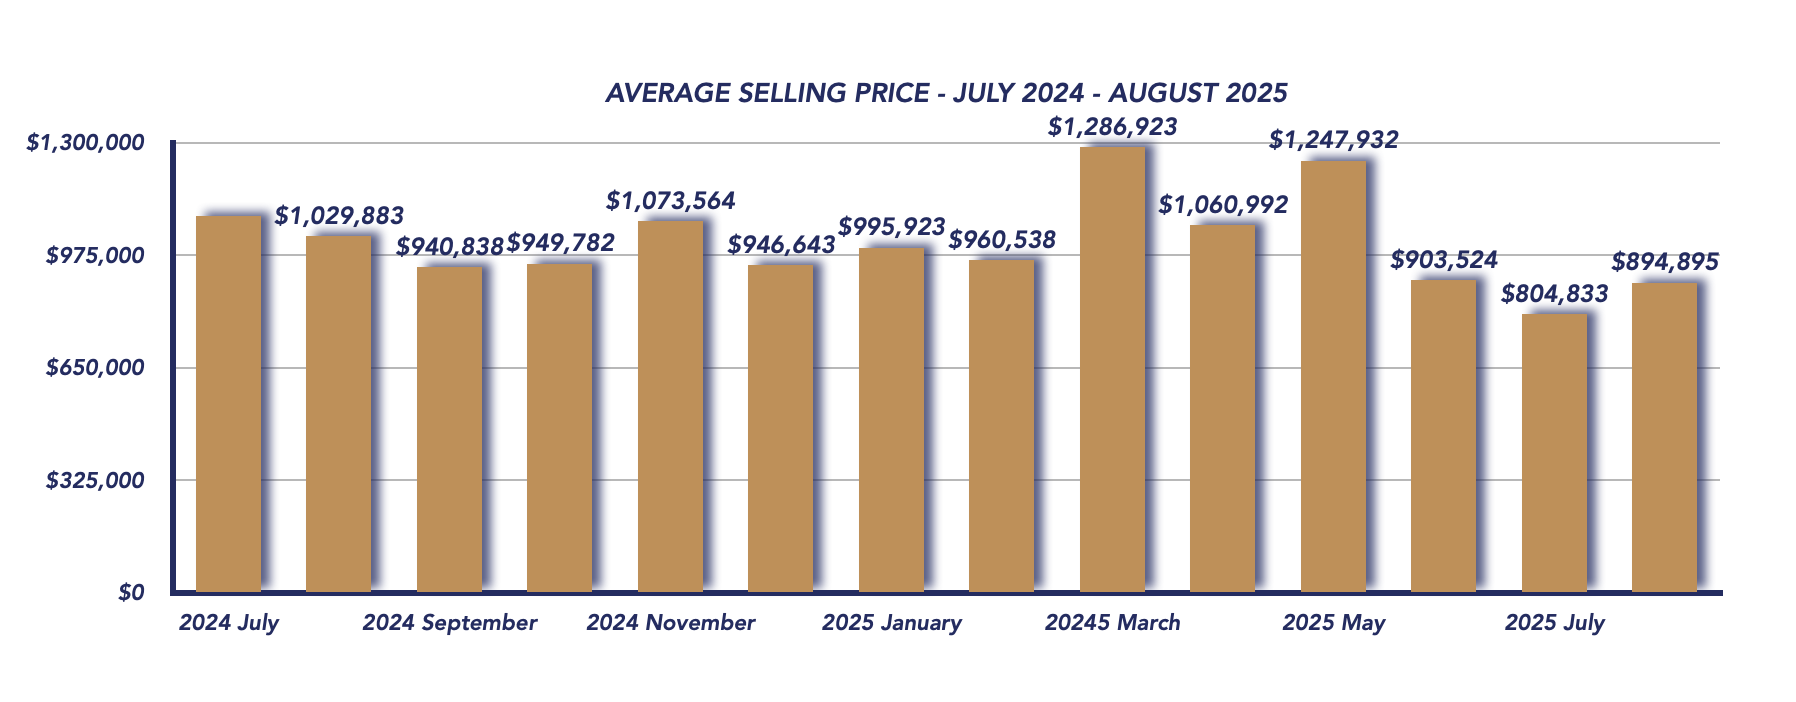
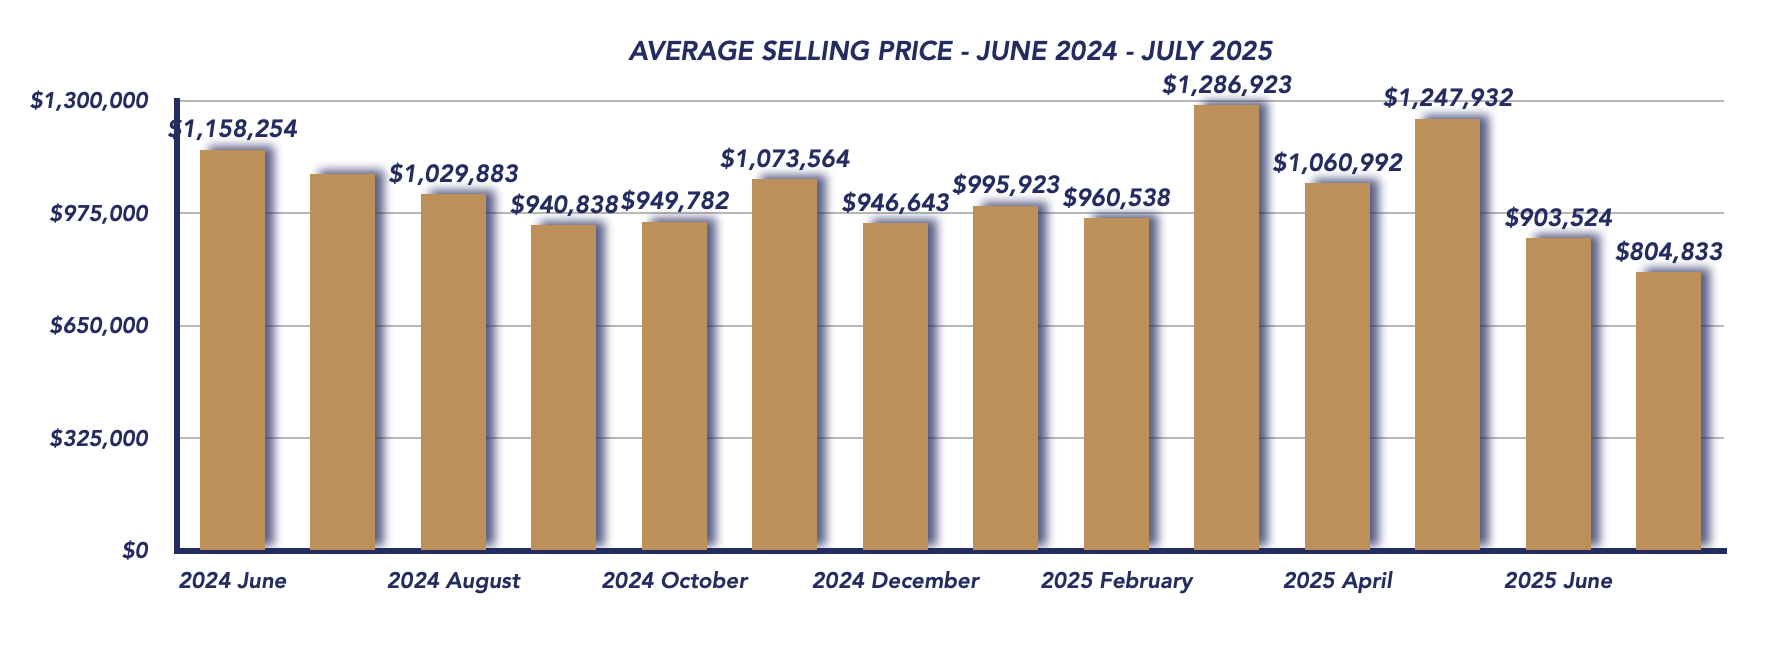
The average sales price for August came in at $894,895, which represents a 13.1% decline year-over-year compared to $1,029,883 in August 2024. However, prices made a notable rebound month-over-month, rising 11.2% from $804,833 in July 2025.
Luxury sales helped drive this increase. In August, two properties sold for over $1 million, including one that reached $1.5 million. By comparison, July also had two million-dollar-plus transactions, though at lower thresholds, while last August saw three homes sell for over $2 million.
Sales Activity
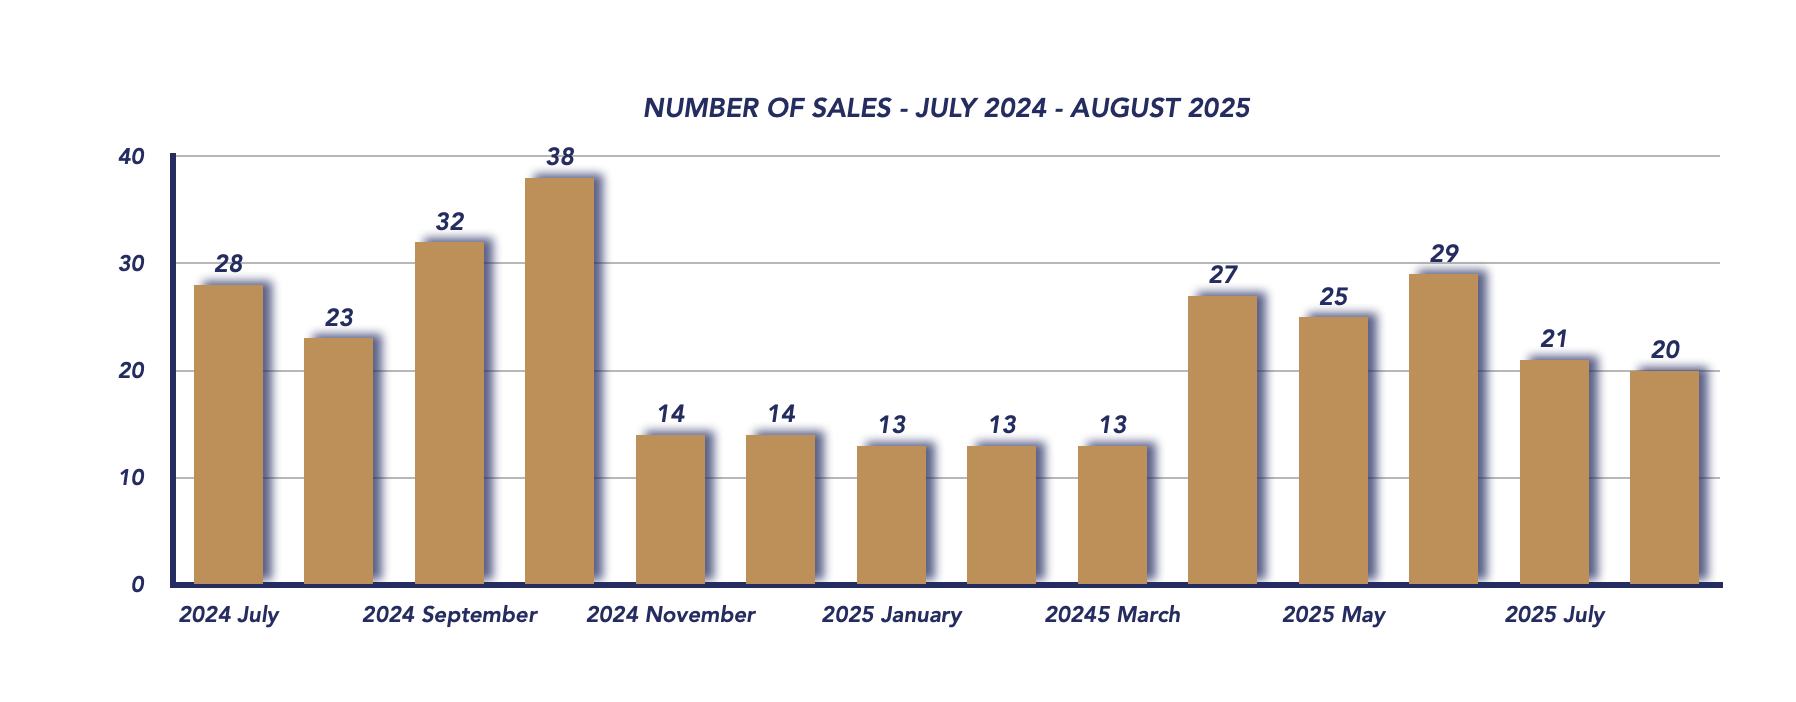
There were 20 total sales in August 2025, slightly down from 21 in July and 23 last August. Despite the decline locally, this runs counter to the GTA-wide trend, where overall sales were up 2.3% year-over-year.
The sale-to-list price ratio held steady at 97%, the same as July, but up from 94% last year, showing that sellers are aligning closely with market expectations.
Listings & Inventory
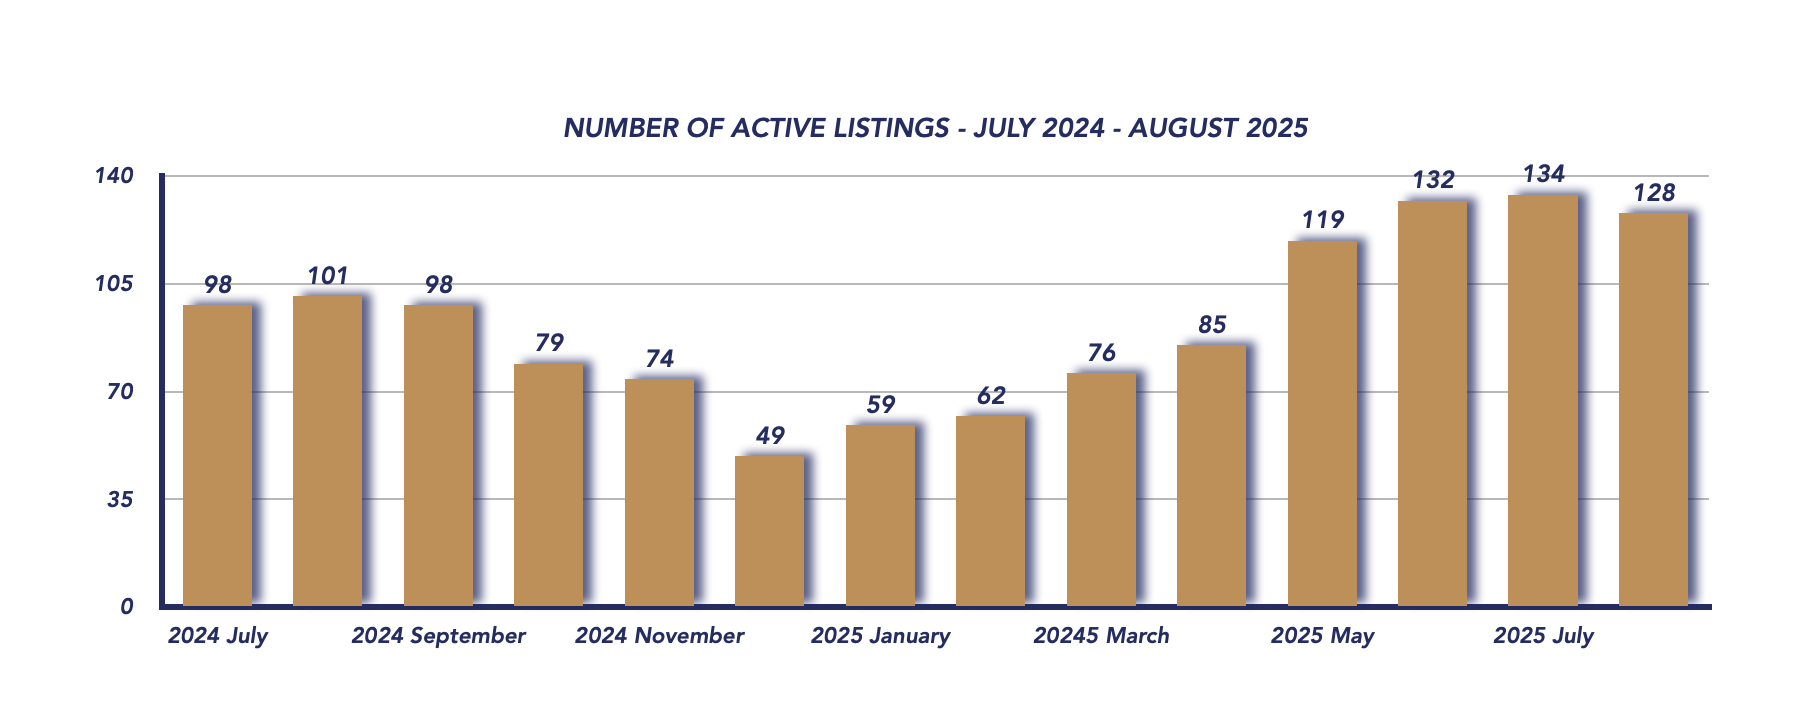
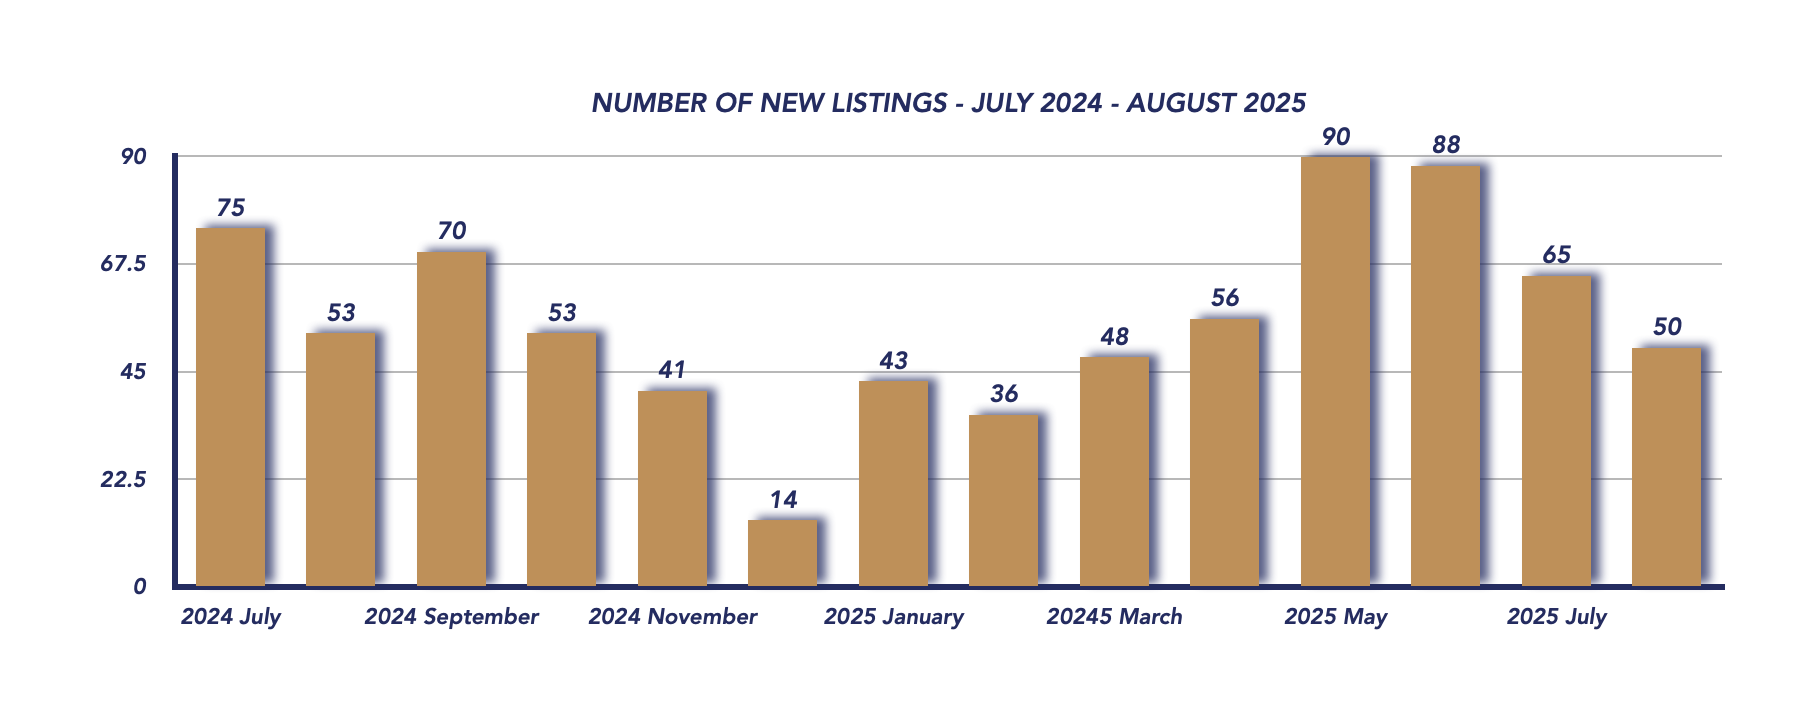
New supply slowed in August with 50 new listings, down from 65 in July and slightly lower than 53 last year. Active listings sat at 128, compared to 134 last month and 101 in August 2024, indicating that while choice remains for buyers, fewer fresh listings entered the market.
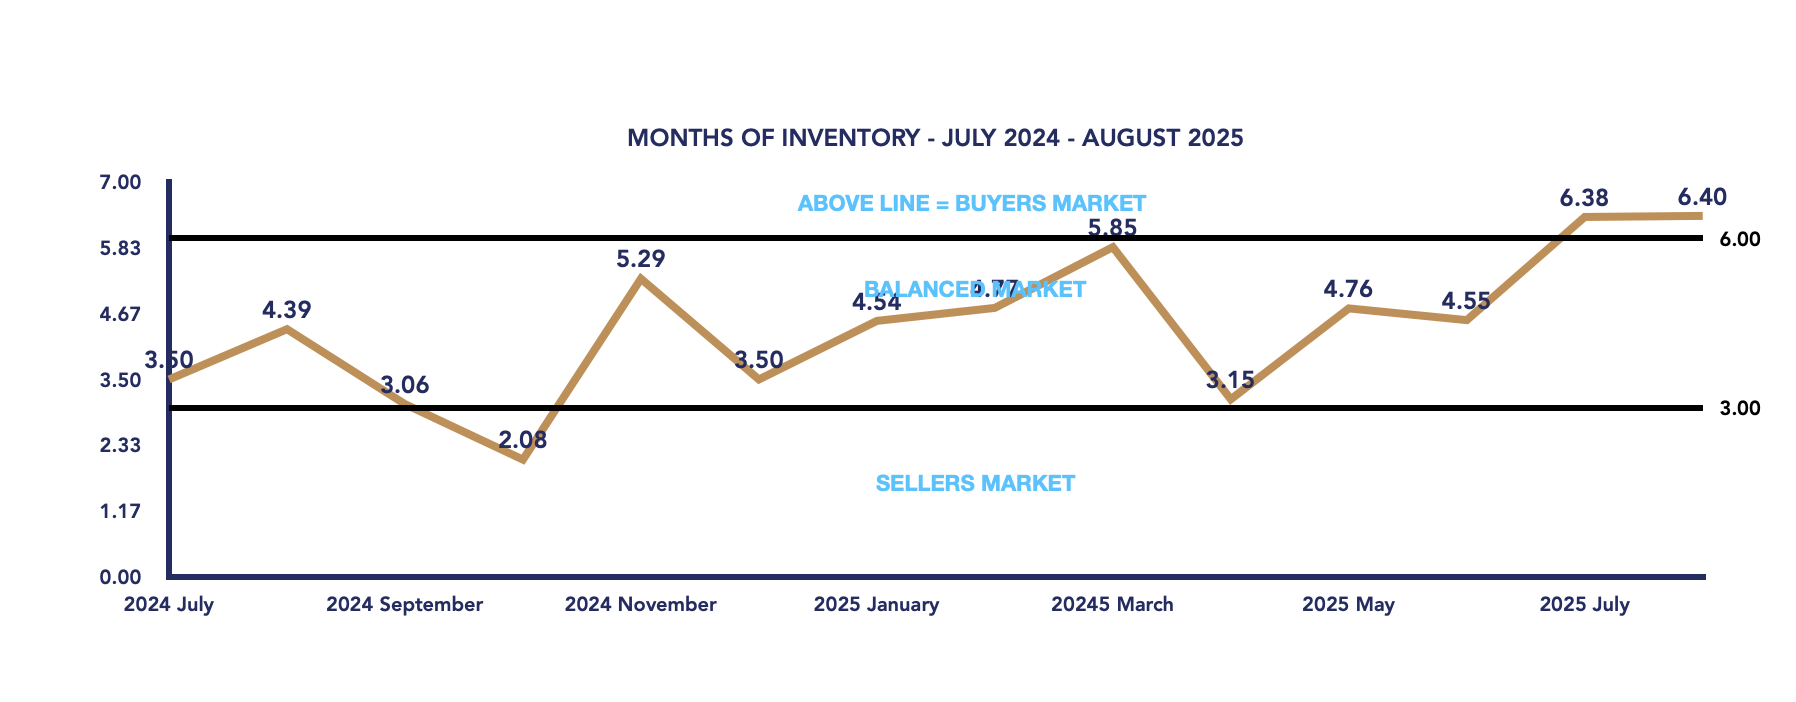
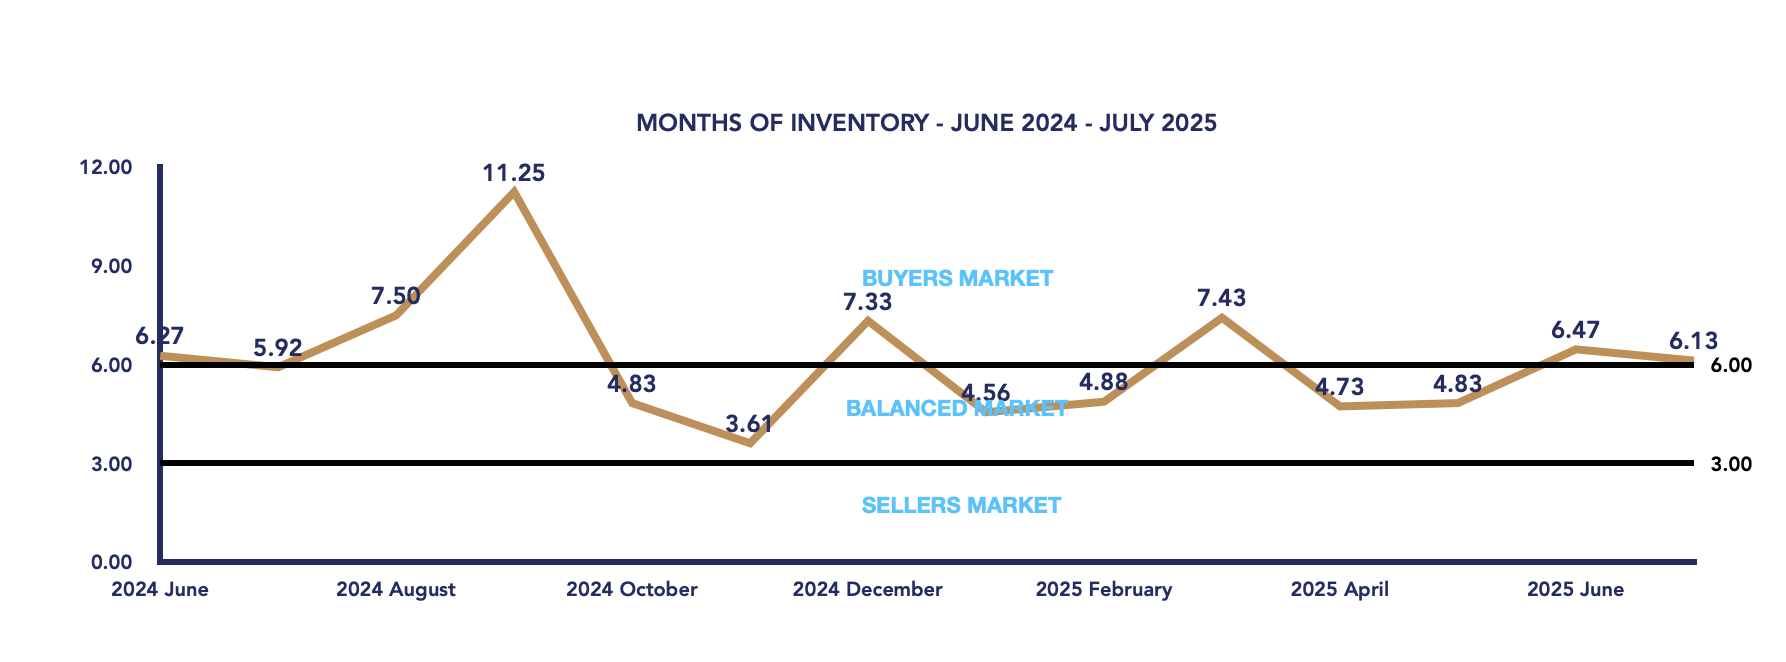
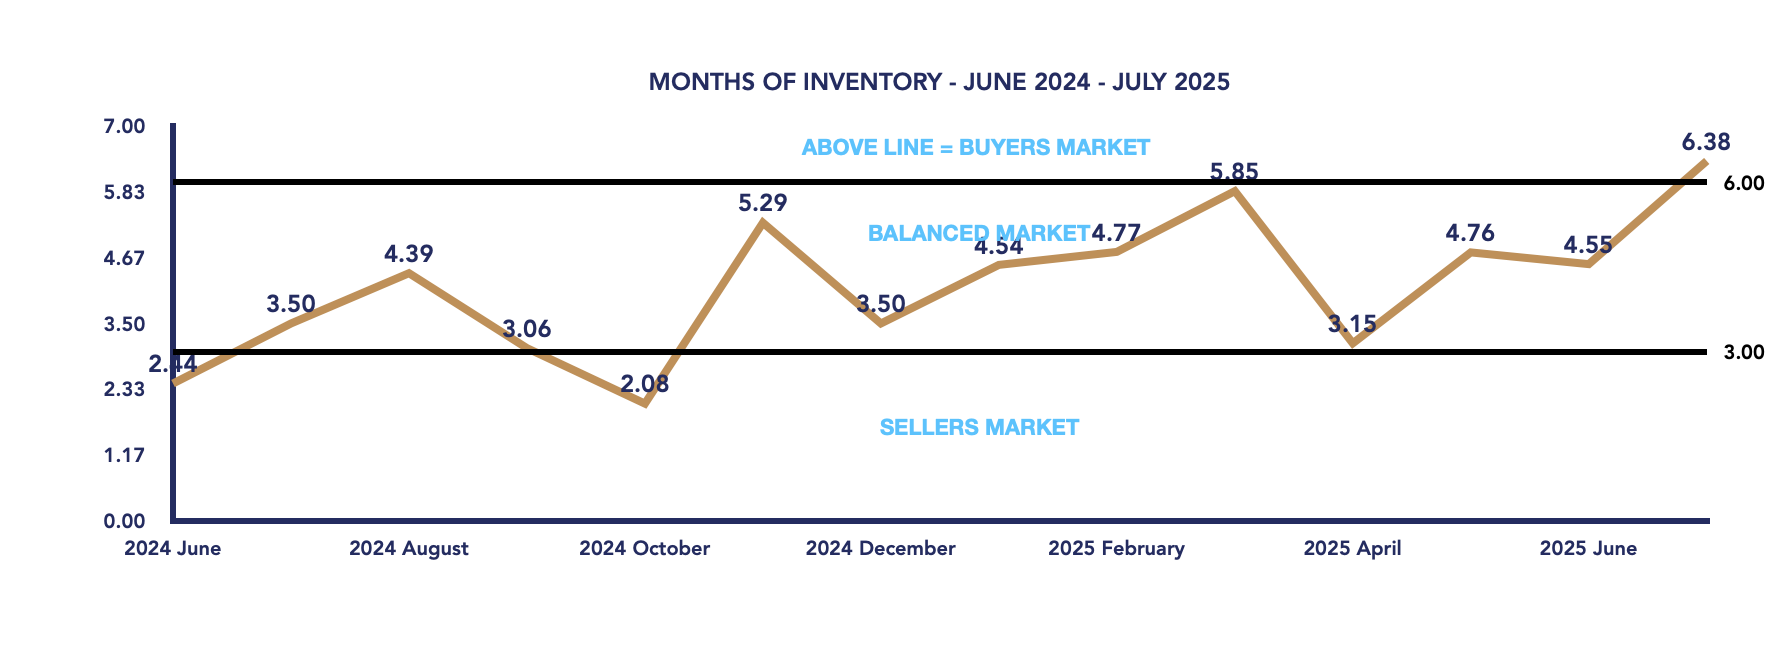
The months of inventory ticked up slightly to 6.40 from 6.38 in July, keeping Scugog firmly in buyer’s market territory.
Days on Market
Homes in Scugog took an average of 64 days to sell in August, reflecting a slower pace compared to more competitive markets. This extended timeline reinforces the negotiating power buyers currently hold.
Key Takeaways
Prices rebounded from July but remain well below last year’s levels.
Luxury sales (including one at $1.5M) helped lift the average price.
Sales volume eased, but Scugog is moving against the wider GTA trend of year-over-year growth.
Inventory remains high, and with over 6 months of supply, buyers continue to hold the advantage.
As we move into the fall market, buyers will find opportunities with ample inventory and room to negotiate, while sellers will need to price strategically to attract offers in a competitive environment.
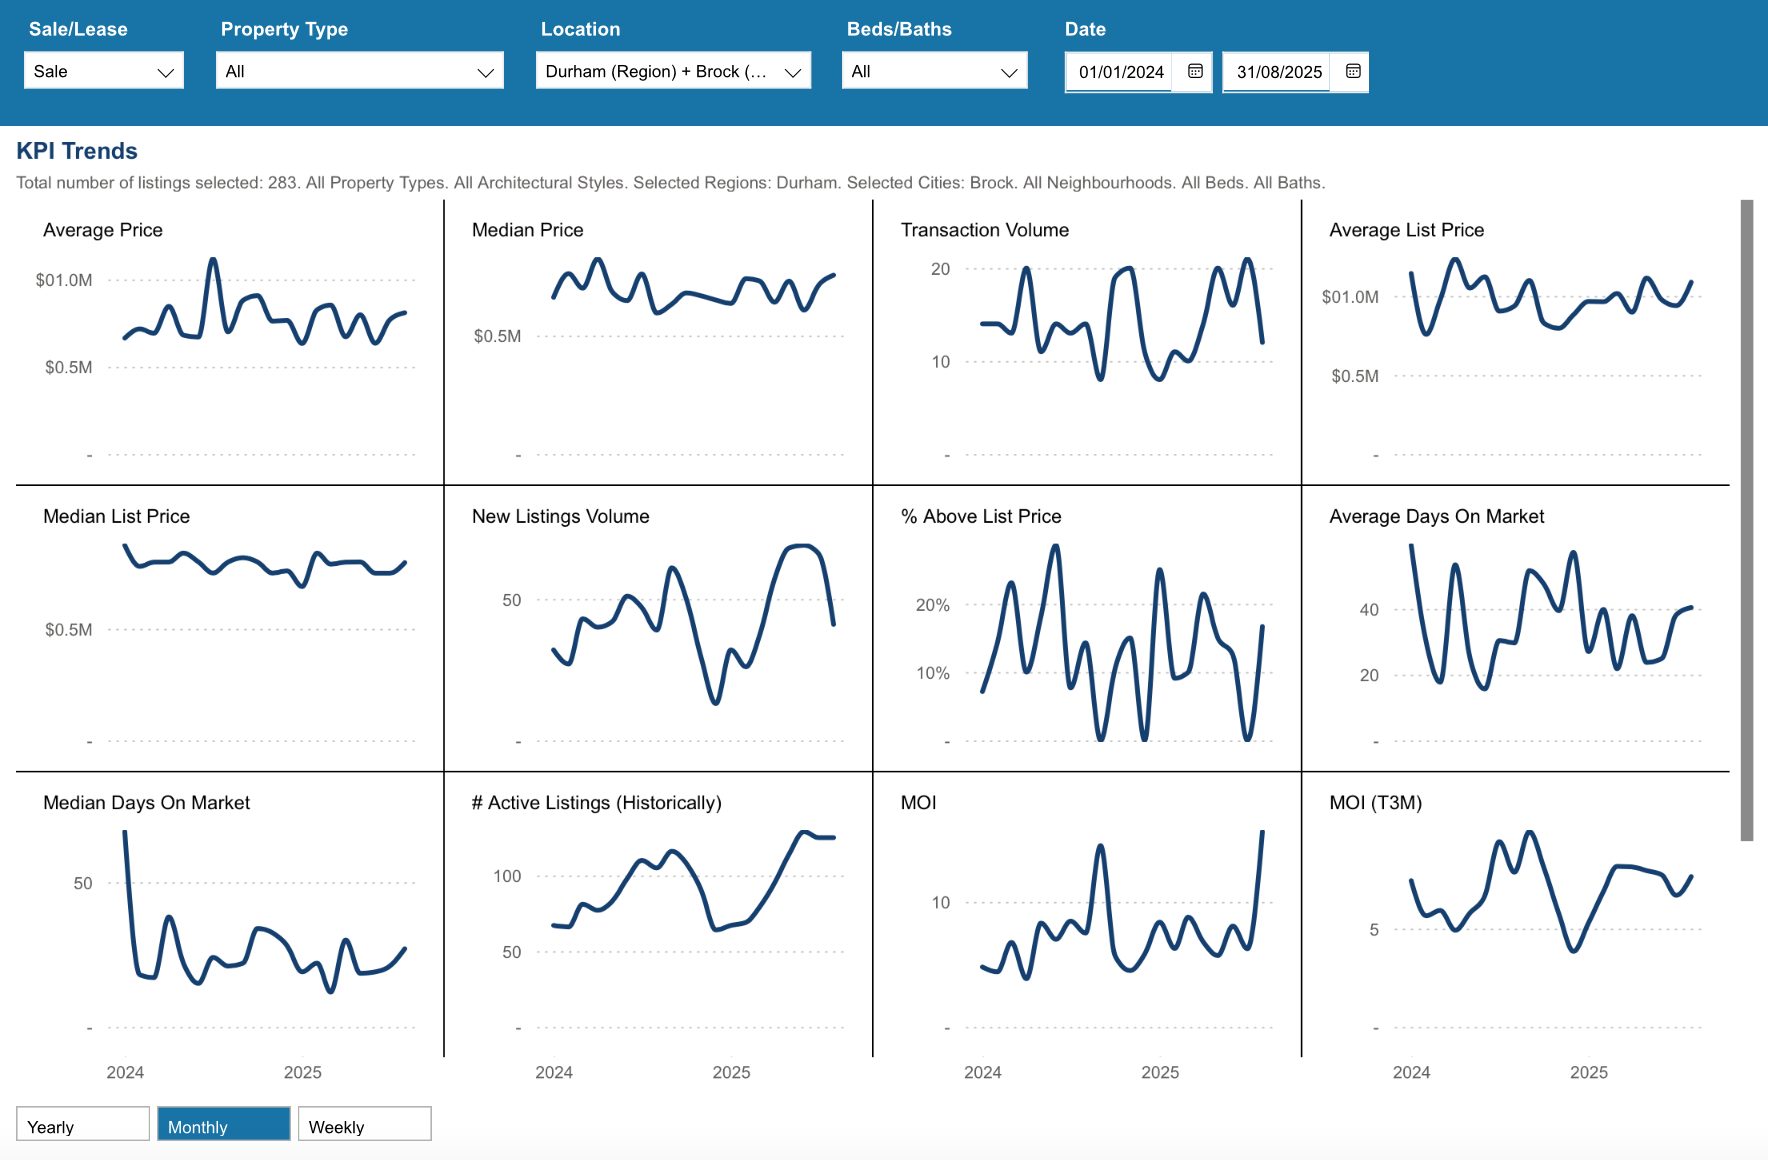
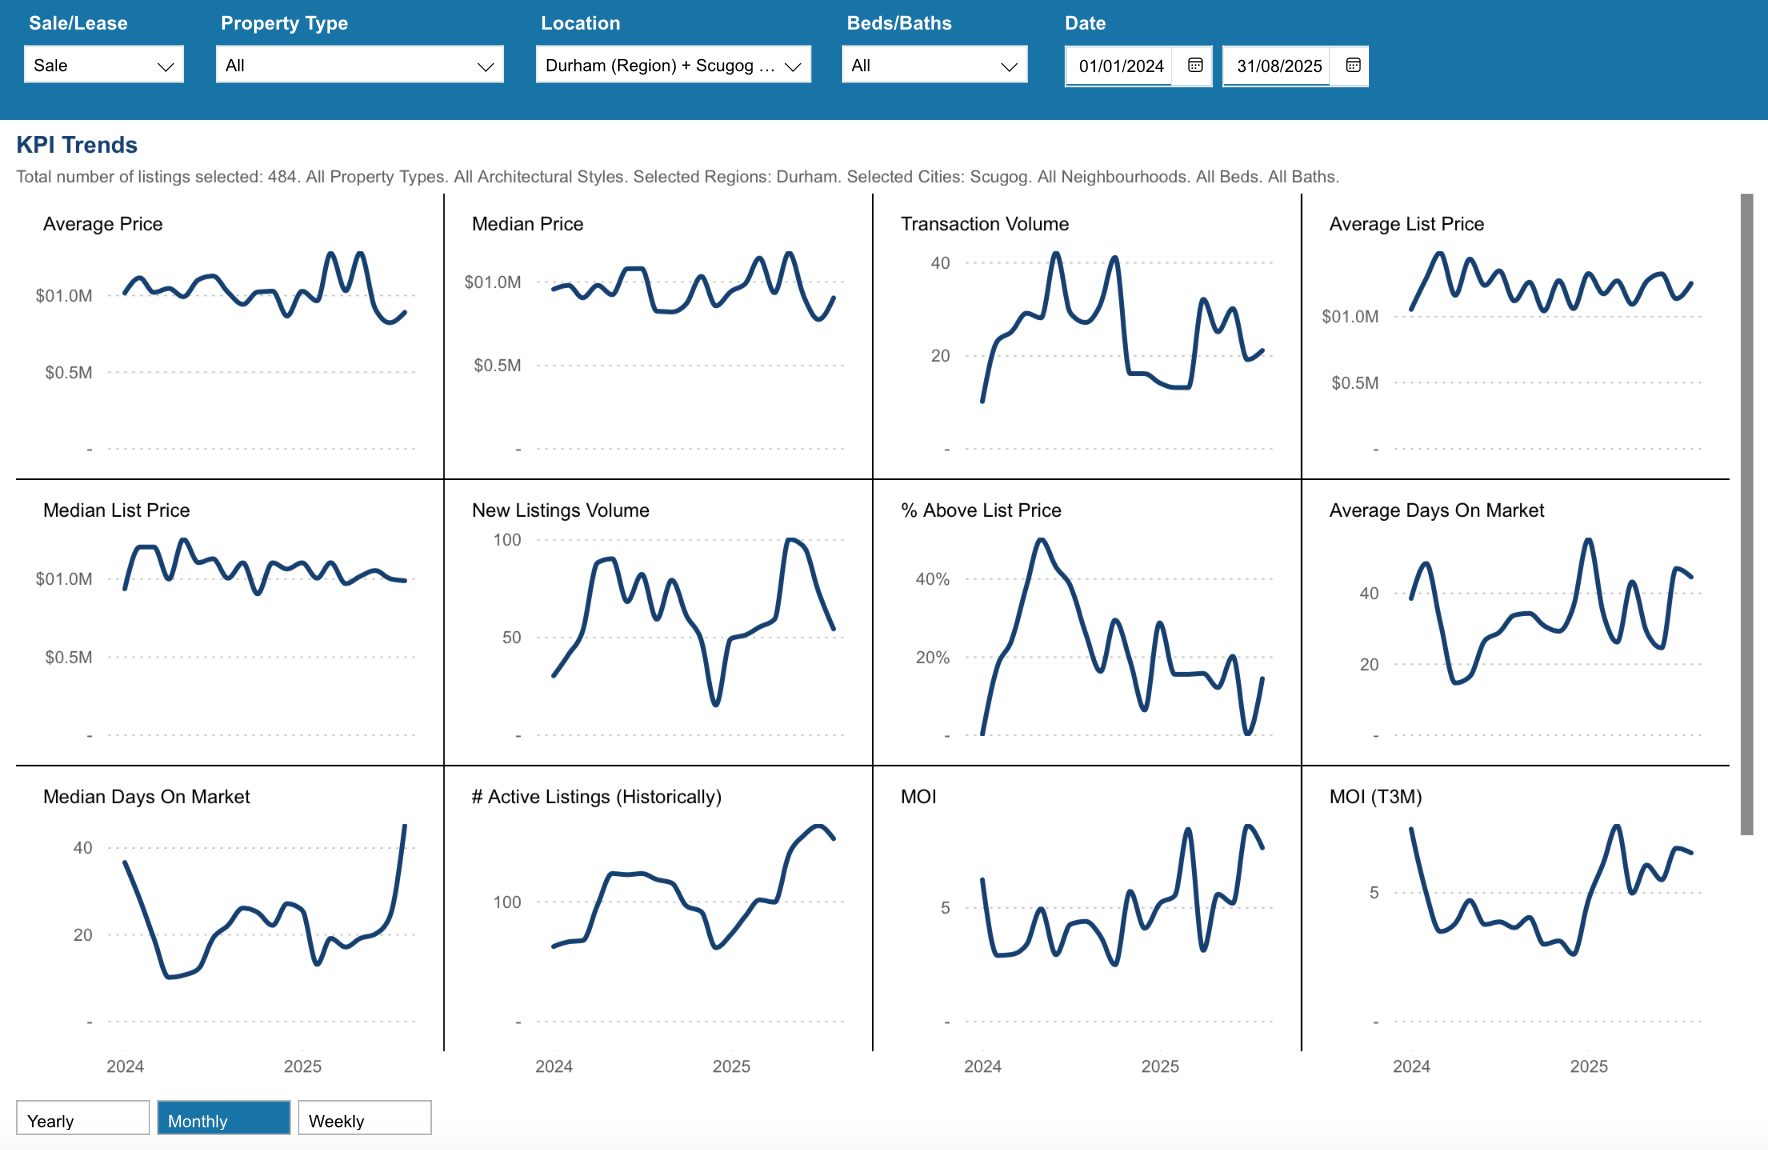
Key Performance Indicators (KPIs) from January 2024 through August 2025 provide a clear snapshot of how the Durham Region real estate market has evolved across all property types, architectural styles, and home configurations
WATCH OUR MONDAY MARKET MINUTES
*Information is believed to be accurate at time of posting but is not guaranteed to be correct. Some values may vary slightly based on the exact date and time the reports were generated. Market stats are provided by TRREB (Toronto Regional Real Estate Board) and are based on sales for the month of Attached/Row/Townhouses, Condo Apartments, Condo Townhouses, Detached, Detached with Common Elements, Link Homes and Semi-detached. *Some values may vary slightly based on the exact date and time the reports were generated.
Check out our Uxbridge and Scugog Events Pages to keep up to date on whats going on around town. Click the links or scan the Code with your phone to take you directly there.
This housing report for Durham Region includes the number of new listings, average list price, number of properties sold, average selling price, average days on market and average asking price to selling price ratio for all property types within the Region of Durham.
Scroll to the bottom for links to take you to the housing market reports for Durham Region, Scugog and Brock.
From Toronto Regional Real Estate Board
Please note: The PropTx MLS® System, of which TRREB is a part, has added a number of new client boards over the last year. Many of these boards’ Members trade within the Greater Toronto Area and broader Greater Golden Horseshoe regions. As a result, historic data have been updated to reflect the addition of these boards’ listings and transactions. This means historic data have changed relative to previously published static reports. To view updated historic data, click here.
Toronto Regional Real Estate Board – Market Stats At A Glance – August 2025
Uxbridge Township Real Estate Market Analysis – August 2025
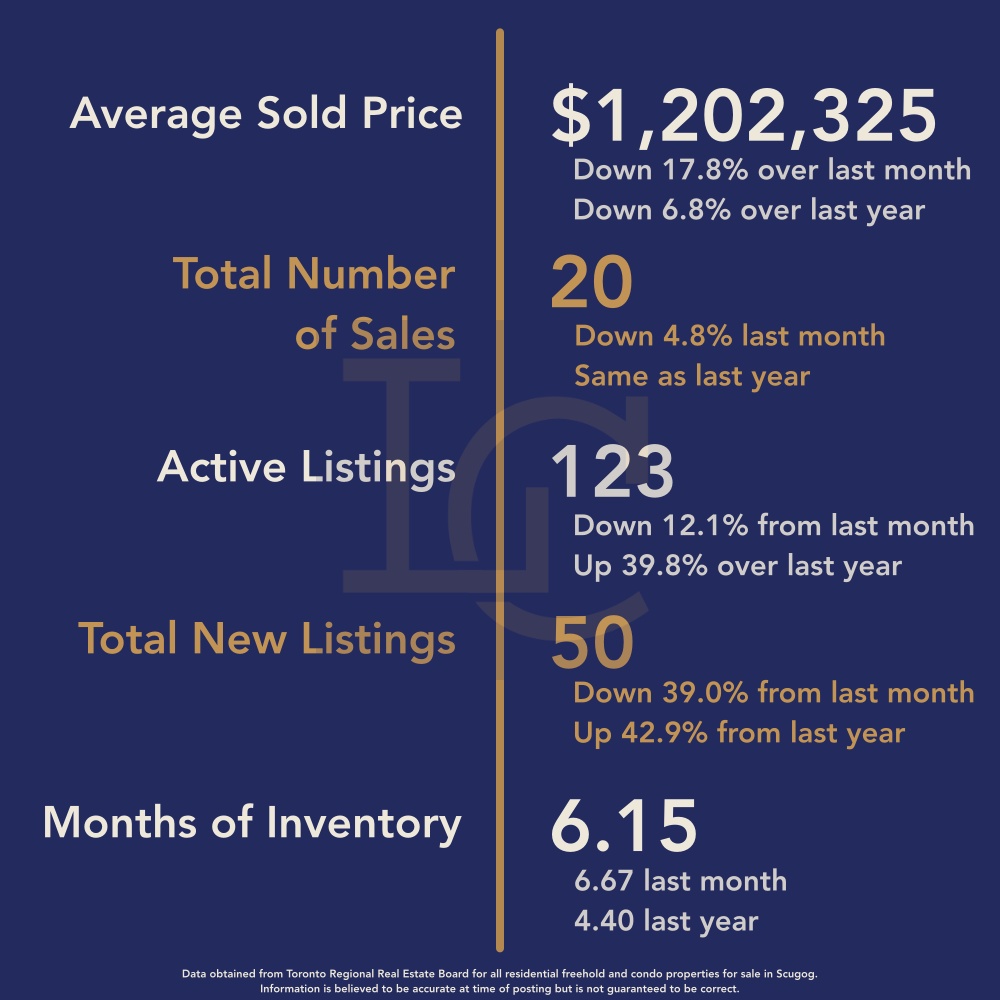
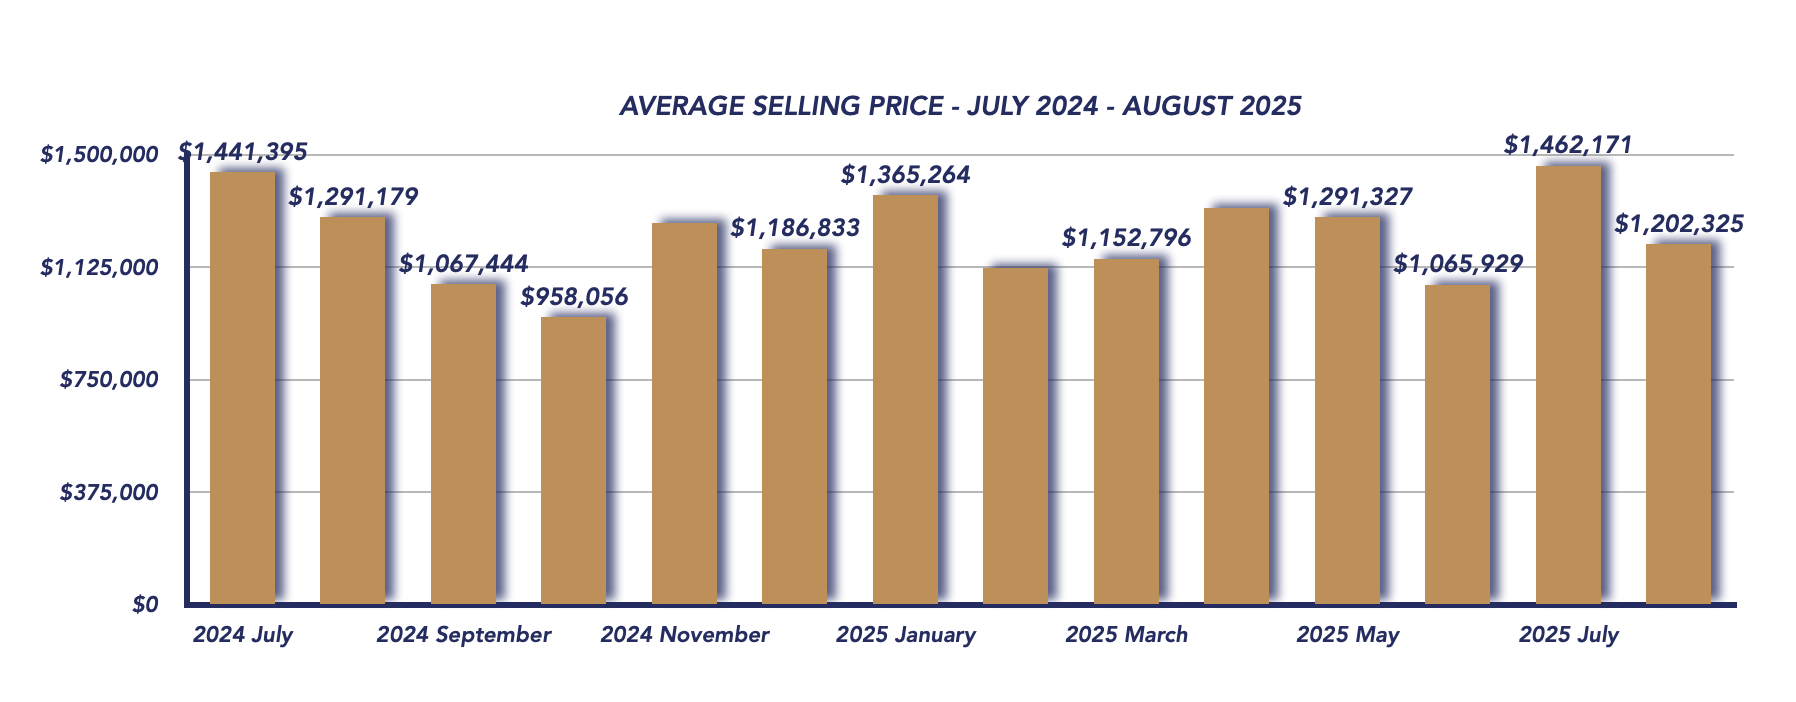
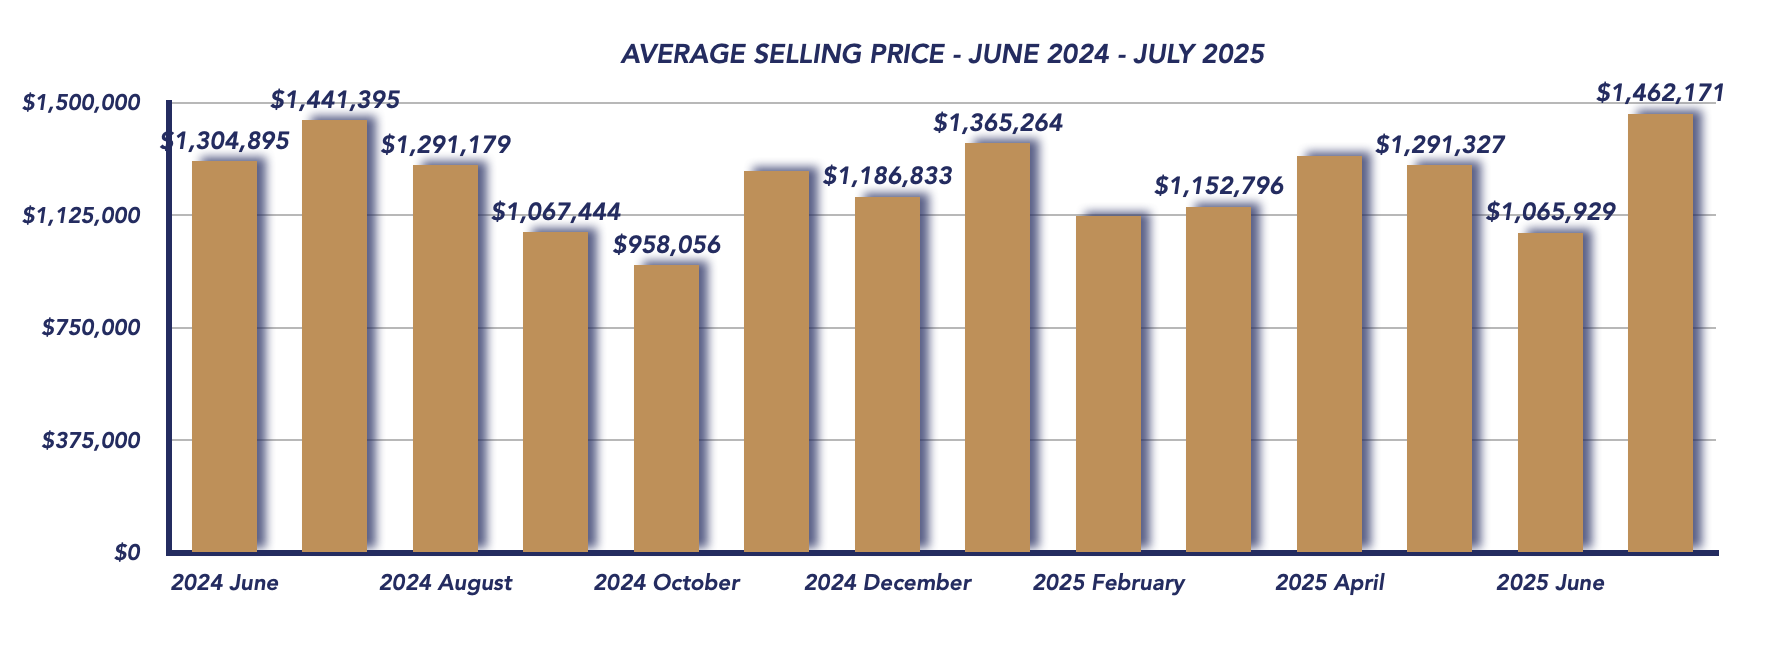
The Uxbridge housing market cooled in August 2025, with average home prices dipping sharply after last month’s spike driven by multiple high-end sales. The average sale price fell to $1,202,325, down 17.8% from July’s $1,462,171 and 6.9% lower than August 2024’s $1,291,179.
This shift reflects the different mix of homes sold. In July, six high-value properties sold between $1.5M and $2.5M, which pushed the average higher. In contrast, August saw only one property sell over $2 million, while nearly half of all sales closed under $1 million, pulling the average down significantly.
August 2025
July 2025
Sales Activity
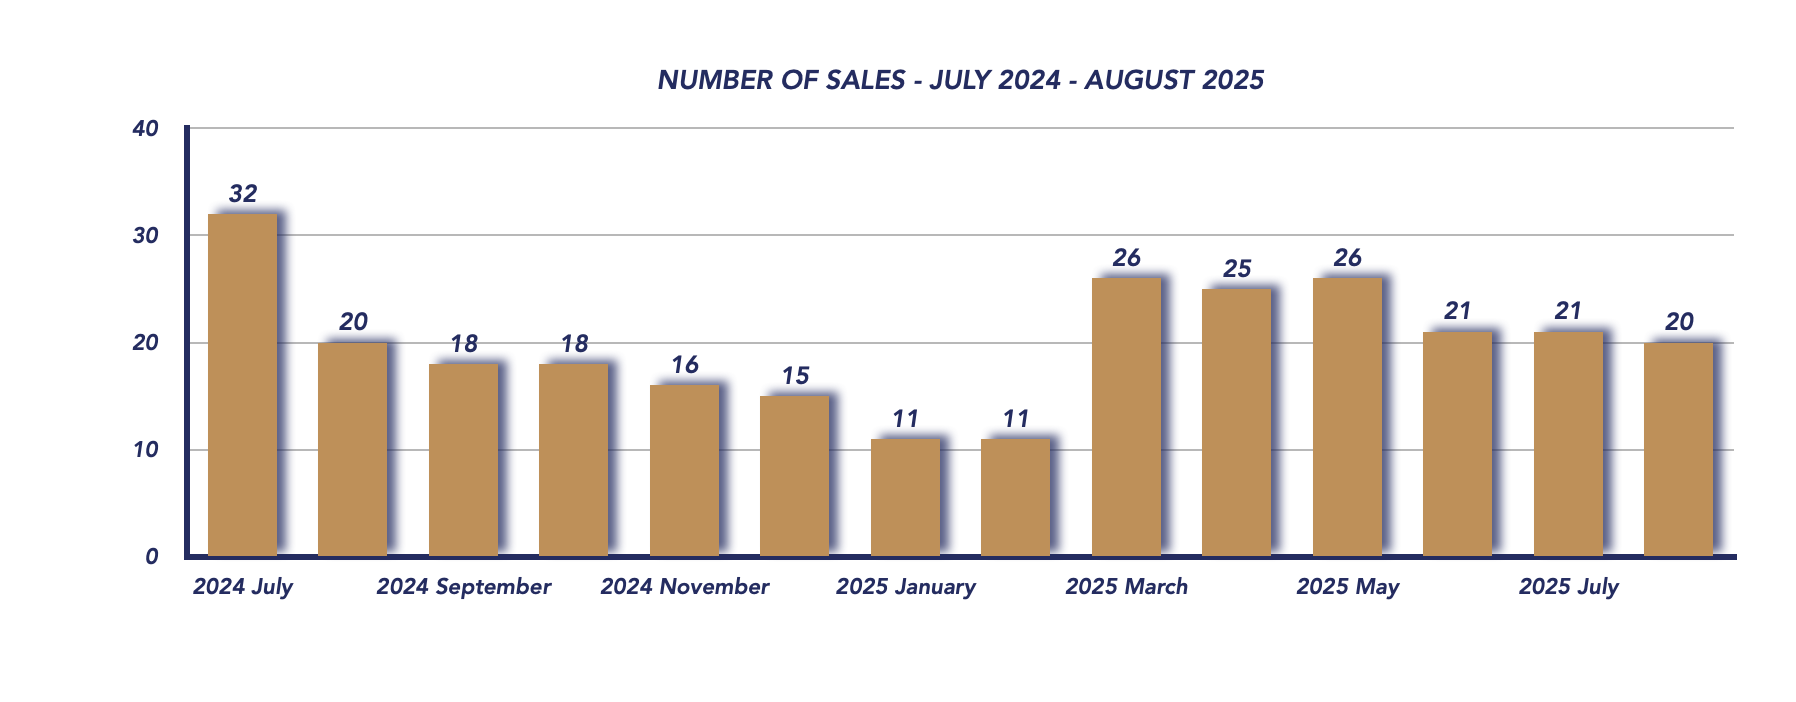
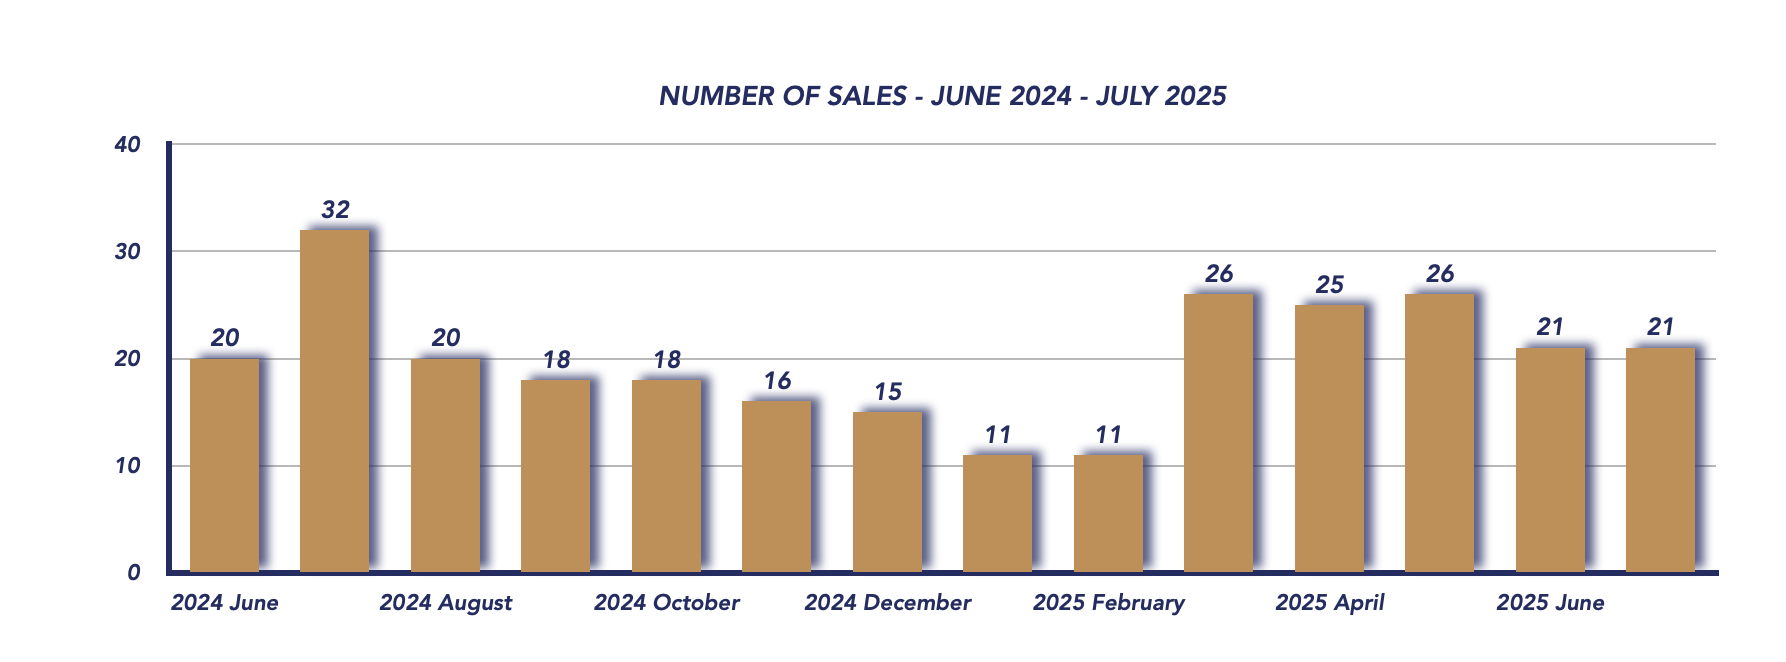
A total of 20 homes were sold in August, unchanged from August 2024 but slightly below July’s 21 sales. This consistency in year-over-year sales suggests demand remains present, though buyers are clearly leaning toward more affordable price points.
Active Listings
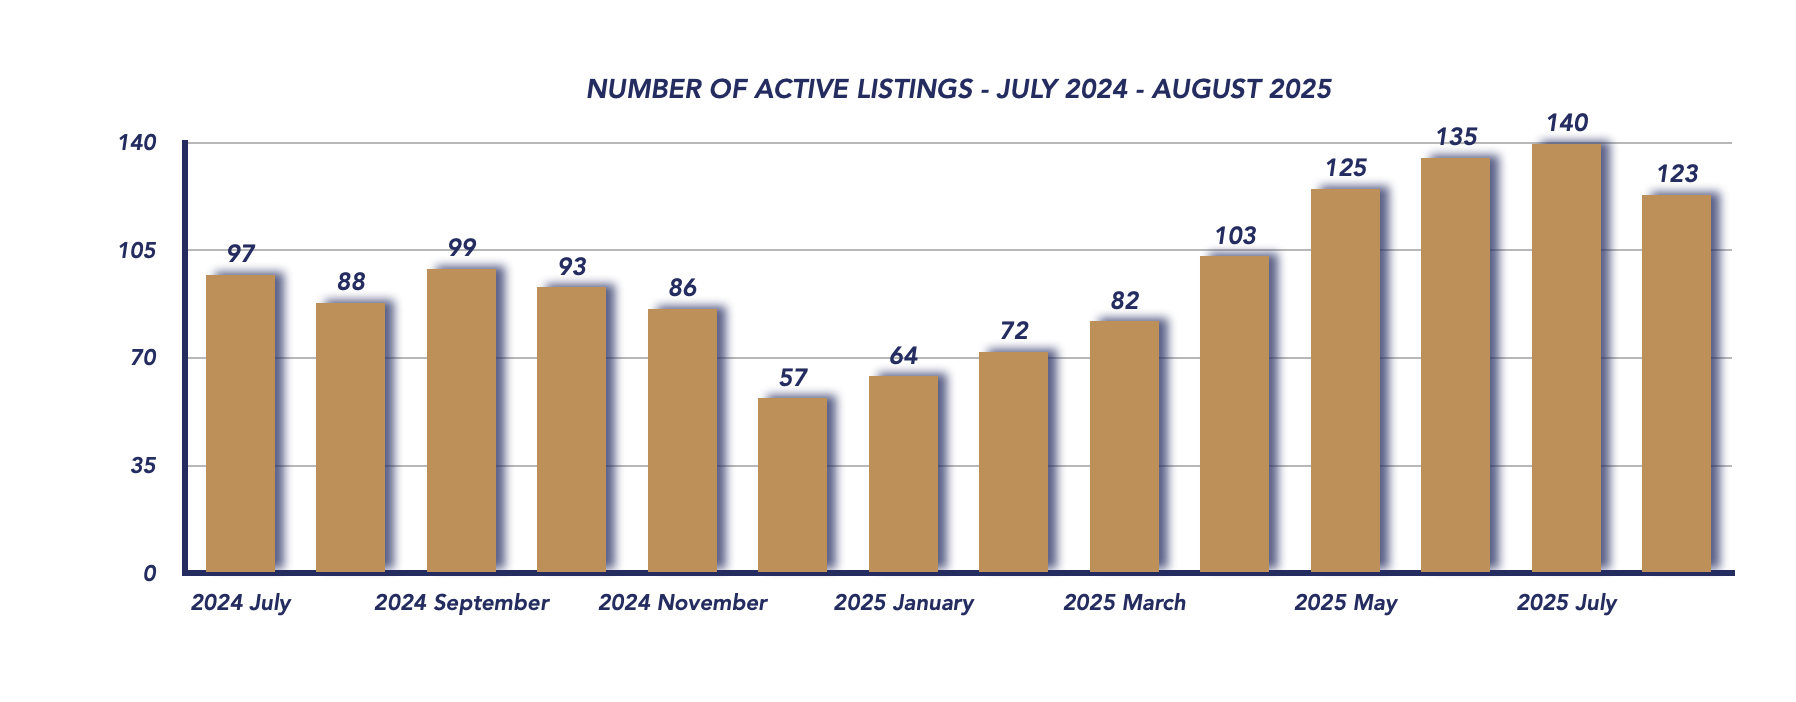
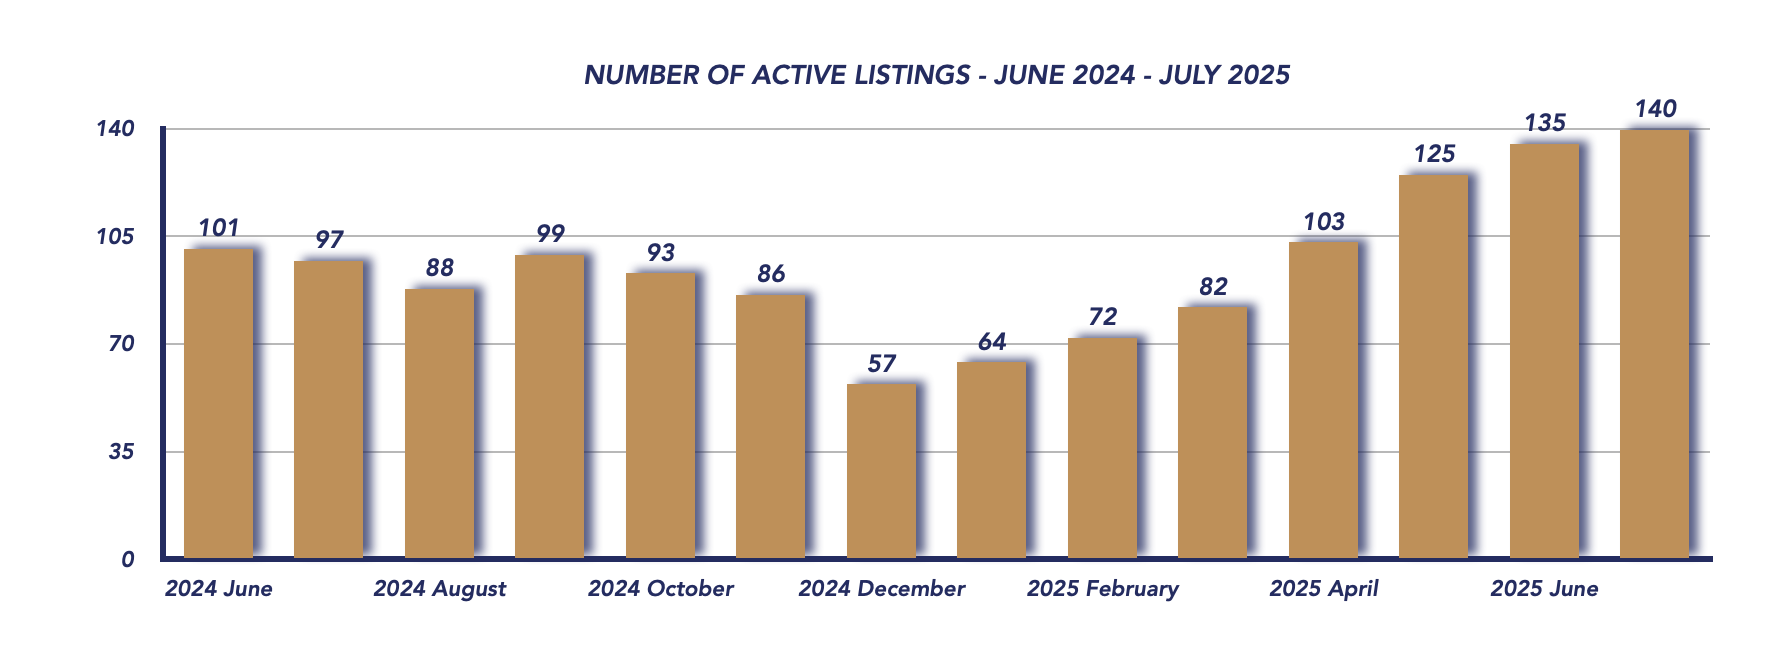
There were 123 active listings in August, down from 140 in July, but still higher than the 88 listings recorded in August 2024. While inventory eased slightly, it remains elevated compared to last year, contributing to a market environment where buyers continue to hold the upper hand.
Sale-to-List Price Ratio
The sale-to-list price ratio slipped to 96%, down from 98% in July, showing that buyers are negotiating more aggressively and sellers are adjusting expectations.
New Listings
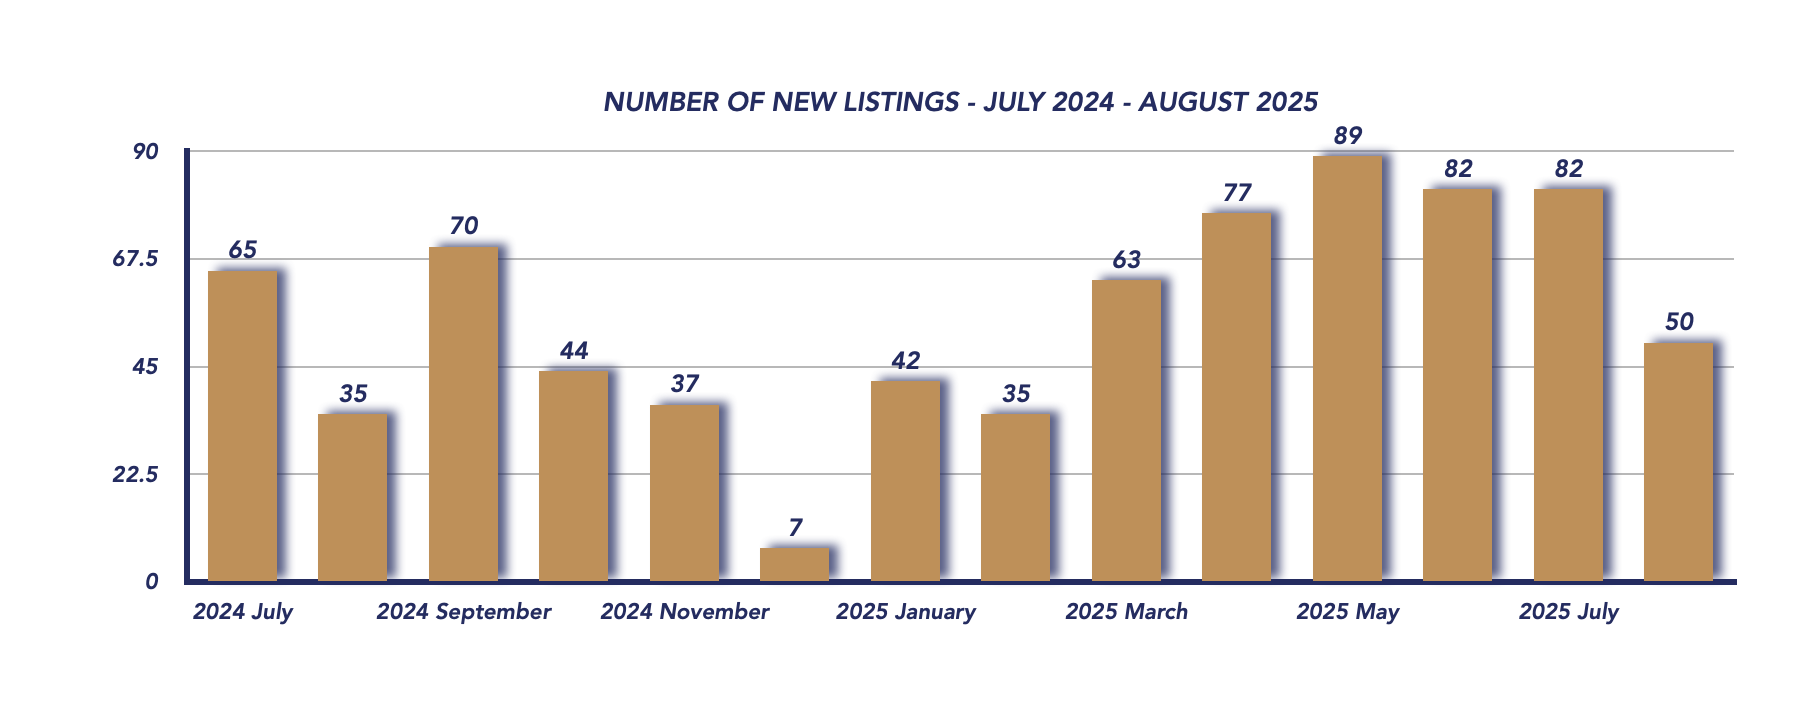
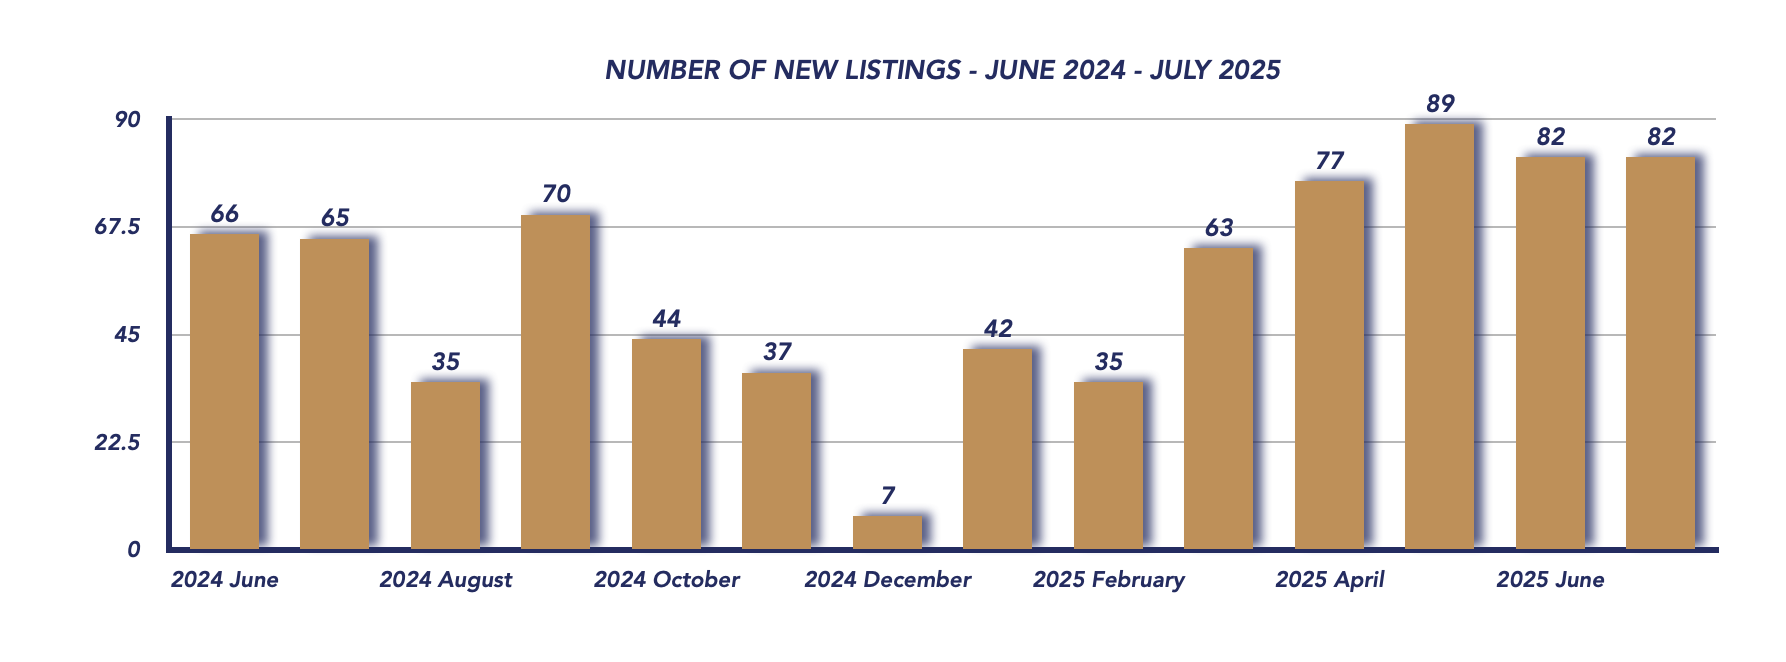
New listings dropped sharply to 50, down from 82 in July, but still above the 35 new listings in August 2024. This reduction in new supply helped ease total inventory slightly, though overall conditions remain competitive for sellers.
Days on Market
Homes took an average of 67 days to sell in August, up from 65 in July, indicating a slower pace of buyer decision-making. Longer selling times suggest buyers are exercising caution and taking advantage of the wider range of available properties.
Months of Inventory
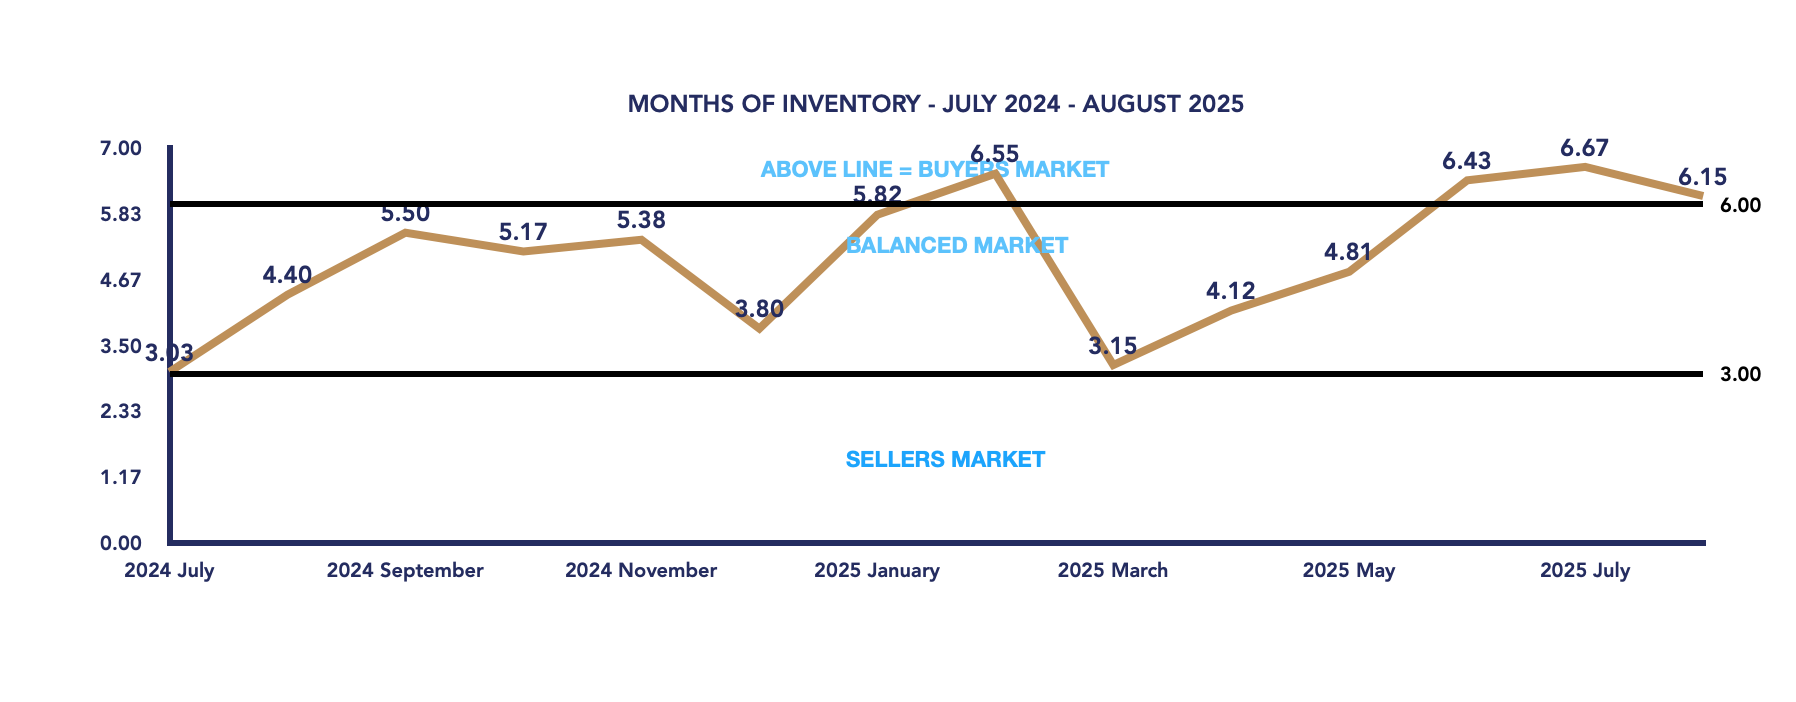
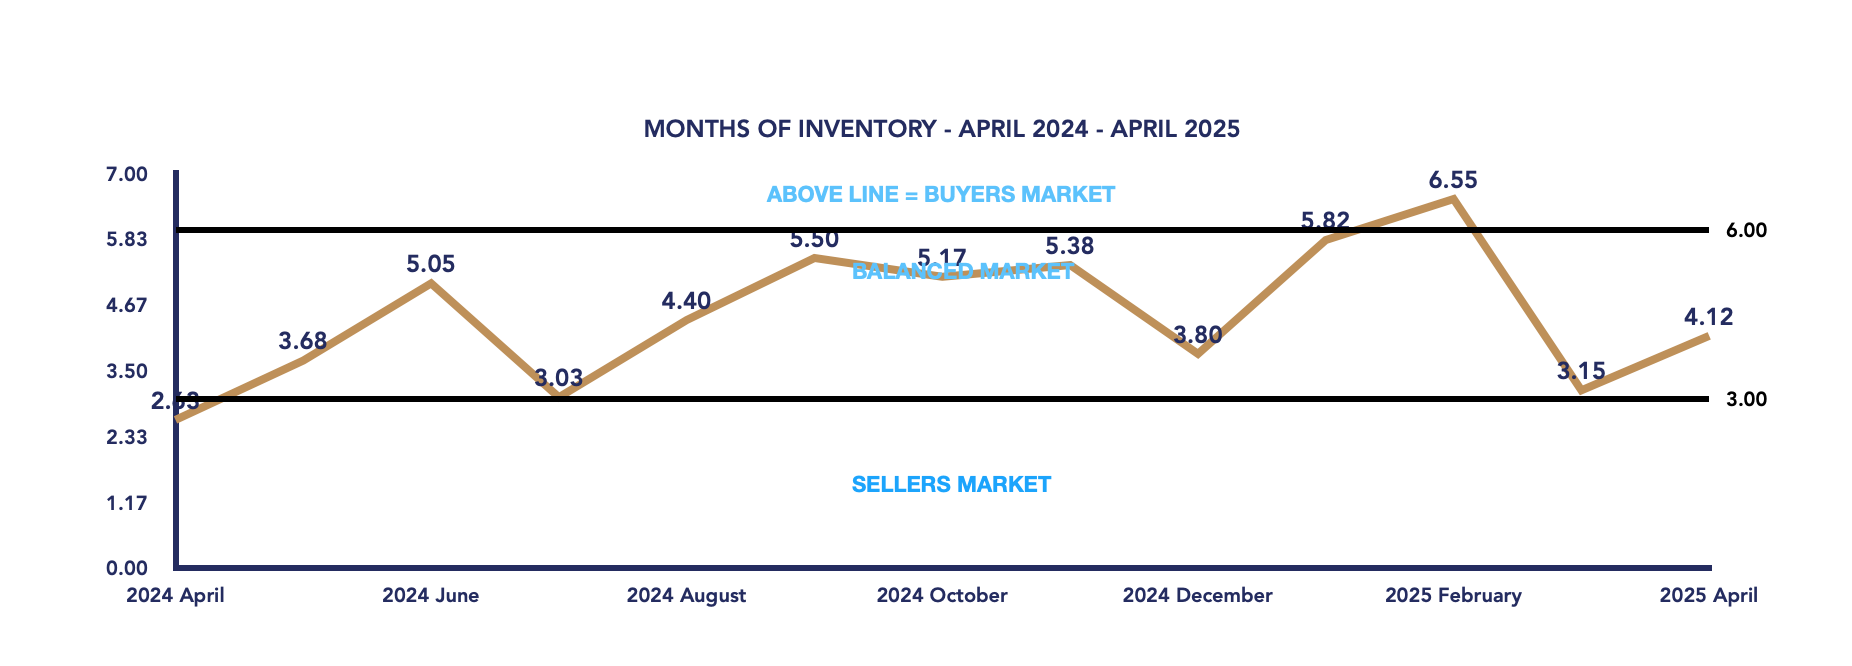
Months of inventory edged down slightly to 6.15 from 6.67 in July, though it remains above the threshold of a balanced market, keeping Uxbridge firmly in buyer’s market territory.
Conclusion
August 2025 reinforced Uxbridge’s status as a buyer’s market. While total sales held steady, the shift in price mix toward more affordable homes pulled the average sale price down sharply from July’s inflated high. Elevated inventory, longer selling times, and reduced sale-to-list ratios all point to buyers maintaining the upper hand.
For sellers, success in this market will require sharp pricing and patience, while buyers continue to benefit from greater negotiating power and wider selection. As we head into the fall, much will depend on whether new listings remain restrained or whether inventory builds again, putting further pressure on prices.
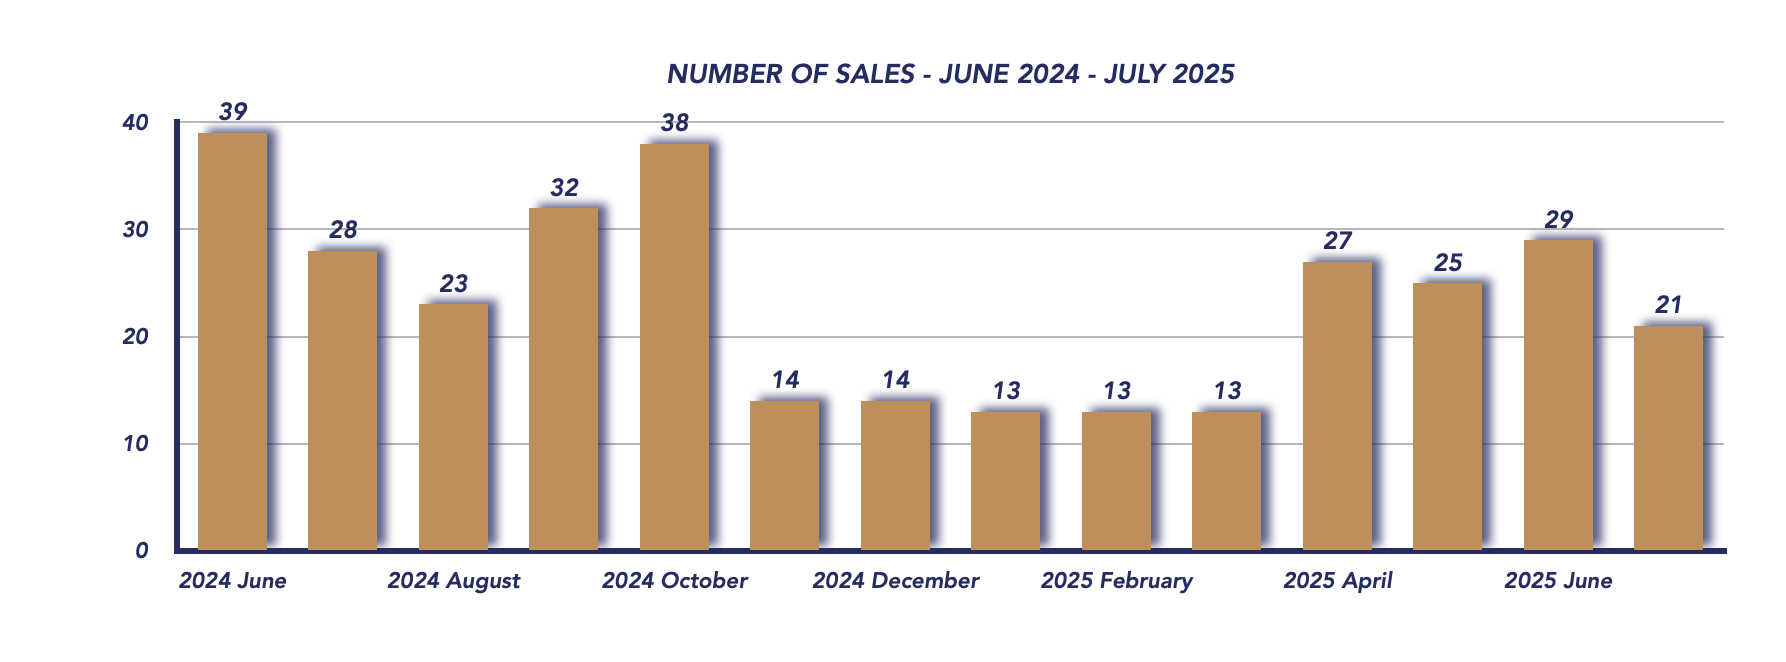
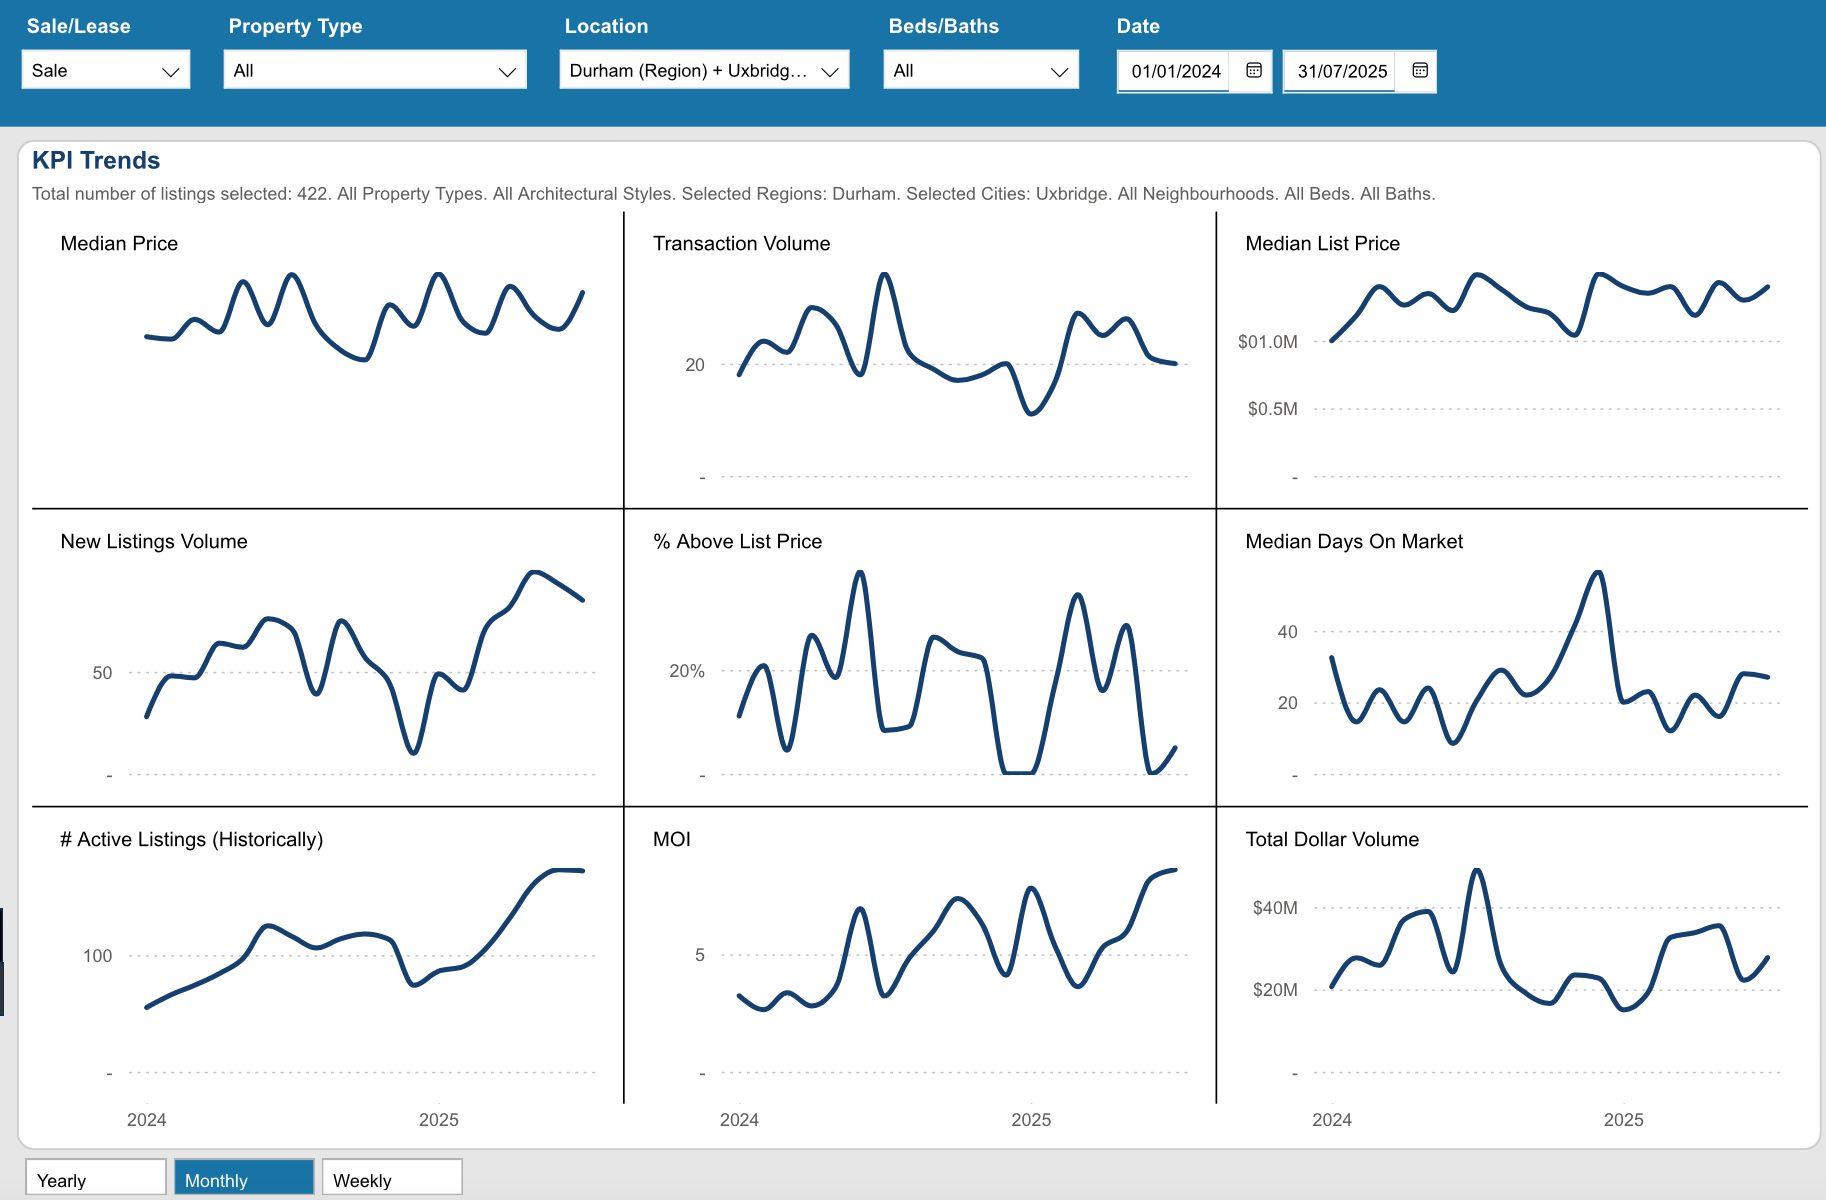
Key Performance Indicators (KPIs) from January 2024 through July 2025 provide a clear snapshot of how the Durham Region real estate market has evolved across all property types, architectural styles, and home configurations
WATCH OUR MONDAY MARKET MINUTES
*Information is believed to be accurate at time of posting but is not guaranteed to be correct. Some values may vary slightly based on the exact date and time the reports were generated. Market stats are provided by TRREB (Toronto Regional Real Estate Board) and are based on sales for the month of Attached/Row/Townhouses, Condo Apartments, Condo Townhouses, Detached, Detached with Common Elements, Link Homes and Semi-detached. *Some values may vary slightly based on the exact date and time the reports were generated.
Check out our Uxbridge and Scugog Events Pages to keep up to date on whats going on around town. Click the links or scan the Code with your phone to take you directly there.
This housing report for Durham Region includes the number of new listings, average list price, number of properties sold, average selling price, average days on market and average asking price to selling price ratio for all property types within the Region of Durham.
Scroll to the bottom for links to take you to the housing market reports for Uxbridge, Scugog and Brock.
From Toronto Regional Real Estate Board
Please note: The PropTx MLS® System, of which TRREB is a part, has added a number of new client boards over the last year. Many of these boards’ Members trade within the Greater Toronto Area and broader Greater Golden Horseshoe regions. As a result, historic data have been updated to reflect the addition of these boards’ listings and transactions. This means historic data have changed relative to previously published static reports. To view updated historic data, click here.
Toronto Regional Real Estate Board – Market Stats At A Glance – August 2025
Durham Region Real Estate Market Analysis – August 2025
The Durham Region housing market showed further signs of cooling in August 2025, with prices continuing to decline, homes taking longer to sell, and inventory levels rising. With sales activity slower compared to last year, the overall picture reflects a market moving deeper into balance as both buyers and sellers adjust to changing conditions.
August 2025
July 2025
📉 Average Home Price Declines Sharply
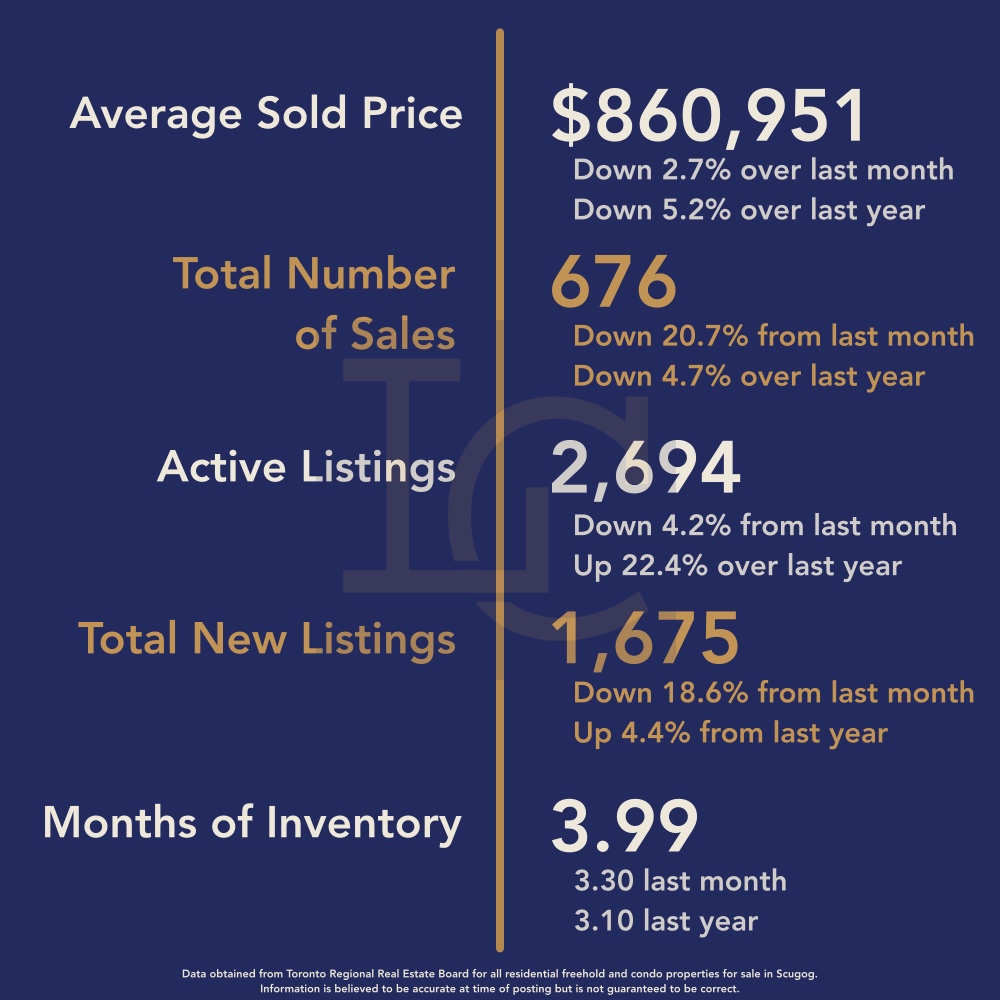
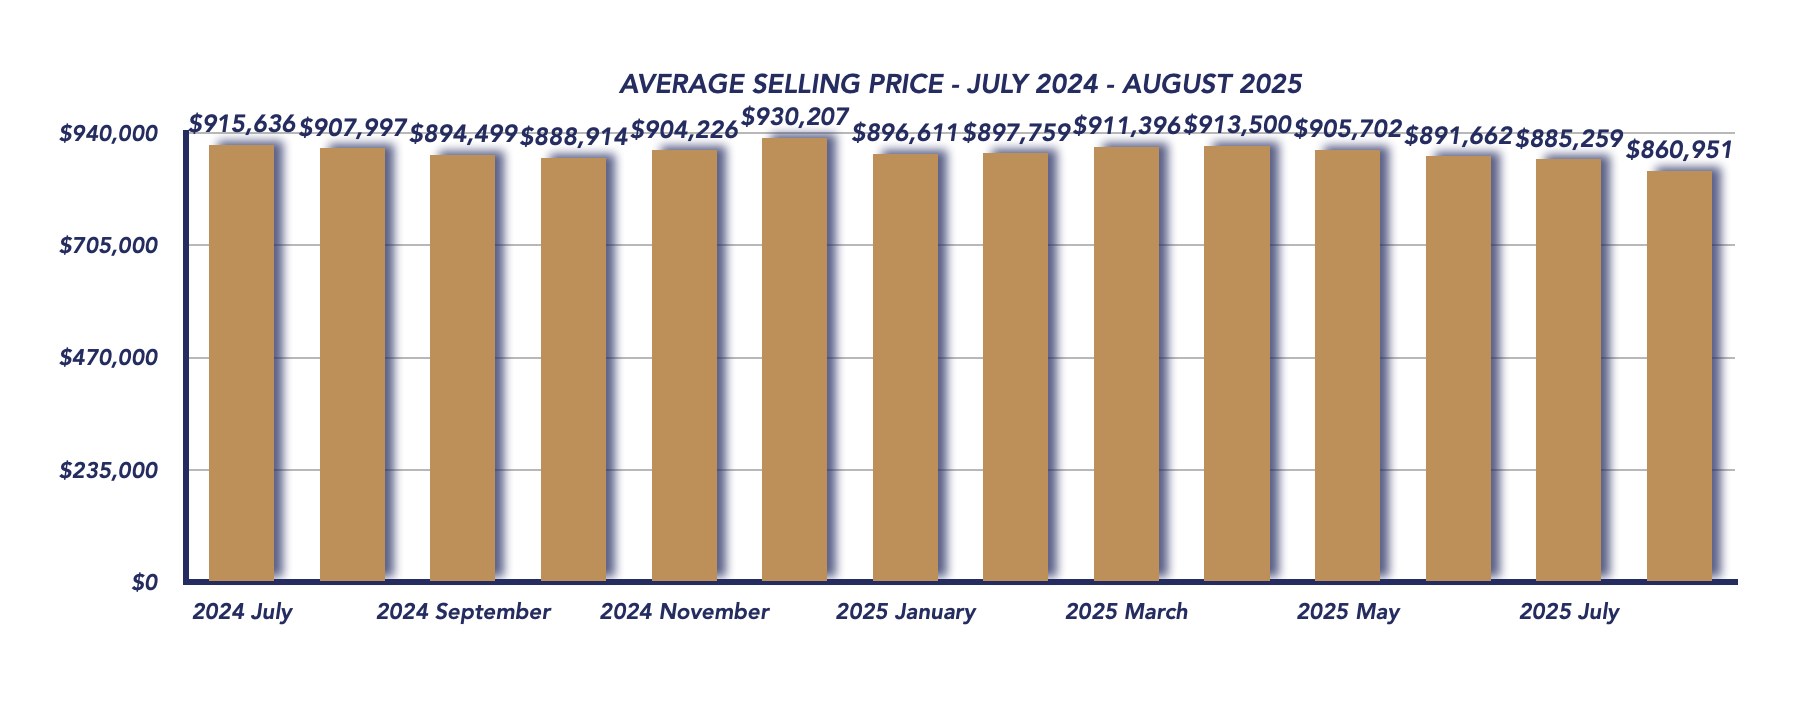
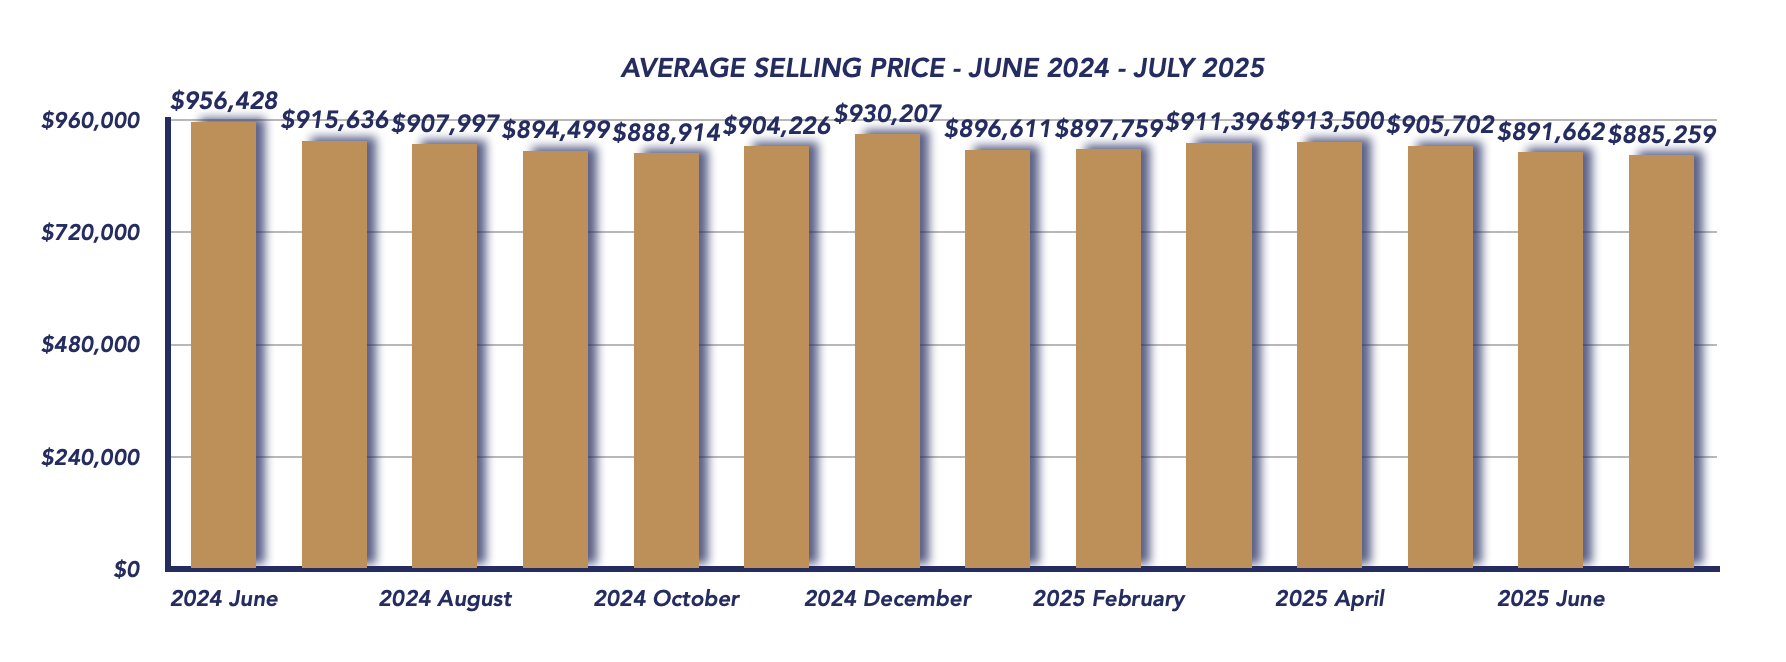
The average sales price fell to $860,951 in August, a 2.7% drop from July’s $885,259 and 5.2% lower than August 2024’s $907,997. This marks one of the sharpest month-over-month declines this year, underscoring the pressure affordability and borrowing costs continue to place on home values.
📊 Sales Volume Dips Below Last Year
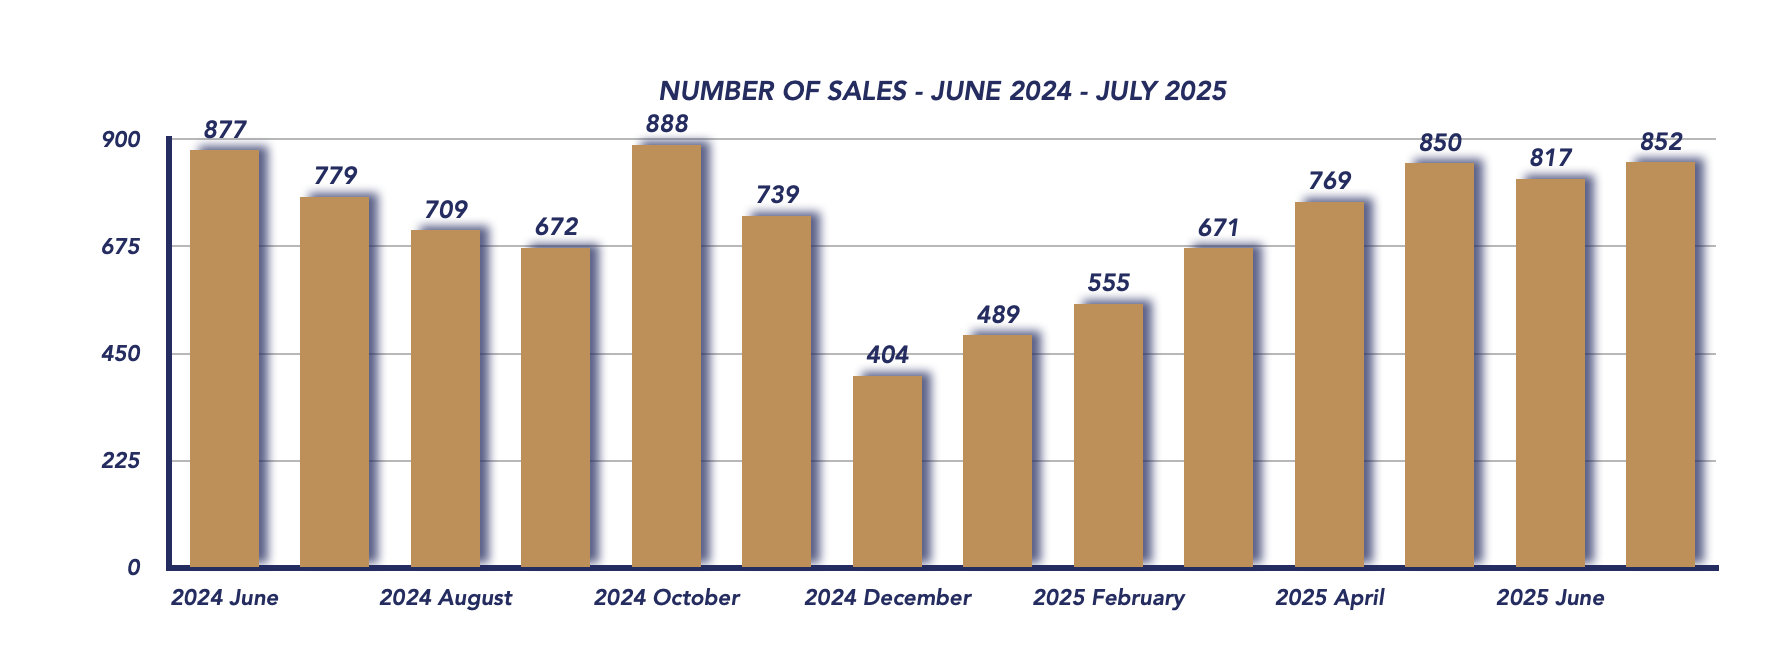
Durham Region recorded 676 sales in August 2025, down from 852 in July as the late summer slowdown took hold. Compared to 709 sales in August 2024, this marks a 4.7% year-over-year decline. This runs counter to the broader GTA, where sales actually rose 2.3% compared to last year. The contrast highlights how Durham’s market is cooling more noticeably than the GTA overall, reflecting more cautious buyer activity across the region.
📉 Sale-to-List Price Ratio Falls to 98%
For the first time since August 2019, the sale-to-list price ratio dropped to 98%, down from 99% in July. This shift signals that buyers are gaining leverage at the negotiation table, and homes are no longer consistently selling at or above asking price. For sellers, realistic pricing strategies are now more critical than ever.
📈 Listings Ease but Inventory Rises
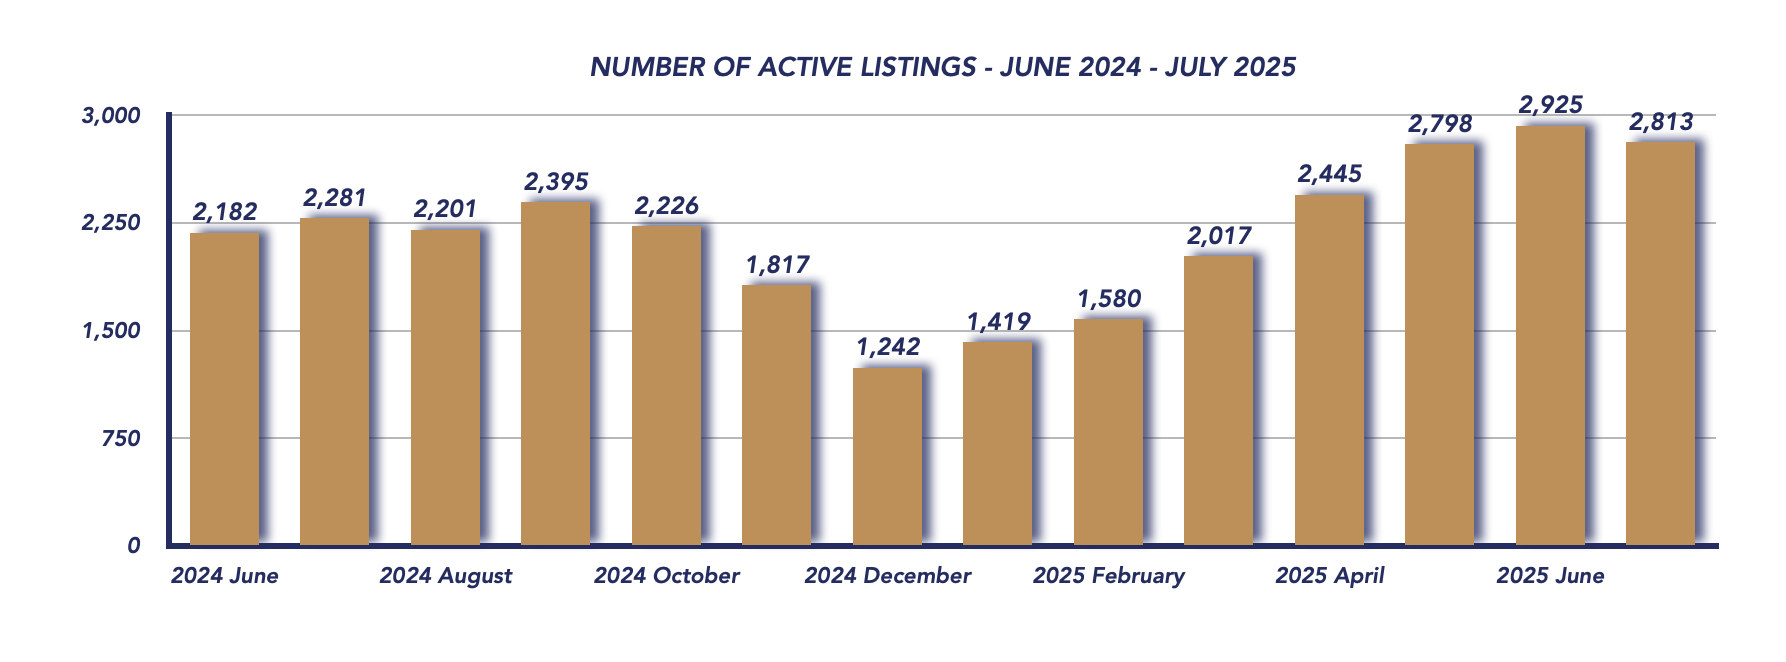
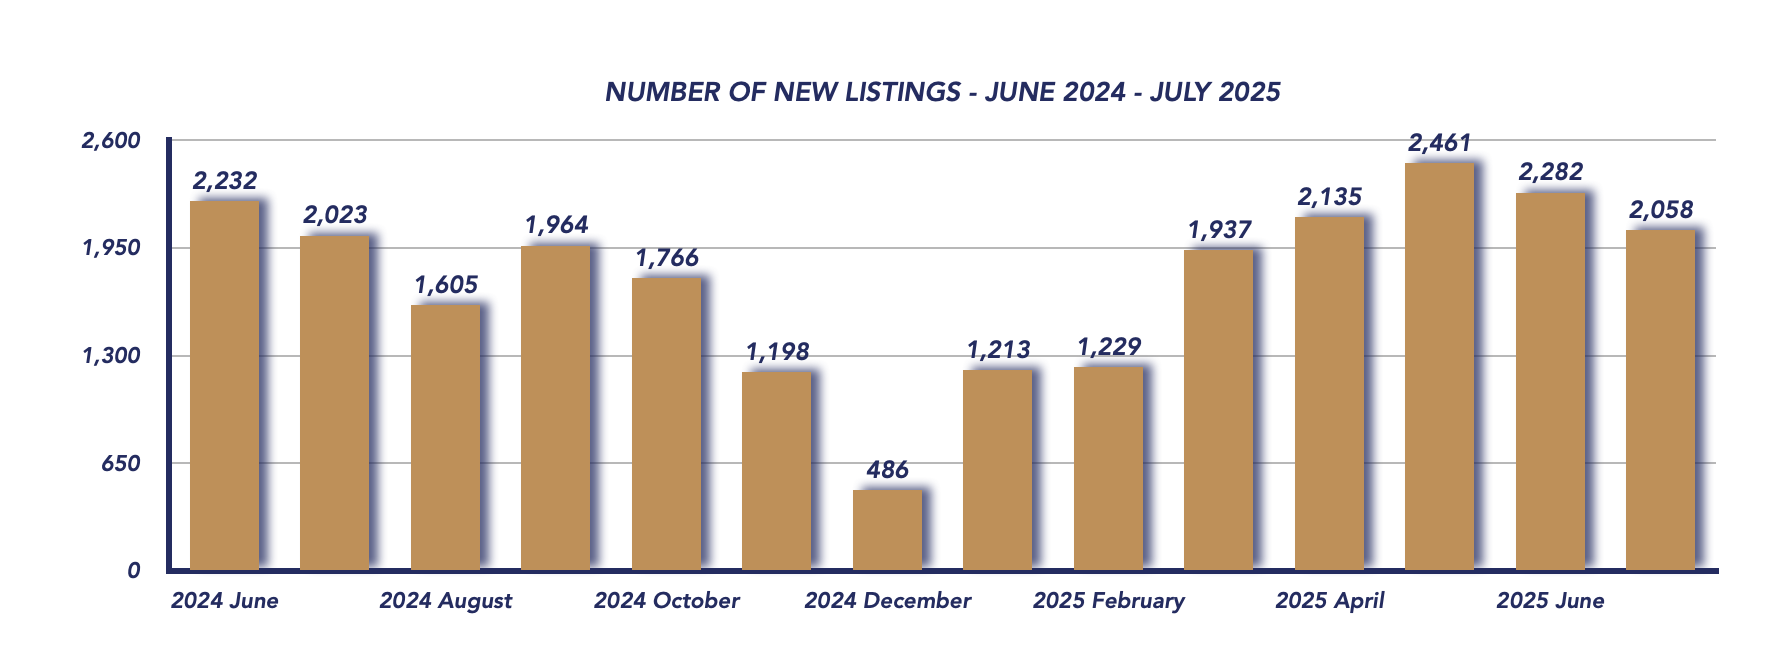
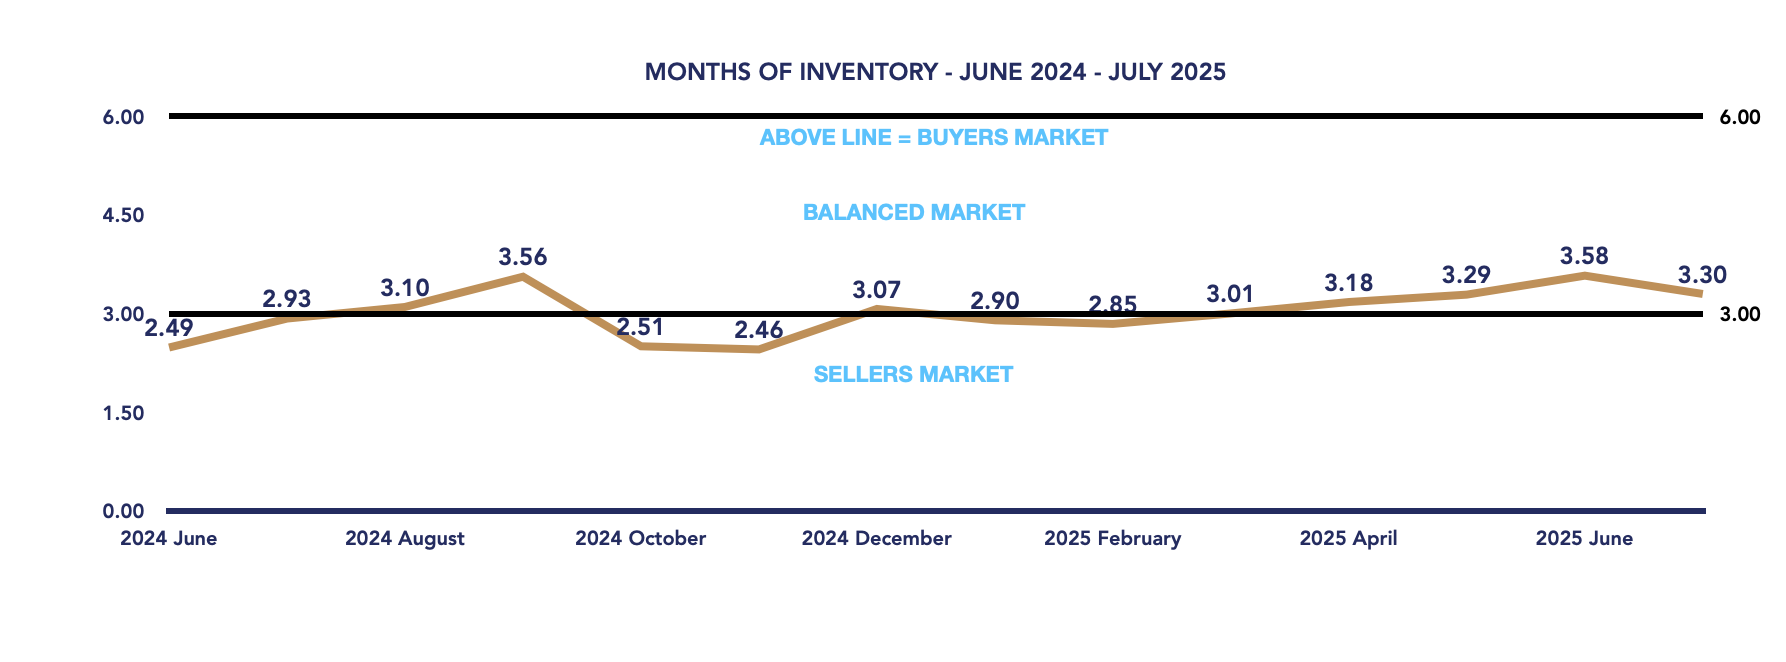
New listings totaled 1,675, a drop from 2,058 in July but slightly higher than the 1,605 recorded in August 2024. Despite fewer new listings month-over-month, the slower pace of sales has pushed months of inventory up to 3.99 from 3.30 in July, moving the market further into balanced territory.
⏳ Homes Taking Longer to Sell
The average days on market increased to 43 days, up from 39 in July. This trend highlights growing buyer caution, as purchasers take more time to weigh options, negotiate, and secure financing. Sellers should be prepared for longer marketing periods and fewer multiple-offer scenarios.
Conclusion
The August 2025 Durham Region housing market continued its shift toward balance, with prices declining, the sale-to-list ratio falling to its lowest level since 2019, and homes taking longer to sell. Sales activity dropped both month-over-month and year-over-year, in contrast to the broader GTA, where transactions actually rose compared to last year.
This divergence shows that Durham is cooling faster than surrounding markets, with buyers exercising more caution and sellers needing to adjust expectations. For buyers, this creates greater negotiating power and more choice. For sellers, success will depend on competitive pricing and patience, as properties take longer to attract offers. Heading into the fall, the key question is whether Durham will catch up to the GTA’s slight sales rebound or continue to soften further.
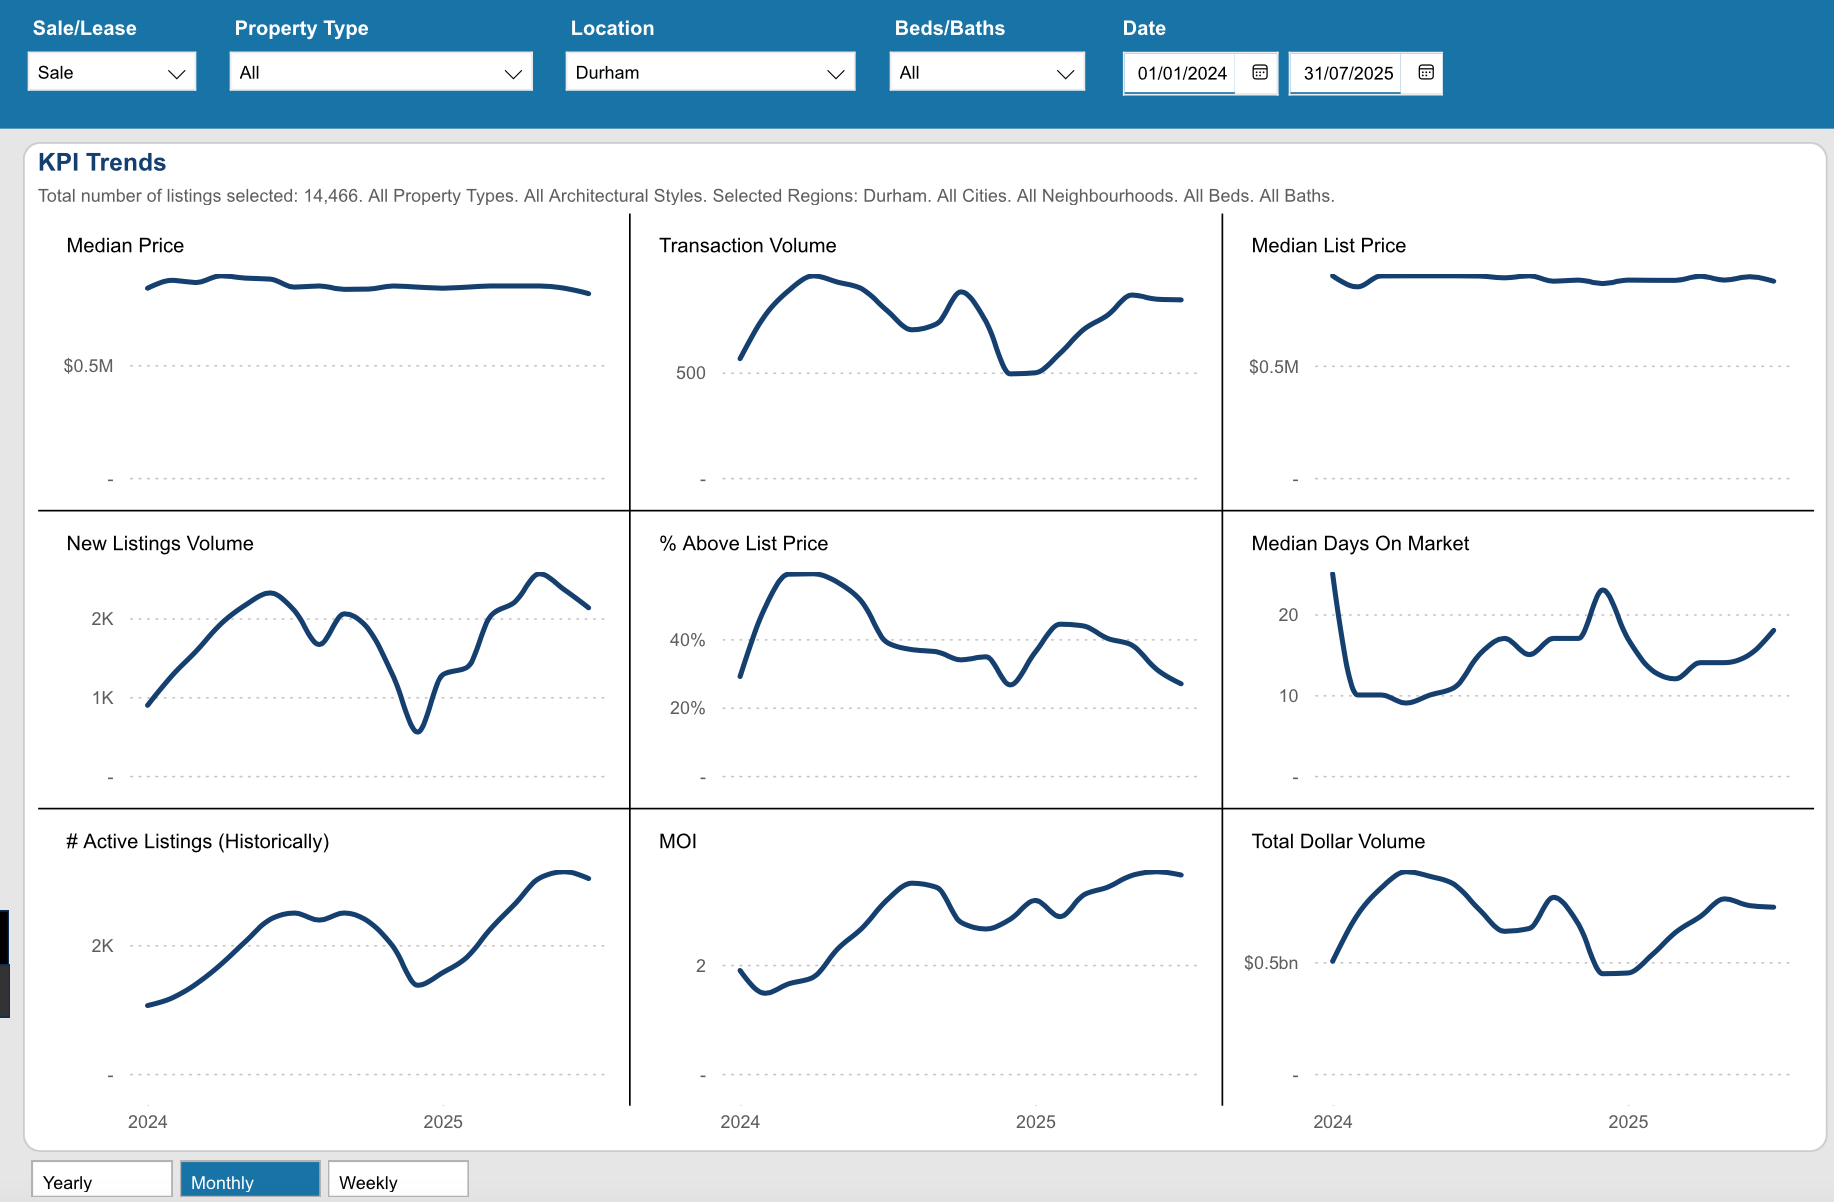
Key Performance Indicators (KPIs) from January 2024 through August 2025 provide a clear snapshot of how the Durham Region real estate market has evolved across all property types, architectural styles, and home configurations
*Information is believed to be accurate at time of posting but is not guaranteed to be correct. Some values may vary slightly based on the exact date and time the reports were generated. Market stats are provided by TRREB (Toronto Regional Real Estate Board) and are based on sales for the month of Attached/Row/Townhouses, Condo Apartments, Condo Townhouses, Detached, Detached with Common Elements, Link Homes and Semi-detached. *Some values may vary slightly based on the exact date and time the reports were generated.
Check out our Uxbridge and Scugog Events Pages to keep up to date on whats going on around town. Click the links or scan the Code with your phone to take you directly there.
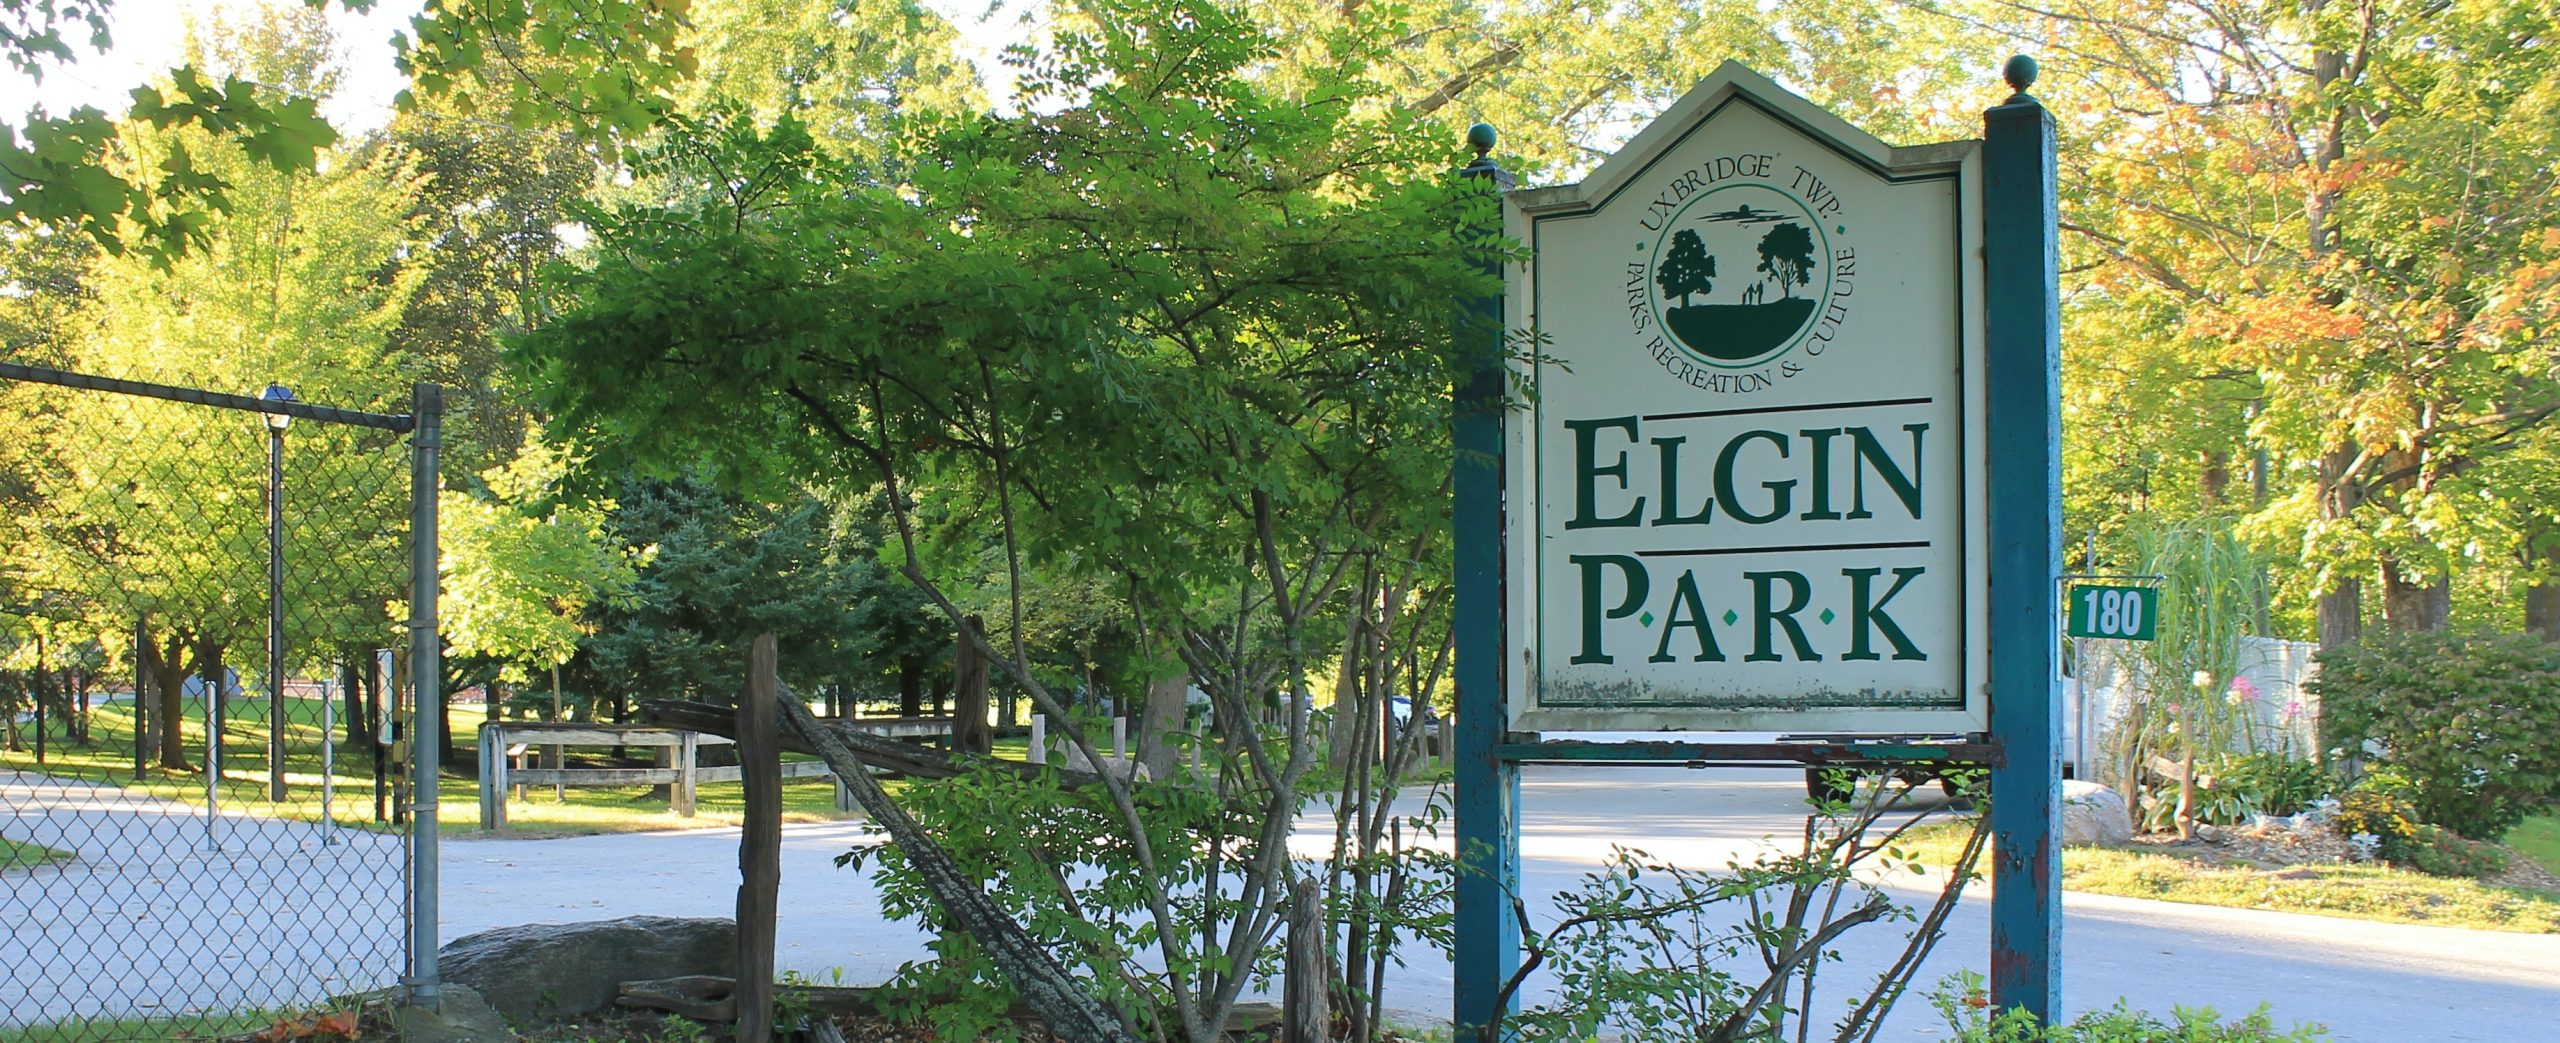
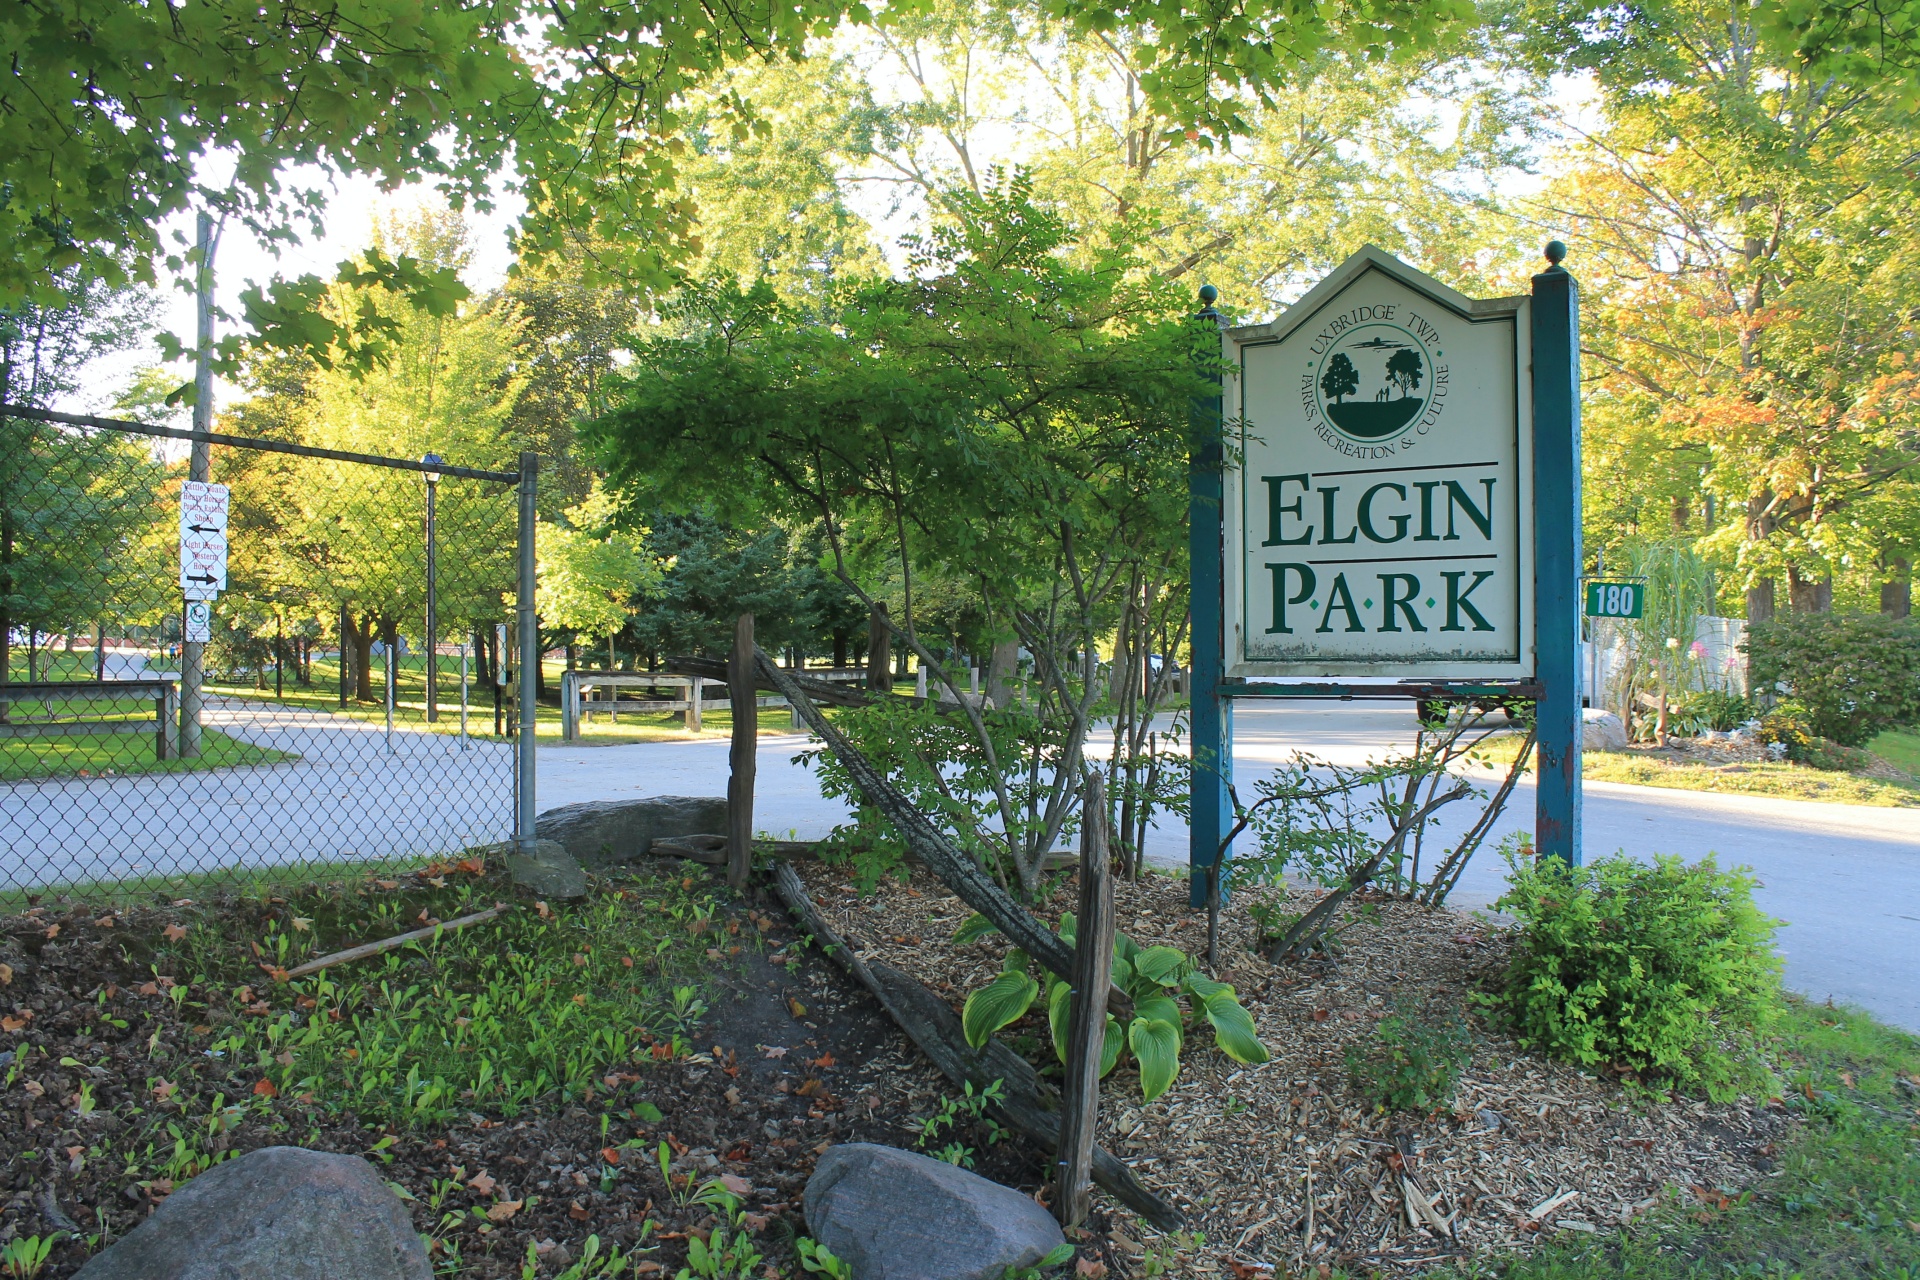
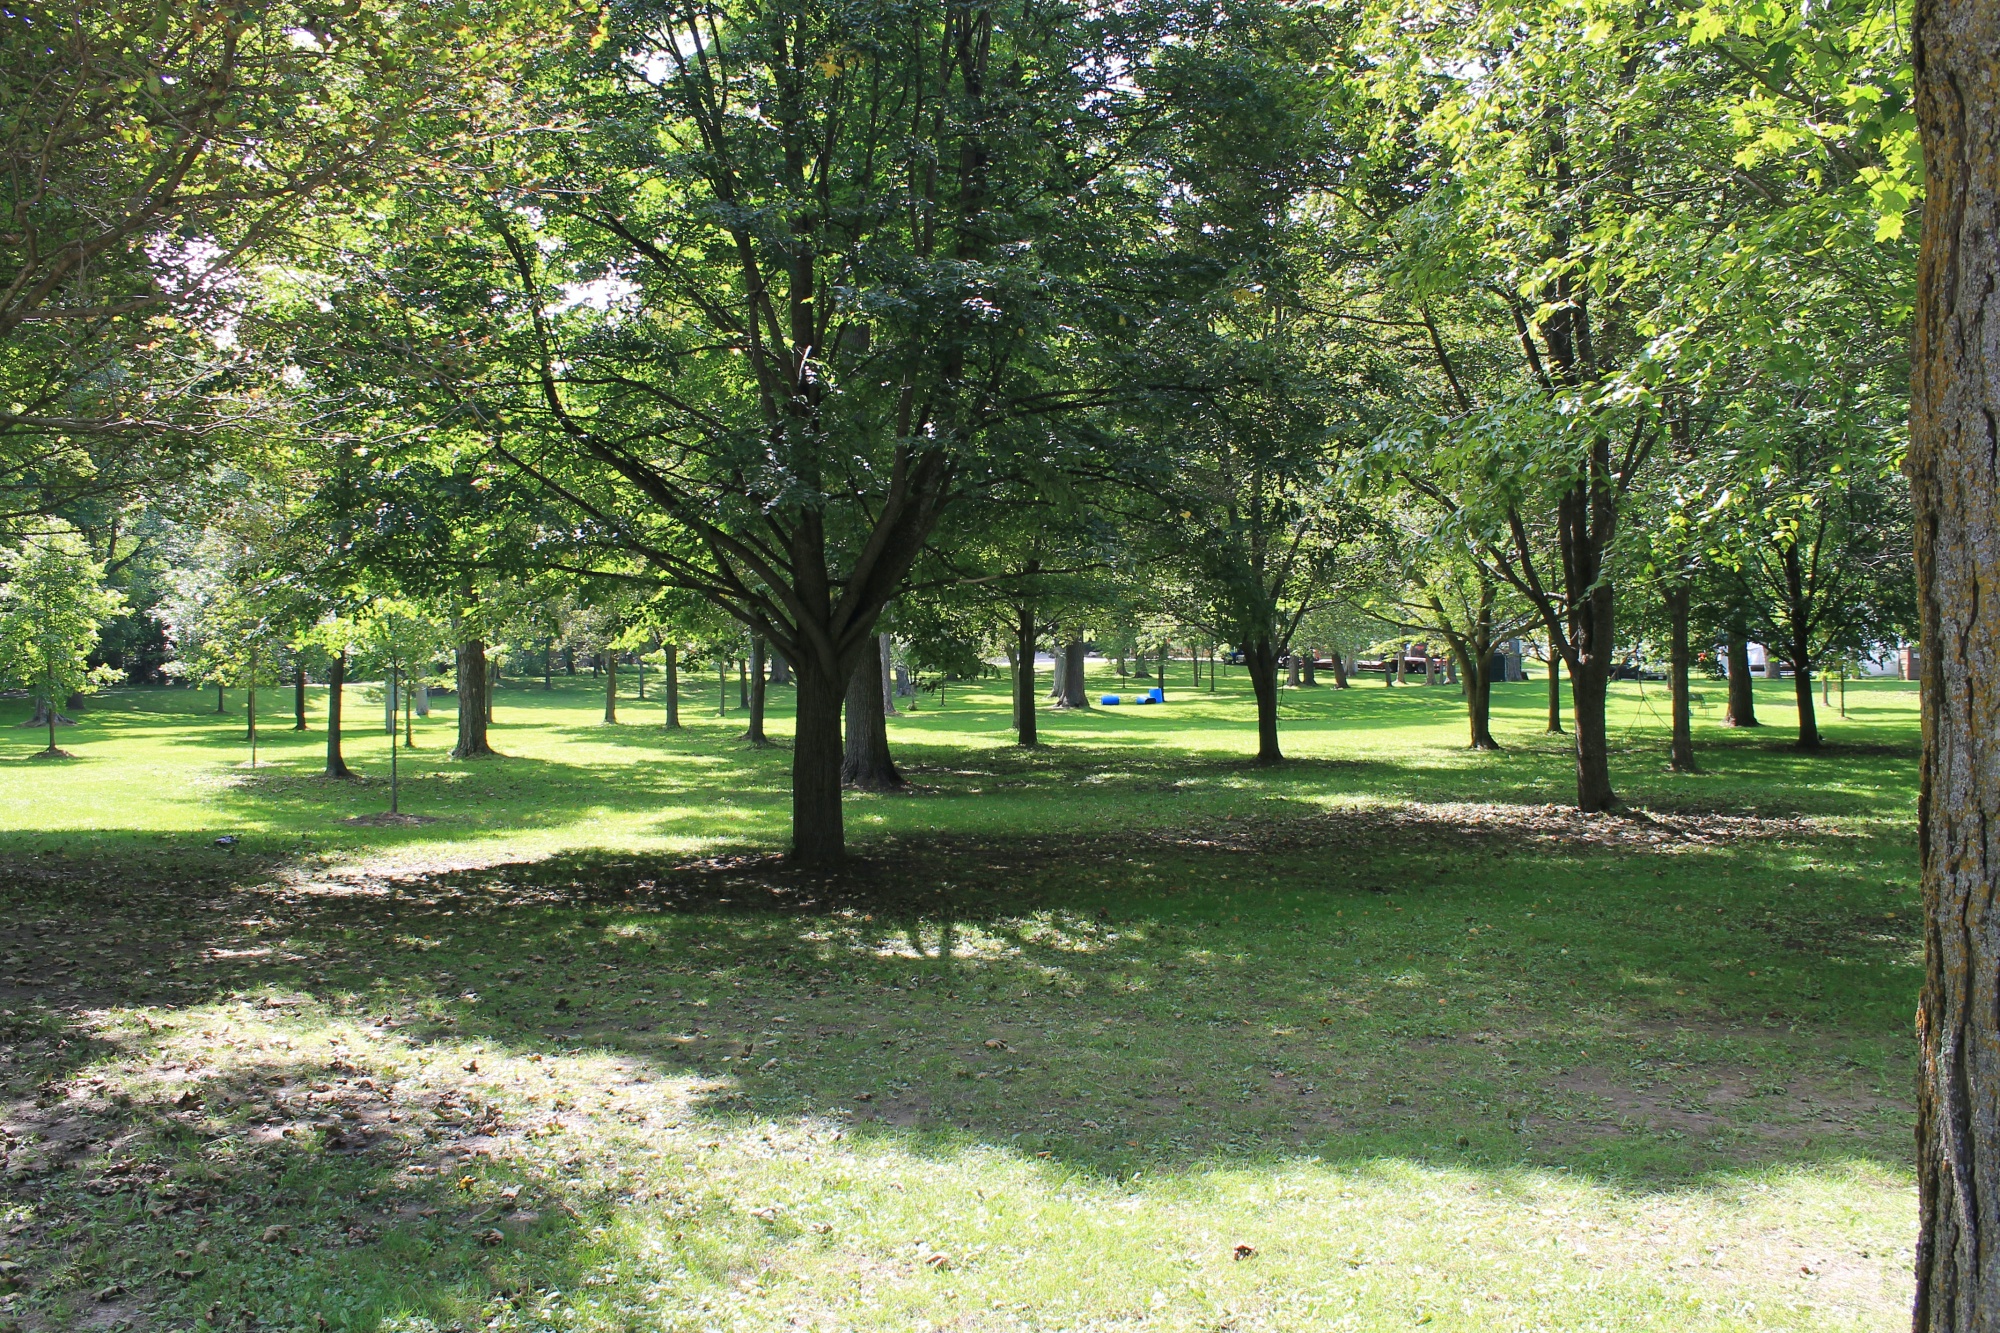
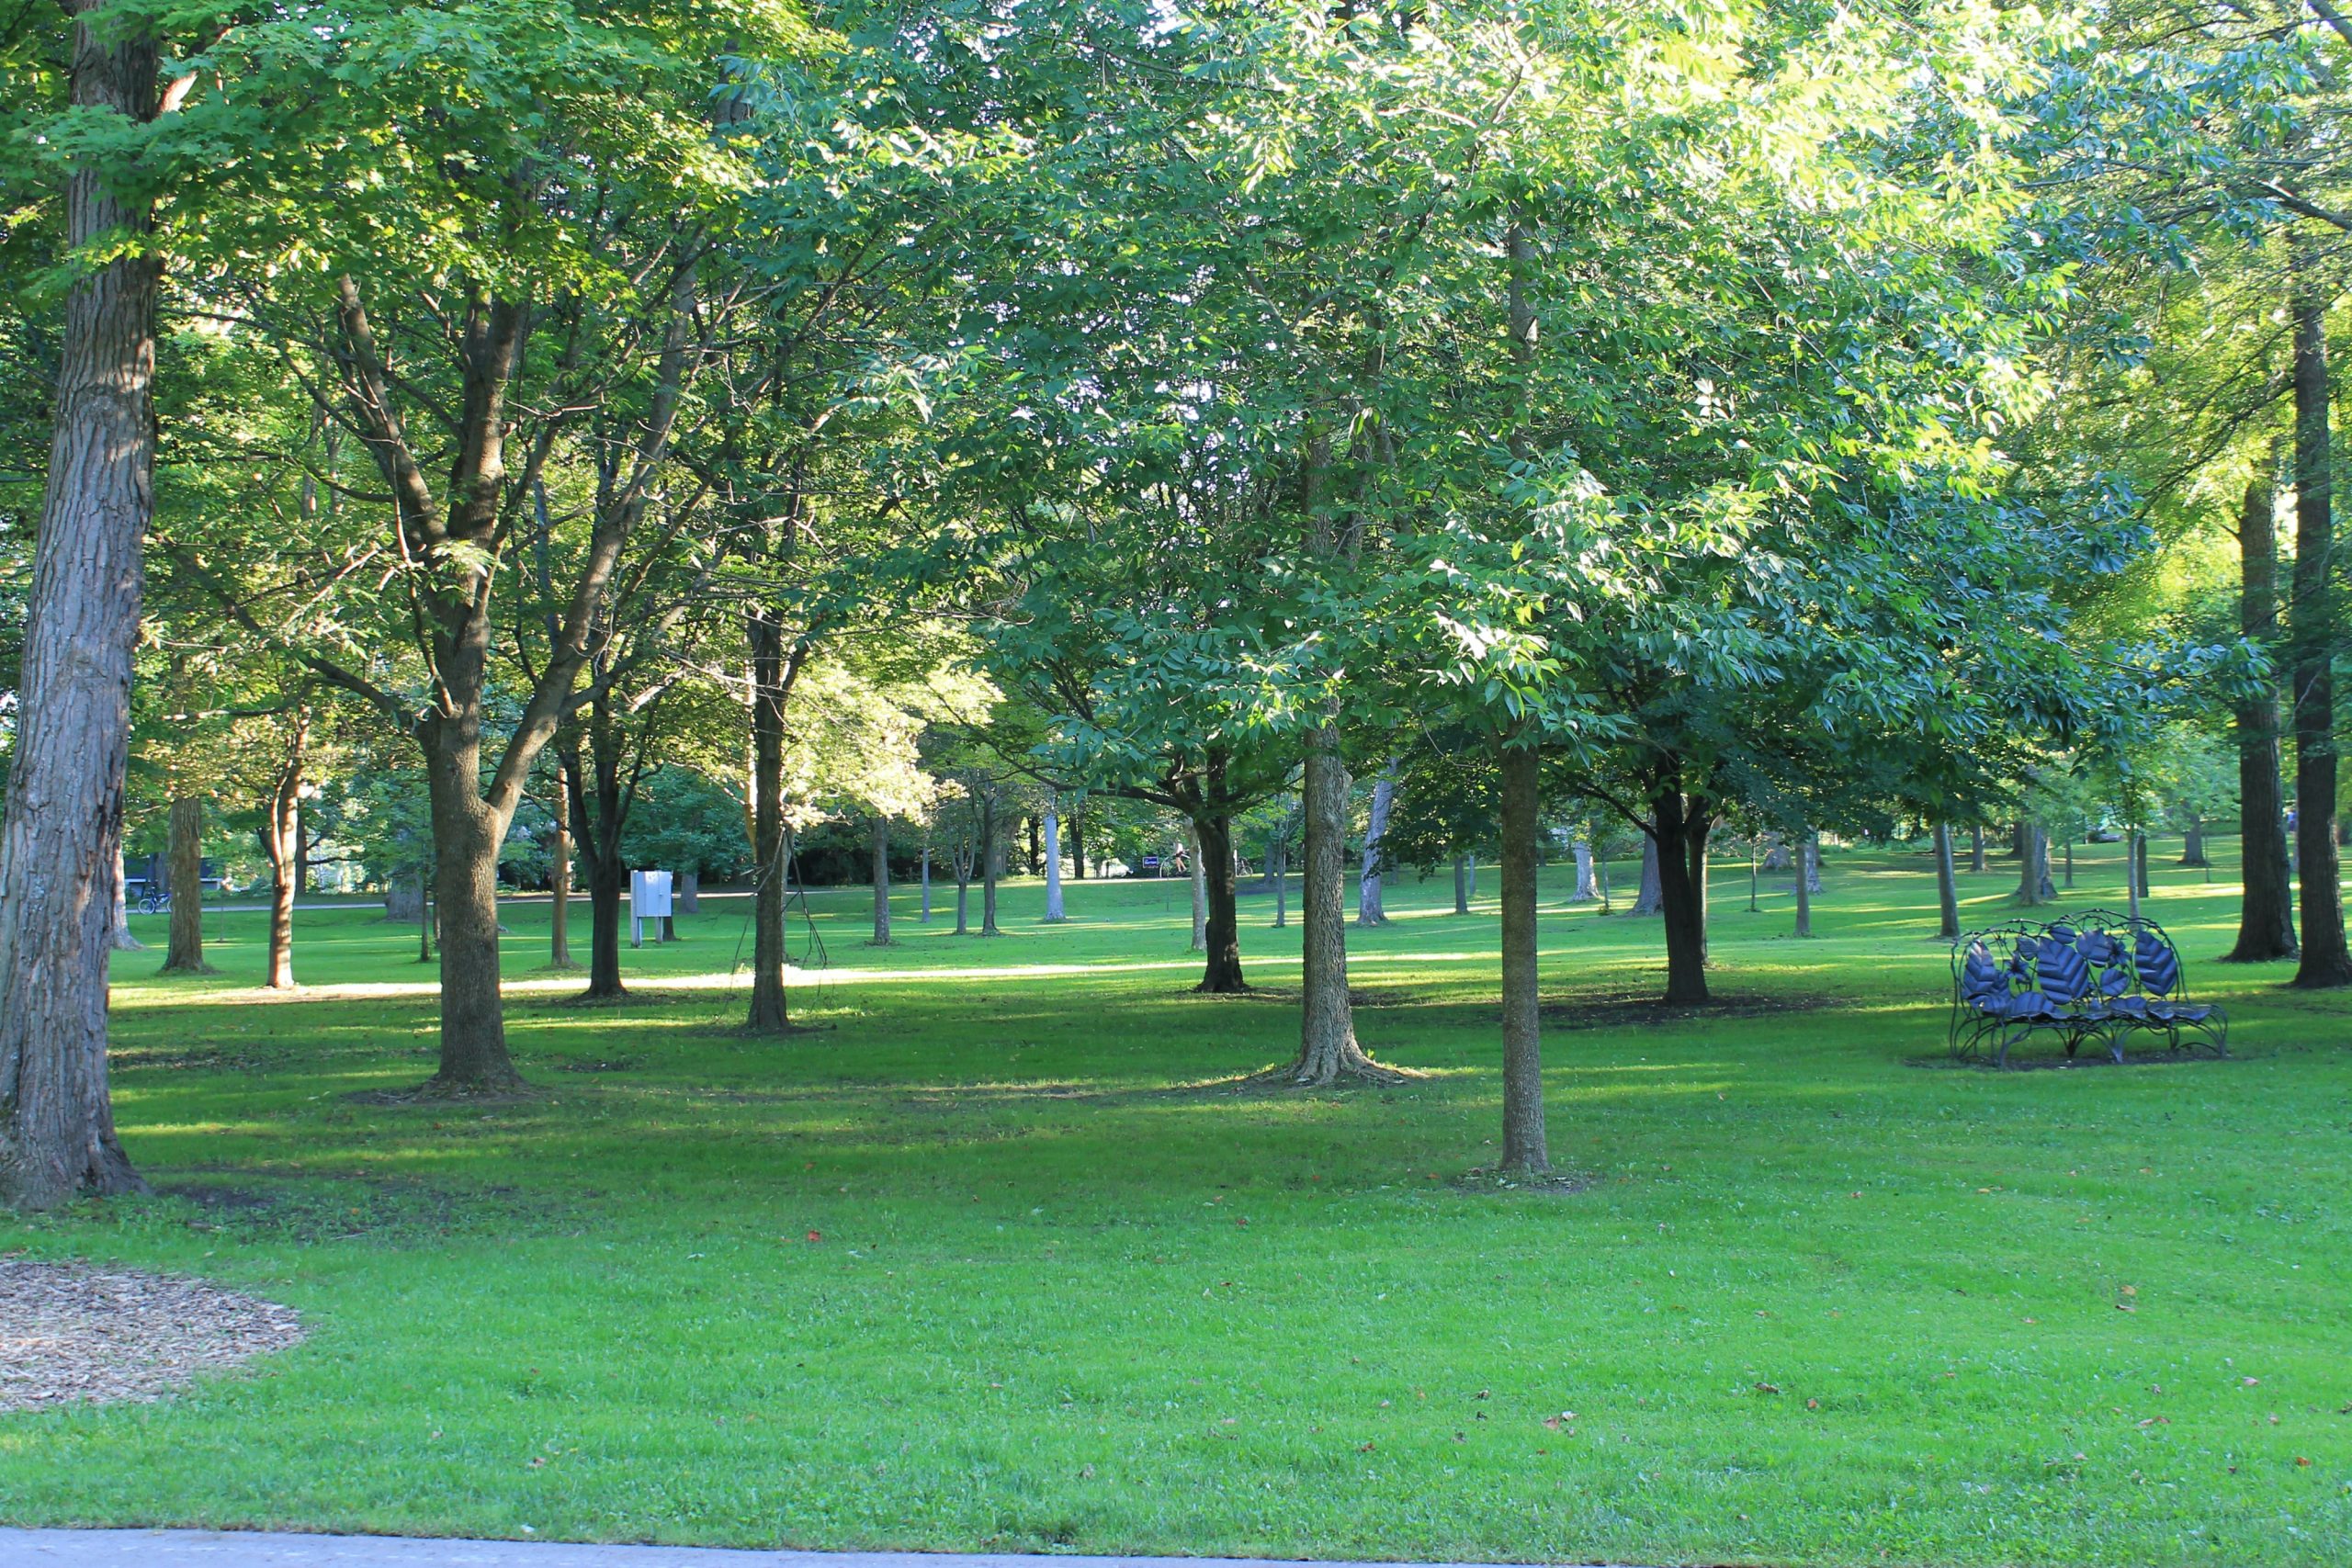
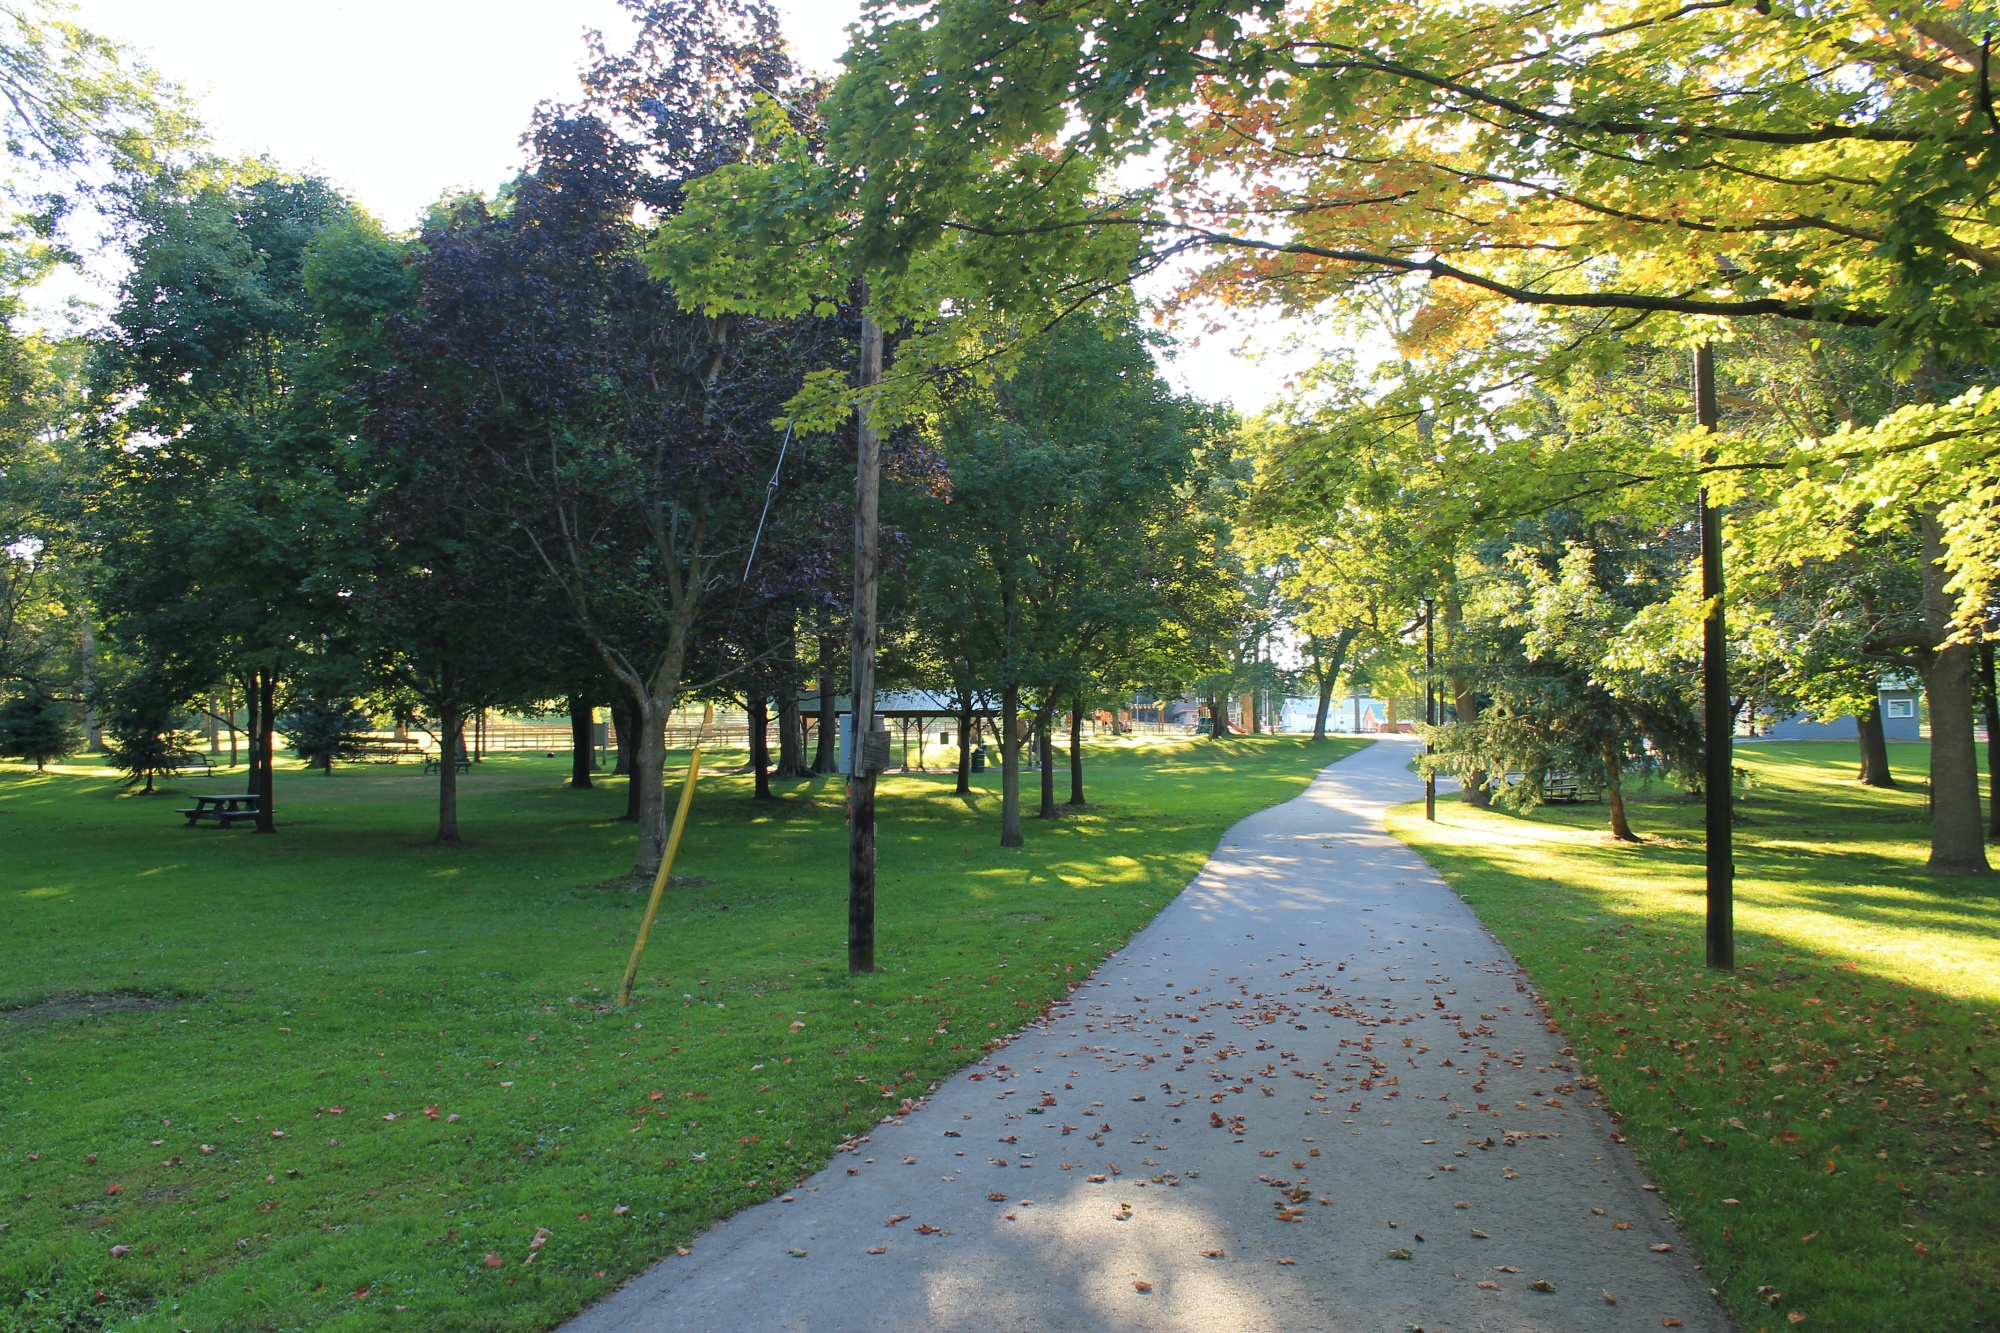
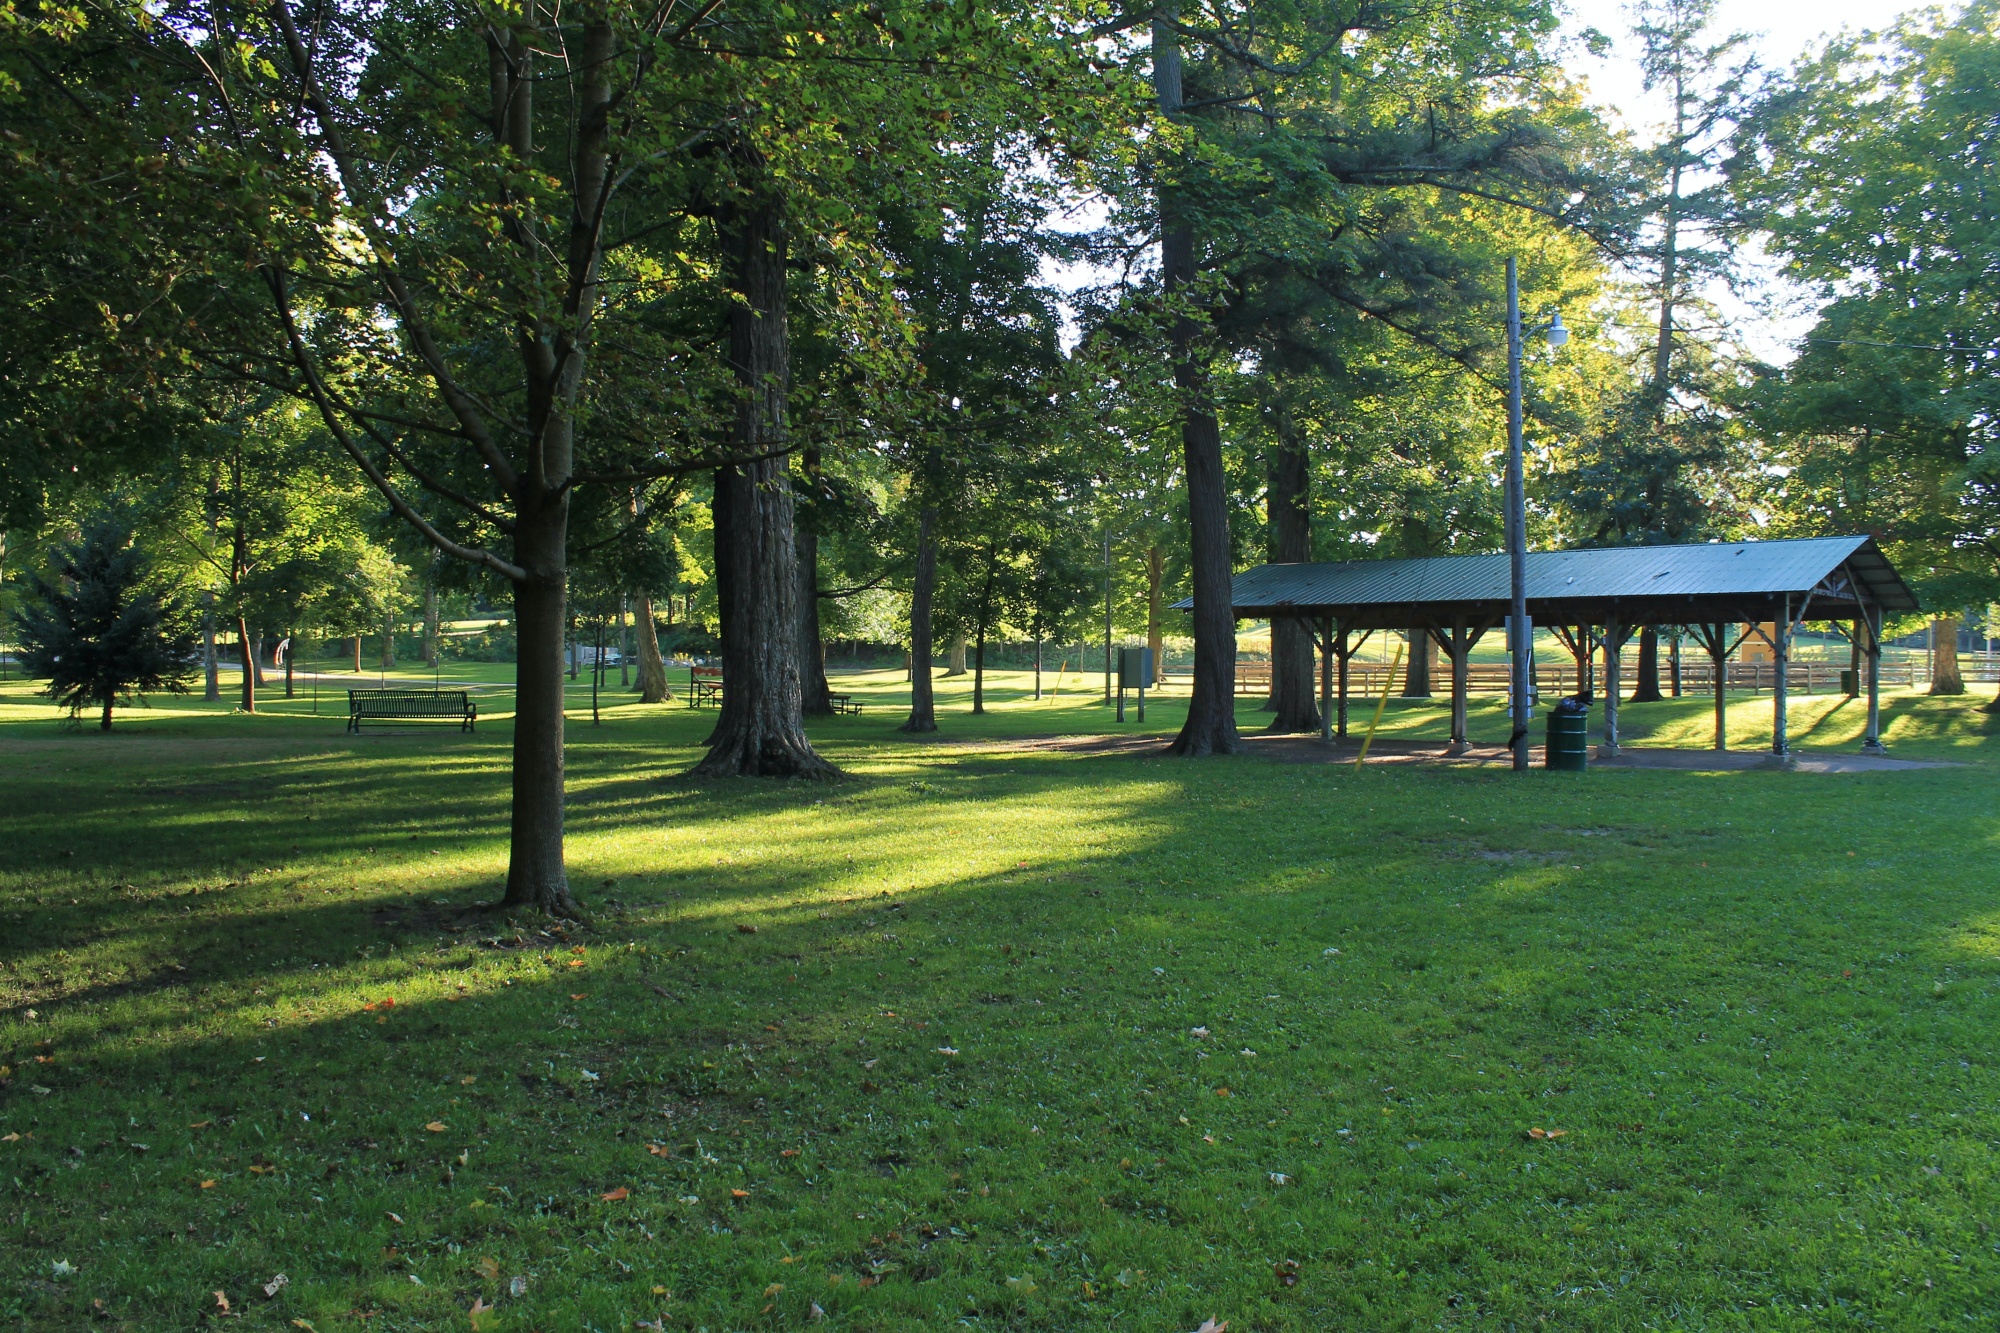
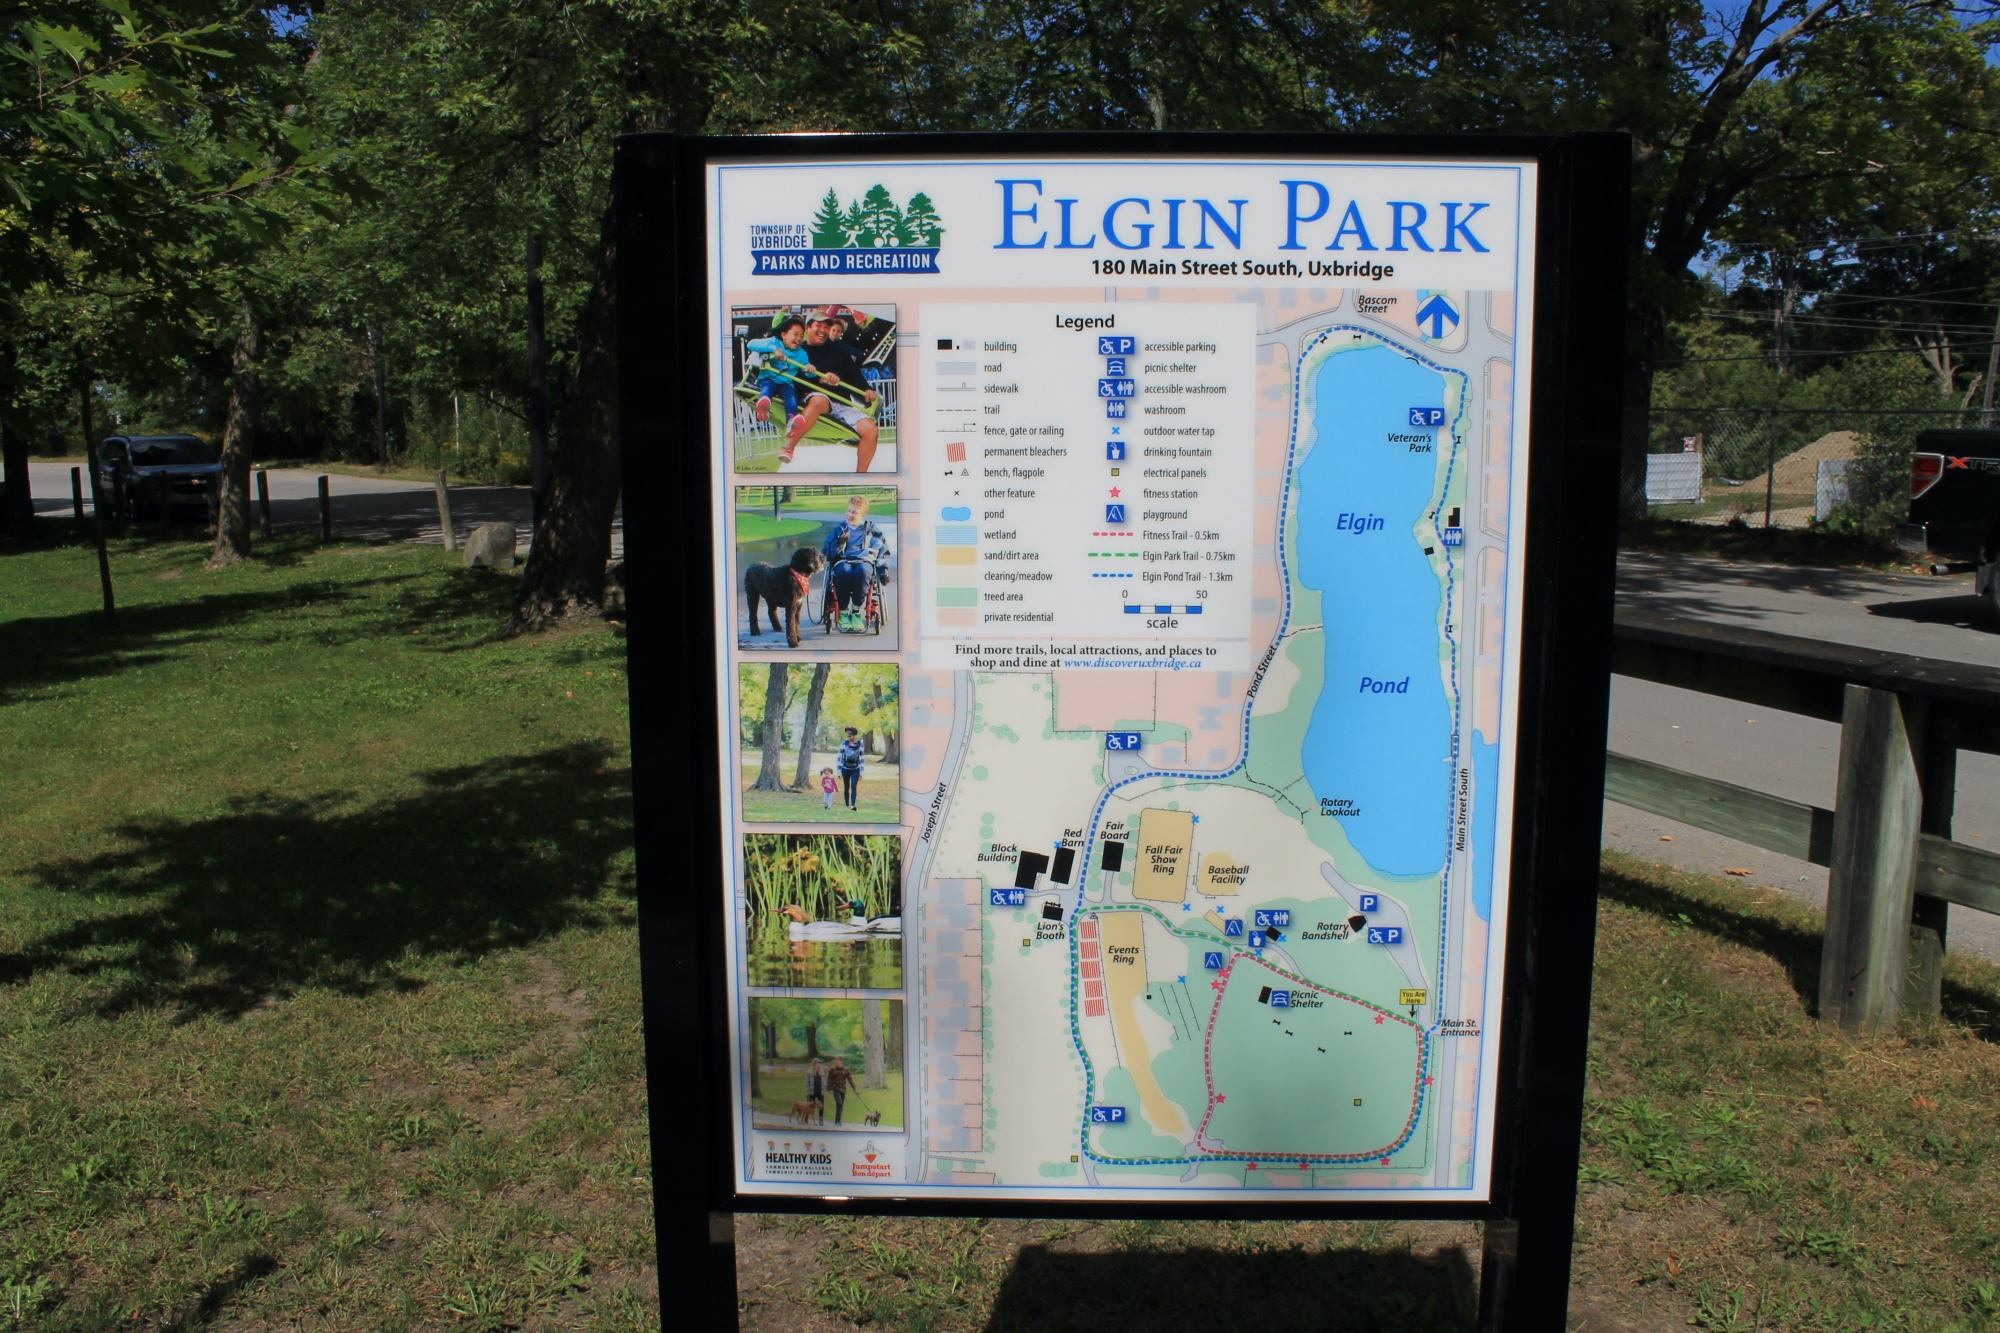
Elgin Park is one of Uxbridge’s most cherished green spaces, offering trails, playgrounds, and a peaceful pondside setting. But long before it became the hub for community events and outdoor recreation that we know today, the park was already a gathering place with deep roots in the township’s history.
The 1860s – From the “South Woods” to a Community Picnic Spot
The story of Elgin Park begins in the 1860s, when residents of the hamlet of Uxbridge flocked to a wooded area affectionately known as the “South Woods.” Families gathered here for picnics and leisurely afternoons, establishing the site’s enduring role as a natural community meeting place.
1873 – Named for Lord Elgin
The park’s public history officially began in 1873, when a public company purchased 13 acres from Isaac Gould and named the space Elgin Park to honour Lord Elgin (James Bruce), Governor General of Canada from 1846 to 1854. Additional land acquisitions followed in 1877 and 1888, expanding the park’s footprint and making it an even more inviting destination for the growing community.
1880s – Racetracks and Political Picnics
In 1881, a half-mile racetrack was added, expanding the park’s facilities and drawing even larger crowds. The park also became a venue for major public events. In the 1880s, Canada’s first Prime Minister, Sir John A. MacDonald, held his famous campaign picnics at the Uxbridge Fall Fair grounds within Elgin Park—huge gatherings that cemented the park as a focal point for the community.
Elgin Park Today – Trails, Events, and Family Fun
Today, Elgin Park remains a central feature of Uxbridge, both historically and recreationally. The park is a highlight of the Township of Uxbridge’s trail system, with over 6 km of marked paths weaving through woodlands, wetlands, andponds.
Visitors can choose from several scenic routes:
Fitness Trail – a 0.5 km loop with outdoor fitness equipment.
Elgin Park Trail – a 0.75 km loop through the park’s heart.
Elgin Pond Trail – a 1.3 km loop circling the picturesque pond.
Alongside its trails, the park also offers:
Two playgrounds
Public washrooms
A baseball field
The Uxbridge Horsemen’s Club arena
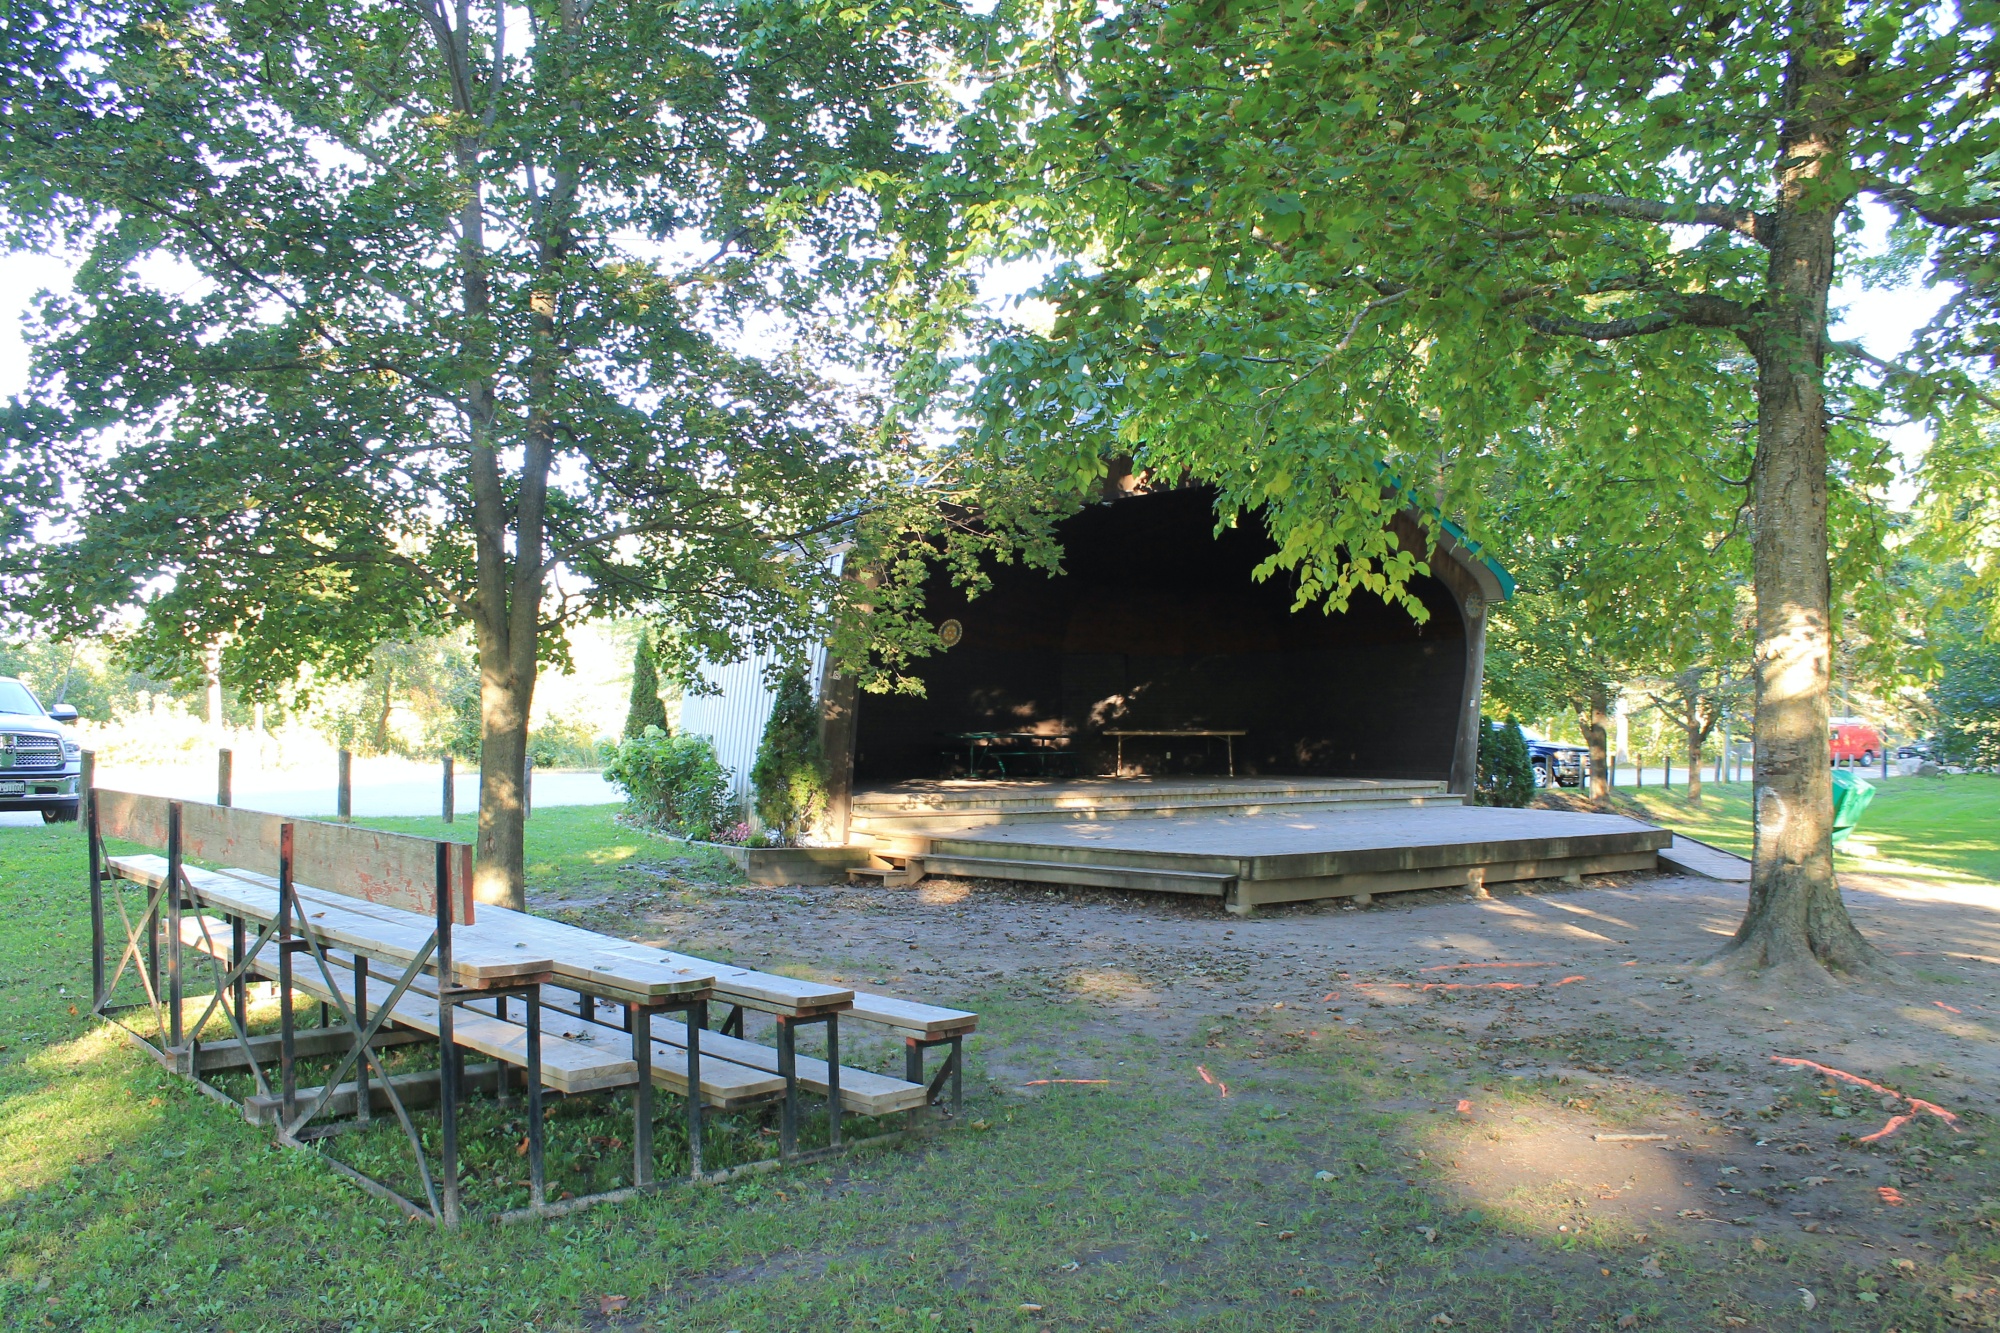
The Rotary Bandshell, hosting concerts and community events
A Hub for Community Celebrations and Events
Beyond its natural beauty and recreational amenities, Elgin Park is also the heart of Uxbridge’s community life, hosting major events year-round. These include:
Bonner Boys Cruise-In Car Show – Every Thursday evening from May through September.
Canada Day Celebrations – A festive community gathering each July.
Uxbridge Ribfest – A summer favourite for food and family fun.
Uxbridge Scottish Festival – Experience the skirl of the bagpipes, highland dancing, and authentic Scottish fare.
Uxbridge Lions’ Art in the Park – Showcasing the talents of some of Ontario’s finest artists, artisans, and craftspeople.
Uxbridge Fall Fair – A tradition for generations, with the park serving as its long-standing home. The fair also features crowd favourites like the Tractor Pull and Demolition Derby, drawing visitors from near and far.
Fantasy of Lights – A magical holiday light display that brightens the park each winter.
A Living Part of Uxbridge’s Story
From its humble beginnings as a picnic spot in the 1860s to its role in political history and as the home of beloved community events, Elgin Park has grown alongside the Township of Uxbridge. Today, it continues to serve as a gathering place where history, recreation, and community spirit come together.
Whether you’re exploring the trails, attending an event, or simply enjoying a picnic under the trees, a visit to Elgin Park connects you to more than 150 years of Uxbridge’s heritage.
Monday Market Minute – Uxbridge & Scugog Real Estate Update Week of August 17 to August 23
Welcome to this week’s Monday Market Minute! Here’s your quick summary of what’s happening in the real estate markets for Uxbridge and Scugog as enter the last week of summer holidays.
Weekly Real Estate Market Minute for the Townships of Uxbridge and Scugog
📍 Uxbridge Market Highlights
New Listings: 3 (down from 6 last week)
Back on Market: 8 properties returned
Price Adjustments: 10 (down from 12 last week)
Sales: 3 conditional and 4 firm (vs. 2 conditional and 5 firm last week)
Active Listings: 162 (down from 166 the previous week)
Includes 17 vacant land properties and 8 condominiums
📊 Takeaway: Uxbridge experienced fewer new listings and a small dip in overall inventory. Sales activity held steady, showing buyers remain engaged even with limited supply.
📍 Scugog Market Highlights
New Listings: 5 (down from 10 last week)
Back on Market: 4 properties returned
Price Adjustments: 3 (down sharply from 13 last week)
Sales: 4 conditional and 4 firm (vs. 1 conditional and 6 firm last week)
Active Listings: 166 (slightly up from 164 last week)
Includes 10 vacant land properties and 4 condominiums
📊 Takeaway: Scugog saw fewer new listings but stronger conditional sales activity compared to last week. With fewer price adjustments, some stability may be returning to this market.
🏡 Final Thoughts
Both Uxbridge and Scugog remain active despite reduced new listings, with firm and conditional sales keeping the markets moving. Inventory remains steady, and price adjustments show sellers are responding to changing buyer demand.
If you’re thinking about buying or selling, these numbers can help guide your decisions. Reach out anytime for a personalized market consultation.
Check out our Uxbridge and Scugog Events Pages to keep up to date on whats going on around town. Click the links or scan the Code with your phone to take you directly there.
Monday Market Minute – Uxbridge & Scugog Real Estate Update Week of August 10 to August 16
The real estate markets in Uxbridge and Scugog continue to show steady summer activity, with shifts in new listings, sales, and price adjustments. Here’s your snapshot for the week of August 10–16, 2025.
Weekly Real Estate Market Minute for the Townships of Uxbridge and Scugog
📍 Uxbridge
6 new listings hit the market (down from 10 last week).
An additional 7 properties returned to the market after previously being listed.
12 properties had price adjustments, up from 9 last week.
Sales included 2 conditional (4 last week) and 5 firm (8 last week).
Total active listings: 166 properties (slightly down from 168).
Includes 17 vacant land properties and 8 condominiums.
📍 Scugog
10 new listings, up from 8 last week.
Another 5 properties were brought back to the market.
13 price adjustments were made, compared to 14 last week.
Sales included 1 conditional (3 last week) and 6 firm (up from 4 last week).
Total active listings: 164 properties (up slightly from 161).
Includes 10 vacant land properties and 3 condominiums.
🏡 Takeaway
Both Uxbridge and Scugog continue to see steady listing and sales activity, with more price adjustments reflecting changing market conditions. Uxbridge saw fewer new listings and sales this week, while Scugog had an increase in firm sales and a slight uptick in total inventory.
If you’re considering buying or selling, staying on top of these week-to-week changes is essential.
Check out our Uxbridge and Scugog Events Pages to keep up to date on whats going on around town. Click the links or scan the Code with your phone to take you directly there.
This housing report for Durham Region includes the number of new listings, average list price, number of properties sold, average selling price, average days on market and average asking price to selling price ratio for all property types within the Region of Durham.
Scroll to the bottom for links to take you to the housing market reports for Durham Region, Uxbridge and Scugog.
From Toronto Regional Real Estate Board
Please note: The PropTx MLS® System, of which TRREB is a part, has added a number of new client boards over the last year. Many of these boards’ Members trade within the Greater Toronto Area and broader Greater Golden Horseshoe regions. As a result, historic data have been updated to reflect the addition of these boards’ listings and transactions. This means historic data have changed relative to previously published static reports. To view updated historic data, click here.
Toronto Regional Real Estate Board – Market Stats At A Glance – July 2025
Brock Township Real Estate Market Analysis – July 2025
The Brock Township real estate market saw moderate gains in July 2025, with average sale prices increasing from last month and sales activity improving. However, the market remains in buyer-friendly territory as inventory levels stay elevated and the sale-to-list price ratio continues to soften.
July 2025
June 2025
Average Sale Price Rises – But With Nuance
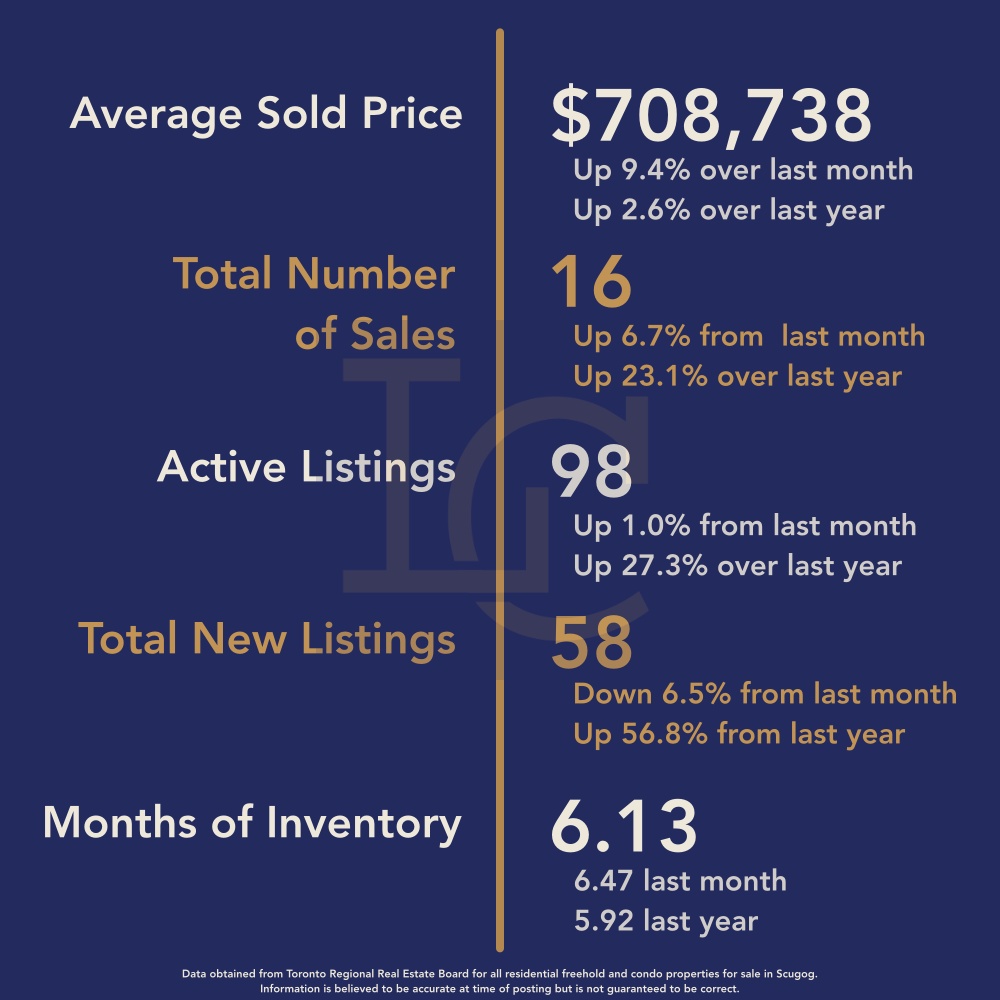
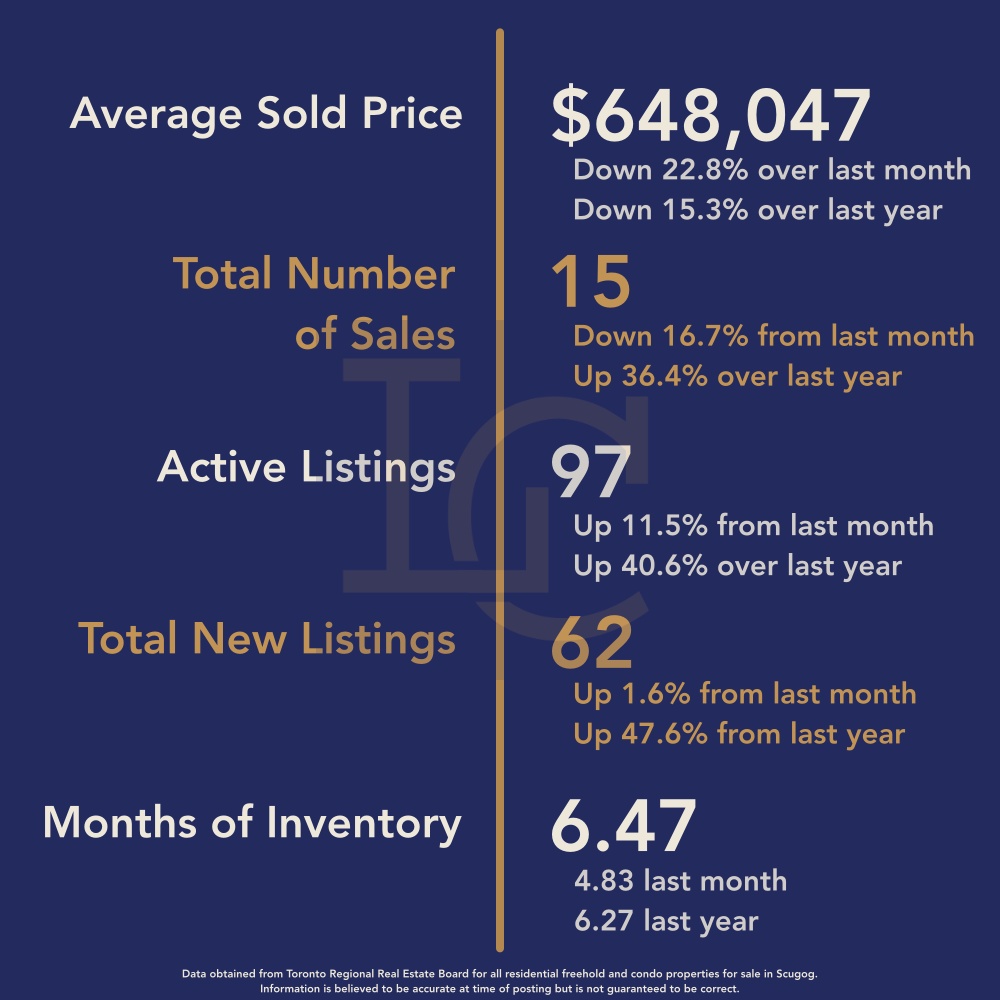
The average sale price in July 2025 reached $708,738, marking a 9.4% increase from June 2025’s $648,047 and a 2.6% rise over July 2024’s $690,577. One contributing factor was the sale of a farm property for $1.38 million, which pushed the monthly average higher.
For a clearer picture, looking at the year-to-date average sale price of $734,067 shows a slight 1.5% decrease compared to last year, indicating that while July’s figure was stronger, broader pricing trends remain relatively flat.
Sales Activity Picks Up
A total of 16 homes sold in July, up slightly from 15 in June and ahead of the 13 sales in July 2024. This modest increase suggests that buyer interest is steady, even as affordability and inventory continue to shape purchasing decisions.
Sale-to-List Price Ratio Slips
The sale-to-list price ratio fell to 96%, down from 97% in June and 98% in July last year. This decline points to buyers negotiating more aggressively, aided by the higher number of available listings.
Inventory Remains High
Inventory levels stayed elevated, with 98 active listings, almost unchanged from 97 in June, but well above the 77 listings in July 2024. New listings totalled 58, down slightly from 62 in June, but significantly higher than the 37 new listings recorded a year ago.
Days on Market & Buyer’s Market Conditions
Homes spent an average of 47 days on the market, reflecting longer selling times compared to the spring months. Months of inventory dipped slightly to 6.13 from 6.47 in June, but this still places Brock Township firmly in buyer’s market territory, where supply exceeds demand.
Conclusion
July 2025 brought a mild boost in prices and sales for Brock Township, though much of the price growth was influenced by a single high-value farm sale. Inventory remains high, giving buyers more options and bargaining power. Sellers can still find success, but pricing competitively and being prepared for longer selling times will be key as the market continues to favor buyers.
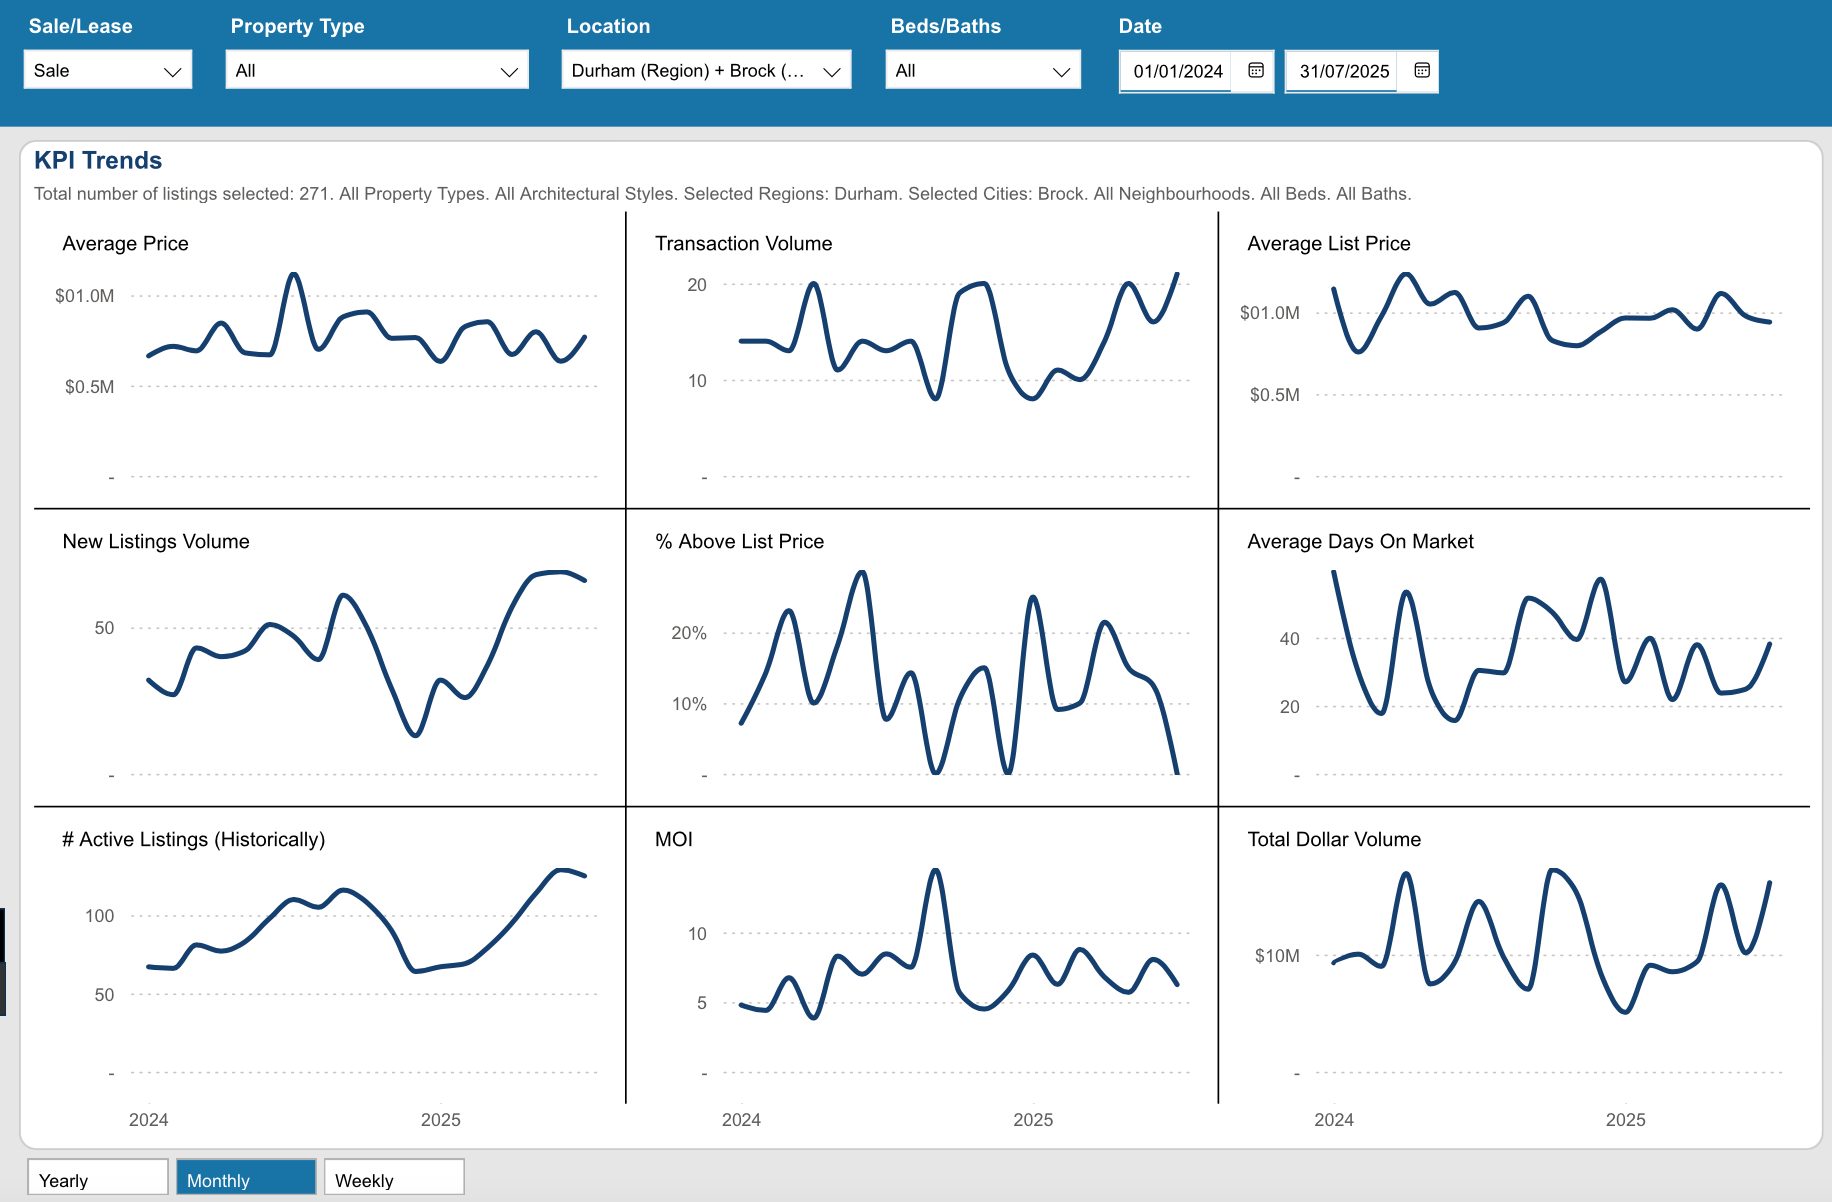
Key Performance Indicators (KPIs) from January 2024 through July 2025 provide a clear snapshot of how the Durham Region real estate market has evolved across all property types, architectural styles, and home configurations
*Information is believed to be accurate at time of posting but is not guaranteed to be correct. Some values may vary slightly based on the exact date and time the reports were generated. Market stats are provided by TRREB (Toronto Regional Real Estate Board) and are based on sales for the month of Attached/Row/Townhouses, Condo Apartments, Condo Townhouses, Detached, Detached with Common Elements, Link Homes and Semi-detached. *Some values may vary slightly based on the exact date and time the reports were generated.
Check out our Uxbridge and Scugog Events Pages to keep up to date on whats going on around town. Click the links or scan the Code with your phone to take you directly there.
This housing report for Durham Region includes the number of new listings, average list price, number of properties sold, average selling price, average days on market and average asking price to selling price ratio for all property types within the Region of Durham.
Scroll to the bottom for links to take you to the housing market reports for Durham Region, Uxbridge and Brock.
From Toronto Regional Real Estate Board
Please note: The PropTx MLS® System, of which TRREB is a part, has added a number of new client boards over the last year. Many of these boards’ Members trade within the Greater Toronto Area and broader Greater Golden Horseshoe regions. As a result, historic data have been updated to reflect the addition of these boards’ listings and transactions. This means historic data have changed relative to previously published static reports. To view updated historic data,click here.
Toronto Regional Real Estate Board – Market Stats At A Glance – July 2025
Scugog Township Real Estate Market Analysis – July 2025
The July 2025 housing data for Scugog Township reflects a market that is cooling in both price and sales activity, diverging from broader regional trends. While the Toronto Regional Real Estate Board reported the best July sales in the Greater Toronto Area since 2021, Scugog experienced declines in both average sale price and transaction volume, highlighting local market differences.
July 2025
June 2025
Average Sales Price: Continued Decline
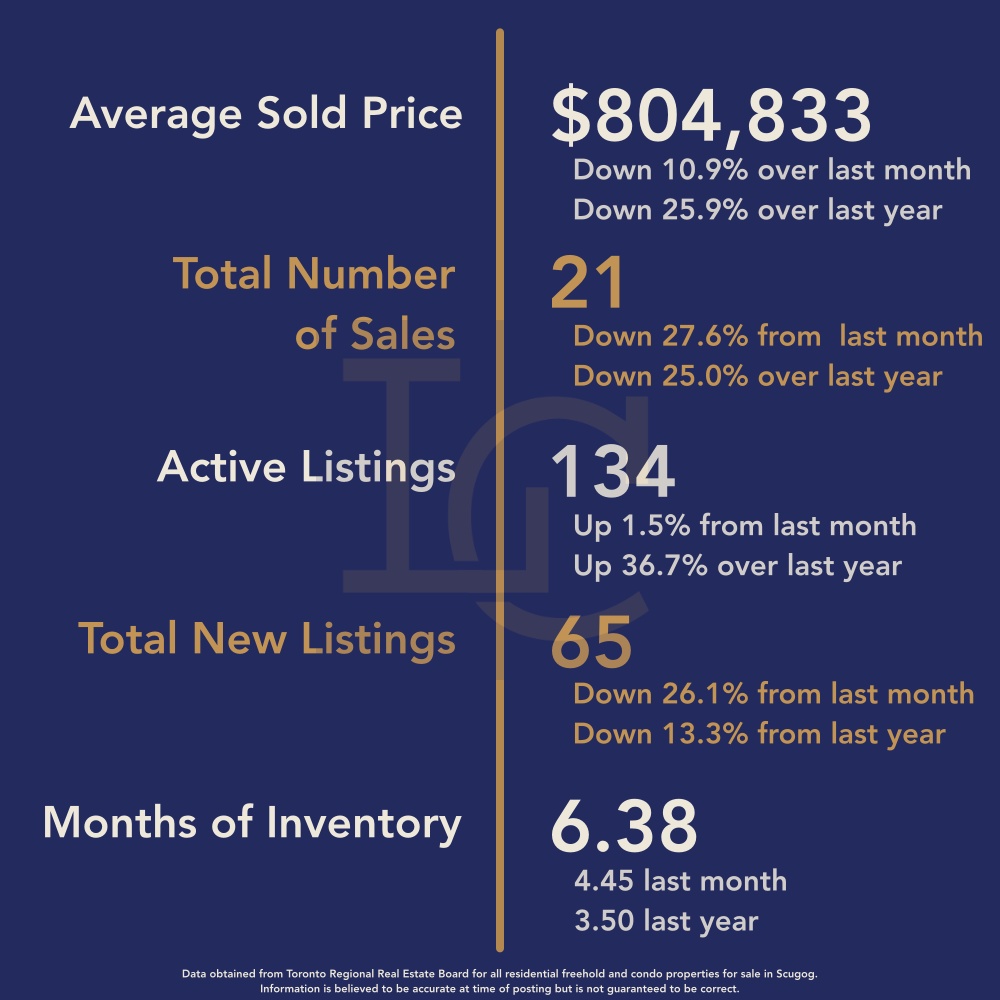
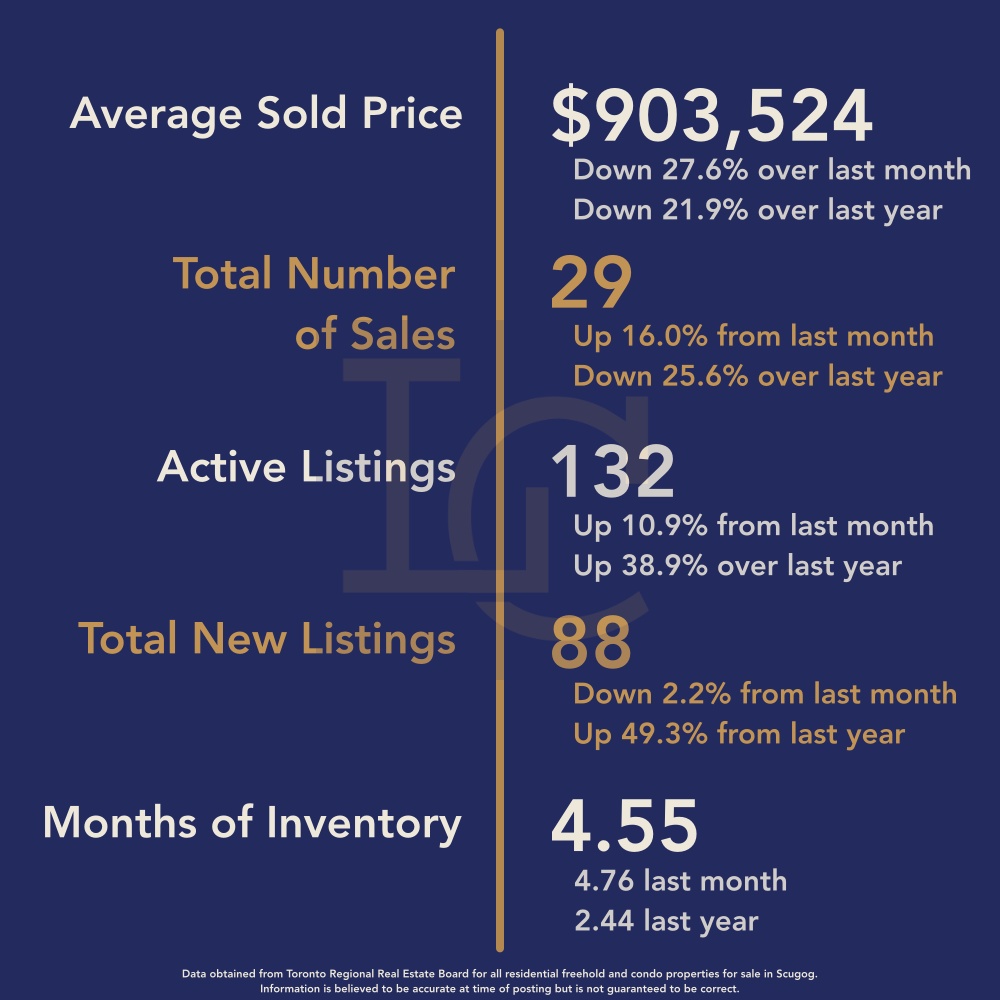
The average sales price fell to $804,833, marking a 10.9% drop from June 2025 ($903,524) and a 25.9% decline year-over-year from July 2024 ($1,087,161). This represents the second consecutive month of notable price reductions, signalling softening demand and a market adjusting away from last year’s peak values.
Sales Volume: Slower Than Seasonal Norms
A total of 21 homes sold in July, down from 29 in June and well below the 28 sales recorded in July 2024. This is a stark contrast to the GTA-wide surge in sales activity, suggesting that local buyer demand in Scugog is not mirroring regional momentum.
Inventory & Listings: Supply Holding Steady
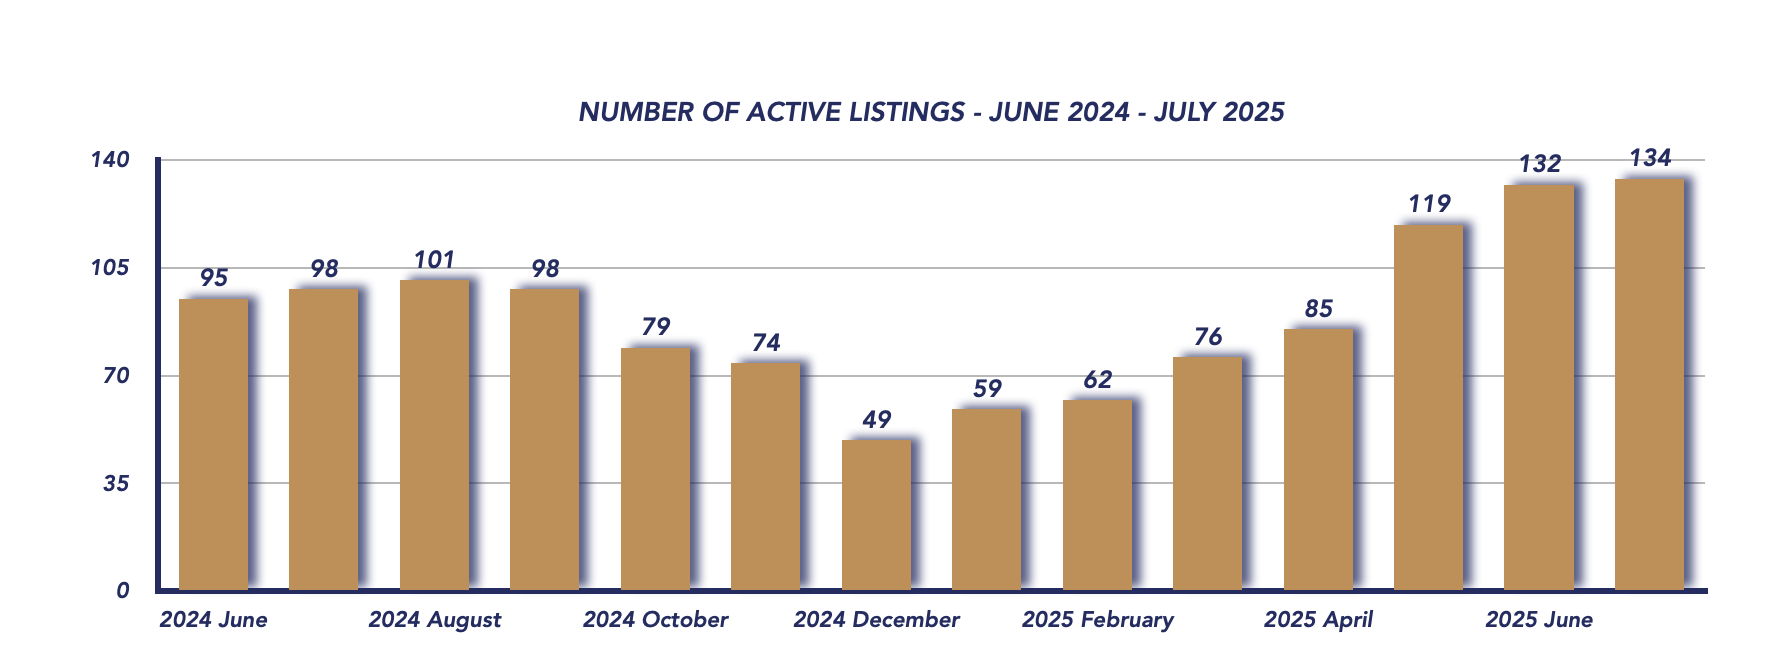
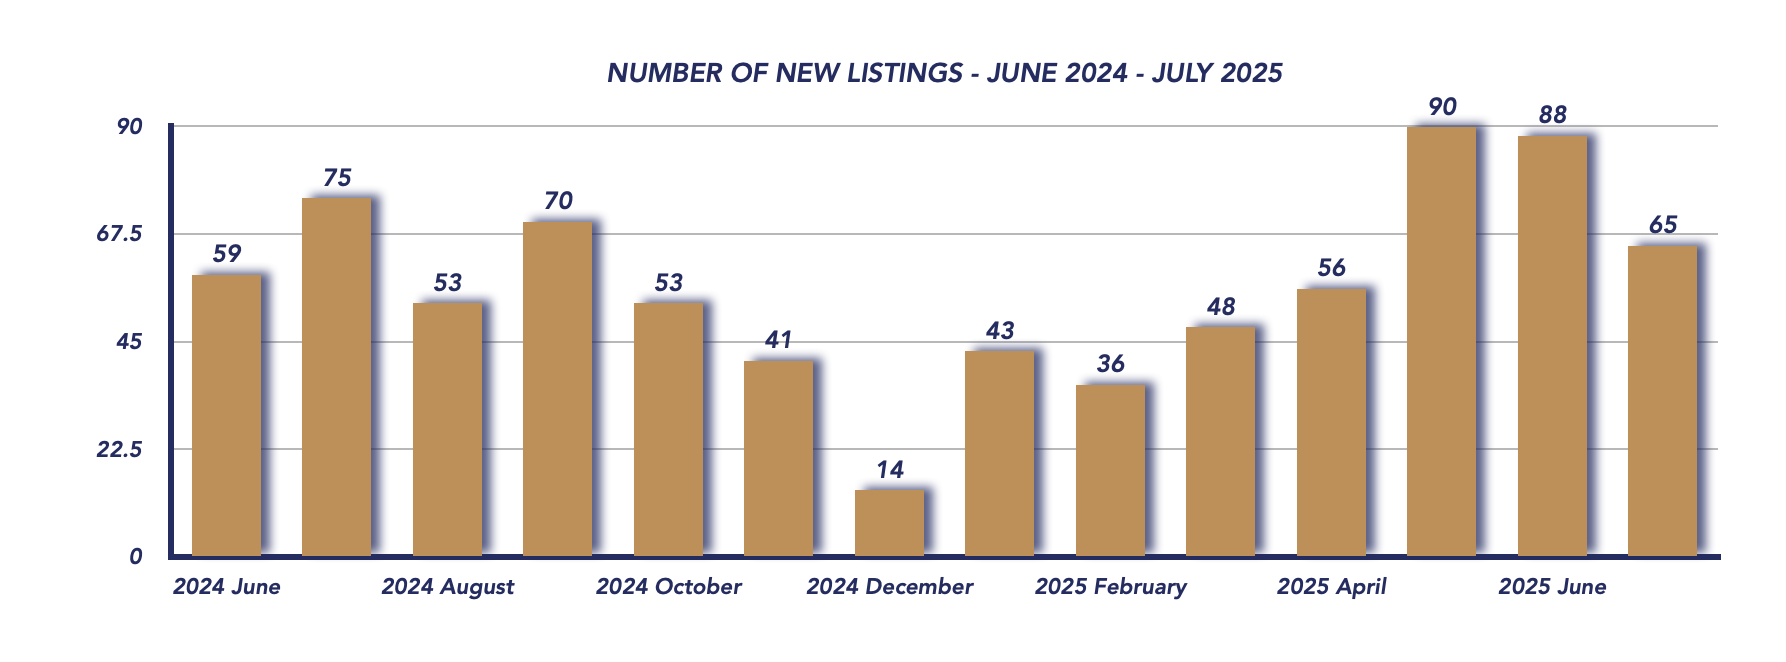
Active listings stood at 134, nearly unchanged from 132 in June but significantly higher than the 98 listings in July 2024. New listings fell to 65, down from 88 in June and 75 last year, suggesting that fewer homeowners are choosing to enter the market mid-summer.
Time on Market: Sales Taking Longer to Close
Homes in July took an average of 54 days to sell, a notable increase from 32 days in June, indicating slower decision-making among buyers and potentially more conditional offers before closing.
Months of Inventory: Shift Toward Buyer’s Market
The months of inventory dropped to 4.55 from 6.38 in June, largely due to fewer new listings and a modest absorption of existing inventory. While this technically brings the market closer to balanced conditions, the overall sales slowdown and elevated active listings suggest buyer-friendly conditions are still emerging.
Conclusion: A Local Market Out of Step with the GTA Trend
July 2025 underscores that Scugog’s housing market is moving at its own pace. Despite strong GTA-wide results, local data points to lower prices, slower sales, and increased selling times. Buyers are benefiting from more negotiation room and less competition, while sellers must be realistic with pricing to secure offers.
With summer winding down, market momentum may hinge on fall inventory levels and whether regional economic factors can spur demand locally. For now, Scugog remains a more favorable market for buyers than sellers.
Key Performance Indicators (KPIs) from January 2024 through July 2025 provide a clear snapshot of how the Durham Region real estate market has evolved across all property types, architectural styles, and home configurations
WATCH OUR MONDAY MARKET MINUTES
*Information is believed to be accurate at time of posting but is not guaranteed to be correct. Some values may vary slightly based on the exact date and time the reports were generated. Market stats are provided by TRREB (Toronto Regional Real Estate Board) and are based on sales for the month of Attached/Row/Townhouses, Condo Apartments, Condo Townhouses, Detached, Detached with Common Elements, Link Homes and Semi-detached. *Some values may vary slightly based on the exact date and time the reports were generated.
Check out our Uxbridge and Scugog Events Pages to keep up to date on whats going on around town. Click the links or scan the Code with your phone to take you directly there.
This housing report for Durham Region includes the number of new listings, average list price, number of properties sold, average selling price, average days on market and average asking price to selling price ratio for all property types within the Region of Durham.
Scroll to the bottom for links to take you to the housing market reports for Durham Region, Scugog and Brock.
From Toronto Regional Real Estate Board
Please note: The PropTx MLS® System, of which TRREB is a part, has added a number of new client boards over the last year. Many of these boards’ Members trade within the Greater Toronto Area and broader Greater Golden Horseshoe regions. As a result, historic data have been updated to reflect the addition of these boards’ listings and transactions. This means historic data have changed relative to previously published static reports. To view updated historic data, click here.
Toronto Regional Real Estate Board – Market Stats At A Glance – July 2025
Uxbridge Township Real Estate Market Analysis – July 2025
July 2025
June 2025
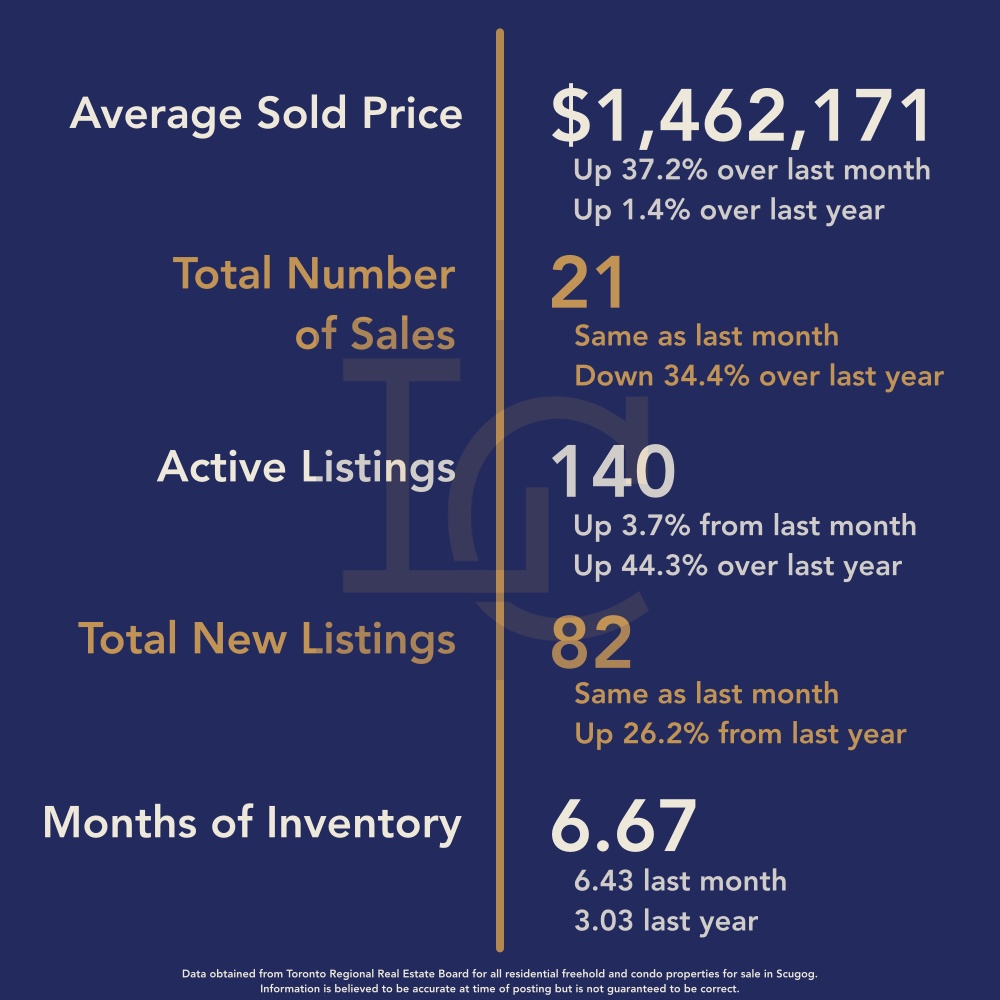
The Uxbridge housing market in July 2025 saw a sharp rise in the average sale price, driven by a notable number of higher-end transactions, even as overall sales activity lagged behind last year. The average sale price climbed to $1,462,171, an impressive 37.2% increase from June’s $1,065,929 and 1.44% higher than July 2024’s $1,441,395.
This price surge is largely explained by the sale of three properties between $1.5M and $2M and three more between $2.2M and $2.5M. In comparison, June had only one property sell over $2 million and three sales under $550,000, which significantly pulled last month’s average downward.
Sales Volume
Total sales held at 21 properties, unchanged from June but down sharply from 32 sales in July 2024. This is in direct contrast to Toronto Regional Real Estate Board (TRREB) data, which reported the best July sales results across the GTA since 2021—highlighting that Uxbridge’s market is moving on a different trajectory from the broader region.
Sale-to-List Price Ratio
The sale-to-list price ratio improved to 98%, up from 96% in June and 95% last July, suggesting sellers are achieving closer to their asking prices compared to earlier in the year, likely helped by the presence of higher-value transactions.
Active Listings
Inventory levels continued to climb, with 140 active listings, up from 135 in June and well above 97 listings in July 2024. This rising supply is contributing to slower sales and extended market times.
New Listings
New listings remained steady at 82, the same as June but higher than the 65 new listings recorded last July. While the pace of new listings hasn’t accelerated month-to-month, sustained supply is keeping pressure on sellers in an already competitive market.
Days on Market
Properties took an average of 65 days to sell, a notable increase from 41 days in June, indicating that buyers are taking longer to make purchasing decisions despite higher-priced sales closing.
Months of Inventory
The months of inventory increased to 6.67 from 6.43 in June, keeping Uxbridge firmly in buyer’s market territory. This means supply continues to outpace demand, giving buyers the upper hand in negotiations.
Conclusion
July 2025 in Uxbridge tells a two-sided story: while the average sale price jumped due to a cluster of high-end transactions, the underlying market remains slower and more competitive for sellers. With sales volume well below last year, inventory levels high, and properties taking longer to sell, conditions continue to favor buyers.
Sellers will need to focus on competitive pricing and strategic marketing to stand out, while buyers can take advantage of greater selection and negotiating power in a market that isn’t following the same trends as the rest of the GTA.
Key Performance Indicators (KPIs) from January 2024 through July 2025 provide a clear snapshot of how the Durham Region real estate market has evolved across all property types, architectural styles, and home configurations
WATCH OUR MONDAY MARKET MINUTES
*Information is believed to be accurate at time of posting but is not guaranteed to be correct. Some values may vary slightly based on the exact date and time the reports were generated. Market stats are provided by TRREB (Toronto Regional Real Estate Board) and are based on sales for the month of Attached/Row/Townhouses, Condo Apartments, Condo Townhouses, Detached, Detached with Common Elements, Link Homes and Semi-detached. *Some values may vary slightly based on the exact date and time the reports were generated.
Check out our Uxbridge and Scugog Events Pages to keep up to date on whats going on around town. Click the links or scan the Code with your phone to take you directly there.
This housing report for Durham Region includes the number of new listings, average list price, number of properties sold, average selling price, average days on market and average asking price to selling price ratio for all property types within the Region of Durham.
Scroll to the bottom for links to take you to the housing market reports for Uxbridge, Scugog and Brock.
From Toronto Regional Real Estate Board
Please note: The PropTx MLS® System, of which TRREB is a part, has added a number of new client boards over the last year. Many of these boards’ Members trade within the Greater Toronto Area and broader Greater Golden Horseshoe regions. As a result, historic data have been updated to reflect the addition of these boards’ listings and transactions. This means historic data have changed relative to previously published static reports. To view updated historic data, click here.
Toronto Regional Real Estate Board – Market Stats At A Glance – July 2025
Durham Region Real Estate Market Analysis – July 2025
The Durham Region housing market in July 2025 showed a mix of cooling prices and improving sales activity, hinting at subtle shifts in market momentum. While home values continued their gradual decline, this month marked the first year-over-year increase in sales since May 2024—suggesting buyer confidence may be creeping back despite ongoing affordability challenges.
July 2025
June 2025
📉 Average Home Price Continues to Ease
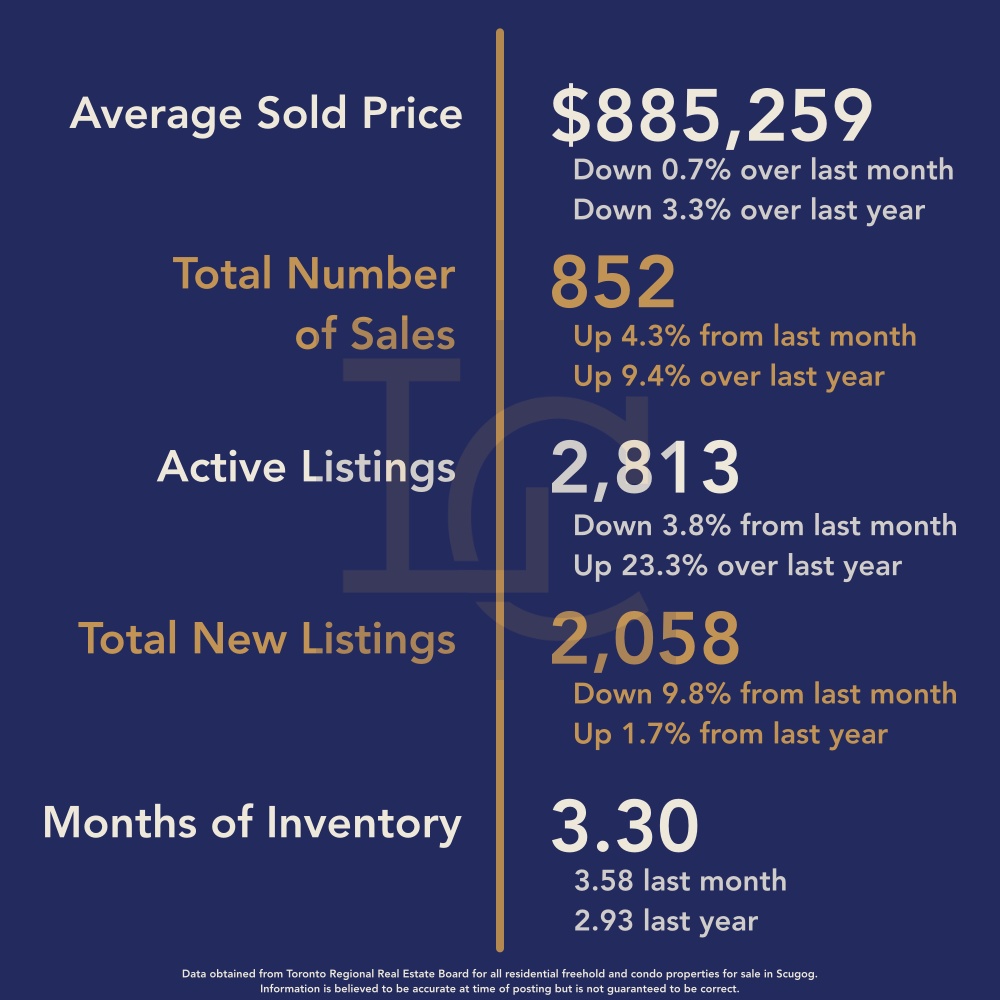
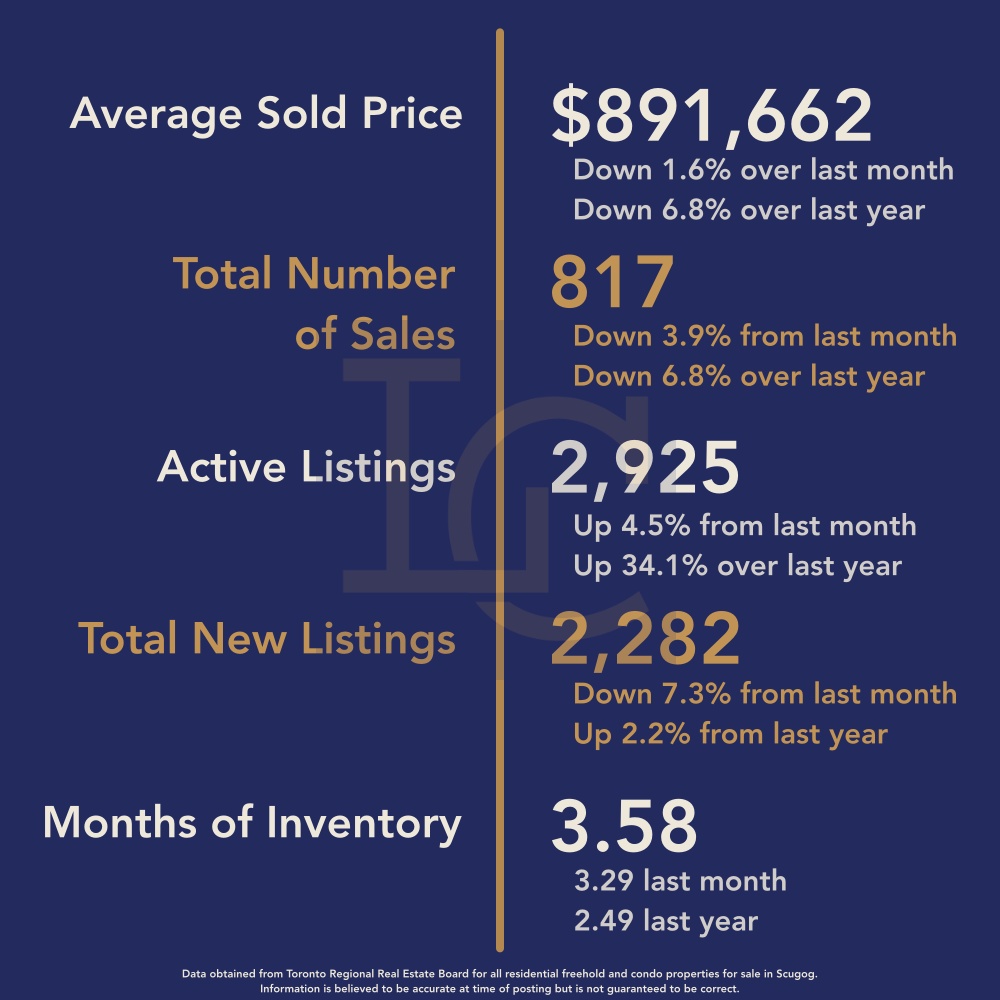
The average sales price fell to $885,259 in July, down 0.7% from June’s $891,662 and 3.3% lower than July 2024’s $915,636. This steady softening in prices reflects a market still working toward balance, as buyers remain cautious and selective in their purchases.
📊 Sales Activity Sees a Positive Turn
July recorded 852 sales, up from 817 in June and 779 in July 2024. This marks the first year-over-year sales increase since May 2024, a sign that some buyers are re-entering the market—possibly encouraged by greater inventory and a slight pullback in prices.
📉 Sale-to-List Price Ratio Slips Below 100%
The sale-to-list price ratio dipped to 99%, down from 100% last month and the first time below 100% since January 2024. This indicates that sellers are now, on average, accepting offers below asking price—a notable shift from the bidding war climate of recent years.
📈 Inventory Levels Adjust Slightly
New listings came in at 2,058, slightly below June’s 2,282 but almost identical to July 2024’s 2,023. The months of inventory dipped to 3.30 from 3.58, keeping the market right at the edge of a balanced state. This marginal change suggests that buyer demand is just strong enough to offset the available supply.
⏳ Homes Taking Longer to Sell
The average days on market rose to 39 days, up from 34 in June, showing that buyers are taking their time to evaluate options. Sellers may need to remain flexible with pricing and negotiation to secure offers in this slower-moving environment.
Conclusion
July 2025’s Durham Region housing market delivered a mixed message: prices are still edging down, but sales activity is picking up—breaking a year-long streak of annual declines. The dip in the sale-to-list price ratio below 100% is significant, as it signals a shift toward a buyer-friendly market where negotiations are more common.
If this sales momentum continues into late summer, we could see more stability in pricing heading into the fall. However, with homes taking longer to sell and buyers holding more negotiating power, sellers will need to adapt their strategies to stay competitive.
Key Performance Indicators (KPIs) from January 2024 through July 2025 provide a clear snapshot of how the Durham Region real estate market has evolved across all property types, architectural styles, and home configurations.
*Information is believed to be accurate at time of posting but is not guaranteed to be correct. Some values may vary slightly based on the exact date and time the reports were generated. Market stats are provided by TRREB (Toronto Regional Real Estate Board) and are based on sales for the month of Attached/Row/Townhouses, Condo Apartments, Condo Townhouses, Detached, Detached with Common Elements, Link Homes and Semi-detached. *Some values may vary slightly based on the exact date and time the reports were generated.
Check out our Uxbridge and Scugog Events Pages to keep up to date on whats going on around town. Click the links or scan the Code with your phone to take you directly there.
Steady activity in both markets, with more listings in Uxbridge and an increase in firm sales in both townships.
Weekly Real Estate Market Minute for the Townships of Uxbridge and Scugog
Uxbridge
New Listings: 10 (up from 5 last week)
Re-listed Properties: 9 properties returned to the market
Price Adjustments: 9 (down from 11 last week)
Sold Conditionally: 4 (down from 6 last week)
Sold Firm: 8 (up from 6 last week)
Total Active Listings: 168 (down slightly from 170 last week)
17 of these are vacant land listings
8 are condominiums
Scugog
New Listings: 8 (down from 10 last week)
Re-listed Properties: 3 properties returned to the market
Price Adjustments: 14 (up from 10 last week)
Sold Conditionally: 3 (down from 8 last week)
Sold Firm: 4 (up from 3 last week)
Total Active Listings: 161 (unchanged from last week)
10 of these are vacant land listings
3 are condominiums
Market Takeaway
In Uxbridge, new listings doubled compared to last week, while sales activity also saw a small uptick in firm deals. Scugog’s new listing numbers dipped slightly, but the number of firm sales edged upward. Price adjustments continue to be a factor in both markets, suggesting sellers are fine-tuning their strategies to meet current buyer demand.
If you’re thinking about buying, selling, or just curious about your home’s value in today’s market, reach out anytime.
Check out our Uxbridge and Scugog Events Pages to keep up to date on whats going on around town. Click the links or scan the Code with your phone to take you directly there.
The summer real estate market continues to shift across Uxbridge and Scugog, and we’re seeing sellers responding to buyer behaviour with more competitive pricing and strategic re-listings.
Weekly Real Estate Market Minute for the Townships of Uxbridge and Scugog
.
📍 Uxbridge
New Listings: 5 (up from 3 last week)
Re-listed Properties: 13
Price Adjustments: 21 (up from 12)
Conditional Sales: 5
Firm Sales: 5 (up from 3)
Total Active Listings: 179 (down slightly from 182)
Vacant Land: 19
Condominiums: 7
There’s a noticeable bump in price adjustments, which could point to a softening of seller expectations or a response to slower buyer activity. Either way, more realistic pricing is a great opportunity for buyers still in the game this summer.
📍 Scugog
New Listings: 6 (down from 15 last week)
Re-listed Properties: 9
Price Adjustments: 15 (up from 8)
Conditional Sales: 1 (down from 5)
Firm Sales: 10 (up from 4)
Total Active Listings: 163 (down from 168)
Vacant Land: 10
Condominiums: 3
Although new listings were down in Scugog, firm sales nearly tripled compared to last week. This signals that serious buyers are still making moves — especially where pricing is on point.
💰 Interest Rate Watch
This Wednesday, the Bank of Canada will make its next interest rate announcement. The current overnight rate sits at 2.75%, and while the consensus is that we won’t see a change, the central bank will be keeping a close eye on inflation and economic activity.
If you’re thinking of making a move or just want to understand how these trends might impact your property, feel free to reach out. I’m here to help!
Check out our Uxbridge and Scugog Events Pages to keep up to date on whats going on around town. Click the links or scan the Code with your phone to take you directly there.
🏡 Uxbridge & Scugog Real Estate Market Update – July 13–19, 2025
Weekly Real Estate Market Minute for the Townships of Uxbridge and Scugog
As we move through the heart of summer, the real estate market in Uxbridge and Scugog continues to show signs of balance with some notable trends in activity and inventory.
.
📍 Uxbridge
New Listings: 3 (down from 8 last week)
Relisted Properties: 13
Price Adjustments: 12 (down from 20 last week)
Conditional Sales: 7 (up from 5)
Firm Sales: 3 (down from 4)
Total Active Listings: 182 (up slightly from 181)
🔎 Noteworthy: Of the current listings, 19 are vacant land and 8 are condominiums, showing diversity in property types available.
📍 Scugog
New Listings: 15 (up from 10)
Relisted Properties: 4
Price Adjustments: 8 (down from 18)
Conditional Sales: 5 (unchanged)
Firm Sales: 4 (up from 3)
Total Active Listings: 168 (up from 163)
🛠️ There are currently 11 vacant land properties and 3 condos on the market in Scugog.
💡 What This Means:
Uxbridge saw slower new listing activity but a solid number of conditional sales. Scugog saw a jump in listings, which could offer more opportunities for buyers in the coming weeks. With price adjustments continuing in both townships, sellers are responding to current market conditions.
Thinking of buying or selling? Let’s talk about how this market fits into your plans.
📞 Reach out any time – we’re here to help you navigate the next step.
Check out our Uxbridge and Scugog Events Pages to keep up to date on whats going on around town. Click the links or scan the Code with your phone to take you directly there.
Welcome to your Monday Market Minute! As we move further into July, the real estate markets in Uxbridge and Scugog continue to show signs of balance—with steady inventory, strategic pricing shifts, and buyer activity holding strong, especially in the conditional category.
Weekly Real Estate Market Minute for the Townships of Uxbridge and Scugog
Let’s dive into the highlights from this past week:
📍 Uxbridge Market Highlights
8 new listings, down from 12 last week
16 properties returned to the market
20 price adjustments, nearly double the 11 recorded the week before
5 homes sold conditionally, up from 3
4 firm sales, down from 7
Total active listings: 181 (up by 1)
🔎 Of the current listings:
19 are vacant land properties
9 are condominiums
📌 Insight: Although fewer new listings came to market, the number of relisted homes and price reductions suggest sellers are responding to buyer hesitation and a more competitive environment. Conditional sales are on the rise, but firm deals were down slightly—another signal that buyers are proceeding with caution.
📍 Scugog Market Highlights
10 new listings, up from 6
5 properties returned to the market
18 price changes, up from 13
5 conditional sales, a healthy jump from just 1 last week
3 firm sales, down slightly from 4
Total active listings: 163 (up by 6)
🔎 Of the current listings:
10 are vacant land properties
4 are condominiums
📌 Insight: Scugog had more new listings and more price reductions this week, but the biggest shift was the increase in conditional sales—a strong sign of buyer interest, paired with a more cautious approach to closing.
📝 Final Thoughts
As inventory continues to climb and more properties return to market, pricing and presentation are critical for sellers looking to stand out. Meanwhile, buyers are actively searching but moving carefully—opting for conditional offers and negotiating terms.
Whether you’re buying, selling, or just watching the market, we’re here to help you understand what these shifts mean for your next move.
Check out our Uxbridge and Scugog Events Pages to keep up to date on whats going on around town. Click the links or scan the Code with your phone to take you directly there.
This housing report for Durham Region includes the number of new listings, average list price, number of properties sold, average selling price, average days on market and average asking price to selling price ratio for all property types within the Region of Durham.
Scroll to the bottom for links to take you to the housing market reports for Durham Region, Scugog and Brock.
From Toronto Regional Real Estate Board
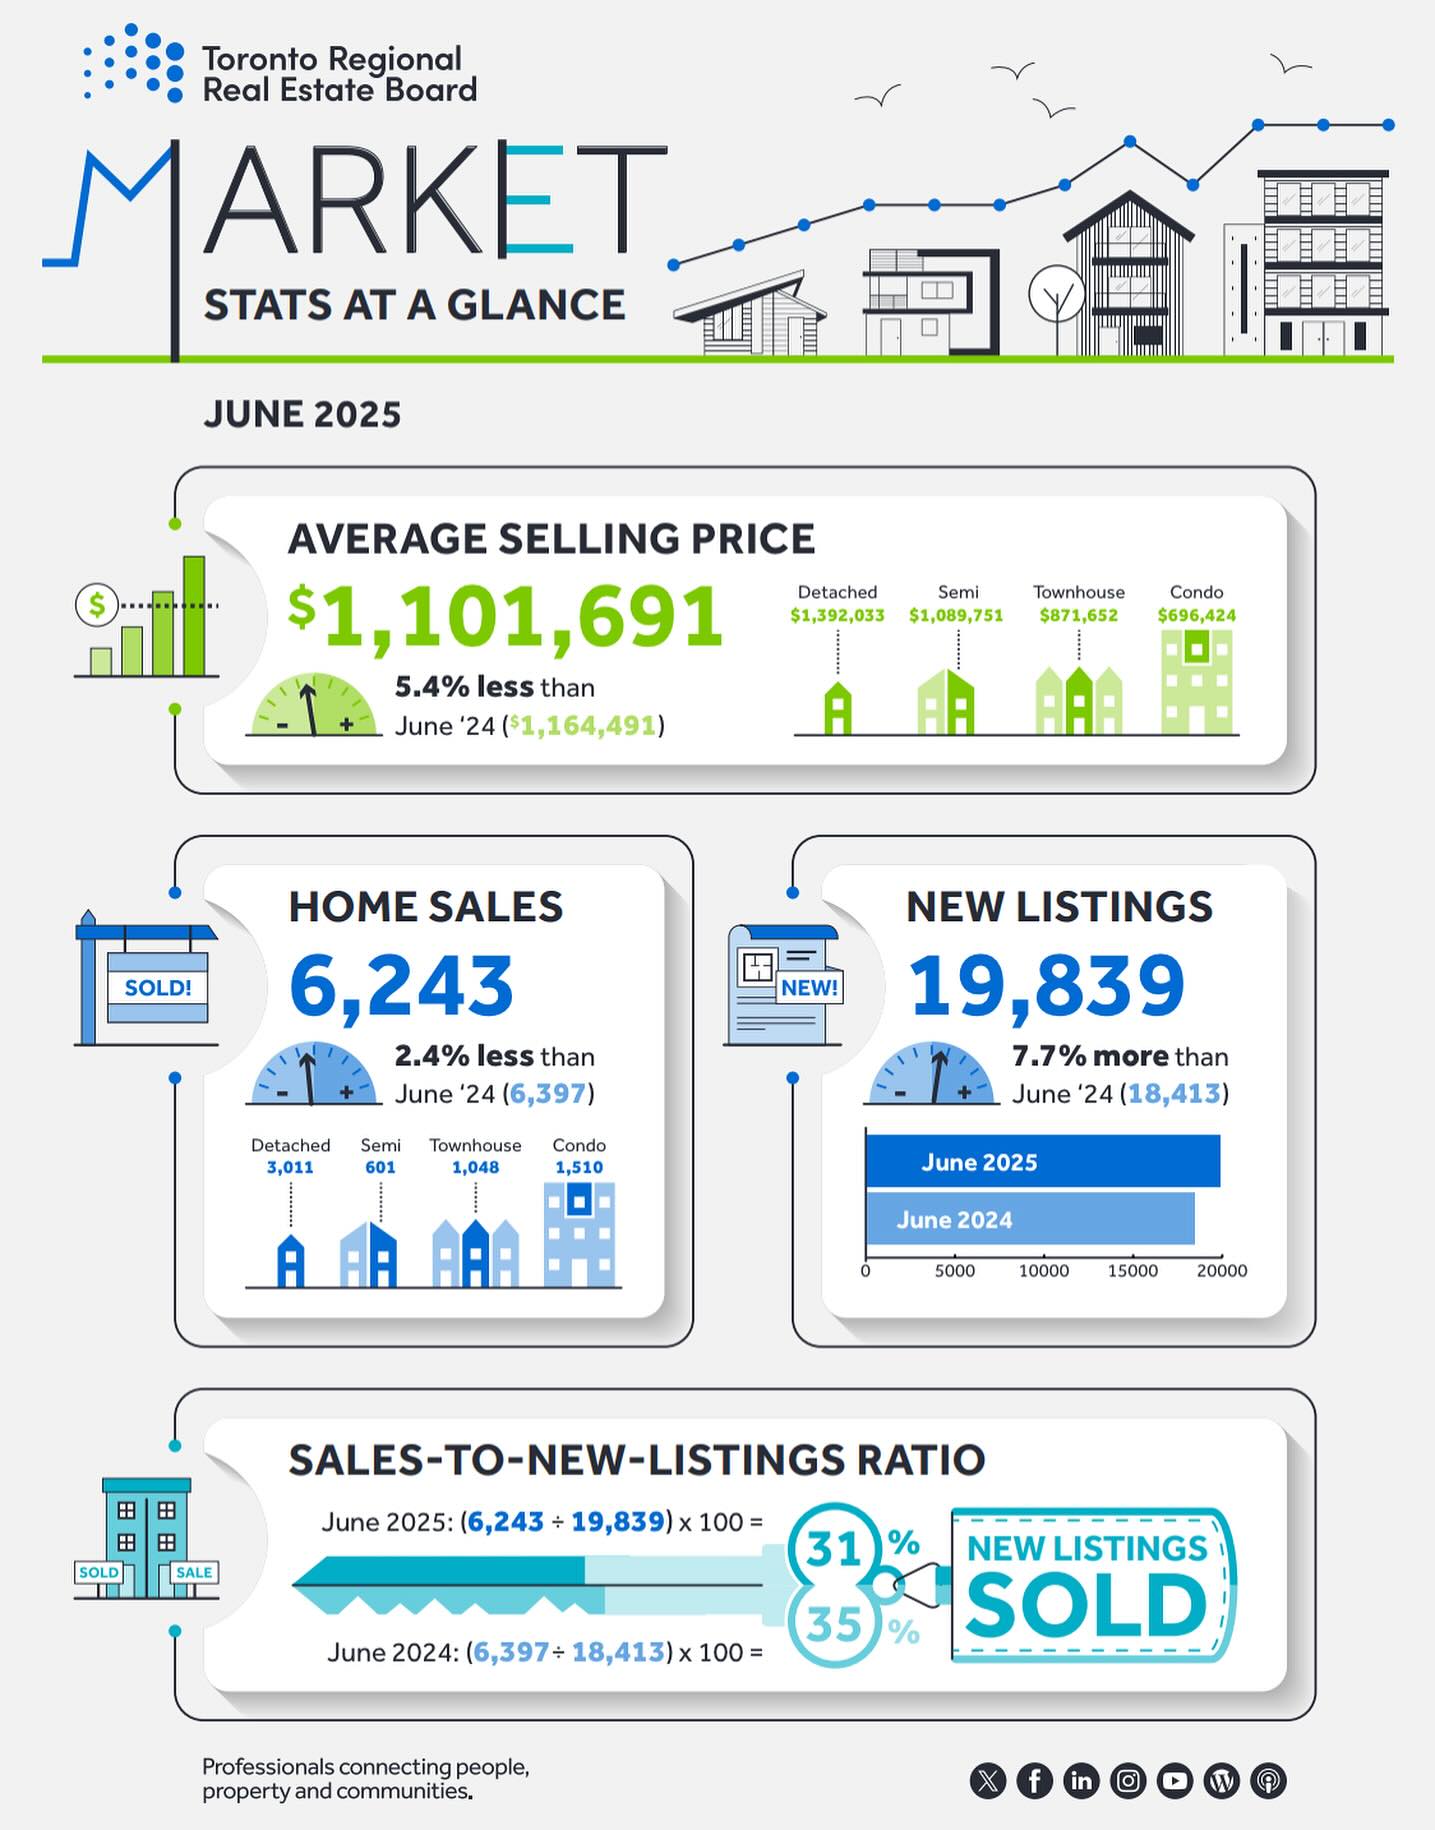
Toronto Regional Real Estate Board – Market Stats At A Glance – June 2025
The Uxbridge real estate market saw a noticeable shift in June 2025, moving more firmly into buyer’s market territory. With average home prices declining, inventory rising, and sales activity slowing slightly, both buyers and sellers are adjusting to a new set of market dynamics. Below is a breakdown of the key performance indicators for the month:
June 2025
May 2025
Average Sales Price
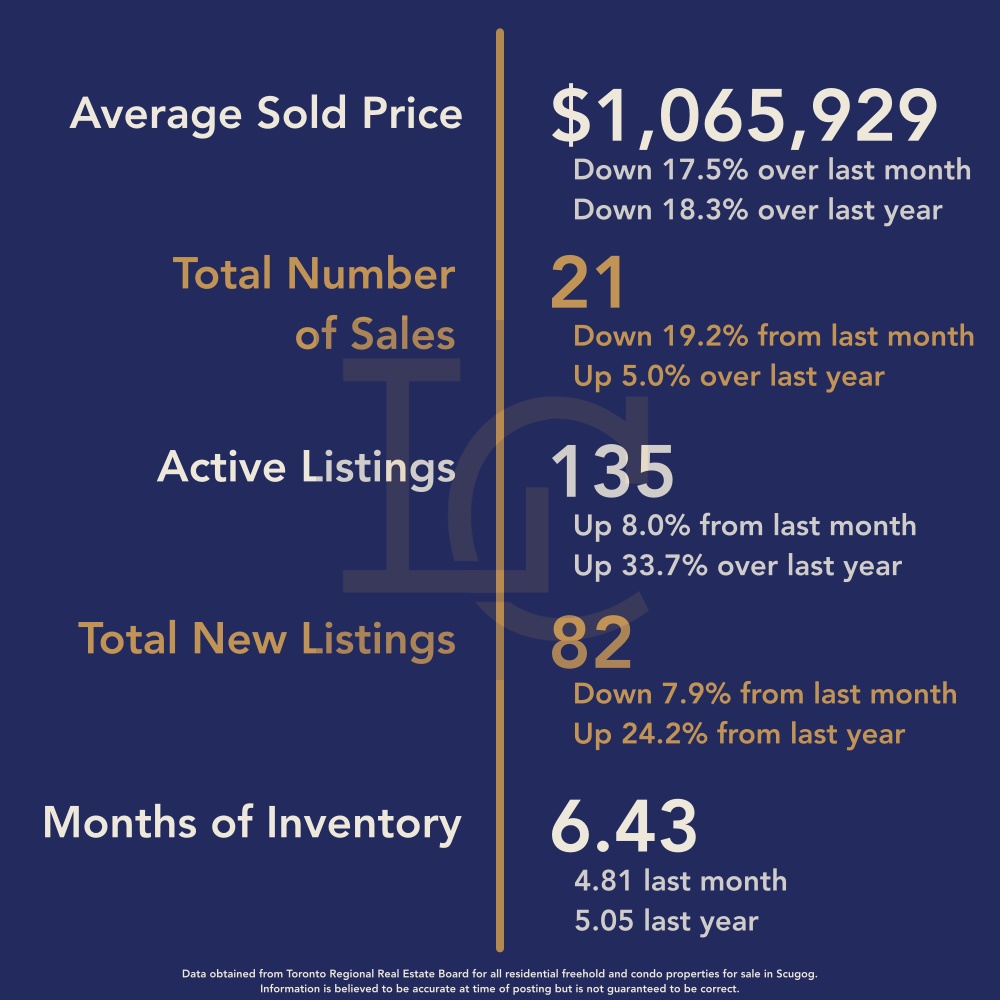
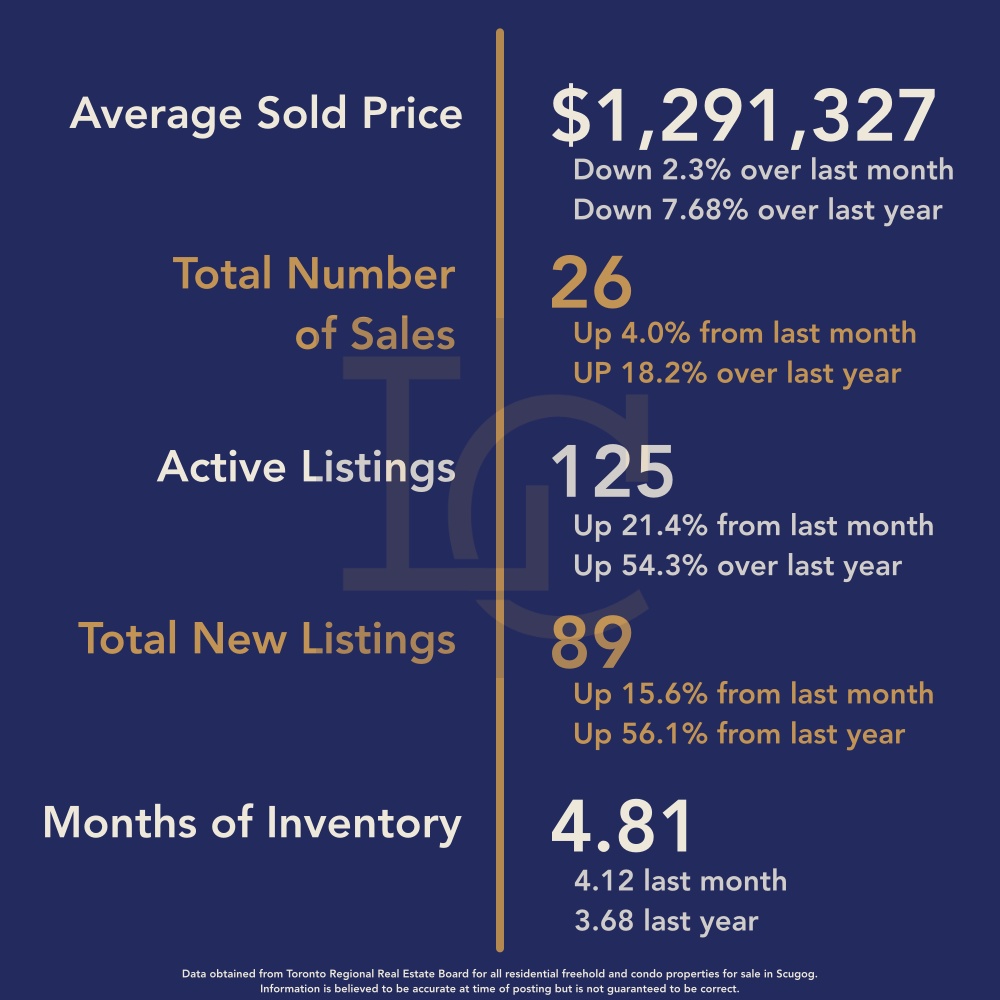
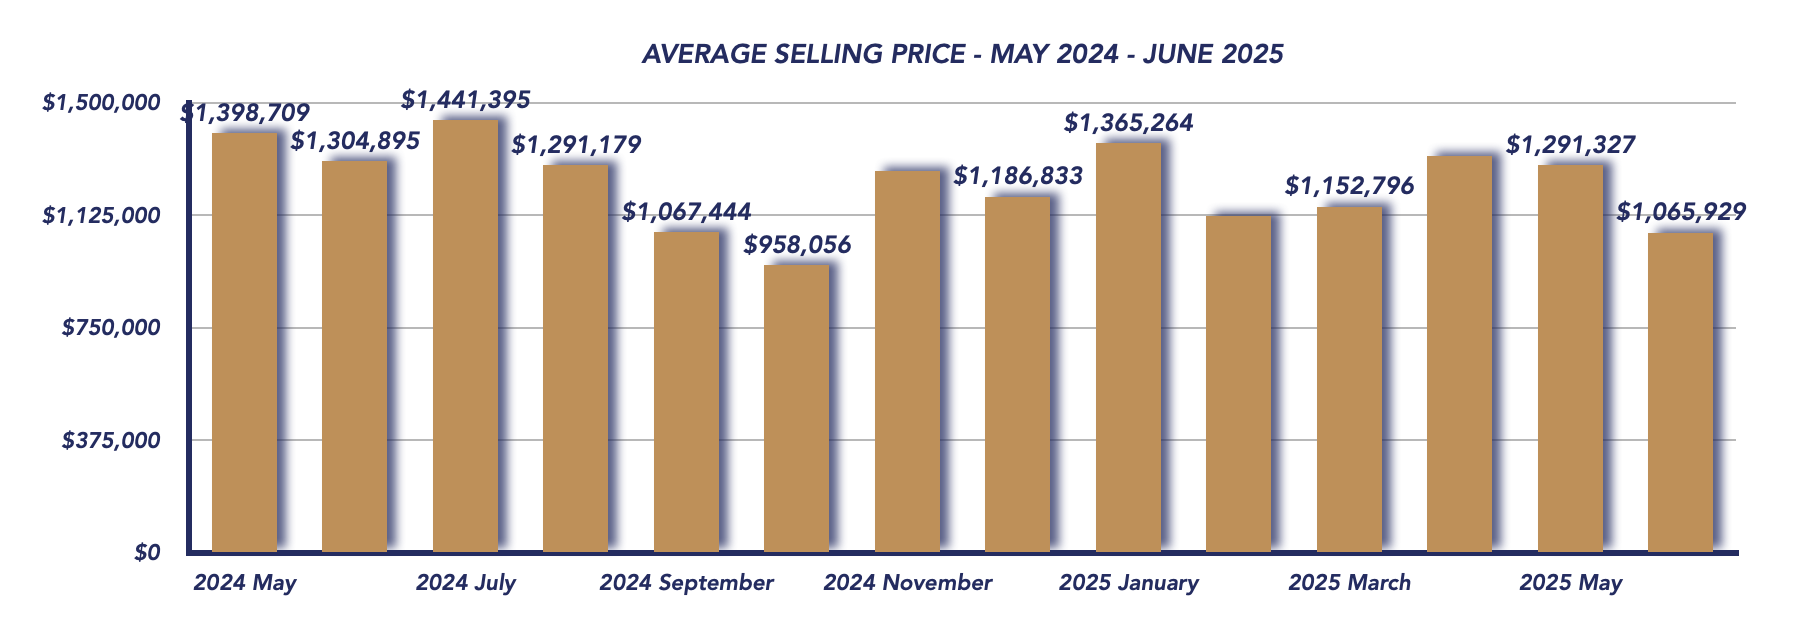
The average sale price in June 2025 was $1,065,929, reflecting a 17.5% decrease from May ($1,291,327) and an 18.3% year-over-year drop from June 2024 ($1,304,895). This steep decline was partly influenced by the lack of high-end sales in June—just one home sold over $2 million, while three sold under $550,000. In contrast, May’s average was elevated by a single $3.7 million transaction, skewing the previous month’s numbers.
Average Number of Sales
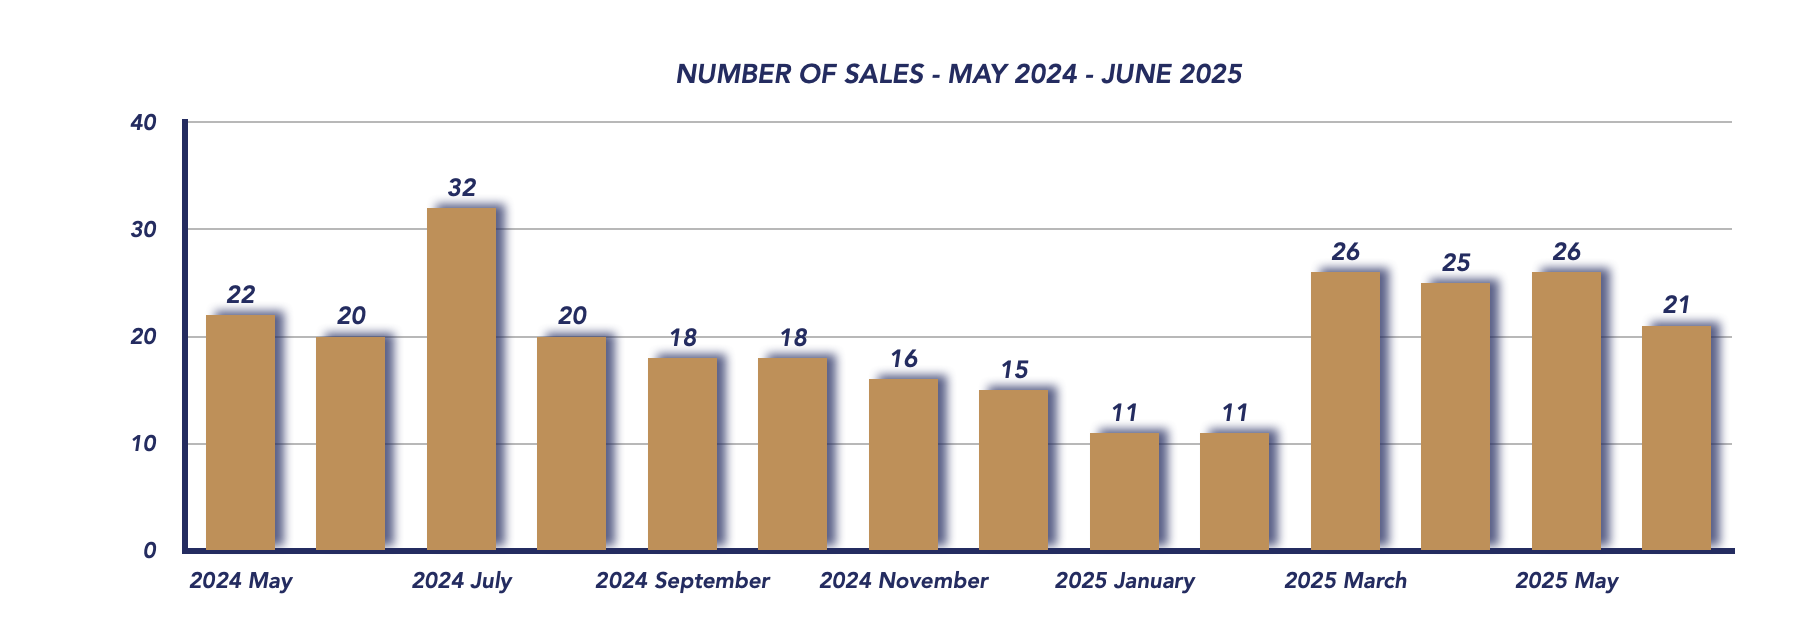
21 homes were sold in June, a decrease from 26 sales in May, though slightly ahead of the 20 sales in June 2024. The drop in activity points to cooling buyer urgency and a more deliberate pace as market conditions favor purchasers.
Active Listings
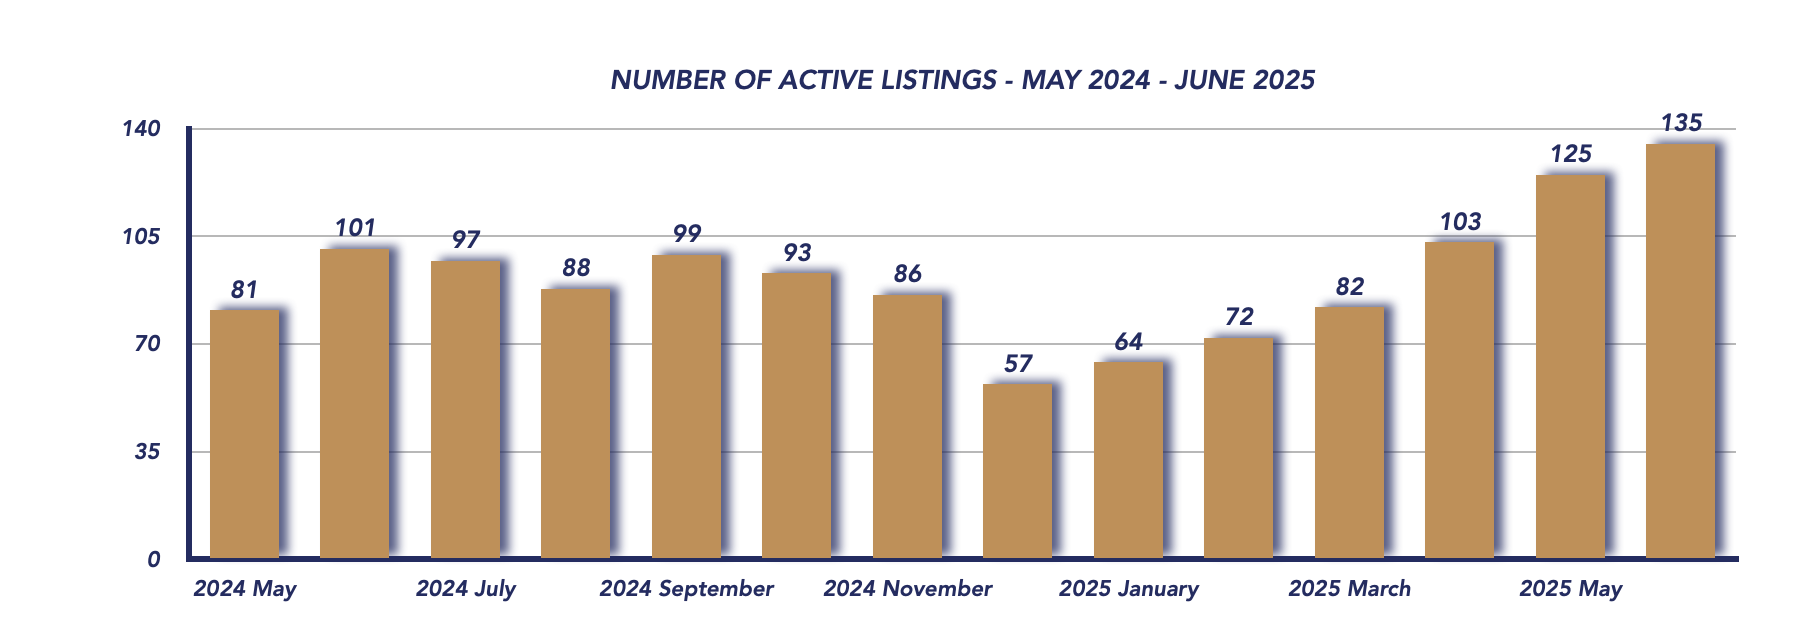
The market saw 135 active listings in June, up from 125 in May and 101 in June last year. This steady climb reflects growing inventory, giving buyers more choice and reducing urgency.
Number of New Listings
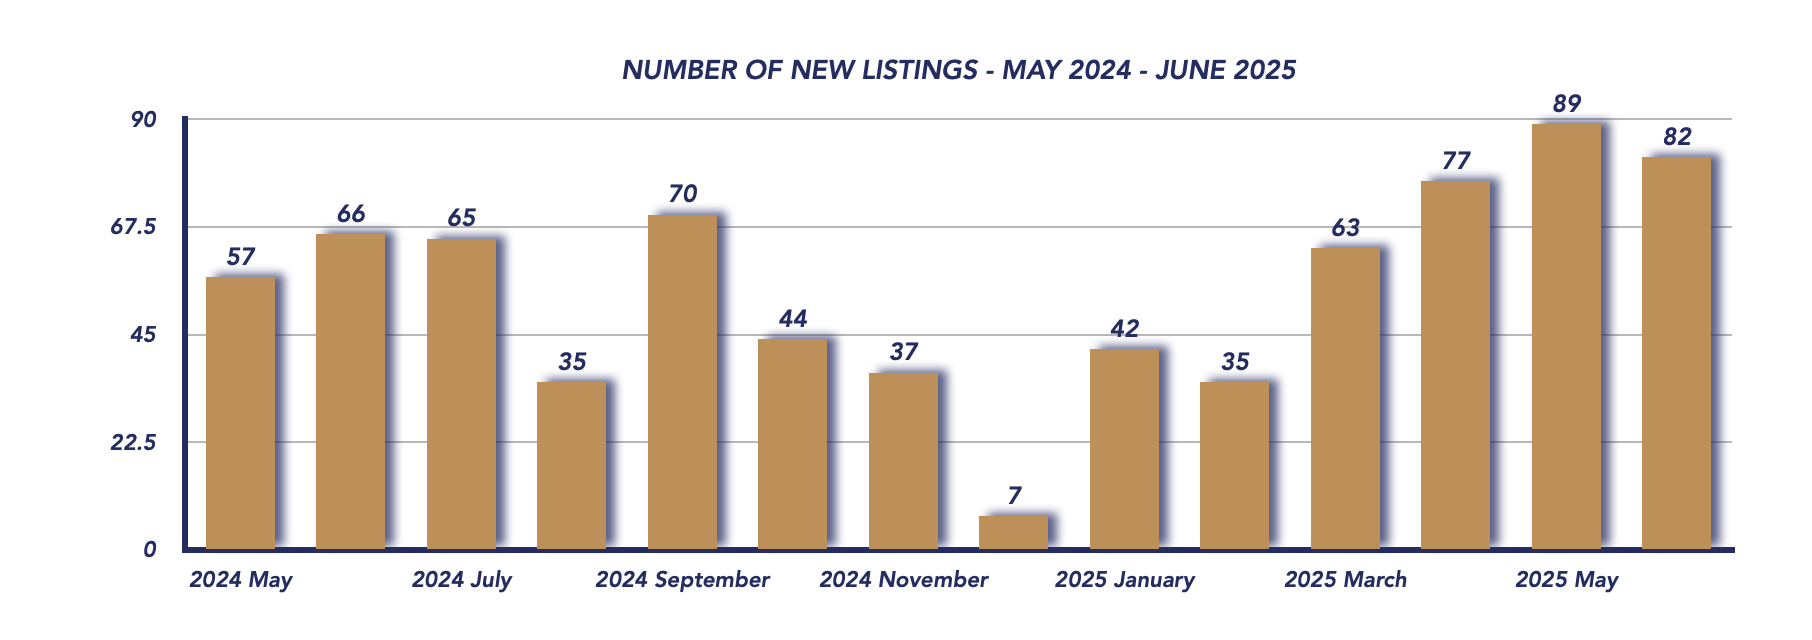
There were 82 new listings in June, slightly down from 89 in May, but significantly higher than 66 in June 2024. This suggests that sellers are still entering the market at an active rate, though competition for buyer attention is increasing.
Months of Inventory
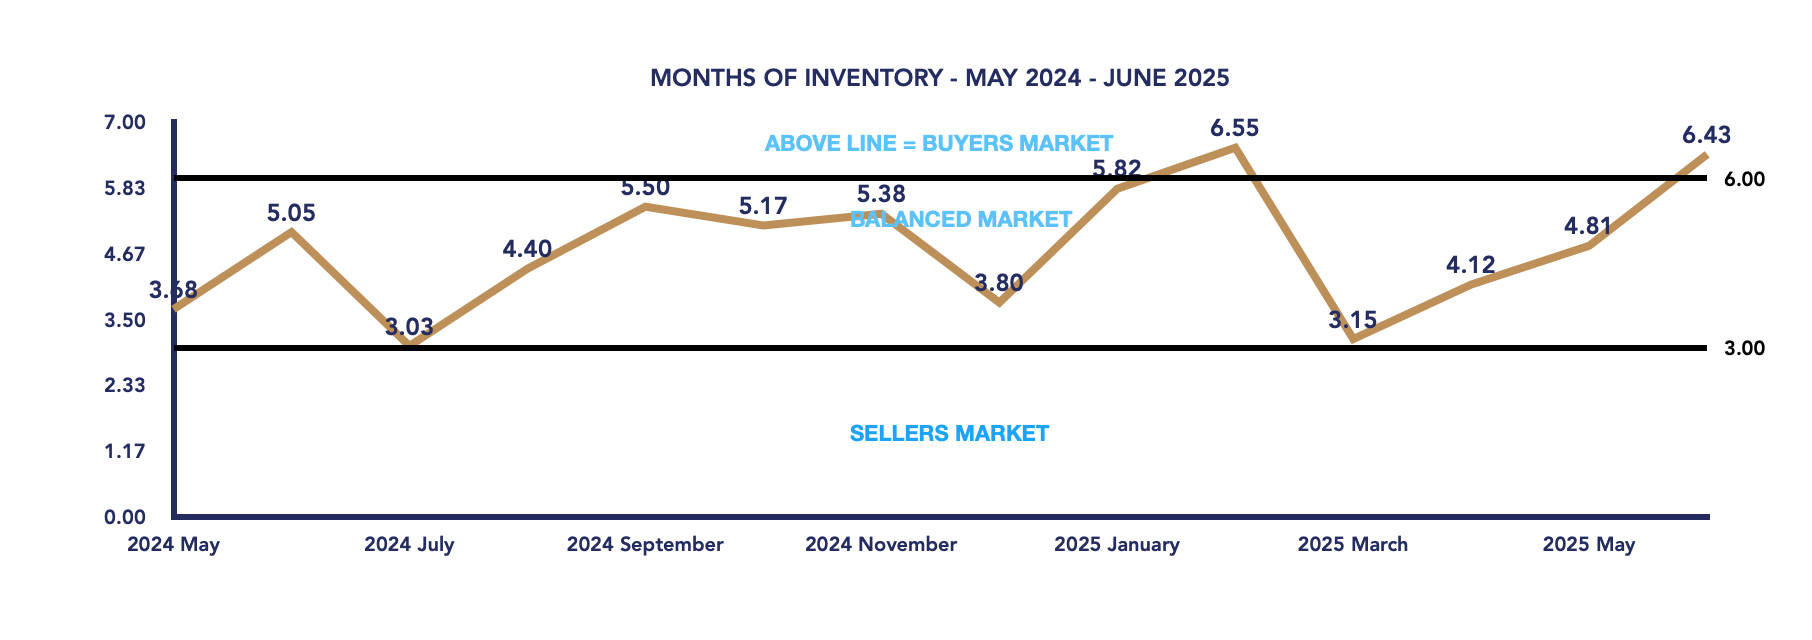
Months of inventory rose to 6.43, compared to 4.81 in May, officially marking a shift into a buyer’s market. With over six months’ worth of inventory now available, sellers must be strategic in pricing and presentation to remain competitive, while buyers benefit from more negotiating room and wider options.
Conclusion
June 2025 brought a notable realignment in the Uxbridge housing market, with falling prices and rising inventory clearly shifting conditions in favor of buyers. While overall demand remains present, especially compared to past Junes, the balance has tipped—giving buyers more leverage and compelling sellers to adapt to more competitive dynamics.
As we move into the heart of summer, expect more of the same: a cautious but active market where opportunities exist for those prepared to make informed, timely decisions.
WATCH OUR MONDAY MARKET MINUTES
*Information is believed to be accurate at time of posting but is not guaranteed to be correct. Some values may vary slightly based on the exact date and time the reports were generated. Market stats are provided by TRREB (Toronto Regional Real Estate Board) and are based on sales for the month of Attached/Row/Townhouses, Condo Apartments, Condo Townhouses, Detached, Detached with Common Elements, Link Homes and Semi-detached. *Some values may vary slightly based on the exact date and time the reports were generated.
Check out our Uxbridge and Scugog Events Pages to keep up to date on whats going on around town. Click the links or scan the Code with your phone to take you directly there.


 Facebook
 X
X
 Pinterest
 Copy Link