

 Facebook
 X
 Pinterest
 Copy Link
Uxbridge Housing February 2025

Uxbridge Housing February 2025

Each office is independently owned and operated



Housing Market Report for February 2025
Here is the Region of Durham Housing February 2025 report (all housing types), with reports from the Canadian Real Estate Association, and Toronto Regional Real Estate Board included.
This housing report for Durham Region includes the number of new listings, average list price, number of properties sold, average selling price, average days on market and average asking price to selling price ratio for all property types within the Region of Durham.
Scroll to the bottom for links to take you to the housing market reports for Uxbridge, Scugog and Brock.


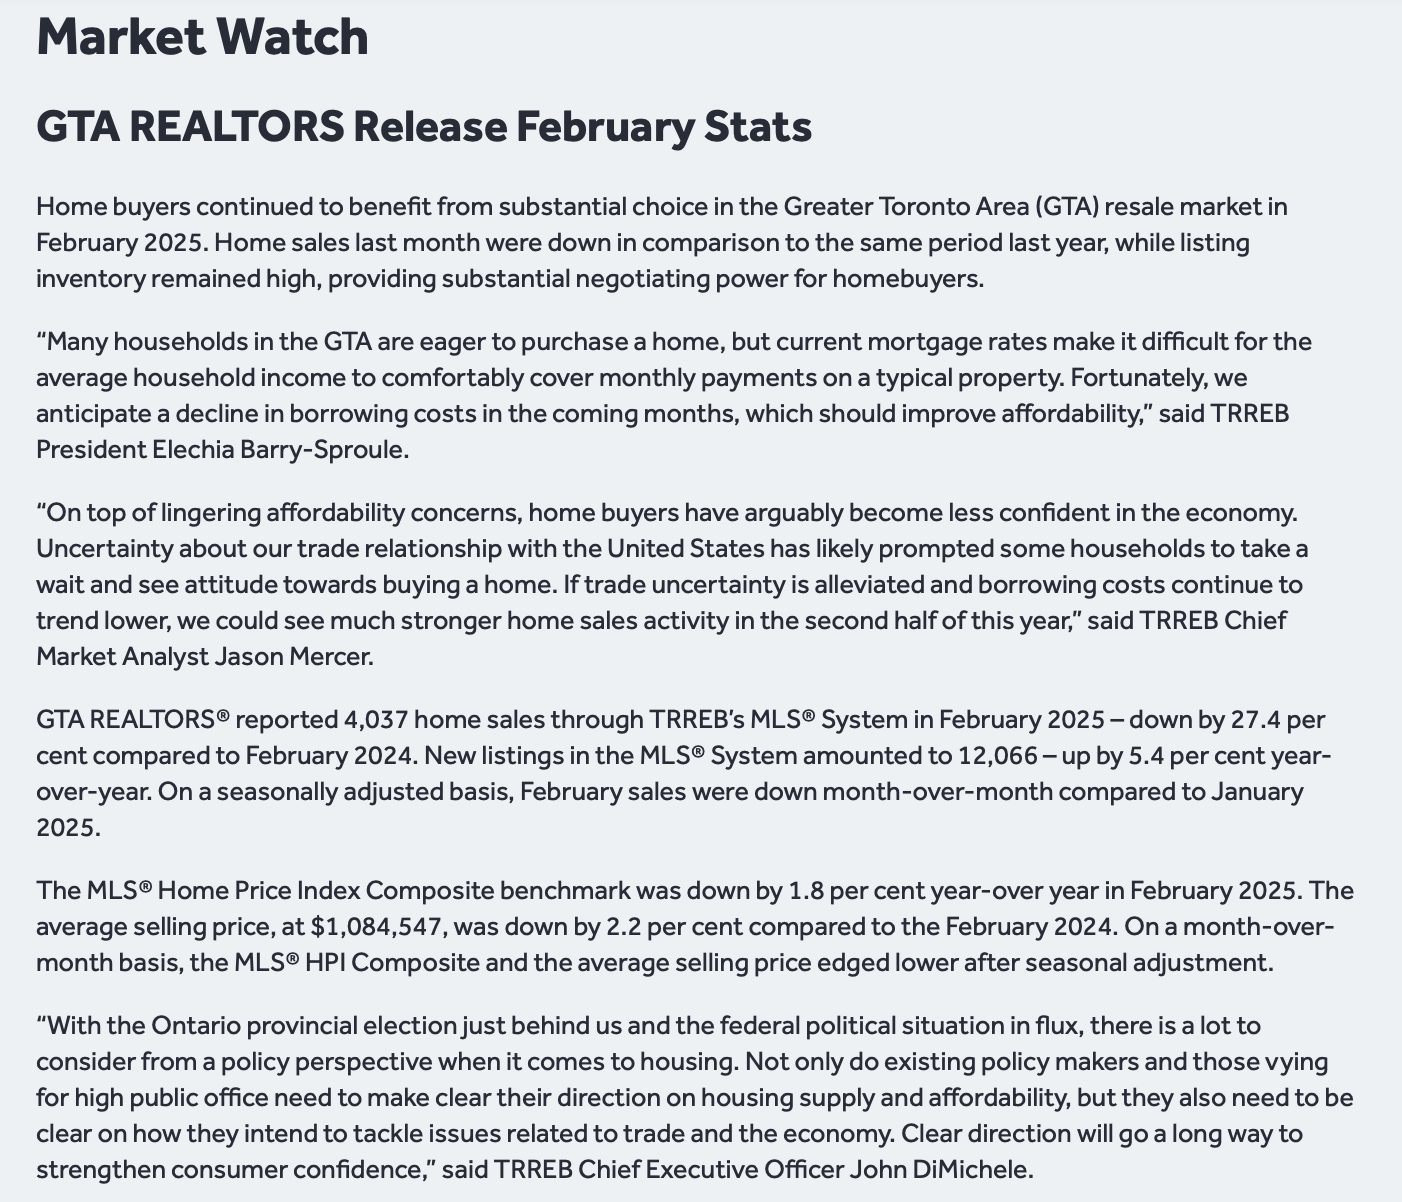
From Toronto Regional Real Estate Board
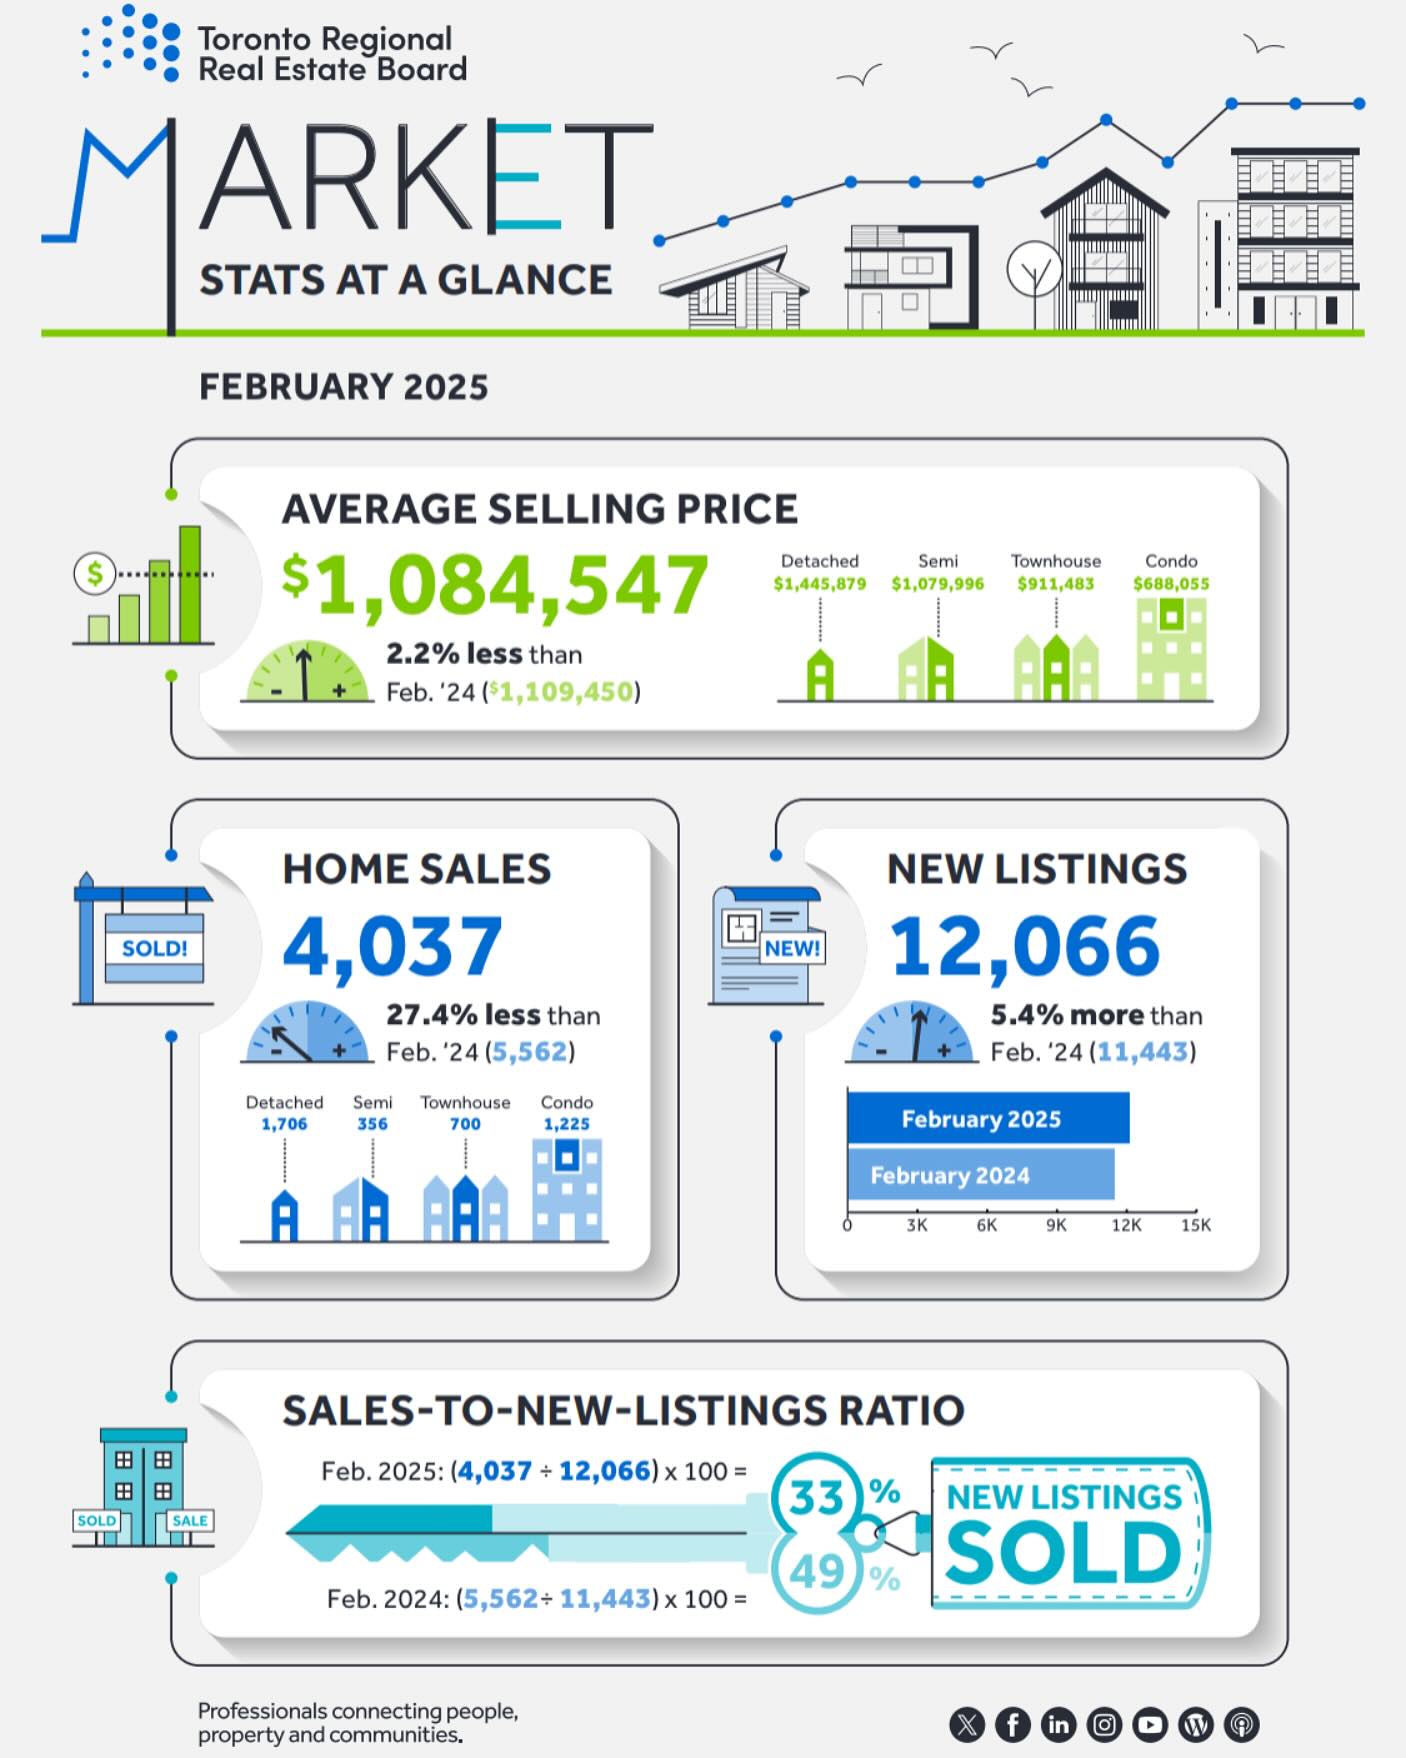
Toronto Regional Real Estate Board – Market Stats At A Glance – February 2025
Read the Toronto Regional Real Estate Board Market Watch Report

Township of Uxbridge Full Report
Uxbridge Township Real Estate Market Analysis – February 2025
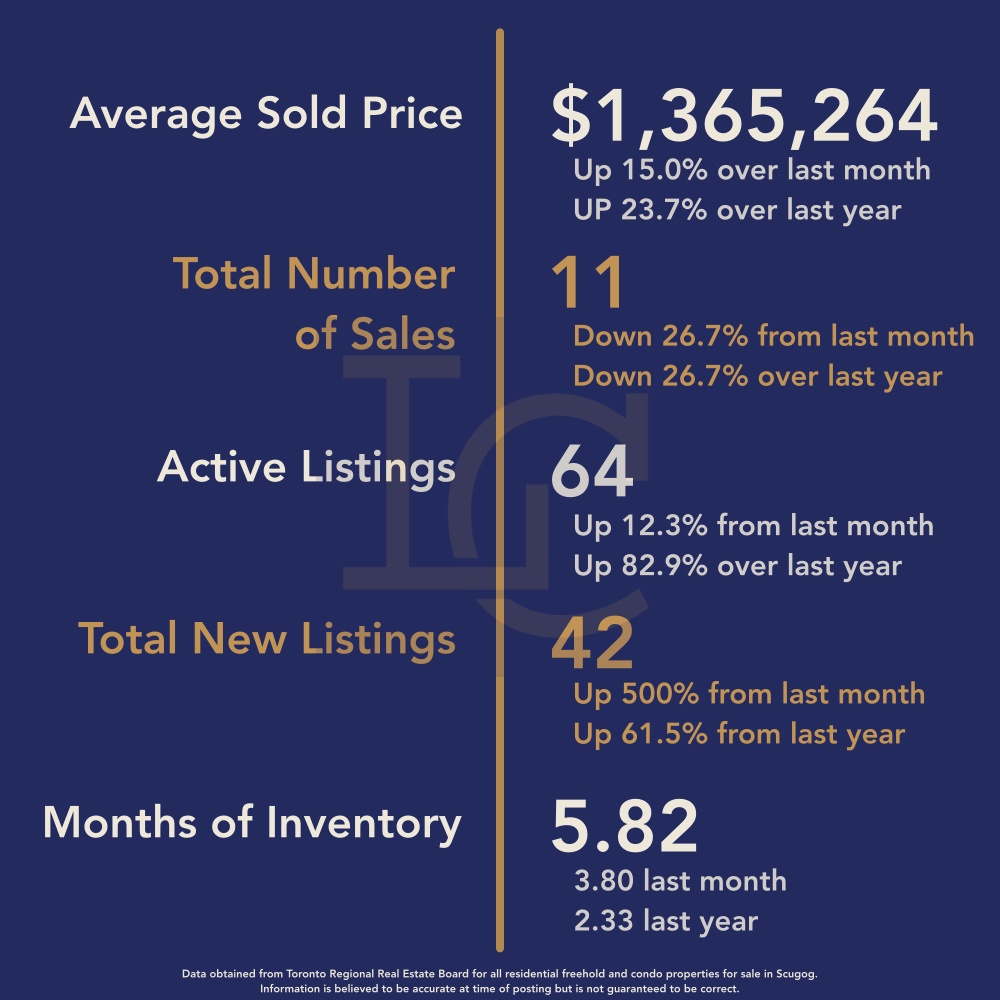
The real estate market in Uxbridge Township experienced a notable decline in February 2025, with key indicators pointing toward a shift in market dynamics. The average sales price for the month was $1,123,318, reflecting a 6.2% decrease from February 2024 and a more significant 17.7% drop from January 2025 when the average price was $1,365,264. This sharp month-over-month decline suggests a cooling market, potentially driven by seasonal trends, economic conditions, or changing buyer demand.
Market Activity & Sales Trends
Total sales remained consistent with January 2025 at 11 transactions, but this figure represents a 42% decline from February 2024, when 19 properties were sold. Despite the decrease in sales volume, the sale-to-list price ratio rose to 99% from 94% last month, indicating that sellers were achieving near-asking prices on their listings.
Properties sold in a broad price range of $50,000 to $3,575,000, with three sales exceeding $1.3 million. The inclusion of two vacant land sales at $50,000 and $365,000 and a rural home sale at $3,575,000 contributed to fluctuations in the average price. Without these outliers, the overall market trend may have been different, highlighting the importance of considering median prices alongside averages.
Inventory & Market Conditions
New listings dropped to 35 in February, down from 42 in January and 44 in February 2024, reflecting a decline in seller activity. Meanwhile, the average days on market remained steady at 21 days, suggesting stable buyer engagement despite reduced inventory.
The months of inventory increased slightly to 6.55 months, up from 5.82 months in January, officially positioning the market into buyer’s territory. This shift indicates that supply is outpacing demand, providing buyers with more negotiating power and greater selection, which could contribute to further price softening in the coming months.
Outlook
With sales volume declining, inventory rising, and prices dropping, Uxbridge Township’s real estate market appears to be entering a buyer-friendly phase. The market will likely continue adjusting as buyers take advantage of softer pricing and more inventory choices. Future trends will depend on external economic factors, interest rates, and seller motivations in the upcoming spring market.
February 2025

January 2025
Average Sold Price

Number of Properties Sold

Active Listings

Number of New Listings

Months of Inventory

MONDAY MARKET MINUTES
Monday February 3
Monday February 10
Monday February 24
Monday March 3
*Information is believed to be accurate at time of posting but is not guaranteed to be correct. Some values may vary slightly based on the exact date and time the reports were generated. Market stats are provided by TRREB (Toronto Regional Real Estate Board) and are based on sales for the month of Attached/Row/Townhouses, Condo Apartments, Condo Townhouses, Detached, Detached with Common Elements, Link Homes and Semi-detached. *Some values may vary slightly based on the exact date and time the reports were generated.
Not intended as a solicitation if your property is already listed by another broker. Affiliated real estate agents are independent contractor sales associates, not employees. ©2021 Coldwell Banker. All Rights Reserved. Coldwell Banker and the Coldwell Banker logos are trademarks of Coldwell Banker Real Estate LLC. The Coldwell Banker® System is comprised of company owned offices which are owned by a subsidiary of Realogy Brokerage Group LLC and franchised offices which are independently owned and operated. The Coldwell Banker System fully supports the principles of the Fair Housing Act and the Equal Opportunity Act.
Click below for more reports
Check out our Uxbridge and Scugog Events Pages to keep up to date on whats going on around town. Click the links or scan the Code with your phone to take you directly there.

UXBRIDGE EVENTS

SCUGOG EVENTS

Scugog Housing February 2025

Scugog Housing February 2025
Each office is independently owned and operated


Housing Market Report for February 2025
Here is the Region of Durham Housing February 2025 report (all housing types), with reports from the Canadian Real Estate Association, and Toronto Regional Real Estate Board included.
This housing report for Durham Region includes the number of new listings, average list price, number of properties sold, average selling price, average days on market and average asking price to selling price ratio for all property types within the Region of Durham.
Scroll to the bottom for links to take you to the housing market reports for Uxbridge, Scugog and Brock.
From Toronto Regional Real Estate Board
Toronto Regional Real Estate Board – Market Stats At A Glance – February 2025
Read the Toronto Regional Real Estate Board Market Watch Report

Township of Scugog Full Report
Scugog Township Real Estate Market Analysis – February 2025
The real estate market in Scugog Township showed signs of continued cooling in February 2025, with declining home prices and stable but subdued sales activity.
Price Trends: Decline in Average Sales Price
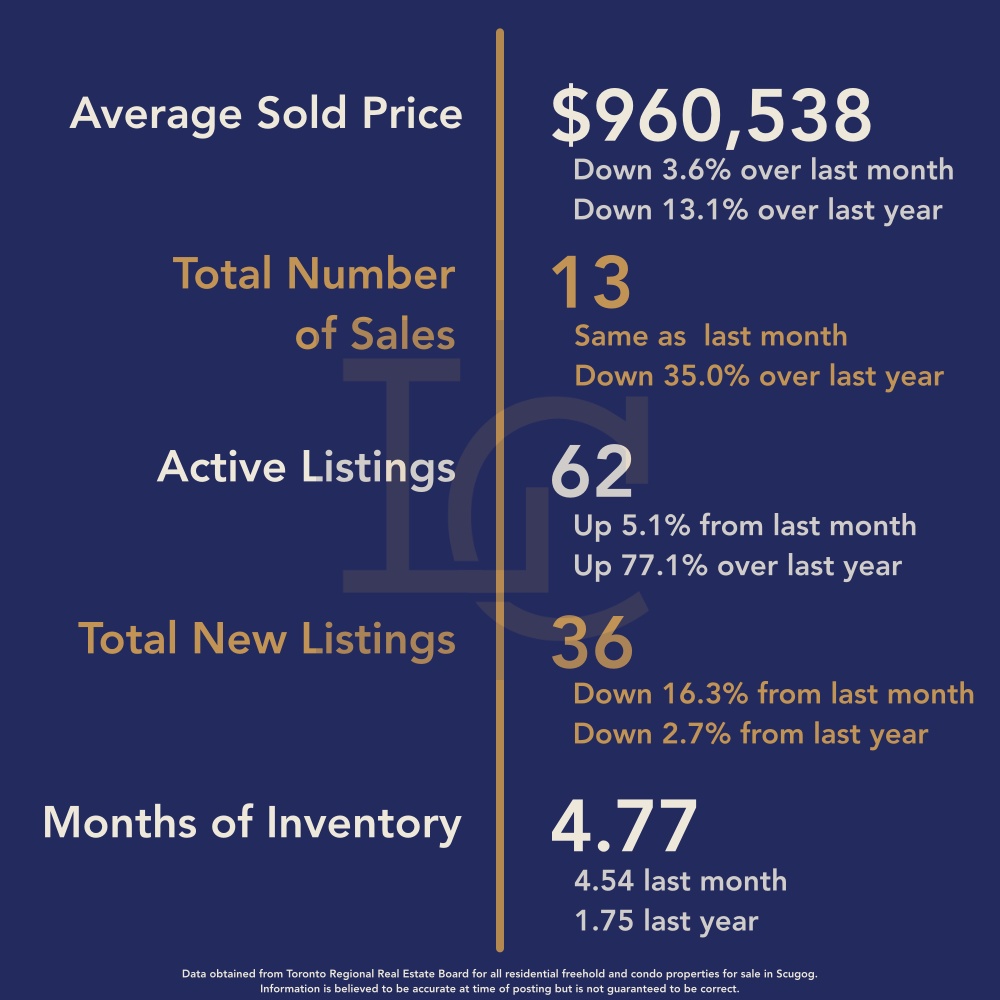
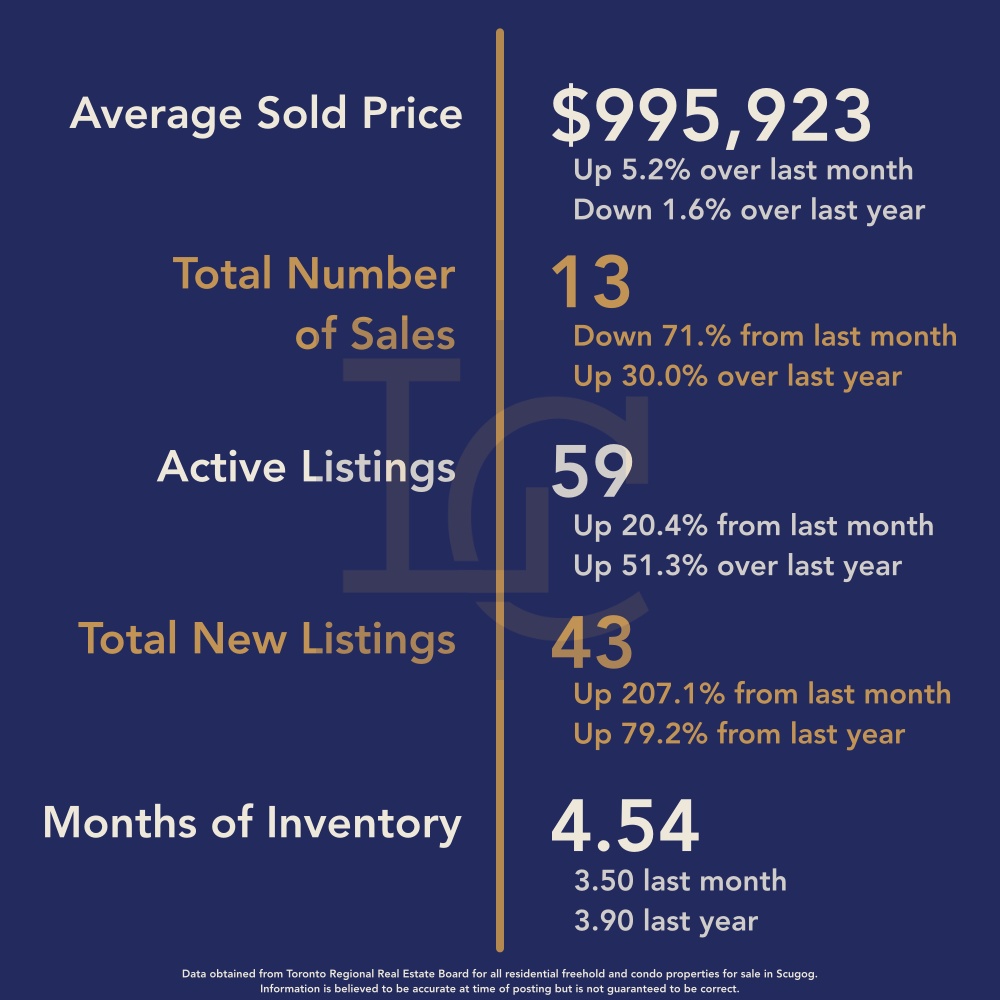
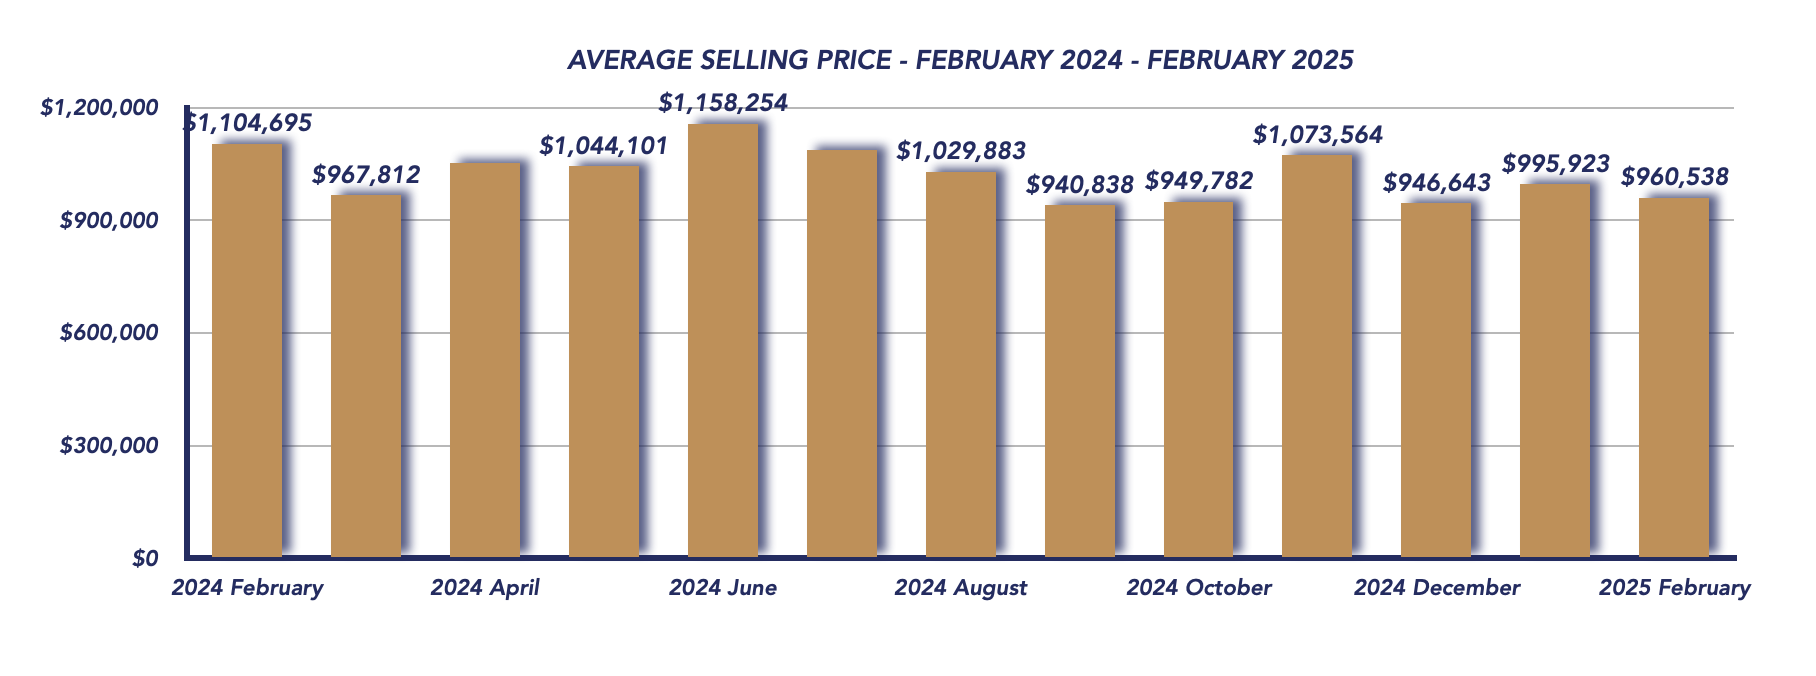
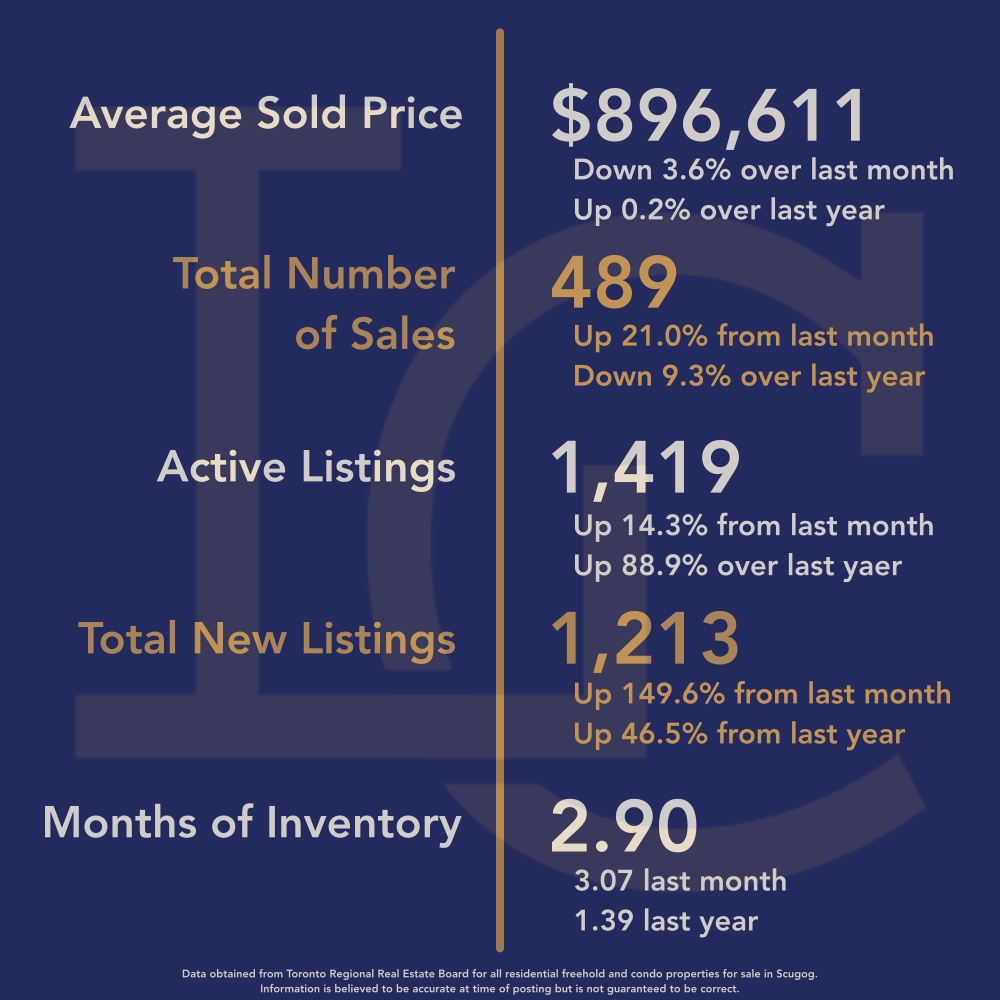
The average sales price for February 2025 was $960,538, reflecting a 13.1% decline from February 2024 ($1,104,695) and a 3.6% drop from January 2025 ($995,923). This downward trend suggests a shift in buyer behavior, potentially influenced by affordability concerns, higher borrowing costs, or a general market correction after previous price surges.
Sales Activity: Fewer Transactions Compared to Last Year
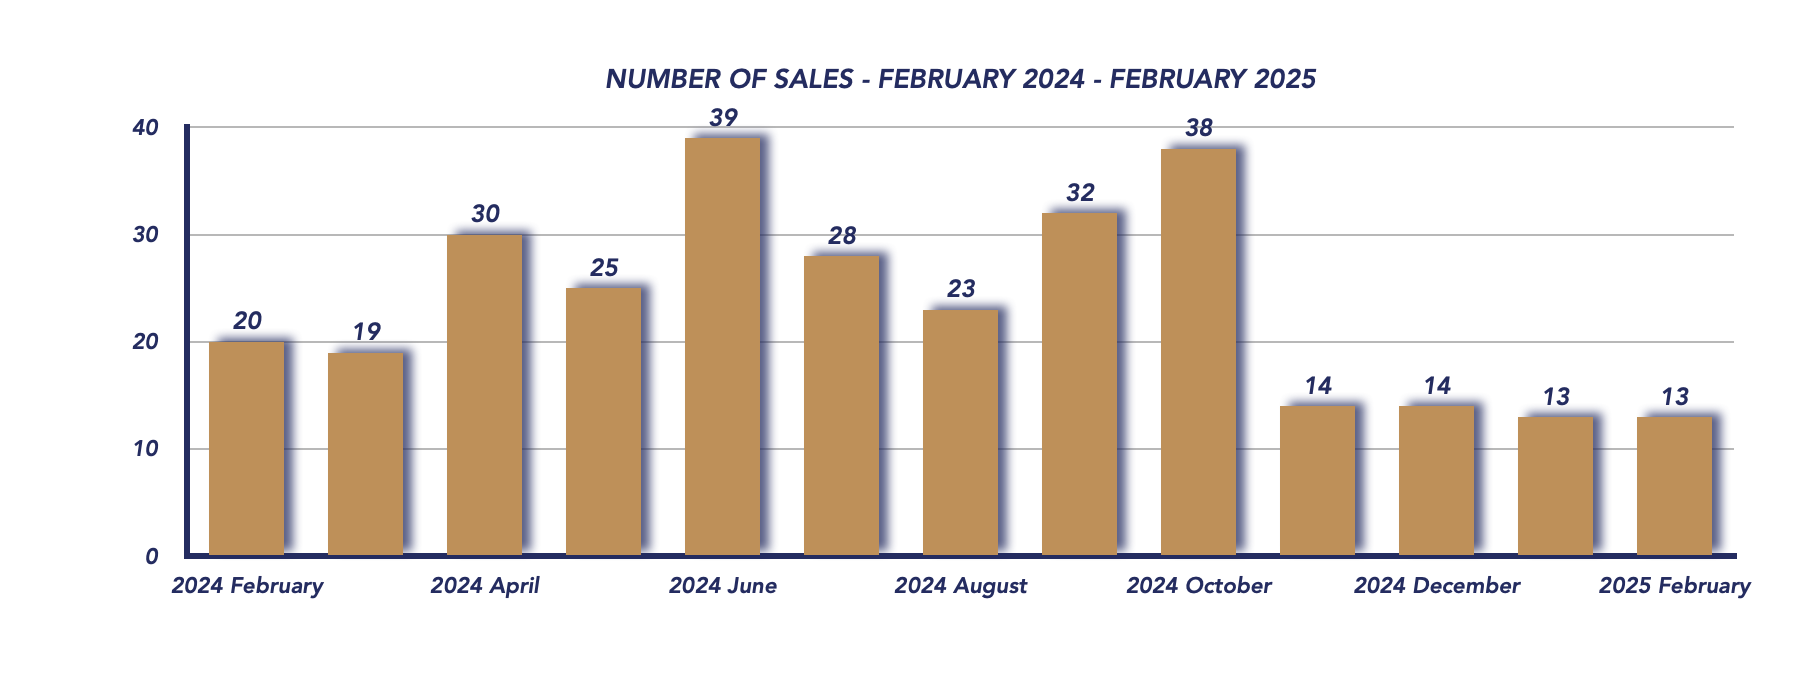
Total sales remained stagnant at 13 transactions, the same as January but significantly lower than 20 sales in February 2024. Despite this, the range of property sales remained diverse, spanning from $641,000 to $1,400,000, with three homes selling for over $1.2 million. This indicates that while demand has softened, there are still buyers in the market for higher-end properties.
Market Competitiveness: Lower Sale-to-List Price Ratio
The sale-to-list price ratio declined to 96%, down from 98% last month, signaling increased negotiation between buyers and sellers. This suggests that properties are not achieving as close to their asking prices as they were in the previous month, a sign of a market favoring buyers more than sellers.
Inventory & Supply: Balanced Market Continues
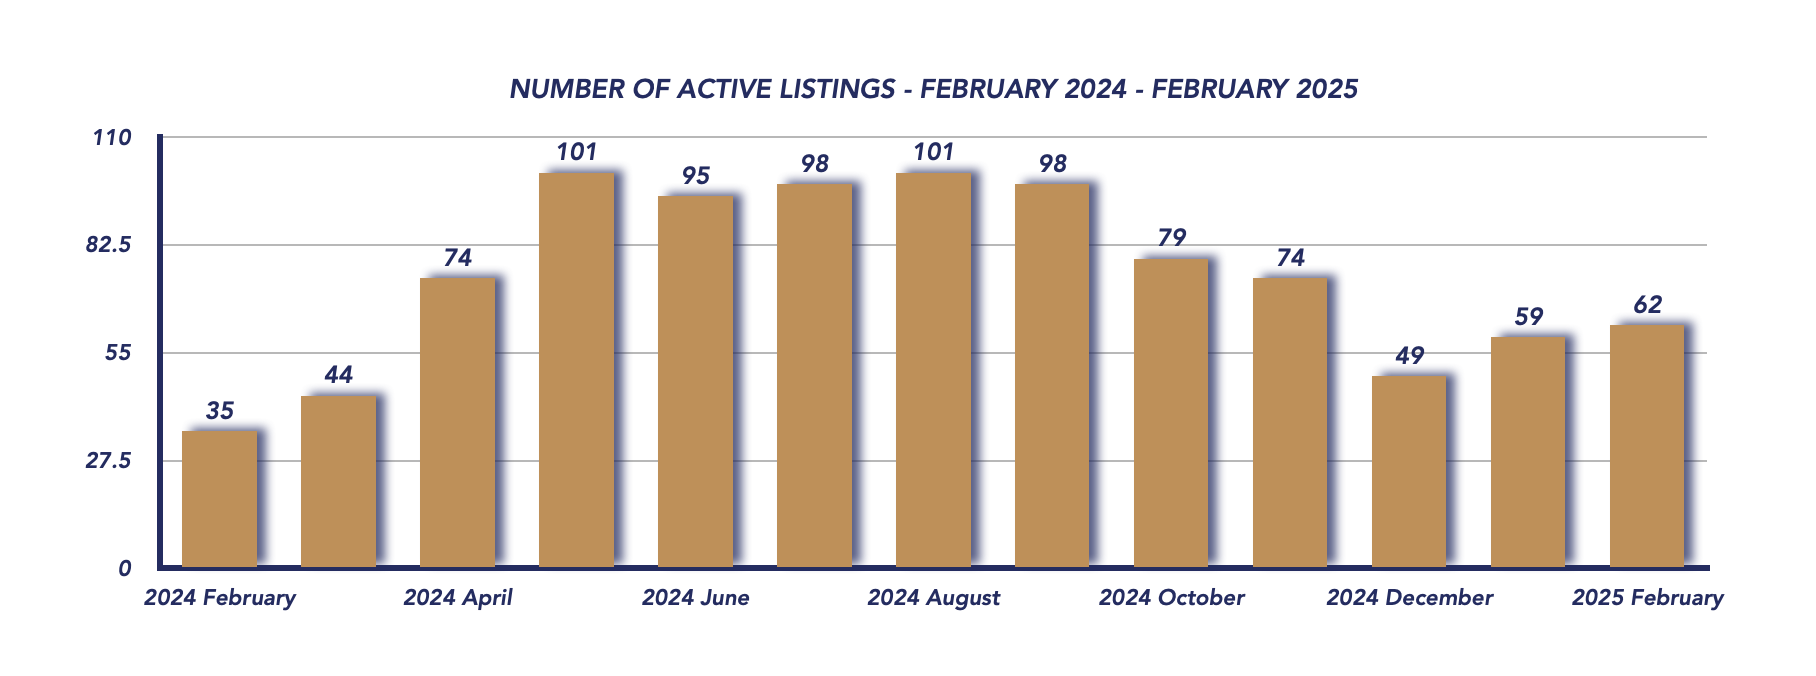
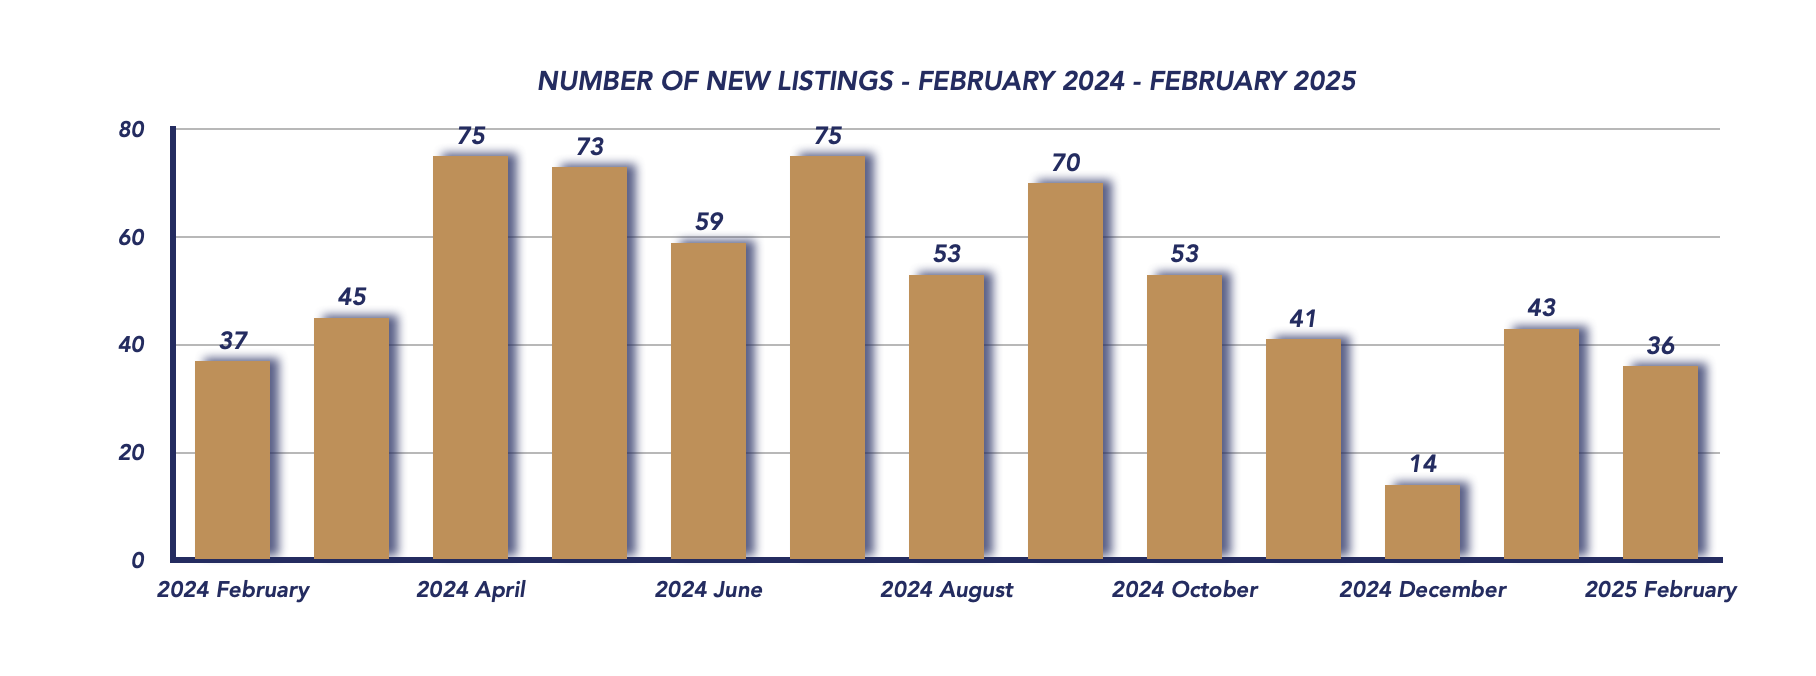
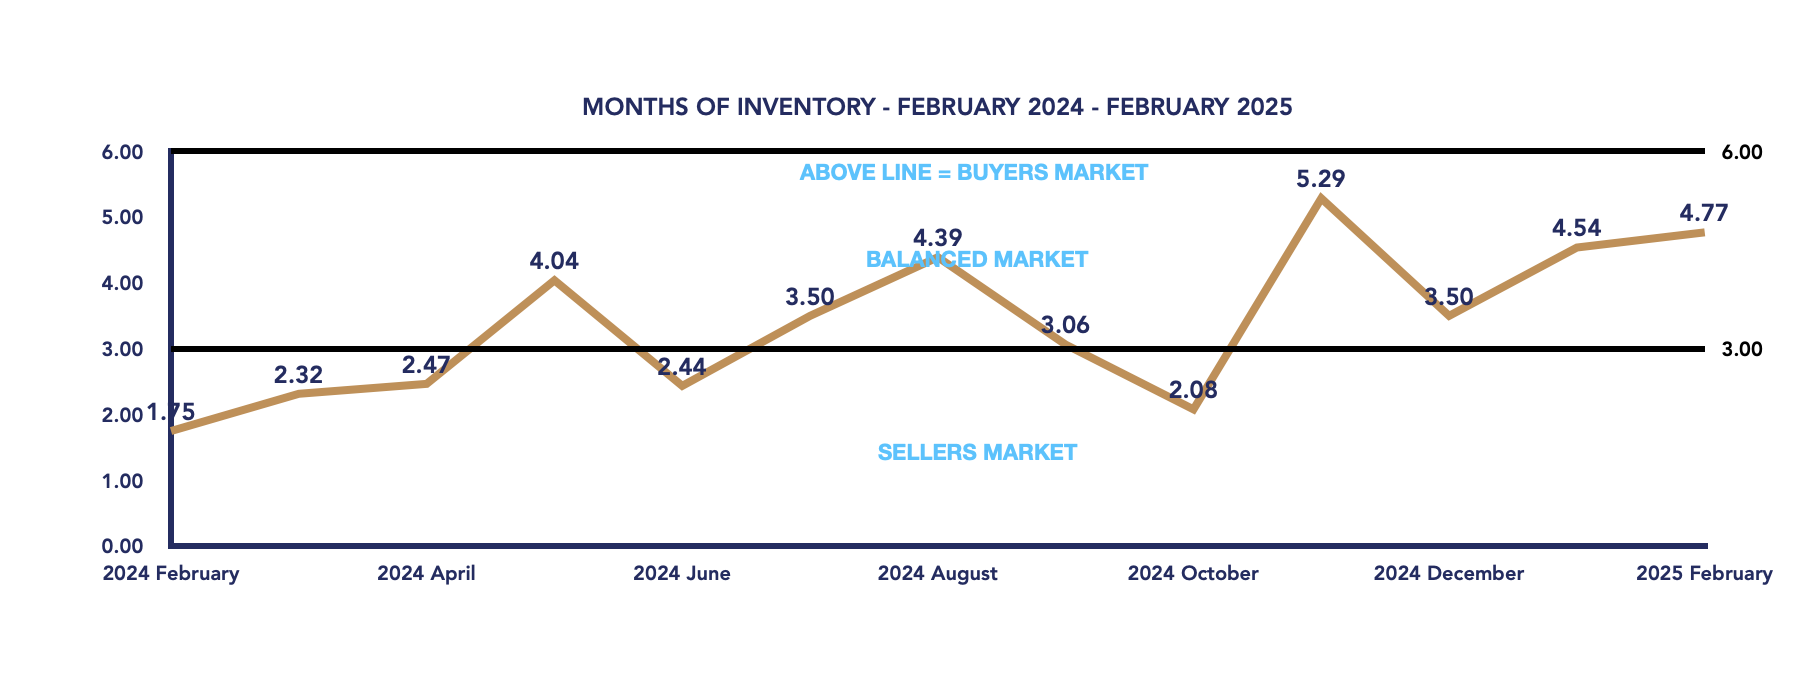
New listings fell to 36, compared to 43 in January and 37 in February 2024, indicating a moderate decrease in seller activity. Meanwhile, the months of inventory edged slightly higher to 4.77 months, up from 4.54 in January, further reinforcing the presence of a balanced market where neither buyers nor sellers hold a strong advantage.
Time on Market: Homes Taking Longer to Sell
The average days on market for properties in February was 52 days, reinforcing the trend of longer selling times. This suggests that buyers are being more selective, and sellers may need to adjust pricing expectations or offer more incentives to close deals.
Conclusion: A Cooling Market with Opportunities for Buyers
The Scugog Township real estate market is continuing its cooling trend, with declining home prices, steady but reduced sales, and longer time on market. While sellers are still achieving respectable prices, the lower sale-to-list price ratio and increasing inventory suggest buyers may have more negotiating power in the coming months. However, with sales remaining steady, the market continues to exhibit characteristics of a balanced environment, rather than a steep downturn.
As we move into the spring market, it will be important to monitor whether increased listing activity and potential interest rate shifts impact buyer confidence and overall market momentum.
February 2025
January 2025
Average Sold Price
Number of Properties Sold
Active Listings
Number of New Listings
Months of Inventory
MONDAY MARKET MINUTES
Monday February 3
Monday February 10
Monday February 24
Monday March 3
*Information is believed to be accurate at time of posting but is not guaranteed to be correct. Some values may vary slightly based on the exact date and time the reports were generated. Market stats are provided by TRREB (Toronto Regional Real Estate Board) and are based on sales for the month of Attached/Row/Townhouses, Condo Apartments, Condo Townhouses, Detached, Detached with Common Elements, Link Homes and Semi-detached. *Some values may vary slightly based on the exact date and time the reports were generated.
Not intended as a solicitation if your property is already listed by another broker. Affiliated real estate agents are independent contractor sales associates, not employees. ©2021 Coldwell Banker. All Rights Reserved. Coldwell Banker and the Coldwell Banker logos are trademarks of Coldwell Banker Real Estate LLC. The Coldwell Banker® System is comprised of company owned offices which are owned by a subsidiary of Realogy Brokerage Group LLC and franchised offices which are independently owned and operated. The Coldwell Banker System fully supports the principles of the Fair Housing Act and the Equal Opportunity Act.
Click below for more reports
Check out our Uxbridge and Scugog Events Pages to keep up to date on whats going on around town. Click the links or scan the Code with your phone to take you directly there.
UXBRIDGE EVENTS
SCUGOG EVENTS
Brock Housing February 2025

Brock Housing February 2025
Each office is independently owned and operated

Housing Market Report for February 2025
Here is the Region of Durham Housing February 2025 report (all housing types), with reports from the Canadian Real Estate Association, and Toronto Regional Real Estate Board included.
This housing report for Durham Region includes the number of new listings, average list price, number of properties sold, average selling price, average days on market and average asking price to selling price ratio for all property types within the Region of Durham.
Scroll to the bottom for links to take you to the housing market reports for Uxbridge, Scugog and Brock.
From Toronto Regional Real Estate Board
Toronto Regional Real Estate Board – Market Stats At A Glance – February 2025
Read the Toronto Regional Real Estate Board Market Watch Report
Township of Brock Full Report
Brock Township Real Estate Market Analysis – February 2025
The real estate market in Brock Township saw notable shifts in February 2025, with home prices continuing to rise despite a slowdown in sales activity.
Average Sales Price Trends
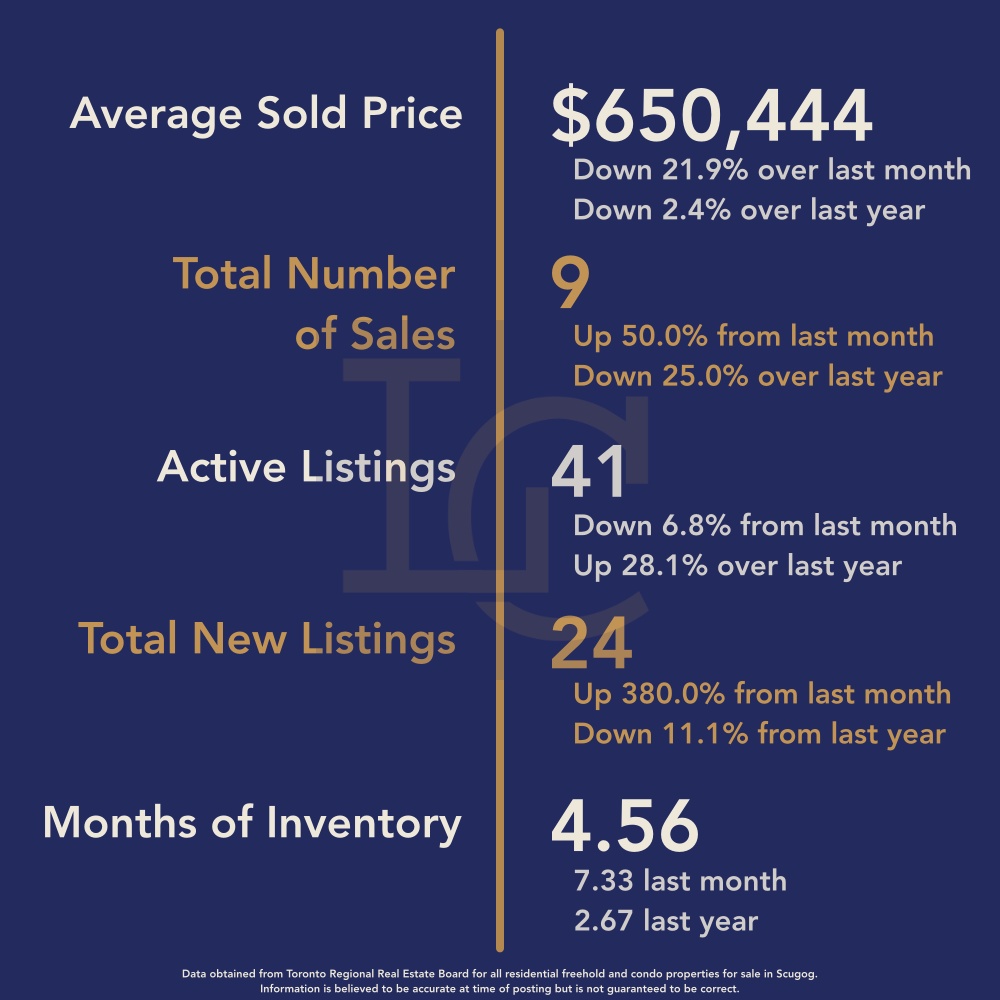
The average sales price for homes in Brock Township climbed to $787,861, reflecting a 3.44% increase from February 2024 ($761,636) and a significant 21.1% jump from January 2025 ($650,444). This sharp month-over-month increase suggests that higher-priced properties contributed to the overall price growth, particularly as three properties sold for over $1 million.
Sales Activity & Market Demand
A total of 8 homes were sold in February 2025, slightly below January’s 9 sales and considerably lower than the 14 sales recorded in February 2024. This decline in sales volume indicates a softer demand compared to last year. However, despite fewer sales, homes transacted within a broad price range, from $475,000 to $1,825,000, highlighting diversity in the market.
The sale-to-list price ratio fell to 95%, down from 99% in January, suggesting that buyers had more negotiating power in February, leading to properties selling below asking price more frequently.
Inventory & Listing Activity
New listings in February totaled 19, down from 24 in January 2025 and 21 in February 2024. While the supply of new homes entering the market decreased, inventory levels remained stable, with months of inventory rising slightly to 4.88, up from 4.56 in January. This keeps Brock Township within a balanced market, neither favoring buyers nor sellers.
Time on Market & Buyer Behavior
Homes in February took an average of 44 days to sell, indicating a moderate pace of transactions. While this doesn’t signal a dramatic slowdown, it suggests that buyers are taking more time to make purchasing decisions.
Conclusion
Overall, February 2025’s real estate market in Brock Township presented a mixed picture. Prices saw a notable rise, driven in part by higher-end sales, while sales activity slowed compared to previous months and last year. The decline in the sale-to-list price ratio and longer days on the market indicate shifting buyer dynamics, with more room for negotiation. Inventory levels remain balanced, suggesting a stable market outlook in the coming months.
February 2025

January 2025
Average Sold Price

Number of Properties Sold

Active Listings

Number of New Listings

Months of Inventory

*Information is believed to be accurate at time of posting but is not guaranteed to be correct. Some values may vary slightly based on the exact date and time the reports were generated. Market stats are provided by TRREB (Toronto Regional Real Estate Board) and are based on sales for the month of Attached/Row/Townhouses, Condo Apartments, Condo Townhouses, Detached, Detached with Common Elements, Link Homes and Semi-detached. *Some values may vary slightly based on the exact date and time the reports were generated.
Not intended as a solicitation if your property is already listed by another broker. Affiliated real estate agents are independent contractor sales associates, not employees. ©2021 Coldwell Banker. All Rights Reserved. Coldwell Banker and the Coldwell Banker logos are trademarks of Coldwell Banker Real Estate LLC. The Coldwell Banker® System is comprised of company owned offices which are owned by a subsidiary of Realogy Brokerage Group LLC and franchised offices which are independently owned and operated. The Coldwell Banker System fully supports the principles of the Fair Housing Act and the Equal Opportunity Act.
Click below for more reports
Check out our Uxbridge and Scugog Events Pages to keep up to date on whats going on around town. Click the links or scan the Code with your phone to take you directly there.
UXBRIDGE EVENTS
SCUGOG EVENTS
Durham Region Housing February 2025

Durham Region Housing February 2025
Each office is independently owned and operated

Housing Market Report for February 2025
Here is the Region of Durham Housing February 2025 report (all housing types), with reports from the Canadian Real Estate Association, and Toronto Regional Real Estate Board included.
This housing report for Durham Region includes the number of new listings, average list price, number of properties sold, average selling price, average days on market and average asking price to selling price ratio for all property types within the Region of Durham.
Scroll to the bottom for links to take you to the housing market reports for Uxbridge, Scugog and Brock.
From Toronto Regional Real Estate Board
Toronto Regional Real Estate Board – Market Stats At A Glance – February 2025
Read the Toronto Regional Real Estate Board Market Watch Report
Durham Region Full Report
Durham Region Real Estate Market Analysis – February 2025
The Durham Region real estate market in February 2025 showed a mix of stability and gradual shifts, with pricing trends indicating a market still finding its footing.
Home Prices: A Slight Year-Over-Year Decline, but Month-Over-Month Stability
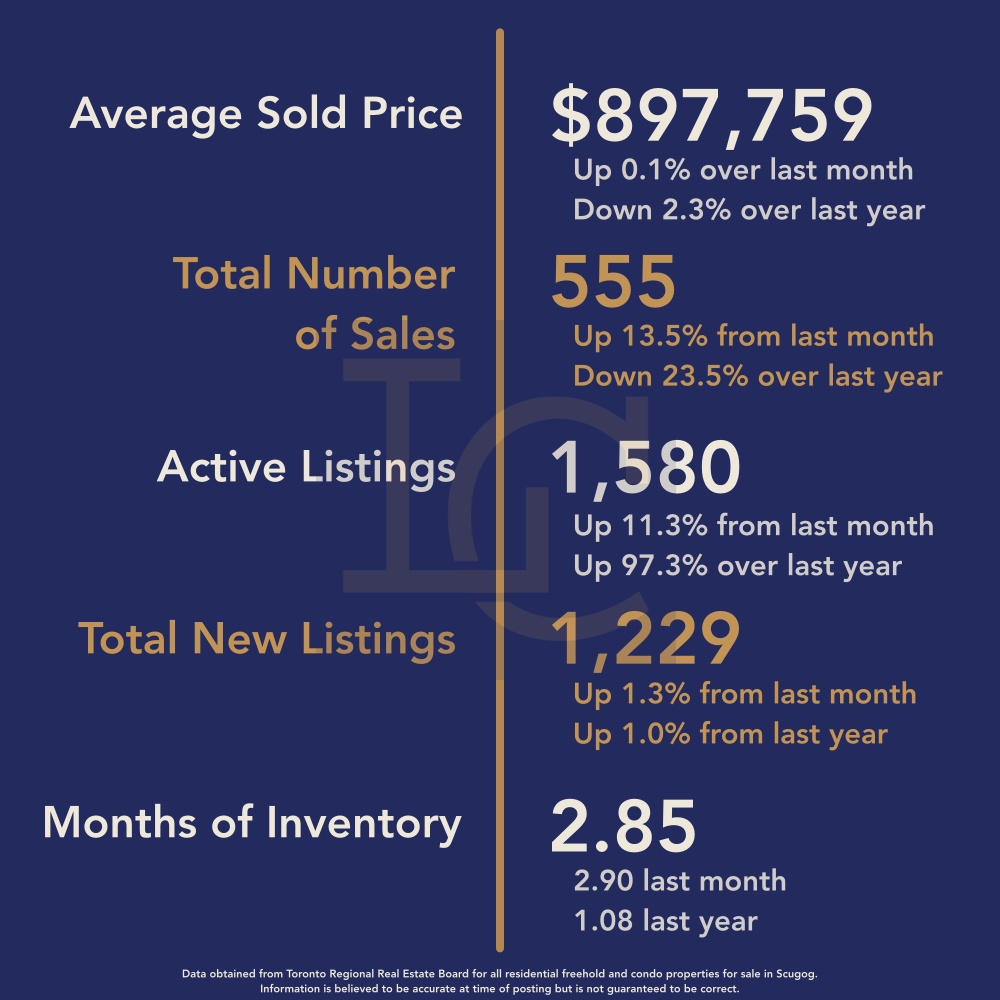
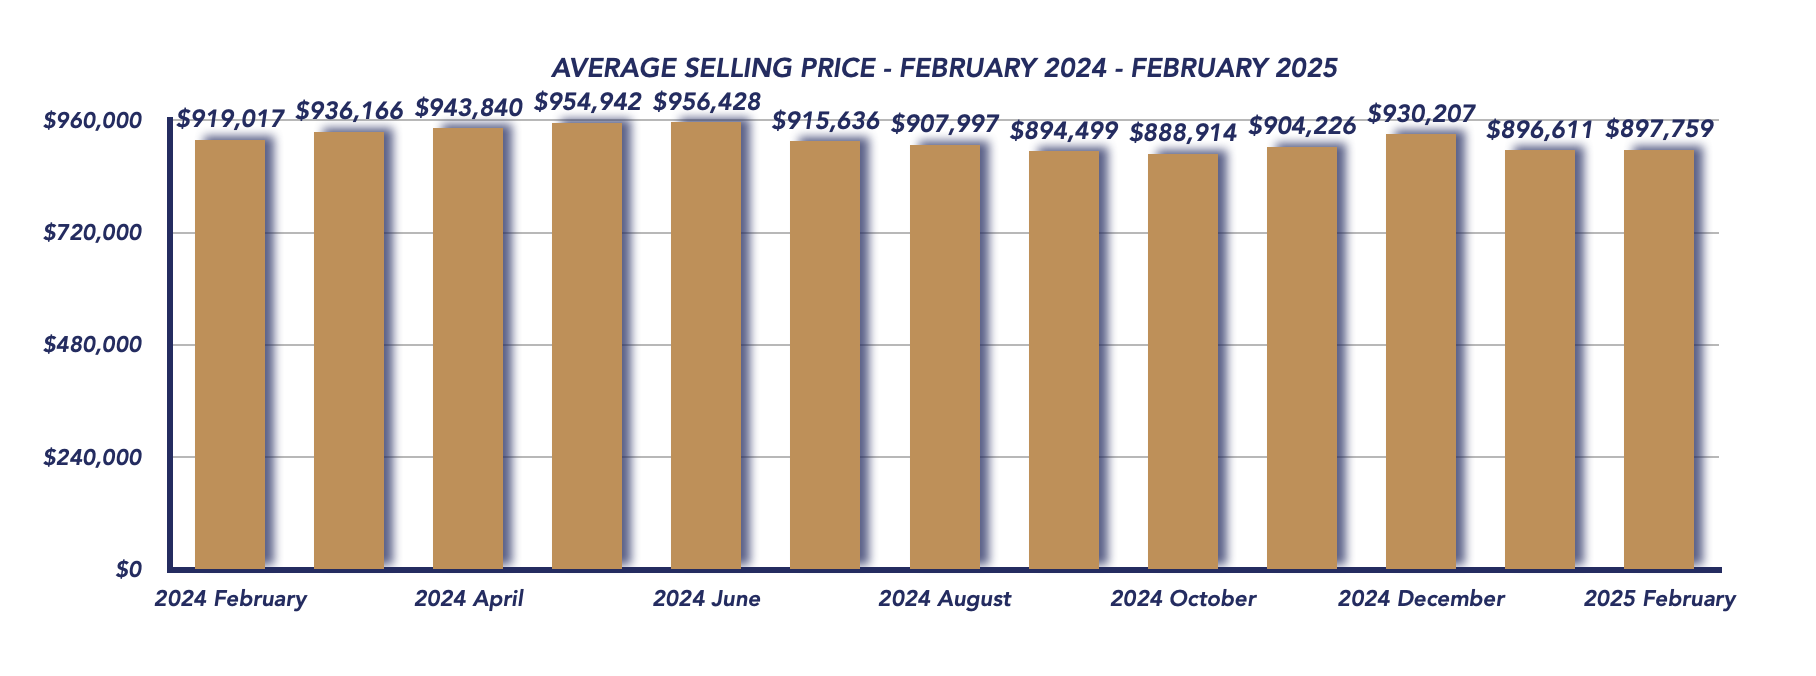
The average sales price for February 2025 was $897,759, reflecting a 2.3% decrease from February 2024 when the average was $919,017. However, on a month-over-month basis, prices remained virtually unchanged, rising by just 0.1% from January’s $896,611. This suggests that while prices have softened compared to last year, they may be stabilizing as buyers and sellers adjust to evolving market conditions.
Sales Activity: Slower Than Last Year but Improving Monthly
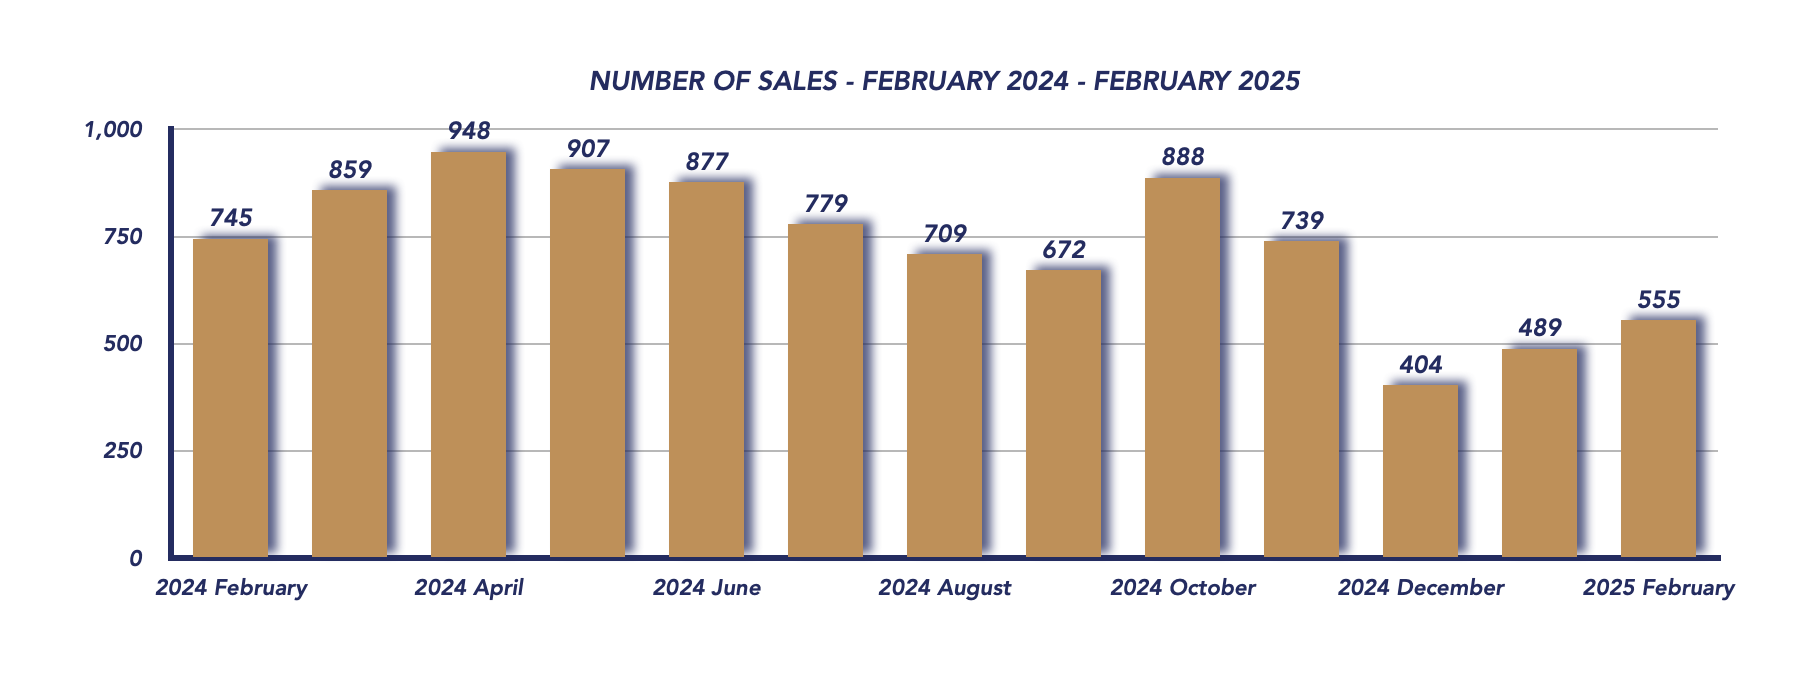
Total home sales in February reached 555, which represents a 25.5% decline from the 745 sales recorded in February 2024. However, sales showed an encouraging increase from 489 transactions in January, indicating a seasonal uptick in activity as we move toward the traditionally busier spring market.
List-to-Sale Price Ratio Indicates Strong Buyer Competition
Despite the lower overall sales volume, the sale-to-list price ratio rose to 101%, up from 100% in January. This suggests that homes are still selling close to, or slightly above, asking prices, indicating continued demand in certain property segments.
New Listings Slightly Up, Inventory Remains Tight
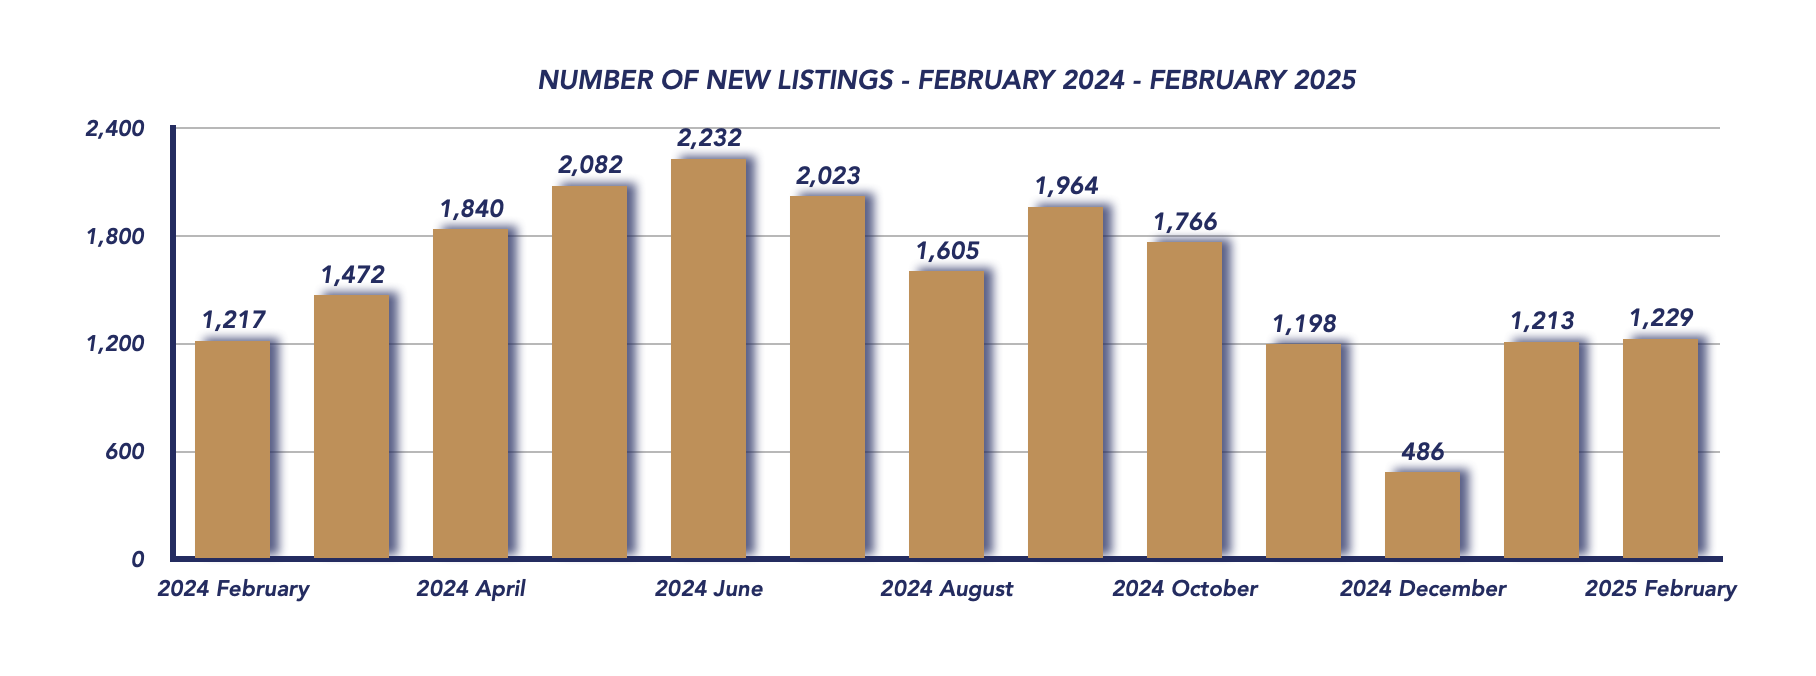
The number of new listings in February was 1,229, showing a slight increase from 1,213 in January and 1,217 in February 2024. This consistent listing activity is keeping inventory levels relatively stable, preventing a significant swing toward a buyer’s market.
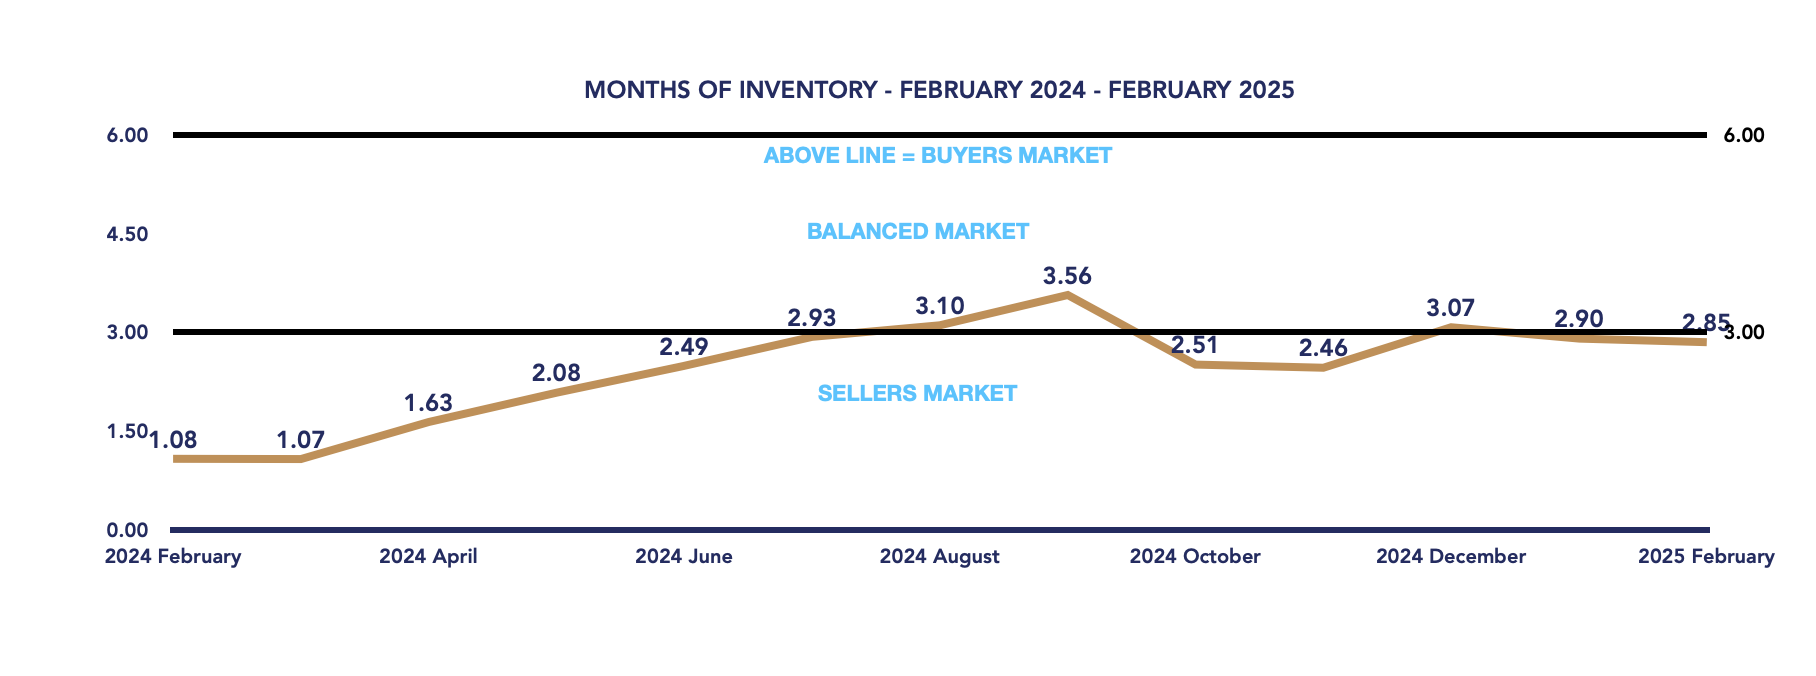
The months of inventory remained at 2.85, down slightly from 2.90 in January. This figure remains right on the cusp of a seller’s market and a balanced market, suggesting that while buyers have a bit more selection than during peak seller’s market conditions, sellers are still maintaining some leverage.
Days on Market: A Balanced Market Signal
The average days on market (DOM) for February was 34 days, reflecting a relatively stable timeline for selling properties. This suggests that while homes are not moving as quickly as in highly competitive periods, the market is still functioning efficiently.
Conclusion
The Durham Region real estate market in February 2025 continued to show signs of adjustment. While average prices remain slightly lower than last year, month-over-month stability suggests a potential price floor forming. Sales activity is picking up from January lows, and with the list-to-sale price ratio at 101%, there is evidence of buyer demand in select areas. Inventory levels remain relatively tight, reinforcing a market teetering between balanced and seller-friendly conditions. As we head into the spring market, it will be crucial to watch whether increasing listings meet demand or if buyer competition continues to push prices upward.
February 2025
January 2025
Average Sold Price
Number of Properties Sold
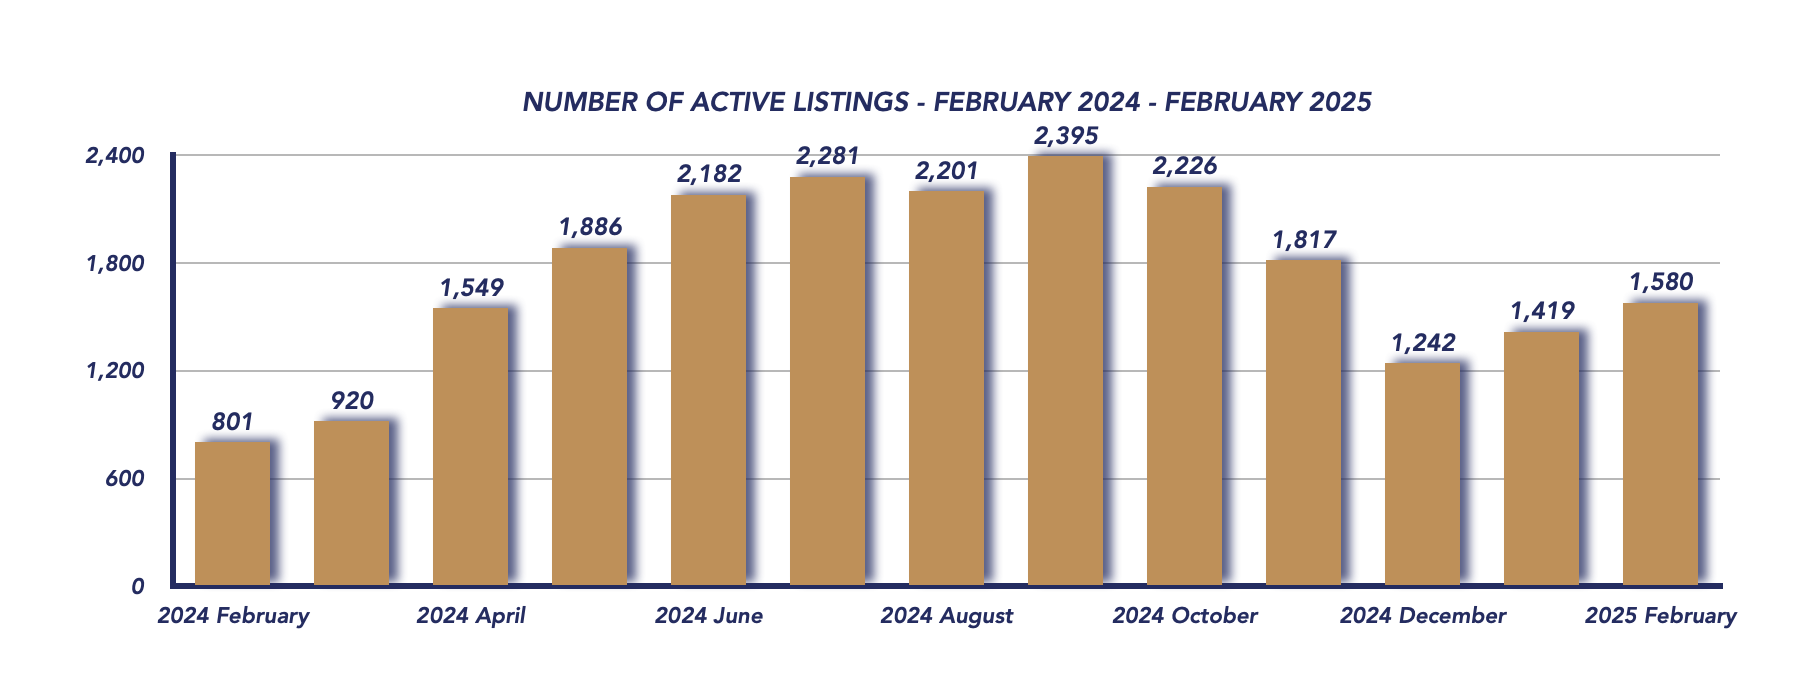
Active Listings
Number of New Listings
Months of Inventory
*Information is believed to be accurate at time of posting but is not guaranteed to be correct. Some values may vary slightly based on the exact date and time the reports were generated. Market stats are provided by TRREB (Toronto Regional Real Estate Board) and are based on sales for the month of Attached/Row/Townhouses, Condo Apartments, Condo Townhouses, Detached, Detached with Common Elements, Link Homes and Semi-detached. *Some values may vary slightly based on the exact date and time the reports were generated.
Not intended as a solicitation if your property is already listed by another broker. Affiliated real estate agents are independent contractor sales associates, not employees. ©2021 Coldwell Banker. All Rights Reserved. Coldwell Banker and the Coldwell Banker logos are trademarks of Coldwell Banker Real Estate LLC. The Coldwell Banker® System is comprised of company owned offices which are owned by a subsidiary of Realogy Brokerage Group LLC and franchised offices which are independently owned and operated. The Coldwell Banker System fully supports the principles of the Fair Housing Act and the Equal Opportunity Act.
Click below for more reports
Check out our Uxbridge and Scugog Events Pages to keep up to date on whats going on around town. Click the links or scan the Code with your phone to take you directly there.
UXBRIDGE EVENTS
SCUGOG EVENTS


