
 Facebook
 X
X
 Pinterest
 Copy Link

Uxbridge Housing March 2026

Each office is independently owned and operated
![]()
![]()
Housing Market Report for March 2026
Here is the Township of Uxbridge Housing March 2026 report (all housing types), with reports from the Canadian Real Estate Association, and Toronto Regional Real Estate Board included.
This housing report for Durham Region includes the number of new listings, average list price, number of properties sold, average selling price, average days on market and average asking price to selling price ratio for all property types within the Region of Durham.
Scroll to the bottom for links to take you to the housing market reports for Durham Region, Scugog and Brock.
![]()
![]()

From Toronto Regional Real Estate Board
Please note: The PropTx MLS® System, of which TRREB is a part, has added a number of new client boards over the last year. Many of these boards’ Members trade within the Greater Toronto Area and broader Greater Golden Horseshoe regions. As a result, historic data have been updated to reflect the addition of these boards’ listings and transactions. This means historic data have changed relative to previously published static reports. To view updated historic data, click here.
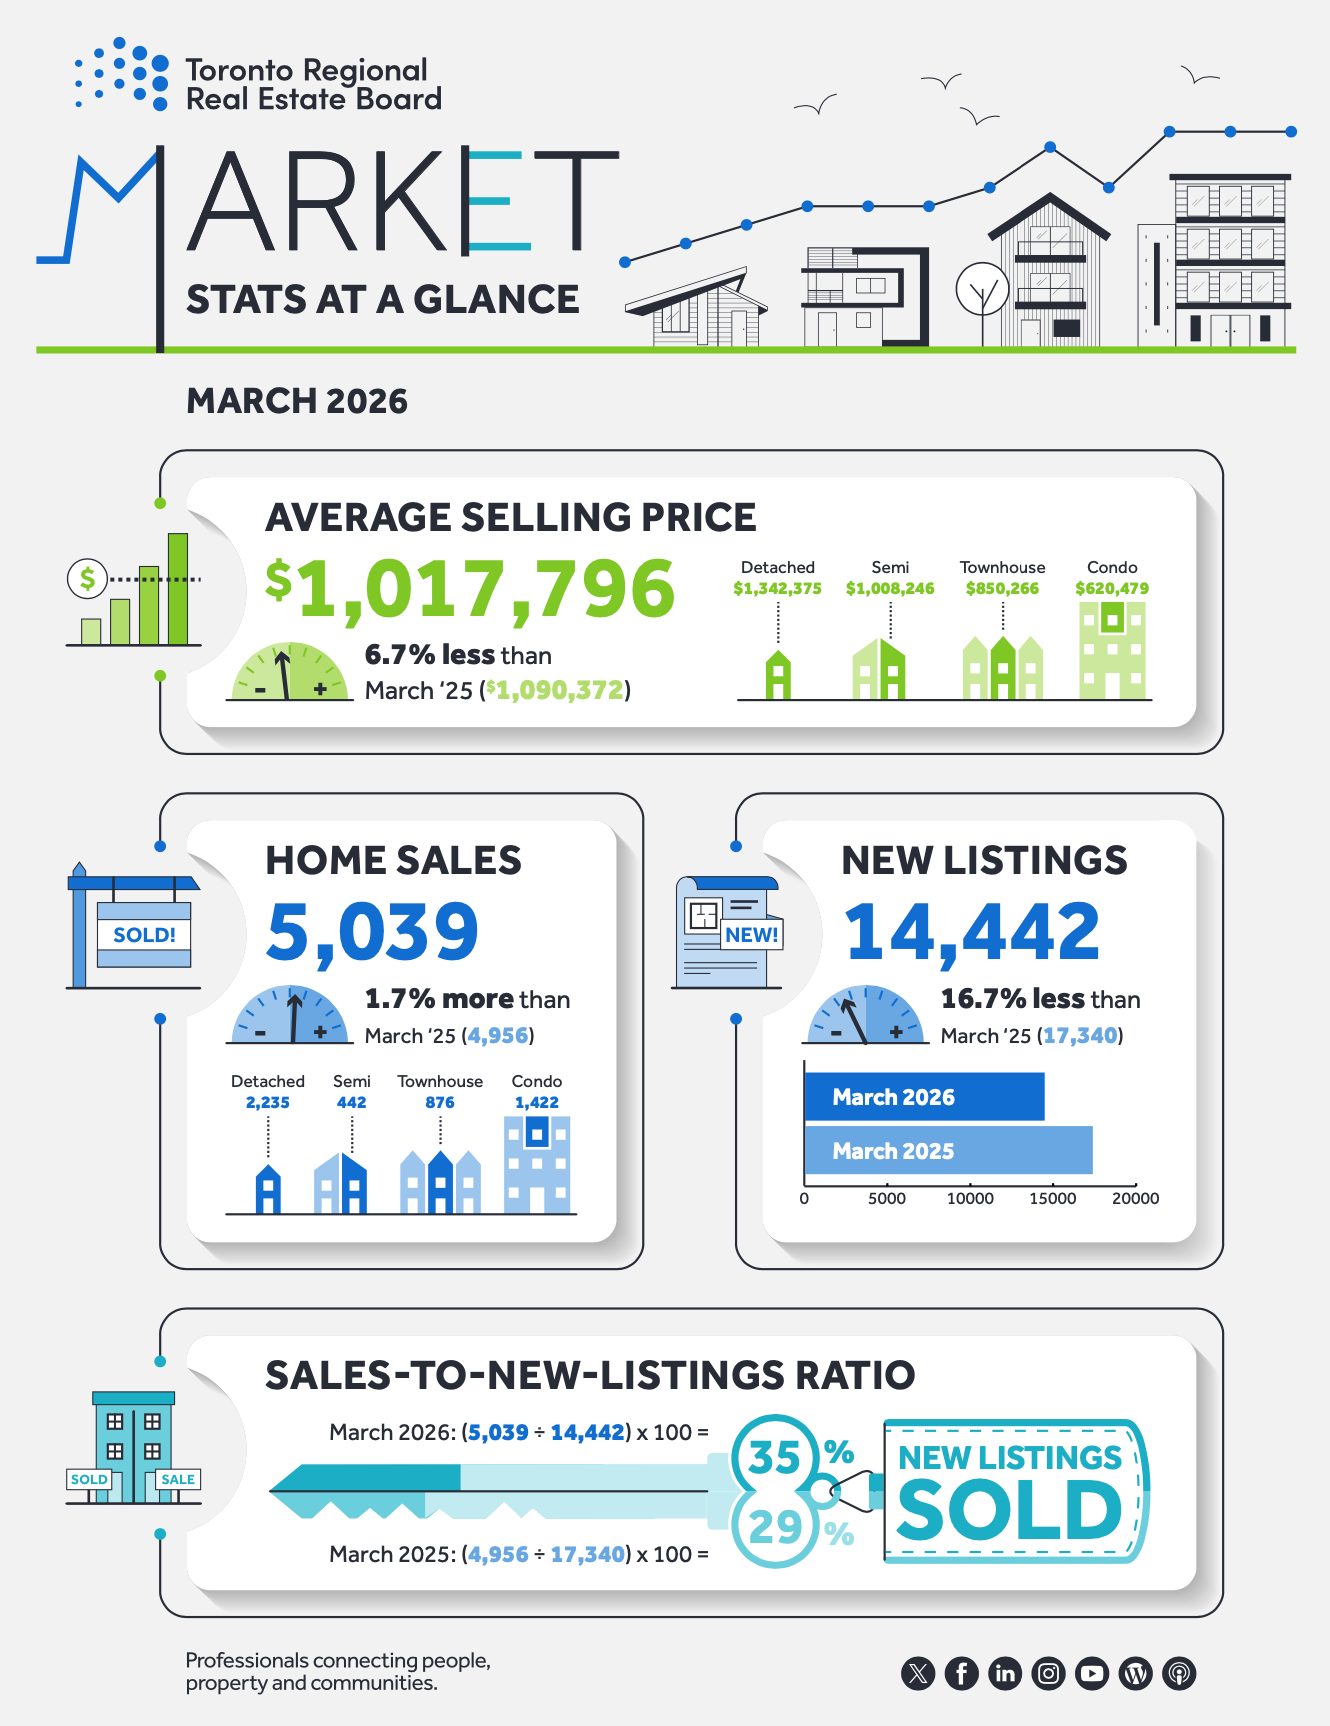
Toronto Regional Real Estate Board – Market Stats At A Glance – March 2026
Read the Toronto Regional Real Estate Board Market Watch Report
![]()
Uxbridge Township Real Estate Market Analysis – March 2026
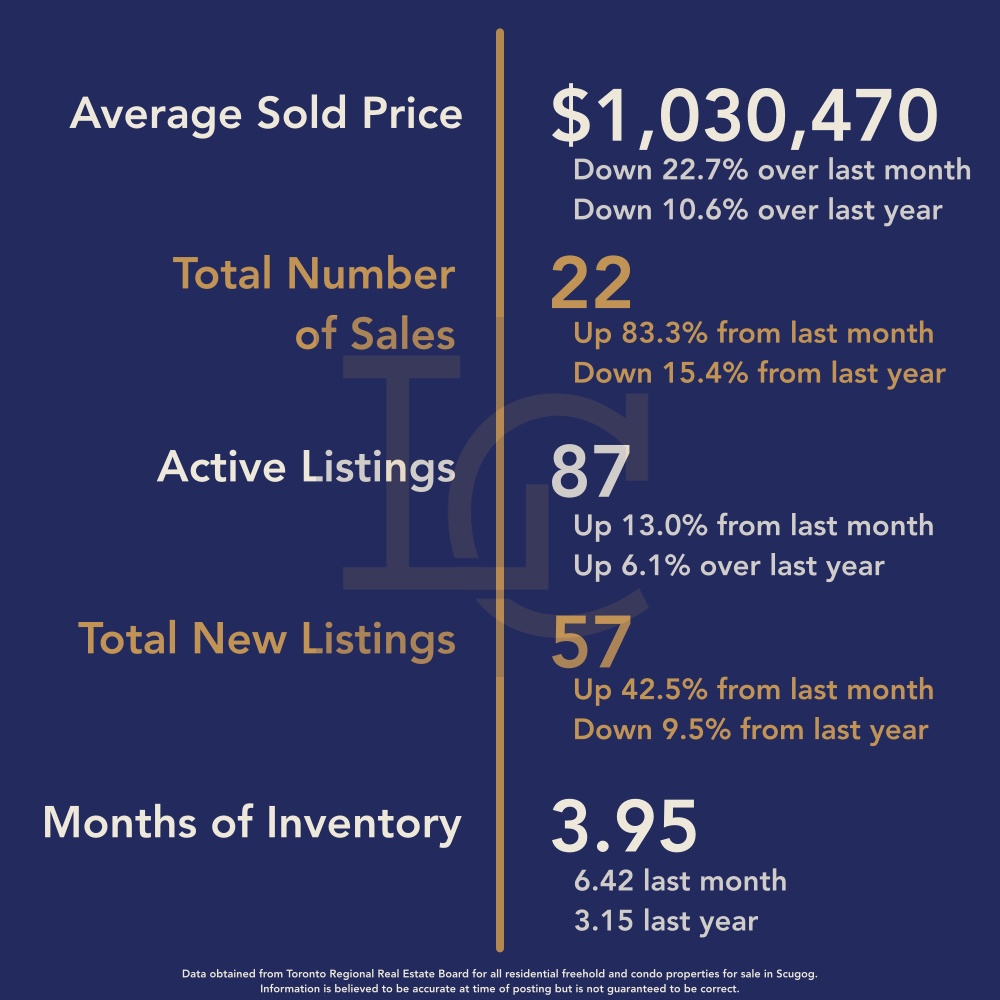
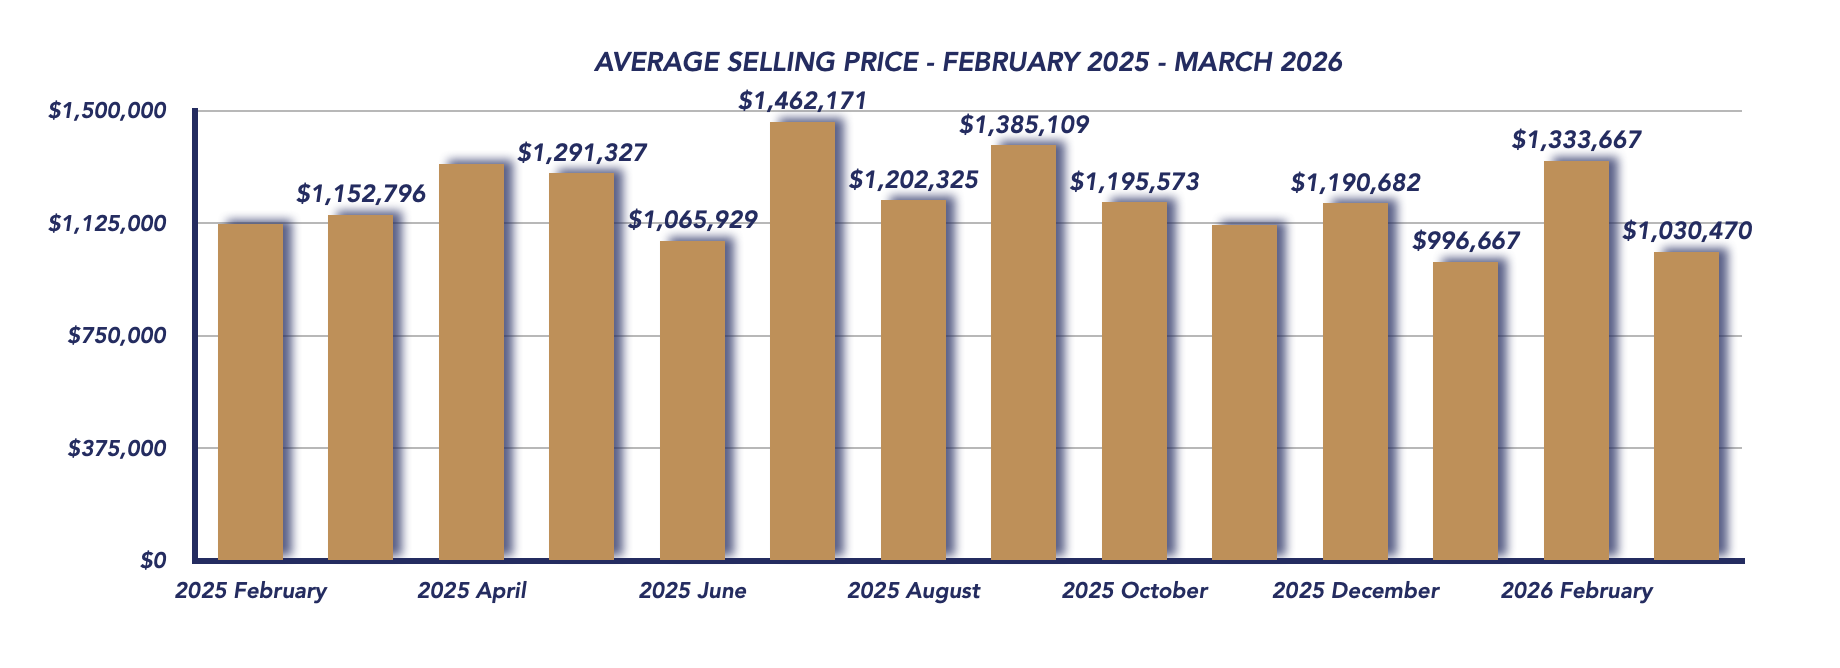
The Uxbridge real estate market saw a notable shift in March 2026, with increased sales activity and improving market balance, despite a sharp drop in the average sale price. The average sale price declined to $1,030,470, representing a 22.7% decrease from February’s $1,333,667 and a 10.6% drop compared to March 2025’s $1,152,796.
March 2026
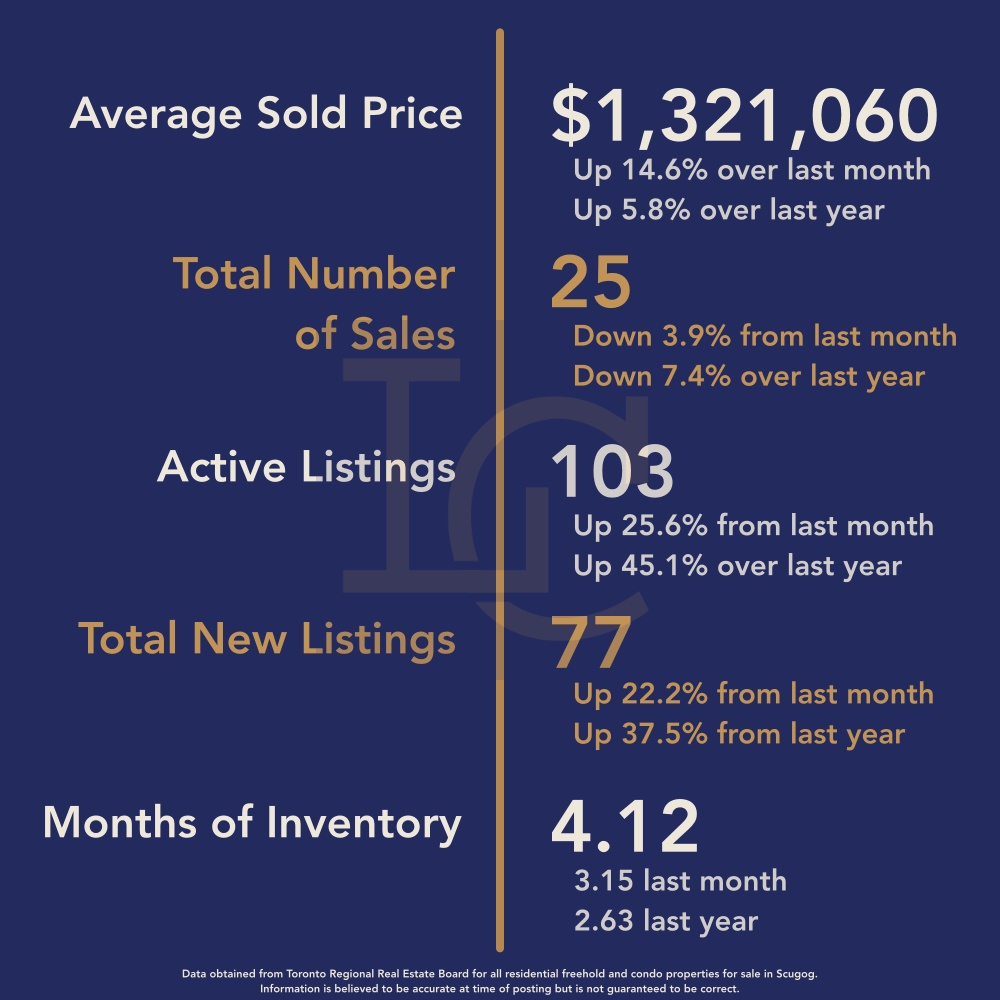
February 2026
This decline is largely due to a change in the mix of properties sold. In February, the market included several high-end transactions, with multiple homes selling above $1 million, including two properties over $2 million. In contrast, March saw a significant shift toward lower price points, with the highest sale at $1,957,000, only two properties selling between $1 million and $1.5 million, and a substantial 13 properties selling under $1 million. This shift in activity heavily influenced the overall average price.
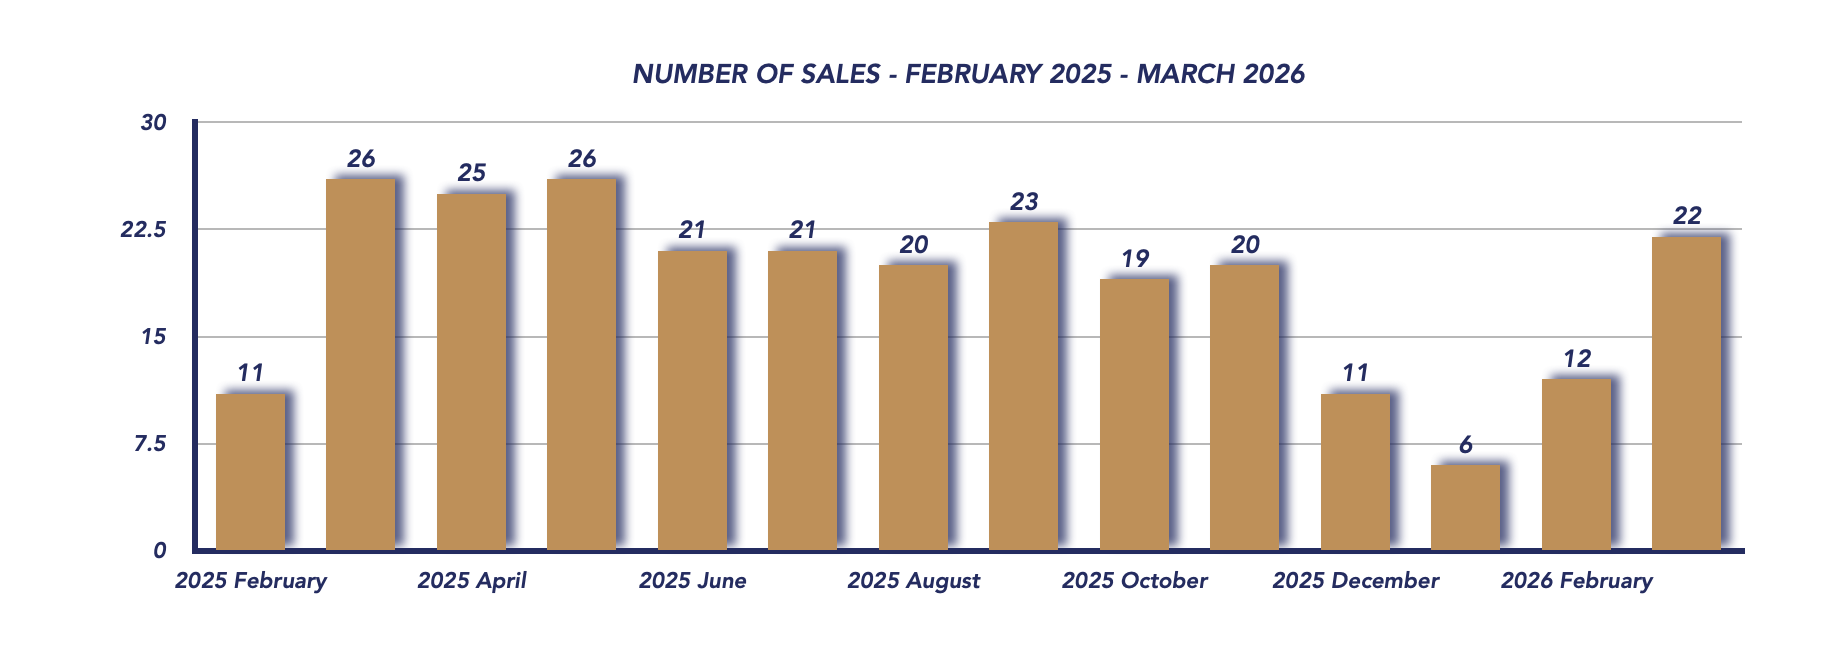
Sales Activity
Sales activity rebounded strongly, with 22 homes sold in March, up from 12 in February, though slightly below the 26 sales recorded in March 2025. This increase signals that buyer activity is picking up as we enter the spring market, even as buyers focus more on affordability.
Sale-to-List Price Ratio
The sale-to-list price ratio held steady at 96%, unchanged from February. This consistency indicates that homes are still selling close to asking price, provided they are priced appropriately for current market conditions.
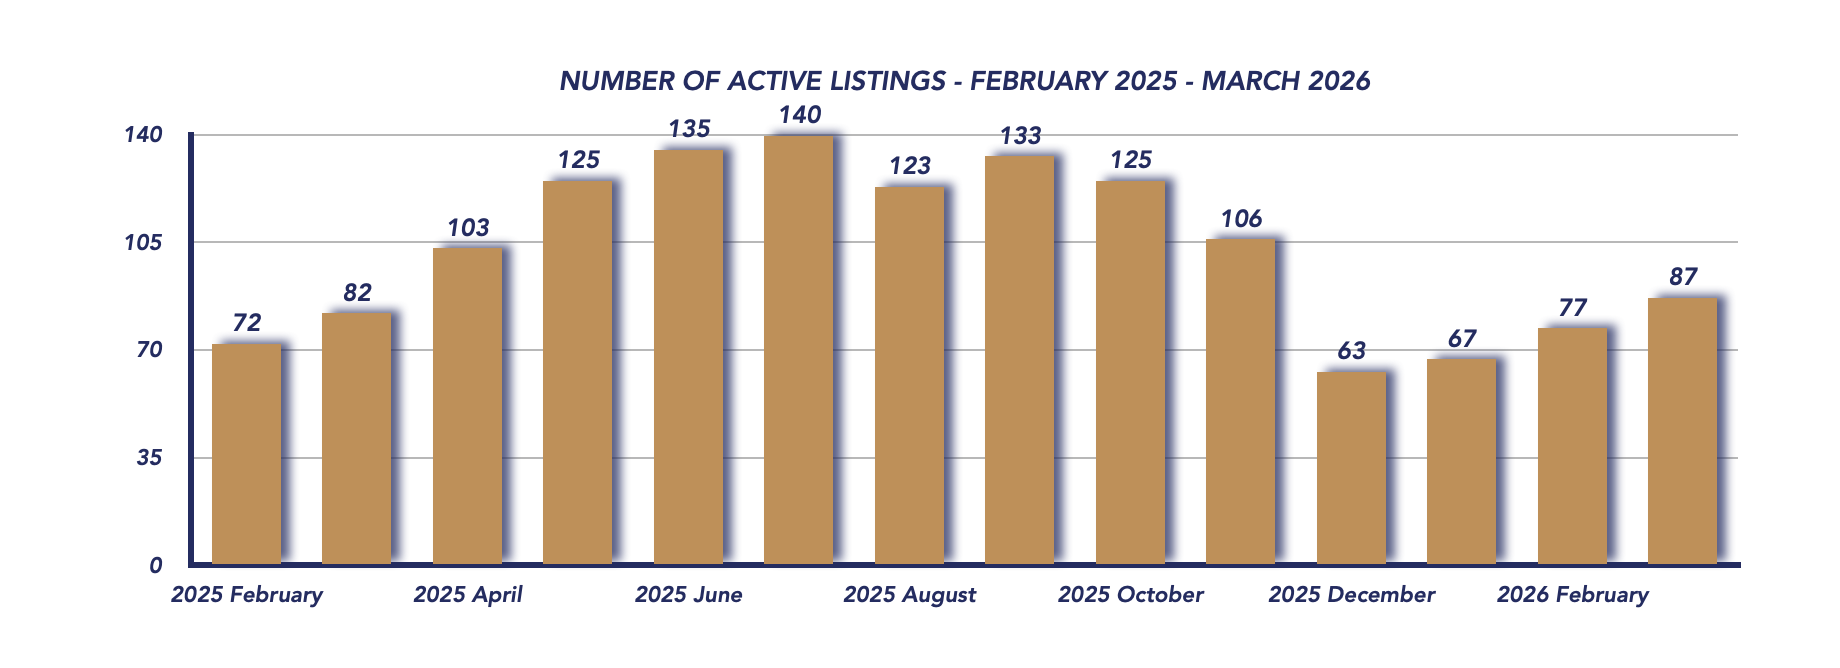
Active Listings
Active listings rose to 87, compared to 77 in February and 82 in March 2025. This gradual increase in inventory is typical for the spring season, as more sellers enter the market.
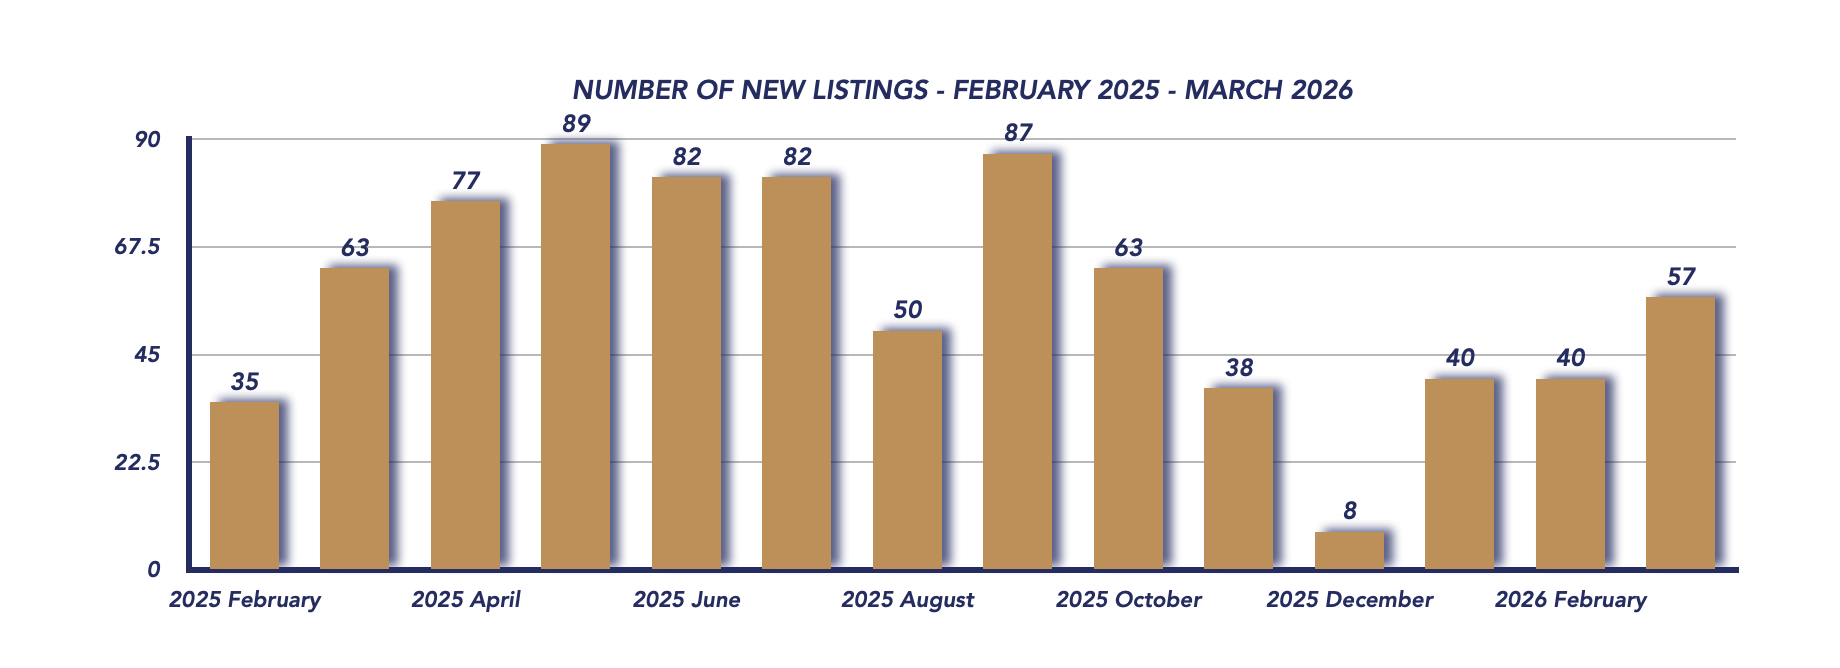
New Listings
There were 57 new listings in March, up from 40 in February, though slightly below the 63 new listings recorded last March. This increase reflects the expected seasonal boost in listing activity, giving buyers more options.
Days on Market
Homes sold in an average of 39 days, a significant improvement from February’s 85 days. This faster pace suggests renewed buyer urgency and stronger engagement as the spring market gains momentum.
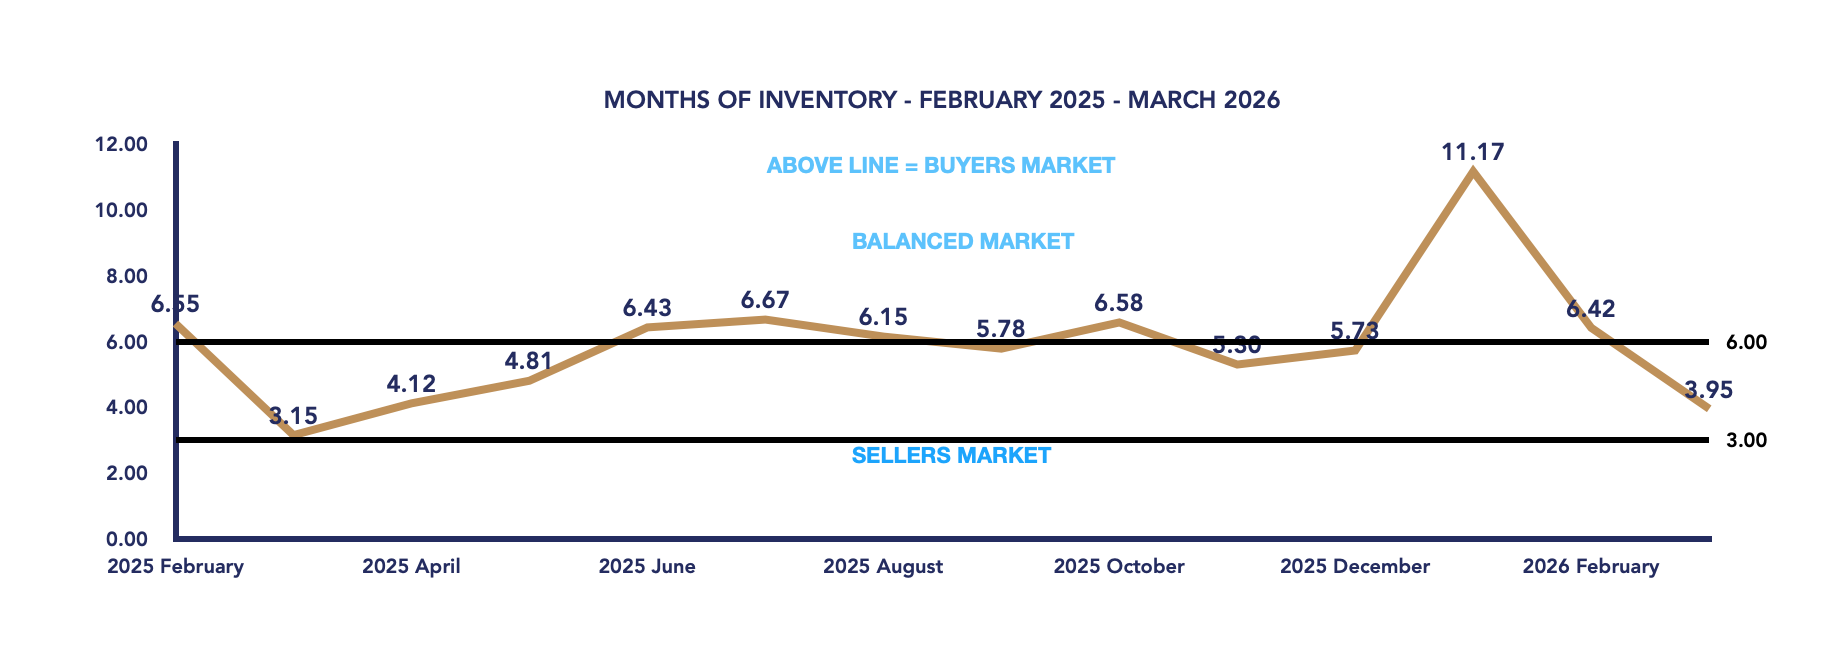
Months of Inventory
One of the most important shifts this month is the drop in months of inventory to 3.95, down from 6.42 in February. This brings the market back into balanced territory, where supply and demand are more evenly matched.
Conclusion
March 2026 highlights a market in transition. While the average sale price declined due to a shift toward more affordable homes, sales activity increased, homes sold faster, and inventory levels improved, all pointing to a healthier and more active market.
The return to balanced conditions suggests that both buyers and sellers have opportunities. Buyers still benefit from a range of options and reasonable negotiating power, while sellers can take advantage of renewed demand—especially if they price their homes strategically.
As we move further into the spring market, Uxbridge is showing signs of stabilization, with momentum building and conditions becoming more predictable after a volatile start to the year.
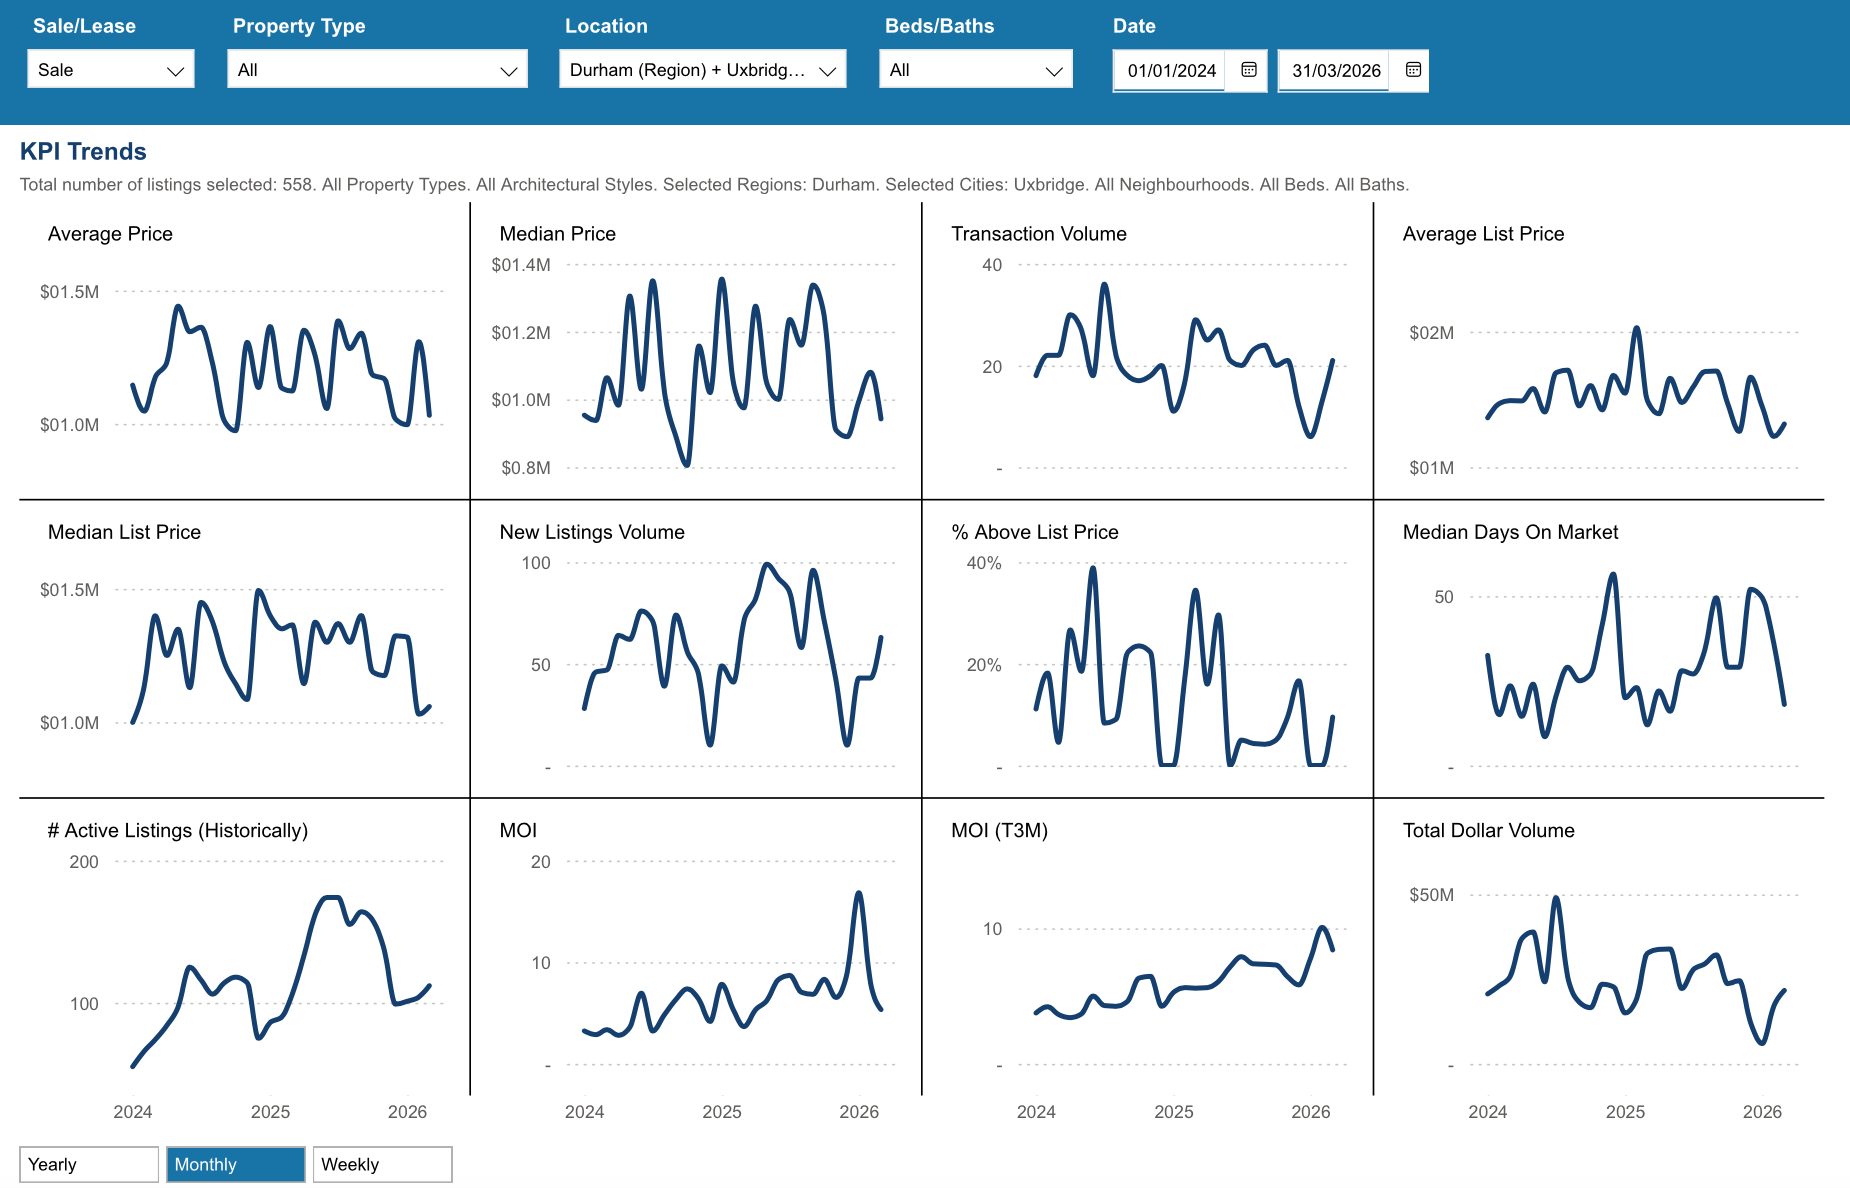
Key Performance Indicators (KPIs) from January 2024 through March 2026 provide a clear snapshot of how the Township of Uxbridge real estate market has evolved across all property types, architectural styles, and home configurations
WATCH OUR MONDAY MARKET MINUTES

*Information is believed to be accurate at time of posting but is not guaranteed to be correct. Some values may vary slightly based on the exact date and time the reports were generated. Market stats are provided by TRREB (Toronto Regional Real Estate Board) and are based on sales for the month of Attached/Row/Townhouses, Condo Apartments, Condo Townhouses, Detached, Detached with Common Elements, Link Homes and Semi-detached. *Some values may vary slightly based on the exact date and time the reports were generated.
Not intended as a solicitation if your property is already listed by another broker. Affiliated real estate agents are independent contractor sales associates, not employees. ©2021 Coldwell Banker. All Rights Reserved. Coldwell Banker and the Coldwell Banker logos are trademarks of Coldwell Banker Real Estate LLC. The Coldwell Banker® System is comprised of company owned offices which are owned by a subsidiary of Realogy Brokerage Group LLC and franchised offices which are independently owned and operated. The Coldwell Banker System fully supports the principles of the Fair Housing Act and the Equal Opportunity Act.
Click below for more reports
Check out our Uxbridge and Scugog Events Pages to keep up to date on whats going on around town. Click the links or scan the Code with your phone to take you directly there.

UXBRIDGE EVENTS

SCUGOG EVENTS


