

 Facebook
 X
X
 Pinterest
 Copy Link

Durham Region Housing September 2026

Each office is independently owned and operated


Housing Market Report for September 2026
Here is the Region of Durham Housing September 2026 report (all housing types), with reports from the Canadian Real Estate Association, and Toronto Regional Real Estate Board included.
This housing report for Durham Region includes the number of new listings, average list price, number of properties sold, average selling price, average days on market and average asking price to selling price ratio for all property types within the Region of Durham.
Scroll to the bottom for links to take you to the housing market reports for Uxbridge, Scugog and Brock.


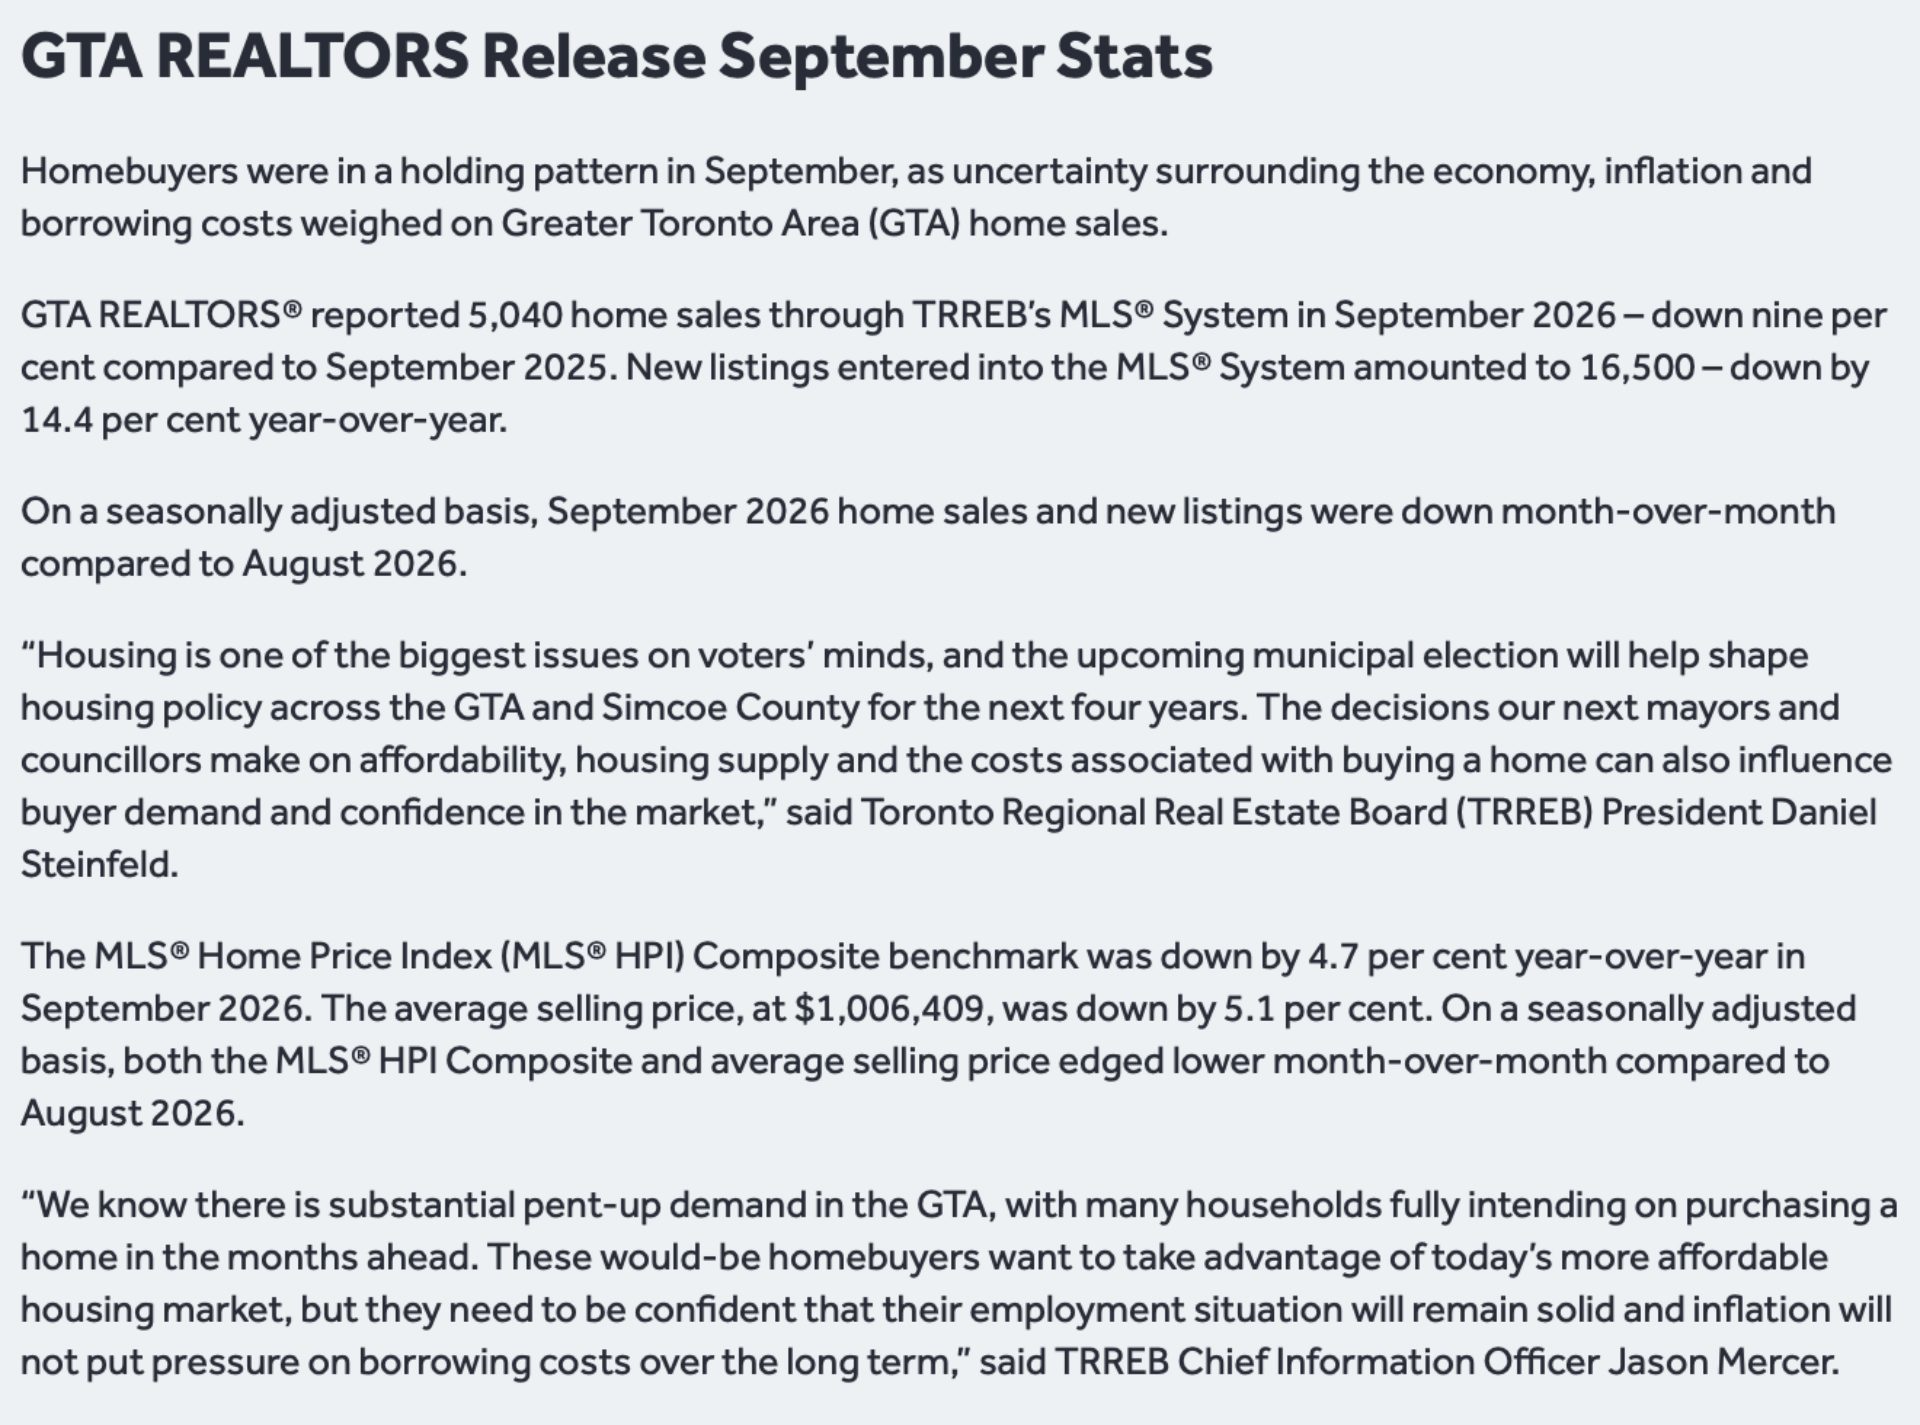
From Toronto Regional Real Estate Board
Please note: The PropTx MLS® System, of which TRREB is a part, has added a number of new client boards over the last year. Many of these boards’ Members trade within the Greater Toronto Area and broader Greater Golden Horseshoe regions. As a result, historic data have been updated to reflect the addition of these boards’ listings and transactions. This means historic data have changed relative to previously published static reports. To view updated historic data, click here.
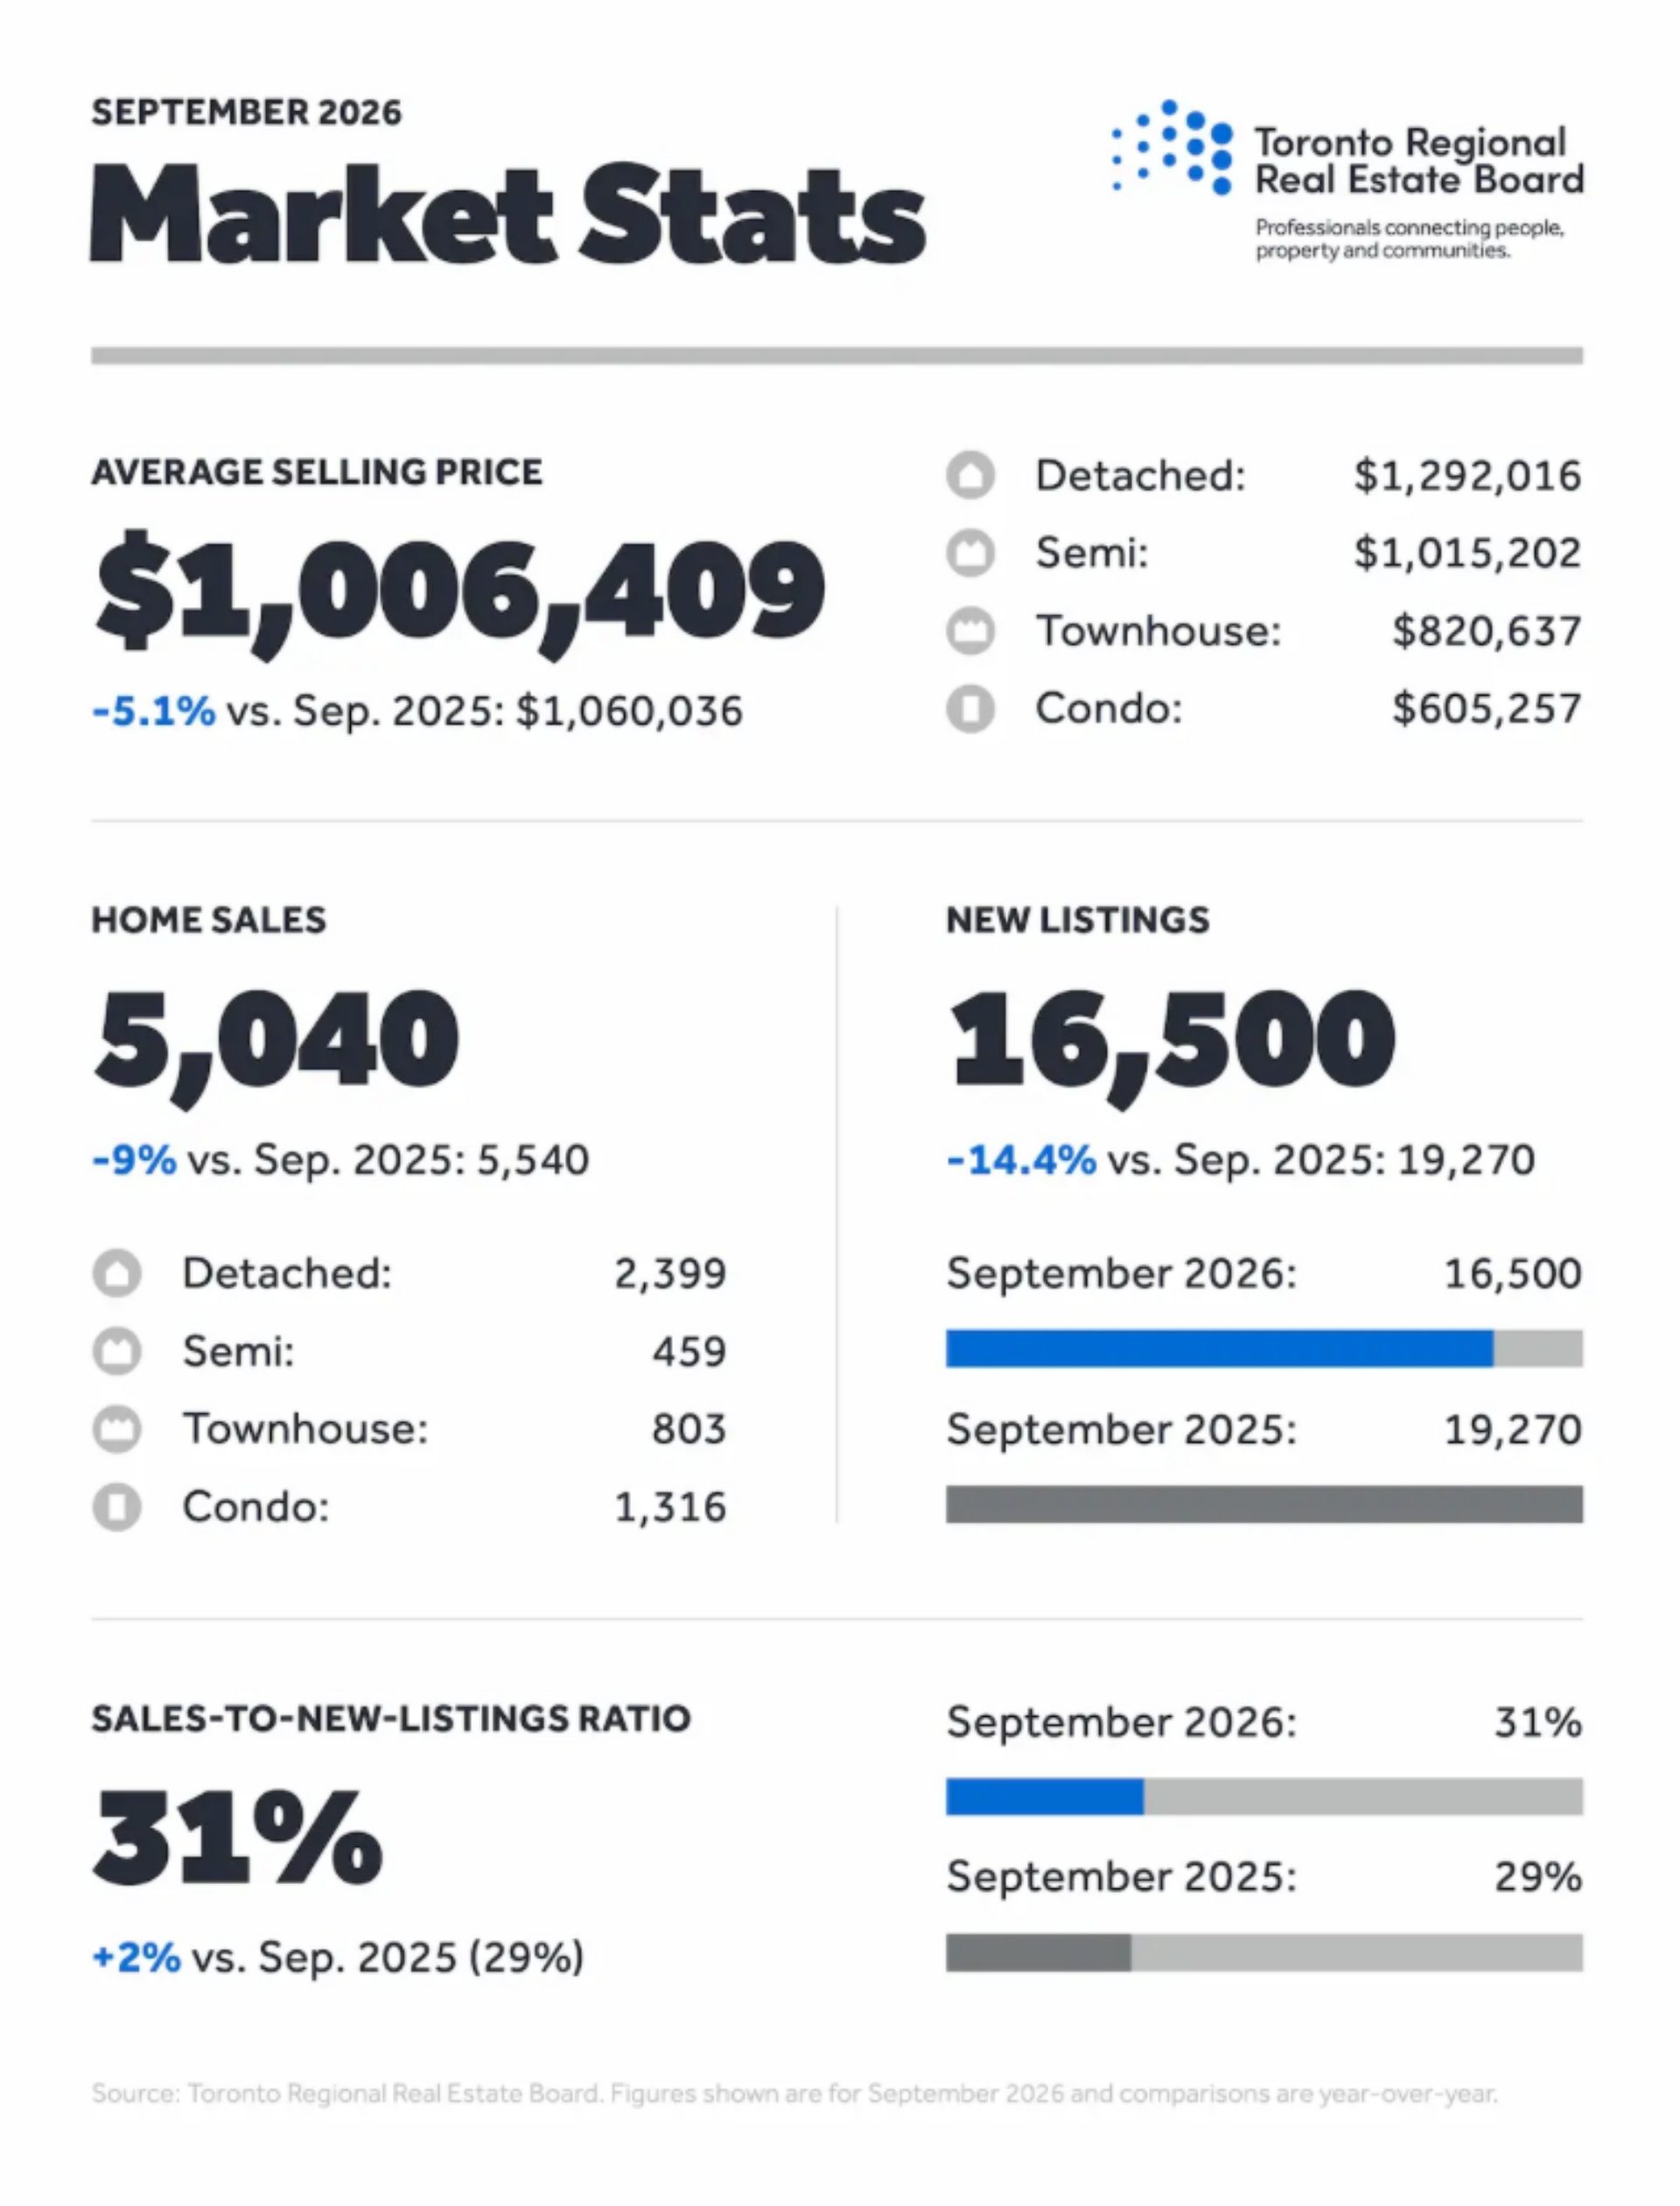
Toronto Regional Real Estate Board – Market Stats At A Glance – September 2026
Read the Toronto Regional Real Estate Board Market Watch Report
Durham Region Real Estate Market Analysis – September 2026
Prices edge higher, but slowing sales and rising inventory shift the market closer to buyer-friendly conditions.
The Durham Region real estate market showed mixed signals in September 2026. While the average selling price increased slightly from August, sales activity continued to slow, homes spent longer on the market, and inventory climbed to its highest level in recent months.
With 4.75 months of inventory, Durham Region remains in balanced market territory, but conditions are moving closer to a buyer’s market as we head further into the fall.
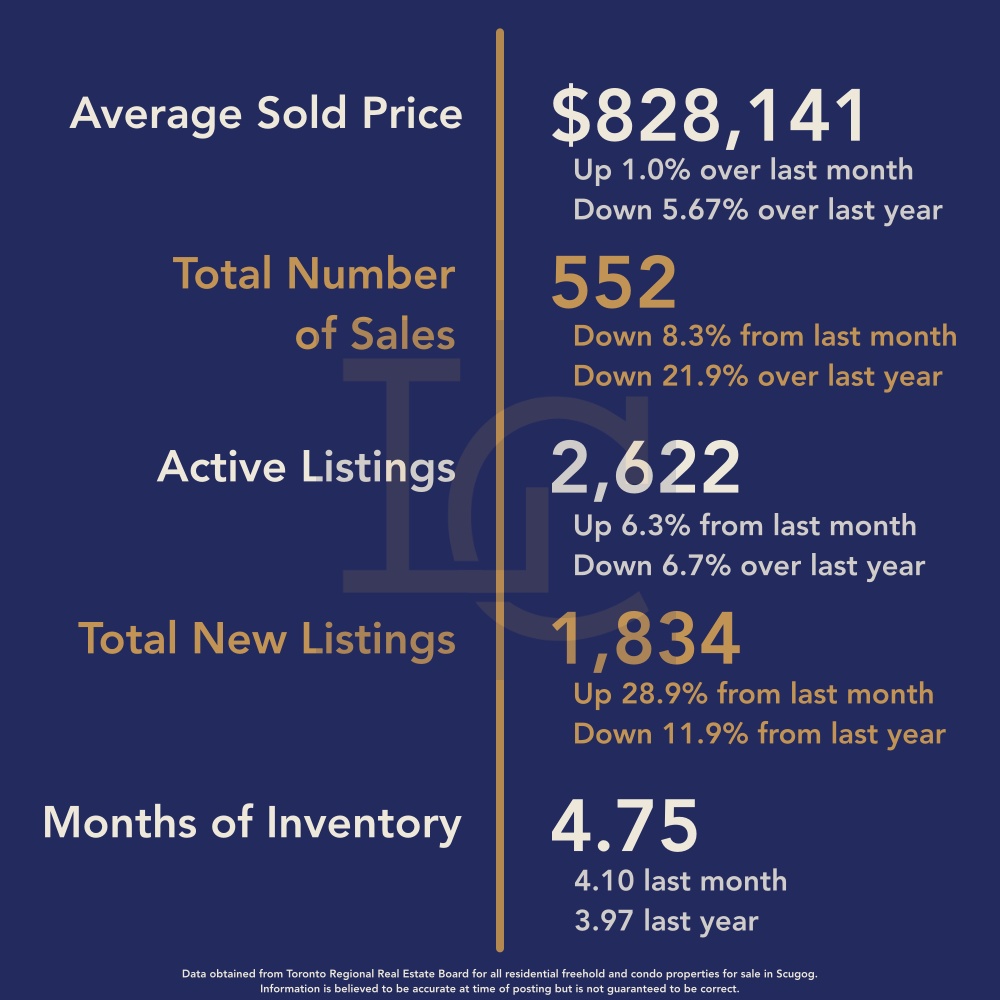
September 2026
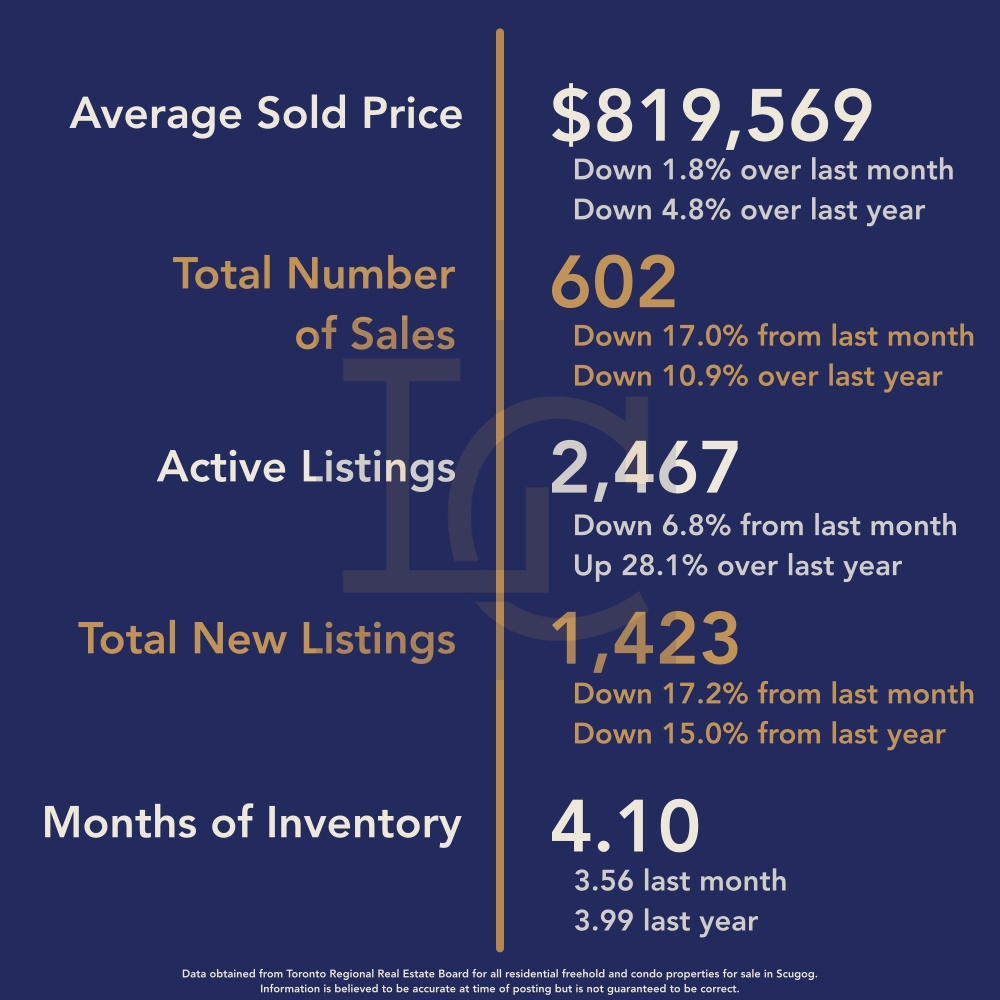
August 2026
Average Selling Price Edges Higher
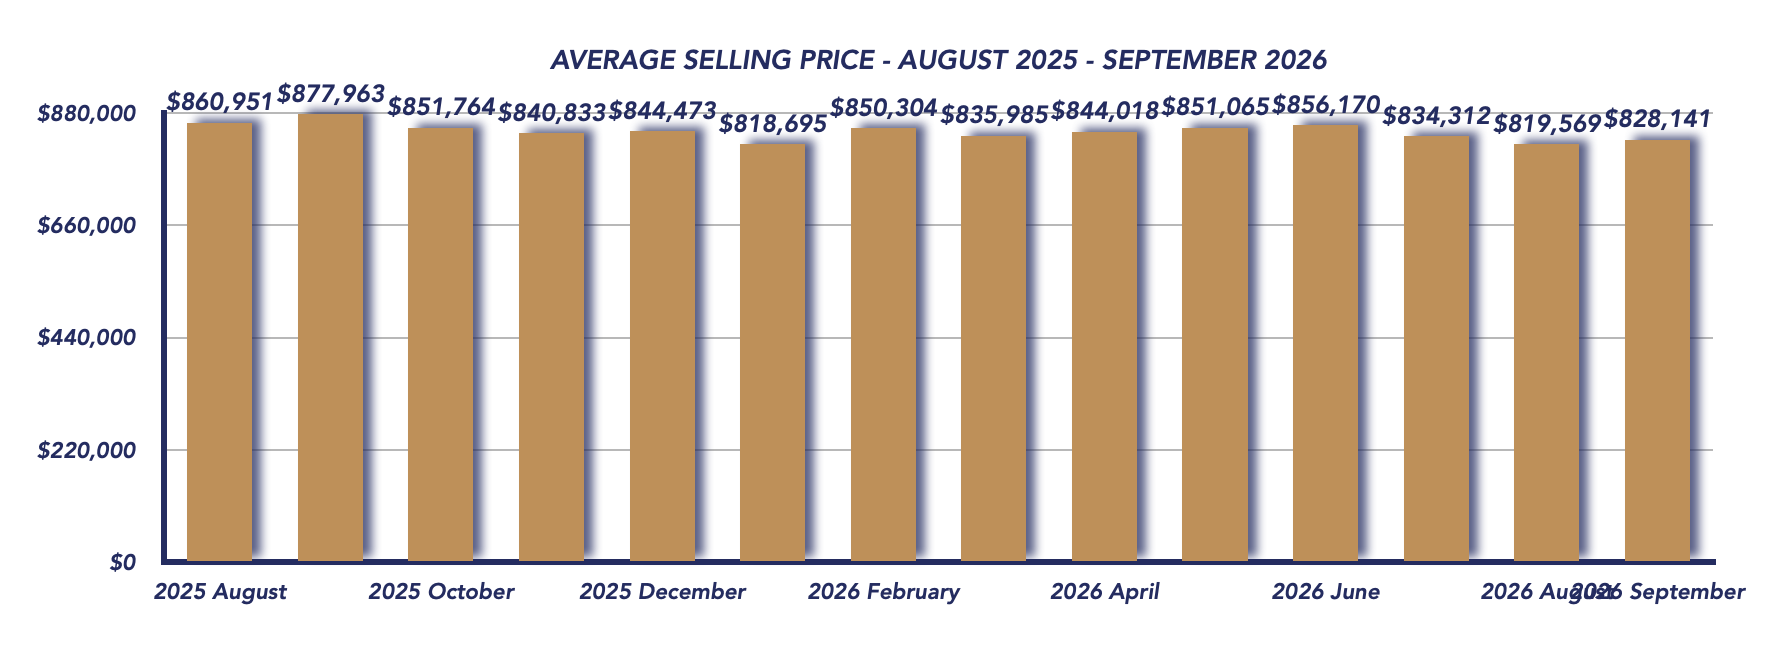
The average selling price in September was $828,141, up 1.0% from August’s $819,569, but still 5.67% below September 2025’s $877,963. After two consecutive months of declining prices in July and August, September brought a modest rebound. While the month-over-month increase is encouraging, the year-over-year decline reminds us that home values remain below where they were at this time last year.
The slight improvement in pricing suggests some stability, but with sales slowing and inventory increasing, it is too early to say whether prices have established a sustained upward trend.
Sale-to-List Price Ratio Remains at 98%
The sale-to-list price ratio held steady at 98%, unchanged from both August 2026 and September 2025. On average, homes continue to sell for approximately 98% of their asking price, indicating that buyers still have room to negotiate.
For sellers, this reinforces the importance of setting a competitive asking price from the beginning. With more properties available and buyers taking longer to make decisions, overpriced listings may struggle to attract offers.
Sales Activity Continues to Slow
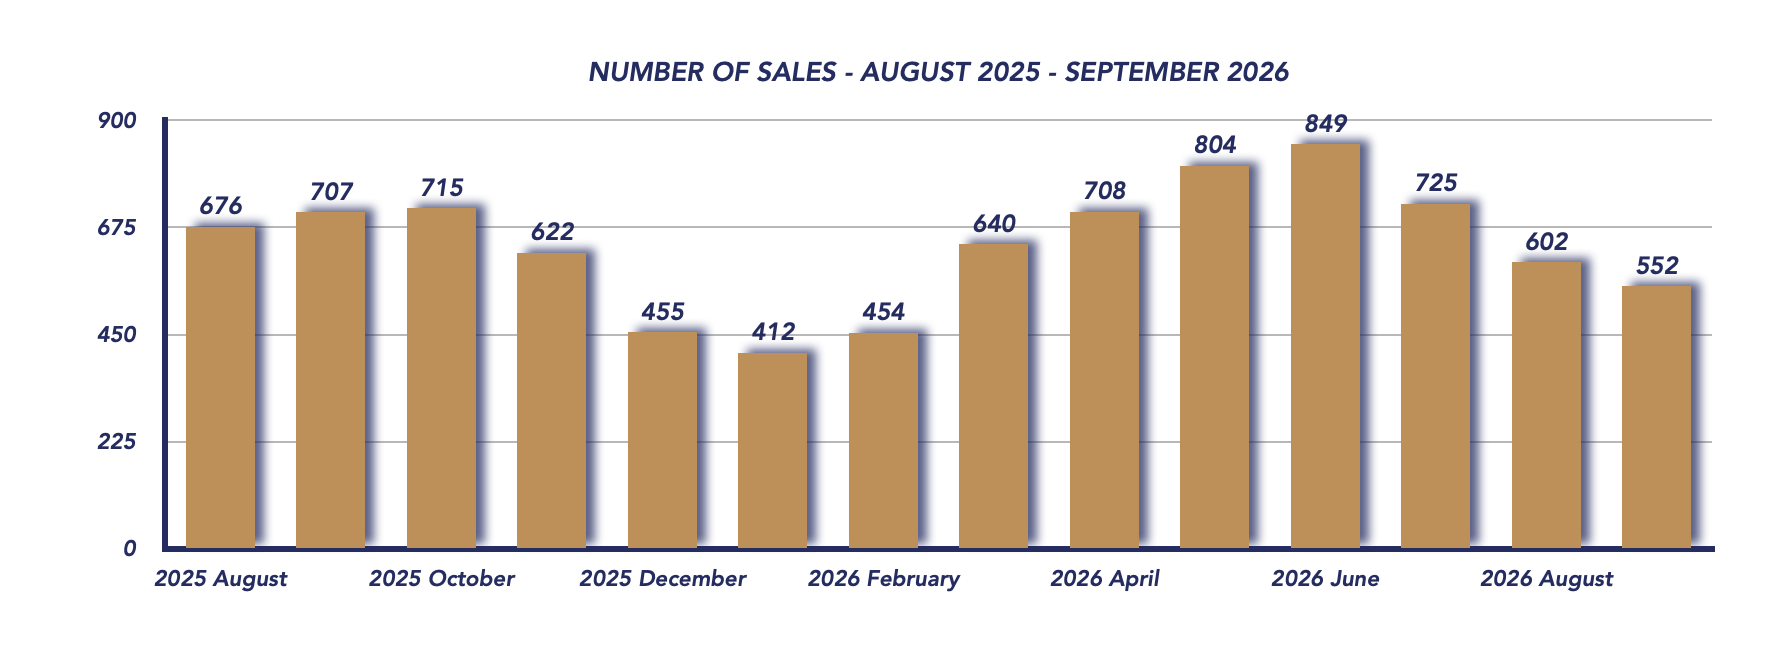
Durham Region recorded 552 sales in September, compared with 602 in August and 707 in September 2025. That represents a decline of approximately 8.3% month-over-month and 21.9% year-over-year. The year-over-year decrease is particularly notable, suggesting that buyer demand remains significantly softer than it was last fall.
September typically brings renewed real estate activity as summer vacations end and buyers return to their routines. However, this year’s numbers suggest that many buyers remain cautious despite having more properties and negotiating opportunities available.
New Listings Increase as the Fall Market Begins
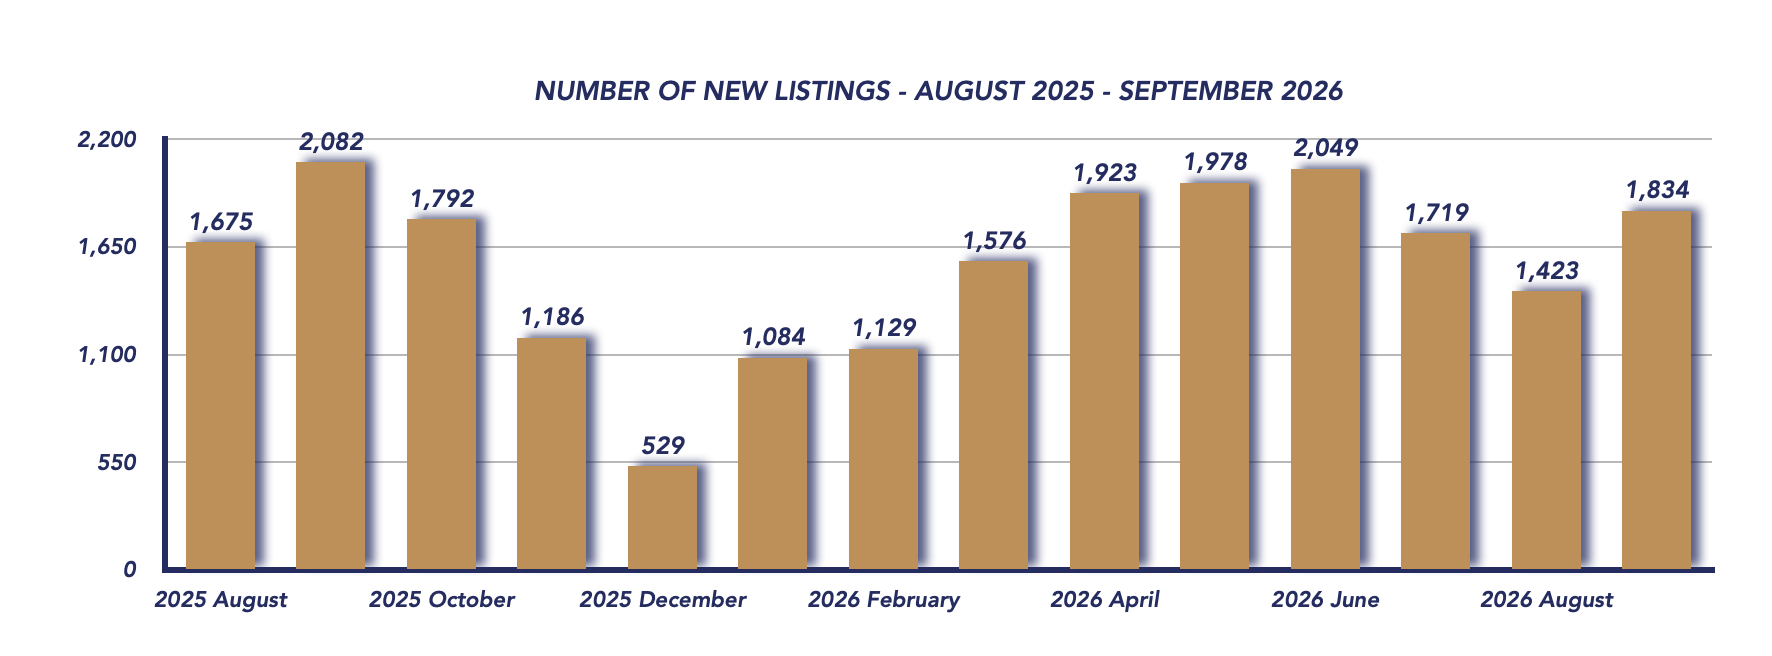
There were 1,834 new listings in September, up from 1,423 in August, but below the 2,082 recorded in September 2025. The increase of approximately 28.9% from August reflects the typical arrival of new inventory during the fall market. However, the combination of rising new listings and declining sales means available inventory is building faster than buyers are absorbing it. For buyers, this can mean greater selection and less pressure to make quick decisions. For sellers, it means increased competition from other properties on the market.
Homes Are Taking Longer to Sell
The average property days on market increased to 48 days, compared with 46 days in August and 46 days in September 2025. Homes are now taking slightly longer to sell than they were both last month and at this time last year. This reflects a market where buyers are more selective and willing to wait for the right property at the right price. For sellers, professional presentation, effective marketing, and realistic pricing are increasingly important to stand out.
Months of Inventory Climbs to 4.75
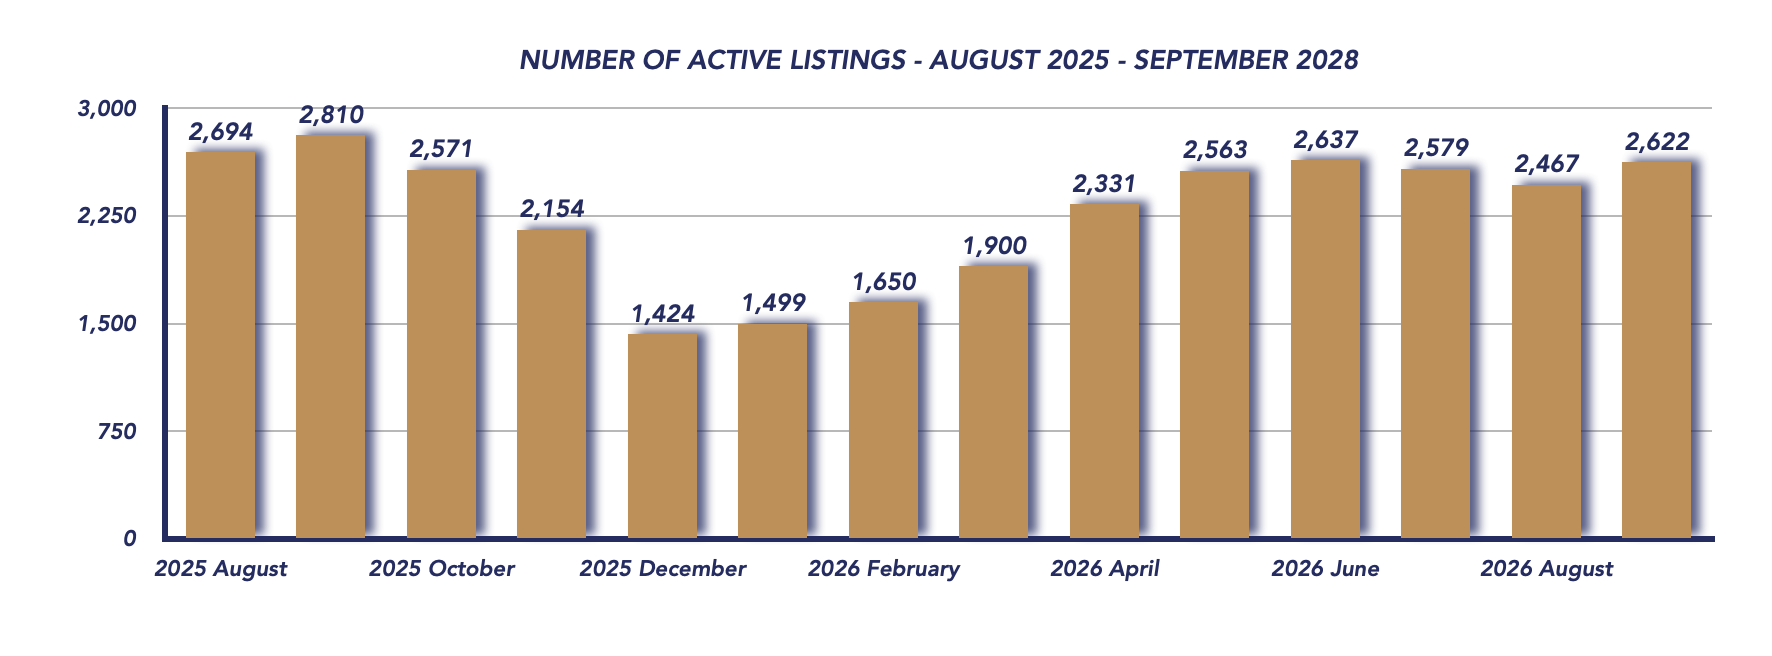
One of the most significant developments in September was the increase in months of inventory to 4.75, up from 4.10 in August and 3.97 in September 2025.This continues the upward trend in inventory we’ve seen since June, when Durham Region had just 3.11 months of supply. Although the market remains balanced, 4.75 months of inventory brings Durham closer to buyer’s market territory. With fewer sales and more properties available, buyers are gaining additional leverage. If inventory continues to rise without a corresponding improvement in sales, conditions could shift further in their favour.
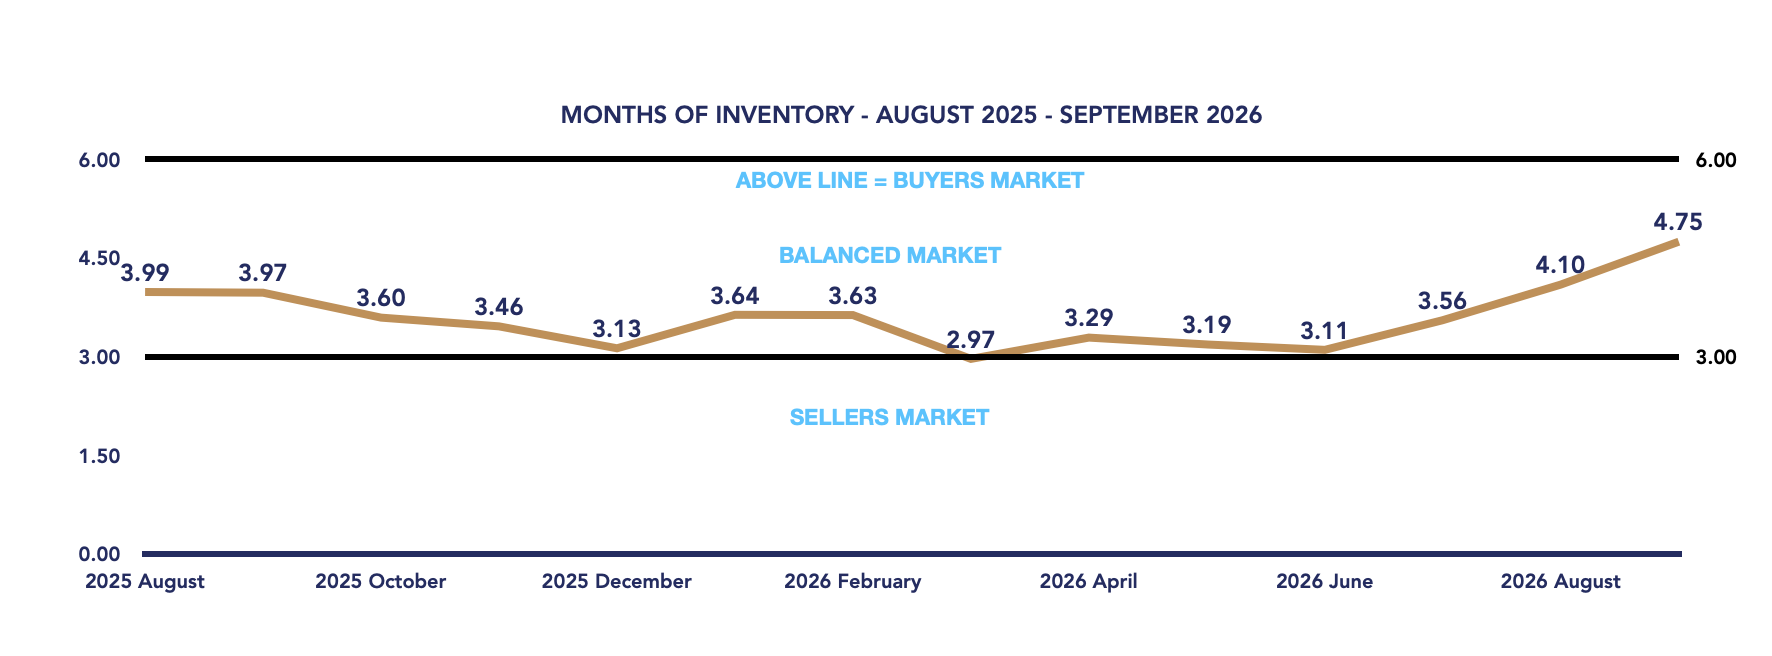
Market Outlook: Is Durham Moving Toward a Buyer’s Market?
September’s numbers paint an interesting picture. On one hand, average selling prices increased slightly, suggesting that home values may be finding some stability after the summer declines. On the other hand, sales dropped significantly compared with last year, homes are taking longer to sell, and inventory continues to build. The biggest question heading into the remainder of the fall market is whether buyer activity will strengthen enough to absorb the additional supply. If sales remain subdued while inventory continues to rise, Durham Region could move closer to a buyer’s market. For now, we’re still in balanced territory, but the market is clearly offering buyers more choice, time, and negotiating flexibility than it did earlier this year.
What This Means for Buyers vs. Sellers
For Buyers
September’s market offers several advantages for buyers:
- More inventory means greater selection.
- Longer days on market provide additional time to evaluate properties.
- A 98% sale-to-list ratio suggests opportunities to negotiate.
- Slower sales activity may give buyers more flexibility when discussing price and conditions.
However, desirable properties that are priced correctly can still attract attention. Buyers should focus on finding the right property rather than assuming every seller will be willing to negotiate significantly.
For Sellers
For sellers, September reinforces the importance of having a strong strategy.
With inventory rising and sales slowing, buyers have more options and are becoming increasingly selective.
Accurate pricing, strong presentation, and effective marketing are essential to attracting serious buyers.
Sellers should also be prepared for longer selling times and remain flexible when negotiating offers.
The Bottom Line
The Durham Region housing market in September 2026 remains balanced, but momentum is shifting toward buyers.
Average prices increased modestly from August, offering a positive sign after the summer declines. However, lower sales, longer selling times, and rising inventory indicate that buyer demand has not kept pace with the available supply.
As we move through the final months of 2026, we’ll be watching whether inventory continues to build or whether renewed buyer activity brings the market back toward a more even balance.
Whether you’re buying, selling, or simply keeping an eye on the market, understanding these changing conditions is essential to making informed real estate decisions.
Key Performance Indicators (KPIs) from January 2024 through September 2026 provide a clear snapshot of how the Durham Region real estate market has evolved across all property types, architectural styles, and home configurations
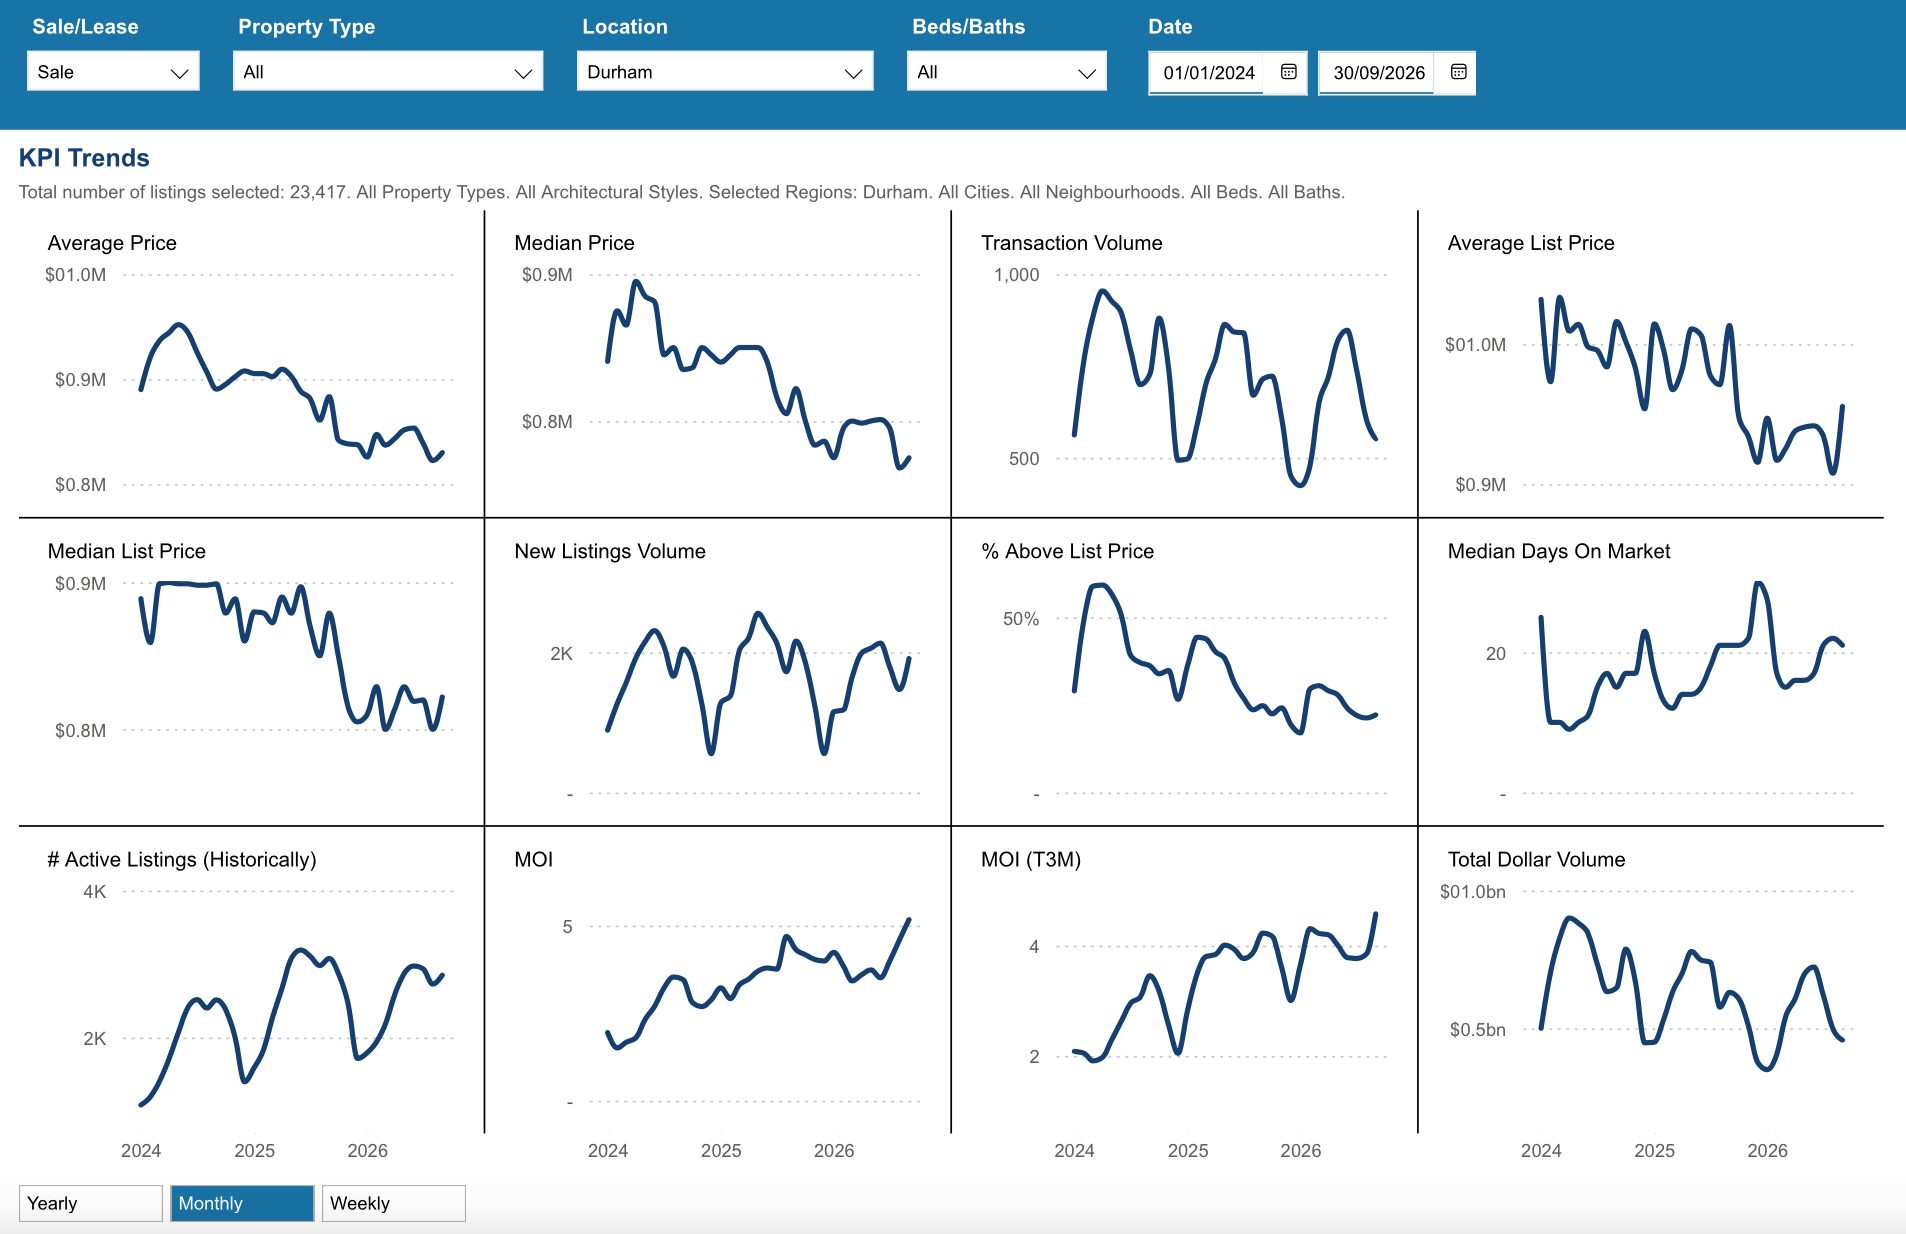
*Information is believed to be accurate at time of posting but is not guaranteed to be correct. Some values may vary slightly based on the exact date and time the reports were generated. Market stats are provided by TRREB (Toronto Regional Real Estate Board) and are based on sales for the month of Attached/Row/Townhouses, Condo Apartments, Condo Townhouses, Detached, Detached with Common Elements, Link Homes and Semi-detached. *Some values may vary slightly based on the exact date and time the reports were generated.
Not intended as a solicitation if your property is already listed by another broker. Affiliated real estate agents are independent contractor sales associates, not employees. ©2021 Coldwell Banker. All Rights Reserved. Coldwell Banker and the Coldwell Banker logos are trademarks of Coldwell Banker Real Estate LLC. The Coldwell Banker® System is comprised of company owned offices which are owned by a subsidiary of Realogy Brokerage Group LLC and franchised offices which are independently owned and operated. The Coldwell Banker System fully supports the principles of the Fair Housing Act and the Equal Opportunity Act.
Click below for more reports
Check out our Uxbridge and Scugog Events Pages to keep up to date on whats going on around town. Click the links or scan the Code with your phone to take you directly there.

UXBRIDGE EVENTS

SCUGOG EVENTS



