
 Facebook
 X
X
 Pinterest
 Copy Link
Monday Market Minute January 5

Monday Market Minute – Uxbridge & Scugog Real Estate Update
Week of December 28 to January 3
The final week of the year brought a seasonal slowdown to the real estate markets in both the Township of Uxbridge and the Township of Scugog. With the holidays in full swing, activity across both communities remained quiet—something we expect to see every year at this time.
Weekly Real Estate Market Minute for the Townships of Uxbridge and Scugog
Uxbridge Market Snapshot
Uxbridge recorded no new listings during the week, unchanged from the previous week. One property that had been previously listed returned to the market.
There were no price adjustments, reflecting limited activity and fewer properties actively competing for buyer attention.
On the sales side, there were no conditional sales, down from two the week before, while one property sold firm, matching last week’s total.
Active inventory continued to decline, with 88 active listings, down from 100 the previous week. This drop highlights how quickly inventory tightens during the holiday season.
Scugog Market Snapshot
In Scugog, the market remained calm but saw slightly more movement.
There was one new listing, consistent with last week, along with five previously listed properties coming back to the market.
Price adjustments increased to three properties, up from zero the week before, as some sellers repositioned ahead of the new year.
Sales activity included one conditional sale, unchanged from last week, and two firm sales, up from one.
Active listings declined again, landing at 76 properties, down from 89, continuing the trend of shrinking inventory.
Looking Ahead
Overall, this was a typical year-end market, marked by fewer listings, fewer sales, and tightening inventory across both townships. As we move into January, activity is expected to gradually pick up as buyers and sellers return with fresh plans and new goals for the year ahead.
If you’re considering buying or selling in Uxbridge or Scugog in 2026, now is an excellent time to start planning and preparing.
Thank You For Watching
The Monday Market Minute January 5
Check out our Uxbridge and Scugog Events Pages to keep up to date on whats going on around town. Click the links or scan the Code with your phone to take you directly there.

UXBRIDGE EVENTS

SCUGOG EVENTS

Monday Market Minute December 15

Monday Market Minute – Uxbridge & Scugog Real Estate Update
Week of December 7 to December 13
As we move deeper into December, the real estate markets in Uxbridge and Scugog continue to show seasonal trends—fewer new listings, tightening inventory, and steady buyer activity. Here’s a breakdown of what happened across both townships during the week of December 7 to December 13.
Weekly Real Estate Market Minute for the Townships of Uxbridge and Scugog
As we move deeper into December, the real estate markets in Uxbridge and Scugog continue to show seasonal trends—fewer new listings, tightening inventory, and steady buyer activity. Here’s a breakdown of what happened across both townships during the week of December 7 to December 13.
Uxbridge Market Snapshot
Uxbridge saw an increase in new listings this week, with 4 properties coming to market, up from just 1 last week. In addition, 3 previously listed homes returned to the market, giving buyers a few more options to consider.
Seller activity remained steady with 4 price adjustments, slightly higher than last week’s total of 3. This indicates that sellers are continuing to position their homes competitively as year-end approaches.
On the sales side:
-
1 property sold conditionally, down from 5 the previous week
-
5 properties sold firm, an increase from 4 last week
Active inventory dropped significantly to 117 properties, down from 130, continuing the trend of tightening supply in the Uxbridge market.
Scugog Market Snapshot
Scugog experienced a quieter week for new listings, with just 1 new property added to the market, compared to 5 last week. However, 5 previously listed homes were brought back to market, helping to maintain some balance for buyers.
Price adjustments slowed, with 6 this week, down from 9 the week before.
Sales activity remained consistent:
-
3 properties sold conditionally, down from 5 last week
-
4 properties sold firm, just slightly lower than last week’s 5
Total active listings declined again to 100 properties, down from 107, reinforcing the continued reduction in available inventory as the year comes to a close.
What This Means Moving Forward
Both Uxbridge and Scugog are reflecting typical December market conditions—lower inventory levels and fewer new listings, but continued movement among motivated buyers and sellers. For sellers, reduced competition can be an advantage, while buyers may benefit from more focused negotiations during the holiday season.
If you’re thinking about buying or selling as we head into the new year, understanding these trends can help you plan your next move with confidence.
For more local market insights or personalized advice, feel free to reach out—we’re always happy to help.
Thank You For Watching
The Monday Market Minute December 15
Check out our Uxbridge and Scugog Events Pages to keep up to date on whats going on around town. Click the links or scan the Code with your phone to take you directly there.
UXBRIDGE EVENTS
SCUGOG EVENTS
Port Perry Train Station

A Look Back at the Port Perry Train Station: From Railway Hub to Relocated Relic
Where Palmer Park now stretches along the east side of Water Street—just south of the iconic Grain Elevator—once stood one of Port Perry’s most important early landmarks: the Port Perry Train Station. Though the station itself has long since vanished from its original site, its legacy lives on in the shaping of local industry, commerce, and community growth.
The Arrival of the Railway (1871)
Port Perry’s first train station was built in 1871 by the Port Whitby and Port Perry Railway. On November 23 of that year, the first train steamed into town, marking a transformative moment in local history. The original building was modest—a small rectangular structure with a pitched “lean-to” roof that offered only minimal shelter to passengers waiting on the exposed platform.
At the time, the rails terminated in Port Perry. But with business opportunities growing, an extension to Lindsay was completed in 1877. This expansion led to the rebranding of the railway as the Whitby, Port Perry & Lindsay Railway.

The first train station in Port Perry built in 1871. Photo credit The Toronto Railway Historical Association.
A Growing Community and a Busy Line
By 1886, the railway had become a vital part of everyday life in Port Perry. Six trains were stopping in the community each day—an impressive schedule that spoke to the region’s economic growth and the importance of Port Perry as a transportation link for goods and residents.
A New Station for a Growing Town (1888–1889)
As traffic increased, plans were set in motion for a larger, more functional station. Construction began in August 1888, requiring a shift of the rail line itself—moving it 25 feet to the east. By June 1889, the new station was complete and opened to passengers.
This new building was far more substantial than its predecessor. A two-storey wood-frame structure with a classic gable roof, it featured a distinctive rectangular operator’s window overlooking the tracks. The upper floor served as living quarters for the station agent, while the main level housed the essential station facilities. A single-storey freight shed extended from the main building, reflecting the importance of shipping and goods movement in the area.

The second station in Port Perry was built in 1889. Photo credit: The Toronto Railway Historical Association.
Decline of Passenger Rail (1937)
Passenger service to Port Perry came to an end in 1937. As automobiles became more affordable and road networks improved, train ridership declined across the country. The economic pressures of the Great Depression only accelerated this downward trend.
The War Effort and the end of the Line (1942)
Not long after the last passenger trains left Port Perry, the world entered the turmoil of the Second World War. Steel became a critical resource, and the rails were lifted and melted down to support wartime production. By 1942, all railway operations in Port Perry had ceased.
A Building with a Second Life
Although the trains were gone, the station building itself survived—just not where it originally stood. After closing, it was moved across to the west side of Water Street, behind what is now 166 Water Street. For many years, the relocated structure housed various commercial ventures, including a well-remembered flower shop.
Over time, the building underwent multiple modifications and renovations. Today, it is generally unrecognizable from its historic form—but its bones, and its story, remain woven into the fabric of downtown Port Perry.
A Quiet Legacy
Though the station is no longer in its original location and the tracks have long been removed, the railway’s impact on Port Perry is undeniable. It helped shape the early economic landscape, connected the community to the wider region, and played a crucial role in the development of the town residents know and love today.
Source and Photo Credits:
The Toronto Railway Historical Association
Enjoy more history in our blog
Uxbridge Housing November 2025

Uxbridge Housing November 2025

Each office is independently owned and operated
![]()

![]()
Housing Market Report for Novmeber 2025
Here is the Township of Uxbridge Housing November 2025 report (all housing types), with reports from the Canadian Real Estate Association, and Toronto Regional Real Estate Board included.
This housing report for Durham Region includes the number of new listings, average list price, number of properties sold, average selling price, average days on market and average asking price to selling price ratio for all property types within the Region of Durham.
Scroll to the bottom for links to take you to the housing market reports for Durham Region, Scugog and Brock.
![]()
![]()
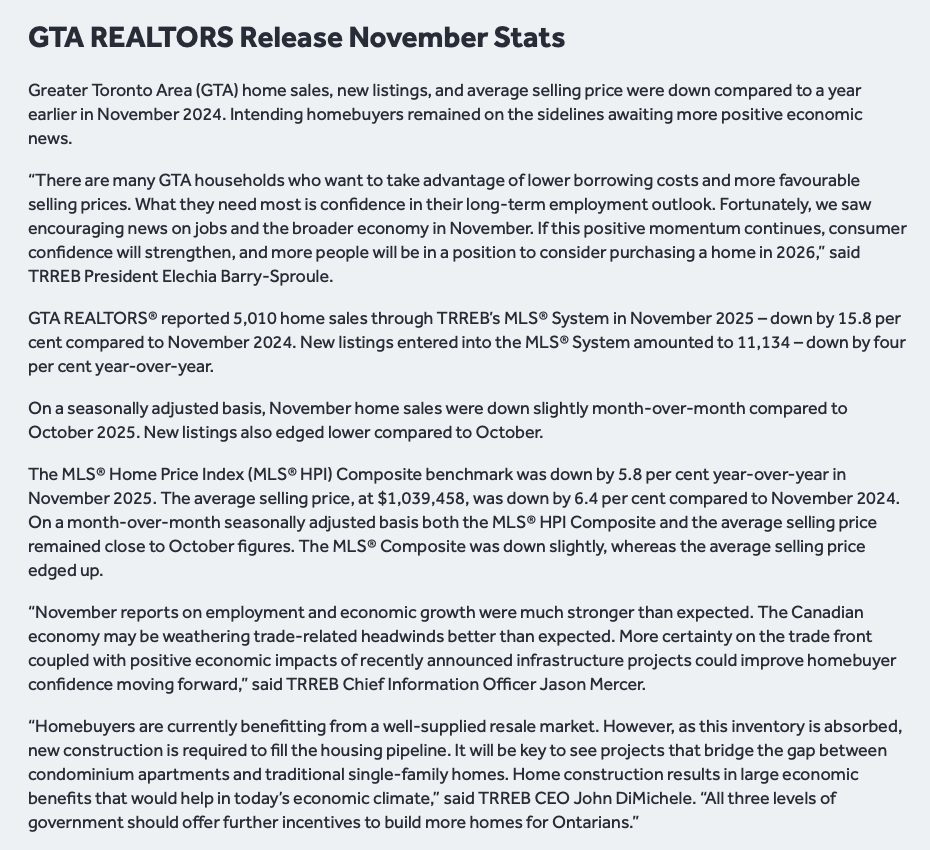
Please note: The PropTx MLS® System, of which TRREB is a part, has added a number of new client boards over the last year. Many of these boards’ Members trade within the Greater Toronto Area and broader Greater Golden Horseshoe regions. As a result, historic data have been updated to reflect the addition of these boards’ listings and transactions. This means historic data have changed relative to previously published static reports. To view updated historic data, click here.
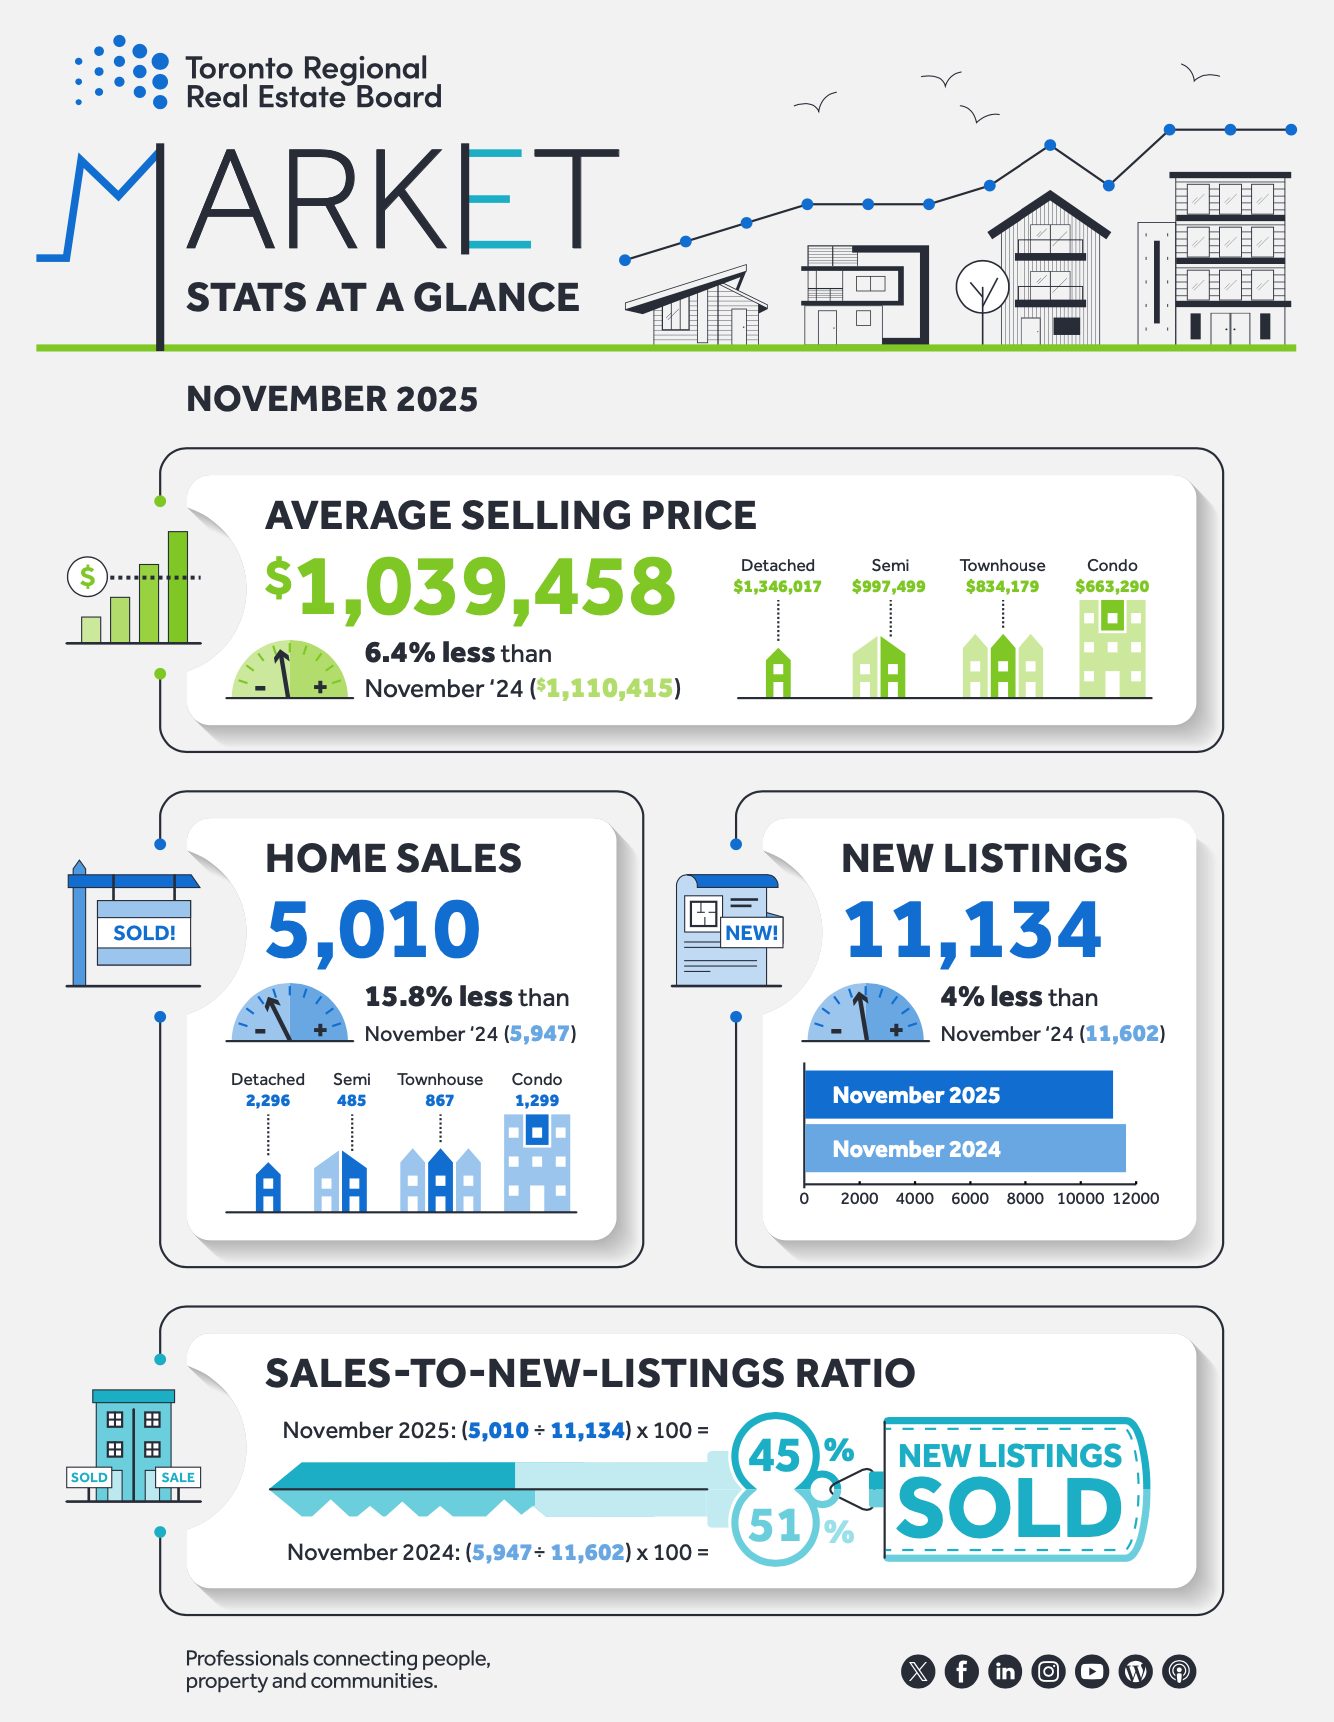
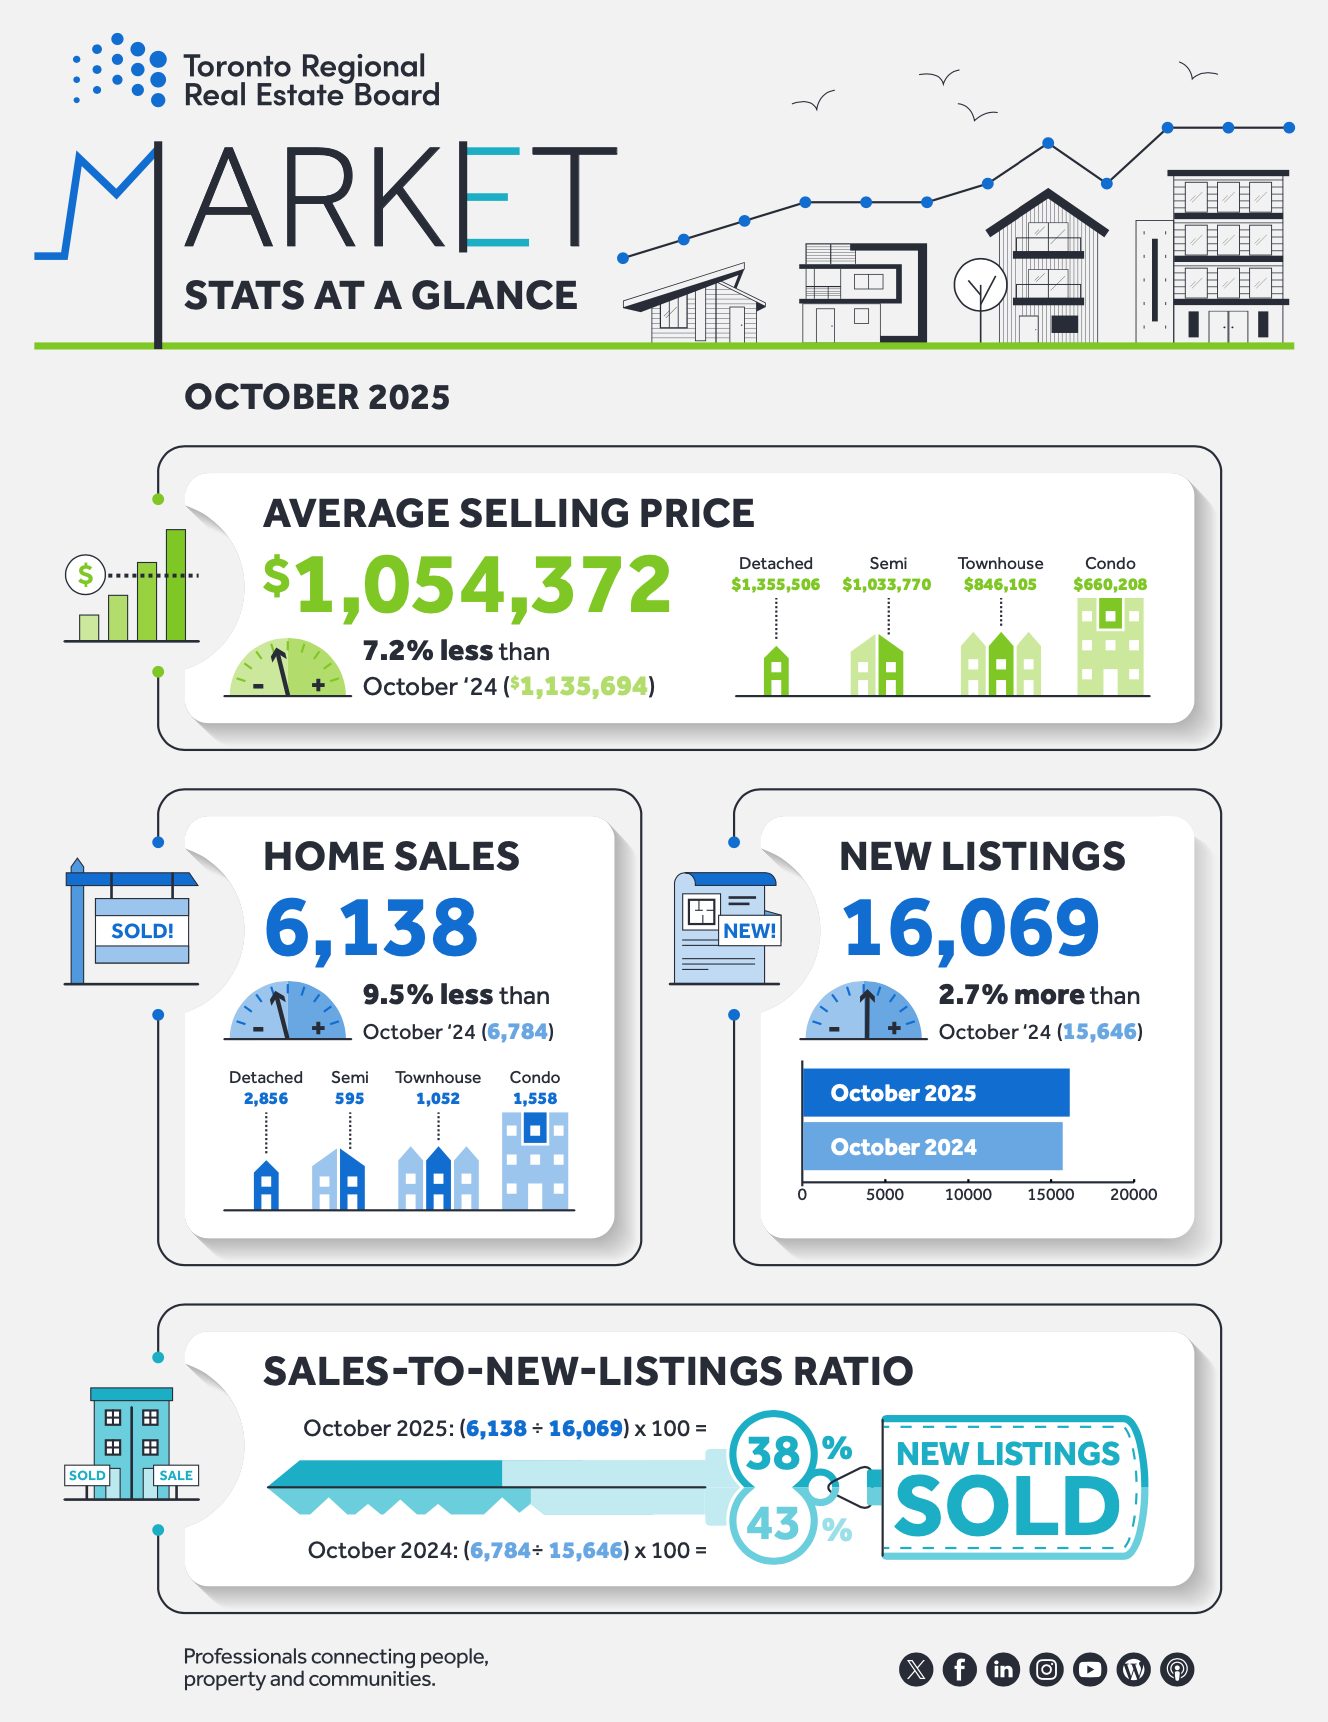
Toronto Regional Real Estate Board – Market Stats At A Glance – November 2025
Read the Toronto Regional Real Estate Board Market Watch Report
![]()
Uxbridge Township Real Estate Market Analysis – November 2025
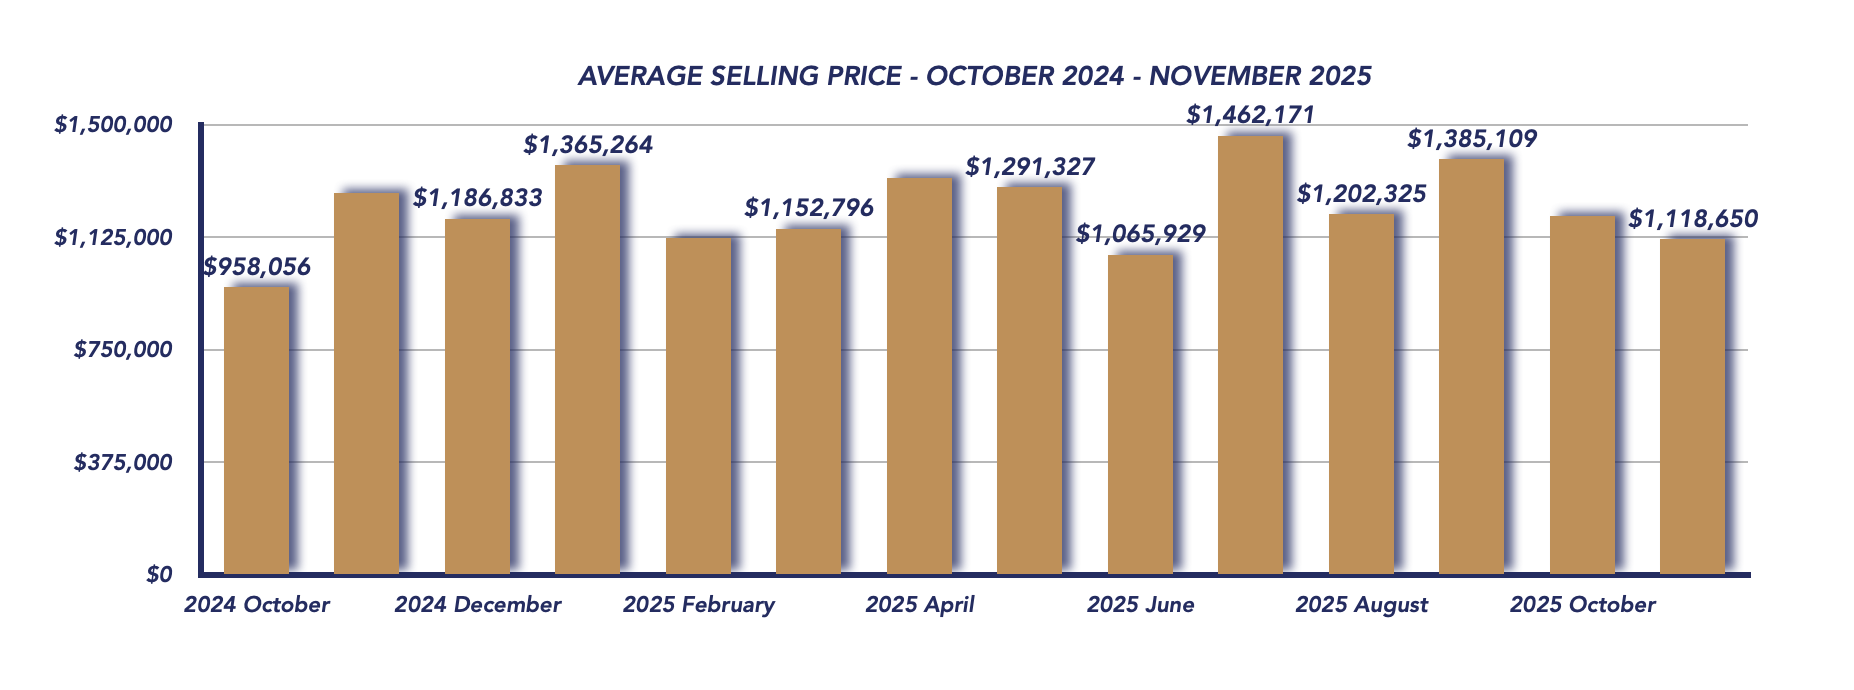
The Uxbridge real estate market continued its late-year adjustment in November 2025, with the average sale price declining to $1,118,650. This represents a 6.4% decrease from October’s $1,195,573 and a 12.1% decline from November 2024’s $1,271,969. While the average price fell, the change is closely tied to shifts in the types of homes sold, rather than a broad drop in property values.
November 2025

October 2025
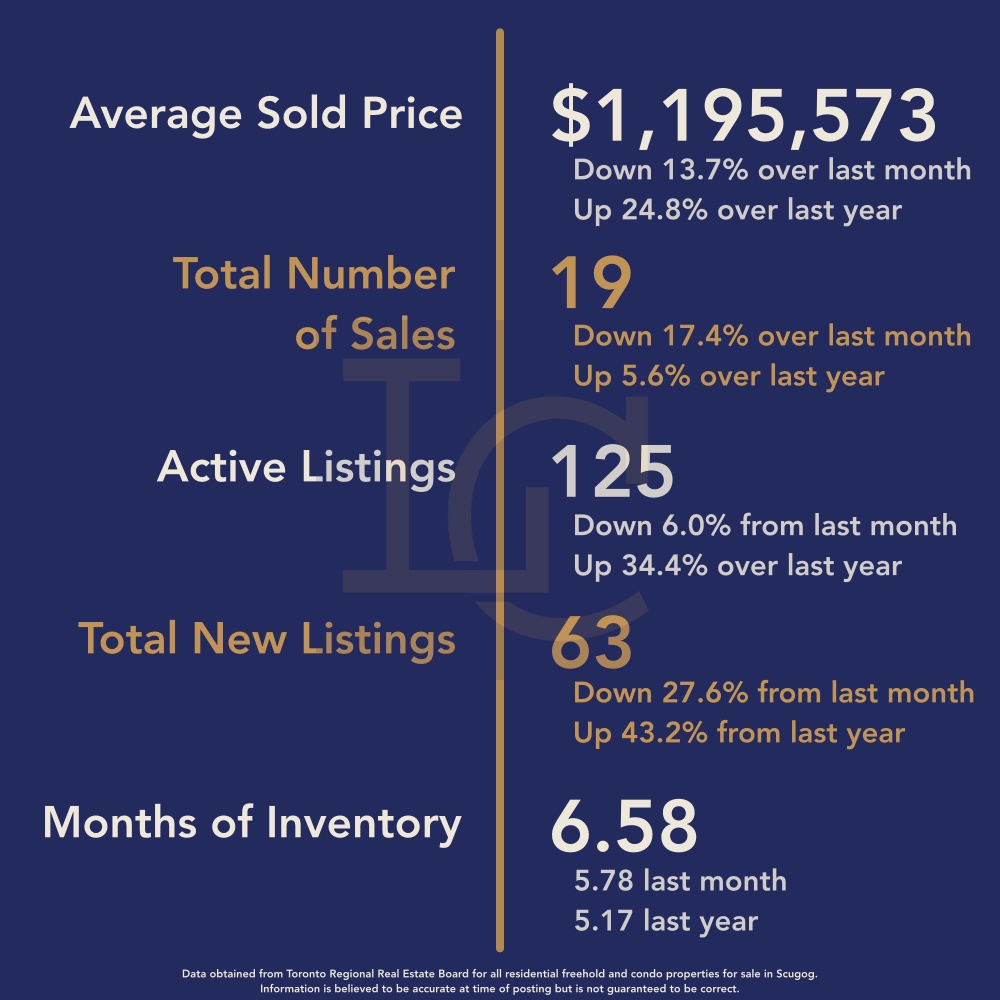
In October, sales were spread across a wide range of price points, with only one property selling above $2 million. In contrast, November saw three sales over $2 million, yet a heavier concentration of lower-priced homes—including 12 properties under $1 million and four under $700,000—ultimately pulled the average down. This demonstrates how a month’s sales mix can significantly influence the overall numbers.
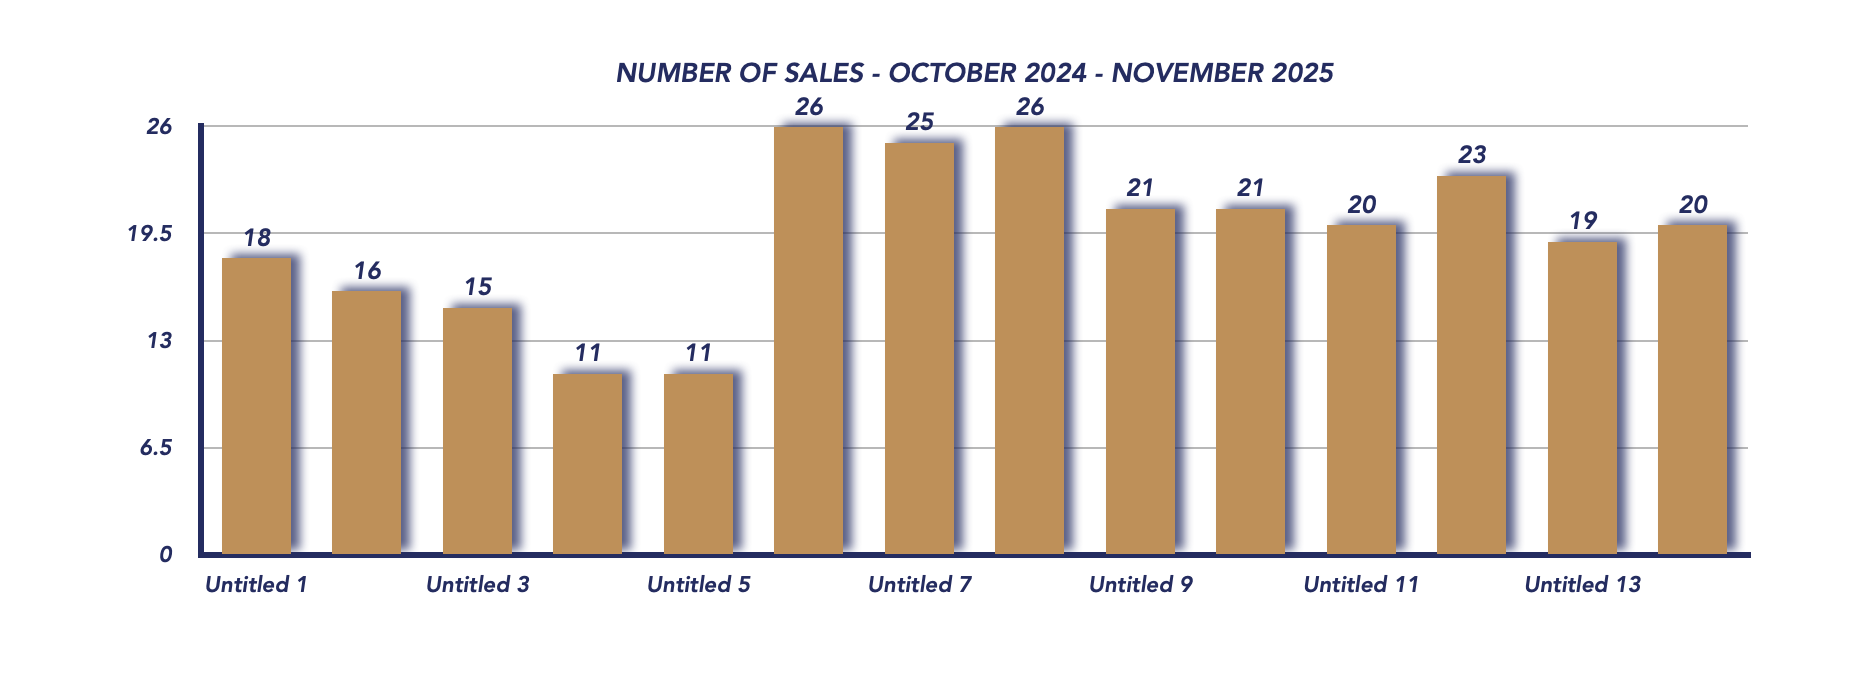
Sales Activity
Sales activity showed a modest improvement, with 20 homes sold in November, up from 19 in October and considerably higher than the 16 sales recorded in November 2024. This increase suggests that despite economic uncertainties and seasonal slowdowns, buyer demand remains steady, particularly in the lower-price categories.
Sale-to-List Price Ratio
The sale-to-list price ratio rose slightly to 97%, compared to 96% in October, indicating stronger alignment between seller expectations and buyer offers. Even with downward pressure on prices in some segments, properties are still selling close to asking—especially when priced competitively.
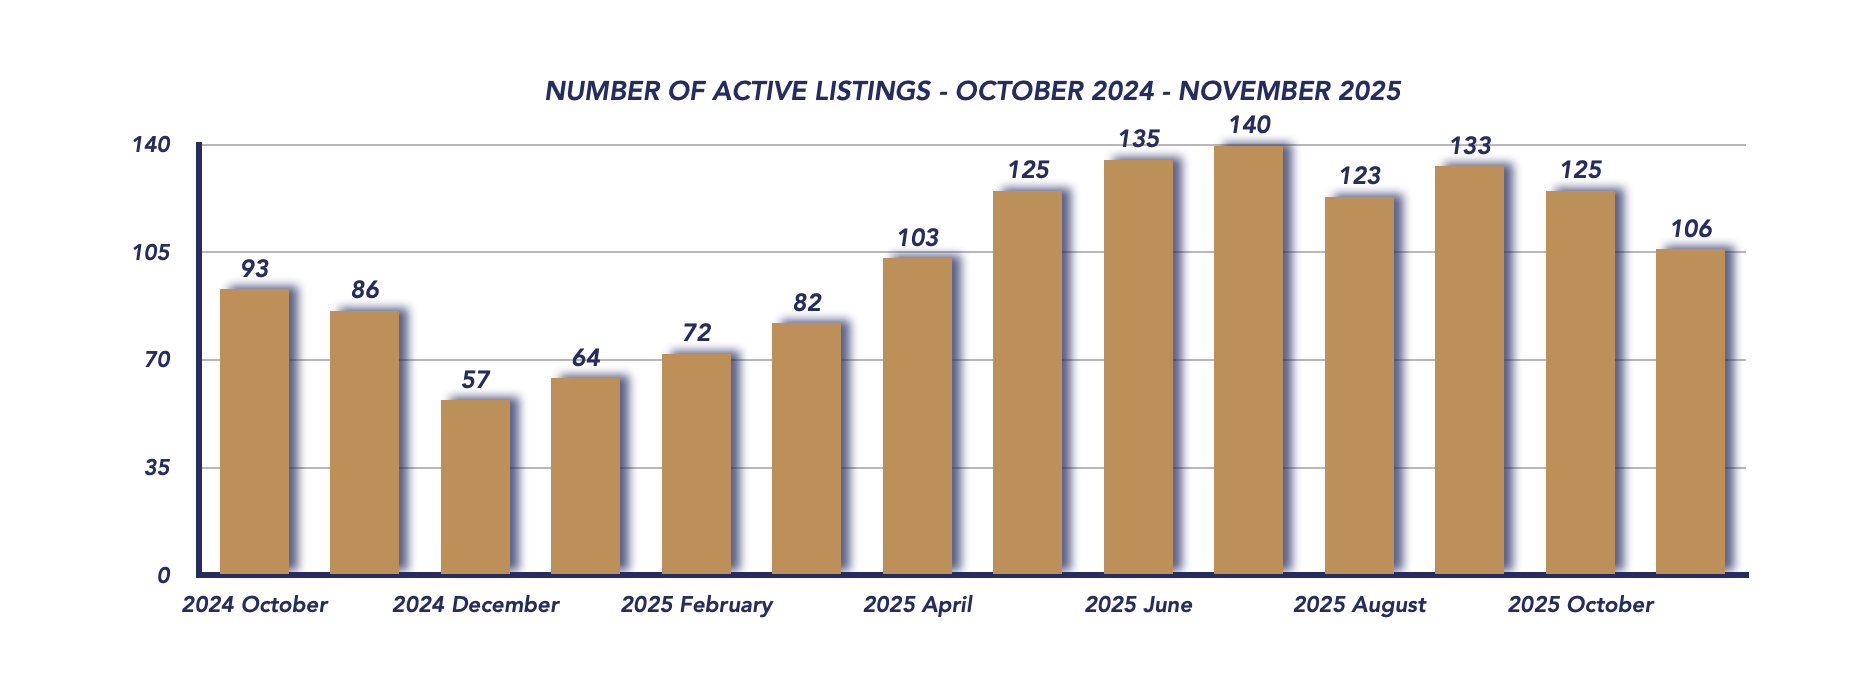
Active Listings
Active listings dropped to 106, down from 125 in October, though notably higher than the 86 listings reported this time last year. This decline reflects a typical seasonal tapering, yet the overall inventory remains comfortable, offering buyers more variety than in late 2024.
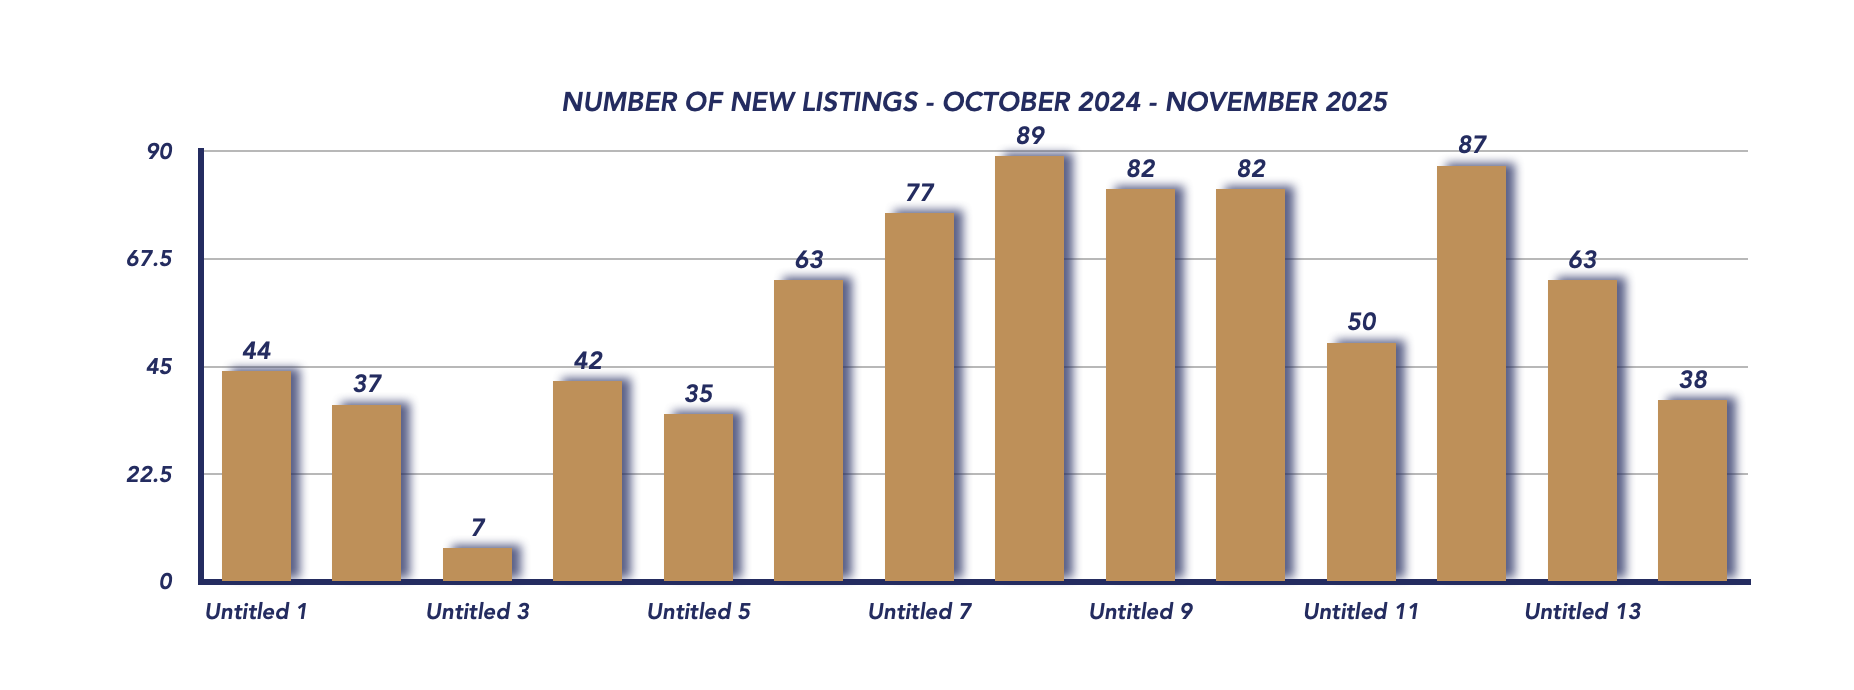
New Listings
New inventory slowed significantly, with only 38 new listings in November, compared to 63 in October. This number is nearly identical to the 37 new listings in November 2024, suggesting consistent seller behaviour year over year. Seasonal patterns—and perhaps market hesitation—are contributing to this pullback in new supply.
Days on Market
Homes spent an average of 68 days on the market, slightly higher than October’s 64 days, reinforcing the current slower-paced environment. Buyers continue to take their time evaluating options, and longer DOM is typical during late fall and early winter.
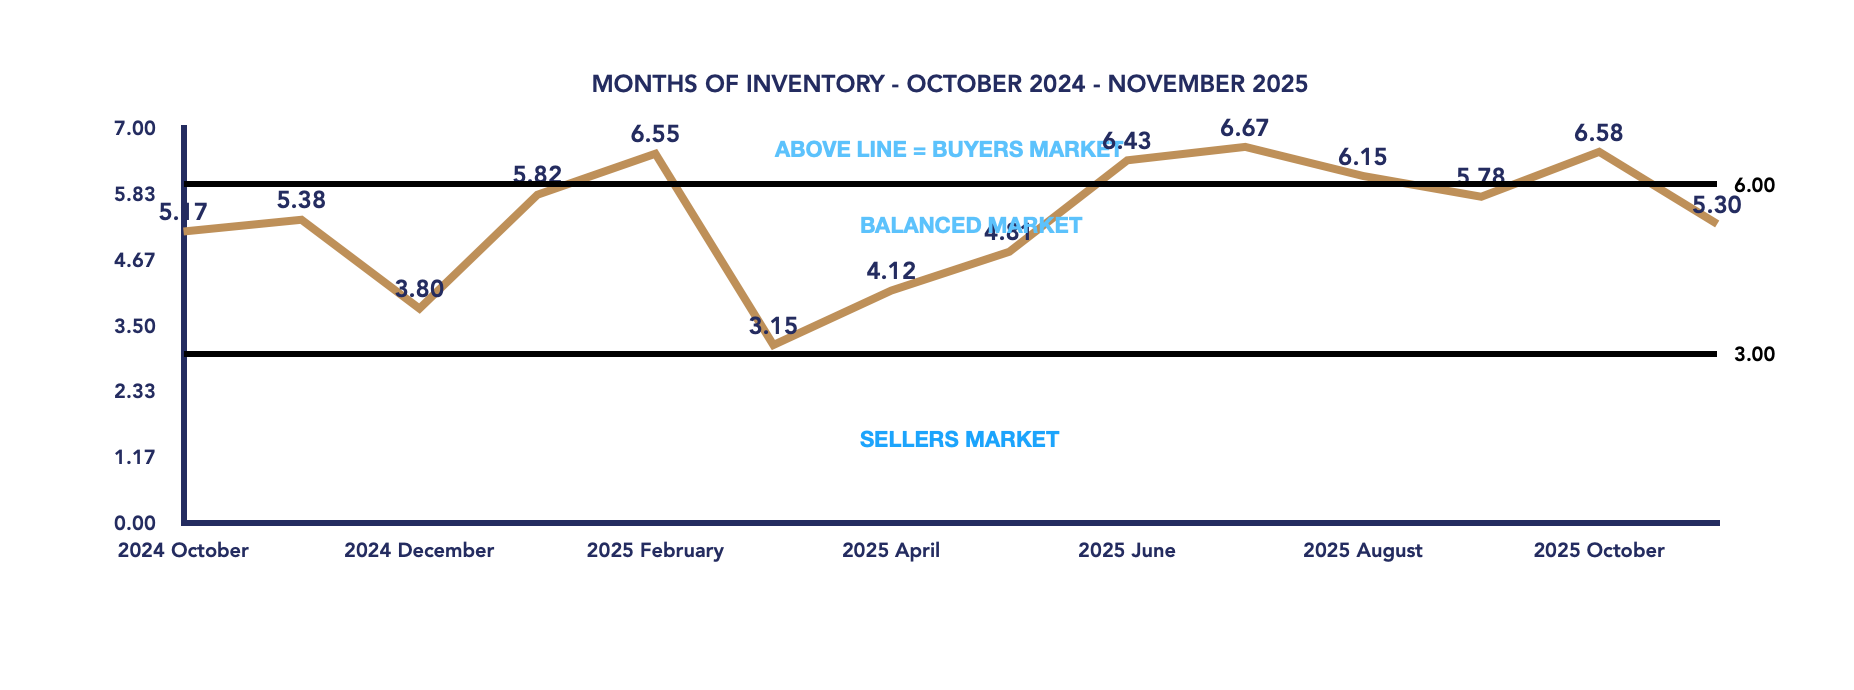
Months of Inventory
Months of inventory decreased to 5.30, down from 6.58 in October, nudging the market back into balanced territory. This shift was largely due to the combination of fewer active listings and a slight sales uptick, tightening conditions without tipping the scale fully toward sellers.
Conclusion
November 2025 presented a steady and predictable adjustment in the Uxbridge housing market. Although the average sale price softened, this change was shaped by an influx of lower-priced home sales rather than a decline in market fundamentals. Inventory levels eased, sales held strong compared to last year, and the market returned to balanced conditions heading into winter.
Looking ahead, Uxbridge is positioned for a stable winter season, with balanced supply and demand keeping the market healthy. Buyers continue to benefit from choice and negotiating room, while sellers who strategically price their homes remain successful—even in a cooler, late-year environment.
Key Performance Indicators (KPIs) from January 2024 through November 2025 provide a clear snapshot of how the Township of Uxbridge real estate market has evolved across all property types, architectural styles, and home configurations
WATCH OUR MONDAY MARKET MINUTES
*Information is believed to be accurate at time of posting but is not guaranteed to be correct. Some values may vary slightly based on the exact date and time the reports were generated. Market stats are provided by TRREB (Toronto Regional Real Estate Board) and are based on sales for the month of Attached/Row/Townhouses, Condo Apartments, Condo Townhouses, Detached, Detached with Common Elements, Link Homes and Semi-detached. *Some values may vary slightly based on the exact date and time the reports were generated.
Not intended as a solicitation if your property is already listed by another broker. Affiliated real estate agents are independent contractor sales associates, not employees. ©2021 Coldwell Banker. All Rights Reserved. Coldwell Banker and the Coldwell Banker logos are trademarks of Coldwell Banker Real Estate LLC. The Coldwell Banker® System is comprised of company owned offices which are owned by a subsidiary of Realogy Brokerage Group LLC and franchised offices which are independently owned and operated. The Coldwell Banker System fully supports the principles of the Fair Housing Act and the Equal Opportunity Act.
Click below for more reports
Check out our Uxbridge and Scugog Events Pages to keep up to date on whats going on around town. Click the links or scan the Code with your phone to take you directly there.
UXBRIDGE EVENTS
SCUGOG EVENTS
Scugog Housing November 2025

Scugog Housing November 2025
Each office is independently owned and operated
![]()
![]()
Housing Market Report for November 2025
Here is the Township of Scugog Housing November 2025 report (all housing types), with reports from the Canadian Real Estate Association, and Toronto Regional Real Estate Board included.
This housing report for Durham Region includes the number of new listings, average list price, number of properties sold, average selling price, average days on market and average asking price to selling price ratio for all property types within the Region of Durham.
Scroll to the bottom for links to take you to the housing market reports for Durham Region, Uxbridge and Brock.
![]()
![]()
From Toronto Regional Real Estate Board
Please note: The PropTx MLS® System, of which TRREB is a part, has added a number of new client boards over the last year. Many of these boards’ Members trade within the Greater Toronto Area and broader Greater Golden Horseshoe regions. As a result, historic data have been updated to reflect the addition of these boards’ listings and transactions. This means historic data have changed relative to previously published static reports. To view updated historic data, click here.
Toronto Regional Real Estate Board – Market Stats At A Glance – November 2025
Read the Toronto Regional Real Estate Board Market Watch Report
![]()
Scugog Township Real Estate Market Analysis – November 2025
The Township of Scugog’s real estate market continued its seasonal slowdown in November 2025, with average prices dipping further while sales activity remained steady. Despite cooling conditions, balanced market indicators suggest that both buyers and sellers still have solid opportunities as the year winds down.
November 2025
October 2025

Average Sales Price
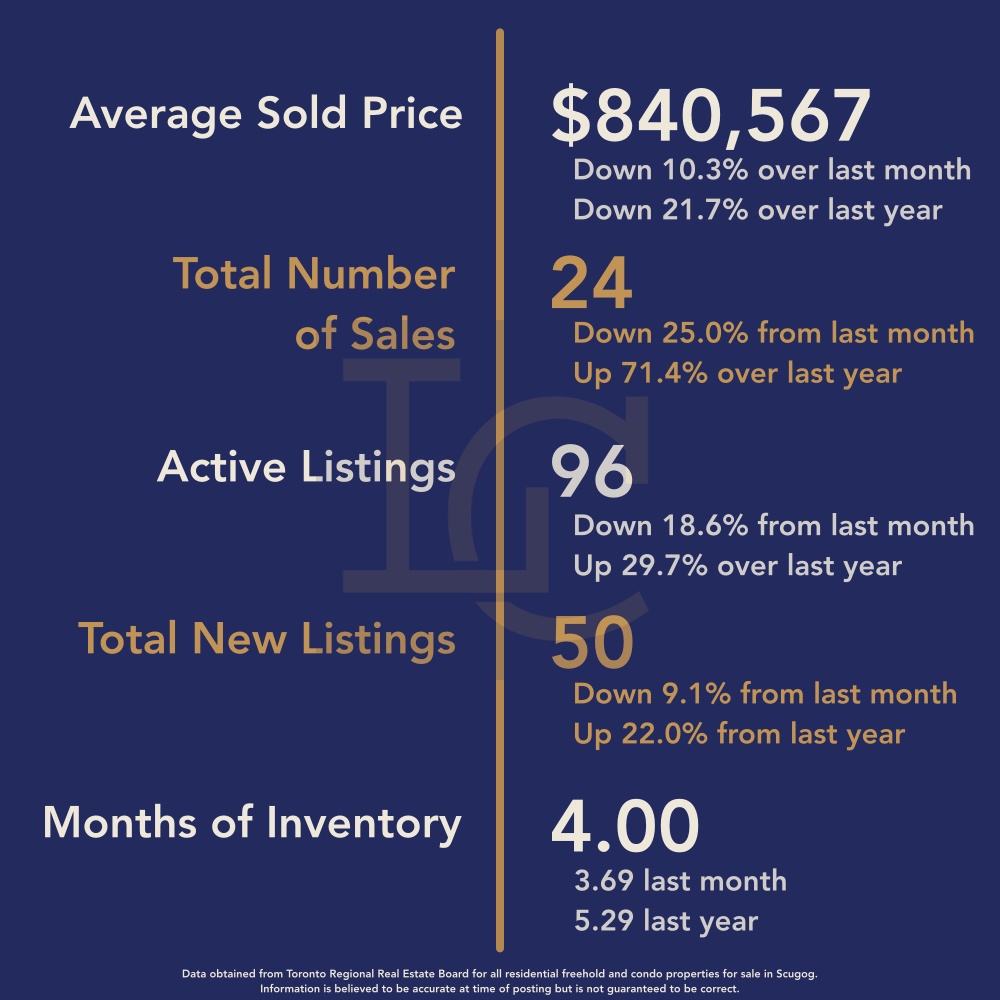
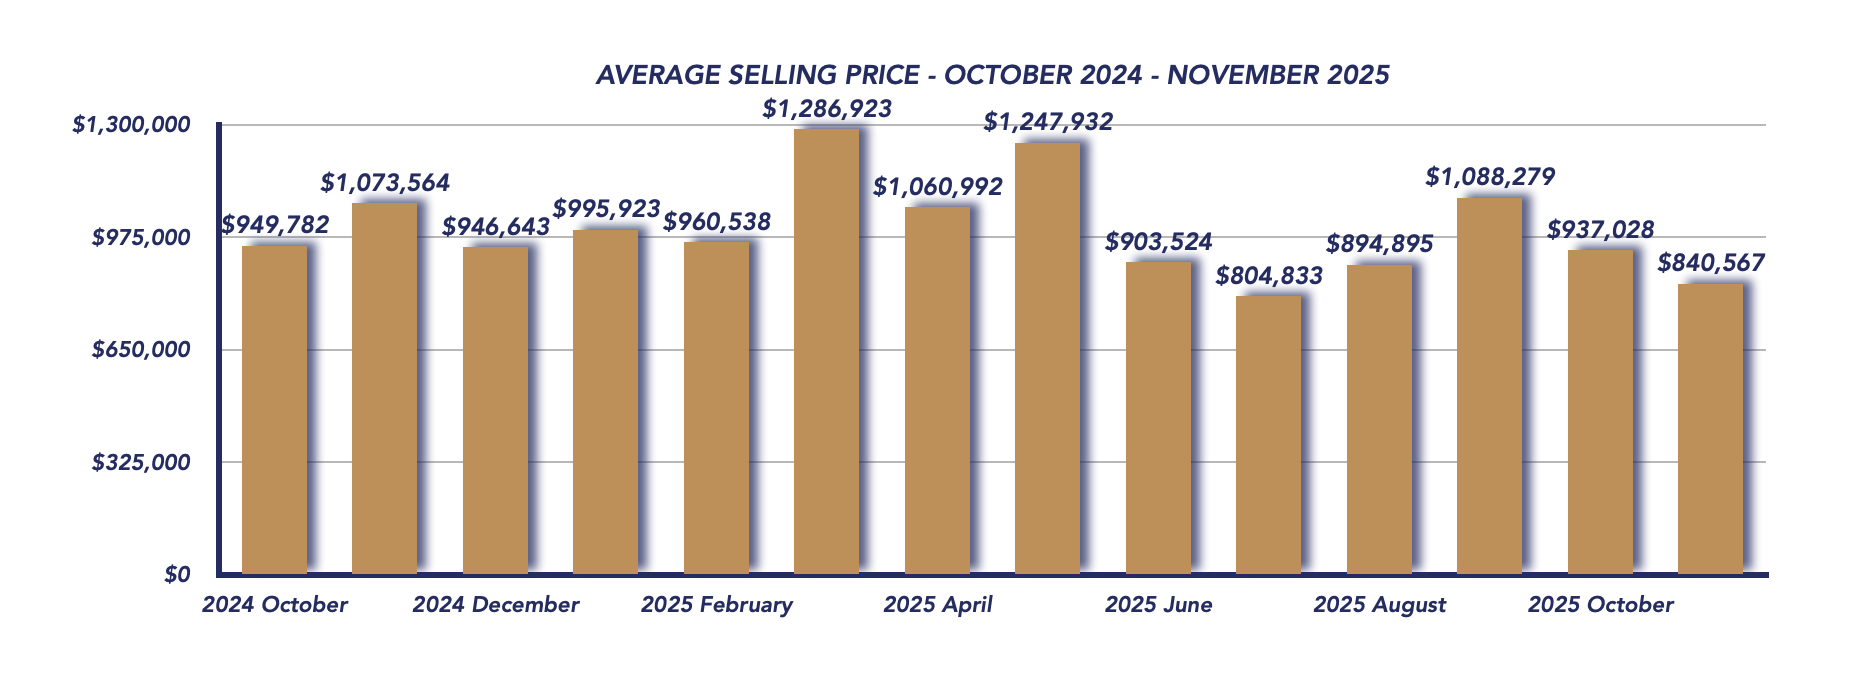
The average sales price for November 2025 came in at $840,567, marking a 10.3% drop from October’s average of $937,028 and a more significant 21.7% decline year-over-year from $1,073,564 in November 2024.
This decline reflects a noticeable shift in the mix of homes sold. While October saw 25 of 32 sales under $1 million, November pushed even lower:
-
3 homes sold under $500,000
-
11 homes sold between $500,000 and $800,000
With far fewer mid- to high-end transactions this month, the average sale price naturally trended downward. The composition of sales—not necessarily overall property values—played the biggest role in shaping November’s numbers.
Sales Activity
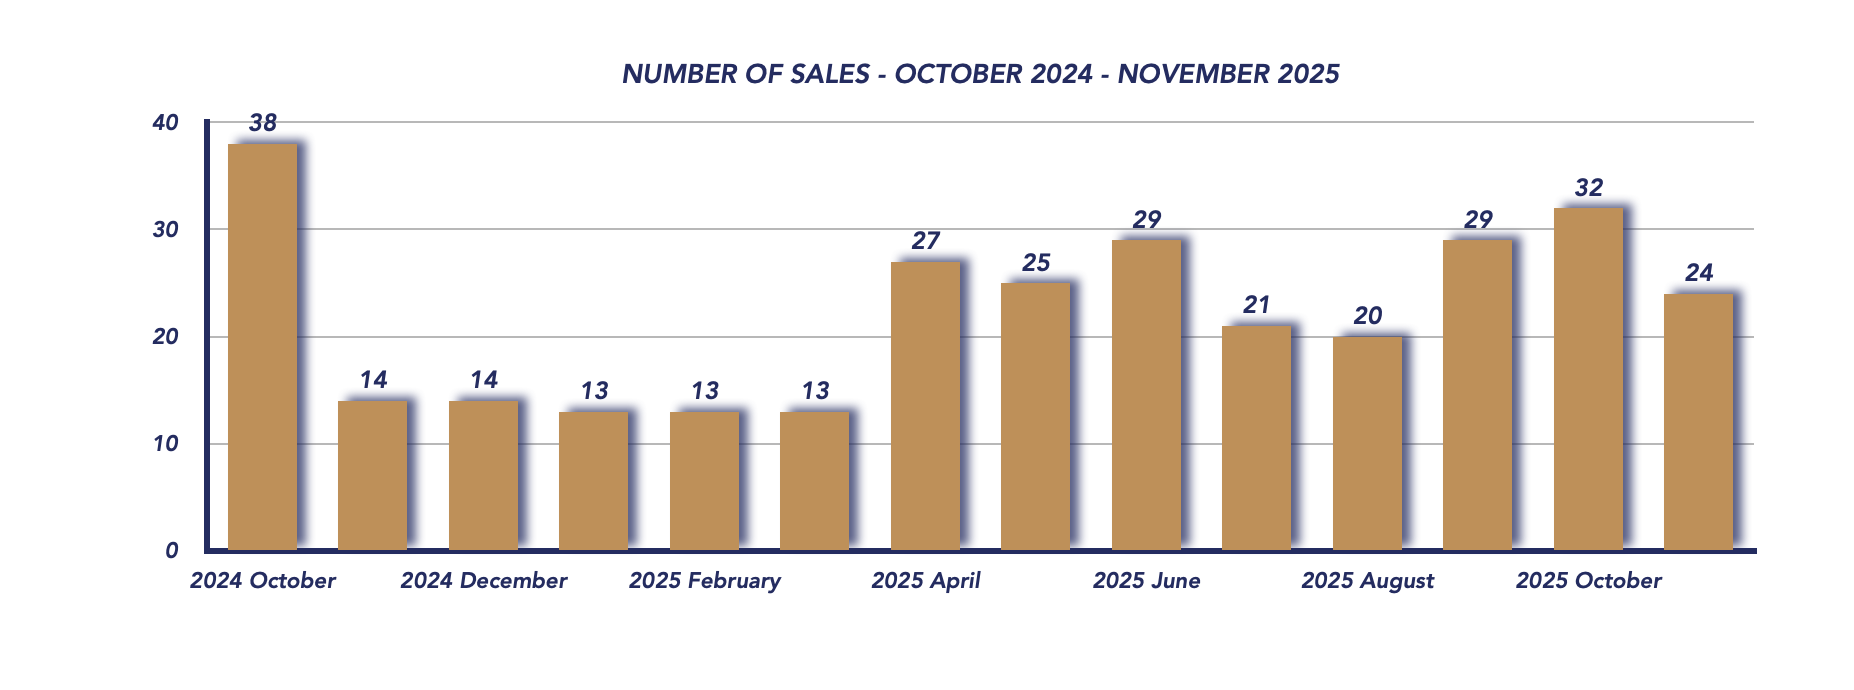
November recorded 24 total sales, down from 32 in October, but up significantly from 14 sales in November 2024.
The sale-to-list price ratio held steady at 97%, matching last month’s performance. This stability shows that sellers who price appropriately are still attracting committed buyers, even as the market tapers into its typical winter rhythm.
Listings & Inventory
The supply side of the market tightened in November:
-
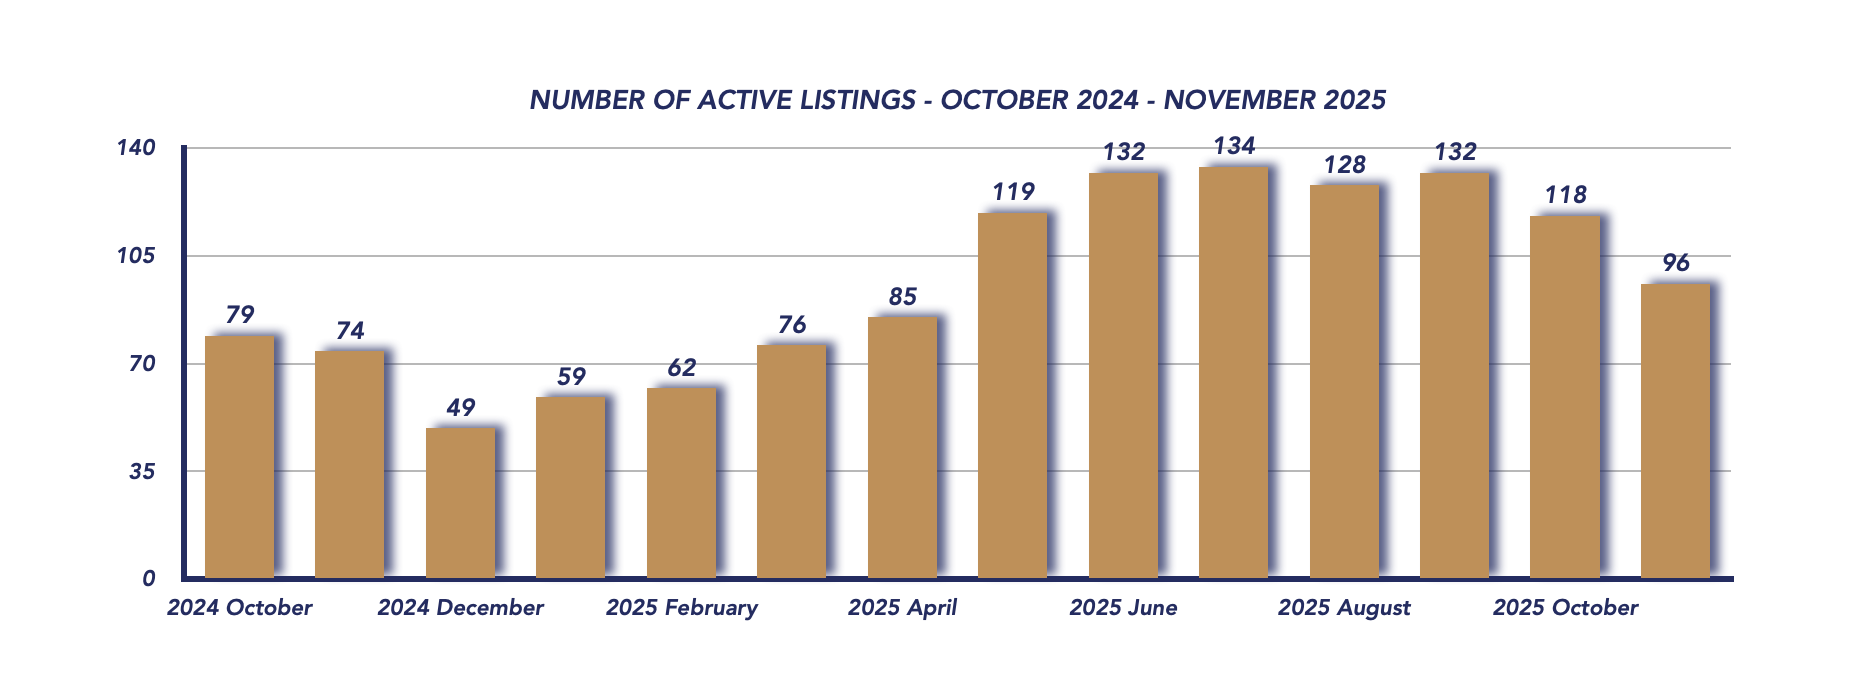
Active listings fell to 96, dropping from 118 in October, though still higher than the 74 listings available last year.
-
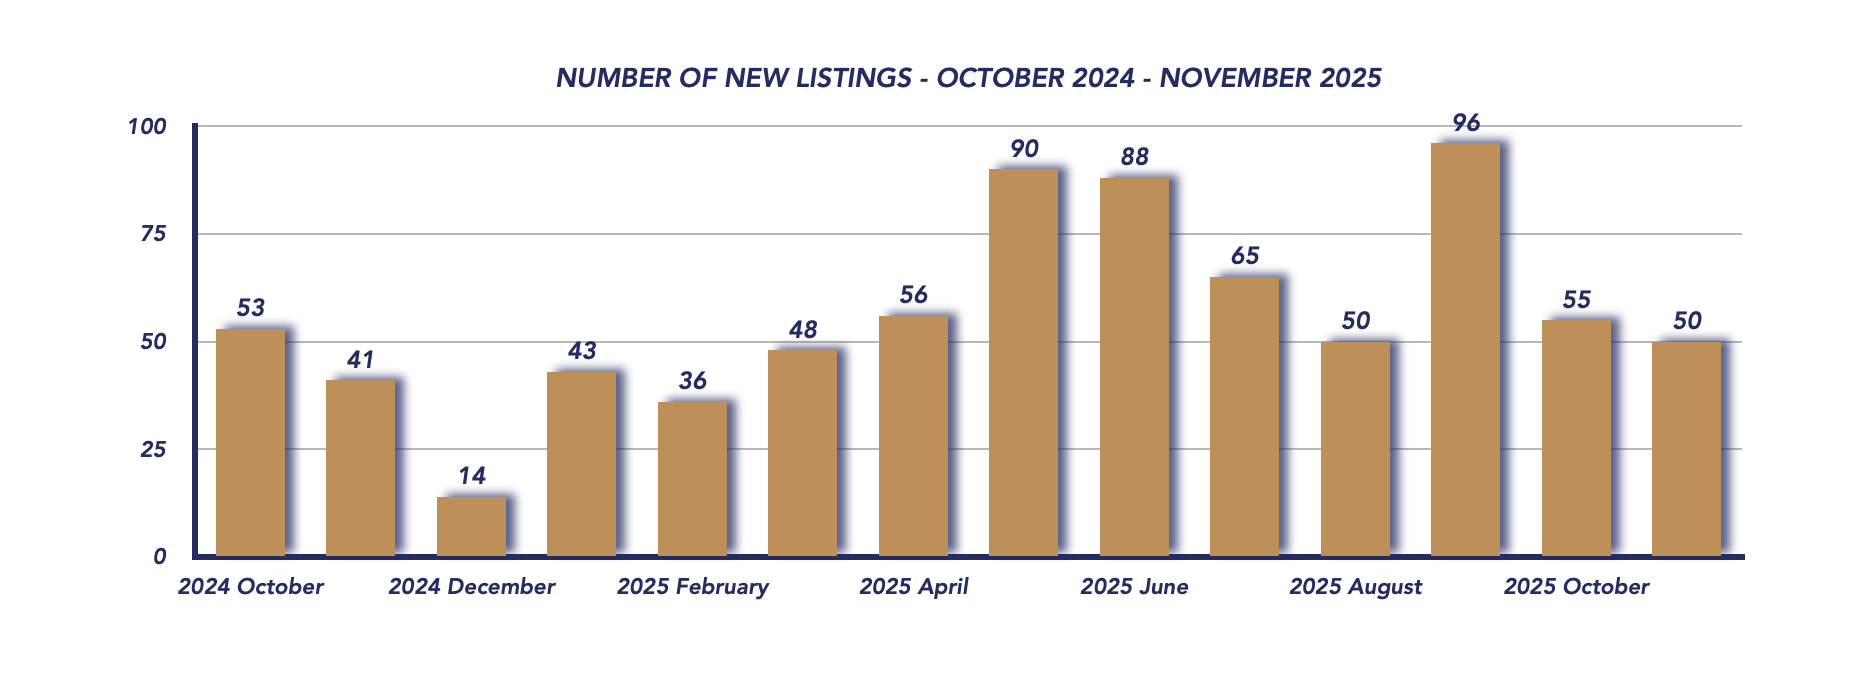
New listings came in at 50, slightly below the 55 added in October, but above the 41 new listings recorded in November 2024.
With fewer homes hitting the market and several older listings being absorbed by buyers, Scugog’s inventory took a natural step down as winter approaches.
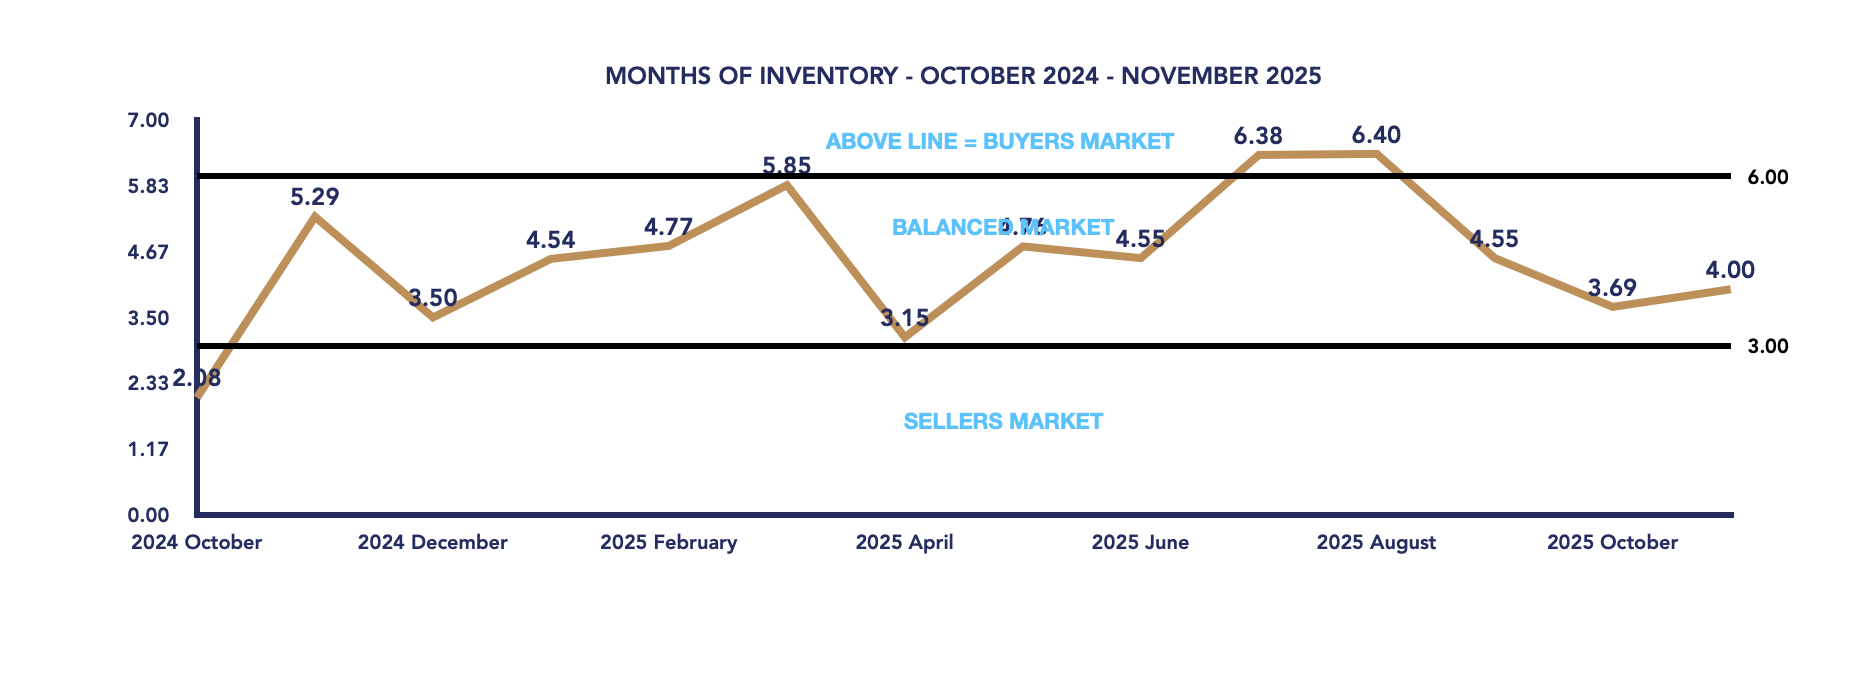
The months of inventory rose slightly to 4.00, up from 3.69, but still firmly within balanced market territory. This means conditions remain fair for both sides: buyers have choice, and sellers retain solid negotiating power.
Days on Market
Homes sold more quickly in November, averaging 53 days on market, a notable improvement from 68 days in October. This shorter selling timeline suggests that buyers who remain active this late in the year are serious and decisive.
Key Takeaways
-
Average prices fell 10.3% month-over-month, mostly due to a higher volume of lower-priced sales.
-
Entry-level and mid-range housing dominated the market, pulling down average sale prices despite steady demand.
-
Sales exceeded last year’s totals, showing ongoing buyer activity in Scugog.
-
inventory tightened, with fewer new listings and fewer active listings overall.
-
Months of inventory remains balanced at 4.00, signaling healthy market conditions heading into winter.
-
Homes sold faster, indicating stronger motivation among late-season buyers.
As 2025 winds down, Scugog’s housing market remains steady, balanced, and active. While average prices continue to adjust due to the types of homes selling, buyer confidence appears stable, and well-priced listings continue to draw interest—even as we move deeper into the slower winter season.
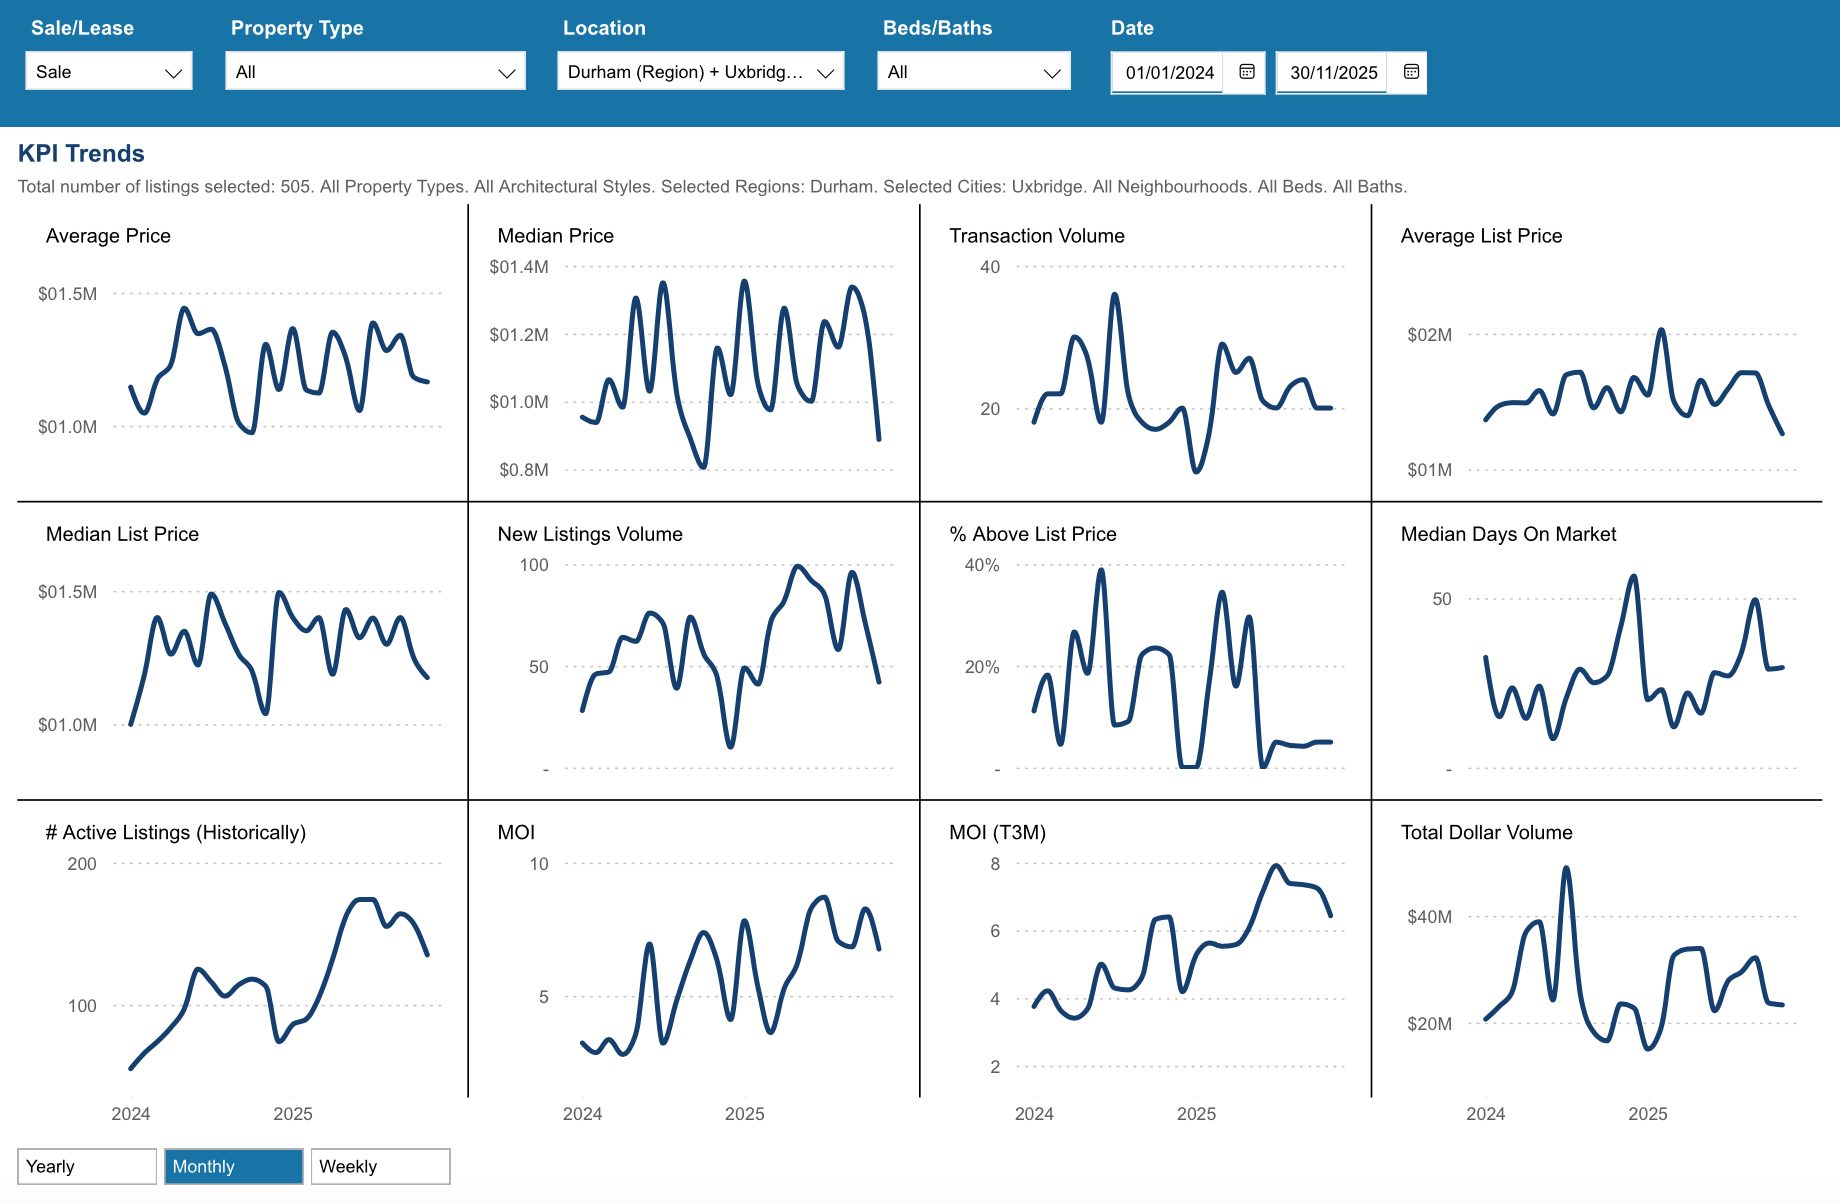
Key Performance Indicators (KPIs) from January 2024 through November 2025 provide a clear snapshot of how the Township of Scugog real estate market has evolved across all property types, architectural styles, and home configurations
WATCH OUR MONDAY MARKET MINUTES
*Information is believed to be accurate at time of posting but is not guaranteed to be correct. Some values may vary slightly based on the exact date and time the reports were generated. Market stats are provided by TRREB (Toronto Regional Real Estate Board) and are based on sales for the month of Attached/Row/Townhouses, Condo Apartments, Condo Townhouses, Detached, Detached with Common Elements, Link Homes and Semi-detached. *Some values may vary slightly based on the exact date and time the reports were generated.
Not intended as a solicitation if your property is already listed by another broker. Affiliated real estate agents are independent contractor sales associates, not employees. ©2021 Coldwell Banker. All Rights Reserved. Coldwell Banker and the Coldwell Banker logos are trademarks of Coldwell Banker Real Estate LLC. The Coldwell Banker® System is comprised of company owned offices which are owned by a subsidiary of Realogy Brokerage Group LLC and franchised offices which are independently owned and operated. The Coldwell Banker System fully supports the principles of the Fair Housing Act and the Equal Opportunity Act.
Click below for more reports
Check out our Uxbridge and Scugog Events Pages to keep up to date on whats going on around town. Click the links or scan the Code with your phone to take you directly there.
UXBRIDGE EVENTS
SCUGOG EVENTS
Brock Housing November 2025

Brock Housing November 2025
Each office is independently owned and operated
![]()
![]()
Housing Market Report for November 2025
Here is the Township of Brock Housing November 2025 report (all housing types), with reports from the Canadian Real Estate Association, and Toronto Regional Real Estate Board included.
This housing report for Durham Region includes the number of new listings, average list price, number of properties sold, average selling price, average days on market and average asking price to selling price ratio for all property types within the Region of Durham.
Scroll to the bottom for links to take you to the housing market reports for Durham Region, Uxbridge and Scugog.
![]()
![]()
Please note: The PropTx MLS® System, of which TRREB is a part, has added a number of new client boards over the last year. Many of these boards’ Members trade within the Greater Toronto Area and broader Greater Golden Horseshoe regions. As a result, historic data have been updated to reflect the addition of these boards’ listings and transactions. This means historic data have changed relative to previously published static reports. To view updated historic data, click here.
Toronto Regional Real Estate Board – Market Stats At A Glance – November 2025
Read the Toronto Regional Real Estate Board Market Watch Report
![]()
Brock Township Real Estate Market Analysis – November 2025
The Brock Township real estate market shifted notably in November 2025, with softer pricing, fewer sales, and rising inventory conditions pushing the market back into buyers-market territory. While activity slowed, the data highlights a market adjusting to seasonal trends and broader economic pressures.
November 2025
October 2025
Average Sale Price Declines Month-Over-Month and Year-Over-Year
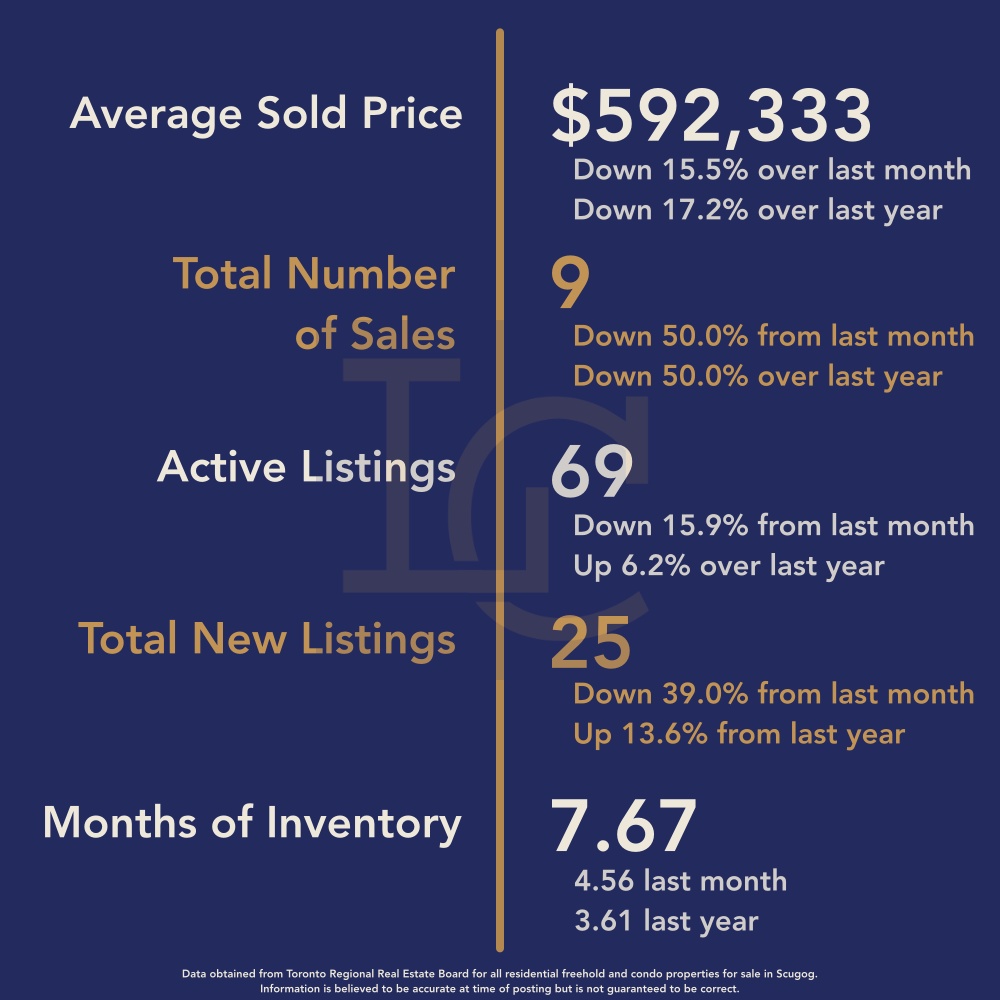
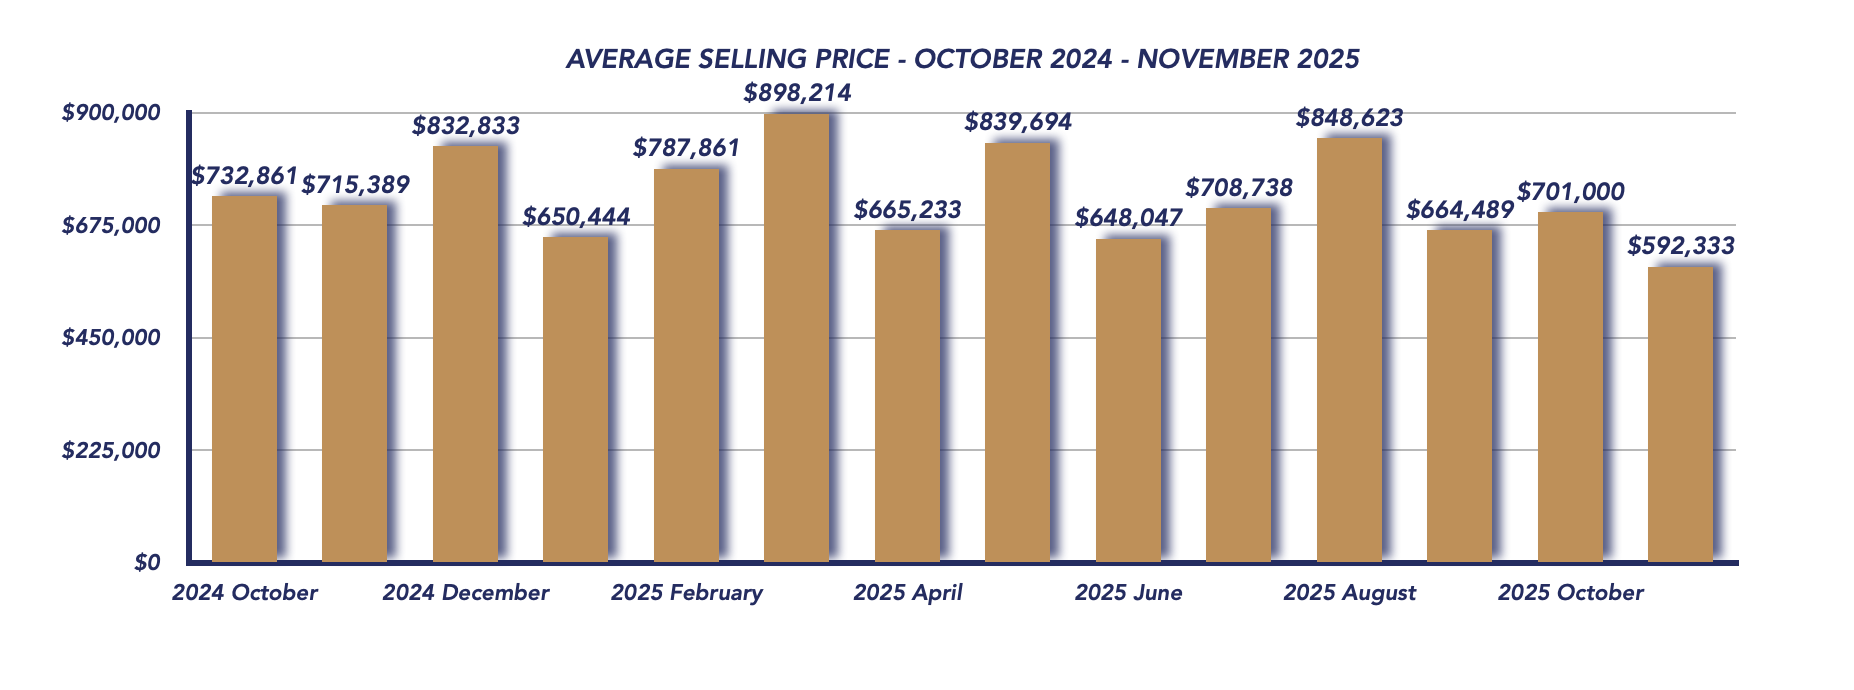
The average sale price in November 2025 was $592,333, representing a:
-
15.5% decrease from October 2025’s $701,000, and
-
17.2% drop from November 2024’s $715,389.
The month-over-month decline is especially notable because October included three sales between $1 million and $1.5 million, which elevated last month’s average.
By contrast, November recorded no sales above $1 million, with only two properties selling over $700,000 and three selling under $500,000, pulling the average downward.
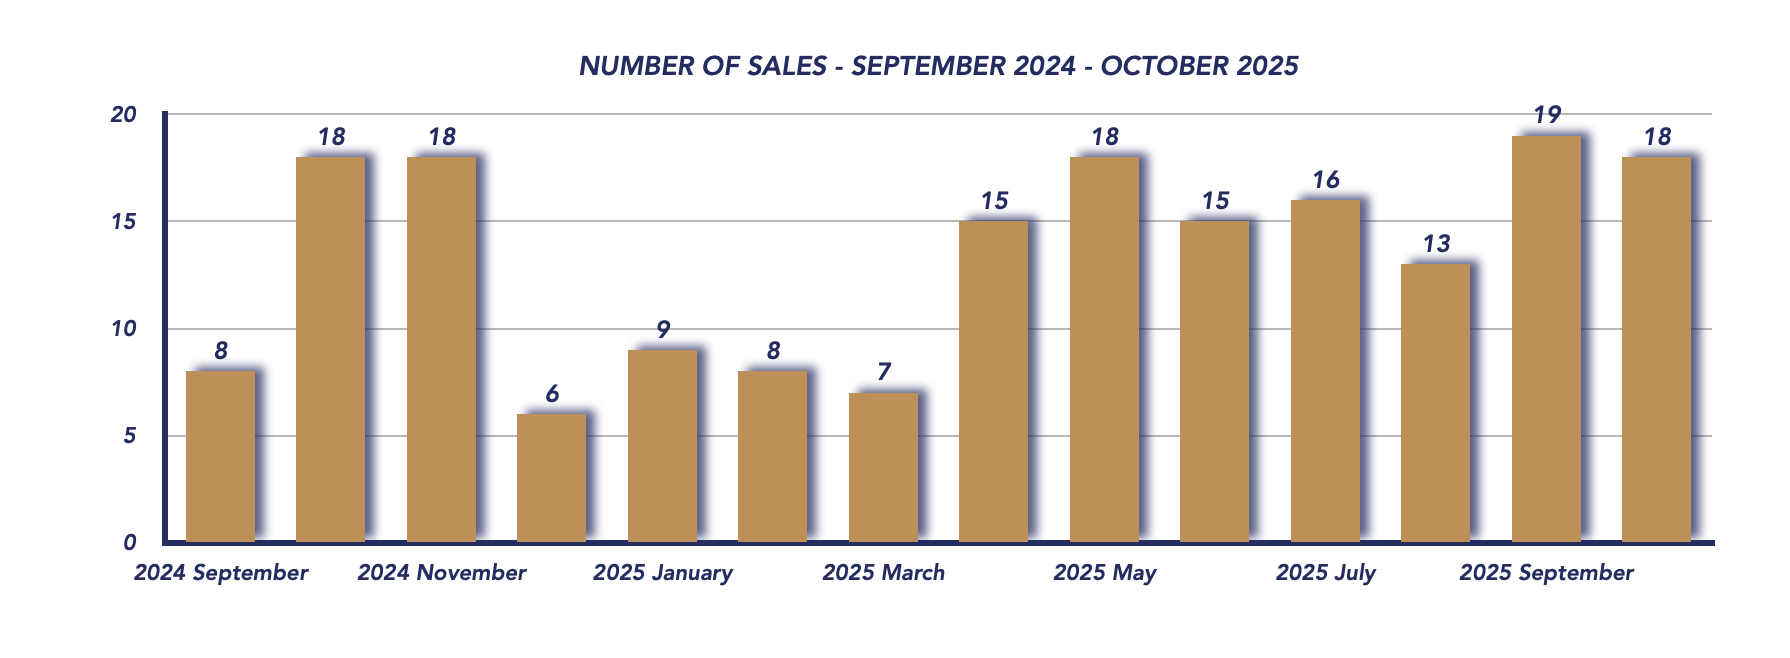
Sales Activity Slows Sharply
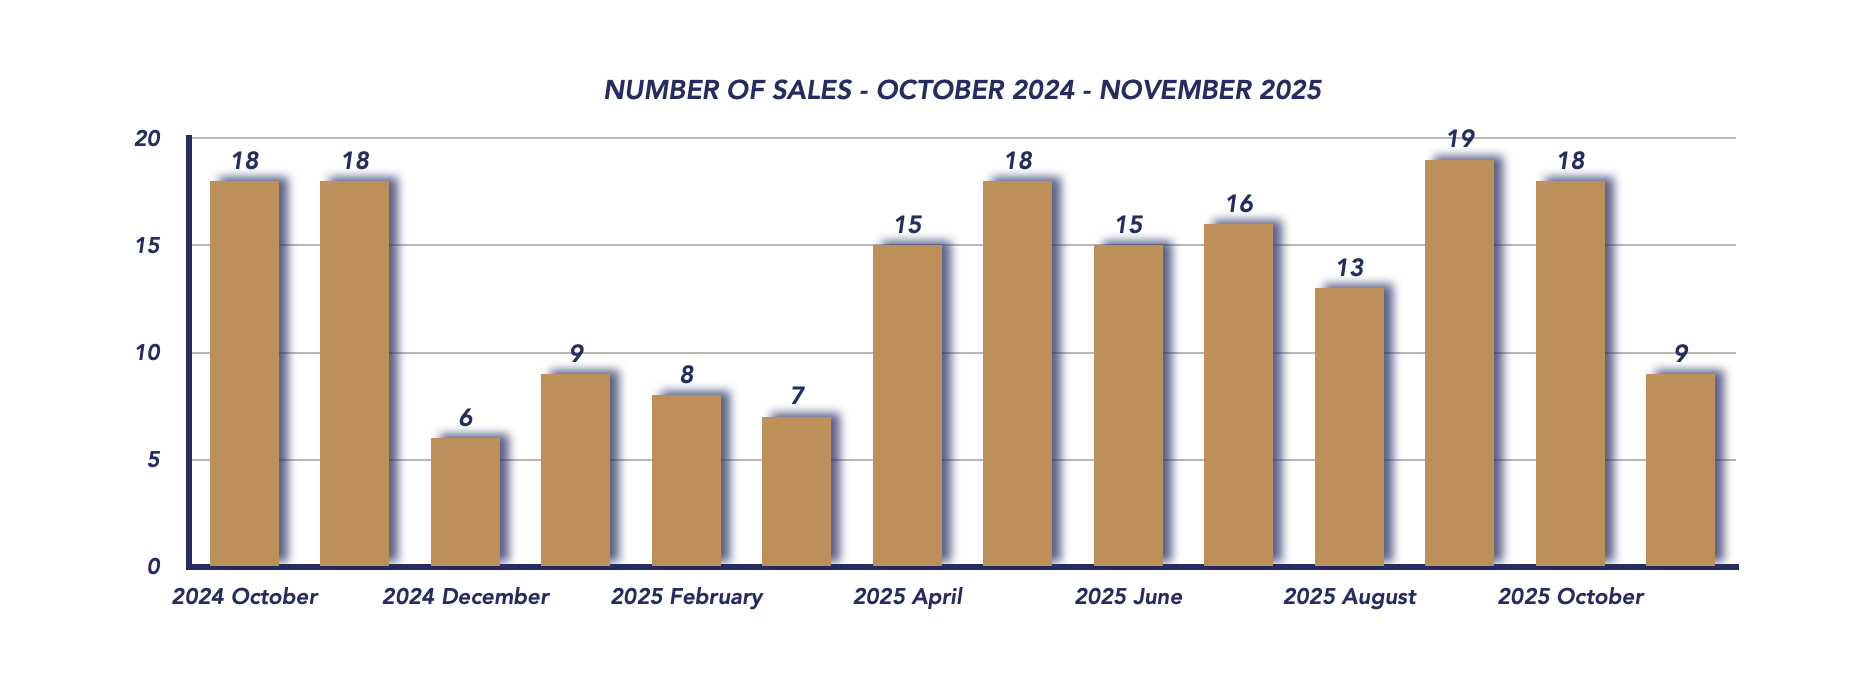
There were 9 total sales in November, a significant drop from both:
-
18 sales in October 2025, and
-
18 sales in November 2024.
This decline reflects typical late-fall seasonality but also signals more cautious buyer behaviour as affordability pressures and economic uncertainty continue to shape demand.
Sellers Achieving Closer to Asking Price
Despite lower overall pricing, sellers saw stronger offer performance.
The sale-to-list price ratio climbed to 98%, up from:
-
95% in October, and
-
matching 98% from last November.
This suggests that while fewer properties sold, well-priced homes attracted serious, motivated buyers willing to meet sellers closer to their expectations.
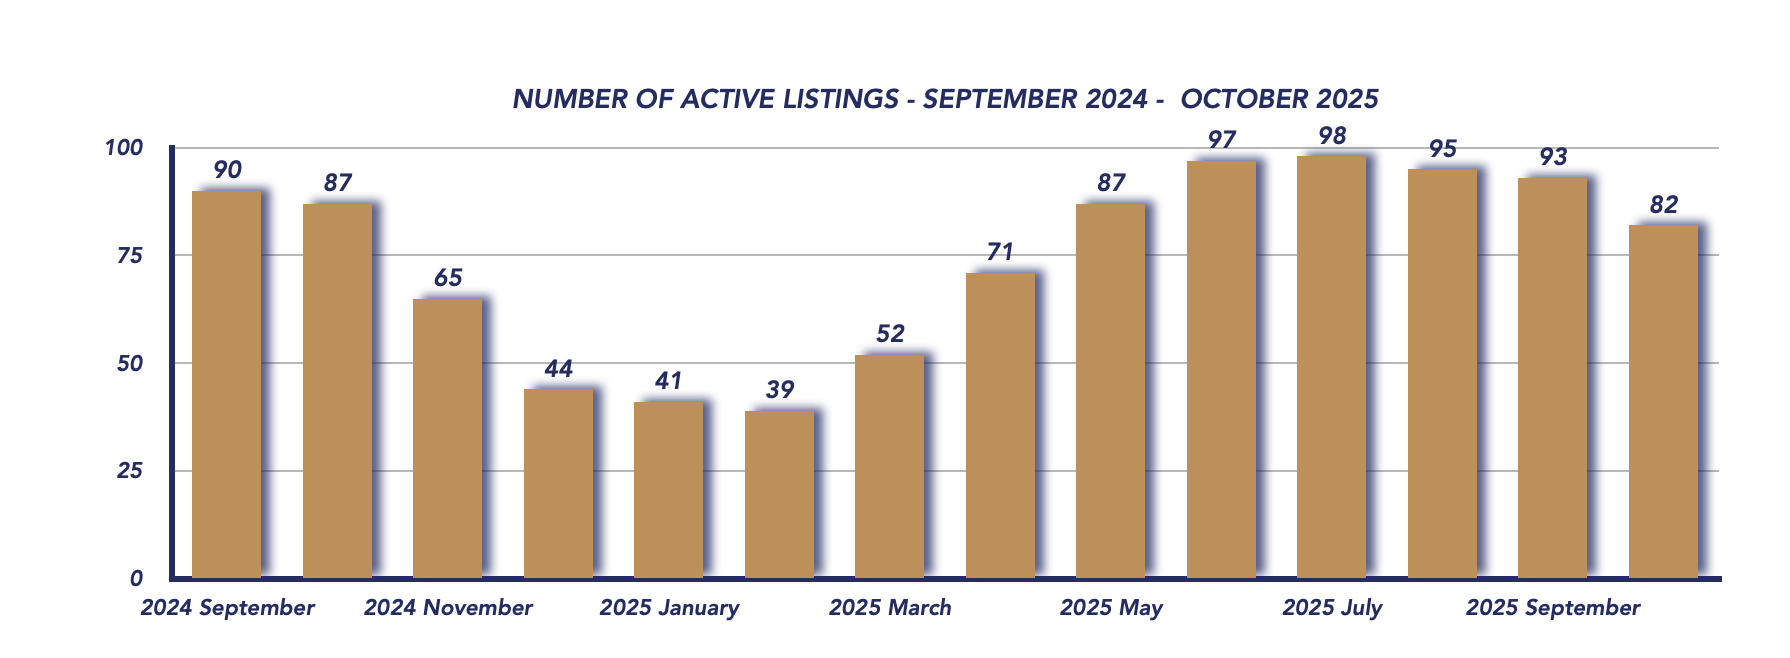
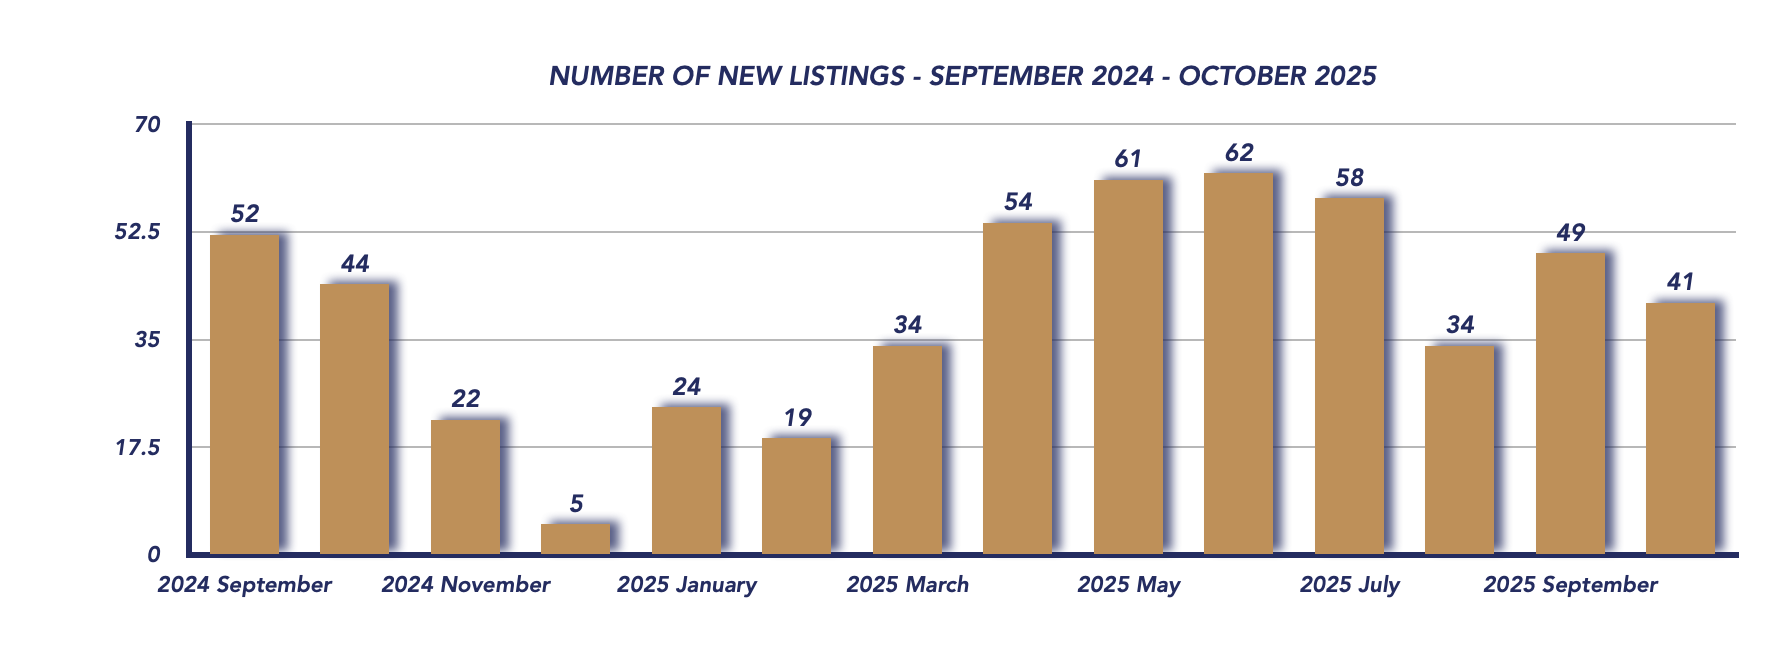
Inventory Rises, Shifting Market Into Buyers Territory
Inventory trends shifted meaningfully in November:
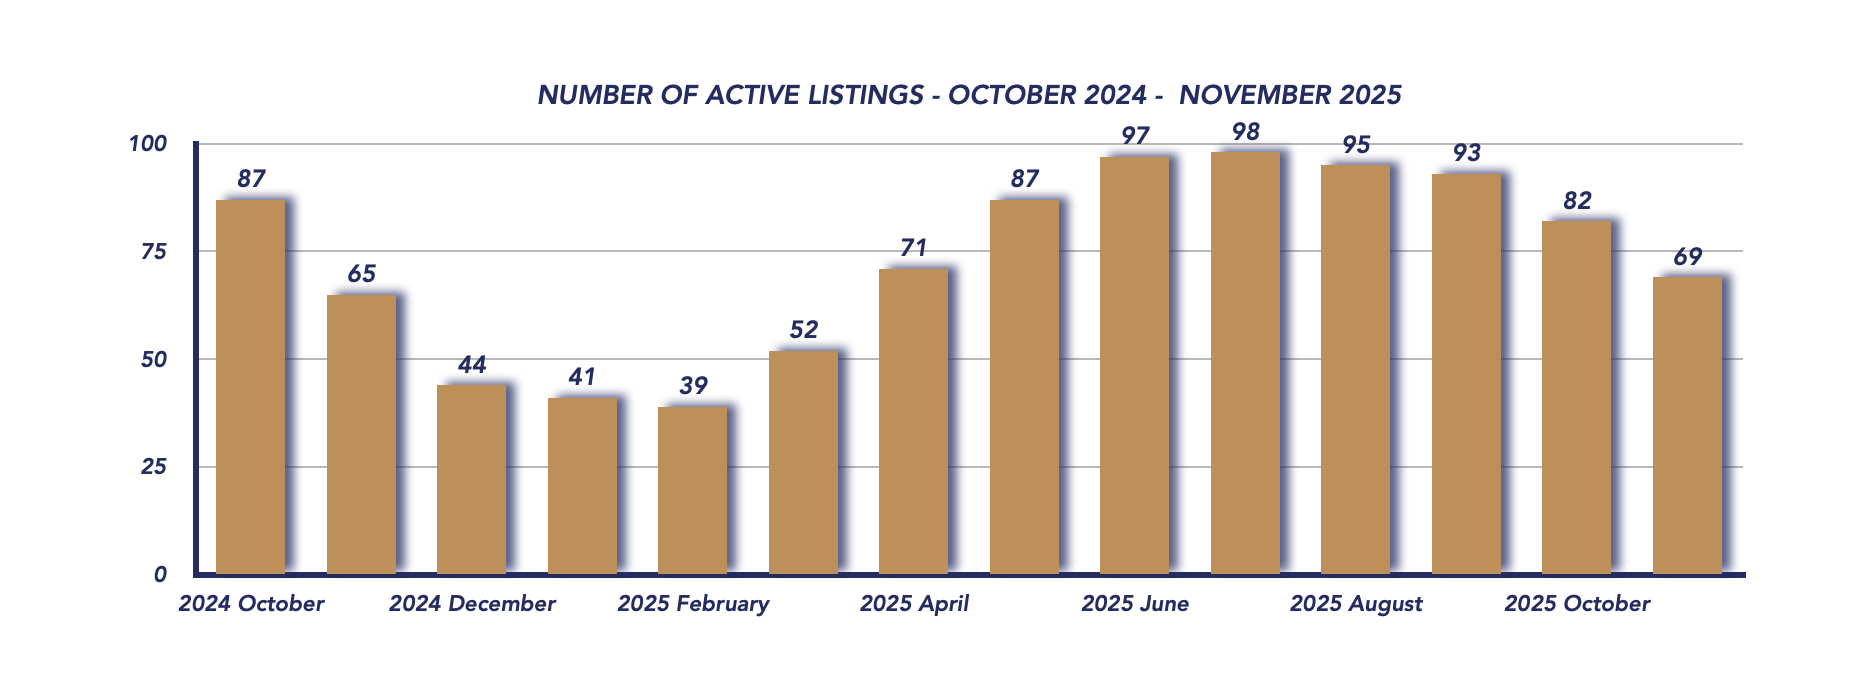
-
Active listings: 69 (down from 82 in October but above 65 last year)
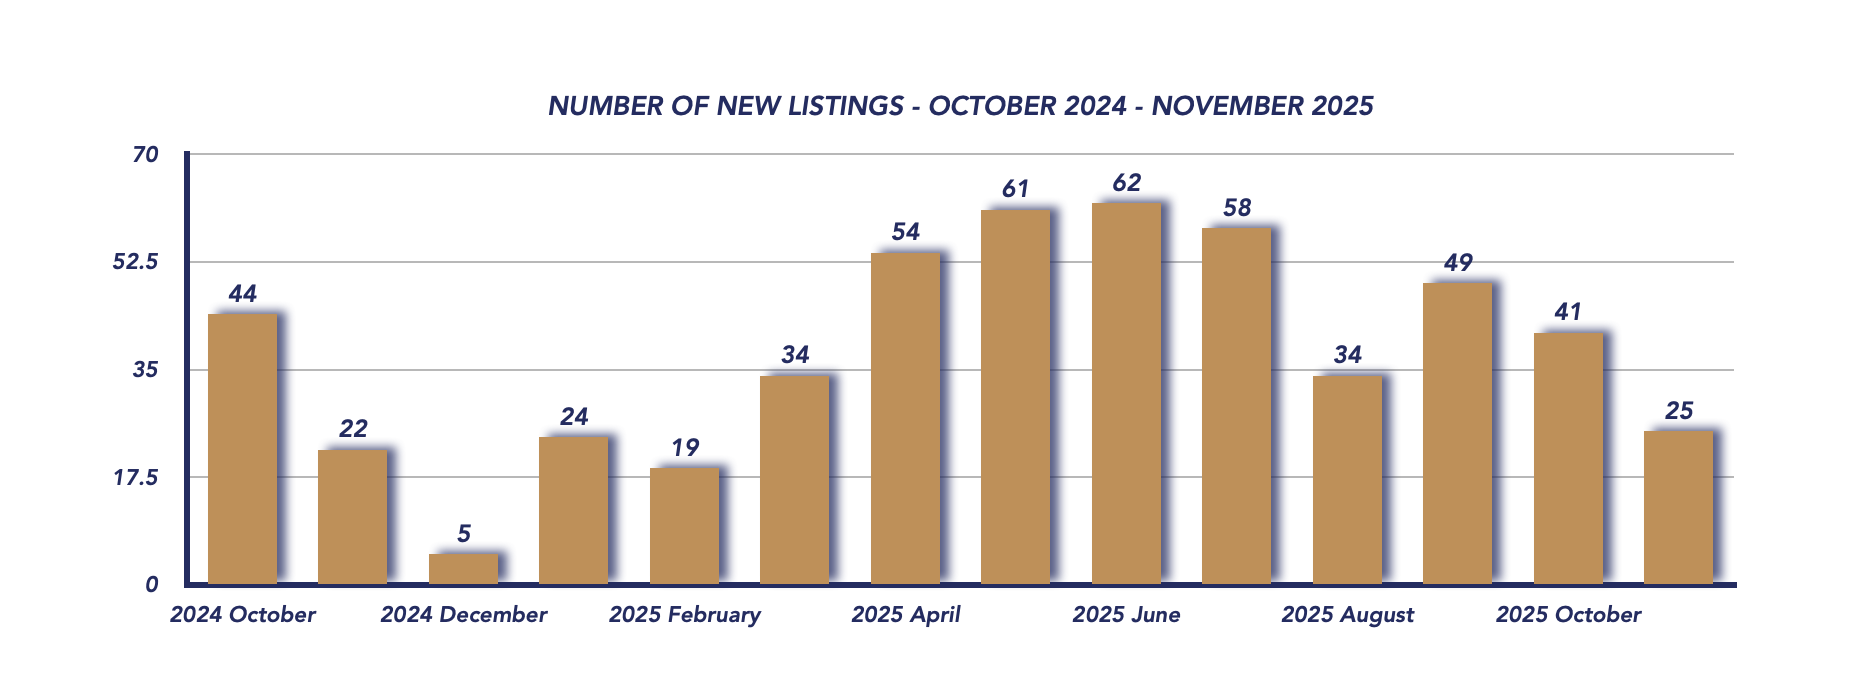
-
New listings: 25 (down from 41 last month, slightly above last year’s 22)
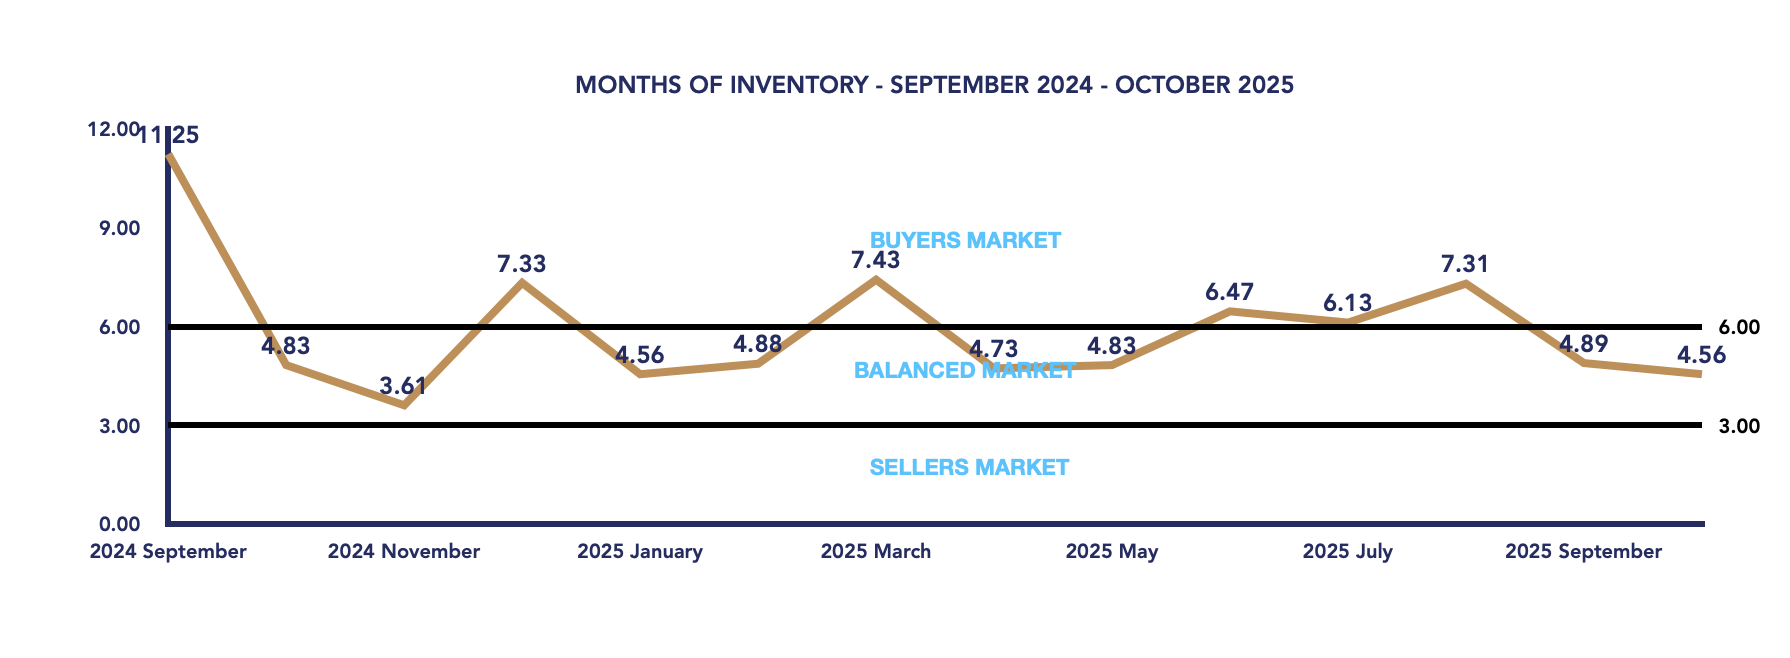
Homes also took longer to sell, with average days on market increasing to 68 days.
The most significant change was in months of inventory, which jumped to:
-
7.67 months, up from 4.56 in October
This increase formally places Brock Township into a buyers market, where inventory exceeds demand and buyers gain negotiating leverage.

Conclusion
November 2025 marked a cooler and more balanced real estate environment in Brock Township, with declining prices and reduced sales signalling a shift in market momentum. While the rise in months of inventory gives buyers more options and bargaining power, sellers can still succeed by focusing on accurate pricing and strong listing presentation.
As the winter season approaches, the market’s direction will depend on how inventory levels evolve, buyer confidence heading into 2026, and the broader economic landscape.
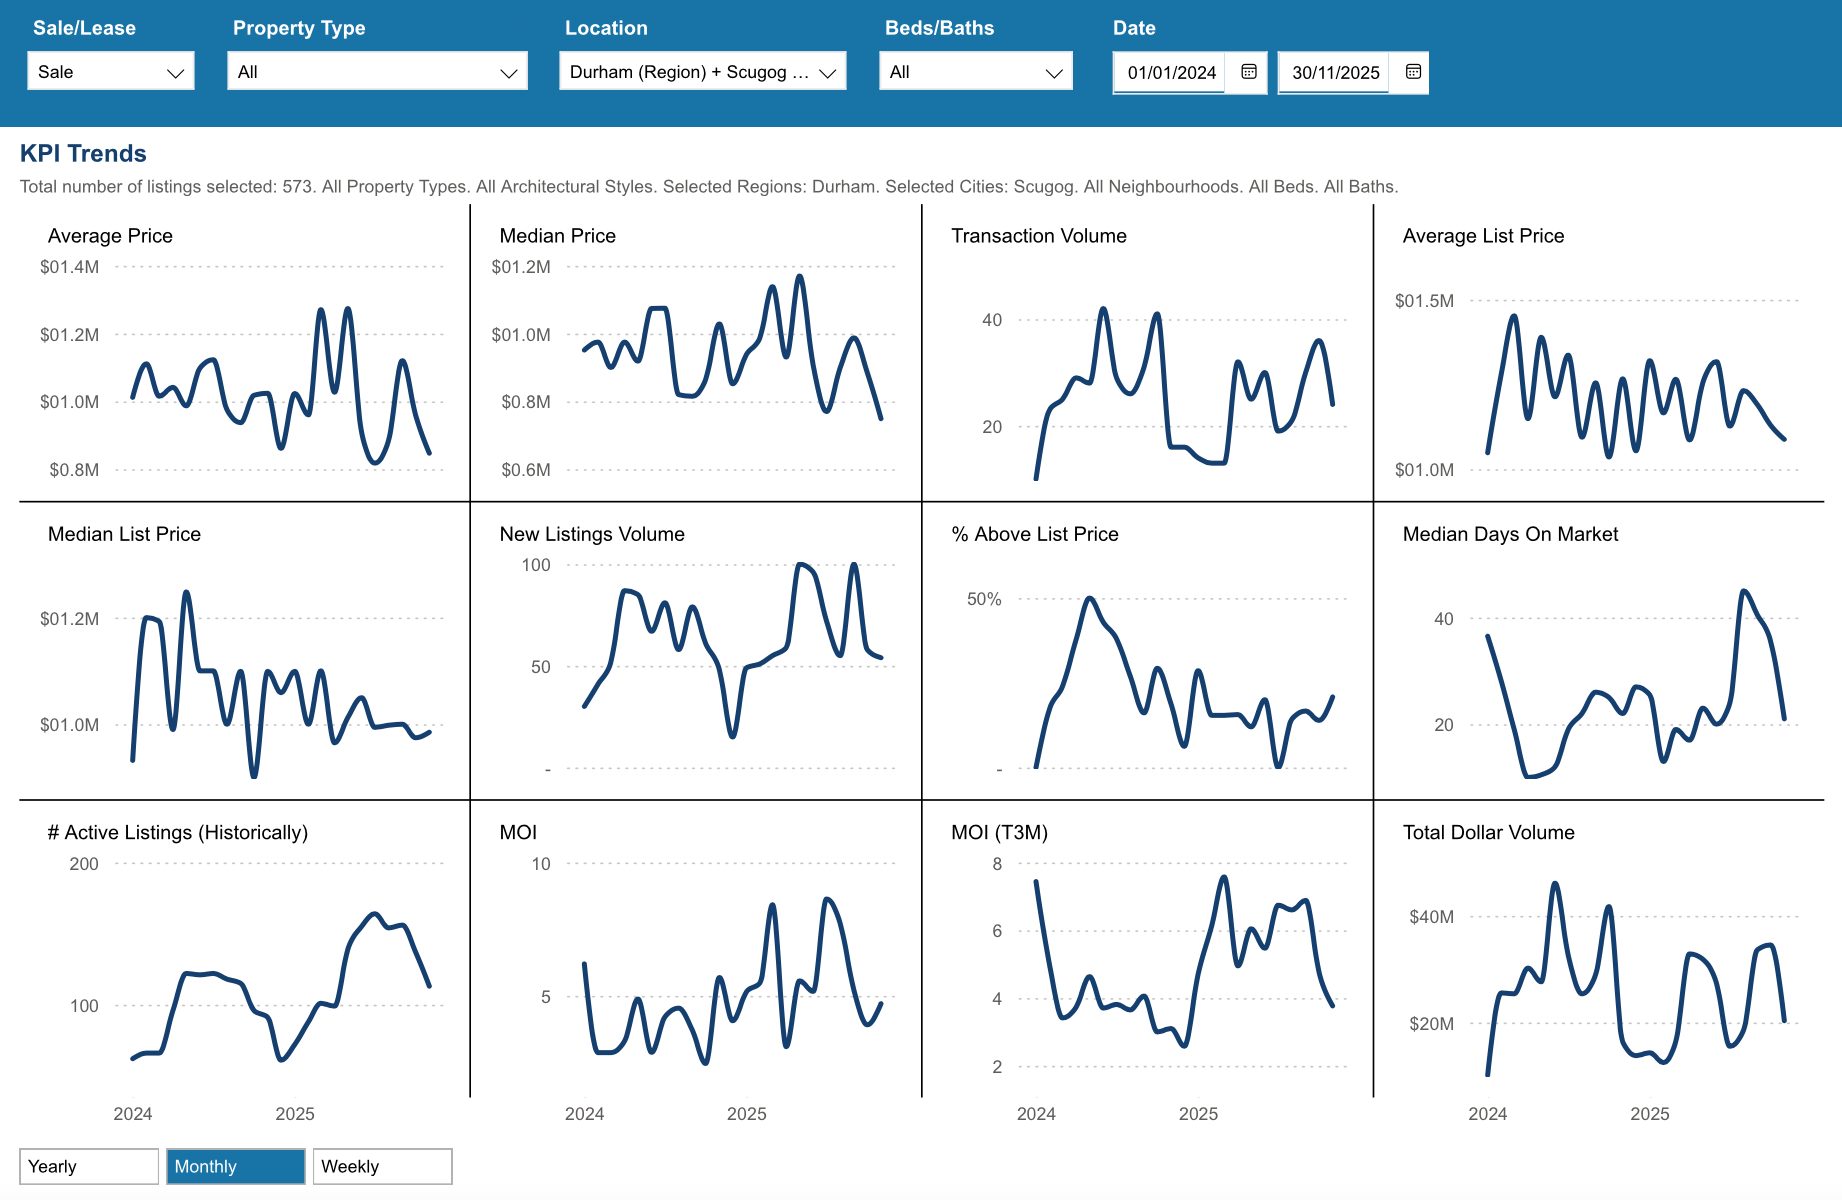
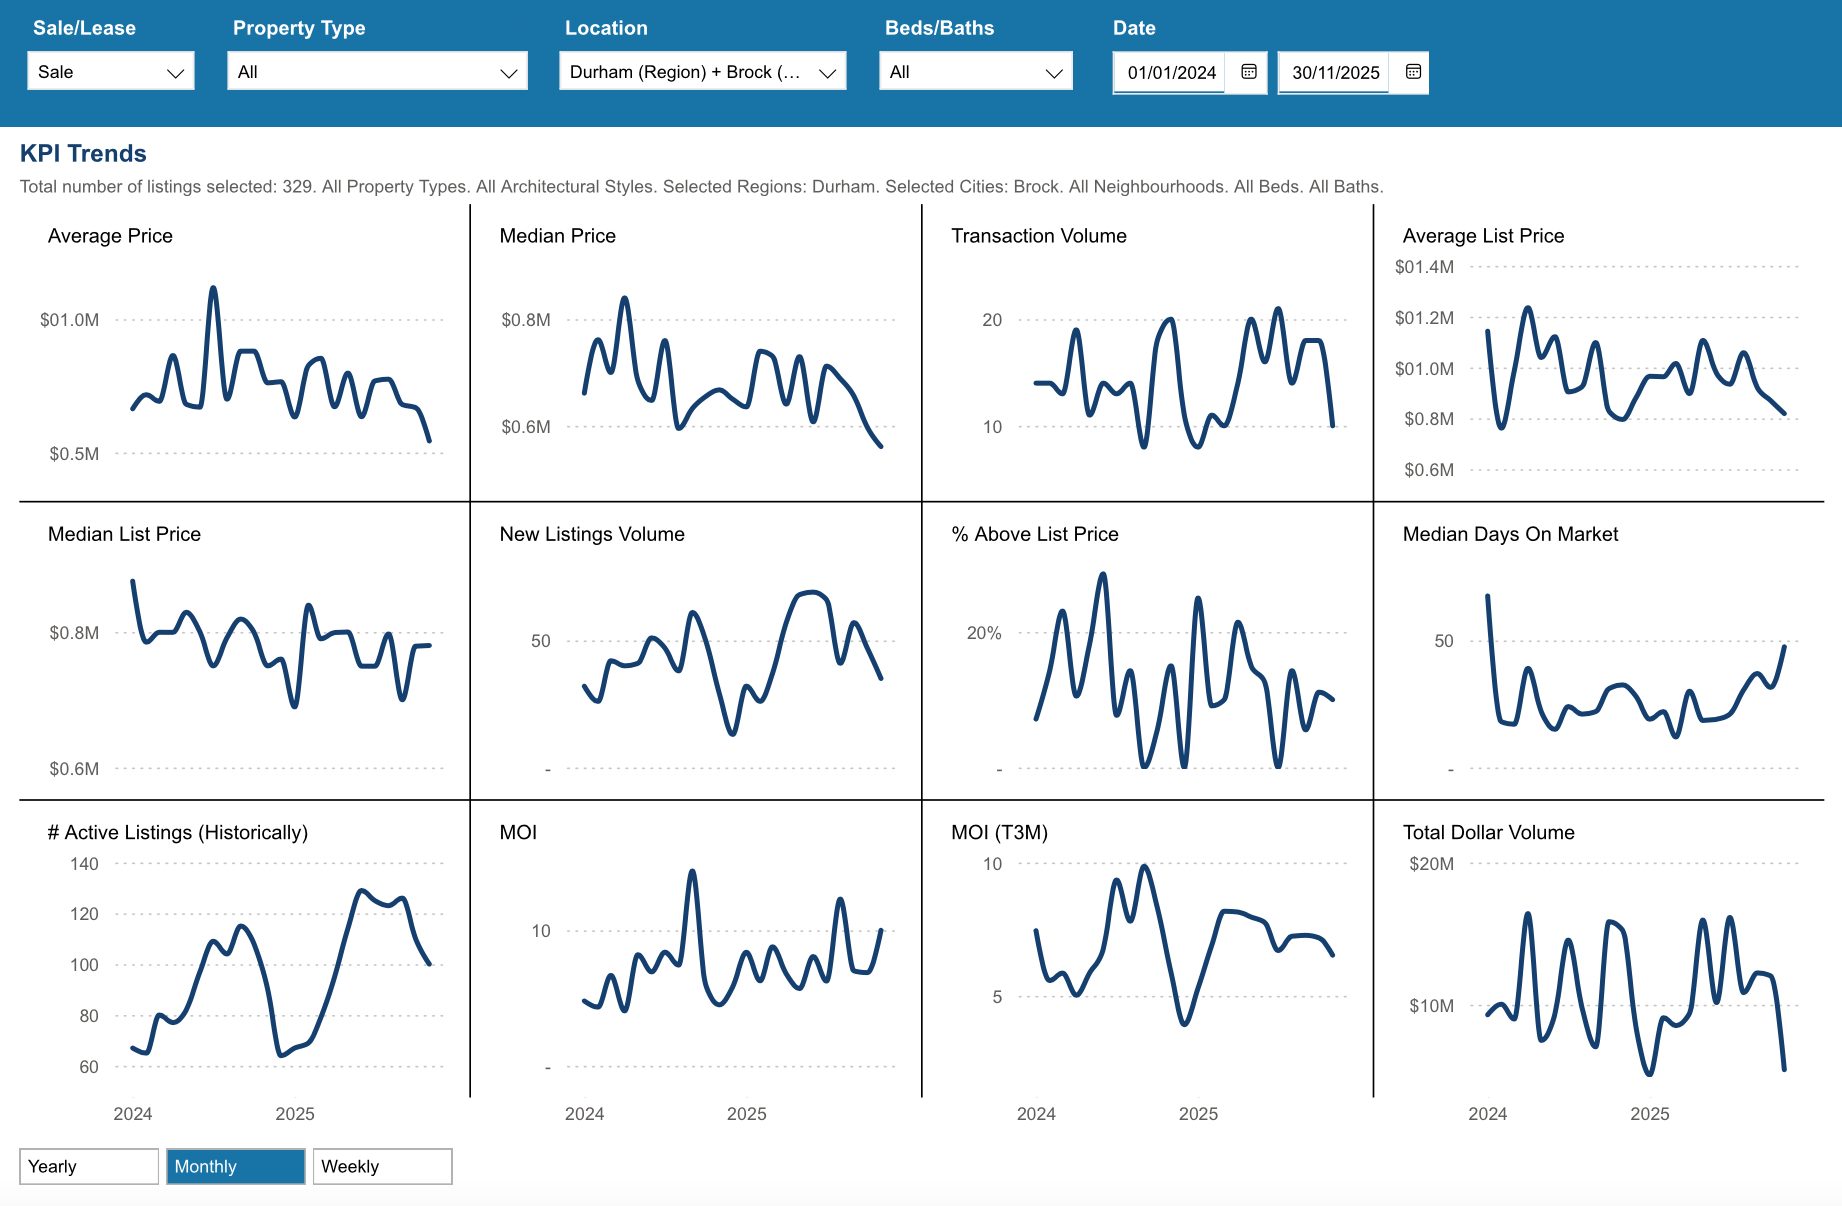
Key Performance Indicators (KPIs) from January 2024 through November 2025 provide a clear snapshot of how the Township of Brock real estate market has evolved across all property types, architectural styles, and home configurations
*Information is believed to be accurate at time of posting but is not guaranteed to be correct. Some values may vary slightly based on the exact date and time the reports were generated. Market stats are provided by TRREB (Toronto Regional Real Estate Board) and are based on sales for the month of Attached/Row/Townhouses, Condo Apartments, Condo Townhouses, Detached, Detached with Common Elements, Link Homes and Semi-detached. *Some values may vary slightly based on the exact date and time the reports were generated.
Not intended as a solicitation if your property is already listed by another broker. Affiliated real estate agents are independent contractor sales associates, not employees. ©2021 Coldwell Banker. All Rights Reserved. Coldwell Banker and the Coldwell Banker logos are trademarks of Coldwell Banker Real Estate LLC. The Coldwell Banker® System is comprised of company owned offices which are owned by a subsidiary of Realogy Brokerage Group LLC and franchised offices which are independently owned and operated. The Coldwell Banker System fully supports the principles of the Fair Housing Act and the Equal Opportunity Act.
Click below for more reports
Check out our Uxbridge and Scugog Events Pages to keep up to date on whats going on around town. Click the links or scan the Code with your phone to take you directly there.
UXBRIDGE EVENTS
SCUGOG EVENTS
Durham Region Housing November 2025

Durham Region Housing November 2025
Each office is independently owned and operated
![]()
![]()
Housing Market Report for November 2025
Here is the Region of Durham Housing November 2025 report (all housing types), with reports from the Canadian Real Estate Association, and Toronto Regional Real Estate Board included.
This housing report for Durham Region includes the number of new listings, average list price, number of properties sold, average selling price, average days on market and average asking price to selling price ratio for all property types within the Region of Durham.
Scroll to the bottom for links to take you to the housing market reports for Uxbridge, Scugog and Brock.
![]()
![]()
From Toronto Regional Real Estate Board
Please note: The PropTx MLS® System, of which TRREB is a part, has added a number of new client boards over the last year. Many of these boards’ Members trade within the Greater Toronto Area and broader Greater Golden Horseshoe regions. As a result, historic data have been updated to reflect the addition of these boards’ listings and transactions. This means historic data have changed relative to previously published static reports. To view updated historic data, click here.
Toronto Regional Real Estate Board – Market Stats At A Glance – November 2025
Read the Toronto Regional Real Estate Board Market Watch Report
![]()
Durham Region Real Estate Market Analysis – November 2025
The Durham Region housing market continued its steady shift toward balance in November 2025, with prices ticking lower, inventory tightening slightly, and activity slowing as the end of the year approaches. While year-over-year figures remain down across most categories, the market is showing consistency, and buyers and sellers appear to be settling into more predictable patterns after months of volatility.
November 2025
October 2025
🏡 Average Sale Price Continues Gradual Decline
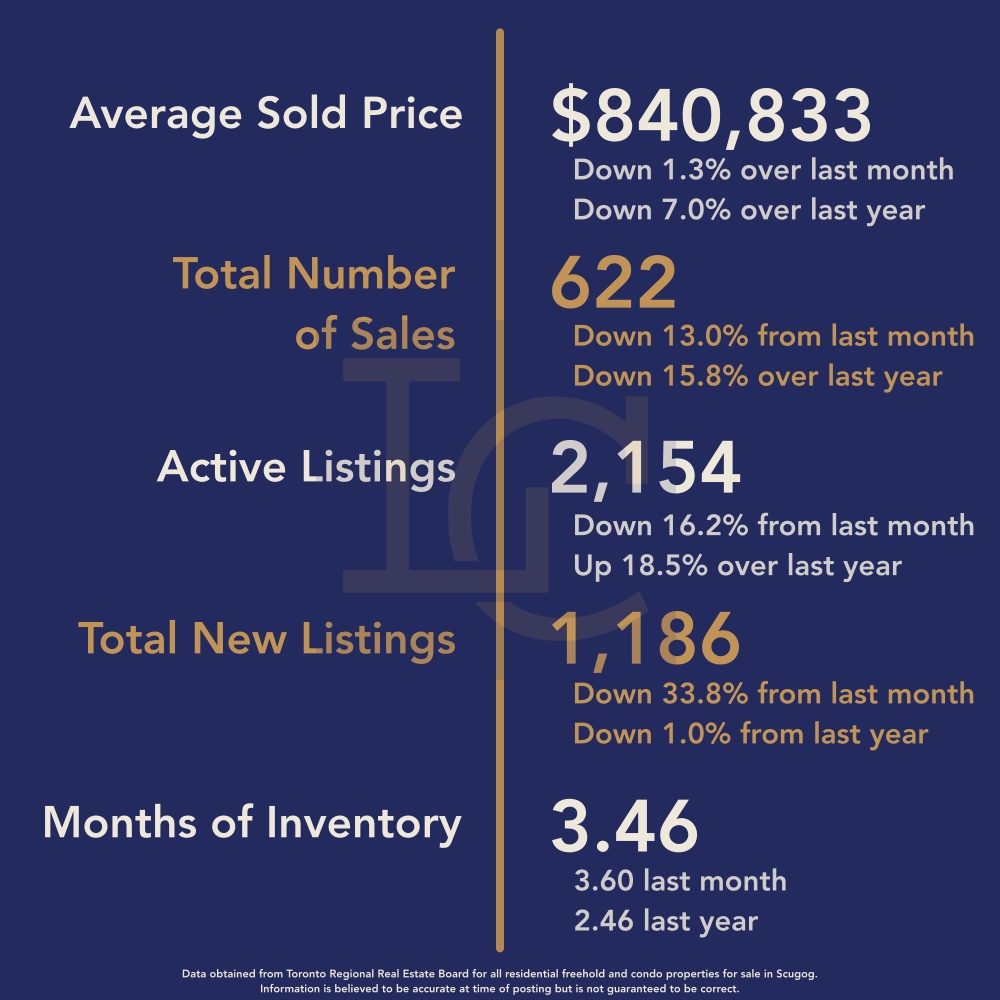
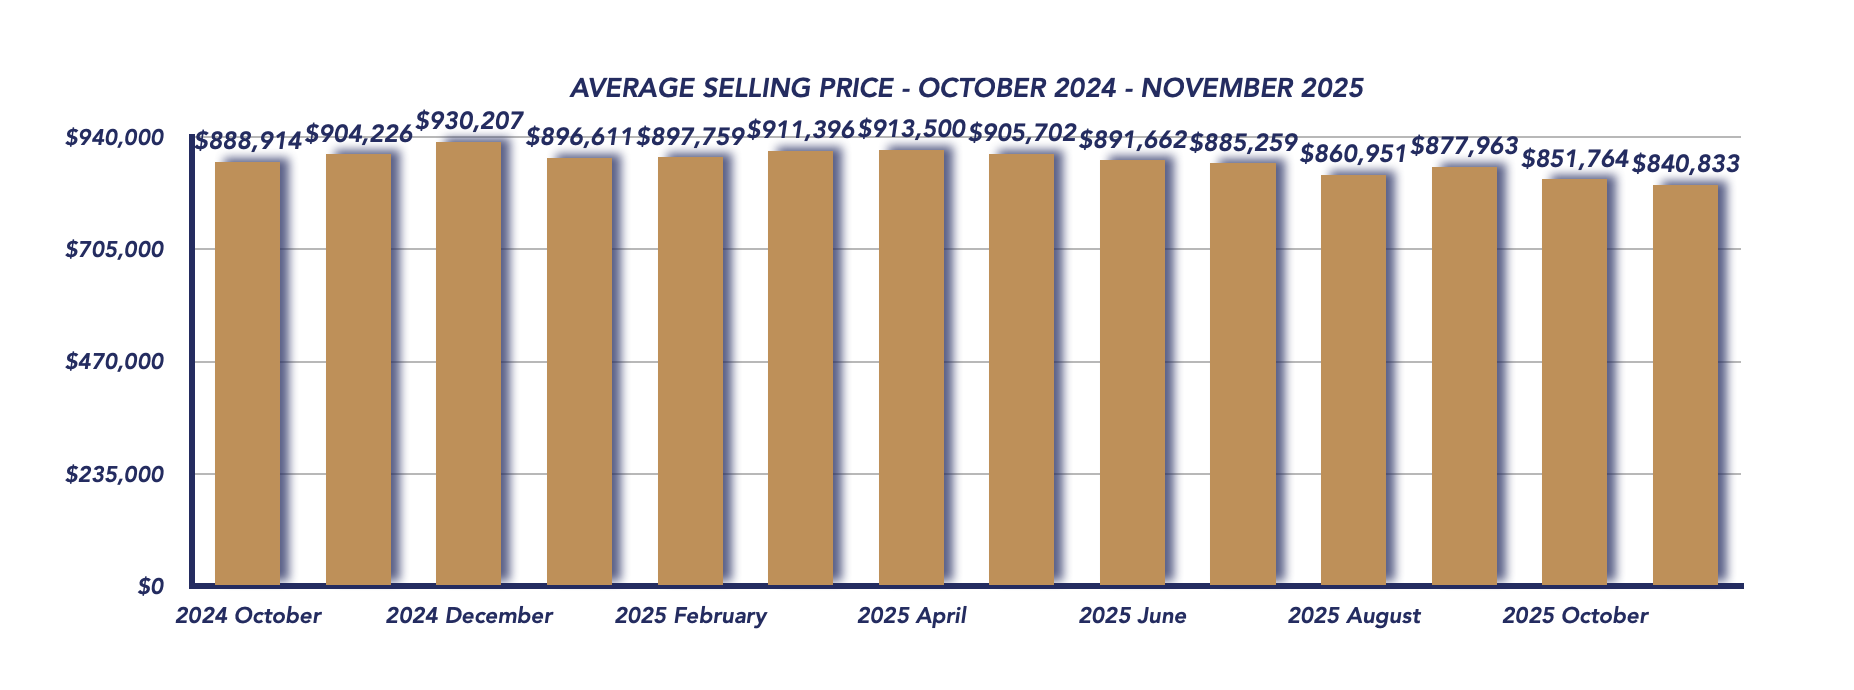
The average sale price in November landed at $840,833, marking a 1.3% decrease from October’s $851,764 and a 7.0% drop compared to November 2024’s $904,226. This softening aligns with seasonal expectations, as late fall and early winter traditionally bring lower price points due to reduced competition and more cautious buyer behavior.
Despite the decline, price movements remain moderate rather than dramatic—supporting the idea that the market is functioning in a more level, predictable manner.
📈 Sale-to-List Price Ratio Holds Steady at 99%
The sale-to-list price ratio improved slightly month-over-month, rising from 98% in October to 99% in November. While still below the 100% ratio seen last year, this is a positive sign that sellers are achieving close to asking price when homes are priced competitively.
This small uptick also indicates that motivated buyers are still engaging, even as overall activity cools.
📉 Sales Decline Into Late Fall
Durham recorded 622 sales in November, down from 715 in October, reflecting the expected seasonal slowdown. Year-over-year, sales were also lower compared to 739 transactions in November 2024.
However, the decline is not disproportionate and mirrors typical late-year patterns across the GTA. Buyers tend to delay moves until after the holiday season, making this dip more reflective of timing than weakening demand.

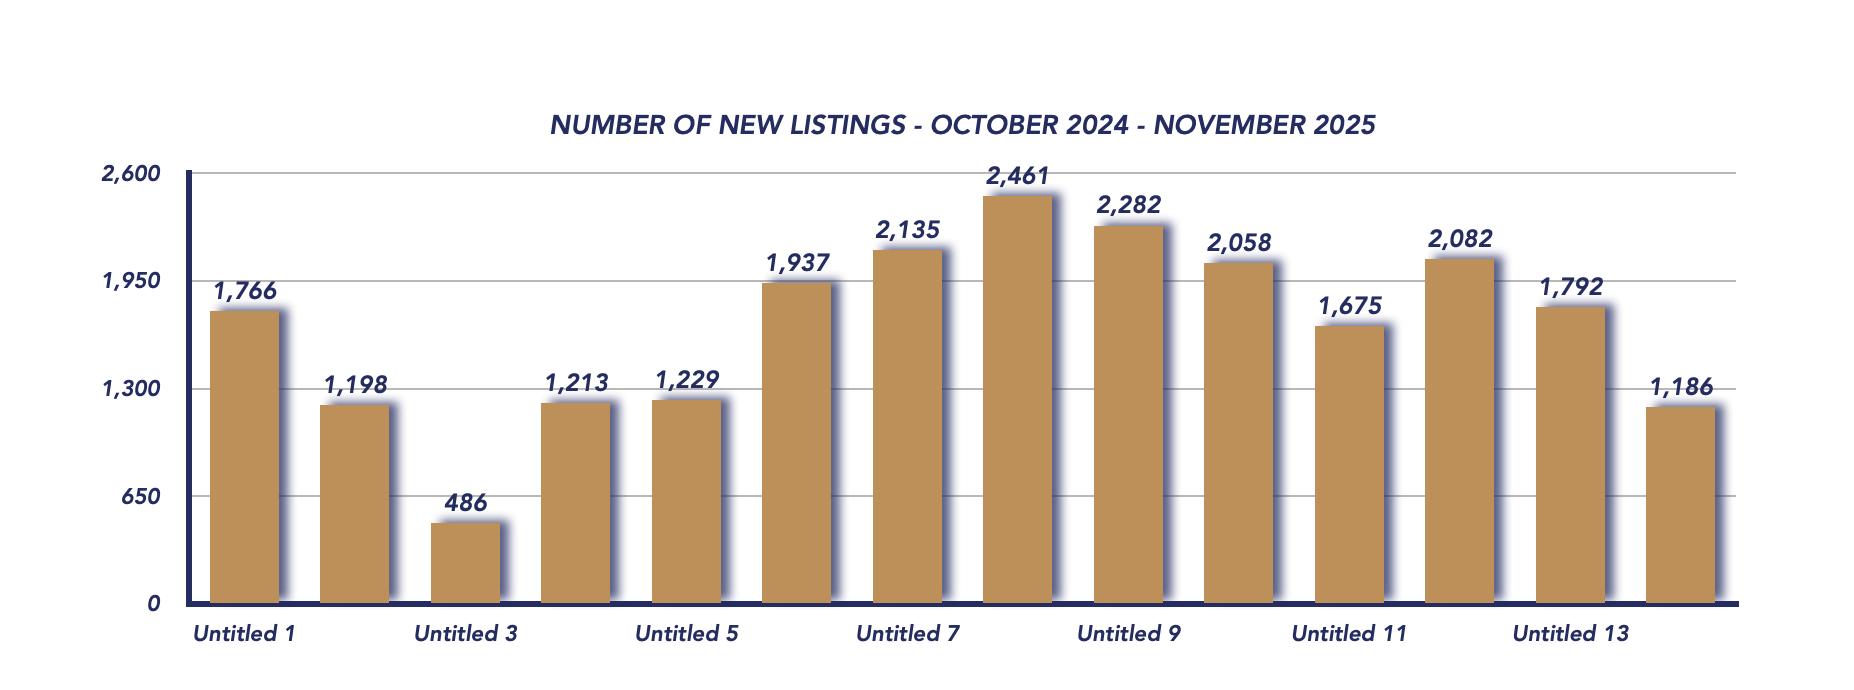
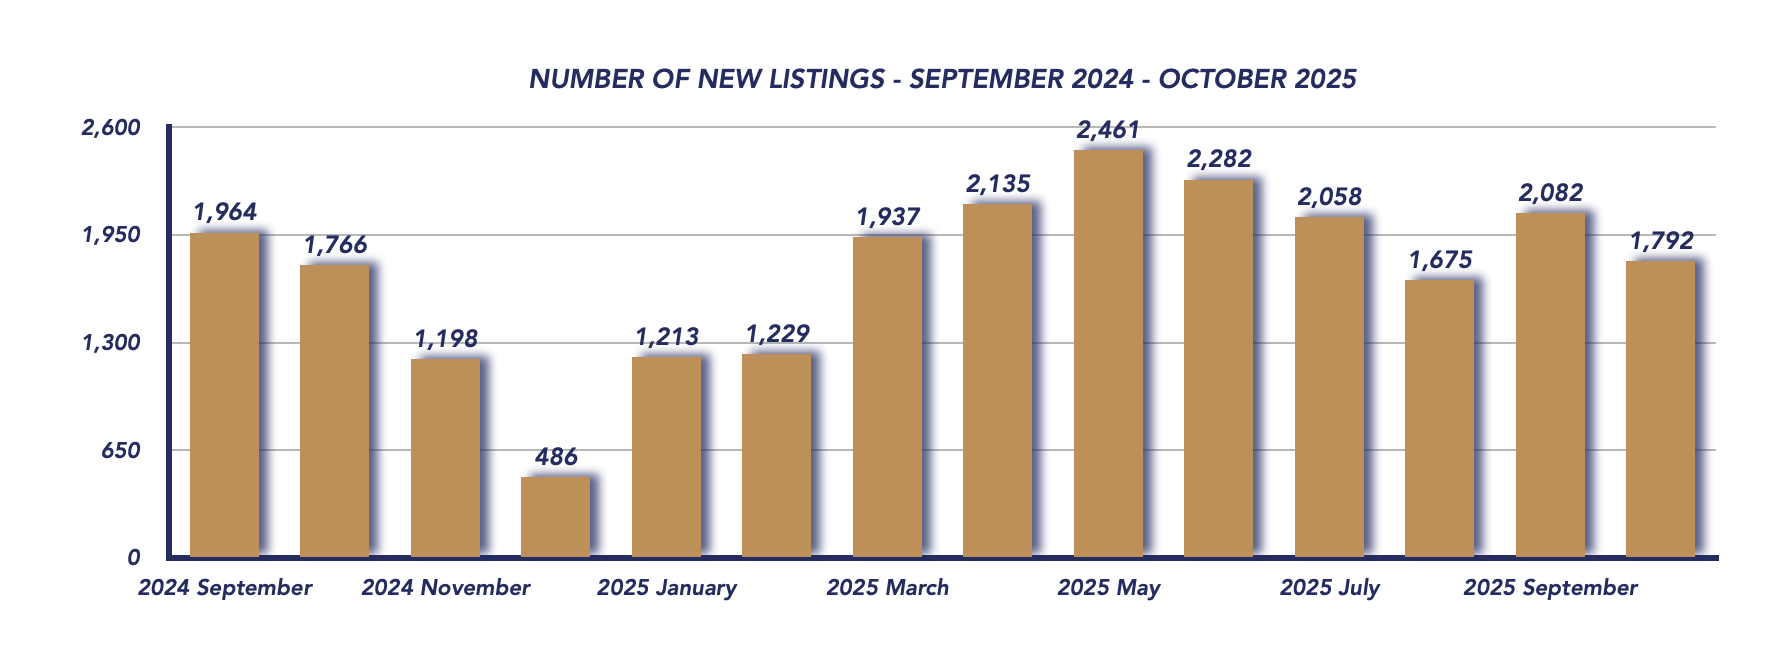
📉 New Listings Drop Sharply
One of the most notable changes this month was the steep decline in new inventory.
New listings fell to 1,186, down significantly from 1,792 in October, and nearly identical to the 1,198 recorded last November.
This drop signals that many sellers are choosing to hold off listing until the new year—an expected seasonal trend that also contributes to tightening supply.
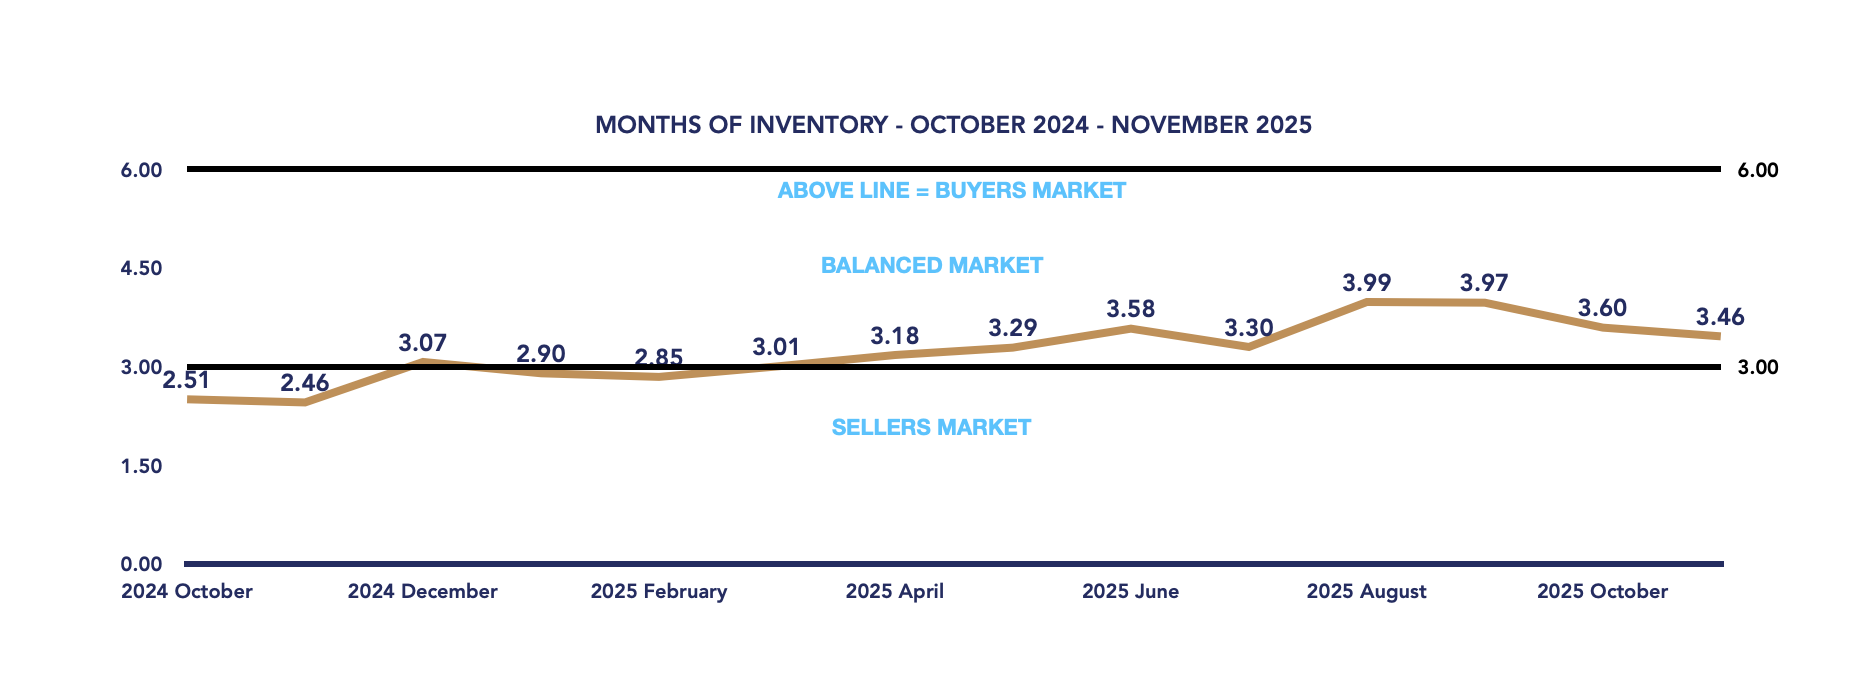
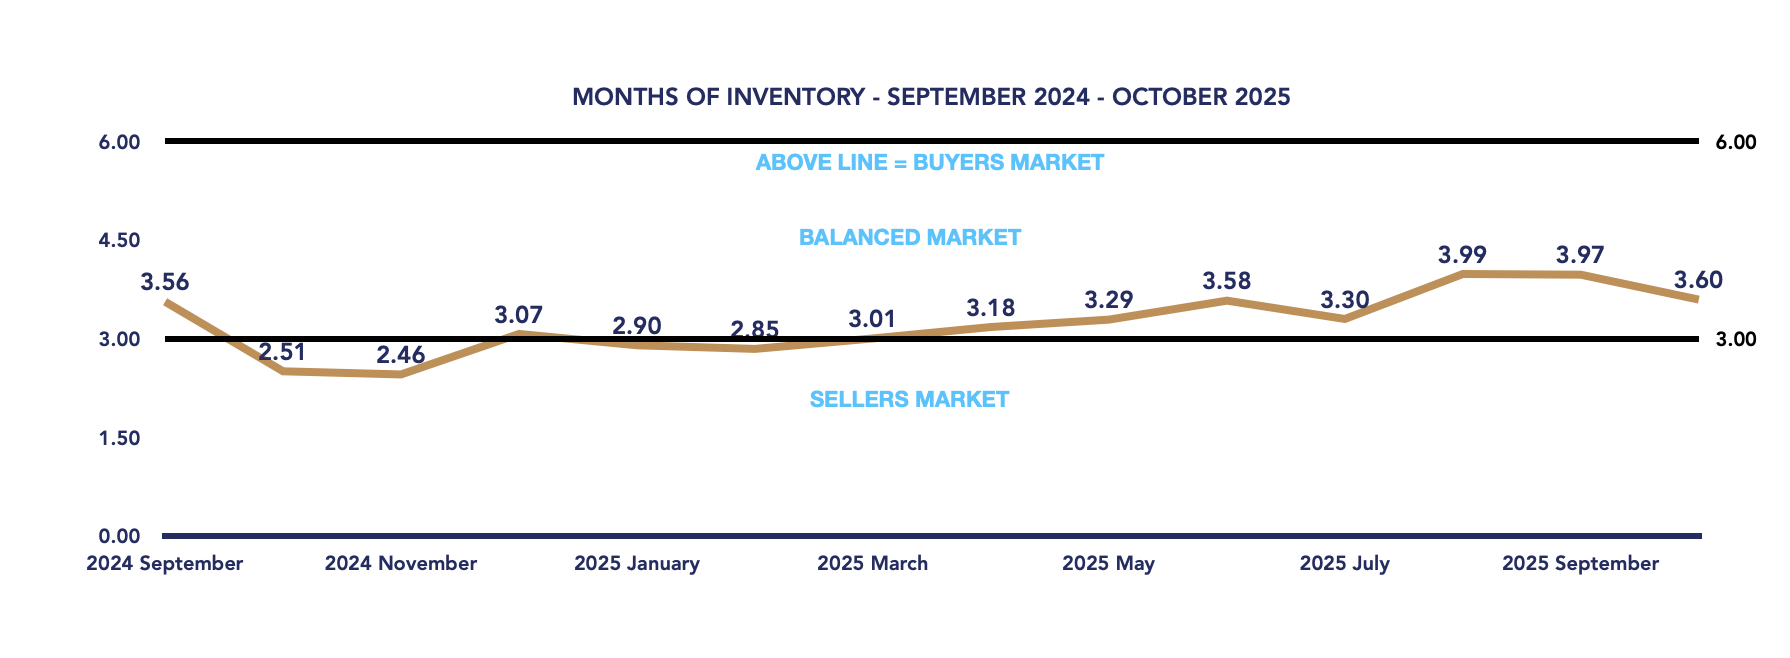
⏳ Homes Taking Longer to Sell, but Inventory Tightens Slightly
The average days on market rose again to 51 days, up from 47 in October, showing that buyers are taking longer to make decisions and that homes require more time to secure firm offers.
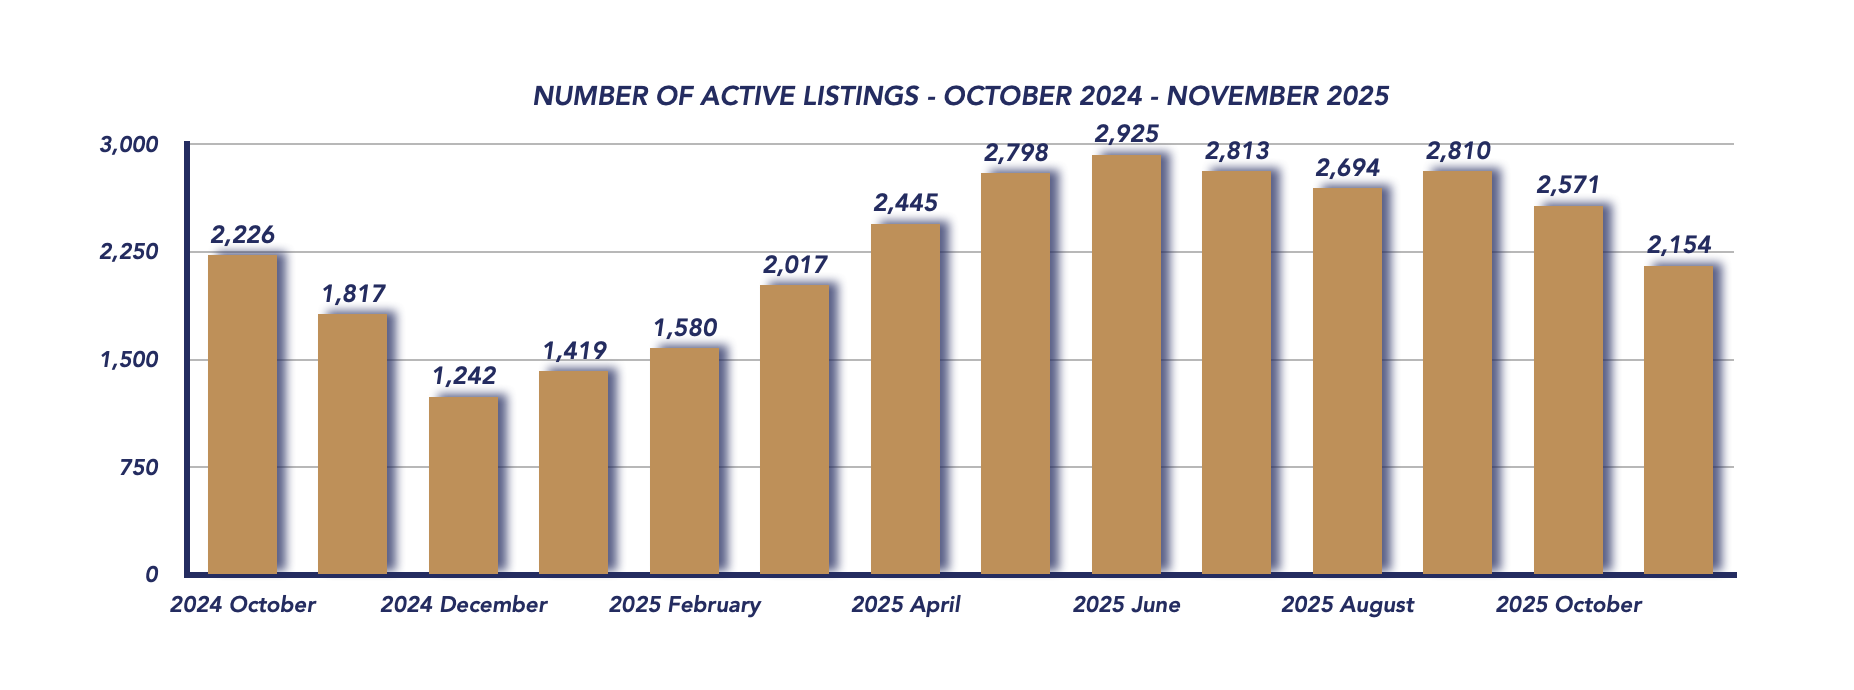
Surprisingly, despite slower sales, months of inventory dipped slightly from 3.60 to 3.46, due to the sharp decline in new listings. This keeps Durham in balanced market territory, where neither buyers nor sellers hold a dominant advantage.
Conclusion
November 2025 continued Durham’s trend toward steady balance. Prices eased, sales slowed, and inventory tightened—but all within expected seasonal norms. While year-over-year figures highlight softer conditions compared to 2024, the market remains stable rather than stressed.
As we move into December and the quietest stretch of the real estate calendar, the region is well positioned for a more active start to 2026. With the GTA experiencing pockets of renewed confidence, time will tell whether that momentum spreads east into Durham once the new year’s activity ramps up.
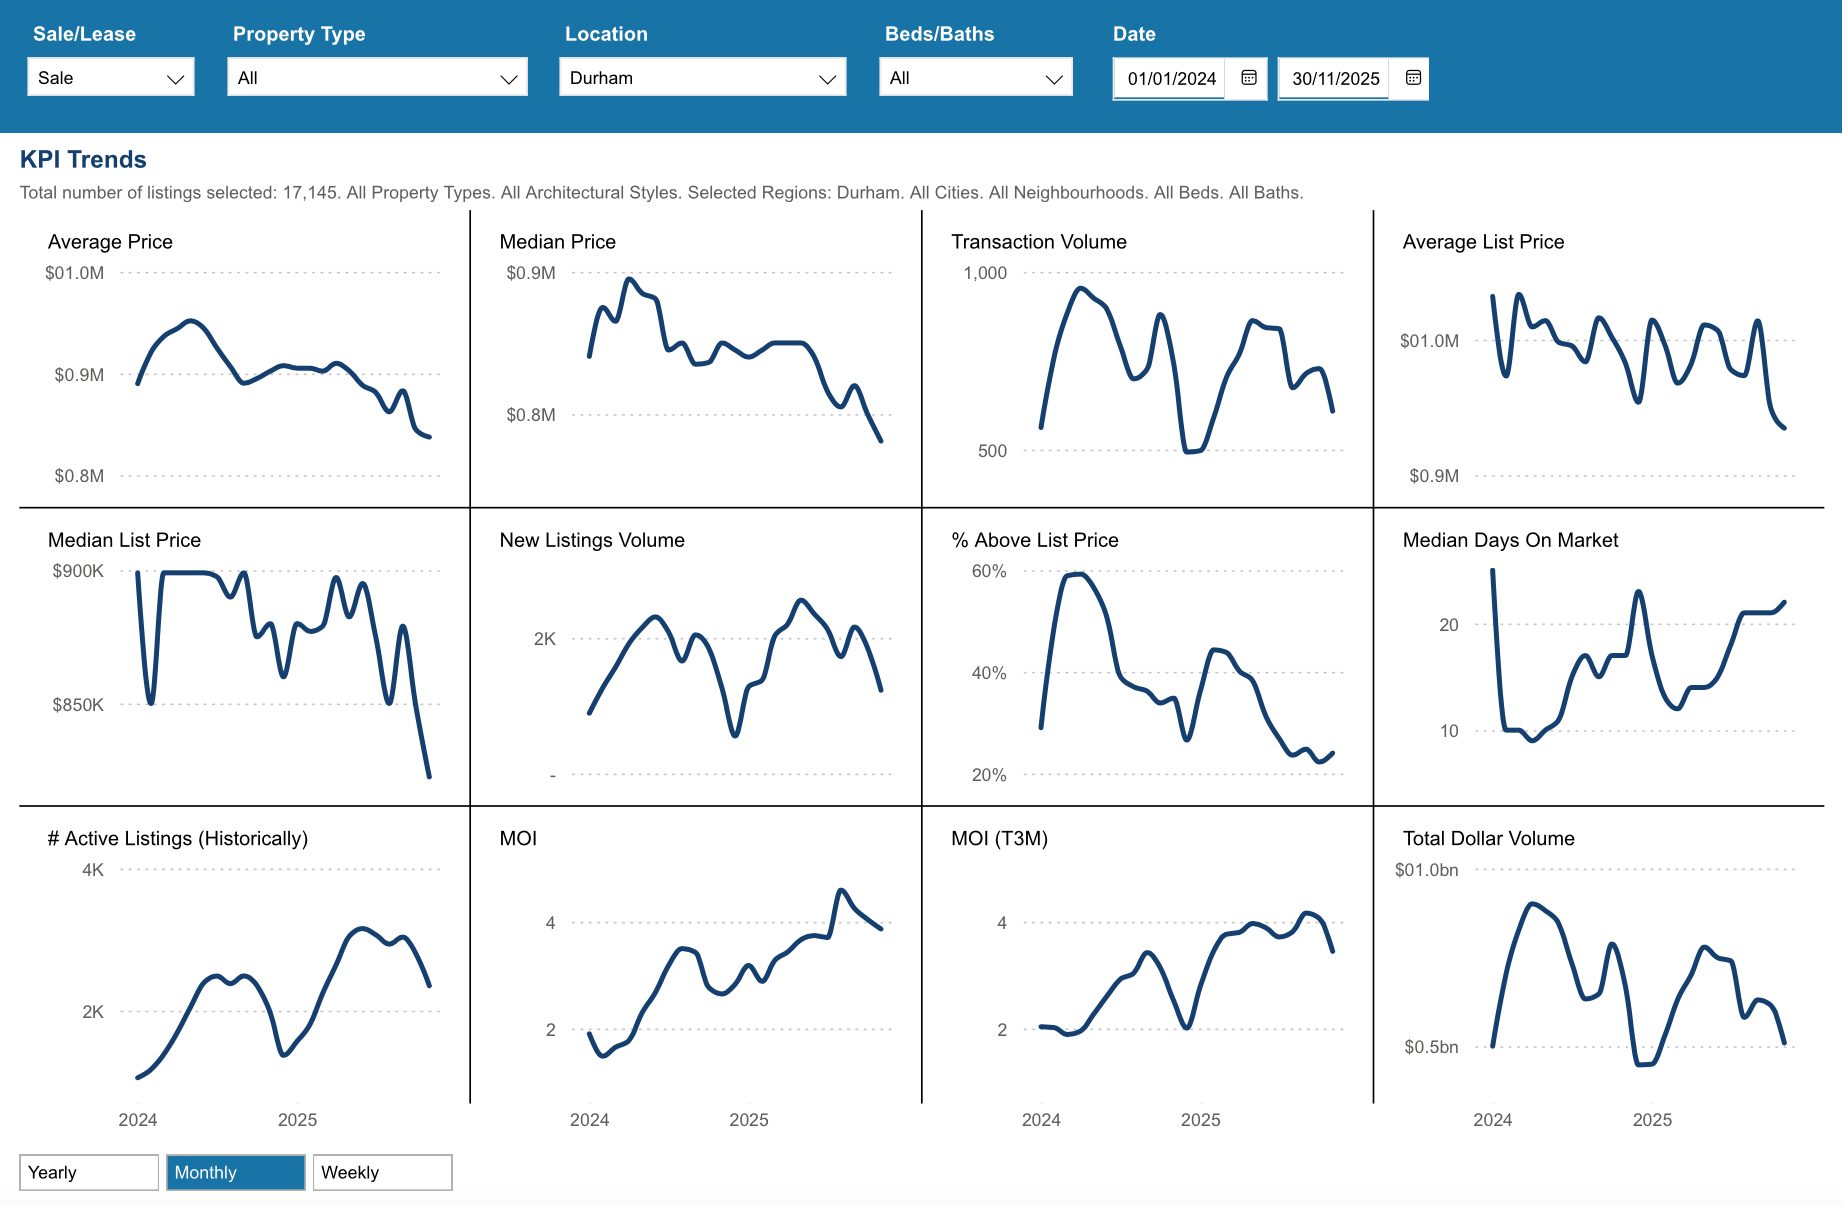
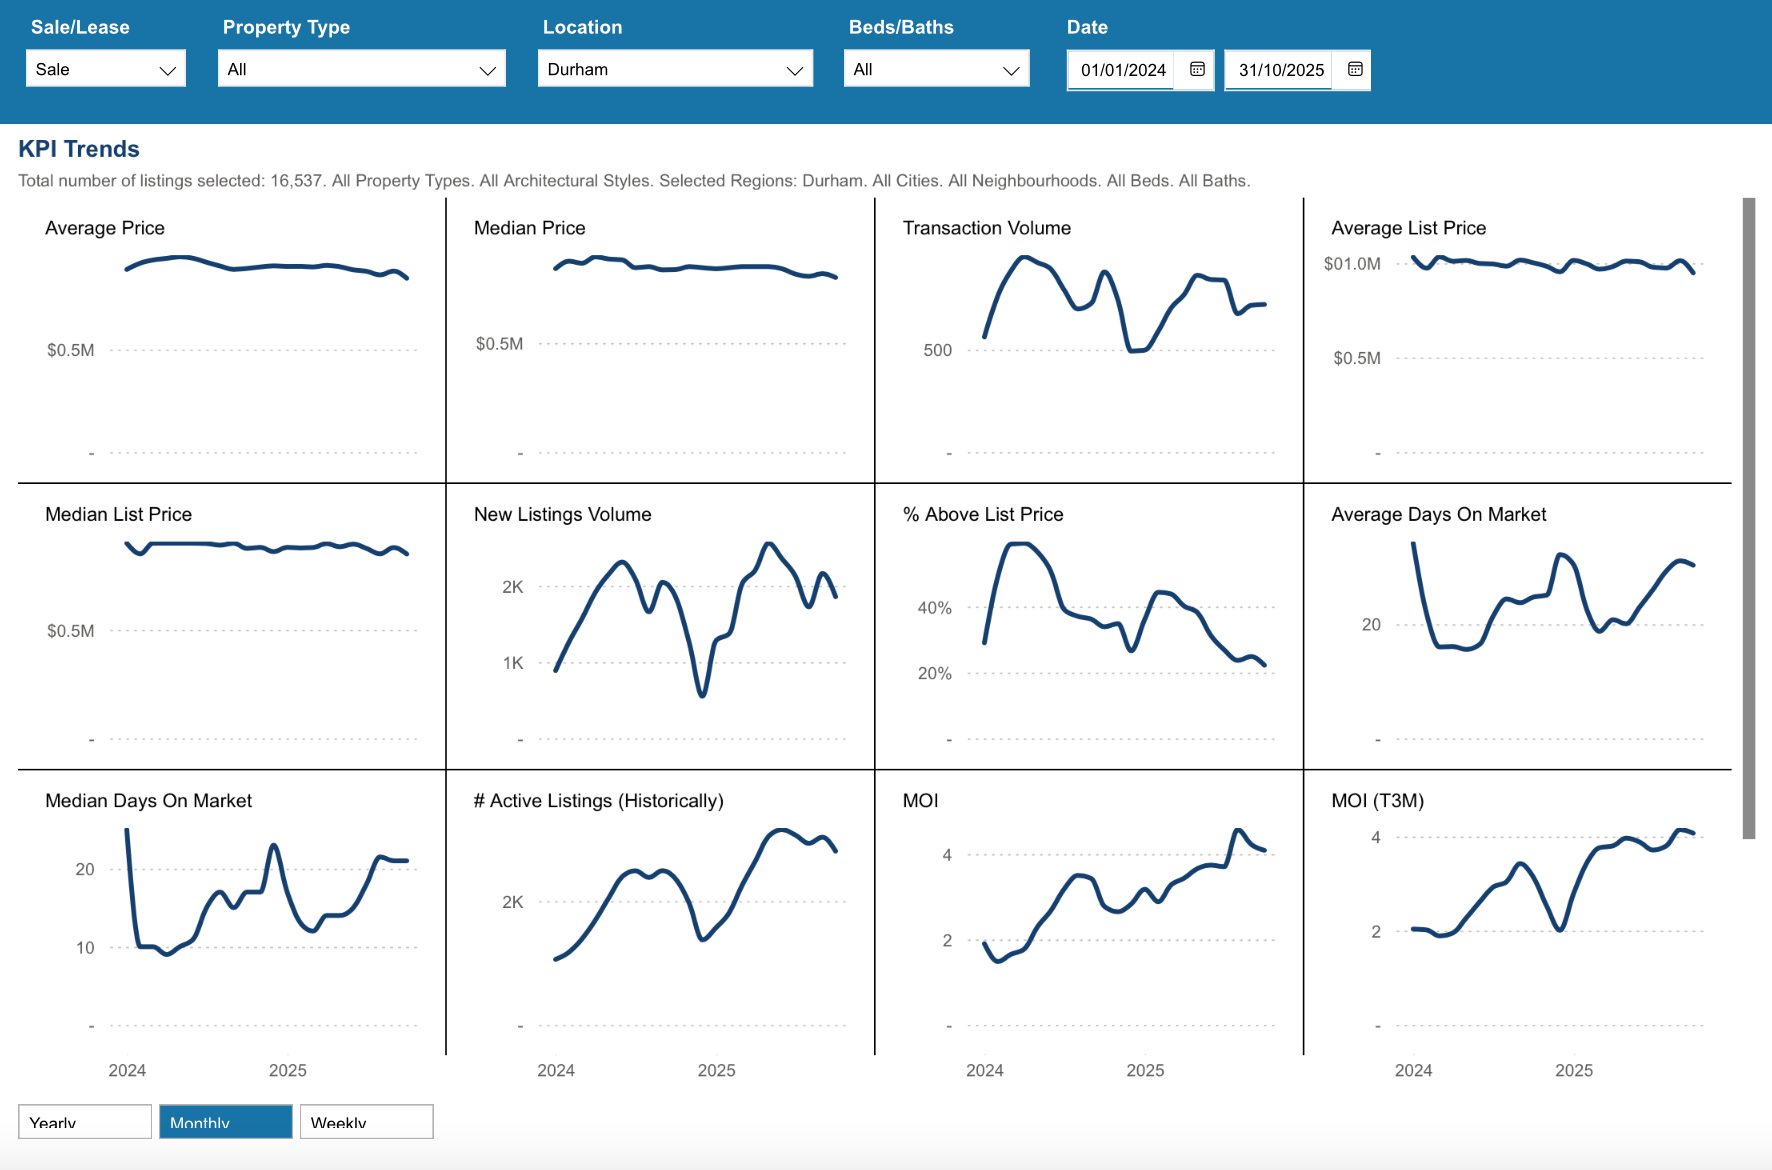
Key Performance Indicators (KPIs) from January 2024 through November 2025 provide a clear snapshot of how the Durham Region real estate market has evolved across all property types, architectural styles, and home configurations
*Information is believed to be accurate at time of posting but is not guaranteed to be correct. Some values may vary slightly based on the exact date and time the reports were generated. Market stats are provided by TRREB (Toronto Regional Real Estate Board) and are based on sales for the month of Attached/Row/Townhouses, Condo Apartments, Condo Townhouses, Detached, Detached with Common Elements, Link Homes and Semi-detached. *Some values may vary slightly based on the exact date and time the reports were generated.
Not intended as a solicitation if your property is already listed by another broker. Affiliated real estate agents are independent contractor sales associates, not employees. ©2021 Coldwell Banker. All Rights Reserved. Coldwell Banker and the Coldwell Banker logos are trademarks of Coldwell Banker Real Estate LLC. The Coldwell Banker® System is comprised of company owned offices which are owned by a subsidiary of Realogy Brokerage Group LLC and franchised offices which are independently owned and operated. The Coldwell Banker System fully supports the principles of the Fair Housing Act and the Equal Opportunity Act.
Click below for more reports
Check out our Uxbridge and Scugog Events Pages to keep up to date on whats going on around town. Click the links or scan the Code with your phone to take you directly there.
UXBRIDGE EVENTS
SCUGOG EVENTS
Monday Market Minute December 8

Monday Market Minute – Uxbridge & Scugog Real Estate Update
Week of November 30 to December 2
Welcome to this week’s Monday Market Minute, your quick snapshot of what’s happening in the real estate markets across the Township of Uxbridge and the Township of Scugog. As we move deeper into December, we’re seeing typical seasonal patterns emerge, with tightening inventory and steady buyer activity in both communities.
Weekly Real Estate Market Minute for the Townships of Uxbridge and Scugog
Uxbridge Real Estate Overview
The Uxbridge market held steady this week with 1 new listing, the same number we saw last week. In addition, 2 previously listed properties returned to the market, adding some movement to the inventory.
Price adjustments slowed noticeably, with 3 changes compared to 7 last week, suggesting that sellers may be settling into more accurate pricing as the year winds down.
Buyer activity picked up slightly:
-
5 conditional sales (up from 3 last week)
-
4 firm sales (just one fewer than last week)
Active inventory dipped to 130 homes, down from 136, keeping supply tight as buyers continue to make thoughtful moves before year-end.
Scugog Real Estate Overview
Scugog had a quieter week for new inventory, with 3 new listings—down from 7 last week. However, 7 returning listings came back to the market, contributing to overall activity.
Price adjustments remained consistent with 9 changes, matching last week’s total.
Sales activity showed solid engagement:
-
5 conditional sales (up from 4 last week)
-
5 firm sales (compared to 7 last week)
Active listings decreased to 107, down from 112, reflecting the seasonal slowdown and continued buyer interest.
What This Means for Buyers & Sellers
Both Uxbridge and Scugog are showing signs of typical December market behaviour:
-
Lower new inventory,
-
Steady buyer activity, and
-
A gradual tightening of supply.
For buyers, opportunities still exist—especially with returning listings and strategic price adjustments. For sellers, continued buyer engagement means well-priced homes are moving.
If you’re thinking about buying or selling in the coming months, Chris and I are always here to help guide you through the market.
Thank You For Watching
The Monday Market Minute December 8
Check out our Uxbridge and Scugog Events Pages to keep up to date on whats going on around town. Click the links or scan the Code with your phone to take you directly there.
UXBRIDGE EVENTS
SCUGOG EVENTS
The Port Perry Grain Elevator

The Port Perry Grain Elevator: A Towering Legacy on the Waterfront
Standing proudly on the shores of Port Perry’s waterfront is one of Canada’s most remarkable historic structures: the Port Perry Grain Elevator. More than just a striking silhouette against the skyline, this iconic building is recognized as Canada’s oldest and most significant wood bin grain elevator—a testament to the town’s agricultural past and its resilience.
Early Beginnings: The Vision of George and Mark Currie
The story begins with George Currie, who arrived in Prince Albert after several years working as a grain merchant in Oshawa. In 1844, he launched a grain-buying business in the area, soon joined by his brother Mark, with whom he operated a thriving general merchandising store specializing in dry goods, liquors, wines, and even children’s wear.
By the 1850s, the Currie brothers had become one of the region’s leading grain purchasers, building a strong foundation for the agricultural economy that would shape Port Perry’s future.
.

.
Constructing a Giant: Building the Elevator in 1874
Although detailed records are limited, it is known that construction on the massive grain elevator began in April 1874. Built on a robust 24-inch stone foundation, the structure rose to an impressive 58 feet. Its enormous frame was crafted from heavy pine beams, while the exterior was clad in thick lumber—2×8 boards covering the first 26 feet and 2×6 boards above, all topped with vertical boarding to protect the joints.
Original accounts note that the building was painted a distinctive rusty red, making it an even more eye-catching presence on the waterfront.
The Ross Era and Survival of the Great Fire
Around 1876, George Currie sold the elevator to his partner Aaron Ross, who operated the business as A. Ross Elevator. When Aaron’s son William joined the company, the name changed to Ross & Son Elevator, marking a new chapter in its operation.
In July 1884, disaster struck. A devastating fire tore through Port Perry, destroying much of the town. Yet the grain elevator, remarkably, was the only building to survive—a fact that further cemented its status as a community landmark.
By 1900, the mill boasted 18 bins, each capable of holding a substantial 2,000 bushels of grain. Around this time, William Ross also upgraded the structure with protective metal siding.
A Century of Changing Hands
The early 20th century saw several ownership changes:
-
1909 – William Ross retired, selling to James Lucas
-
1916 – Lucas sold to Hogg and Lytle
-
Later – Hogg and Lytle sold to Toronto Elevators
In 1962, the elevator found its final industrial owner when Maple Leaf Mills (Master Feeds) assumed control, operating the mill until its closure in 1979.
.

.
A New Purpose and Preservation
With the industrial chapter coming to an end, the elevator was purchased in 1980 by Fred Burghgraef, whose son Jim opened Port Perry Auto Supply in the building the following year. Locals affectionately came to know the structure as “The Old Mill.”
A significant milestone came in 2009, when the Township of Scugog acquired the property, completing municipal ownership of the surrounding waterfront block. This purchase ensured that the iconic elevator would remain a protected and celebrated feature of Port Perry’s historic lakeshore.
A Star on Screen
The elevator’s dramatic appearance and rustic charm have made it a popular filming location over the years, with the site appearing in several movies—a nod to its timeless and atmospheric presence.
A Lasting Symbol of Port Perry
Today, the Port Perry Grain Elevator stands as a rare surviving example of early Canadian grain-handling architecture. Its age, size, and wooden construction make it the largest and oldest wood bin elevator in the country—a truly irreplaceable heritage landmark.
Whether viewed as a relic of Port Perry’s agricultural roots, a survivor of tragedy, or a chapter in the story of the town’s waterfront, the Port Perry Grain Elevator continues to inspire admiration. It remains not just a building, but a symbol of resilience, innovation, and the enduring spirit of the community.
Source:
George Currie’s Grain Elevator Researched and published by J. Peter Hvidsten
Monday Market Minute December 1

Monday Market Minute – Uxbridge & Scugog Real Estate Update
Week of November 23 to November 29
.
By Shane Coxworth, Coldwell Banker R.M.R. Real Estate
As we moved into the final days of November, both Uxbridge and Scugog saw noticeable shifts in inventory levels, signaling the seasonal slowdown that typically arrives this time of year. Here’s your full breakdown of what happened in the local real estate markets during the week of November 23rd to November 29th.
.
Weekly Real Estate Market Minute for the Townships of Uxbridge and Scugog
.
Uxbridge Market Highlights
The Uxbridge market was quieter this week, with limited new inventory coming online:
-
1 new listing, down from 3 the previous week
-
6 listings returned to the market
-
7 price adjustments, more than double last week’s 3
-
3 conditional sales, compared to 5 last week
-
5 firm sales, down slightly from 7
-
136 active listings at week’s end, down from 144
Despite fewer new listings, price adjustments increased as sellers work to position their homes competitively heading into December.
Scugog Market Highlights
The Scugog market was more active on the listing side, though overall inventory still moved downward:
-
7 new listings, up from 4 last week
-
8 listings returned to market
-
9 price adjustments, down from last week’s 13
-
4 conditional sales, matching the previous week
-
7 firm sales, also matching last week
-
112 active listings, a drop from 118
Steady sales activity paired with fewer overall listings suggests buyers are still motivated despite the slower season.
What This Means for Buyers & Sellers
As expected, inventory continues to tighten as the holidays approach. For buyers, this means less selection but also fewer competing offers. For sellers, motivated buyers remain in the market, and well-priced homes are still moving.
If you’re considering buying or selling, now is a great time to plan your next steps. I’m here to help you navigate the winter market confidently.
Thank You For Watching
The Monday Market Minute December 1
Check out our Uxbridge and Scugog Events Pages to keep up to date on whats going on around town. Click the links or scan the Code with your phone to take you directly there.
UXBRIDGE EVENTS
SCUGOG EVENTS
Monday Market Minute November 24

Monday Market Minute – Uxbridge & Scugog Real Estate Update
Week of November 16 to November 22
As we move toward the end of November, both the Uxbridge and Scugog real estate markets continue to show shifting momentum with reduced inventory and steady buyer activity. Here’s your full breakdown of what happened between November 16th and November 22nd.
Weekly Real Estate Market Minute for the Townships of Uxbridge and Scugog
Uxbridge Real Estate Highlights
This week in Uxbridge, the market remained active but continued its gradual tightening:
-
3 new listings hit the market (down from 4 the previous week).
-
5 previously listed properties returned to the market.
-
Only 3 properties saw price adjustments, a sharp decrease from last week’s 14, suggesting more stable pricing.
-
5 conditional sales were recorded (similar to 6 last week).
-
7 firm sales, up slightly from 6 the previous week.
-
144 active listings remained at week’s end, down from 145.
With fewer price changes and solid sales activity, the Uxbridge market appears to be stabilizing, even as available inventory continues to gradually decline.
Scugog Real Estate Highlights
The Scugog market was also busy, with notable shifts from the previous week:
-
4 new listings entered the market (compared to 5 last week).
-
8 properties were relisted, keeping inventory moving.
-
13 price adjustments, up significantly from 5 the week prior — indicating sellers are adjusting to current buyer behaviour.
-
4 conditional sales compared to 2 last week.
-
7 firm sales, matching last week’s total.
-
118 active listings at the end of the week, a substantial drop from 129.
Lower inventory but steady firm sales suggest that motivated buyers are still active heading into late fall — especially as well-priced homes continue to attract attention.
What This Means for Buyers & Sellers
Both markets are seeing declining inventory, which is typical leading into the winter months. Well-priced homes continue to move, and sellers who strategically position their properties in the market are finding buyers.
If you’re considering buying or selling, understanding these weekly shifts is key. Whether you’re adjusting pricing, preparing to list, or waiting for the right opportunity — we’re here to guide you every step of the way.
If you’re curious how your property fits into the current market, reach out anytime.
Thank You For Watching
The Monday Market Minute November 24
Check out our Uxbridge and Scugog Events Pages to keep up to date on whats going on around town. Click the links or scan the Code with your phone to take you directly there.
UXBRIDGE EVENTS
SCUGOG EVENTS
Monday Market Minute November 17

Monday Market Minute – Uxbridge & Scugog Real Estate Update
Week of November 9 to November 17
Welcome to this week’s Monday Market Minute! Here’s your quick summary of what’s happening in the real estate markets for Uxbridge and Scugog as we move further into the spring market.
Weekly Real Estate Market Minute for the Townships of Uxbridge and Scugog
The second week of November brought steady activity and shifting inventory levels across both the Township of Uxbridge and the Township of Scugog. Here’s your detailed look at what happened in the local real estate market from November 9 to November 15, 2025.
Uxbridge Real Estate Market Update
Uxbridge experienced another balanced week, with several indicators showing increased movement compared to the previous period.
New & Returning Listings
-
4 new listings – the same number as last week
-
10 properties returned to market after previously being listed
While new listing activity remained steady, the higher number of returning listings contributed to a moderate level of overall inventory cycling through the system.
Price Adjustments
-
14 price reductions, up from 10 last week
This increase reflects sellers continuing to adjust expectations in response to buyer activity and market conditions.
Sales Activity
-
6 conditional sales (down from 8)
-
6 firm sales (up from 3)
The big story in Uxbridge this week was the jump in firm sales, doubling week-over-week and signaling strong buyer commitment.
Active Inventory
-
145 active listings, down from 155
Lower inventory, combined with steady sales, suggests tightening conditions as we move further into the fall market.
Scugog Real Estate Market Update
Scugog also saw meaningful shifts this week, especially in firm sales and total active inventory.
New & Returning Listings
-
5 new listings (down from 7 last week)
-
6 properties returned to market
New listings eased off slightly, while returning listings helped maintain overall activity.
Price Adjustments
-
5 price reductions, down from 9 last week
Fewer adjustments indicate some stabilization in seller pricing.
Sales Activity
-
2 conditional sales (down from 5)
-
7 firm sales (up from 4)
Similar to Uxbridge, Scugog saw a significant increase in firm sales, showing strong buyer confidence heading into mid-November.
Active Inventory
-
129 active listings, down from 138
With fewer listings available, Scugog is also experiencing a tightening market.
Final Thoughts
Both Uxbridge and Scugog are showing declining inventory, stable listing activity, and increasing firm sales—a sign that motivated buyers are still active even as we approach the late fall season.
If you’re thinking about buying or selling and want to understand how these trends impact your plans, we’re here to help you navigate the market with confidence.
Thank You For Watching
The Monday Market Minute November 17
Check out our Uxbridge and Scugog Events Pages to keep up to date on whats going on around town. Click the links or scan the Code with your phone to take you directly there.
UXBRIDGE EVENTS
SCUGOG EVENTS
Uxbridge Housing October 2025

Uxbridge Housing October 2025
Each office is independently owned and operated
![]()
![]()
Housing Market Report for October 2025
Here is the Township of Uxbridge Housing October 2025 report (all housing types), with reports from the Canadian Real Estate Association, and Toronto Regional Real Estate Board included.
This housing report for Durham Region includes the number of new listings, average list price, number of properties sold, average selling price, average days on market and average asking price to selling price ratio for all property types within the Region of Durham.
Scroll to the bottom for links to take you to the housing market reports for Durham Region, Scugog and Brock.
![]()
![]()

From Toronto Regional Real Estate Board
Please note: The PropTx MLS® System, of which TRREB is a part, has added a number of new client boards over the last year. Many of these boards’ Members trade within the Greater Toronto Area and broader Greater Golden Horseshoe regions. As a result, historic data have been updated to reflect the addition of these boards’ listings and transactions. This means historic data have changed relative to previously published static reports. To view updated historic data, click here.
Toronto Regional Real Estate Board – Market Stats At A Glance – October 2025
Read the Toronto Regional Real Estate Board Market Watch Report
![]()
Uxbridge Township Real Estate Market Analysis
October 2025
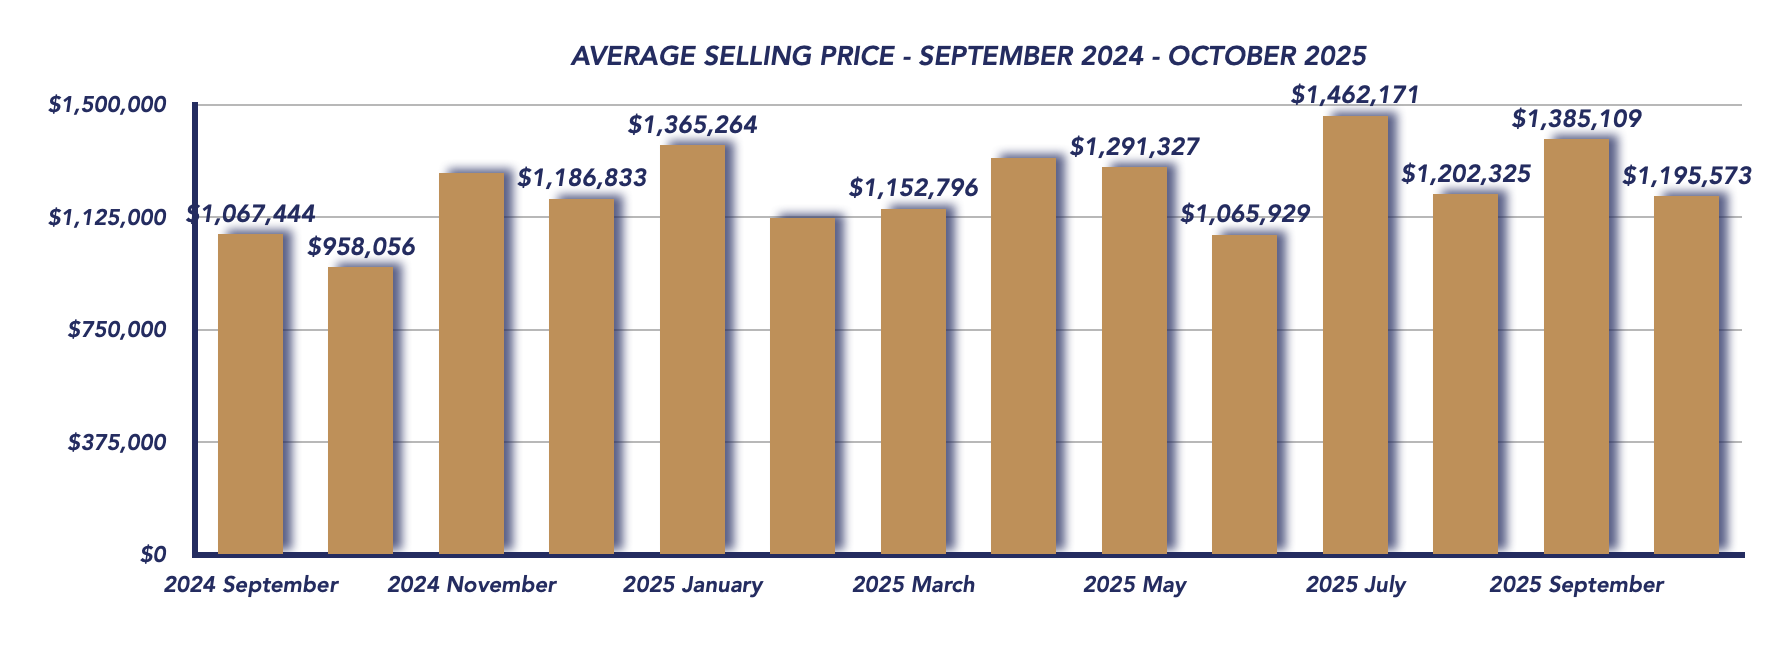
The Uxbridge housing market experienced a moderate cooldown in October 2025, following September’s surge in higher-end sales. The average sale price dropped to $1,195,573, down 13.7% from September’s $1,385,109, yet still up a significant 24.8% compared to October 2024’s $958,056.
October 2025
September 2025
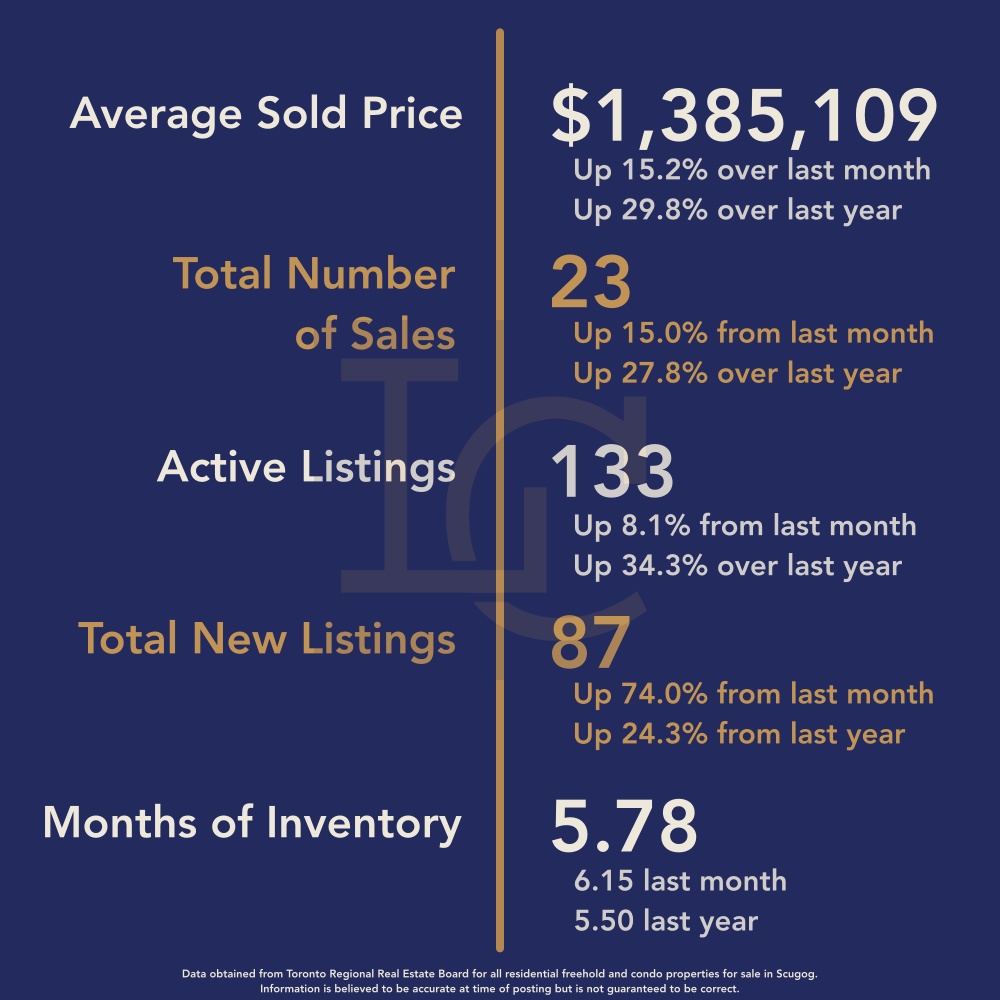
This month’s price decline reflects a shift in the composition of sales, with fewer luxury homes changing hands and more mid- to lower-priced properties contributing to the average. In September, there were two homes sold over $2 million and eight between $1.5M–$2M, while in October, just one property sold above $2 million, three sold between $1.5M–$2M, nine between $1M–$1.5M, and seven homes sold under $800,000.
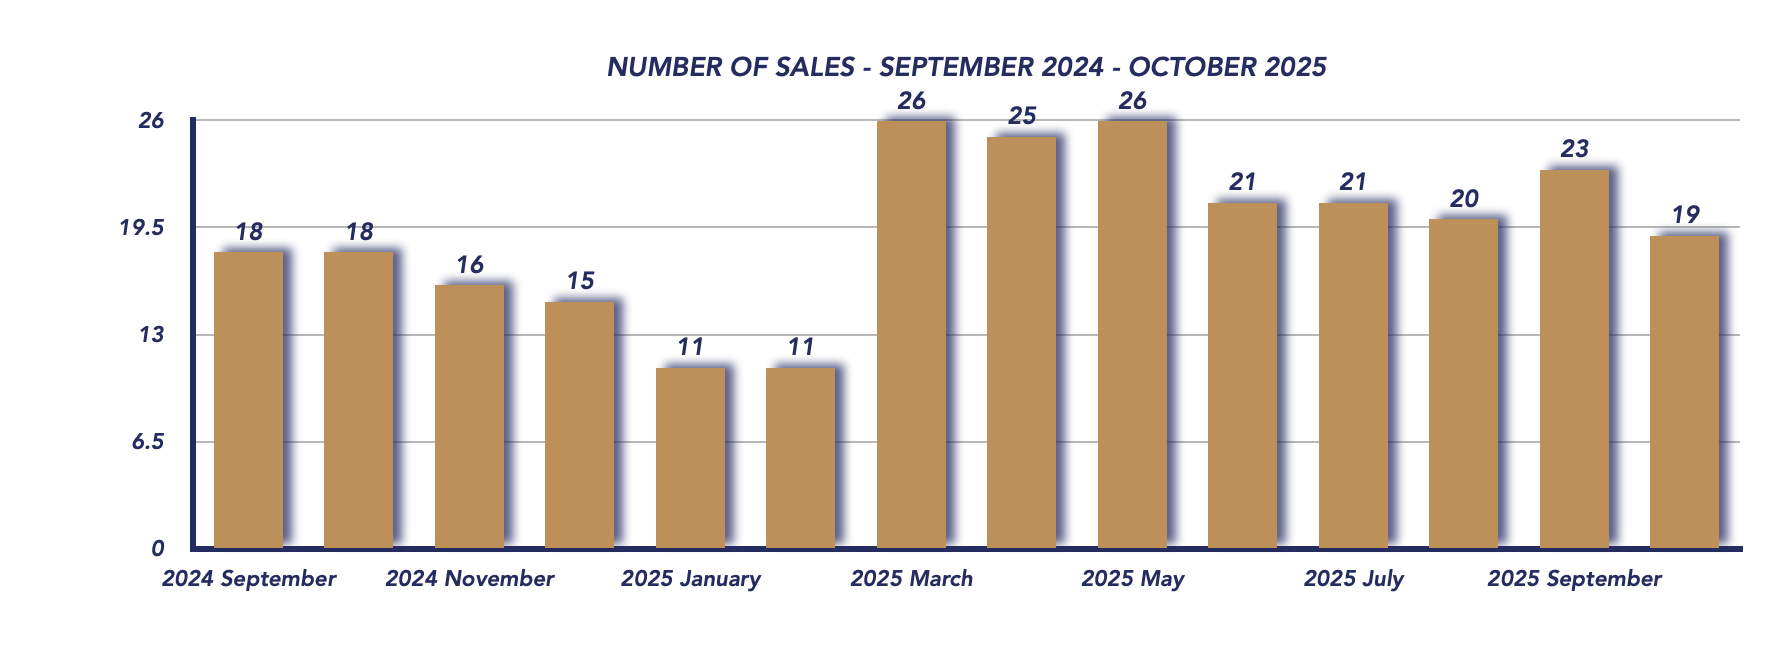
Sales Activity
There were 19 home sales in October, down from 23 in September, but close to October 2024’s total of 18. While this represents a modest dip in monthly activity, the year-over-year consistency shows that buyer interest remains steady, even as affordability challenges persist.
Sale-to-List Price Ratio
The sale-to-list price ratio held steady at 96%, the same as last month. This consistency signals that sellers are continuing to adjust their expectations in line with market conditions, and buyers are still negotiating effectively in a more balanced-to-buyer-leaning market.
Active Listings
Active listings eased slightly to 125, down from 133 in September, but higher than 93 listings in October 2024. Despite a small month-over-month decline, the level of available inventory remains healthy, ensuring buyers have a variety of options across different price points.

New Listings
The number of new listings dropped to 63, compared to 87 in September, but up from 44 last October. This slowdown in new listings heading into the fall is typical for the season, though it may also indicate that some sellers are holding off until market conditions improve or interest rates stabilize.

Days on Market
Properties took an average of 64 days to sell, a slight improvement from 73 days in September. This suggests that while overall activity has softened, well-priced homes are still moving relatively efficiently, particularly those under $1.5 million.
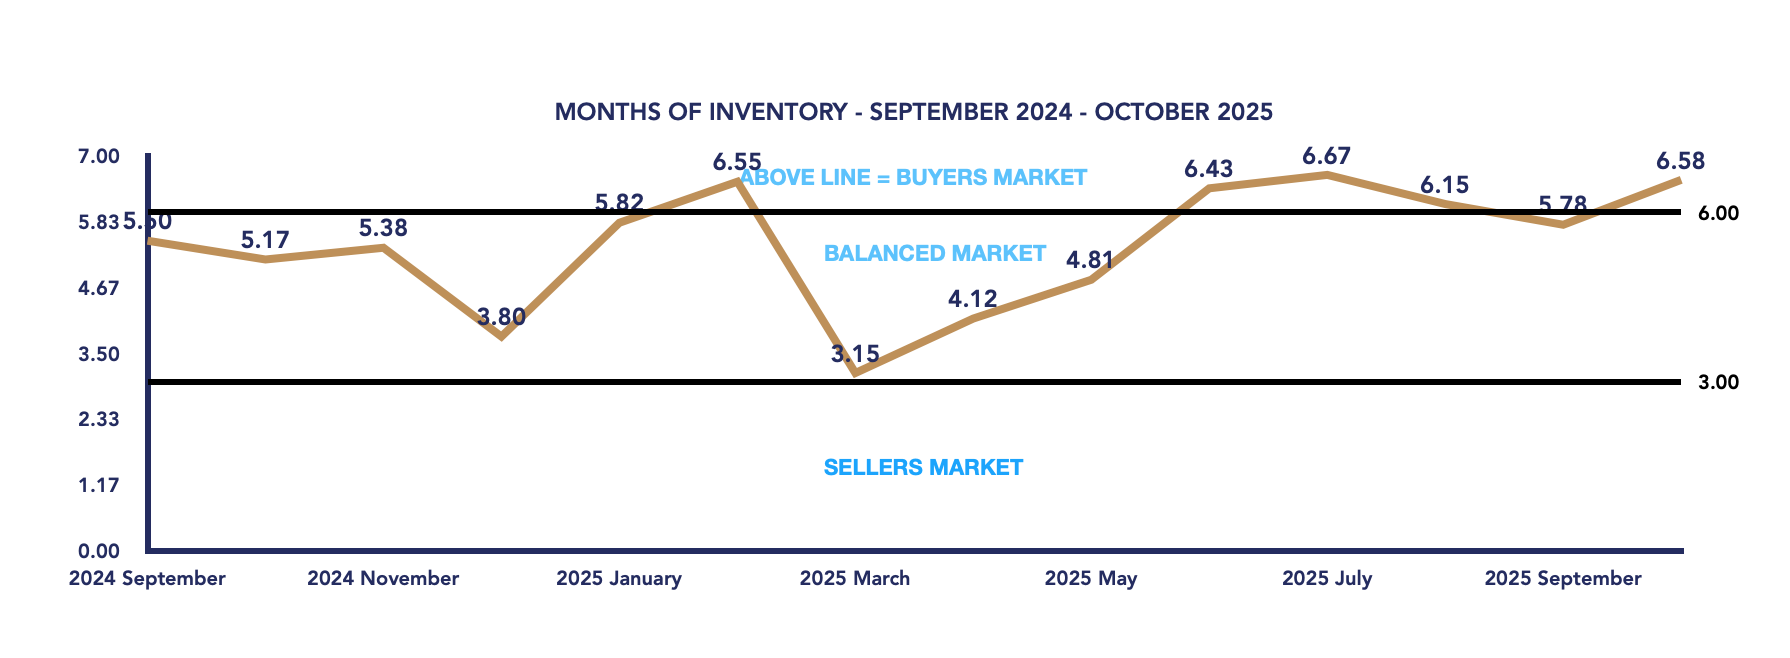
Months of Inventory
The months of inventory increased to 6.58, up from 5.78 in September, marking a return to buyer’s market territory. This rise reflects both fewer sales and a steady flow of active listings, giving buyers more leverage and time to make purchasing decisions.
Conclusion
October 2025 brought a measured correction in the Uxbridge real estate market, following September’s high-value sales spike. Although the average price declined month-over-month, it remains well above last year’s levels, underscoring ongoing demand and stable fundamentals.
With inventory slightly higher and months of supply tipping back toward a buyer’s market, conditions continue to favor those looking to purchase. Sellers, however, can still find success with strategic pricing and realistic expectations. As we move deeper into fall, the market is likely to maintain this steady, balanced tone, setting the stage for a potentially more active start to 2026.
Key Performance Indicators (KPIs) from January 2024 through October 2025 provide a clear snapshot of how the Township of Uxbridge real estate market has evolved across all property types, architectural styles, and home configurations
WATCH OUR MONDAY MARKET MINUTES
*Information is believed to be accurate at time of posting but is not guaranteed to be correct. Some values may vary slightly based on the exact date and time the reports were generated. Market stats are provided by TRREB (Toronto Regional Real Estate Board) and are based on sales for the month of Attached/Row/Townhouses, Condo Apartments, Condo Townhouses, Detached, Detached with Common Elements, Link Homes and Semi-detached. *Some values may vary slightly based on the exact date and time the reports were generated.
Not intended as a solicitation if your property is already listed by another broker. Affiliated real estate agents are independent contractor sales associates, not employees. ©2021 Coldwell Banker. All Rights Reserved. Coldwell Banker and the Coldwell Banker logos are trademarks of Coldwell Banker Real Estate LLC. The Coldwell Banker® System is comprised of company owned offices which are owned by a subsidiary of Realogy Brokerage Group LLC and franchised offices which are independently owned and operated. The Coldwell Banker System fully supports the principles of the Fair Housing Act and the Equal Opportunity Act.
Click below for more reports
Check out our Uxbridge and Scugog Events Pages to keep up to date on whats going on around town. Click the links or scan the Code with your phone to take you directly there.
UXBRIDGE EVENTS
SCUGOG EVENTS
Scugog Housing October 2025

Scugog Housing October 2025
Each office is independently owned and operated
![]()
![]()
Housing Market Report for October 2025
Here is the Township of Scugog Housing October 2025 report (all housing types), with reports from the Canadian Real Estate Association, and Toronto Regional Real Estate Board included.
This housing report for Durham Region includes the number of new listings, average list price, number of properties sold, average selling price, average days on market and average asking price to selling price ratio for all property types within the Region of Durham.
Scroll to the bottom for links to take you to the housing market reports for Durham Region, Uxbridge and Brock.
![]()
![]()
From Toronto Regional Real Estate Board
Please note: The PropTx MLS® System, of which TRREB is a part, has added a number of new client boards over the last year. Many of these boards’ Members trade within the Greater Toronto Area and broader Greater Golden Horseshoe regions. As a result, historic data have been updated to reflect the addition of these boards’ listings and transactions. This means historic data have changed relative to previously published static reports. To view updated historic data, click here.
Toronto Regional Real Estate Board – Market Stats At A Glance – October 2025
Read the Toronto Regional Real Estate Board Market Watch Report
![]()
Scugog Township Real Estate Market Analysis – October 2025
The Township of Scugog’s real estate market showed signs of seasonal cooling in October 2025, as average prices pulled back from September’s highs and sales activity levelled out. Despite softer pricing, market fundamentals remain healthy, with balanced conditions continuing to define the local landscape.
October 2025
September 2025
Average Sales Price
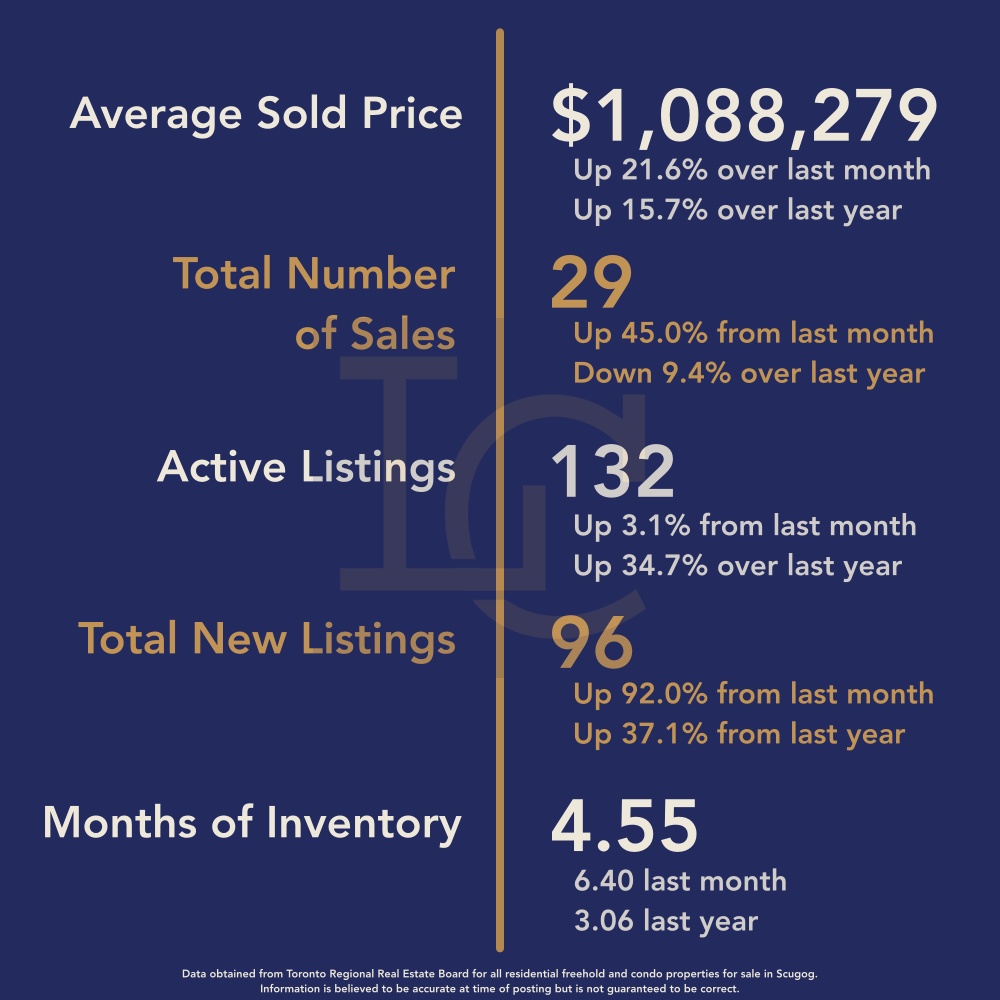
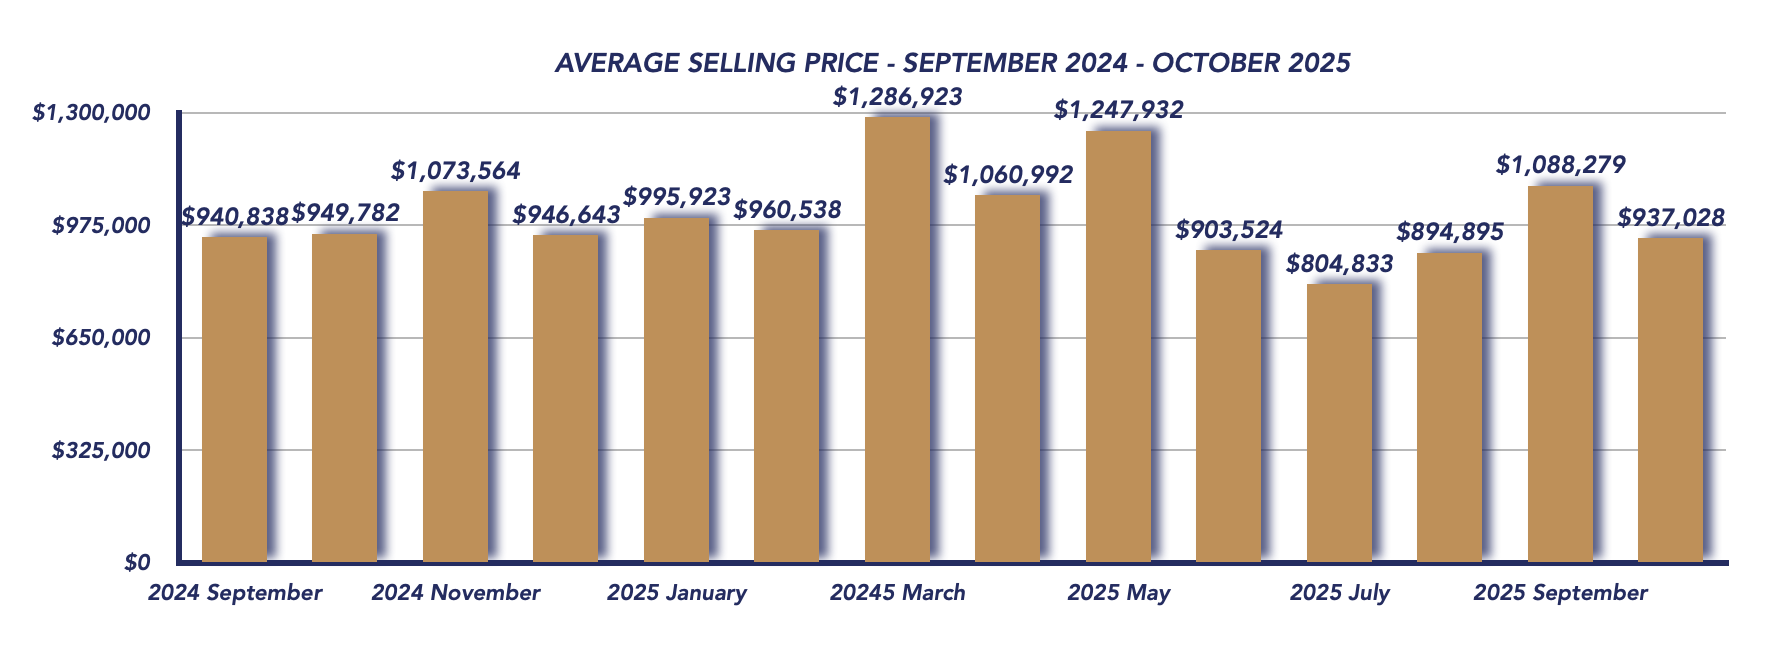
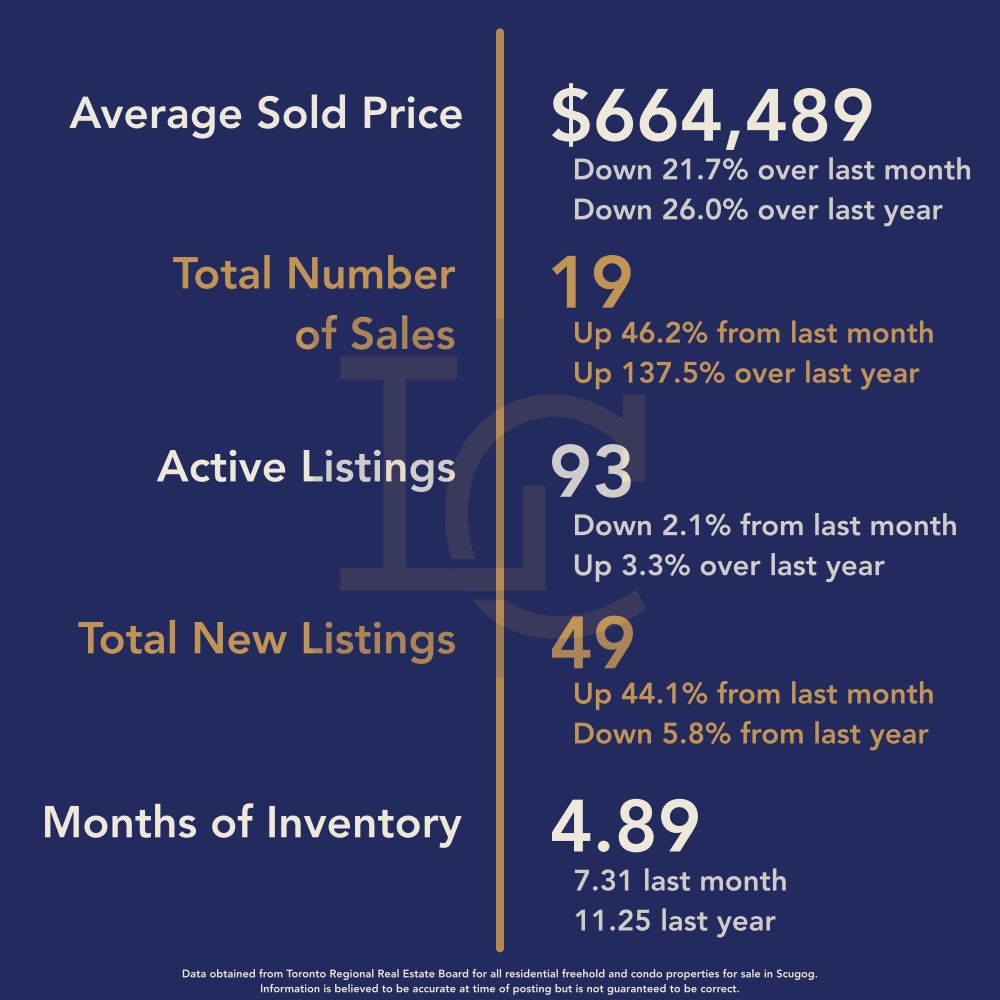
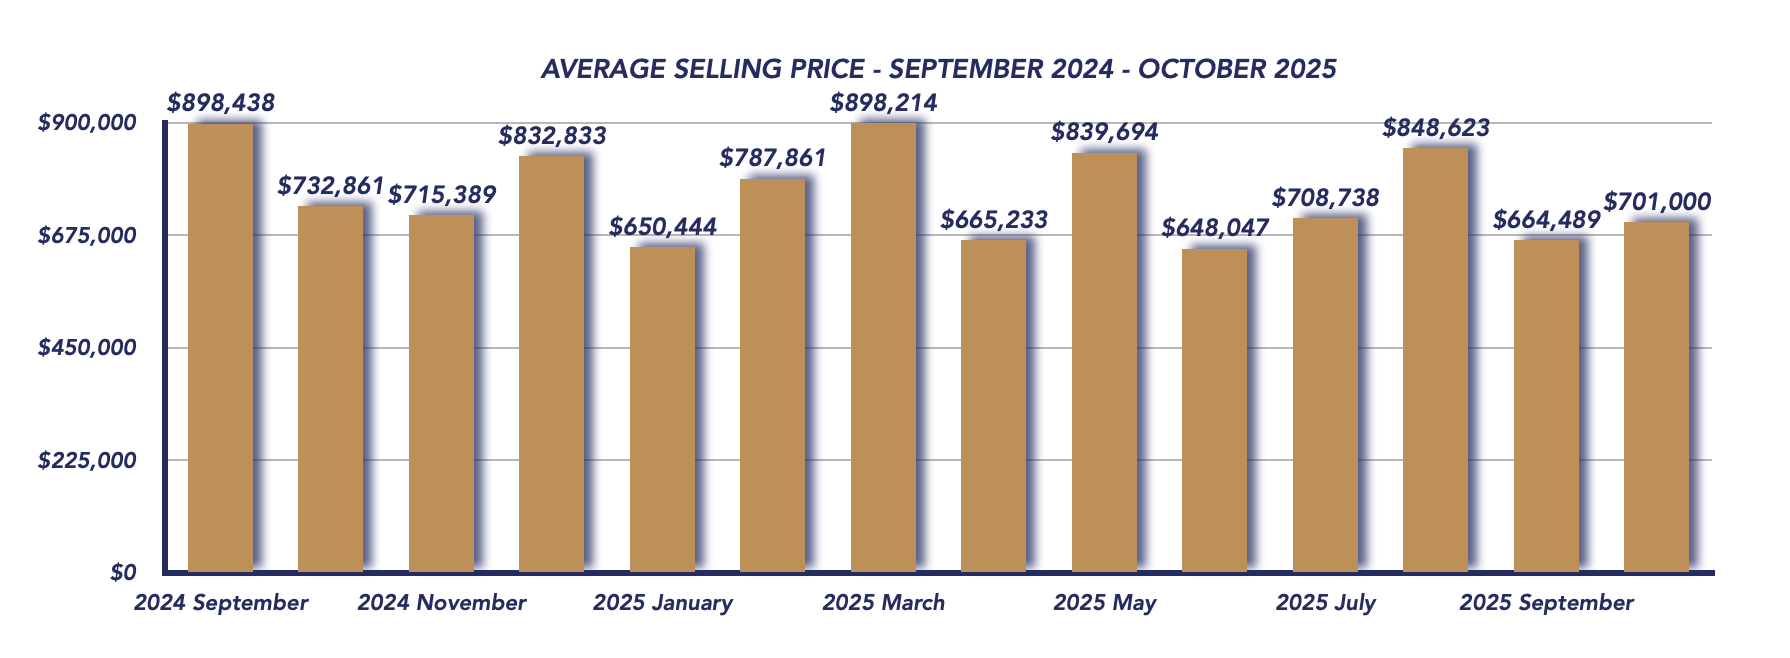
The average sales price in October 2025 settled at $937,028, marking a 1.3% decline year-over-year from $949,028 in October 2024, and a 13.9% drop month-over-month from $1,088,279 in September.
This decline isn’t surprising given the unusually strong price surge in September, which was boosted by several high-end sales. In contrast, October’s market leaned toward more affordable homes, with 25 of the 32 sales occurring under the $1 million mark. September had five sales between $1.5 million and $2 million, which had previously skewed the monthly average upward.
The shift back to mid-range and entry-level transactions indicates a return to more typical market activity as fall progresses.
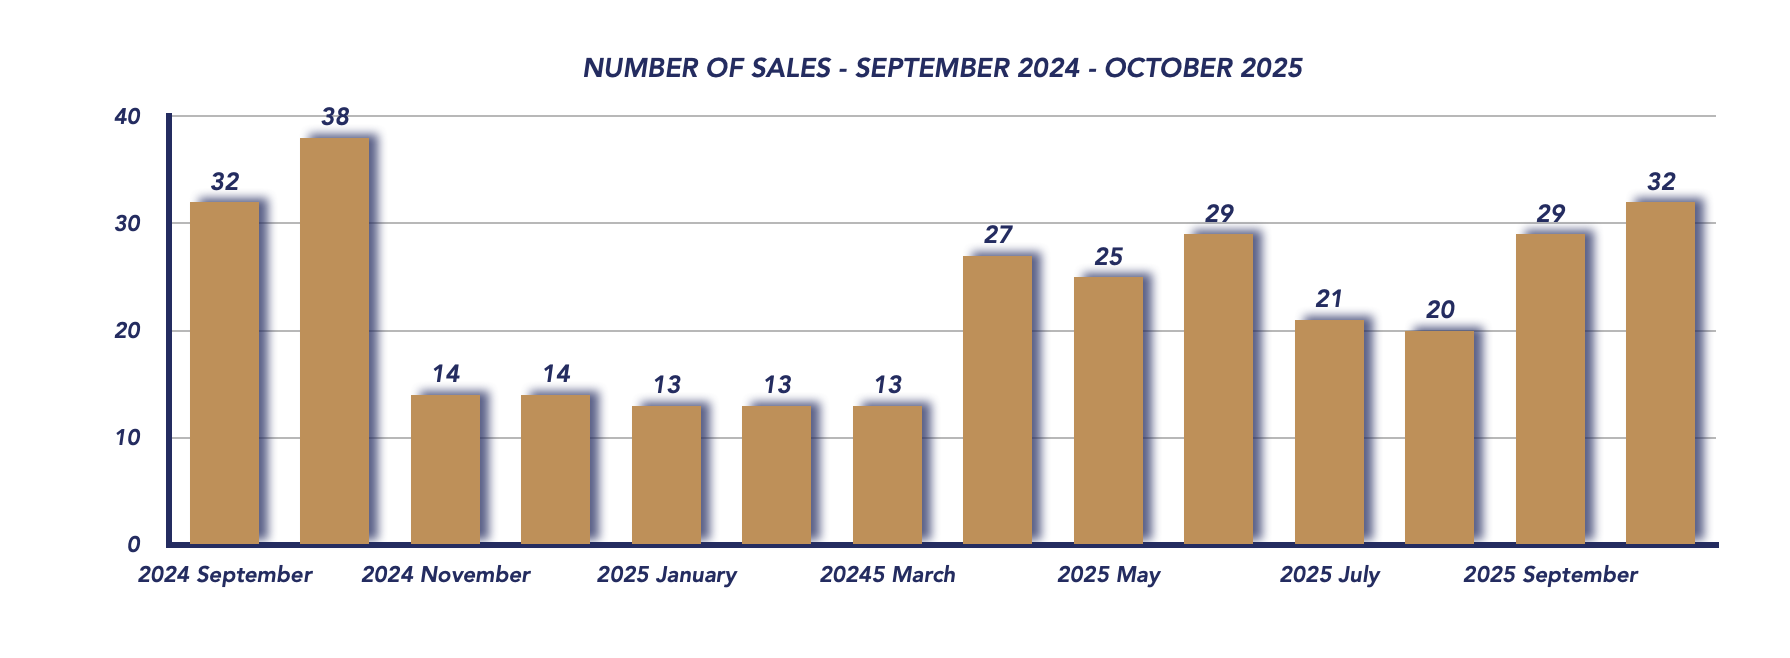
Sales Activity
Sales momentum held steady in October, with 32 total transactions, up slightly from 29 in September, though down from 38 last year. The sale-to-list price ratio edged upward to 97%, improving from 96% last month, which shows sellers are maintaining reasonable expectations and buyers are willing to meet them when properties are priced correctly.
Listings & Inventory
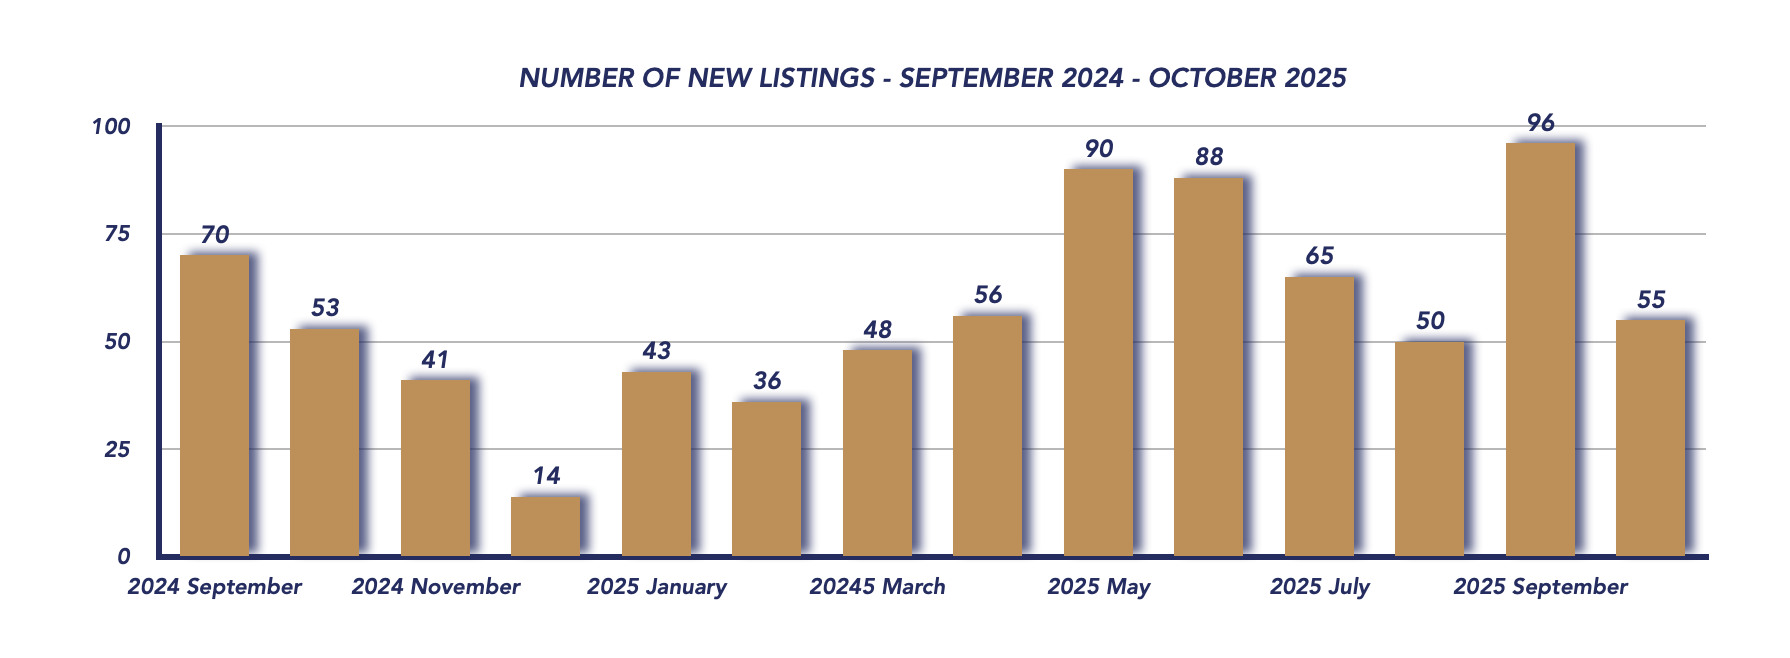
Active listings eased slightly to 118, down from 132 last month, but still higher than the 79 listings recorded in October 2024. Meanwhile, new listings dropped to 55, down from 96 in September and nearly identical to 53 new listings last year.
This pullback in new supply is typical for the fall season, as fewer homeowners list before the winter slowdown. Despite the moderation, Scugog remains well-supplied, giving buyers options without tipping the scales toward a buyer’s market.
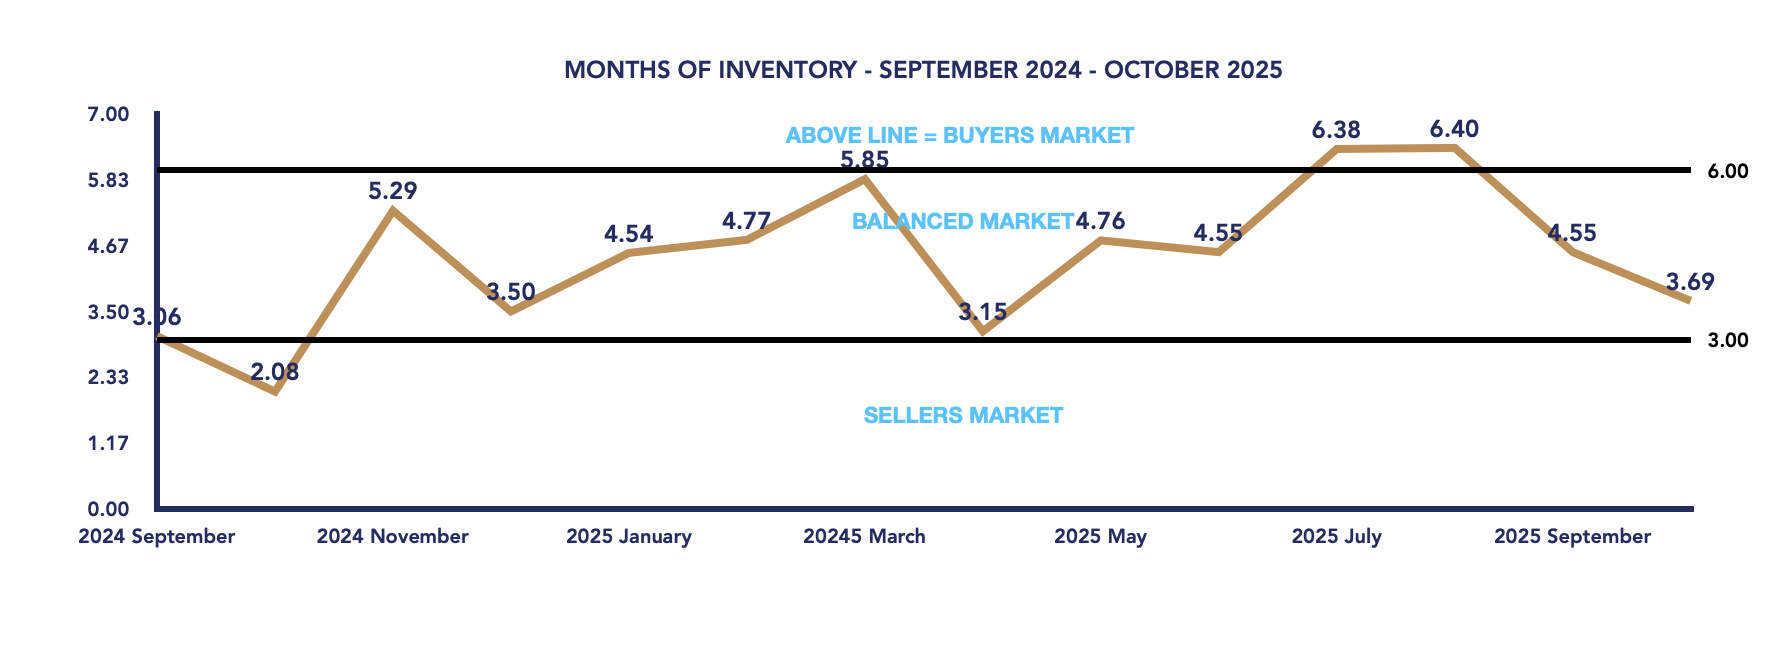
The months of inventory metric fell to 3.69, down from 4.55 in September, keeping Scugog comfortably in balanced market territory — where neither buyers nor sellers have a distinct advantage.

Days on Market
Homes took an average of 68 days to sell in October, up from 57 days in September. This longer selling period aligns with seasonal patterns, as buyers become more cautious and the pool of active shoppers narrows in the final quarter of the year.
Key Takeaways
-
Average prices dropped 13.9% month-over-month, reflecting a normalization after September’s luxury-driven spike.
-
Most homes (78%) sold under $1 million, showing strength in the mid- to lower-price segments.
-
Sales rose modestly, signaling steady demand despite higher days on market.
-
Inventory dipped slightly, maintaining balanced conditions.
-
Sale-to-list ratio improved, showing sellers and buyers are closely aligned on pricing.
As Scugog moves toward the winter market, balanced conditions prevail — with more affordable sales driving the market and motivated buyers taking advantage of steady inventory. Sellers who price competitively and present their homes well will continue to find success, even as activity naturally cools in the months ahead.
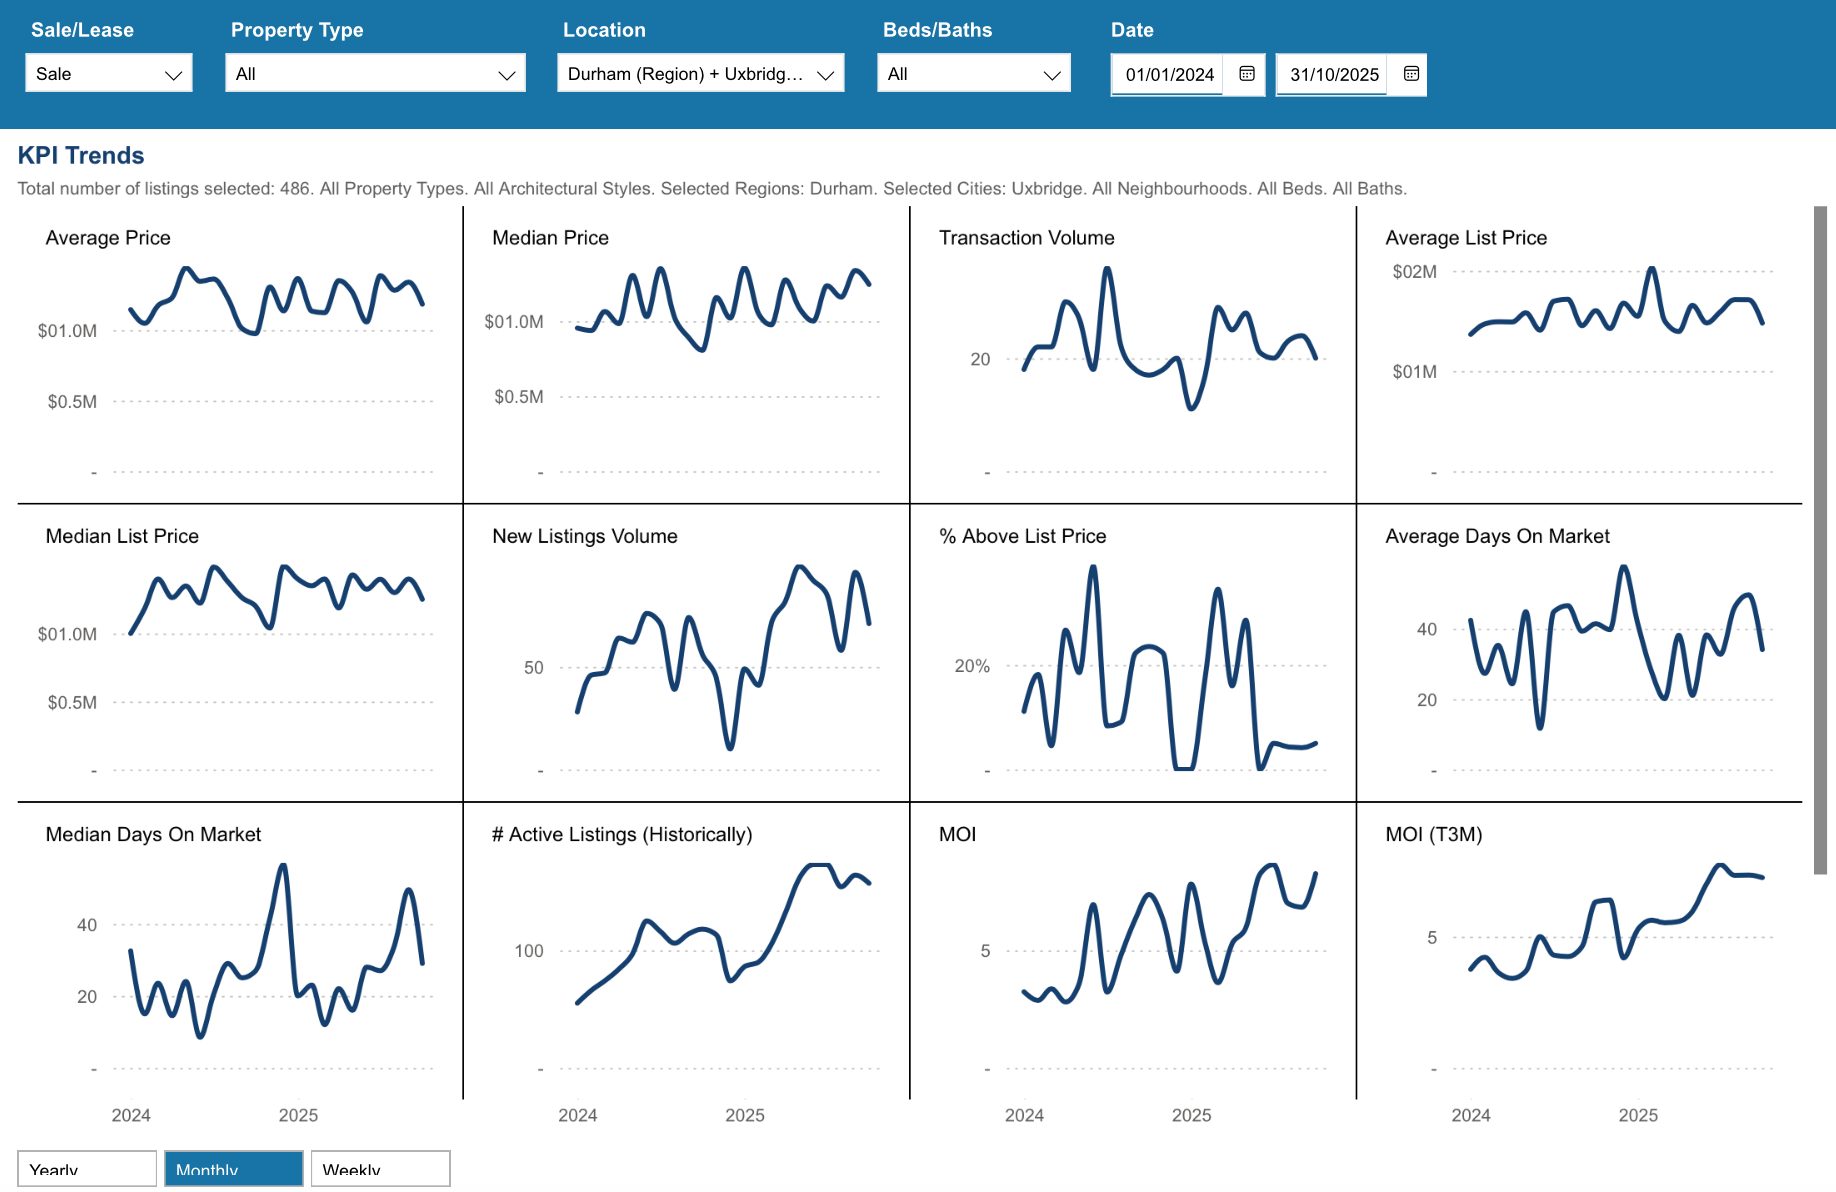
Key Performance Indicators (KPIs) from January 2024 through October 2025 provide a clear snapshot of how the Township of Scugog real estate market has evolved across all property types, architectural styles, and home configurations

WATCH OUR MONDAY MARKET MINUTES
*Information is believed to be accurate at time of posting but is not guaranteed to be correct. Some values may vary slightly based on the exact date and time the reports were generated. Market stats are provided by TRREB (Toronto Regional Real Estate Board) and are based on sales for the month of Attached/Row/Townhouses, Condo Apartments, Condo Townhouses, Detached, Detached with Common Elements, Link Homes and Semi-detached. *Some values may vary slightly based on the exact date and time the reports were generated.
Not intended as a solicitation if your property is already listed by another broker. Affiliated real estate agents are independent contractor sales associates, not employees. ©2021 Coldwell Banker. All Rights Reserved. Coldwell Banker and the Coldwell Banker logos are trademarks of Coldwell Banker Real Estate LLC. The Coldwell Banker® System is comprised of company owned offices which are owned by a subsidiary of Realogy Brokerage Group LLC and franchised offices which are independently owned and operated. The Coldwell Banker System fully supports the principles of the Fair Housing Act and the Equal Opportunity Act.
Click below for more reports
Check out our Uxbridge and Scugog Events Pages to keep up to date on whats going on around town. Click the links or scan the Code with your phone to take you directly there.
UXBRIDGE EVENTS
SCUGOG EVENTS
Brock Housing October 2025

Brock Housing October 2025
Each office is independently owned and operated
![]()
![]()
Housing Market Report for October 2025
Here is the Township of Brock Housing October 2025 report (all housing types), with reports from the Canadian Real Estate Association, and Toronto Regional Real Estate Board included.
This housing report for Durham Region includes the number of new listings, average list price, number of properties sold, average selling price, average days on market and average asking price to selling price ratio for all property types within the Region of Durham.
Scroll to the bottom for links to take you to the housing market reports for Durham Region, Uxbridge and Scugog.
![]()
![]()
From Toronto Regional Real Estate Board
Please note: The PropTx MLS® System, of which TRREB is a part, has added a number of new client boards over the last year. Many of these boards’ Members trade within the Greater Toronto Area and broader Greater Golden Horseshoe regions. As a result, historic data have been updated to reflect the addition of these boards’ listings and transactions. This means historic data have changed relative to previously published static reports. To view updated historic data, click here.
Toronto Regional Real Estate Board – Market Stats At A Glance – October 2025
Read the Toronto Regional Real Estate Board Market Watch Report
![]()
Brock Township Real Estate Market Analysis – October 2025
The Brock Township real estate market in October 2025 showed signs of stability and moderate growth, with prices inching up from last month and market conditions continuing to hover in balanced territory. While average sale prices remain below last year’s levels, the market is showing resilience as buyers and sellers adjust to more realistic expectations.
Brock 2025
September 2025
Average Sale Price Edges Higher Month-Over-Month
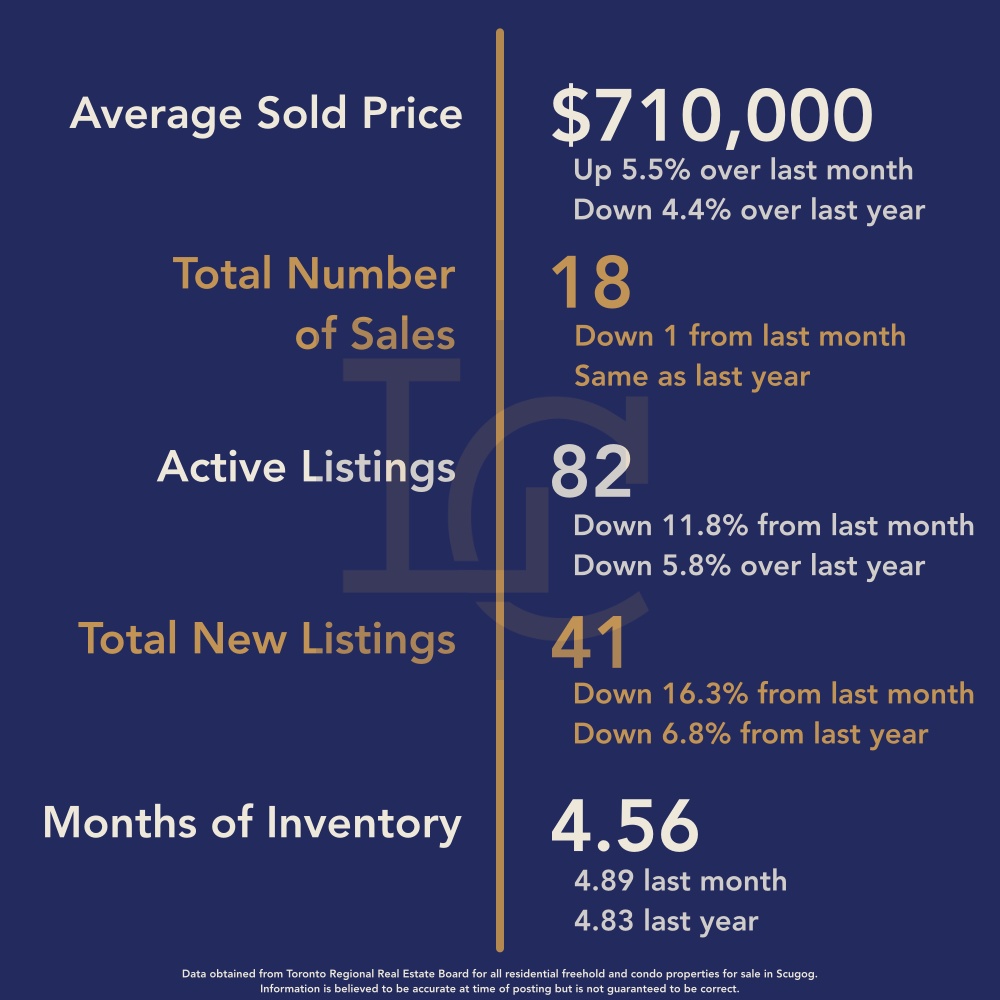
The average sale price in October 2025 was $701,000, representing a 5.5% increase from September’s $664,489, but still 4.35% below October 2024’s $732,861.
Pricing activity in October was mixed, with 15 homes selling under $1 million, including 13 under $700,000, while three properties sold between $1 million and $1.5 million. This combination of mid-range and higher-value sales helped lift the monthly average, contrasting with September’s lower price range where almost all properties sold below $700,000.
Sales Hold Steady Year-over-Year
A total of 18 homes were sold in October 2025, nearly identical to September’s 19 sales and matching the 18 sales recorded in October 2024. This consistency suggests a steady level of buyer engagement, even as affordability challenges and broader economic uncertainty continue to shape market sentiment.
Sellers Gaining Slight Ground
The sale-to-list price ratio rose to 95%, improving from 93% in September, though still slightly lower than 96% this time last year. This indicates that while buyers are still negotiating, sellers are achieving closer to their asking prices — a positive sign of renewed market balance.
Inventory Tightens Slightly
Active listings fell to 82, down from 93 in September and 87 in October 2024, suggesting fewer new properties entering the market as we move deeper into fall. New listings also dipped to 41, compared to 49 last month and 44 last year.
This reduction in available listings could help prevent further downward pressure on prices as supply moderates and buyers compete for well-priced homes.
Days on Market & Inventory Levels
Homes took an average of 65 days to sell in October, a slight increase that reflects the slower autumn pace. The months of inventory decreased to 4.56, down from 4.89 in September, keeping Brock Township firmly in balanced market territory — where supply and demand are roughly aligned.
Conclusion
October 2025 demonstrated a steady and balanced real estate market in Brock Township. Prices ticked up modestly, sales held firm, and inventory began to tighten as the fall market naturally cooled. While the average sale price remains below last year’s level, overall stability suggests the market is finding its rhythm after months of adjustment.
Heading into the final stretch of the year, buyers continue to benefit from healthy inventory and reasonable negotiating room, while sellers can take confidence in a market that’s holding steady and rewarding competitively priced listings.
Key Performance Indicators (KPIs) from January 2024 through October 2025 provide a clear snapshot of how the Township of Brock real estate market has evolved across all property types, architectural styles, and home configurations
*Information is believed to be accurate at time of posting but is not guaranteed to be correct. Some values may vary slightly based on the exact date and time the reports were generated. Market stats are provided by TRREB (Toronto Regional Real Estate Board) and are based on sales for the month of Attached/Row/Townhouses, Condo Apartments, Condo Townhouses, Detached, Detached with Common Elements, Link Homes and Semi-detached. *Some values may vary slightly based on the exact date and time the reports were generated.
Not intended as a solicitation if your property is already listed by another broker. Affiliated real estate agents are independent contractor sales associates, not employees. ©2021 Coldwell Banker. All Rights Reserved. Coldwell Banker and the Coldwell Banker logos are trademarks of Coldwell Banker Real Estate LLC. The Coldwell Banker® System is comprised of company owned offices which are owned by a subsidiary of Realogy Brokerage Group LLC and franchised offices which are independently owned and operated. The Coldwell Banker System fully supports the principles of the Fair Housing Act and the Equal Opportunity Act.
Click below for more reports
Check out our Uxbridge and Scugog Events Pages to keep up to date on whats going on around town. Click the links or scan the Code with your phone to take you directly there.
UXBRIDGE EVENTS
SCUGOG EVENTS
Monday Market Minute November 10

Monday Market Minute – Uxbridge & Scugog Real Estate Update
Week of November 2 to November 8
.
The local real estate market in Uxbridge and Scugog continues to show steady movement as we move further into November. Here’s a look at the numbers for the week of November 2nd to November 8th, 2025.
Weekly Real Estate Market Minute for the Townships of Uxbridge and Scugog
.
Uxbridge Township
This week, Uxbridge saw 4 new listings, a decrease from 10 the previous week, along with 6 previously listed properties returning to the market.
There were 10 price adjustments, consistent with last week’s figures.
Sales activity picked up, with 8 conditional sales (up from 2 last week) and 3 firm sales (down slightly from 7).
At week’s end, there were 155 active listings, down just one from the 156 recorded the week before.
Scugog Township
In Scugog, there were 7 new listings, up from 3 the previous week, and another 7 properties that were previously listed brought back to market.
The township saw 9 price adjustments, up slightly from 8 last week.
Sales included 5 conditional and 4 firm transactions — a slight slowdown in conditional sales but steady firm activity.
Scugog ended the week with 138 active listings, unchanged from the previous week.
Market Insight
As we move deeper into the fall season, both Uxbridge and Scugog remain active despite cooler temperatures and seasonal slowdowns typically seen at this time of year.
Conditional sales continue to show that buyers are engaged, while inventory levels remain stable — providing a balanced environment for both buyers and sellers.
If you’re thinking about listing your home before the holidays or planning your 2026 move, now’s a great time to connect and discuss your options.
Thank You For Watching
The Monday Market Minute November 10
Check out our Uxbridge and Scugog Events Pages to keep up to date on whats going on around town. Click the links or scan the Code with your phone to take you directly there.
UXBRIDGE EVENTS
SCUGOG EVENTS
Durham Region Housing October 2025

Durham Region Housing October 2025
Each office is independently owned and operated
![]()
![]()
Housing Market Report for October 2025
Here is the Region of Durham Housing October 2025 report (all housing types), with reports from the Canadian Real Estate Association, and Toronto Regional Real Estate Board included.
This housing report for Durham Region includes the number of new listings, average list price, number of properties sold, average selling price, average days on market and average asking price to selling price ratio for all property types within the Region of Durham.
Scroll to the bottom for links to take you to the housing market reports for Uxbridge, Scugog and Brock.
![]()
![]()
From Toronto Regional Real Estate Board
Please note: The PropTx MLS® System, of which TRREB is a part, has added a number of new client boards over the last year. Many of these boards’ Members trade within the Greater Toronto Area and broader Greater Golden Horseshoe regions. As a result, historic data have been updated to reflect the addition of these boards’ listings and transactions. This means historic data have changed relative to previously published static reports. To view updated historic data, click here.
Toronto Regional Real Estate Board – Market Stats At A Glance – October 2025
Read the Toronto Regional Real Estate Board Market Watch Report
![]()
Durham Region Real Estate Market Analysis – October 2025
Durham Region Real Estate Finds its Balance
The Durham Region real estate market continued to demonstrate balance in October 2025, with sales activity holding steady, inventory levels tightening slightly, and prices edging lower. While year-over-year figures remain down, the market is showing signs of resilience as both buyers and sellers adjust to shifting conditions and seasonal slowdowns.
October 2025
September 2025
Average Sale Price Slips Month-Over-Month
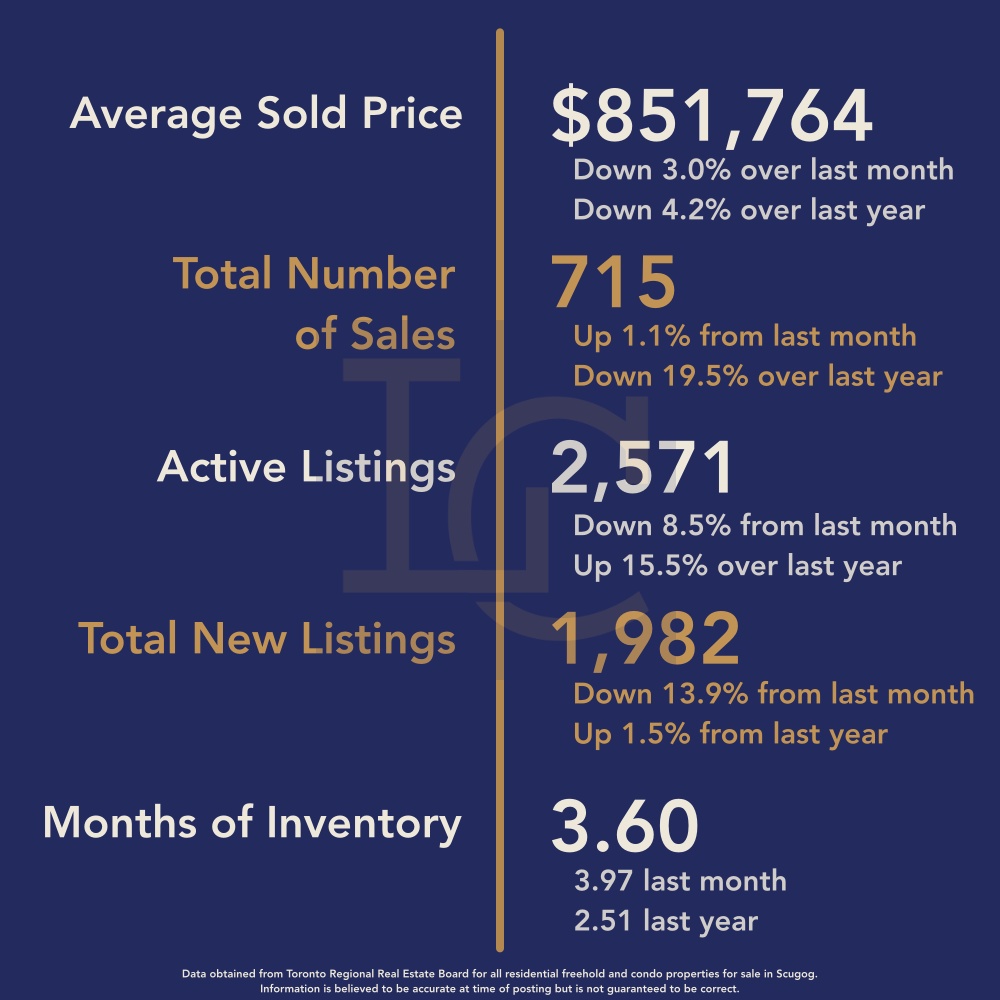
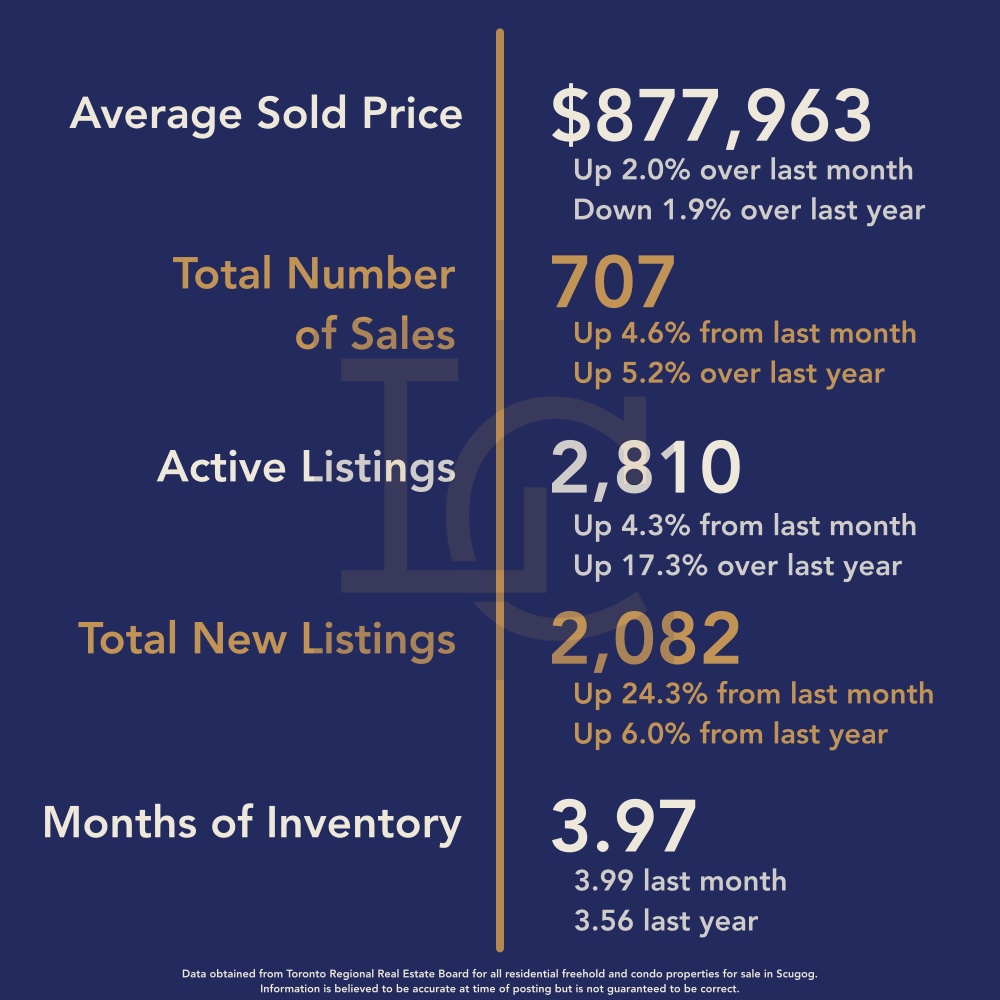
The average sale price in Durham Region for October was $851,764, representing a 3.0% decrease from September’s $877,963 and a 4.2% drop from October 2024’s $888,914. The pullback in prices aligns with typical fall market trends, as activity cools from the busier spring and summer months. However, despite this decline, prices remain relatively stable given broader economic uncertainty and ongoing affordability constraints.

Sale-to-List Price Ratio Rebounds Slightly
The sale-to-list price ratio improved to 99%, up from 98% in September, signaling that sellers are still achieving close to their asking prices. Though down from 100% last year, this small gain shows that buyer demand remains healthy and that well-priced homes continue to attract strong offers.
Sales Activity Steady Despite Seasonal Slowdown
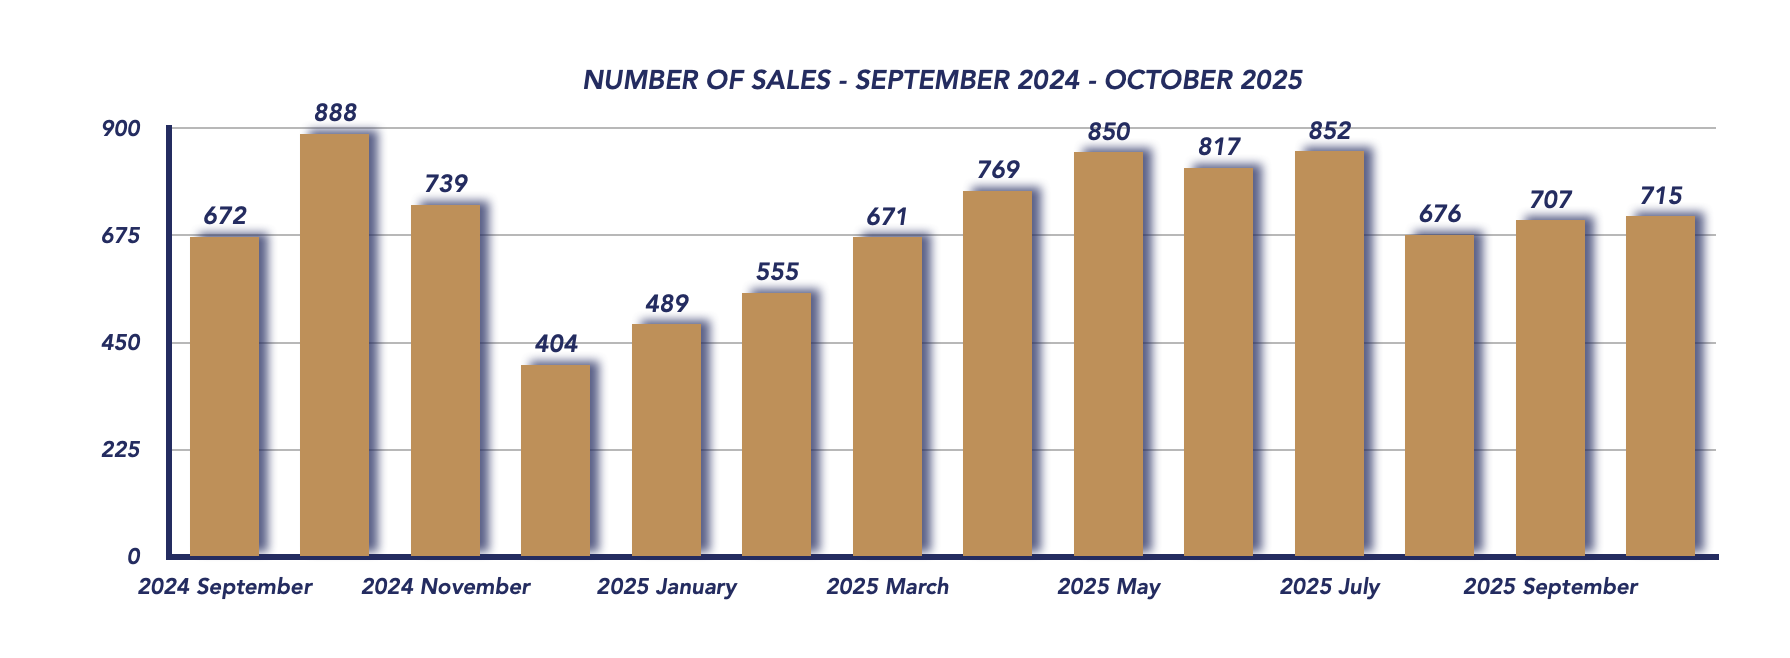
Durham Region saw 715 total sales in October, a slight increase from 707 in September, but down from 888 sales in October 2024. While year-over-year activity remains softer, the monthly uptick suggests buyers are still active heading into the cooler months, taking advantage of stable interest rates and improved negotiating conditions.
Fewer Listings Enter the Market
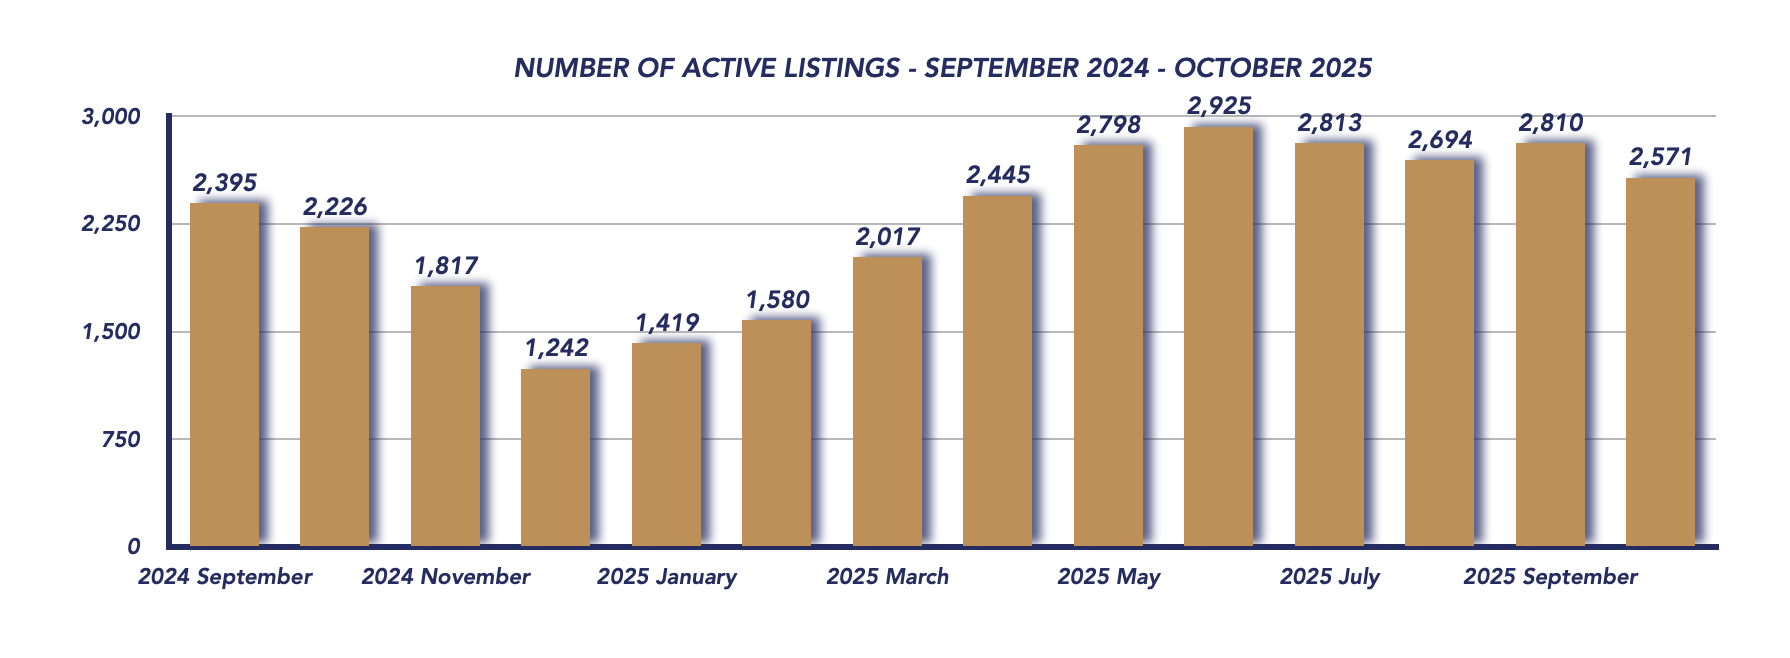
New listings fell to 1,792, down from 2,082 in September, but slightly above 1,766 in October 2024. This dip in new inventory reflects the typical fall slowdown as fewer sellers list before the holidays. However, combined with steady sales, this drop helped tighten supply across the region.
Days on Market and Inventory Show Stability
Homes spent an average of 47 days on the market, up marginally from 46 days in September, suggesting buyers are taking more time to make decisions. Meanwhile, months of inventory decreased to 3.60 from 3.97, keeping Durham in balanced market territory. This equilibrium between supply and demand continues to define the region’s housing environment in 2025.
Conclusion
The Durham Region housing market in October 2025 remained balanced, with modest price adjustments, steady sales, and slightly tighter inventory levels. While activity has slowed from last year, the overall picture remains stable, offering opportunities for both sides of the market.
As we head into the final months of the year, buyers may find increased flexibility and negotiating power, while sellers who price strategically can still achieve solid results. With the GTA market showing ongoing strength, time will tell whether that confidence extends eastward into Durham as we move into the winter season.
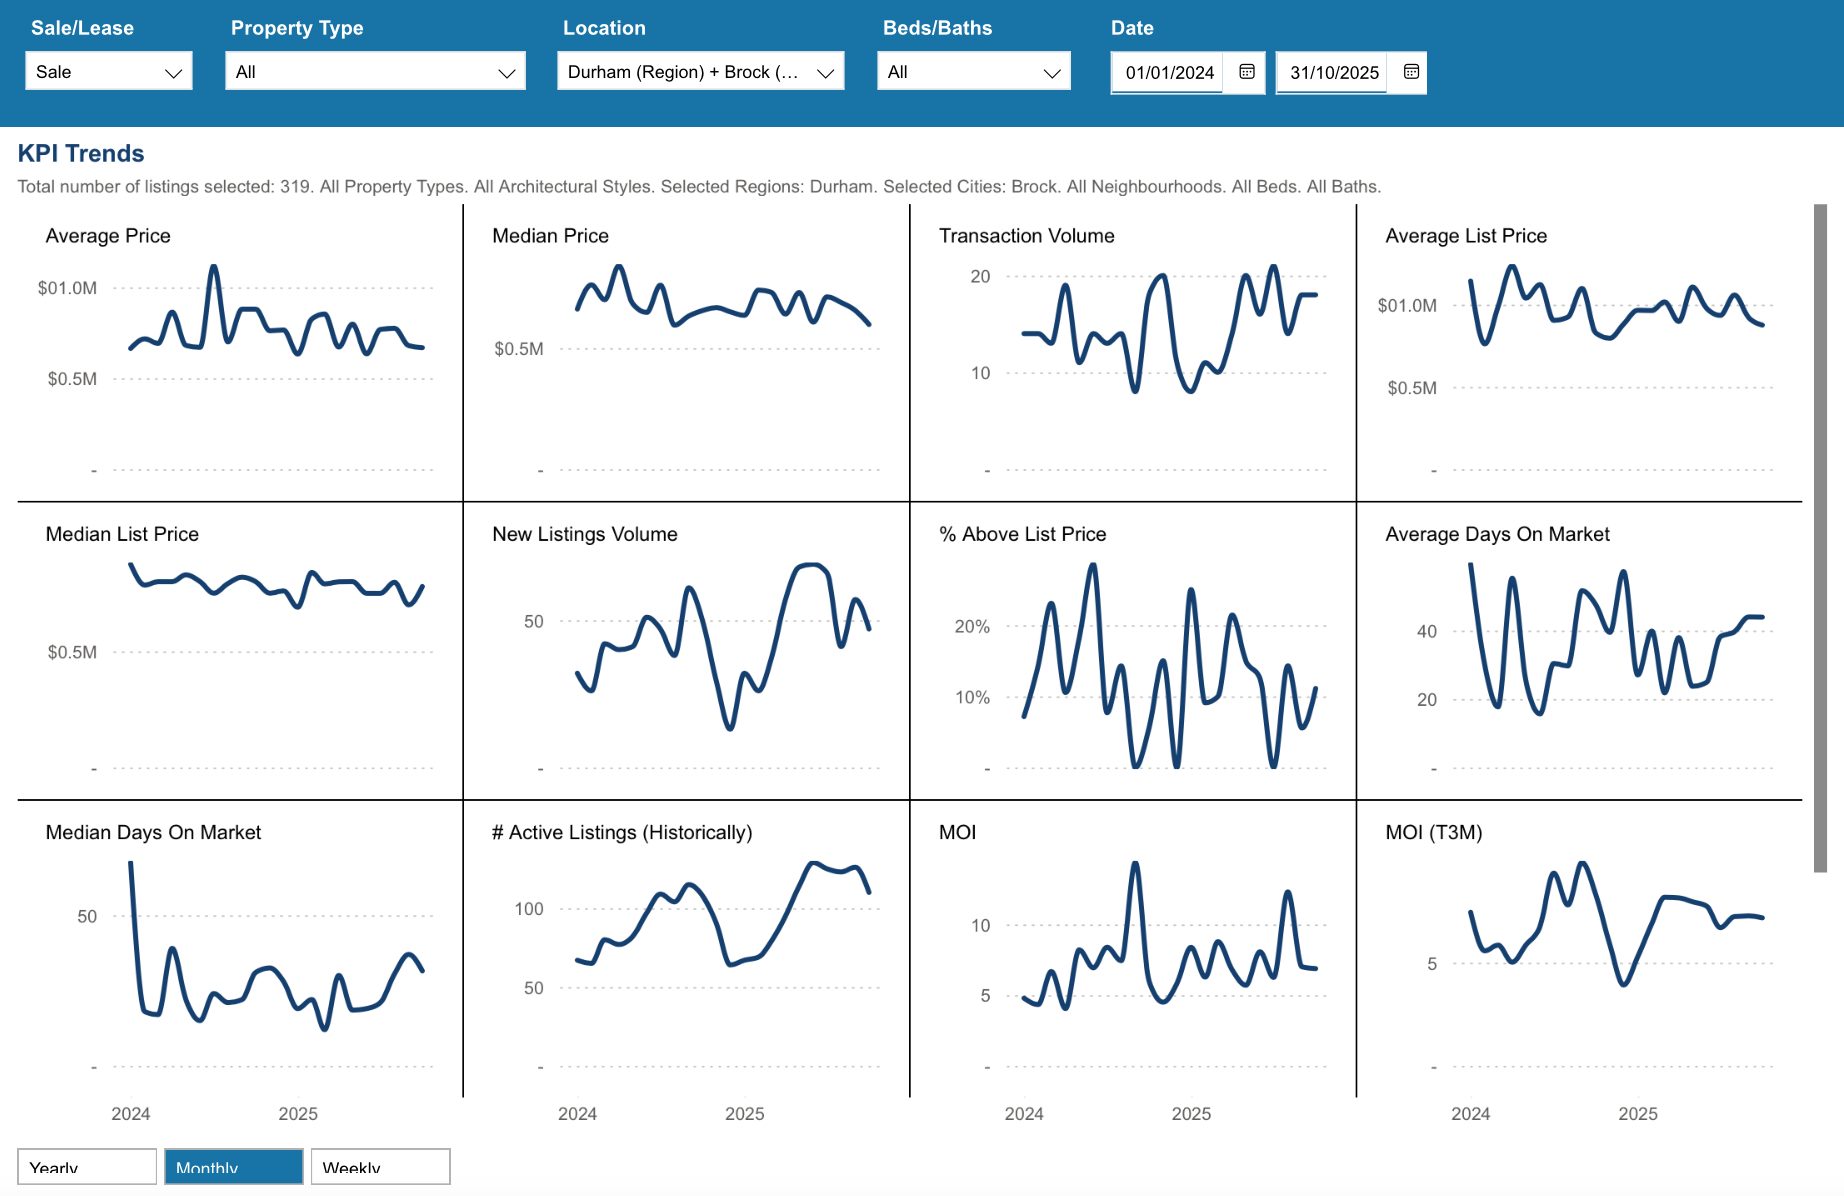
Key Performance Indicators (KPIs) from January 2024 through October 2025 provide a clear snapshot of how the Durham Region real estate market has evolved across all property types, architectural styles, and home configurations
*Information is believed to be accurate at time of posting but is not guaranteed to be correct. Some values may vary slightly based on the exact date and time the reports were generated. Market stats are provided by TRREB (Toronto Regional Real Estate Board) and are based on sales for the month of Attached/Row/Townhouses, Condo Apartments, Condo Townhouses, Detached, Detached with Common Elements, Link Homes and Semi-detached. *Some values may vary slightly based on the exact date and time the reports were generated.
Not intended as a solicitation if your property is already listed by another broker. Affiliated real estate agents are independent contractor sales associates, not employees. ©2021 Coldwell Banker. All Rights Reserved. Coldwell Banker and the Coldwell Banker logos are trademarks of Coldwell Banker Real Estate LLC. The Coldwell Banker® System is comprised of company owned offices which are owned by a subsidiary of Realogy Brokerage Group LLC and franchised offices which are independently owned and operated. The Coldwell Banker System fully supports the principles of the Fair Housing Act and the Equal Opportunity Act.
Click below for more reports
Check out our Uxbridge and Scugog Events Pages to keep up to date on whats going on around town. Click the links or scan the Code with your phone to take you directly there.
UXBRIDGE EVENTS
SCUGOG EVENTS
86 Brock St W Uxbridge

86 Brock Street West – From Printing Press to Modern Hub
.
Nestled in the heart of Uxbridge’s historic downtown, 86 Brock Street West has been a cornerstone of community enterprise for more than 150 years. Its story begins in 1869, when the building first came alive with the sound of the printing press. That June, the first edition of The Uxbridge Journal—the town’s first successful newspaper—rolled off the presses right here. The Journal quickly became an important voice for local news, events, and progress, helping to document the town’s growth and spirit through the late 19th century.
.

The Uxbridge Journal office on the corner of Brock and Church street. Courtesy of the Uxbridge Historical Centre. Permanent collection, P593.
.
Over the decades, as technology and times changed, so too did the uses of this building. By the 1970s, the scent of ink and paper had long since faded, replaced instead by the aroma of freshly baked pizza. Locals will remember Pizza Village, a popular spot for families and friends to gather. In the 90’s, the business changed hands and signage, becoming Sammy’s Pizza and Subs, continuing the tradition of serving up comfort food from this well-loved address.

86 Brock St W as Sammy’s Pizza and Subs, year 2000, photo courtesy of Sadie Moranis.
.
In 2002, 86 Brock Street West underwent a major renovation and received a fresh new look, complete with a coat of grey paint. Following the facelift, the building became home to Strawberry Threads, a women’s clothing boutique known for its unique fashions, on the main floor, and The Tin Cup, a cozy café, on the lower level. Together, they brought a renewed energy to this corner of downtown Uxbridge, blending retail and community connection in one space.
.

86 Brock St W after renovations and was painted. Photo taken in 2016, courtesy of Judy Esmonde.
.
The years that followed saw the building continue to evolve with the times. It later housed Nortek, a local technology company, and an insurance brokerage, reflecting Uxbridge’s growing mix of small businesses and professional services.
In 2020, 86 Brock Street West received another round of extensive renovations. The foundation was repaired, the bricks were cleaned and restored to their original colour, and the structure was brought back to its former charm — a beautiful blend of heritage character and modern craftsmanship.
.

86 Brock St W, 2025
.
Today, 86 Brock Street West stands as a proud example of Uxbridge’s ability to honour its past while embracing the future. From printing presses to pizzerias, boutiques to business offices, this storied building continues to be a vital part of the town’s ever-evolving landscape — a reminder that history lives on not only in our archives but also in the walls that surround us every day.
.
Learn more about the history in Uxbridge by following our Uxbridge History Blog
.
Sources and photo credits:
Sadie Moranis
Judy Esmonde
Monday Market Minute November 3

Monday Market Minute – Uxbridge & Scugog Real Estate Update
Week of October 26 – November 3
It’s time for your Monday Market Minute, where we break down the latest real estate activity across the Townships of Uxbridge and Scugog for the week of October 26 to November 1, 2025.
Weekly Real Estate Market Minute for the Townships of Uxbridge and Scugog
🏡 Uxbridge
This week, Uxbridge saw 10 new listings, up slightly from 7 last week, with an additional 2 properties that were previously listed brought back to the market.
There were 10 price adjustments, matching the steady pace of recent weeks.
Sales activity showed some balance, with 2 properties sold conditionally (down from 4 last week) and 7 sold firm, an increase from 5 the week prior.
At week’s end, there were 156 active listings in Uxbridge, down from 164 the previous week — a sign that some sellers may be holding off as we move deeper into fall.
🏠 Scugog
In Scugog, there were 3 new listings this week, down from 7 last week, along with 5 properties returning to the market after being previously listed.
8 properties had price adjustments — consistent with last week’s numbers.
Sales activity remained strong, with 10 properties sold conditionally (up from 4 last week) and 4 sold firm (down slightly from 9 the week before).
The week closed out with 138 active listings, a small dip from 141 the previous week.
📊 Market Takeaway
Overall, both Uxbridge and Scugog saw a slight decline in total active listings, which is typical as we move into November. Despite that, buyer activity continues to be healthy, especially with a solid number of conditional and firm sales across both areas.
The fall market is showing steady movement — a sign that motivated buyers and sellers are still making deals happen before the winter slowdown.
💡 Thinking of buying or selling?
Let’s talk about what these numbers mean for your next move.
Thank You For Watching
The Monday Market Minute November 3
Check out our Uxbridge and Scugog Events Pages to keep up to date on whats going on around town. Click the links or scan the Code with your phone to take you directly there.
UXBRIDGE EVENTS
SCUGOG EVENTS
Monday Market Minute October 27

Monday Market Minute – Uxbridge & Scugog Real Estate Update
Week of October 19 – 27
As we move further into the fall real estate season, both Uxbridge and Scugog continue to show steady market activity. Inventory levels remain healthy, with moderate listing and sales numbers as buyers and sellers adjust to the shifting pace of the market.
Weekly Real Estate Market Minute for the Townships of Uxbridge and Scugog
Here’s how the week of October 19th to October 25th shaped up:
Uxbridge
-
7 new listings (down from 10 last week)
-
7 properties were relisted and brought back to the market
-
11 price adjustments (down from 19 last week)
-
4 properties sold conditionally (same as last week)
-
5 properties sold firm (up from 2 last week)
-
164 active listings at the end of the week
Scugog
-
6 new listings (same as last week)
-
5 previously listed properties returned to the market
-
8 price adjustments (down from 9 last week)
-
4 properties sold conditionally (same as last week)
-
9 properties sold firm (down slightly from 10 last week)
-
141 active listings at week’s end
Both townships are showing balanced fall activity. While the number of new listings has softened slightly, sales remain steady, indicating that buyers are still actively engaged. The number of price adjustments suggests that sellers are continuing to adapt to current buyer expectations and overall market conditions.
As we near the end of October, we’ll be keeping a close eye on whether inventory continues to tighten heading into November.
📊 Want to know how these trends impact your property value or your buying strategy?
Reach out — we’re happy to help you navigate the market with clarity and confidence.
Thank You For Watching
The Monday Market Minute October 2025
Check out our Uxbridge and Scugog Events Pages to keep up to date on whats going on around town. Click the links or scan the Code with your phone to take you directly there.
UXBRIDGE EVENTS
SCUGOG EVENTS


