Check out our Uxbridge and Scugog Events Pages to keep up to date on whats going on around town. Click the links or scan the Code with your phone to take you directly there.
The heart of Uxbridge has always been its downtown, and few streets capture the community’s character and resilience like Brock Street East. Here are two photographs—one from 1970 and another from 2022—we can step back in time and watch over half a century of transformation unfold.
A Bustling Scene in 1970
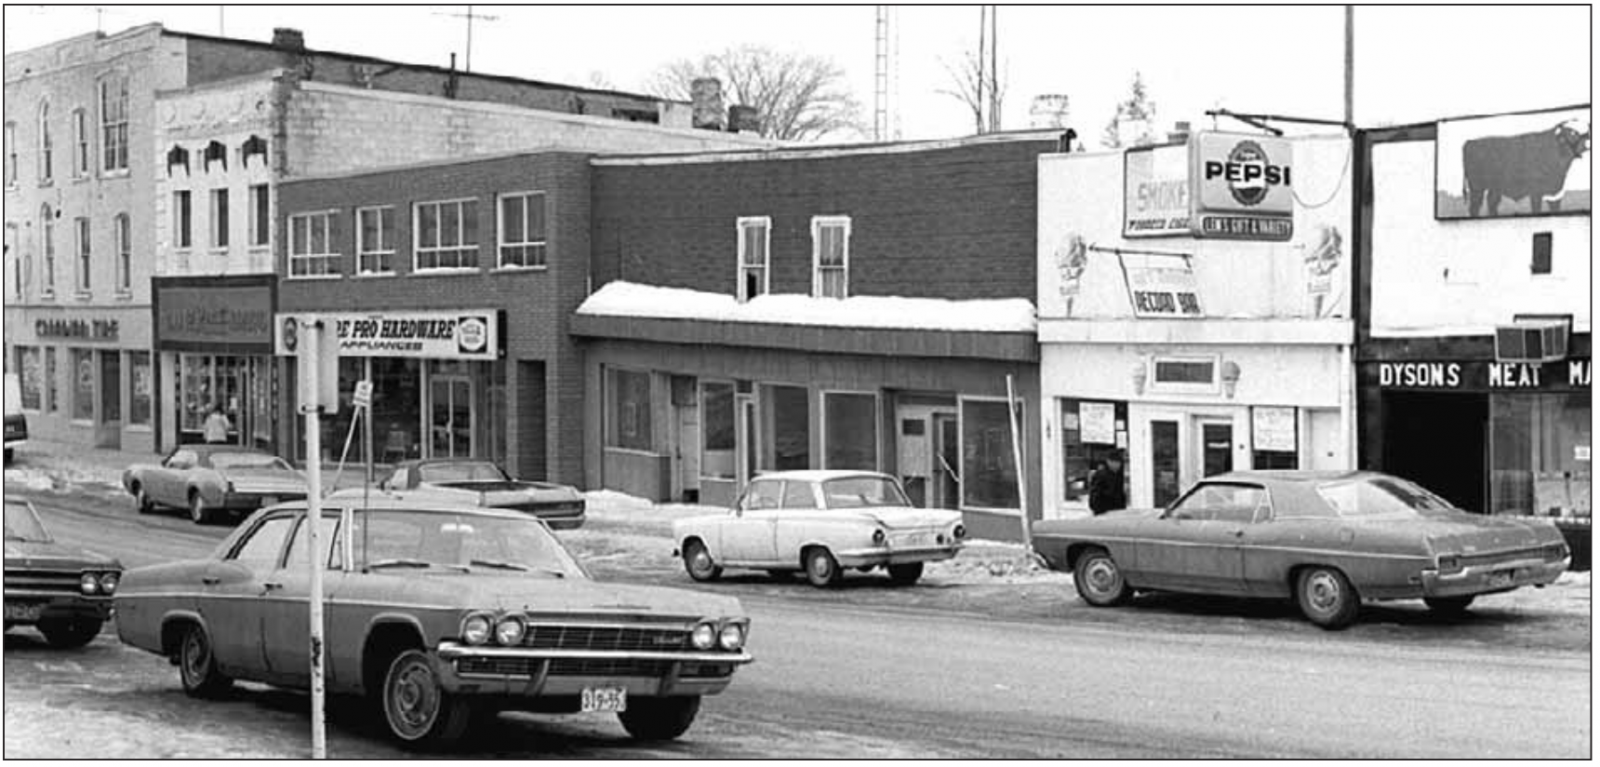
The first image provides a window into the past, revealing the bustling storefronts lining the south side of Brock Street, just west of Bascom Street, in 1970.
Canadian Tire proudly anchors the left side of the scene,
followed by Davie Rexall Drug Store,
and the newly reconstructed Moore’s Pro Hardware Store, standing tall after rising from the ashes of a devastating fire.
Between these shops, a vacant space once housed Uxbridge Cleaners and Dyers, while Len’s Convenience Store and Dyson’s Meat Market rounded out this vibrant block.
Photos courtesy of Uxbridge The Good Old Days by: J. Peter Hvidsten
.
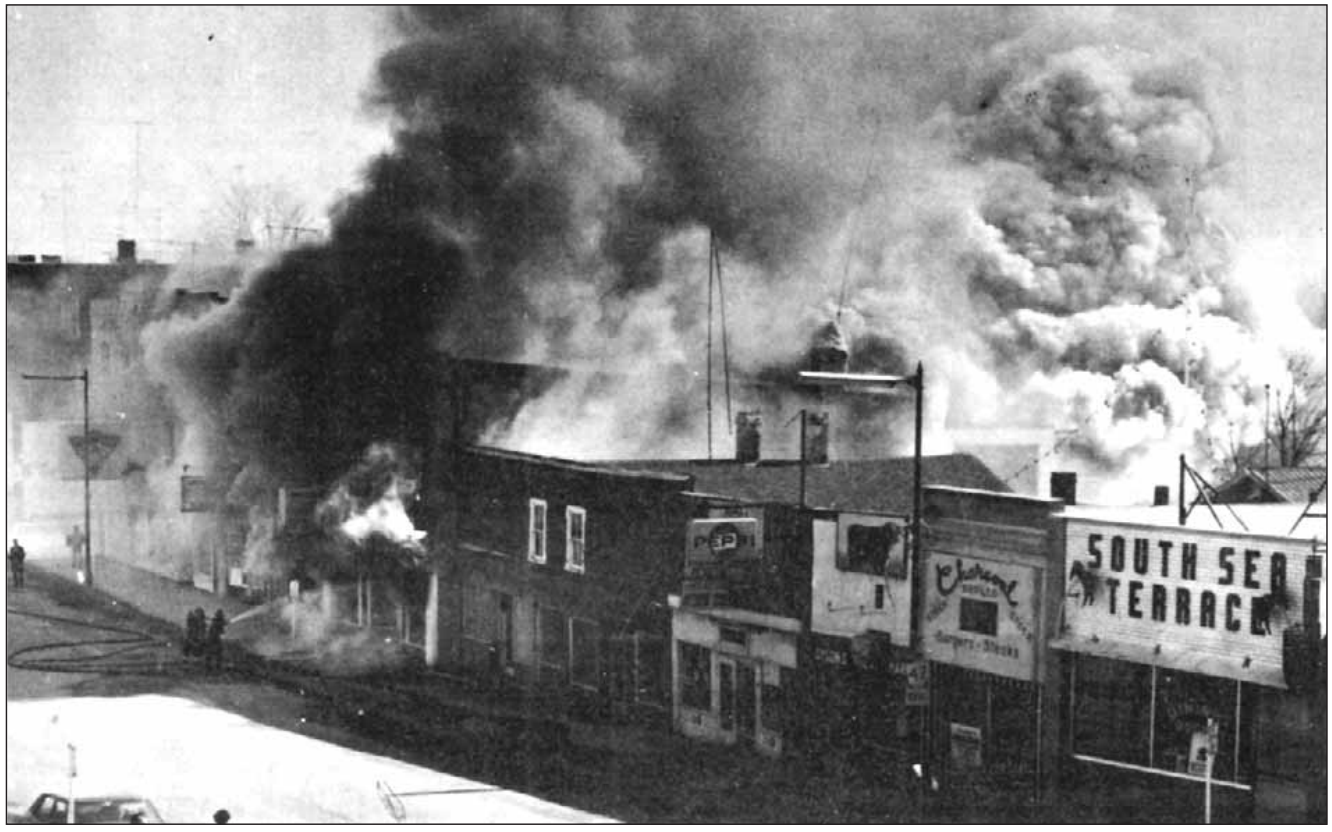
The 1969 Fire
Just a year earlier, in March 1969, a fierce blaze engulfed Moore’s Hardware Store. As captured in the dramatic photo of the fire, flames threatened to erase a cornerstone of Brock Street commerce. Thanks to the swift and courageous efforts of the local fire department, the surrounding buildings were spared, allowing the community to preserve its essential charm and spirit.
.
.
Brock Street Today
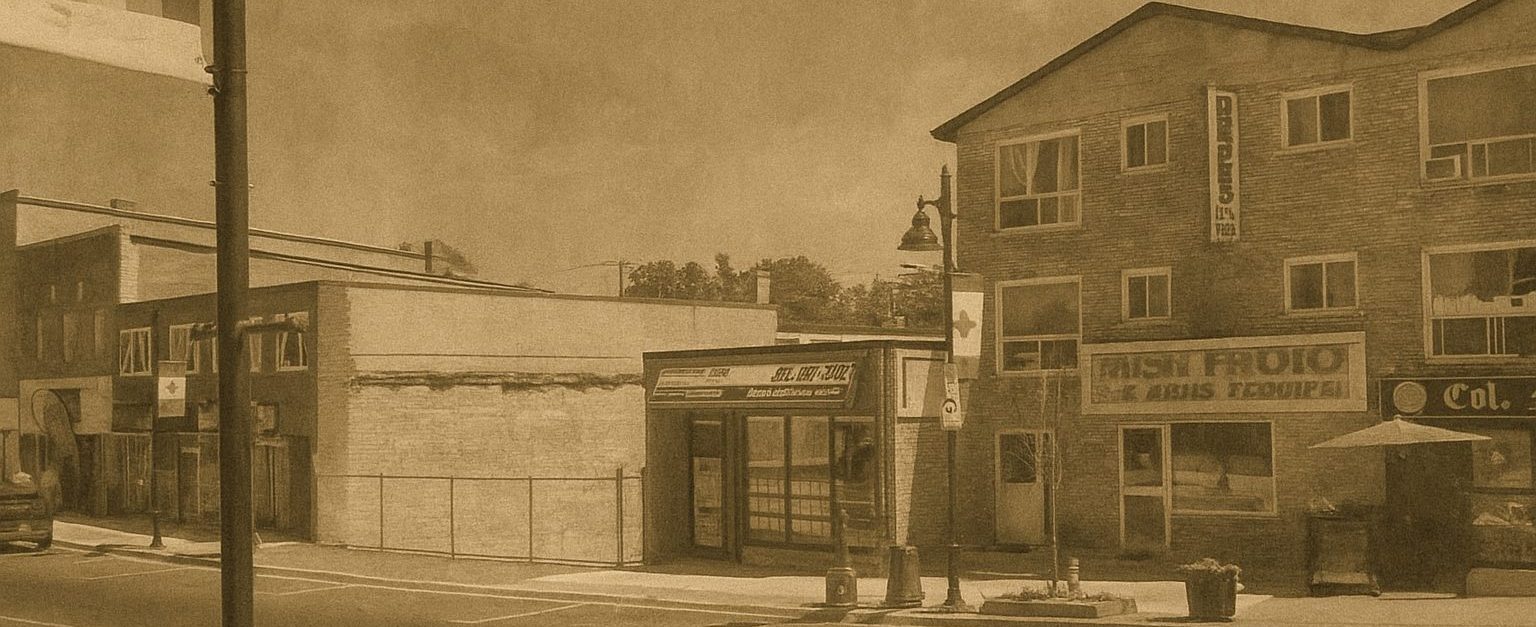
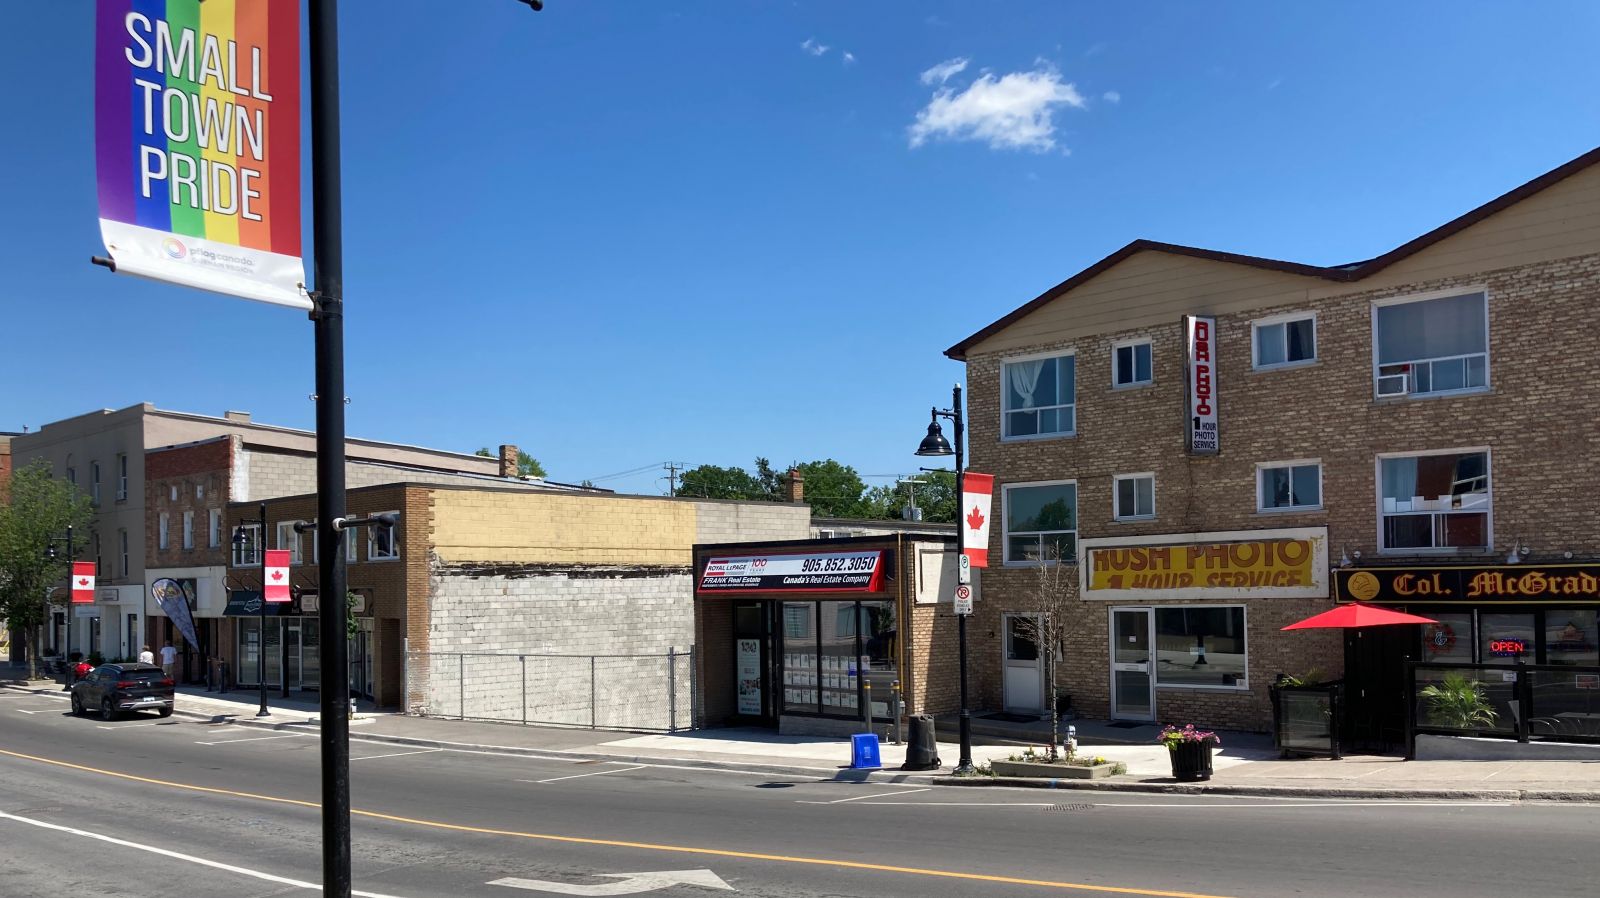
Fast forward to the photo taken in 2022, and the same block of stores shines in the warm glow of a summer afternoon.
On the left, Getaway Travel, Uxbridge Tailoring, The Lemonade Stand, Cycle Solutions, and Mondo Hair Salon welcome visitors with a fresh energy.
On the right side, Royal LePage Frank Real Estate and Col. McGradys Pub & Grill anchor the evolving streetscape.
The once-central building has made way for progress, with space cleared for a new culvert beneath Brock Street—an upgrade ensuring that the heart of Uxbridge continues to thrive for decades to come.
Honouring the Past, Embracing the Future
These photographs side by side tell more than the story of buildings; they illustrate the perseverance of a community. Brock Street East remains a place where history and progress meet—a reminder that while storefronts change, the spirit of Uxbridge endures.
Check out our Uxbridge and Scugog Events Pages to keep up to date on whats going on around town. Click the links or scan the Code with your phone to take you directly there.
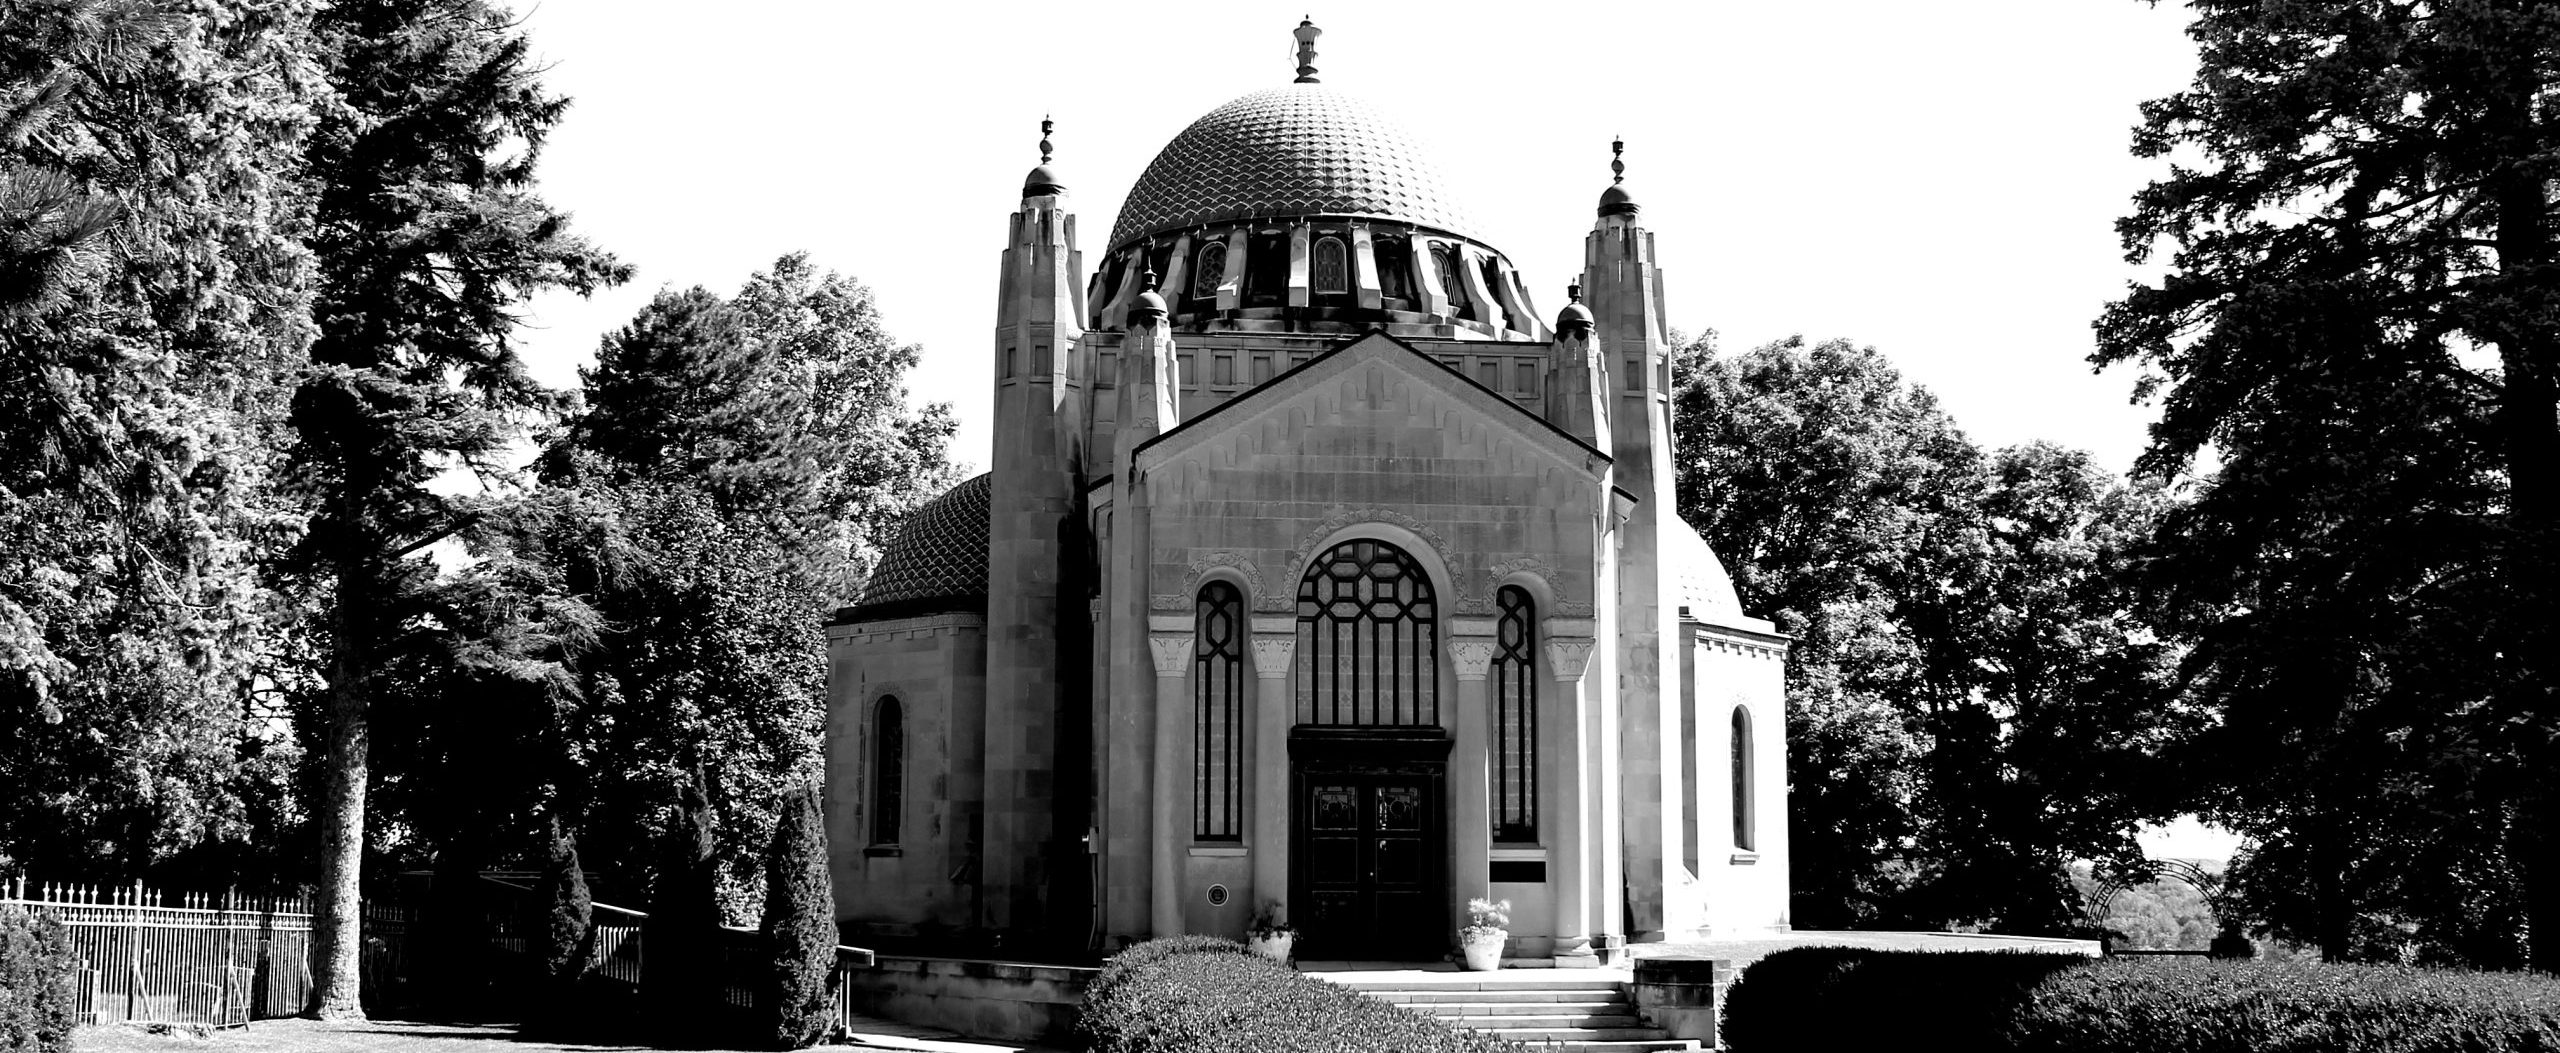
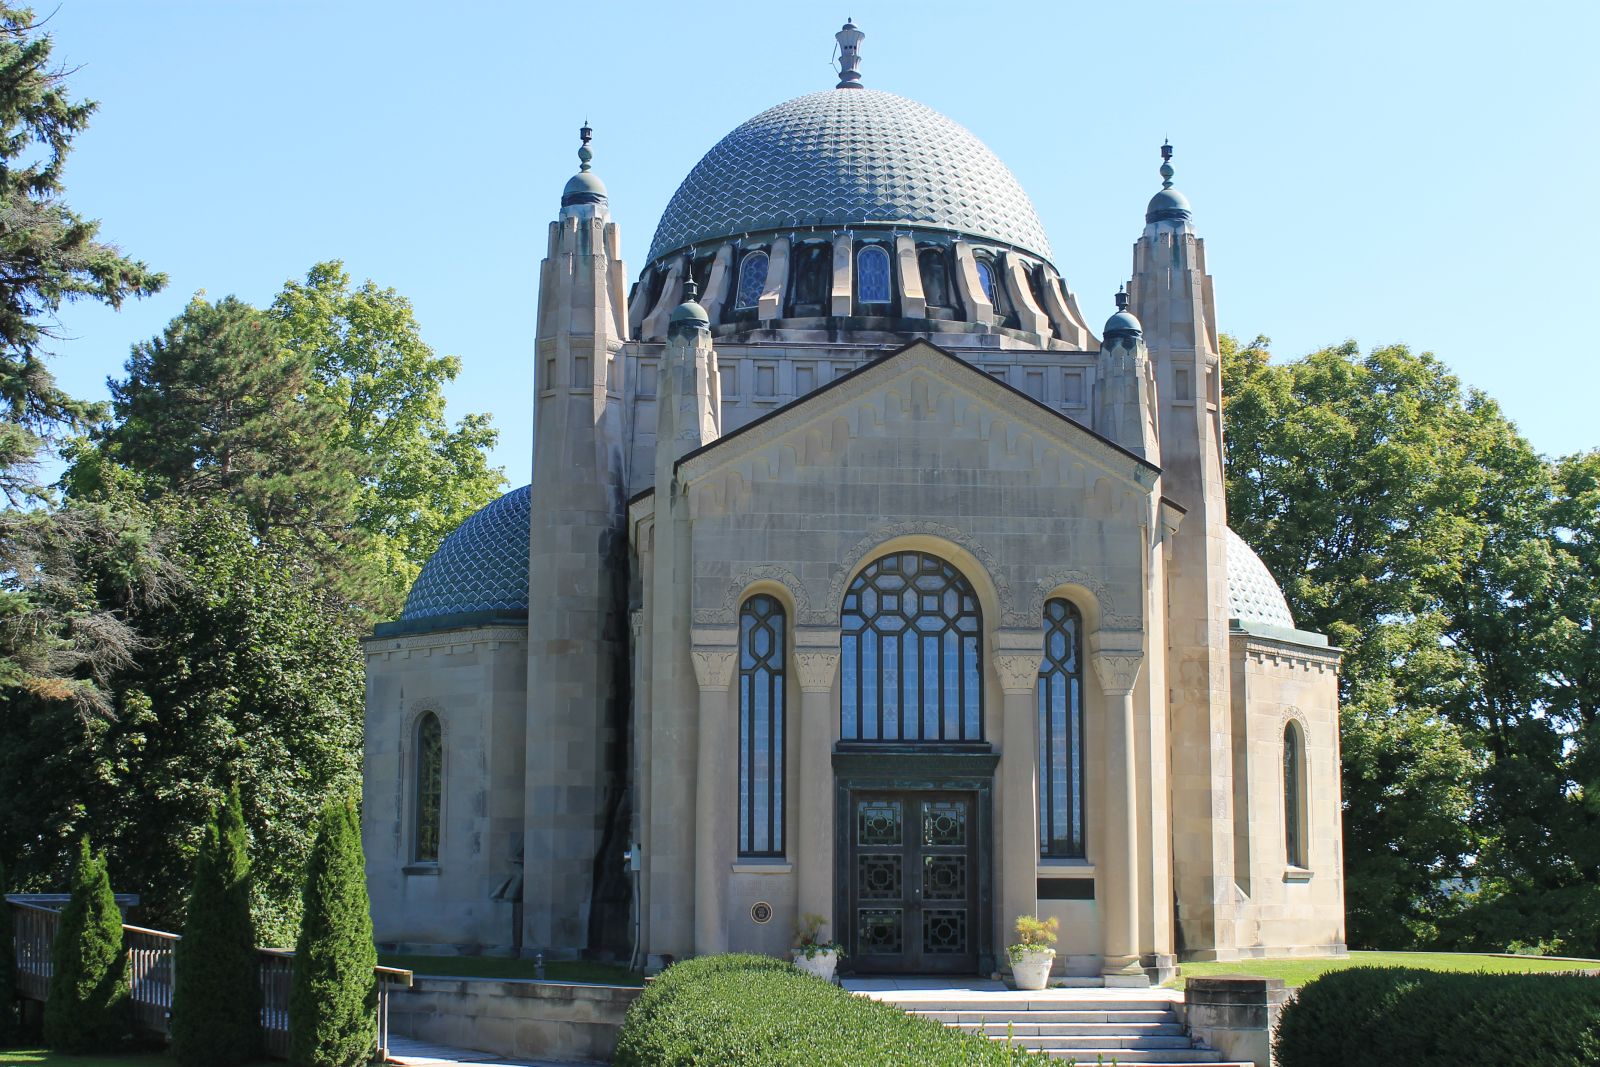
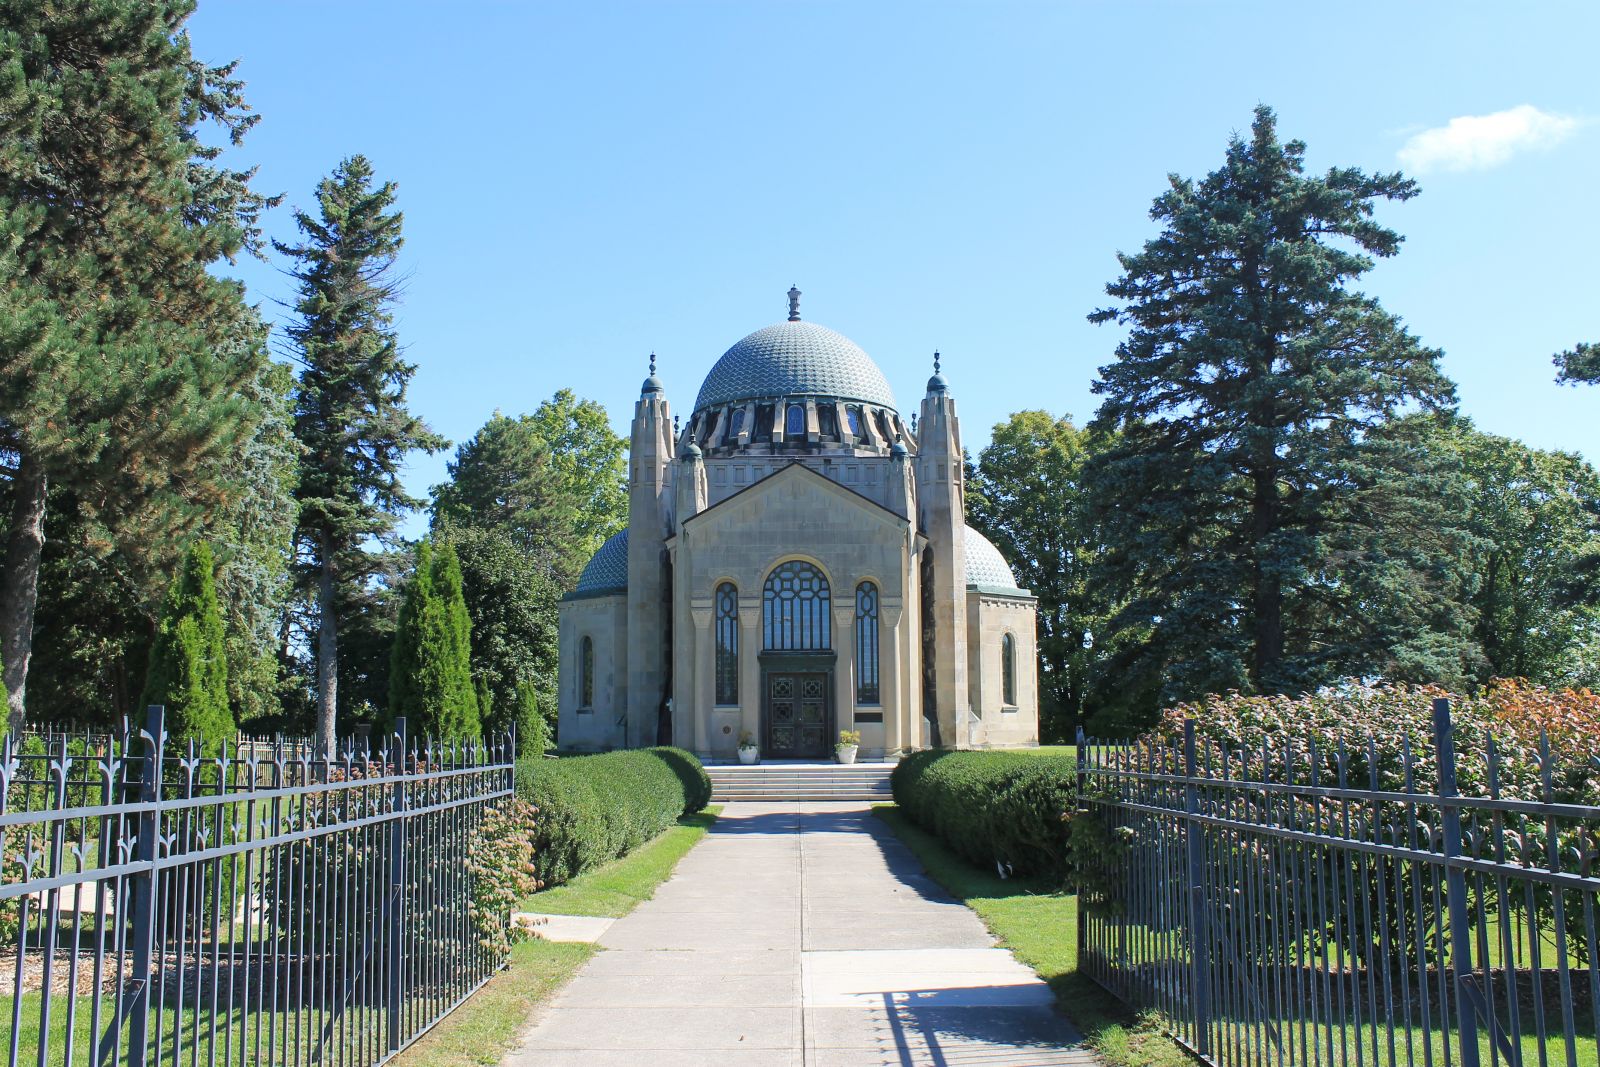
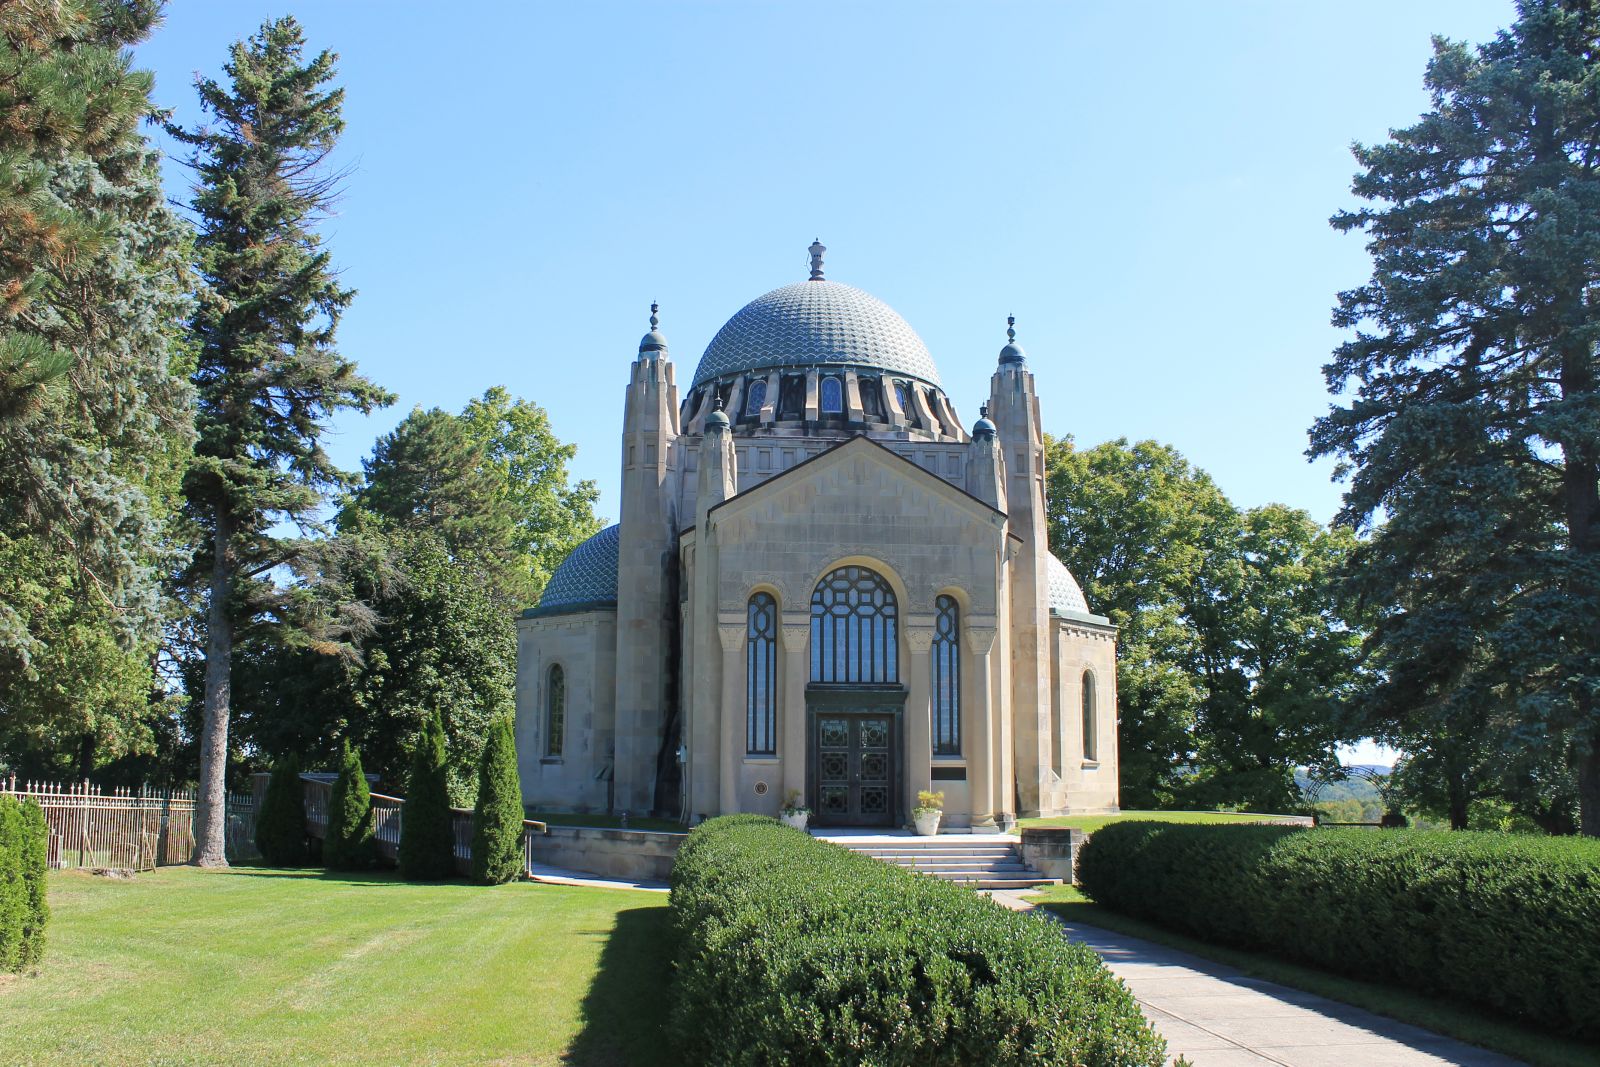
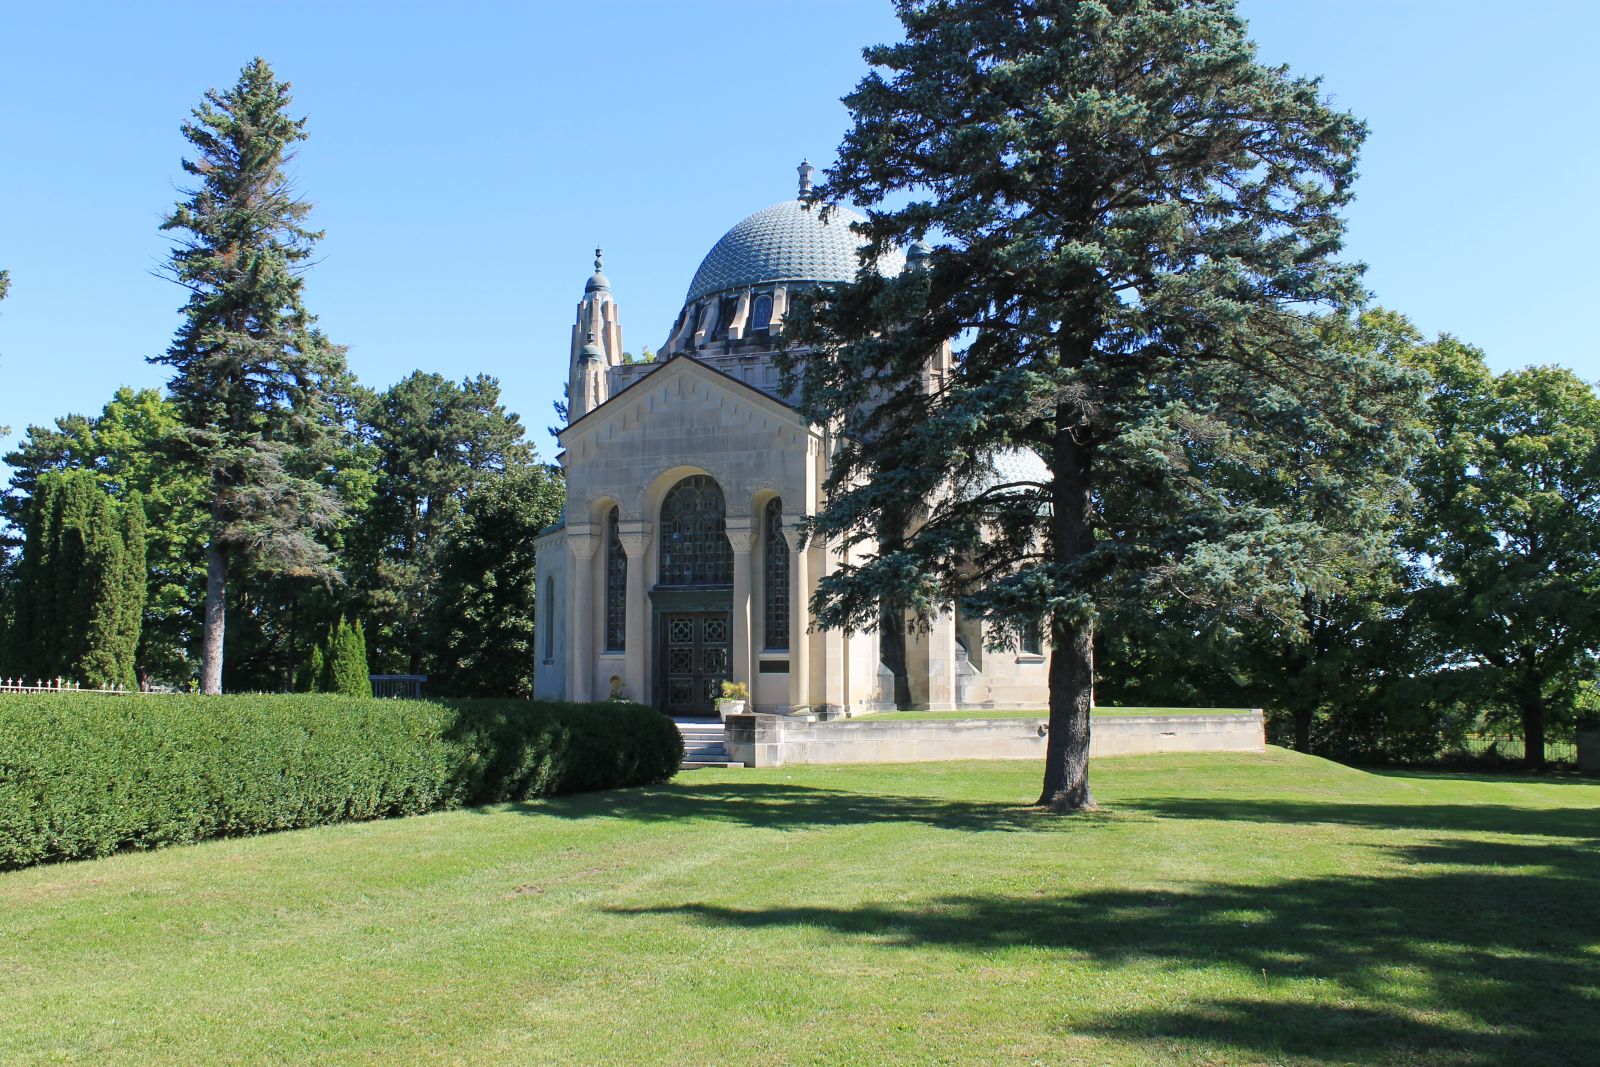
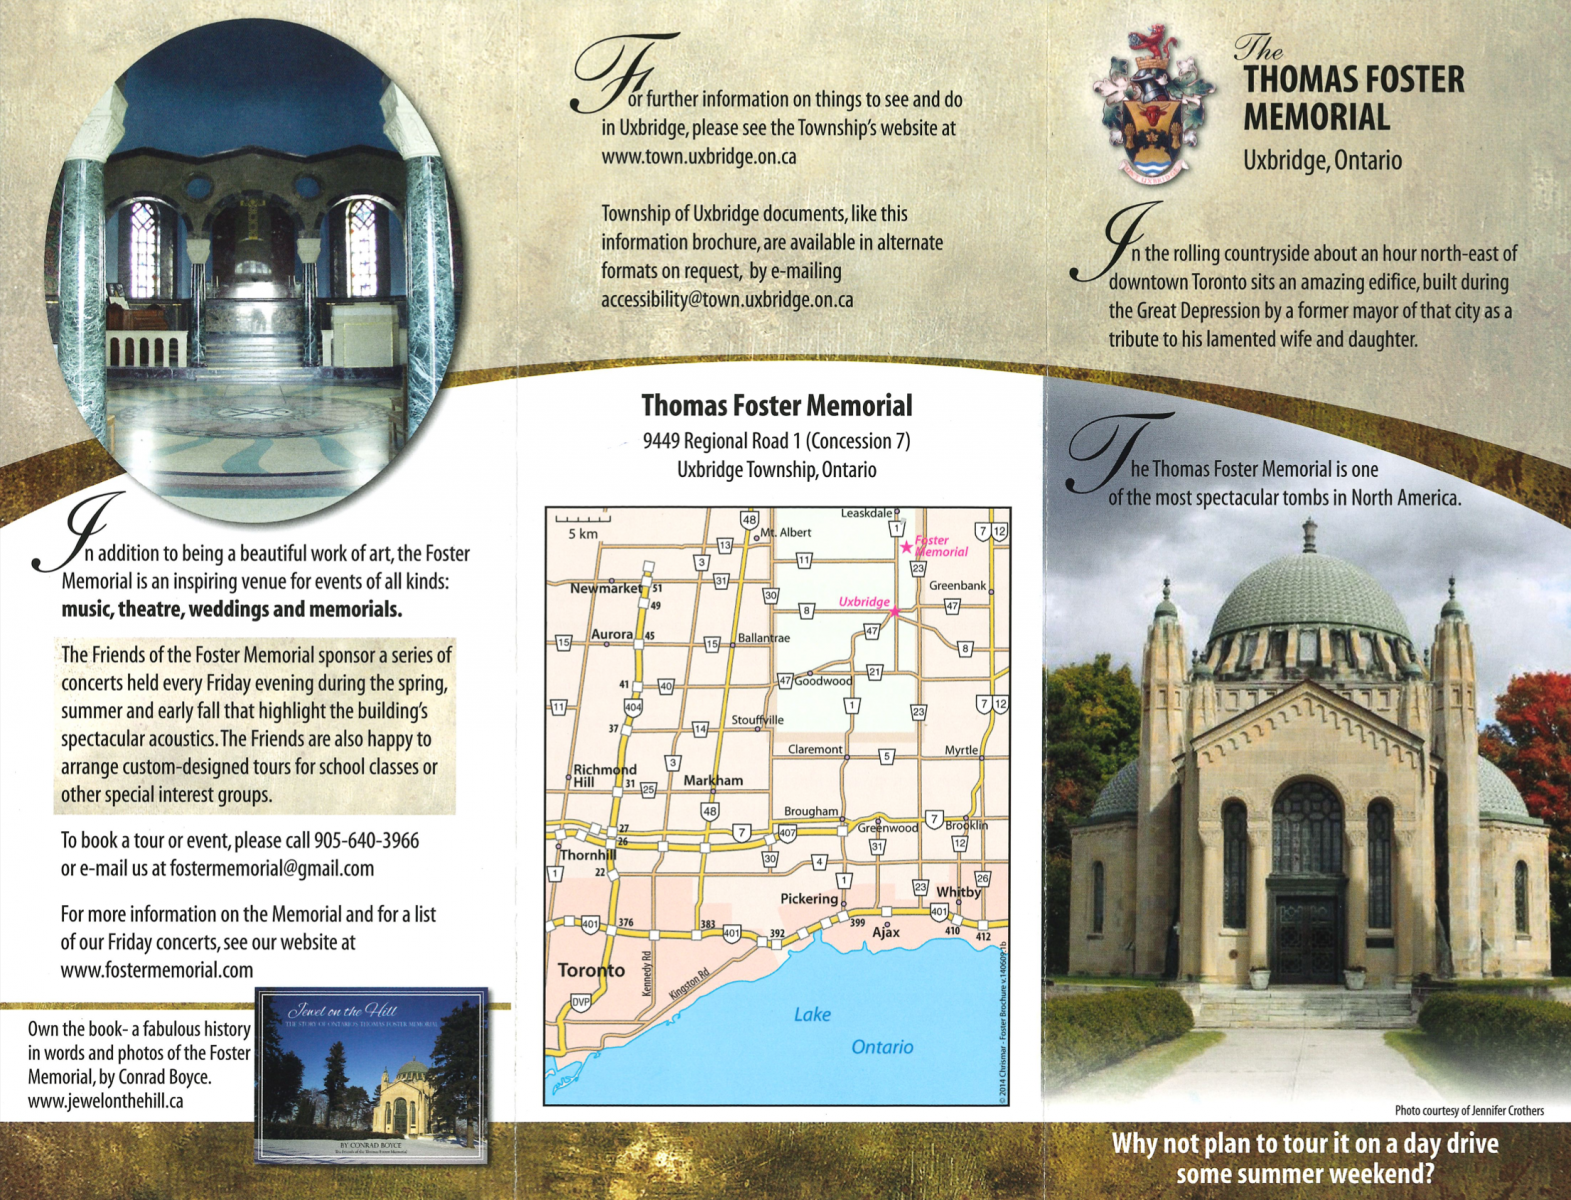
Perched atop a hill in the picturesque countryside north of Uxbridge, The Thomas Foster Memorial is a striking landmark that captivates visitors with its unique design and commanding presence. Visible from the west, south, and east, this architectural marvel stands as a testament to one man’s vision and devotion to his family.
Thomas Foster, a quintessential local boy born on July 24, 1852 eventually ventured to the bustling city and found his fortune, rose to prominence as both a Member of Parliament and Mayor of Toronto. His legacy, woven into the fabric of his community, left an indelible mark that continues to resonate to this day. It’s fitting that a man of such stature would be commemorated in a manner befitting his legacy—a memorial unlike any other, nestled amidst the serene beauty of rural Uxbridge.
A Vision Inspired by the Taj Mahal
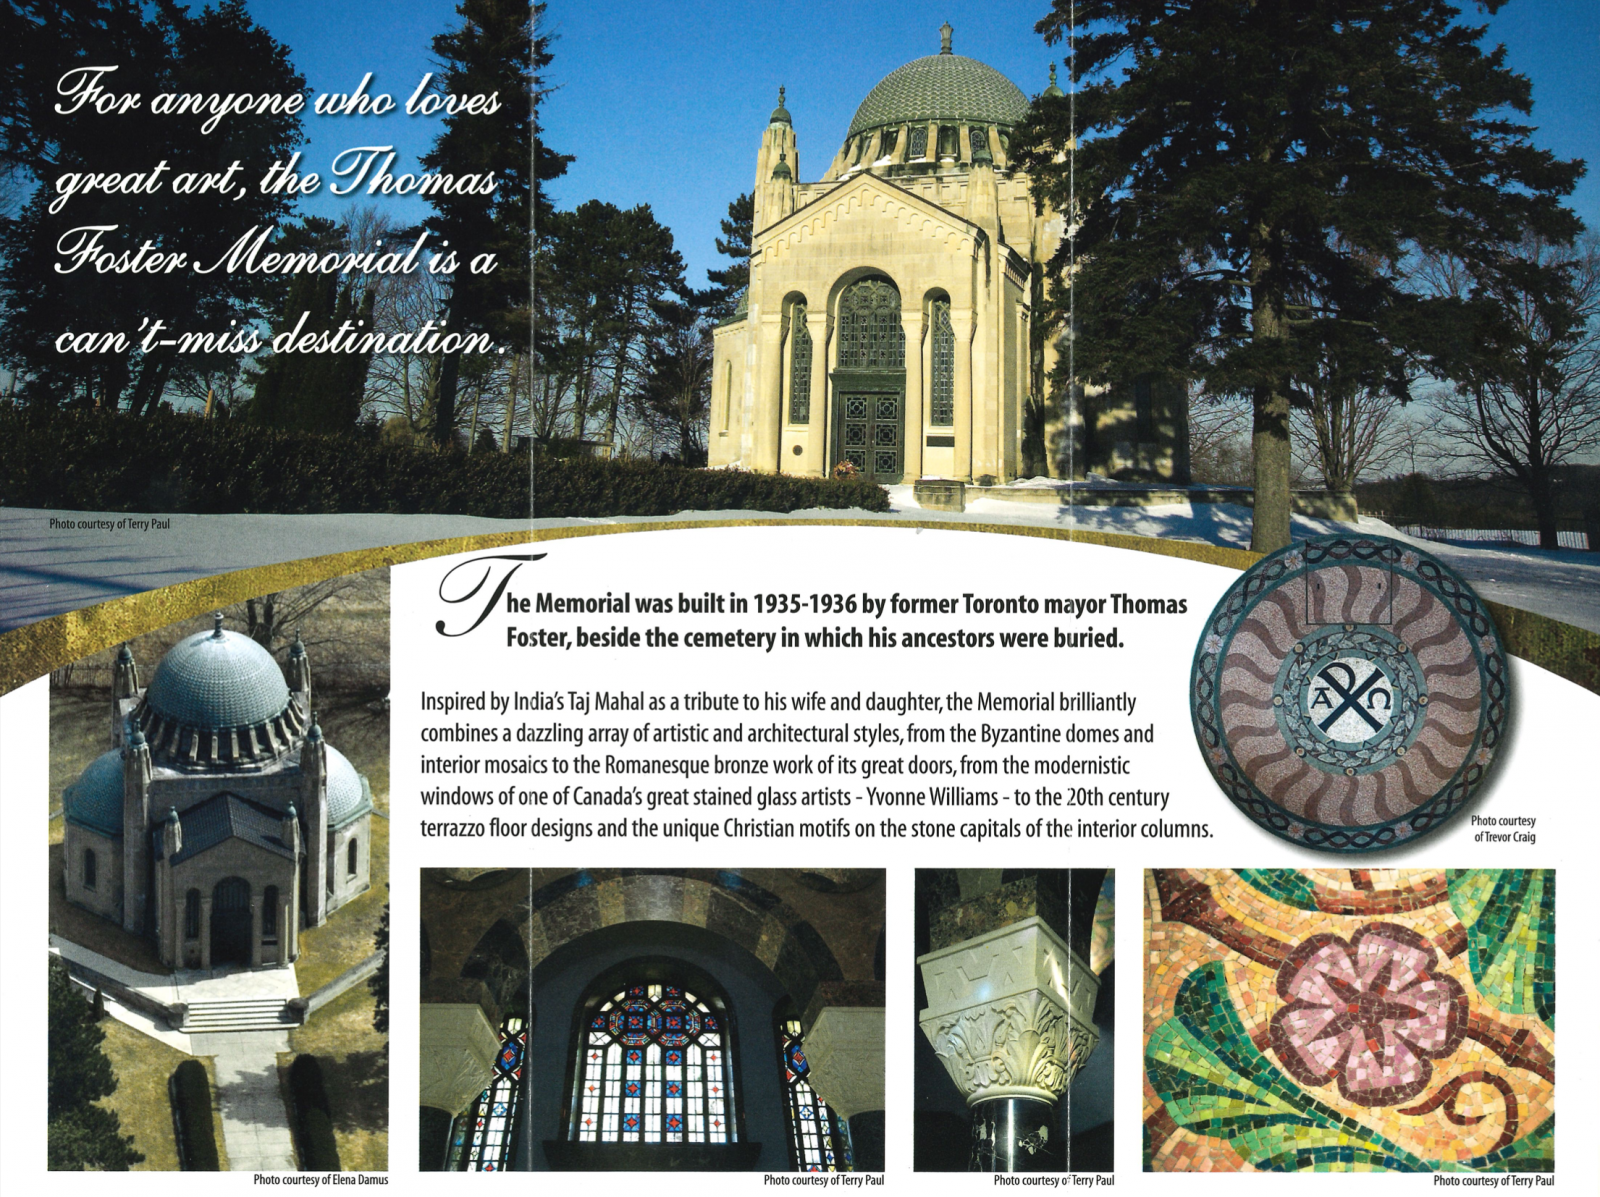
The Thomas Foster Memorial draws inspiration from the world-famous Taj Mahal, located just outside Agra, India. Built in 1650 by Emperor Shah Jahan as a tribute to his beloved wife, the Taj Mahal is widely regarded as the pinnacle of Indian architecture. In the 1930s, Thomas Foster, a former Toronto mayor and successful businessman, sought to create a similarly magnificent structure in Uxbridge as a final resting place for his wife, his daughter Ruby, and himself.
Taj Mahal. Photo courtesy of UNESCO World Heritage Convention
The Making of a Masterpiece
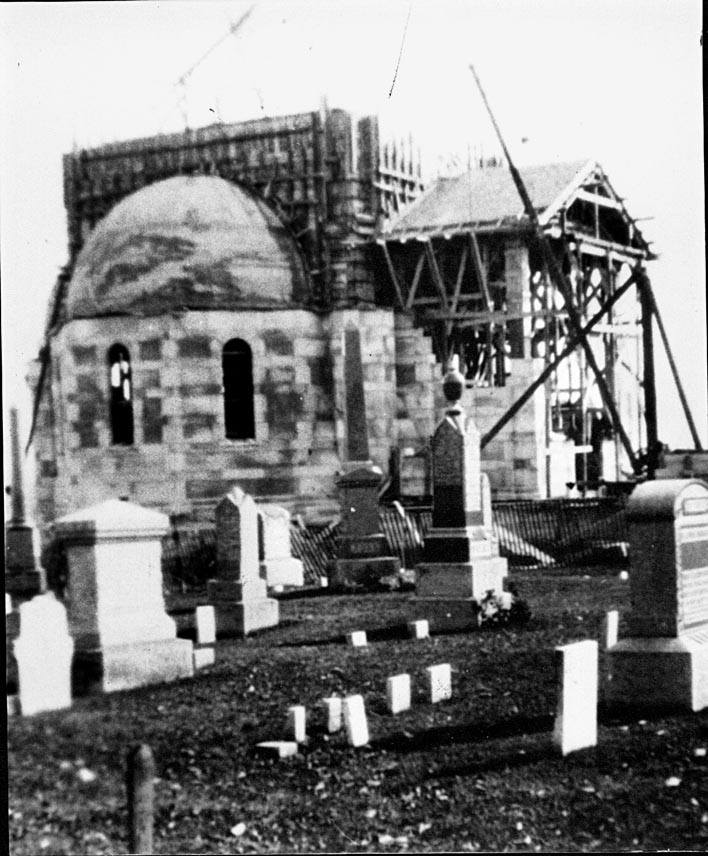
To bring his vision to life, Foster enlisted the Toronto architectural firm Craig and Madill, proposing a grand design that would also serve as a community burial site. A removable slab in the floor was incorporated into the plans to allow coffins to be lowered into crypts below. The initial budget for the project was set at $100,000; however, by the time of its completion, costs had doubled.
Photo of the Foster being built in the 1930’s. Photo courtesy of Peter Hvidstens Uxbridge The First One Hundred Years
Despite the financial challenge, the memorial was completed with elegance and precision thanks to the skillful execution of the building contractor, Messrs. Witchall and Son, alongside general foreman Ted Griffith and Dave Billson. Skilled artisans were brought in to contribute their expertise, including Italian craftsmen who installed exquisite mosaics and terrazzo flooring imported from Italy. Even gold lettering was carefully applied by workers who took on extra weekend jobs due to the scarcity of employment during the Great Depression.
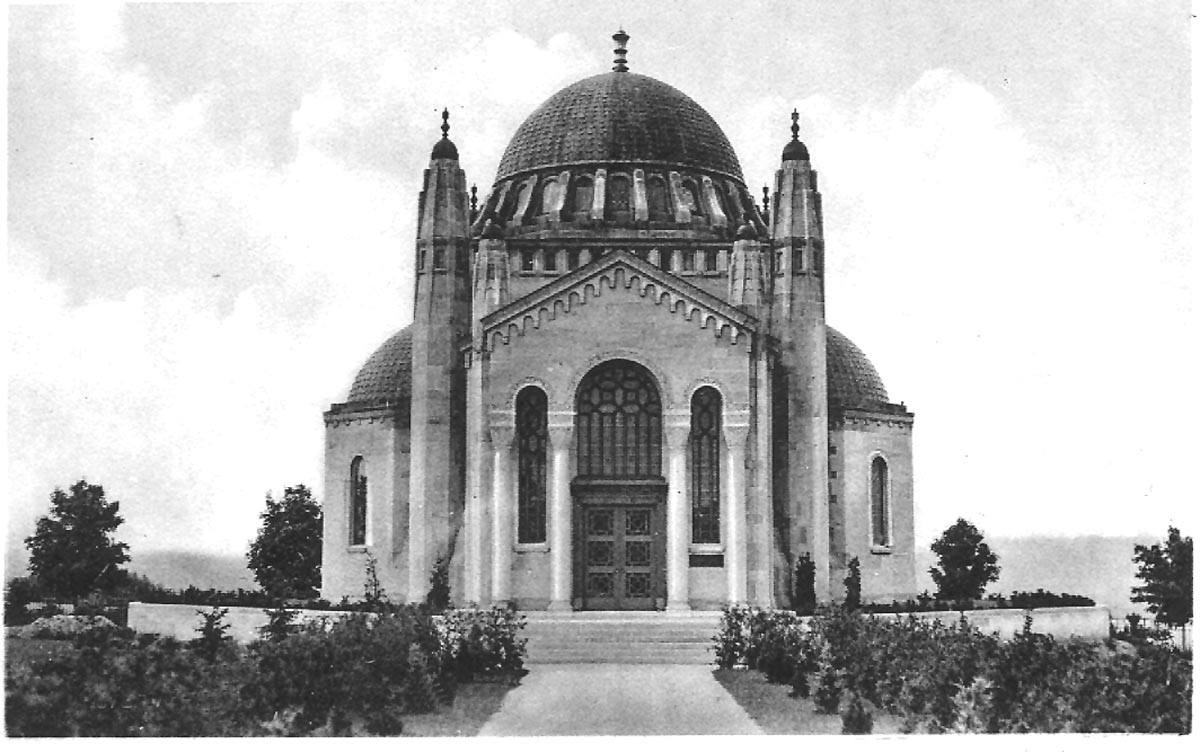
Photo of the completed Foster which was dedicated in October 1936. Photo courtesy of Peter Hvidstens Uxbridge The First One Hundred Years
A Community Effort
Beyond its architectural splendour, the construction of the Thomas Foster Memorial provided much-needed work for the local community during difficult economic times. Workers were housed and fed for a mere $1.00 per day, which covered three meals and lodging. The infusion of jobs and services helped many families through the hardships of the era.
The project spanned three seasons, culminating in a cornerstone-laying ceremony in the fall of 1935. One year later, in October 1936, the Thomas Foster Memorial was officially dedicated.
A Lasting Legacy
Thomas Foster passed away in 1945 at the age of 93, leaving behind not only a fortune but also a legacy of grandeur in the form of the memorial. Today, this architectural gem continues to intrigue visitors, standing as a remarkable symbol of love, remembrance, and community spirit.
For those who appreciate history, architecture, and hidden gems, the Thomas Foster Memorial is a must-see destination in Uxbridge. Whether admiring its breathtaking design or reflecting on its rich history, this extraordinary structure remains a lasting tribute to one man’s remarkable vision.
Hours of Operation
The memorial is open for exploration from Wednesday to Sunday during July and August and guided tours can be arranged during May, June, and September.
The Thomas Foster Memorial stands not only as a symbol of love and remembrance but also as a testament to architectural beauty and artistic craftsmanship. It invites visitors to reflect on its history and the enduring legacy of Thomas Foster and his family.
Check out our Uxbridge and Scugog Events Pages to keep up to date on whats going on around town. Click the links or scan the Code with your phone to take you directly there.
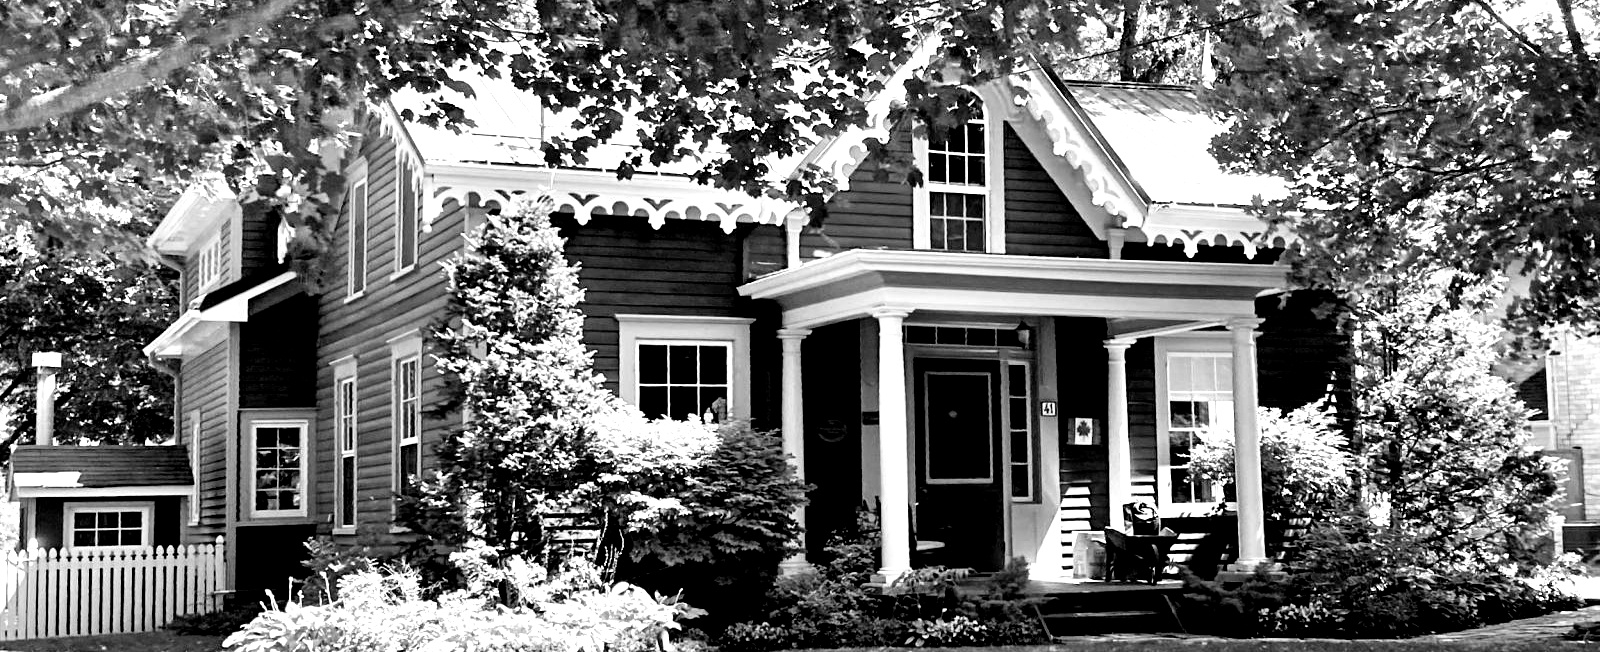
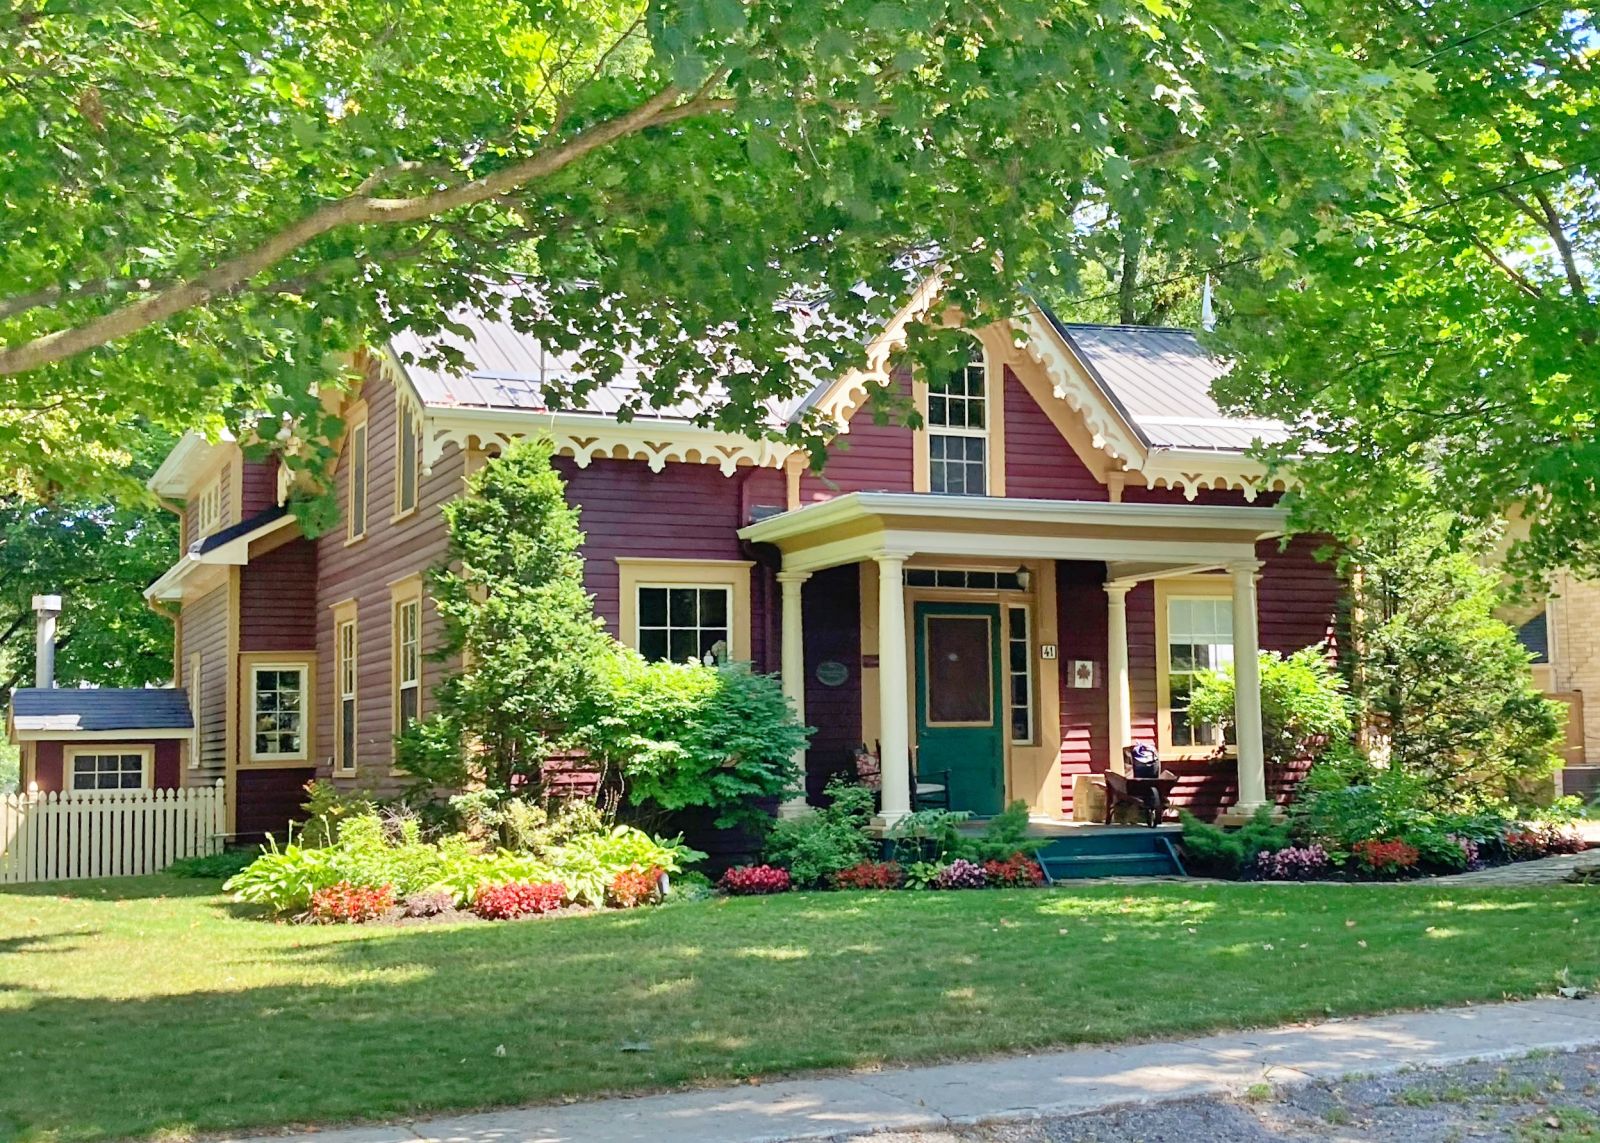
The Wheler House stands as a historical testament to the evolution of architectural styles and the adaptive reuse of buildings within the community of Uxbridge. Built in 1860 by Edward Wheler, this charming 1 1/2 storey Ontario Cottage style home originally sat at the corner of Brock and Main Street. Likely crafted from lumber sourced from George Wheler’s local mill, it symbolized the craftsmanship and resourcefulness of the era.
In 1871, the landscape of Uxbridge began to change, prompting the buildings relocation to its current site. Spearheaded by Ira G. Crosby, the Town Treasurer, this move marked a shift from residential to commercial development in the area. As the Wheler House settled into its new surroundings, it underwent a transformation reflective of changing architectural tastes.
Initially constructed in a plainer, almost Georgian-style, the Wheler House embraced elements of Gothic Revival architecture in the late 19th century. Intricate bargeboard and finials were added, infusing the home with decorative flair and echoing the romanticism of the Gothic Revival movement. These embellishments spoke to the aspirations and aesthetics of the time, enriching the visual appeal of the dwelling.
The early 20th century witnessed further enhancements to the home, as it embraced the Classical Revival influence. A porch, characteristic of the Classical Revival style, was incorporated into the design, providing both aesthetic charm and functional space for leisure and social gatherings.
Today, the Wheler House stands as a fusion of architectural styles, a testament to the enduring legacy of its builders and the rich history of Uxbridge. Its evolution over time reflects the adaptive spirit of the community, ensuring its continued relevance and significance for generations to come.
SOURCES:
Visit the Uxbridge Walking Tour Brochure by clicking HERE
The Township of Uxbridge Heritage Register can be found HERE
Learn more about historic homes in Uxbridge by following our Blog HERE
Check out our Uxbridge and Scugog Events Pages to keep up to date on whats going on around town. Click the links or scan the Code with your phone to take you directly there.
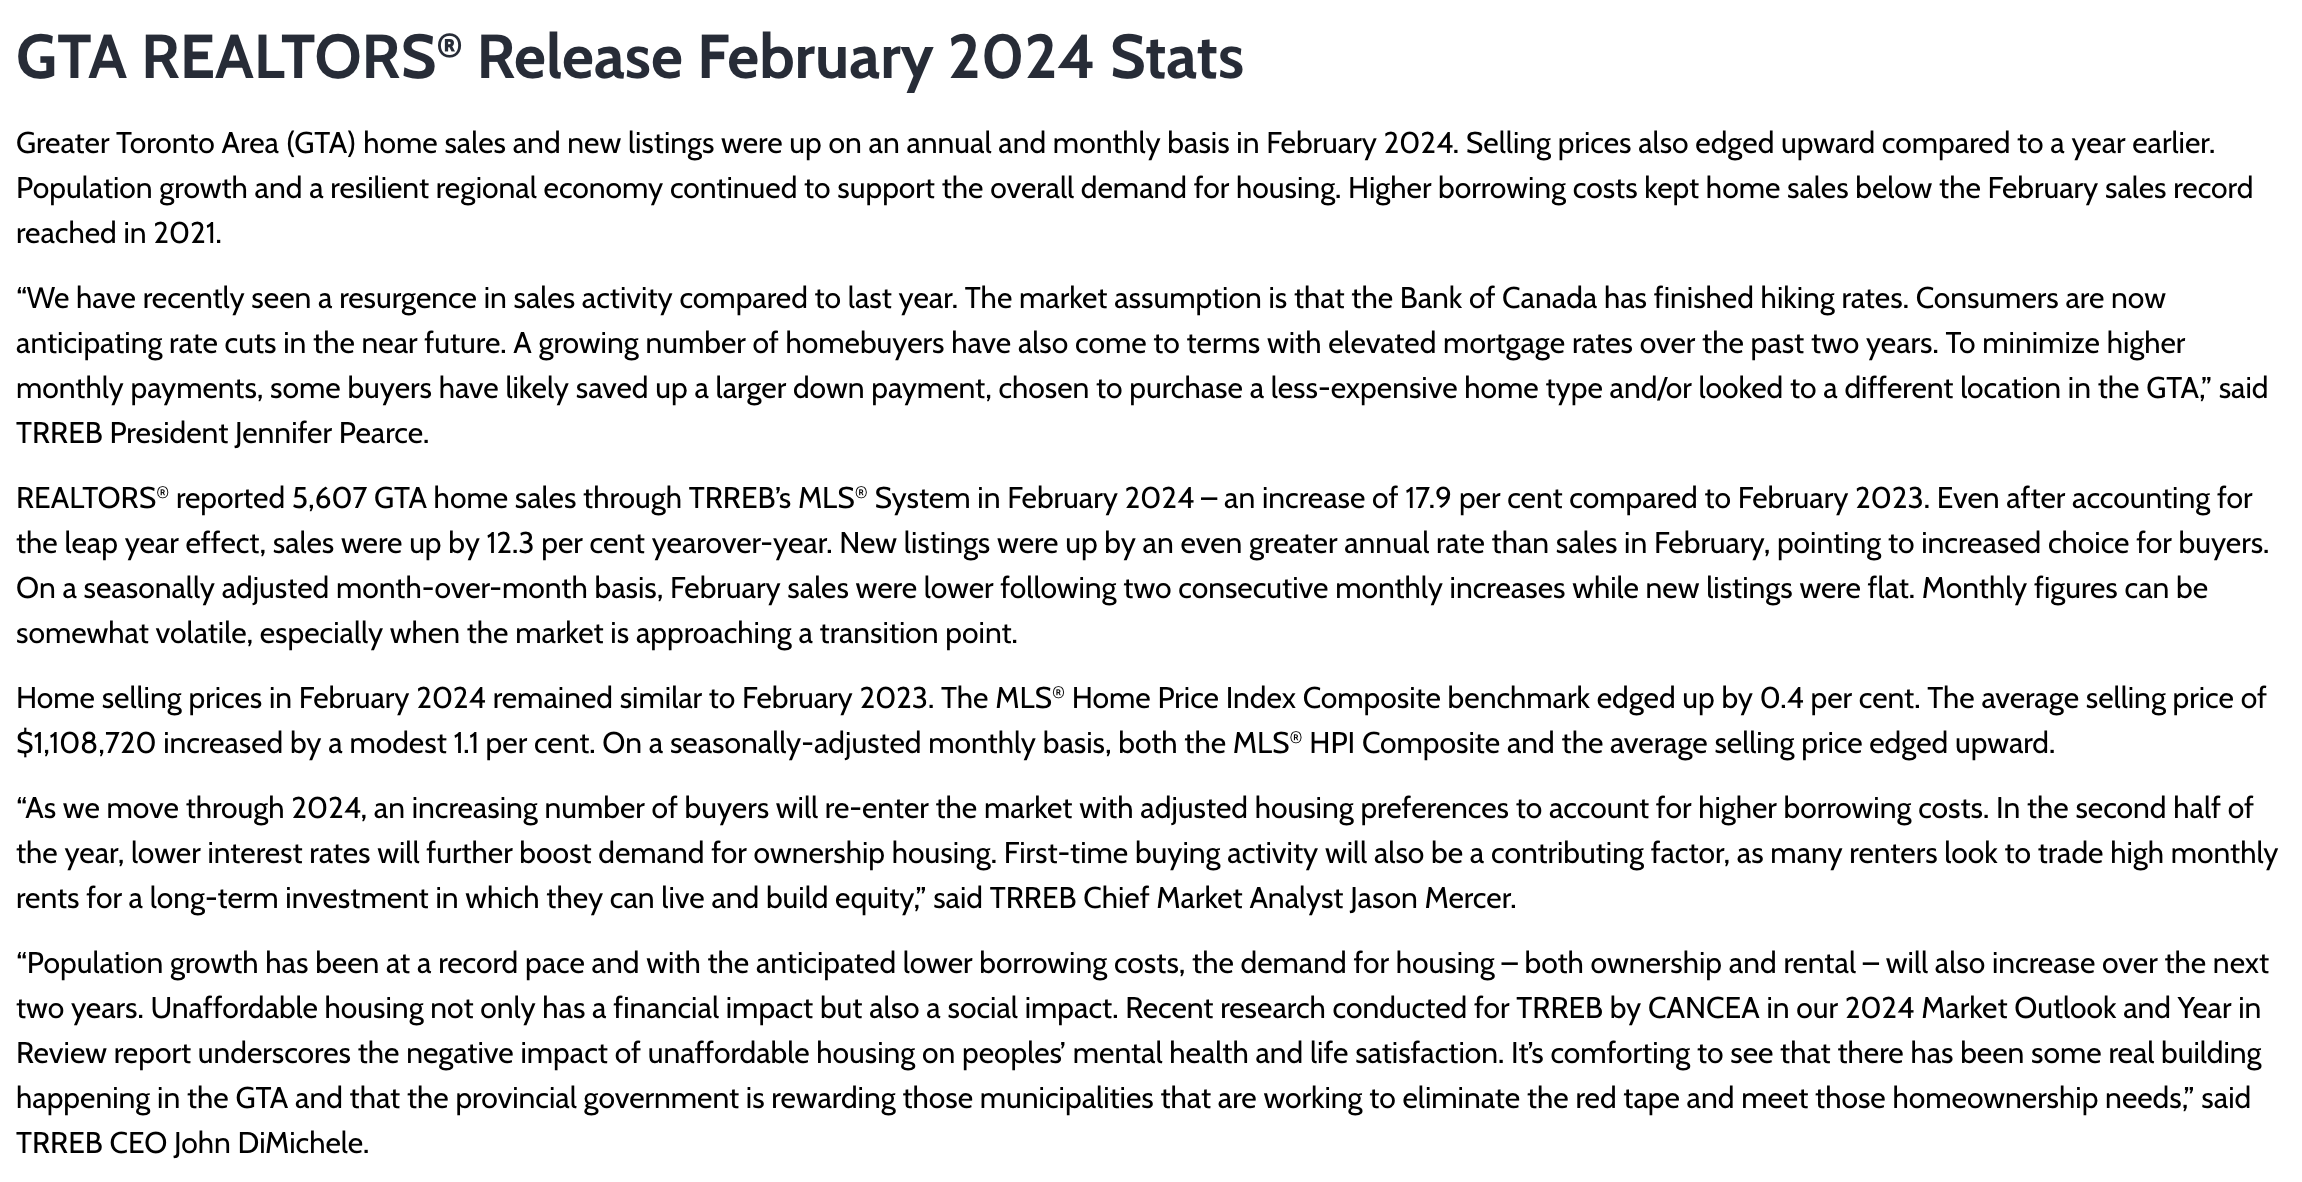
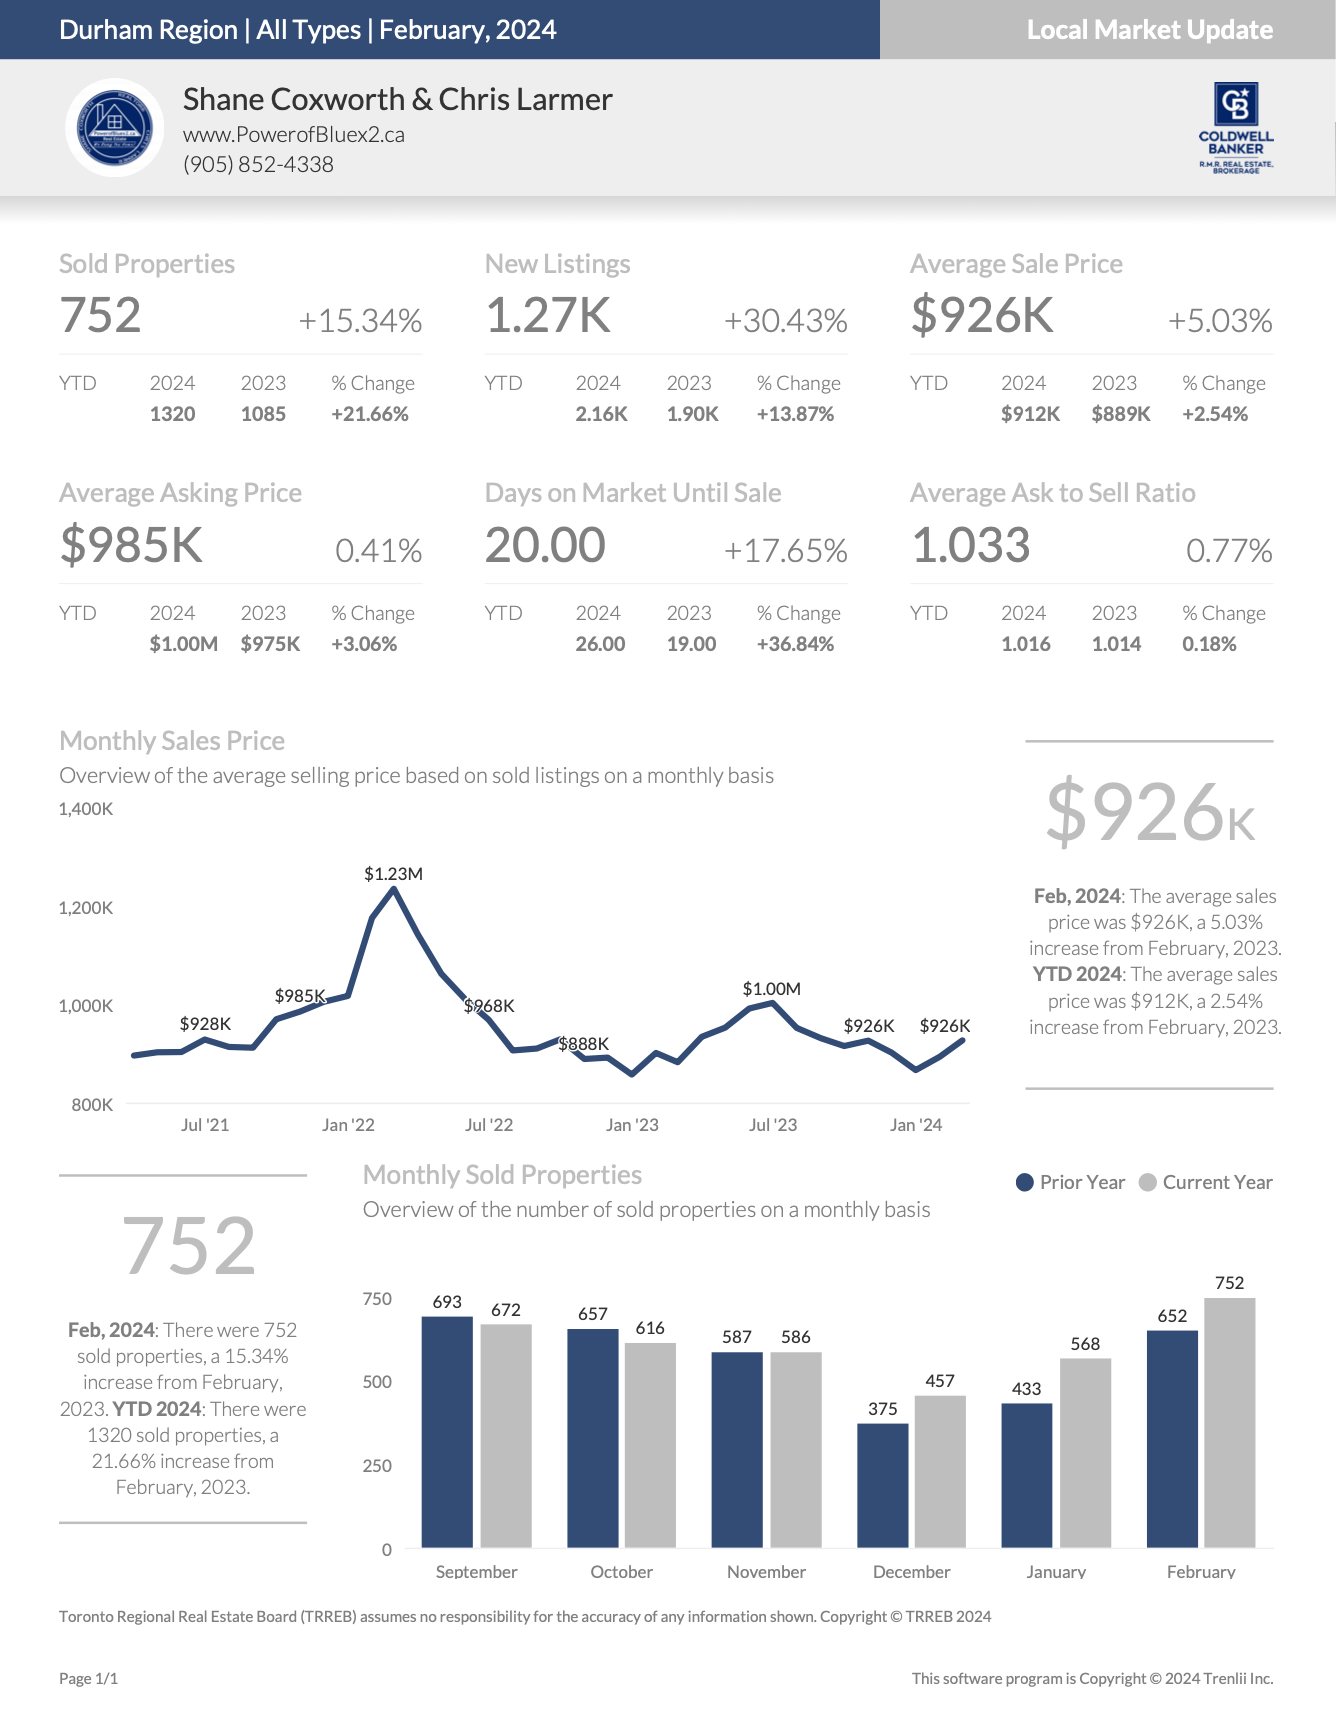
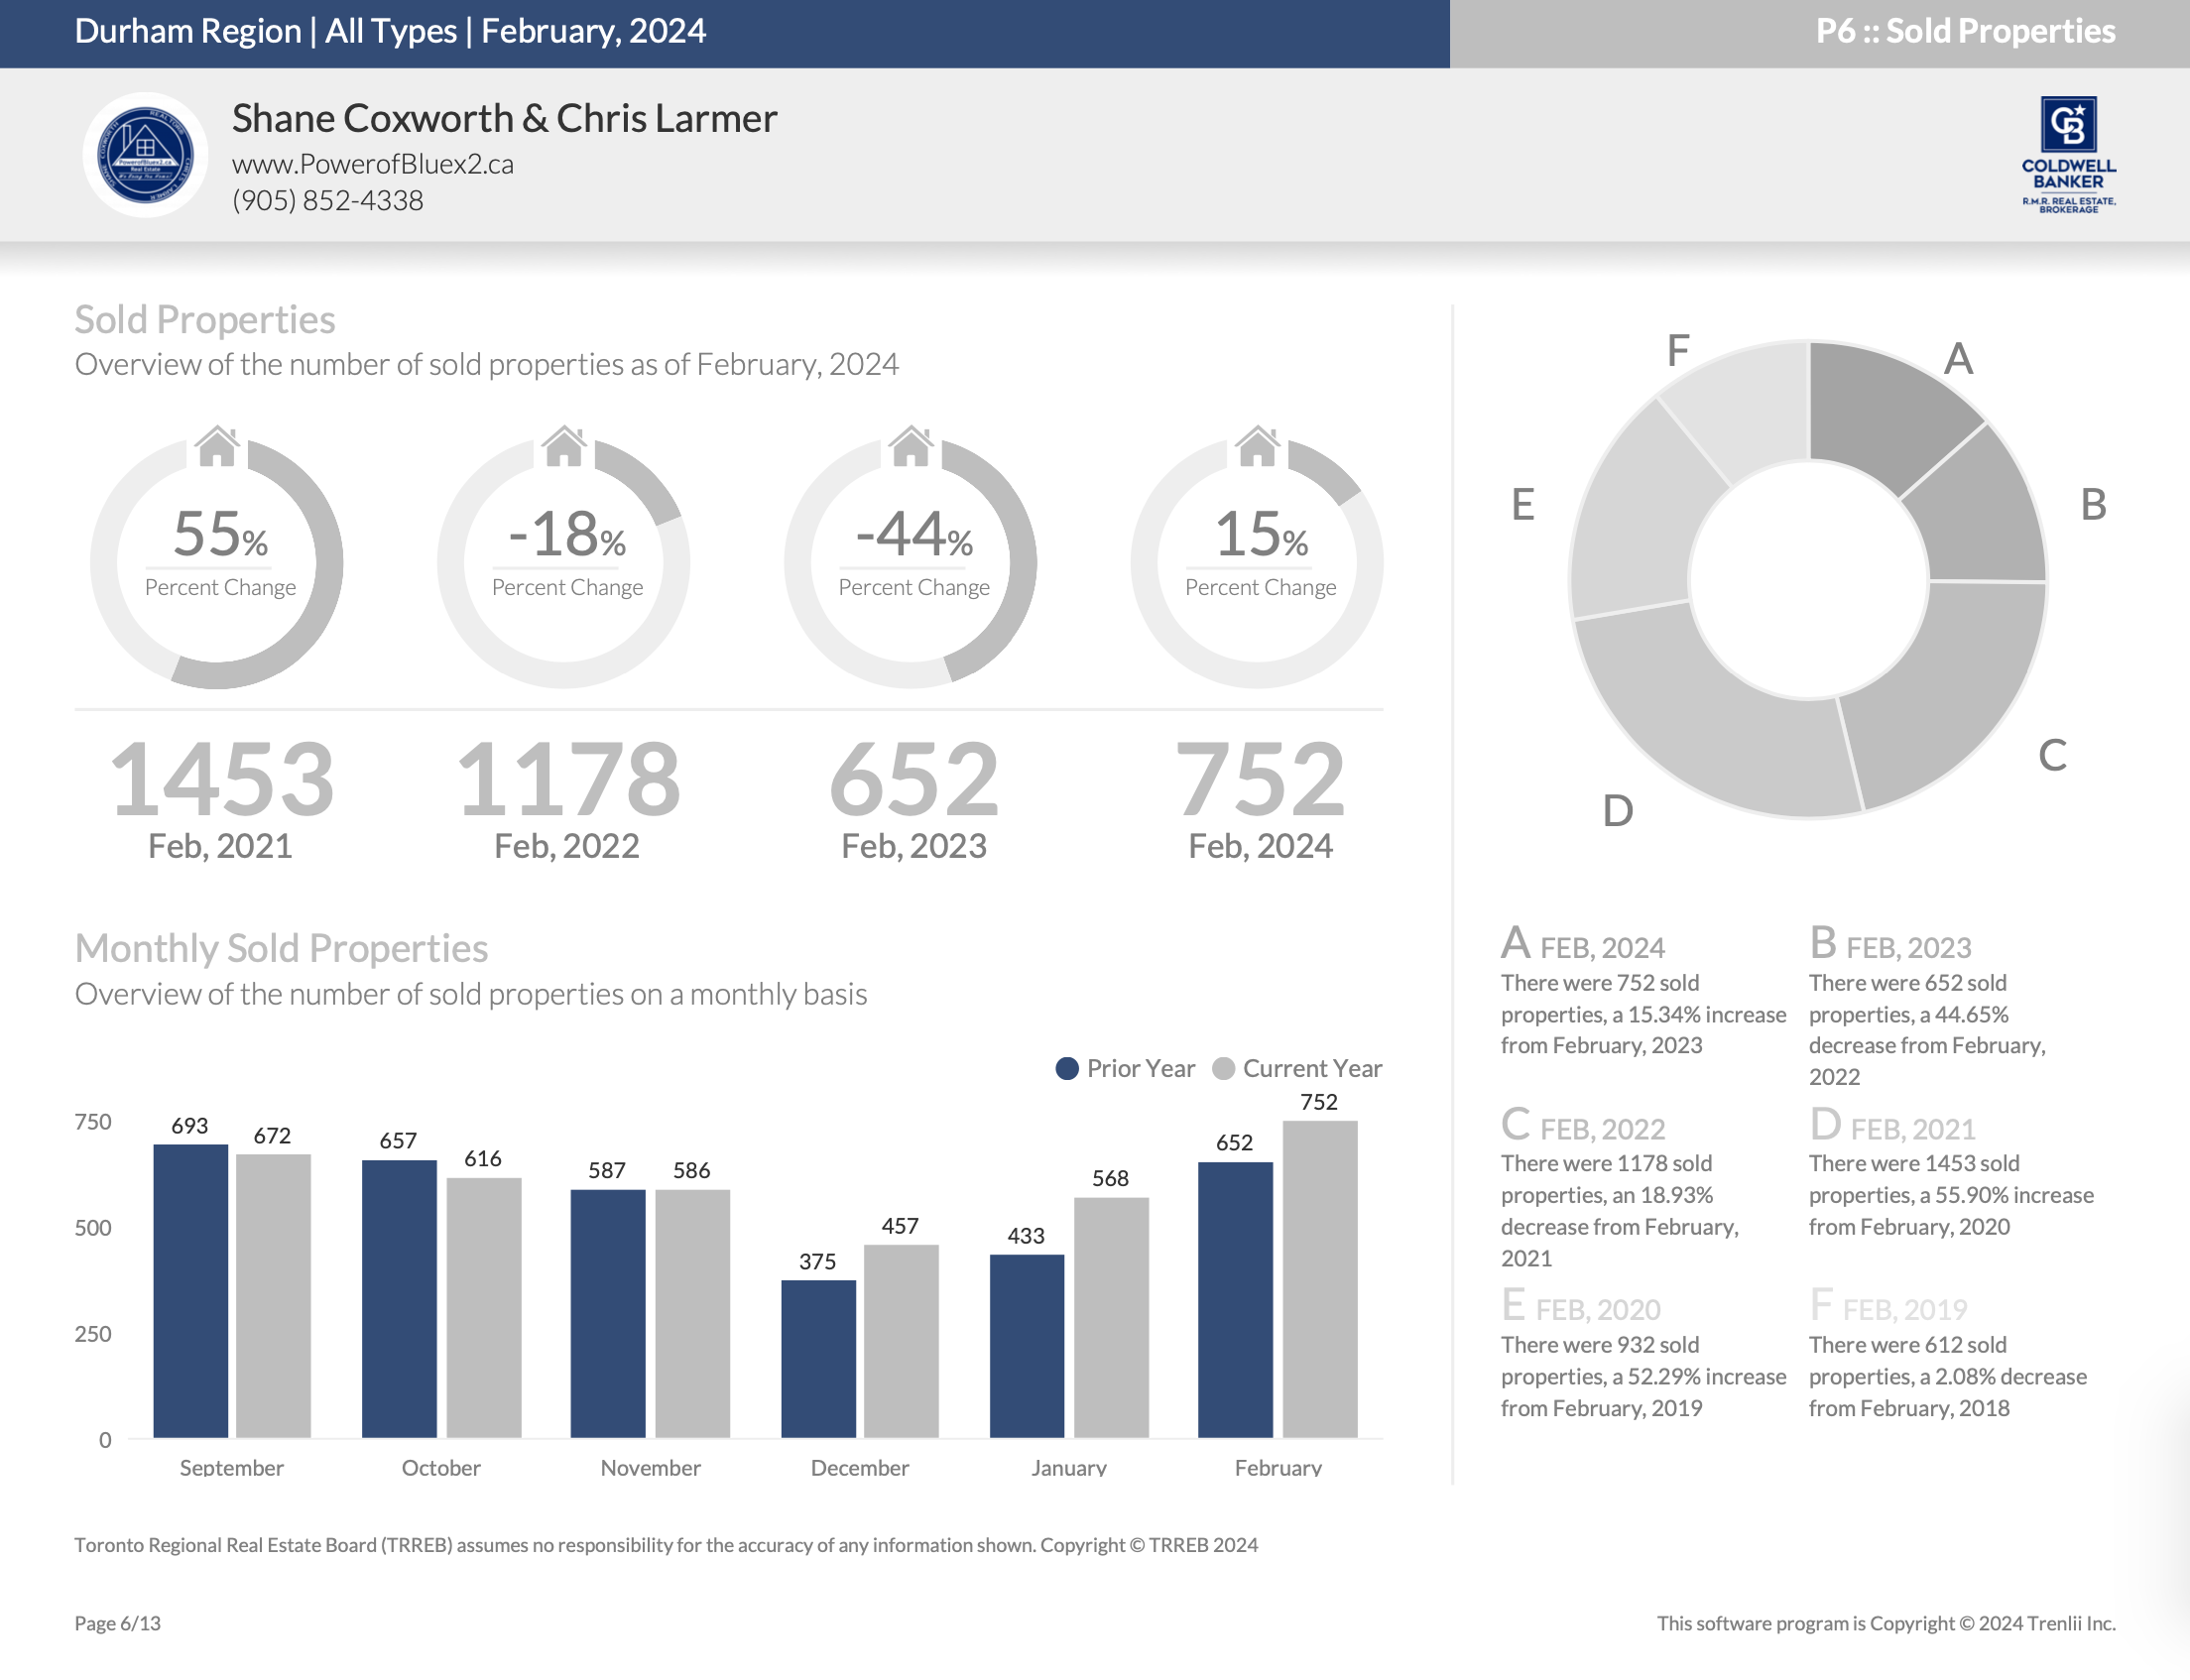
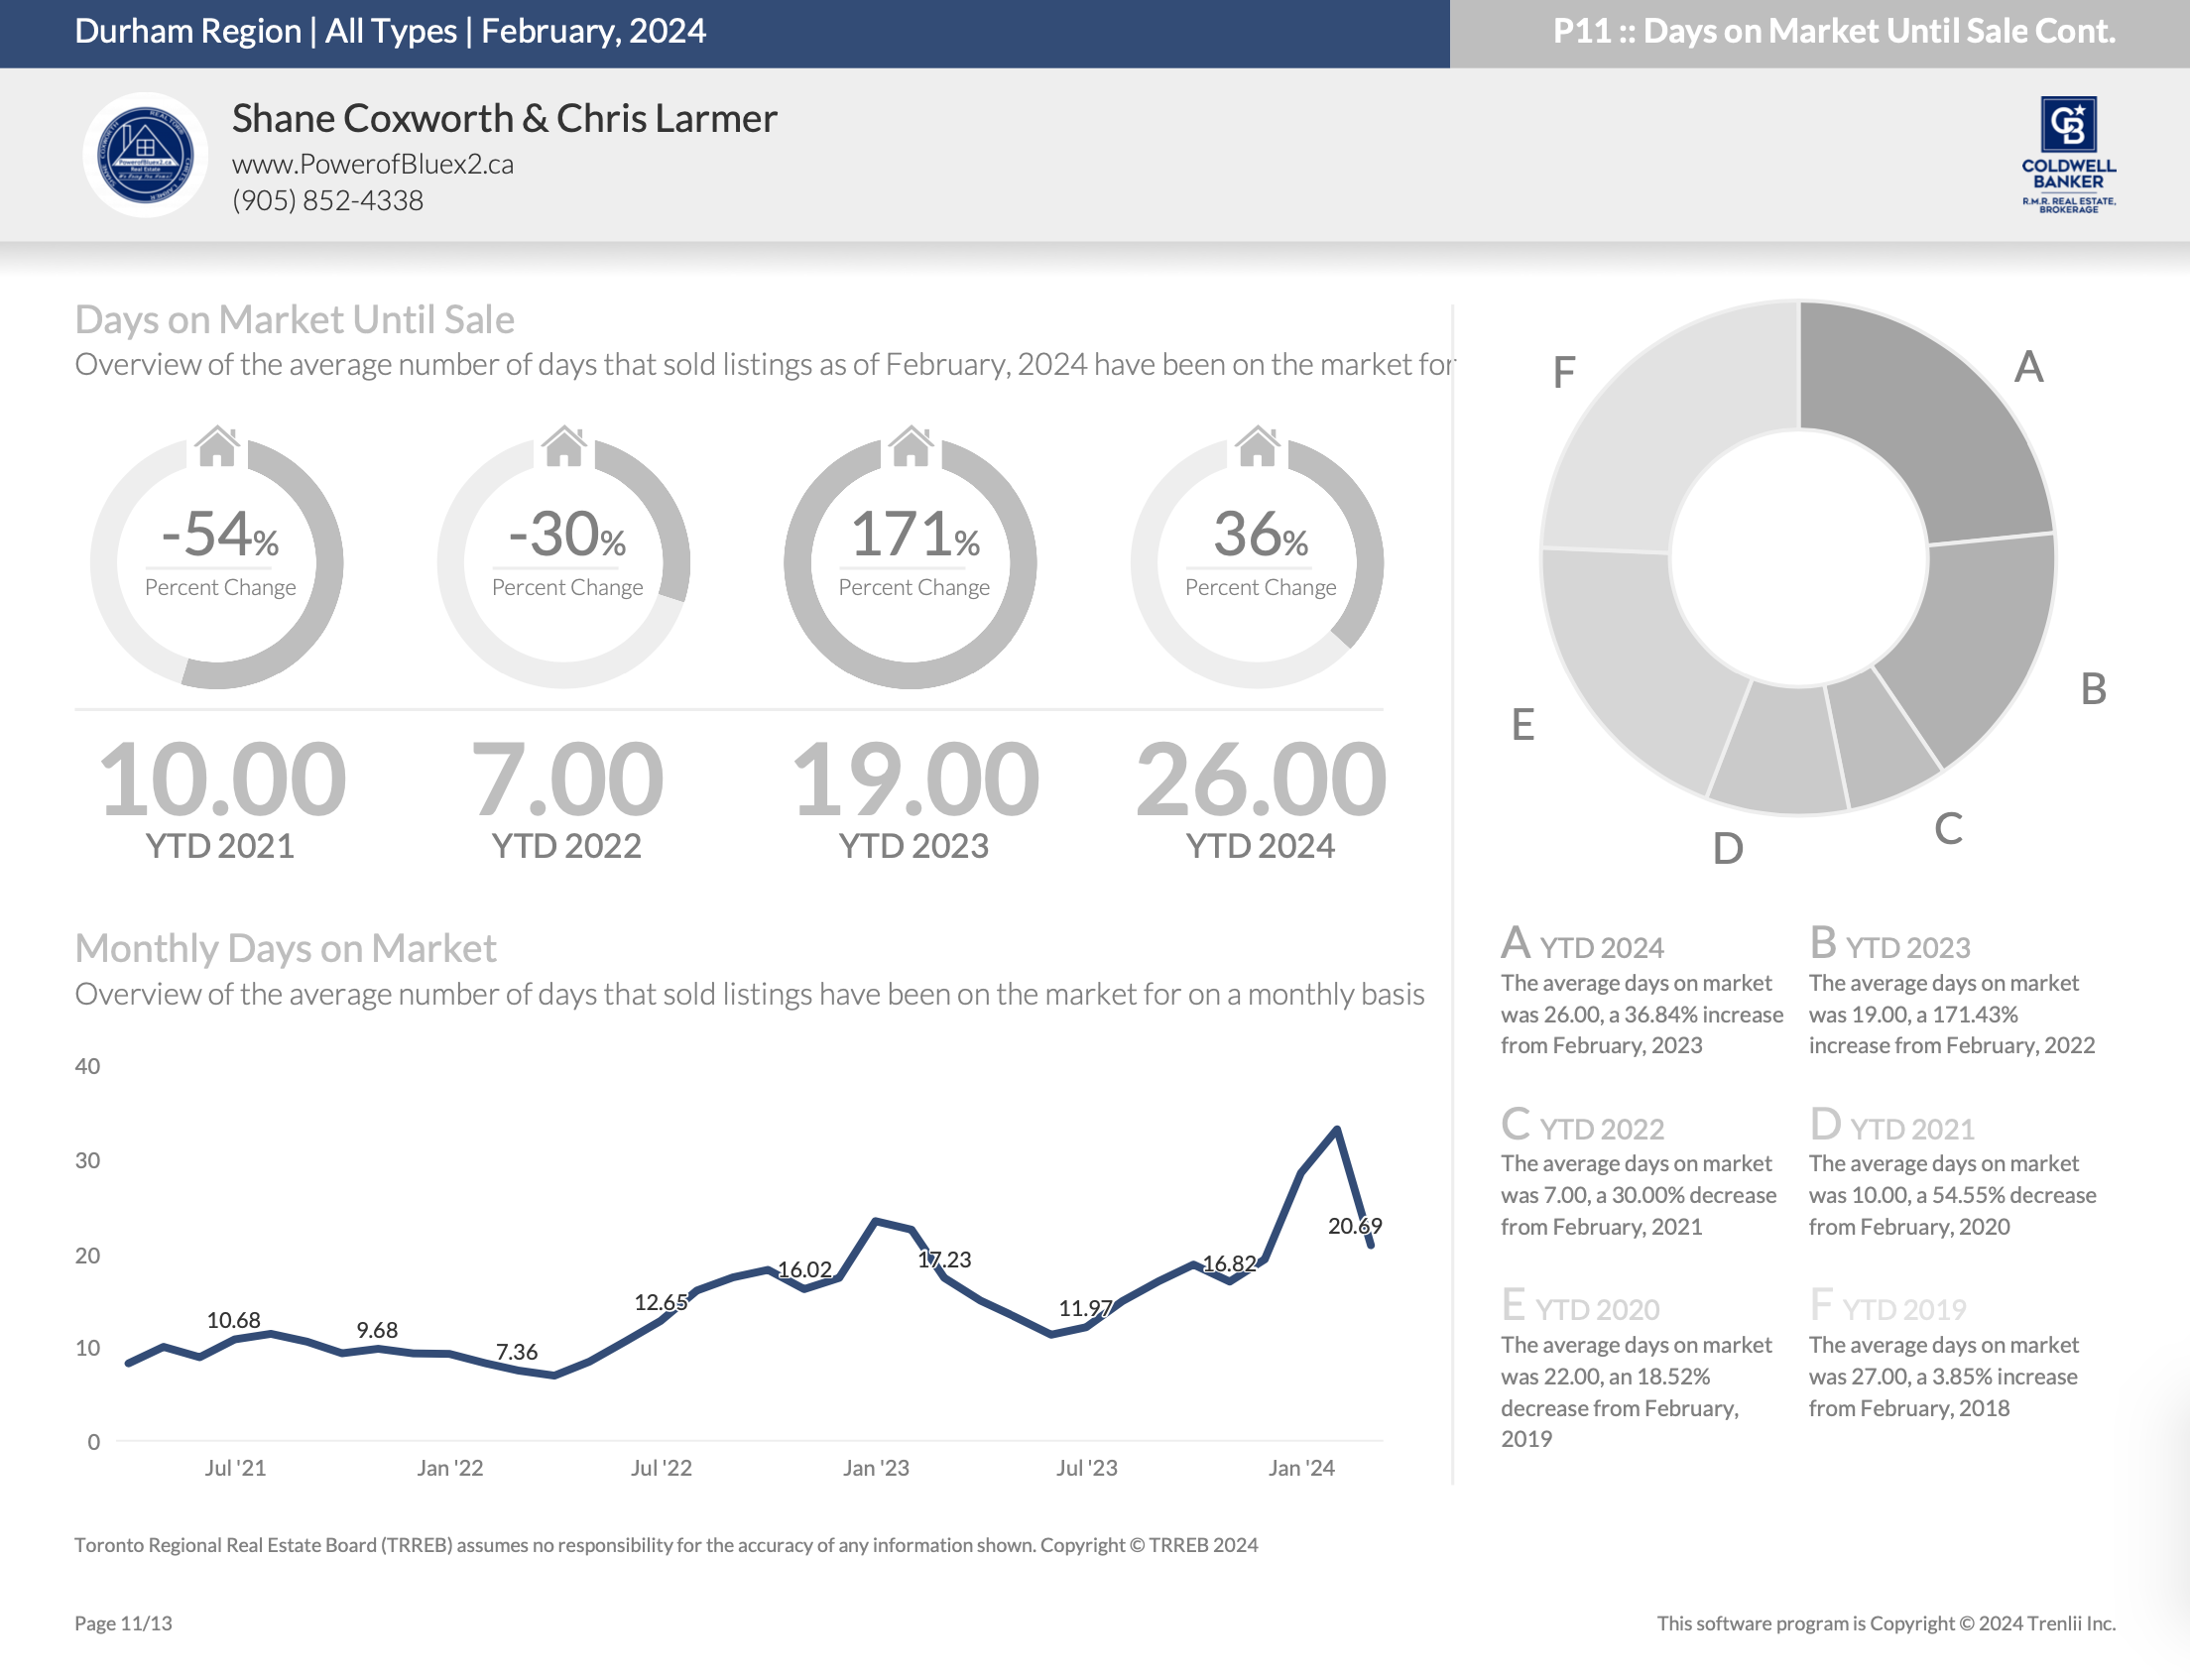
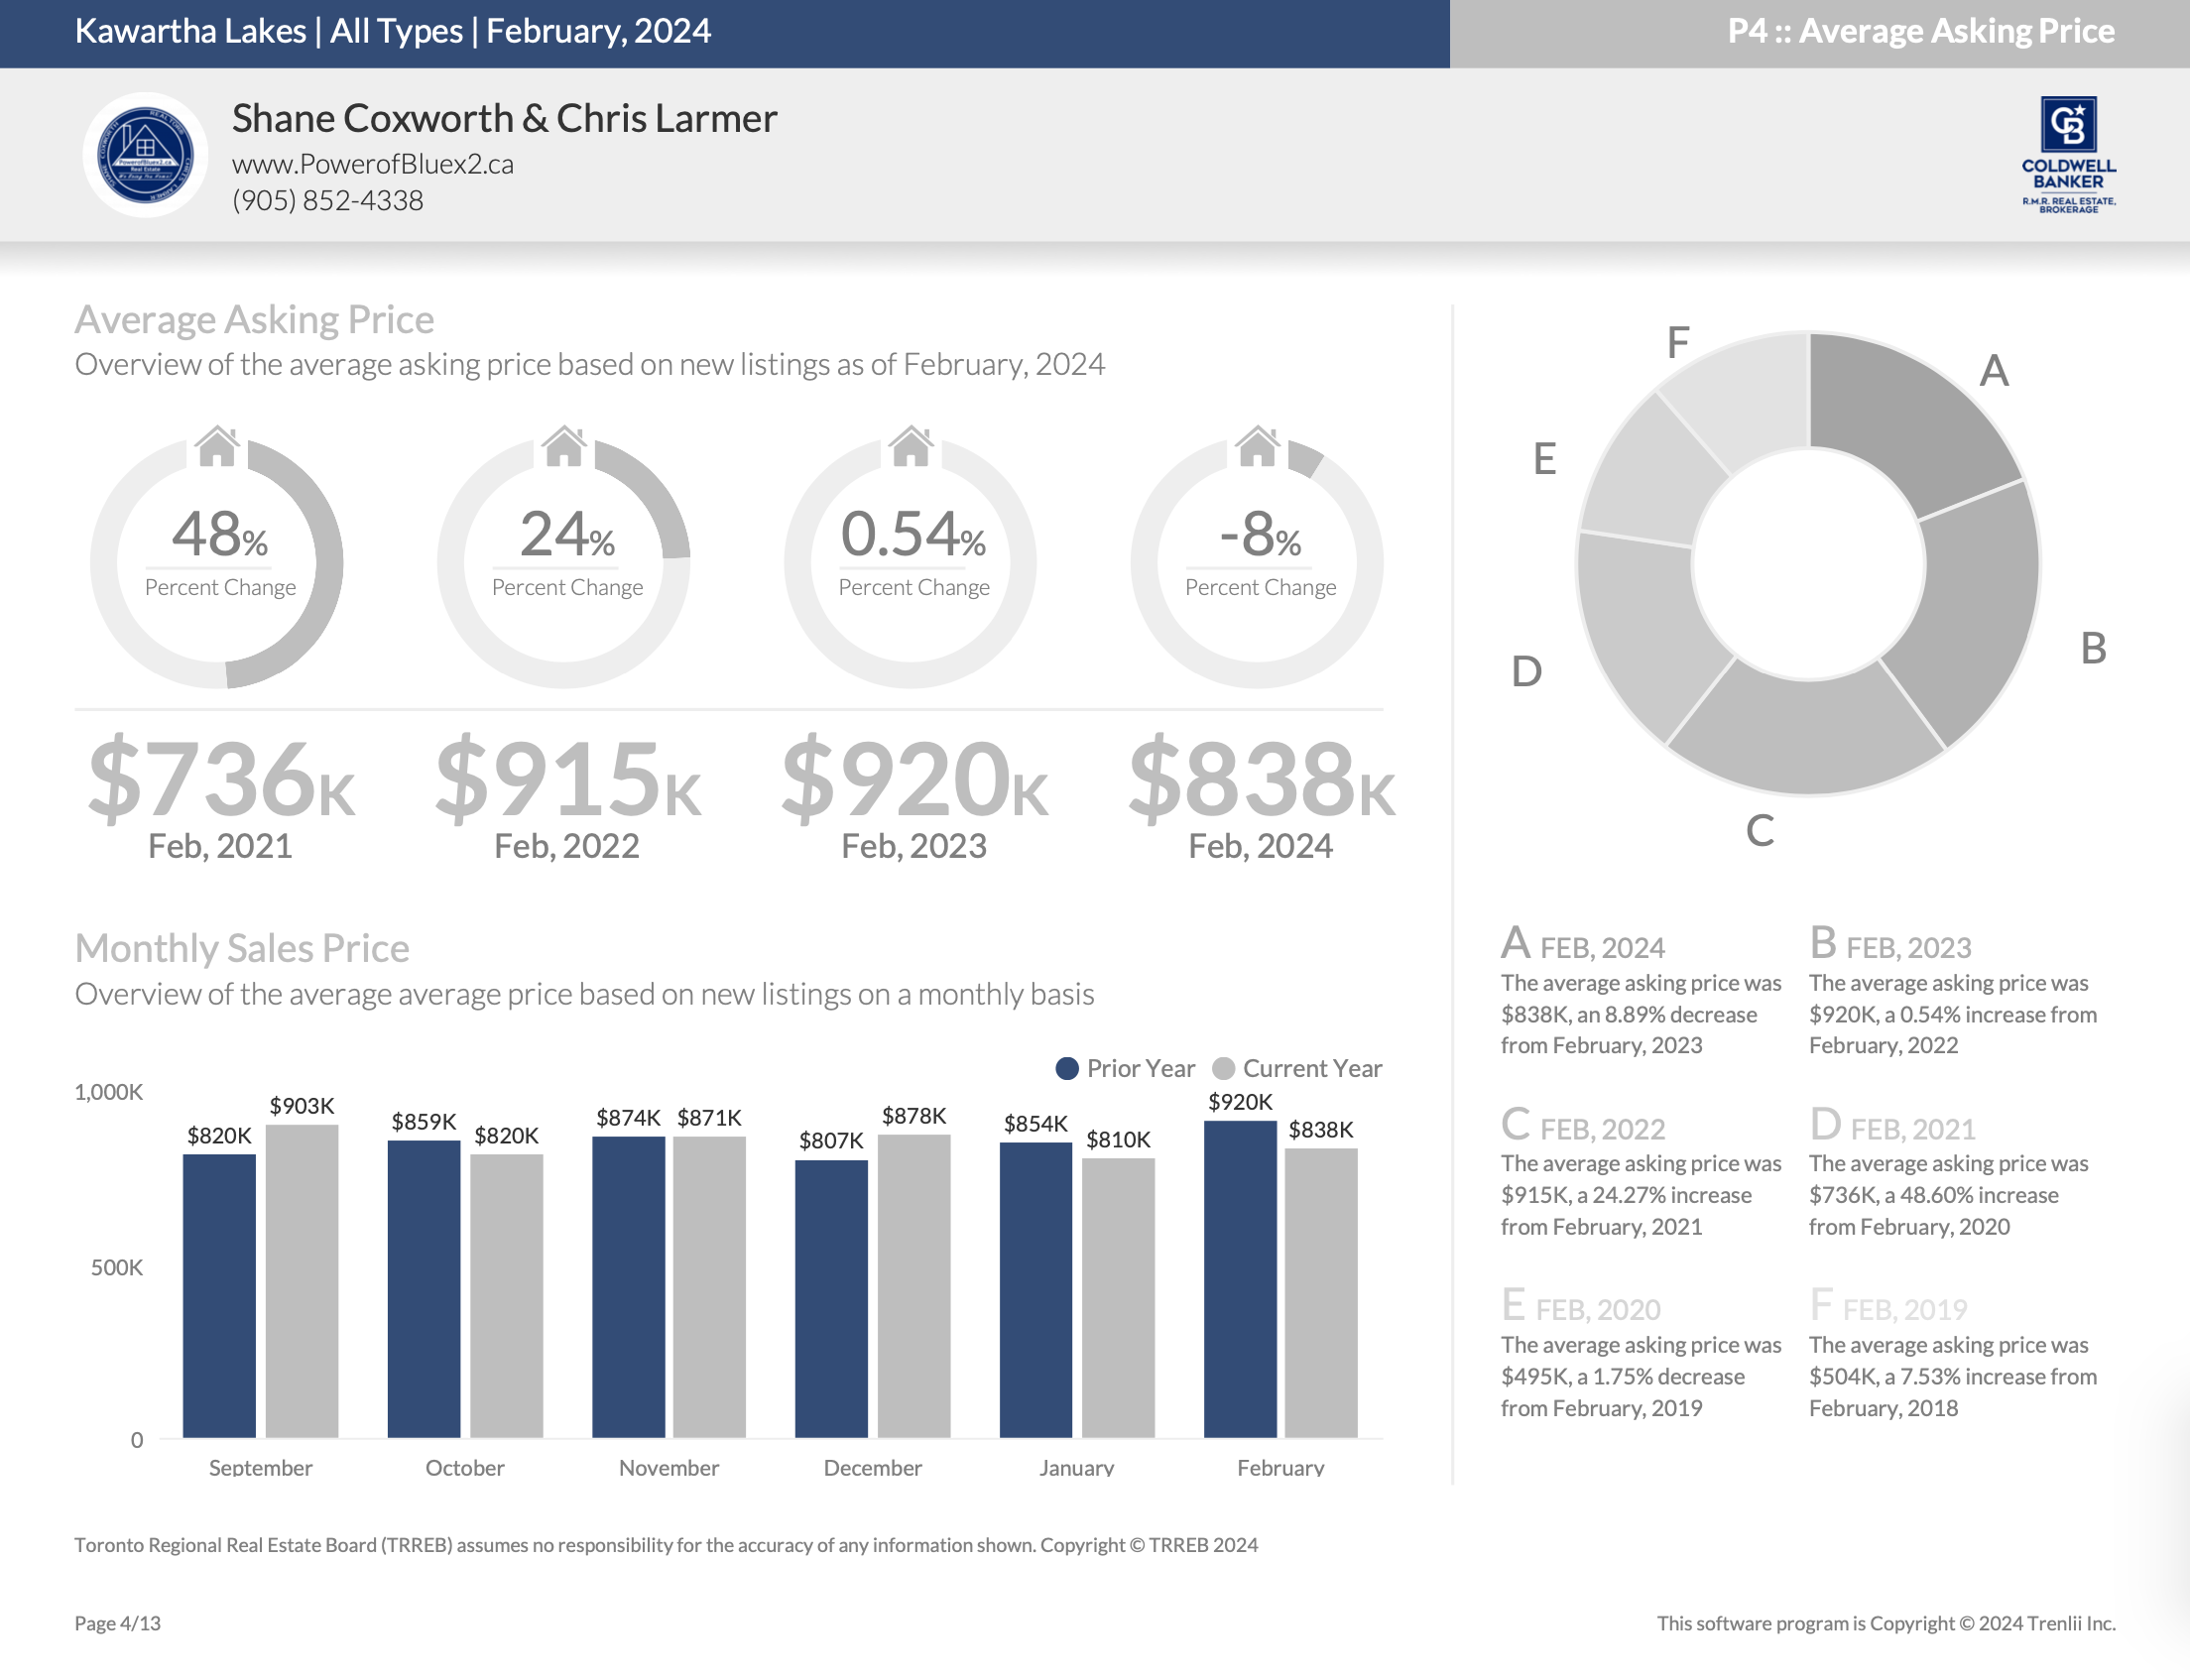
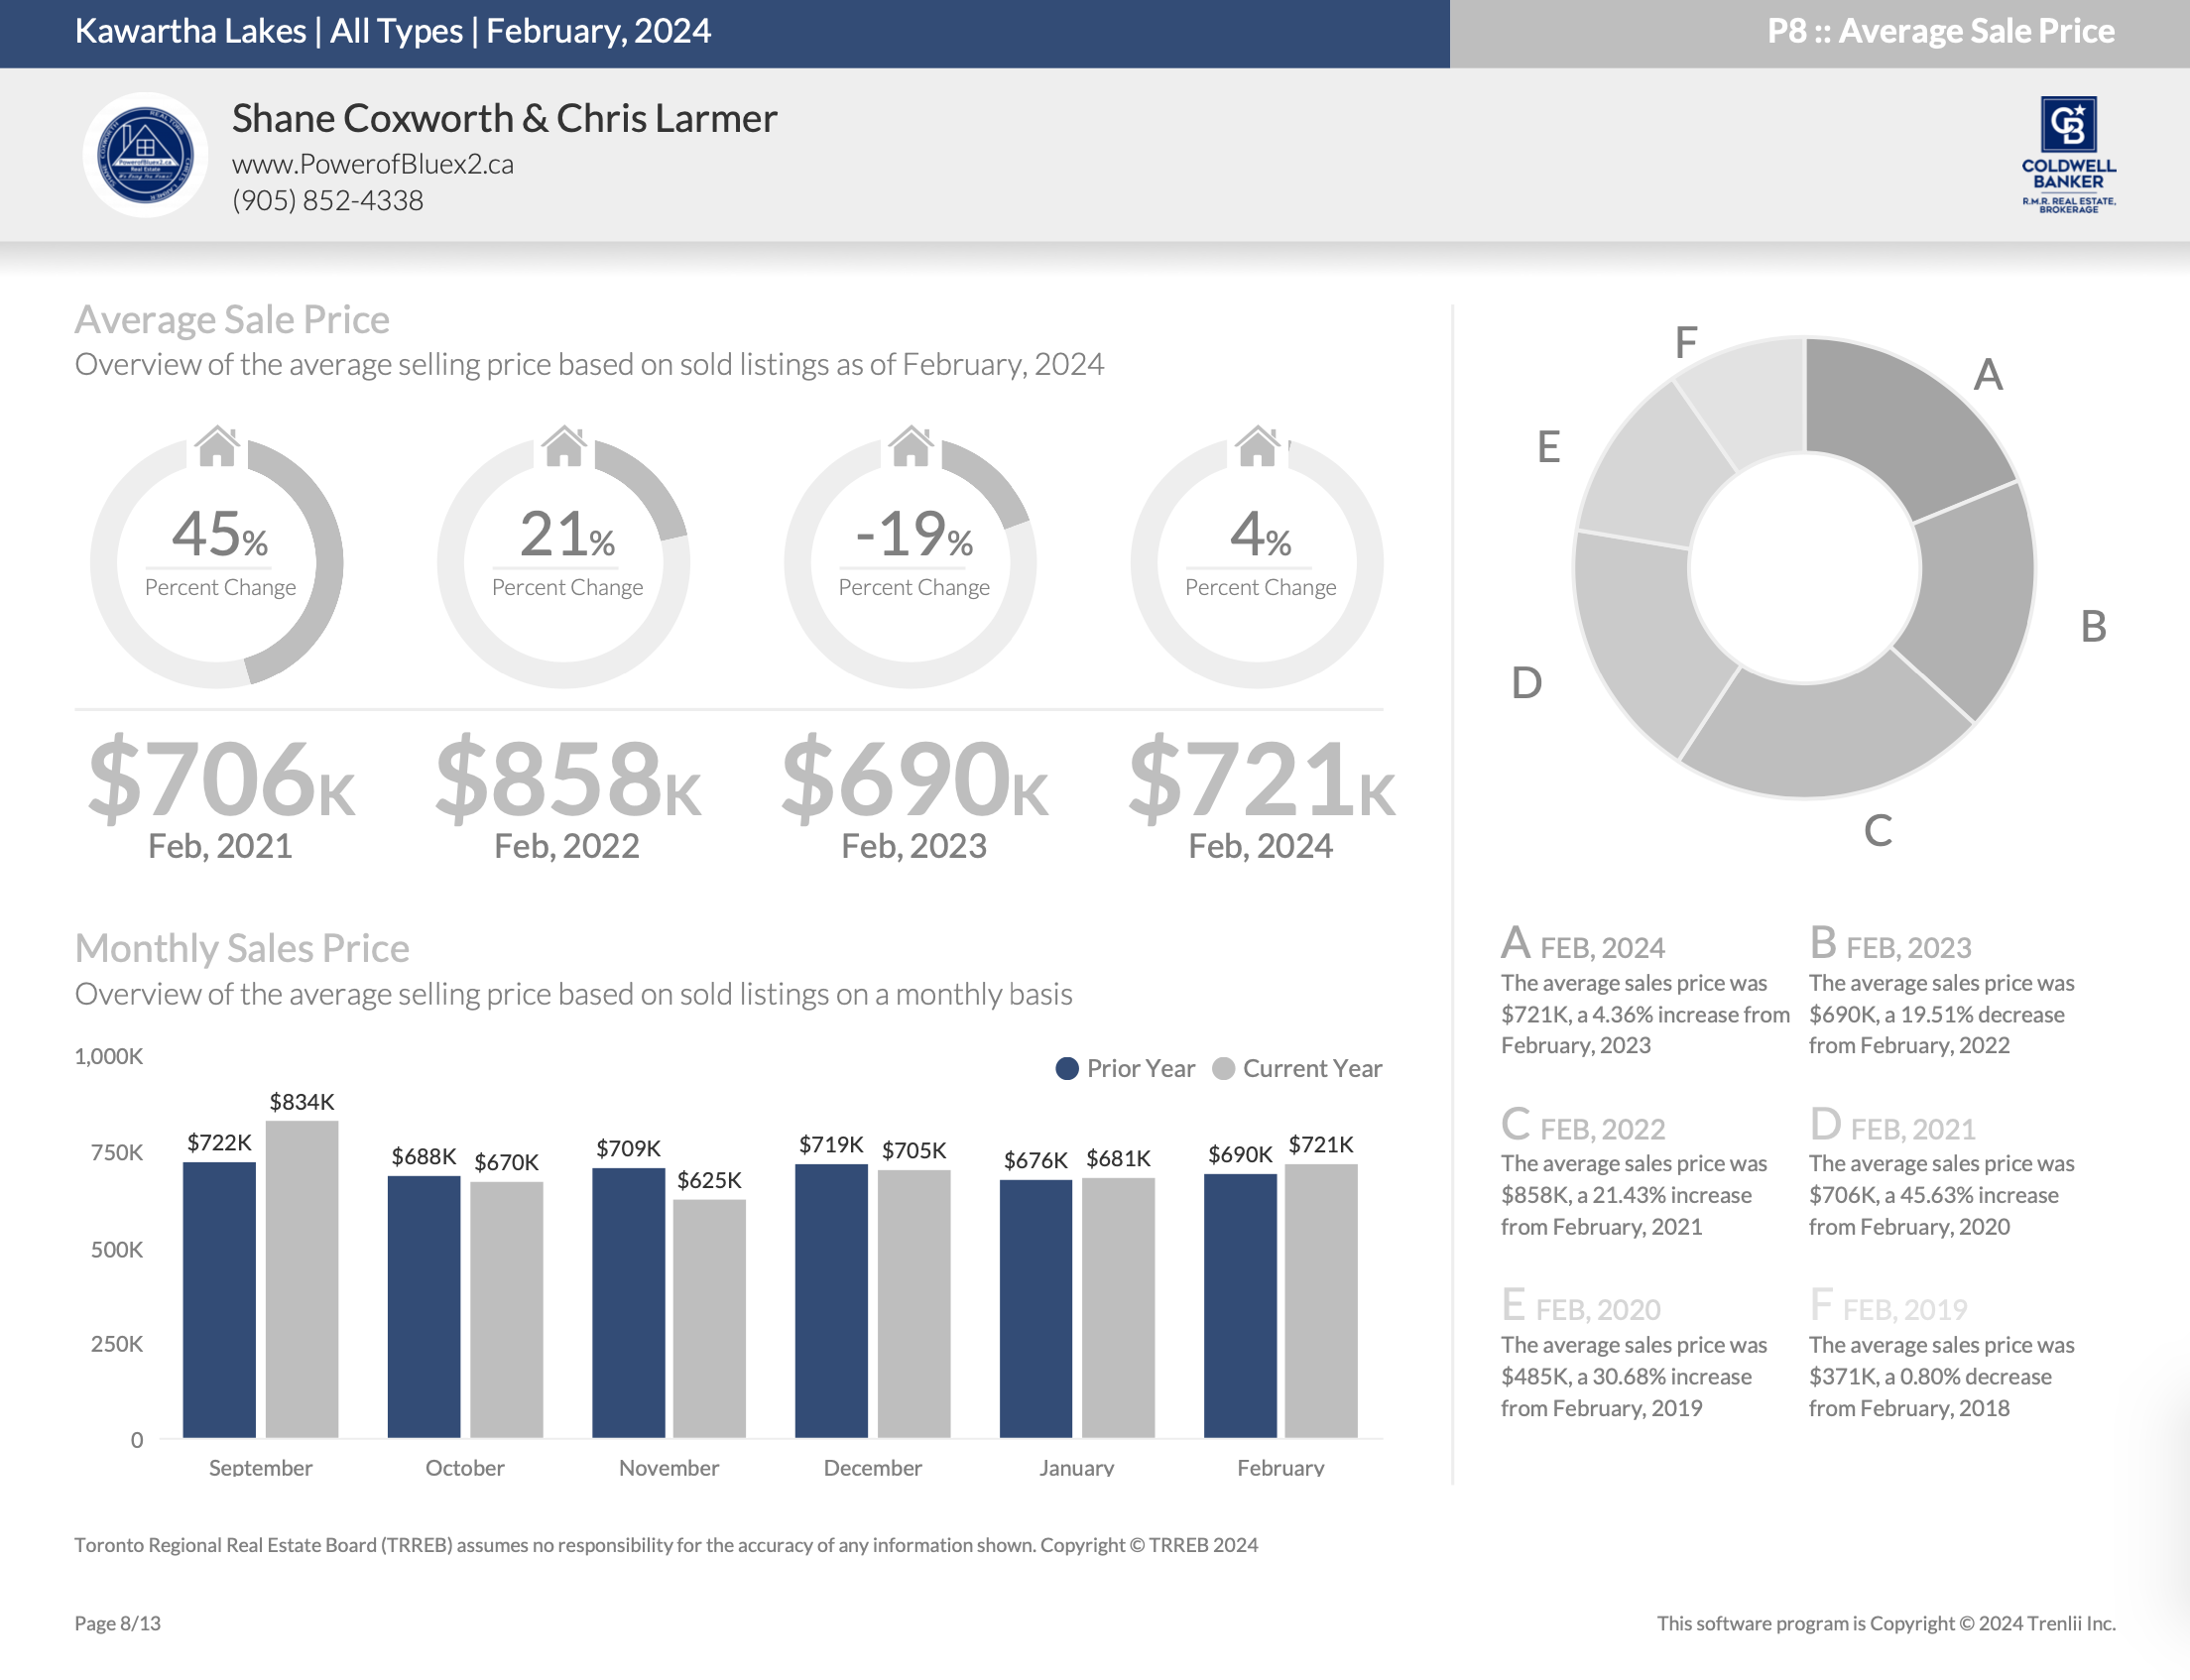
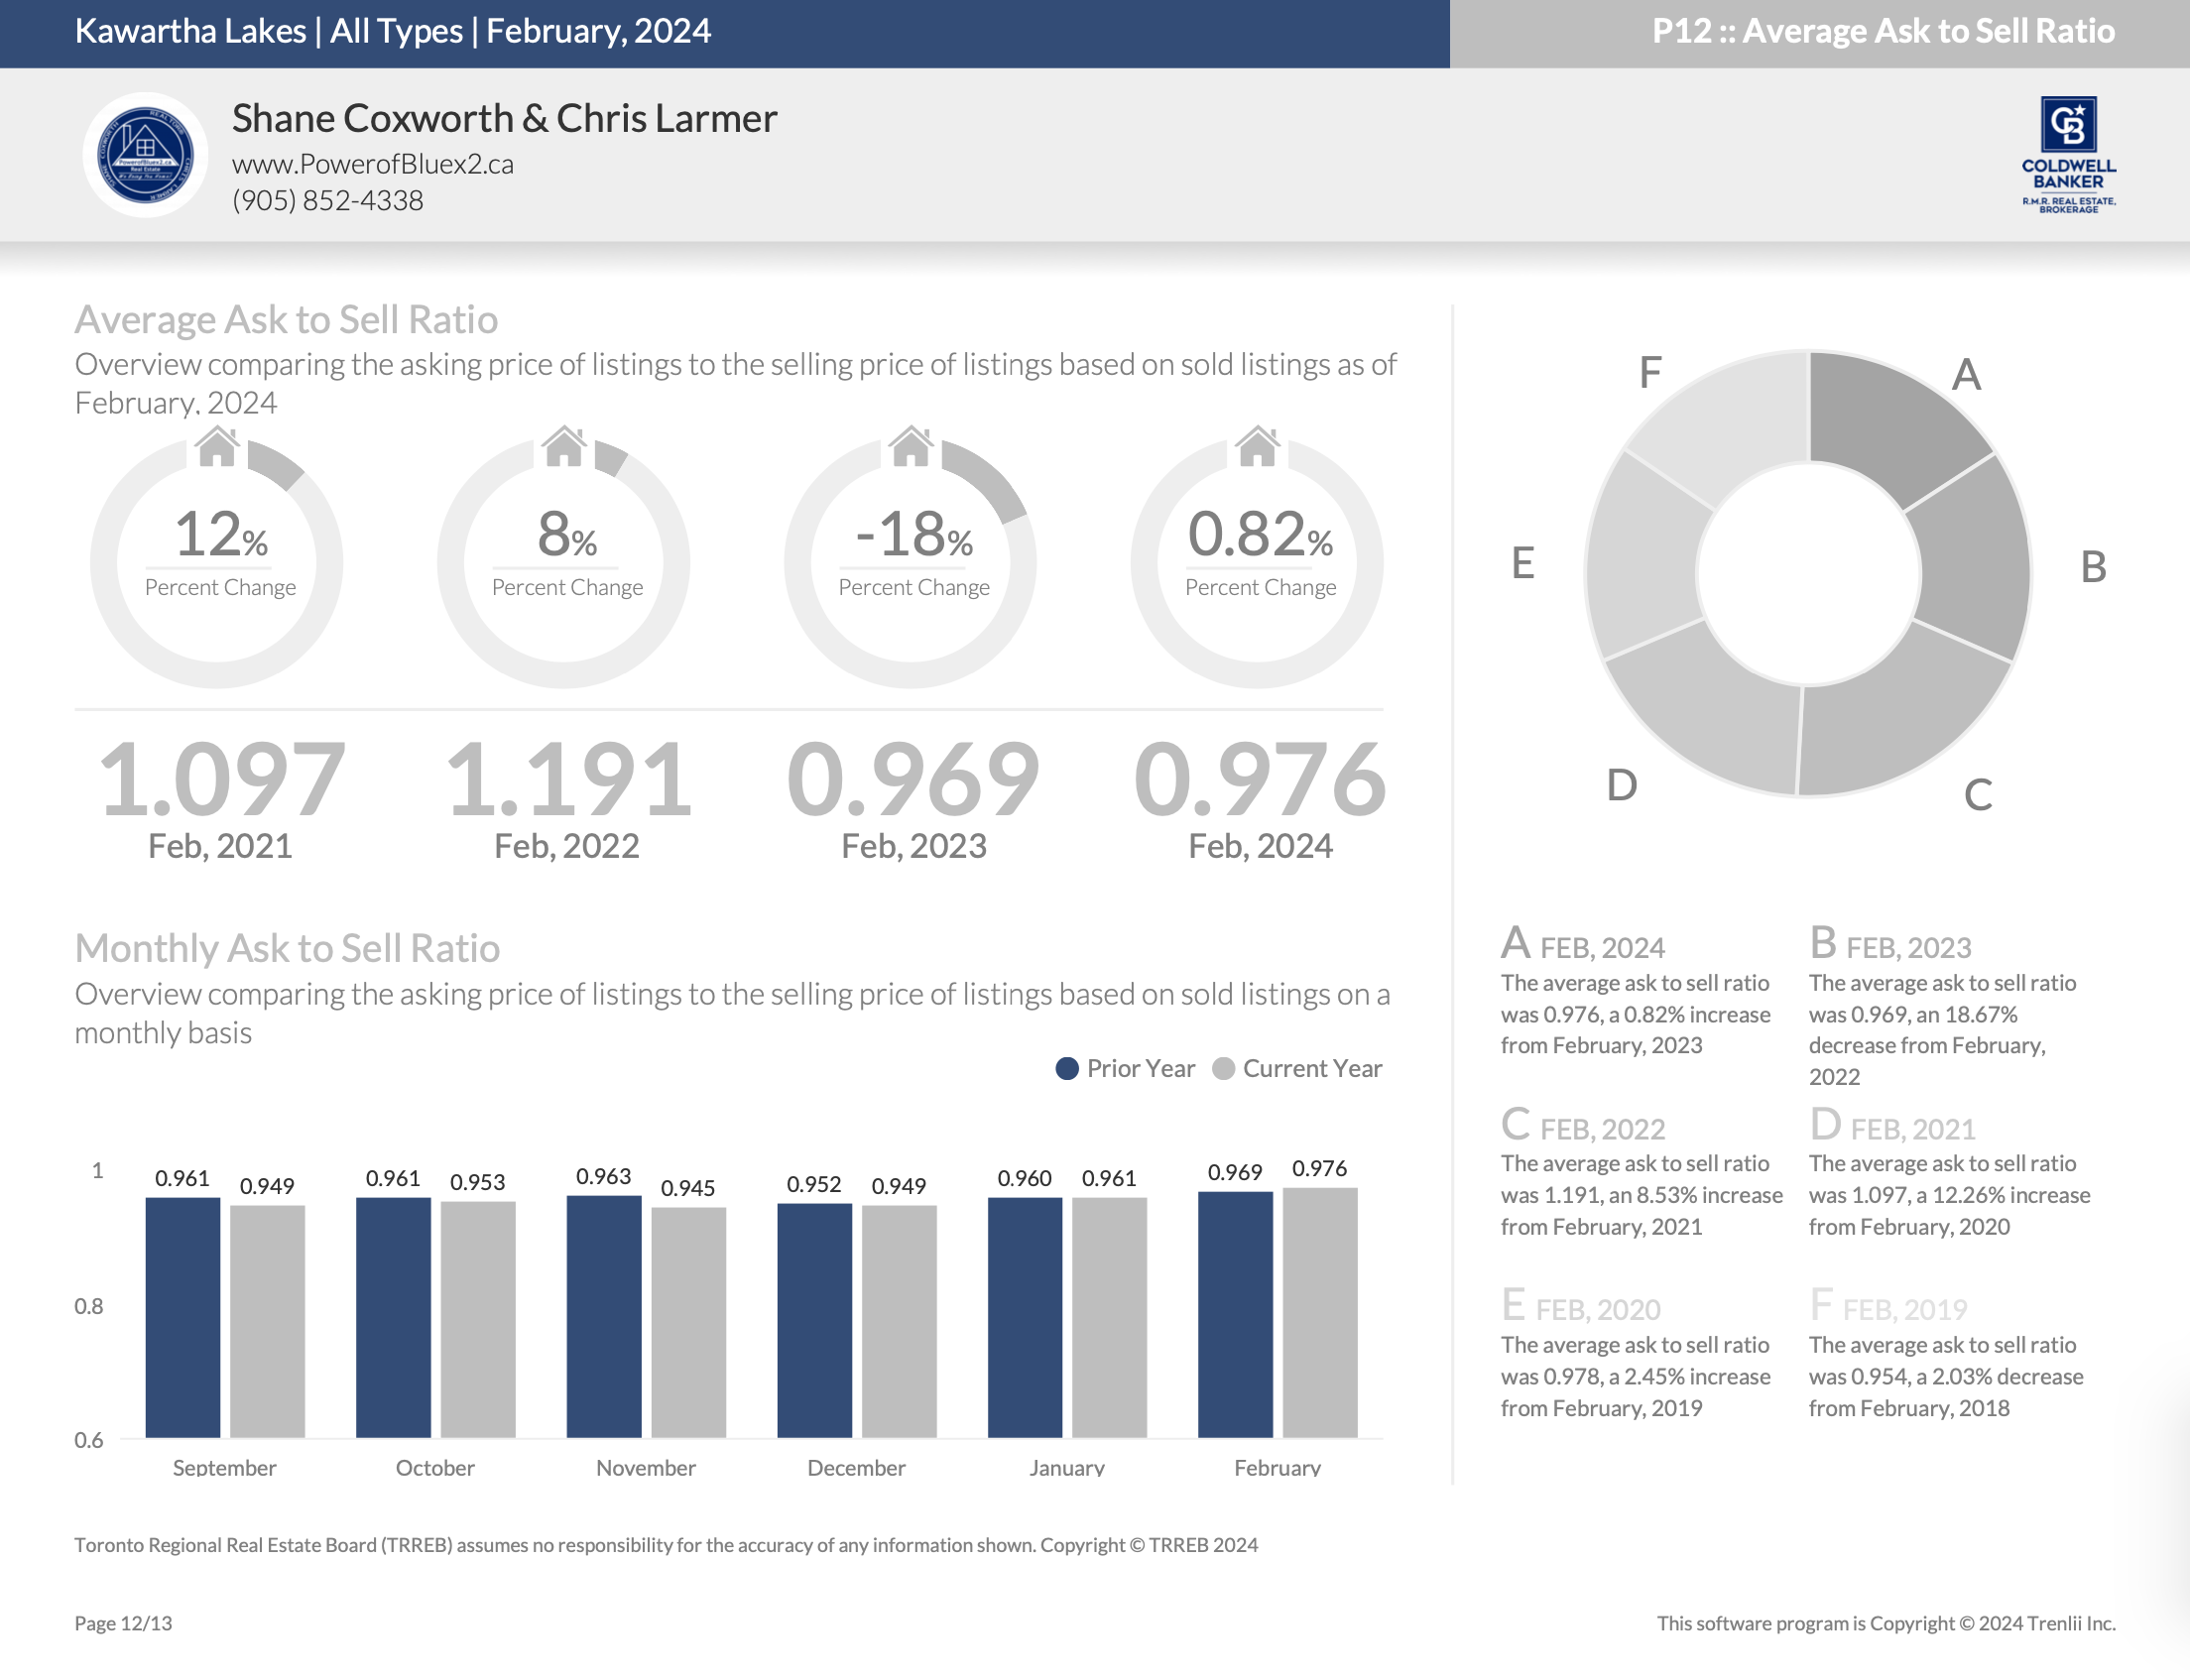
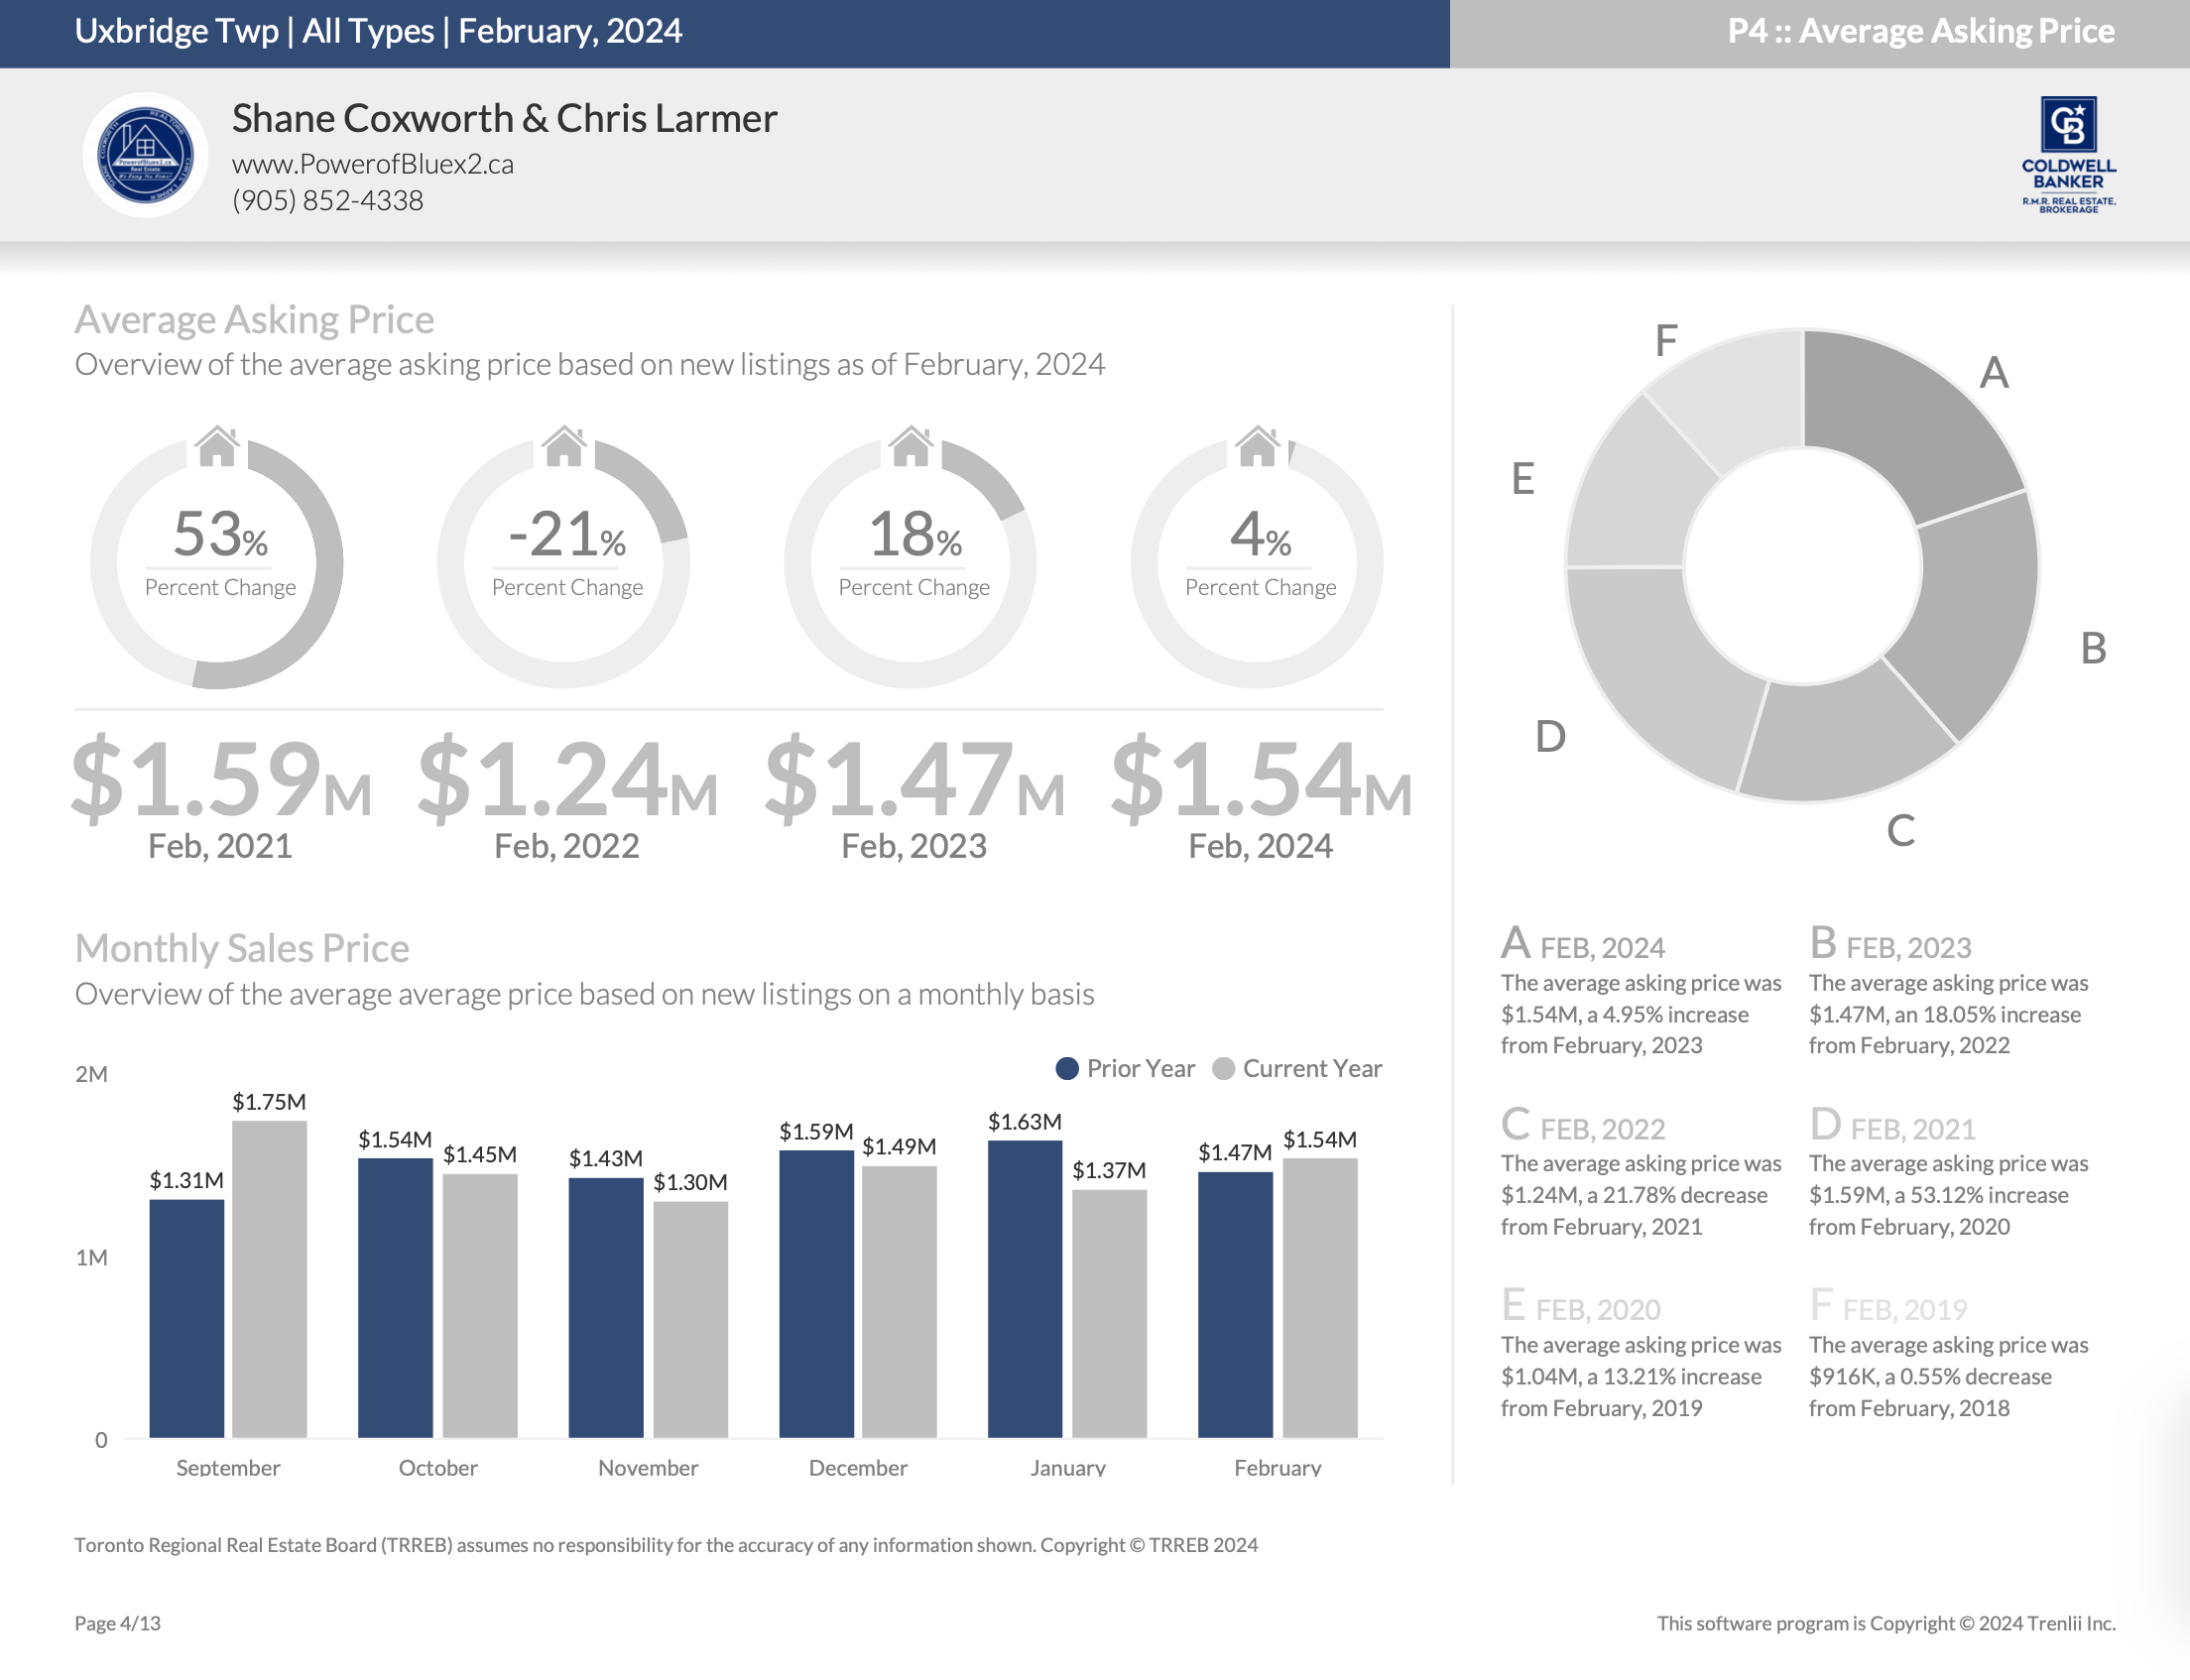
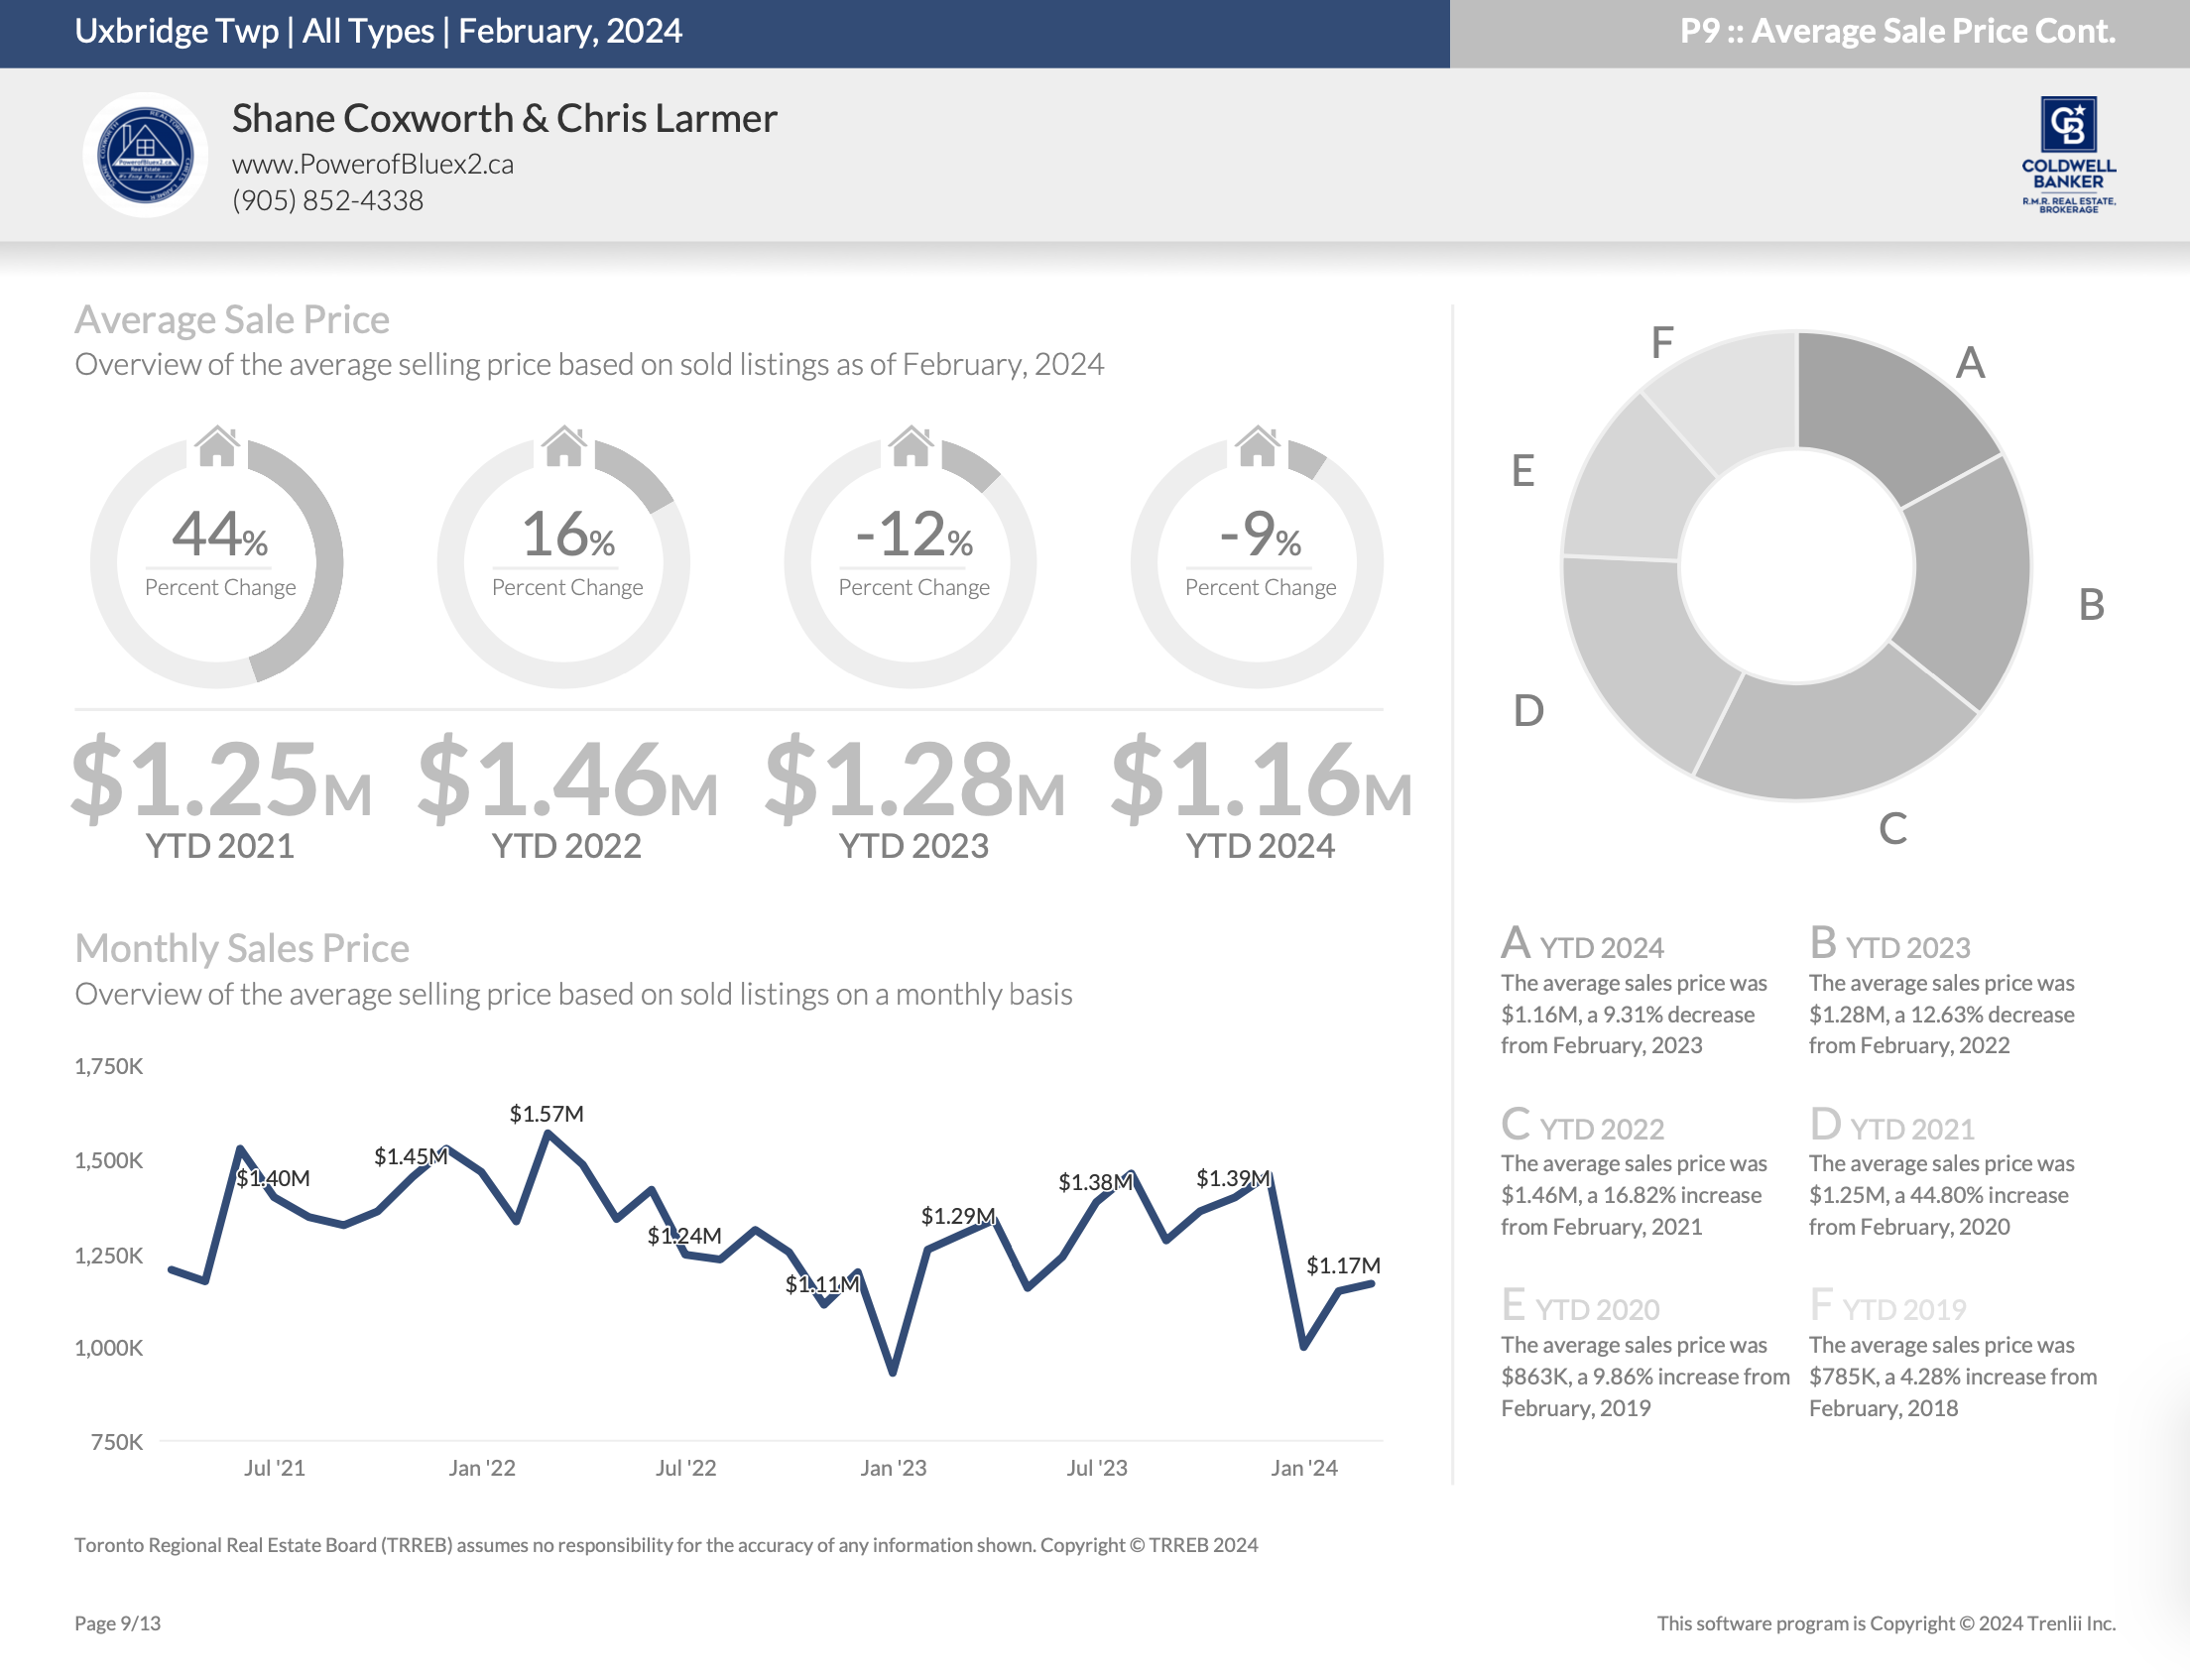
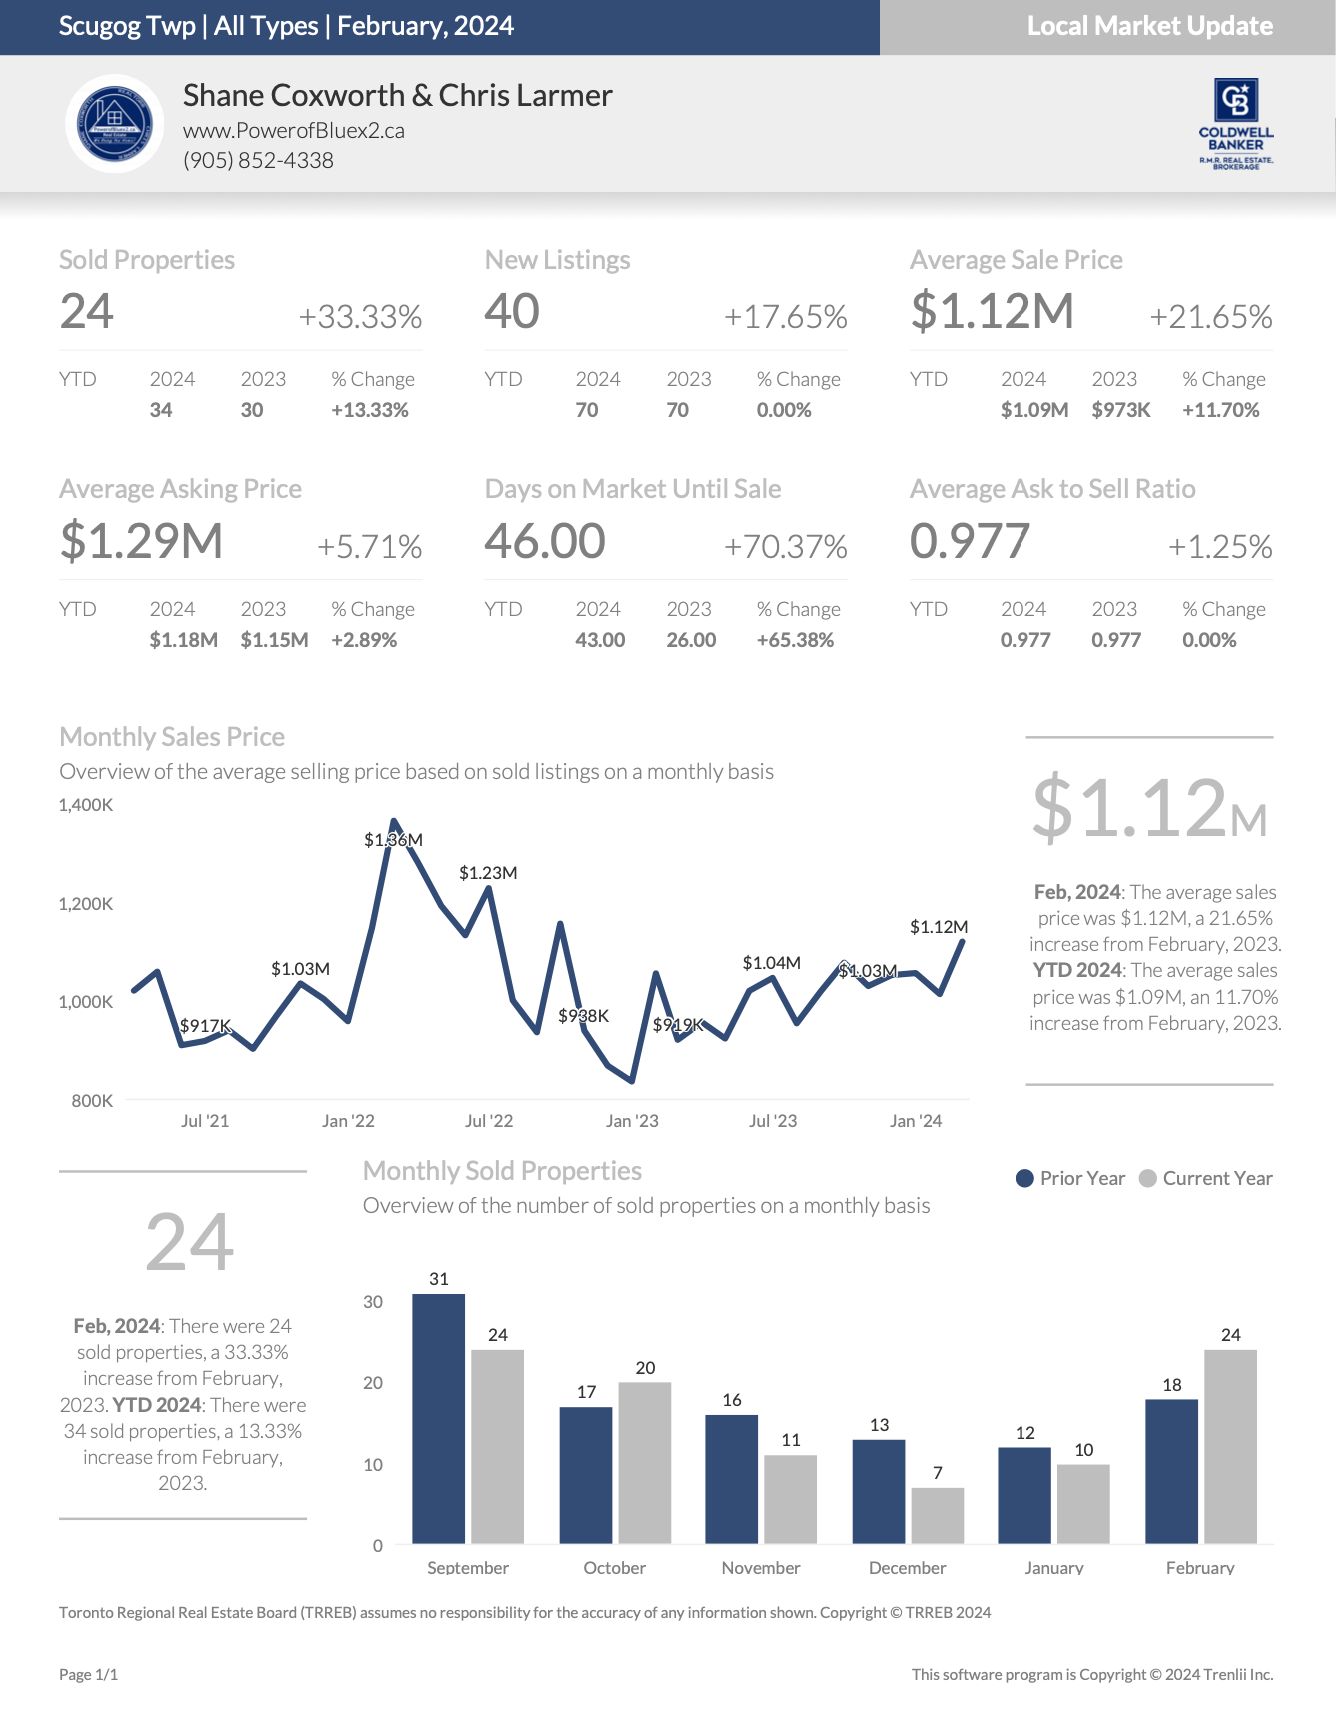
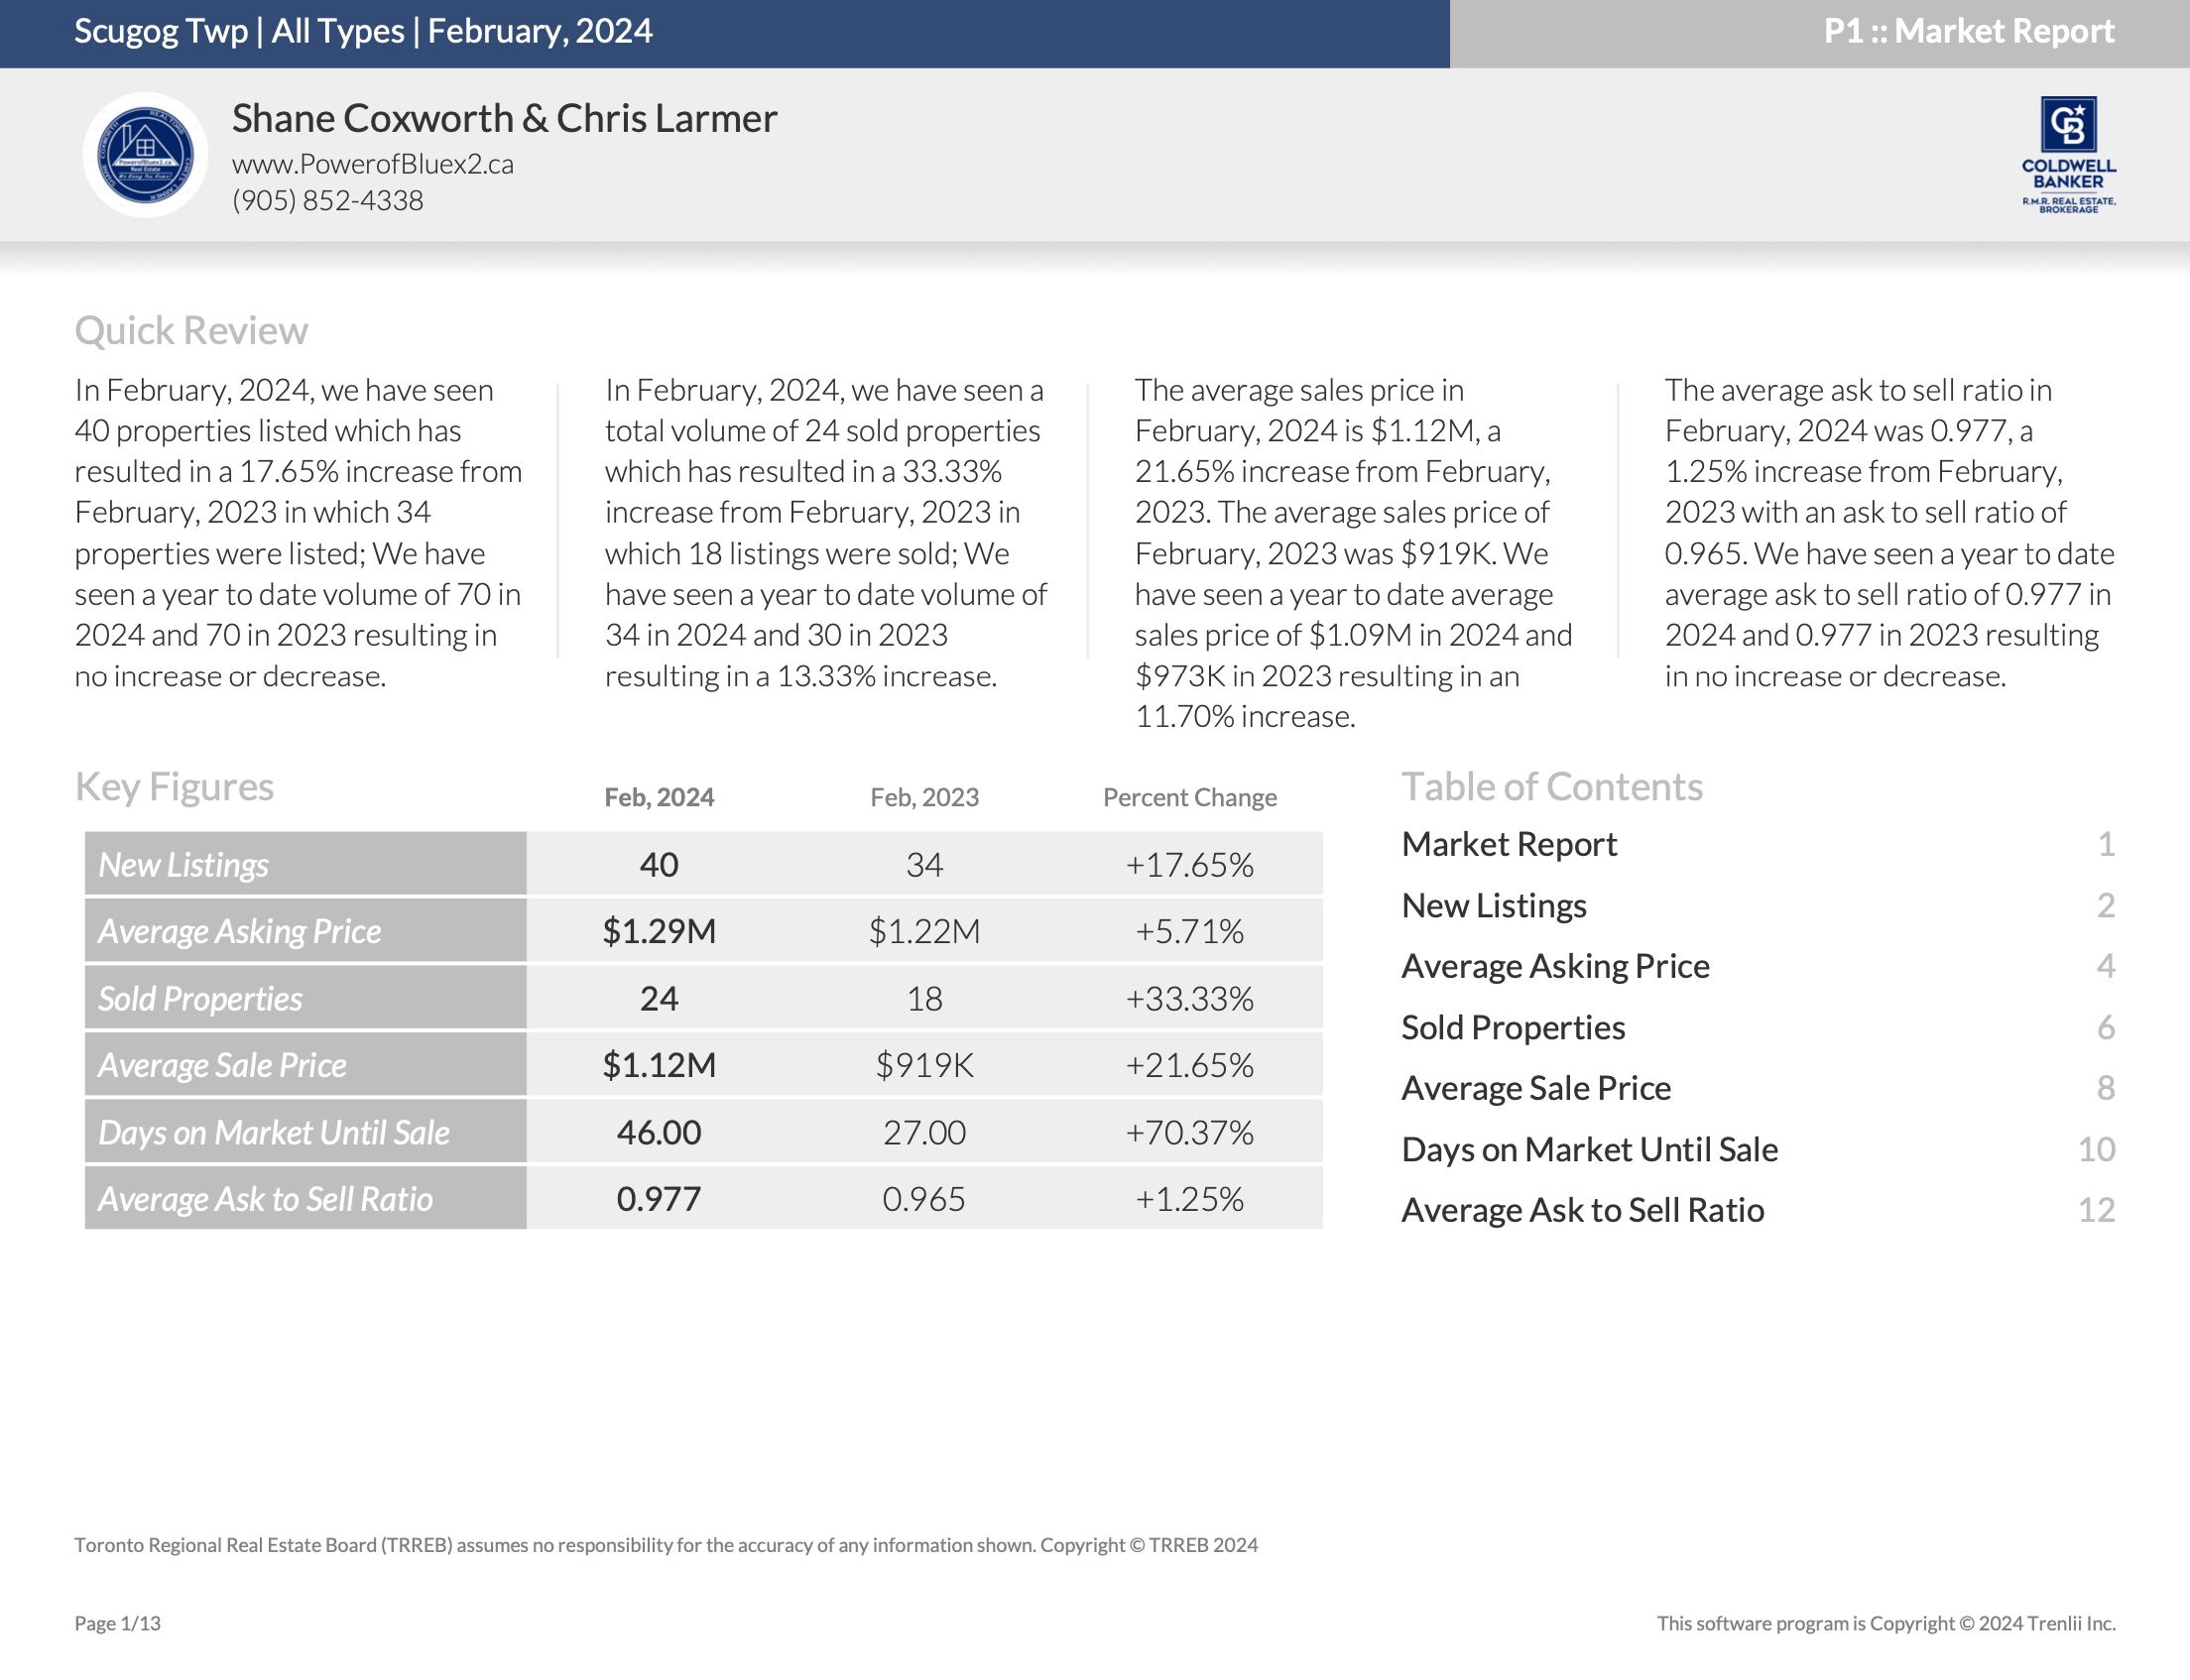
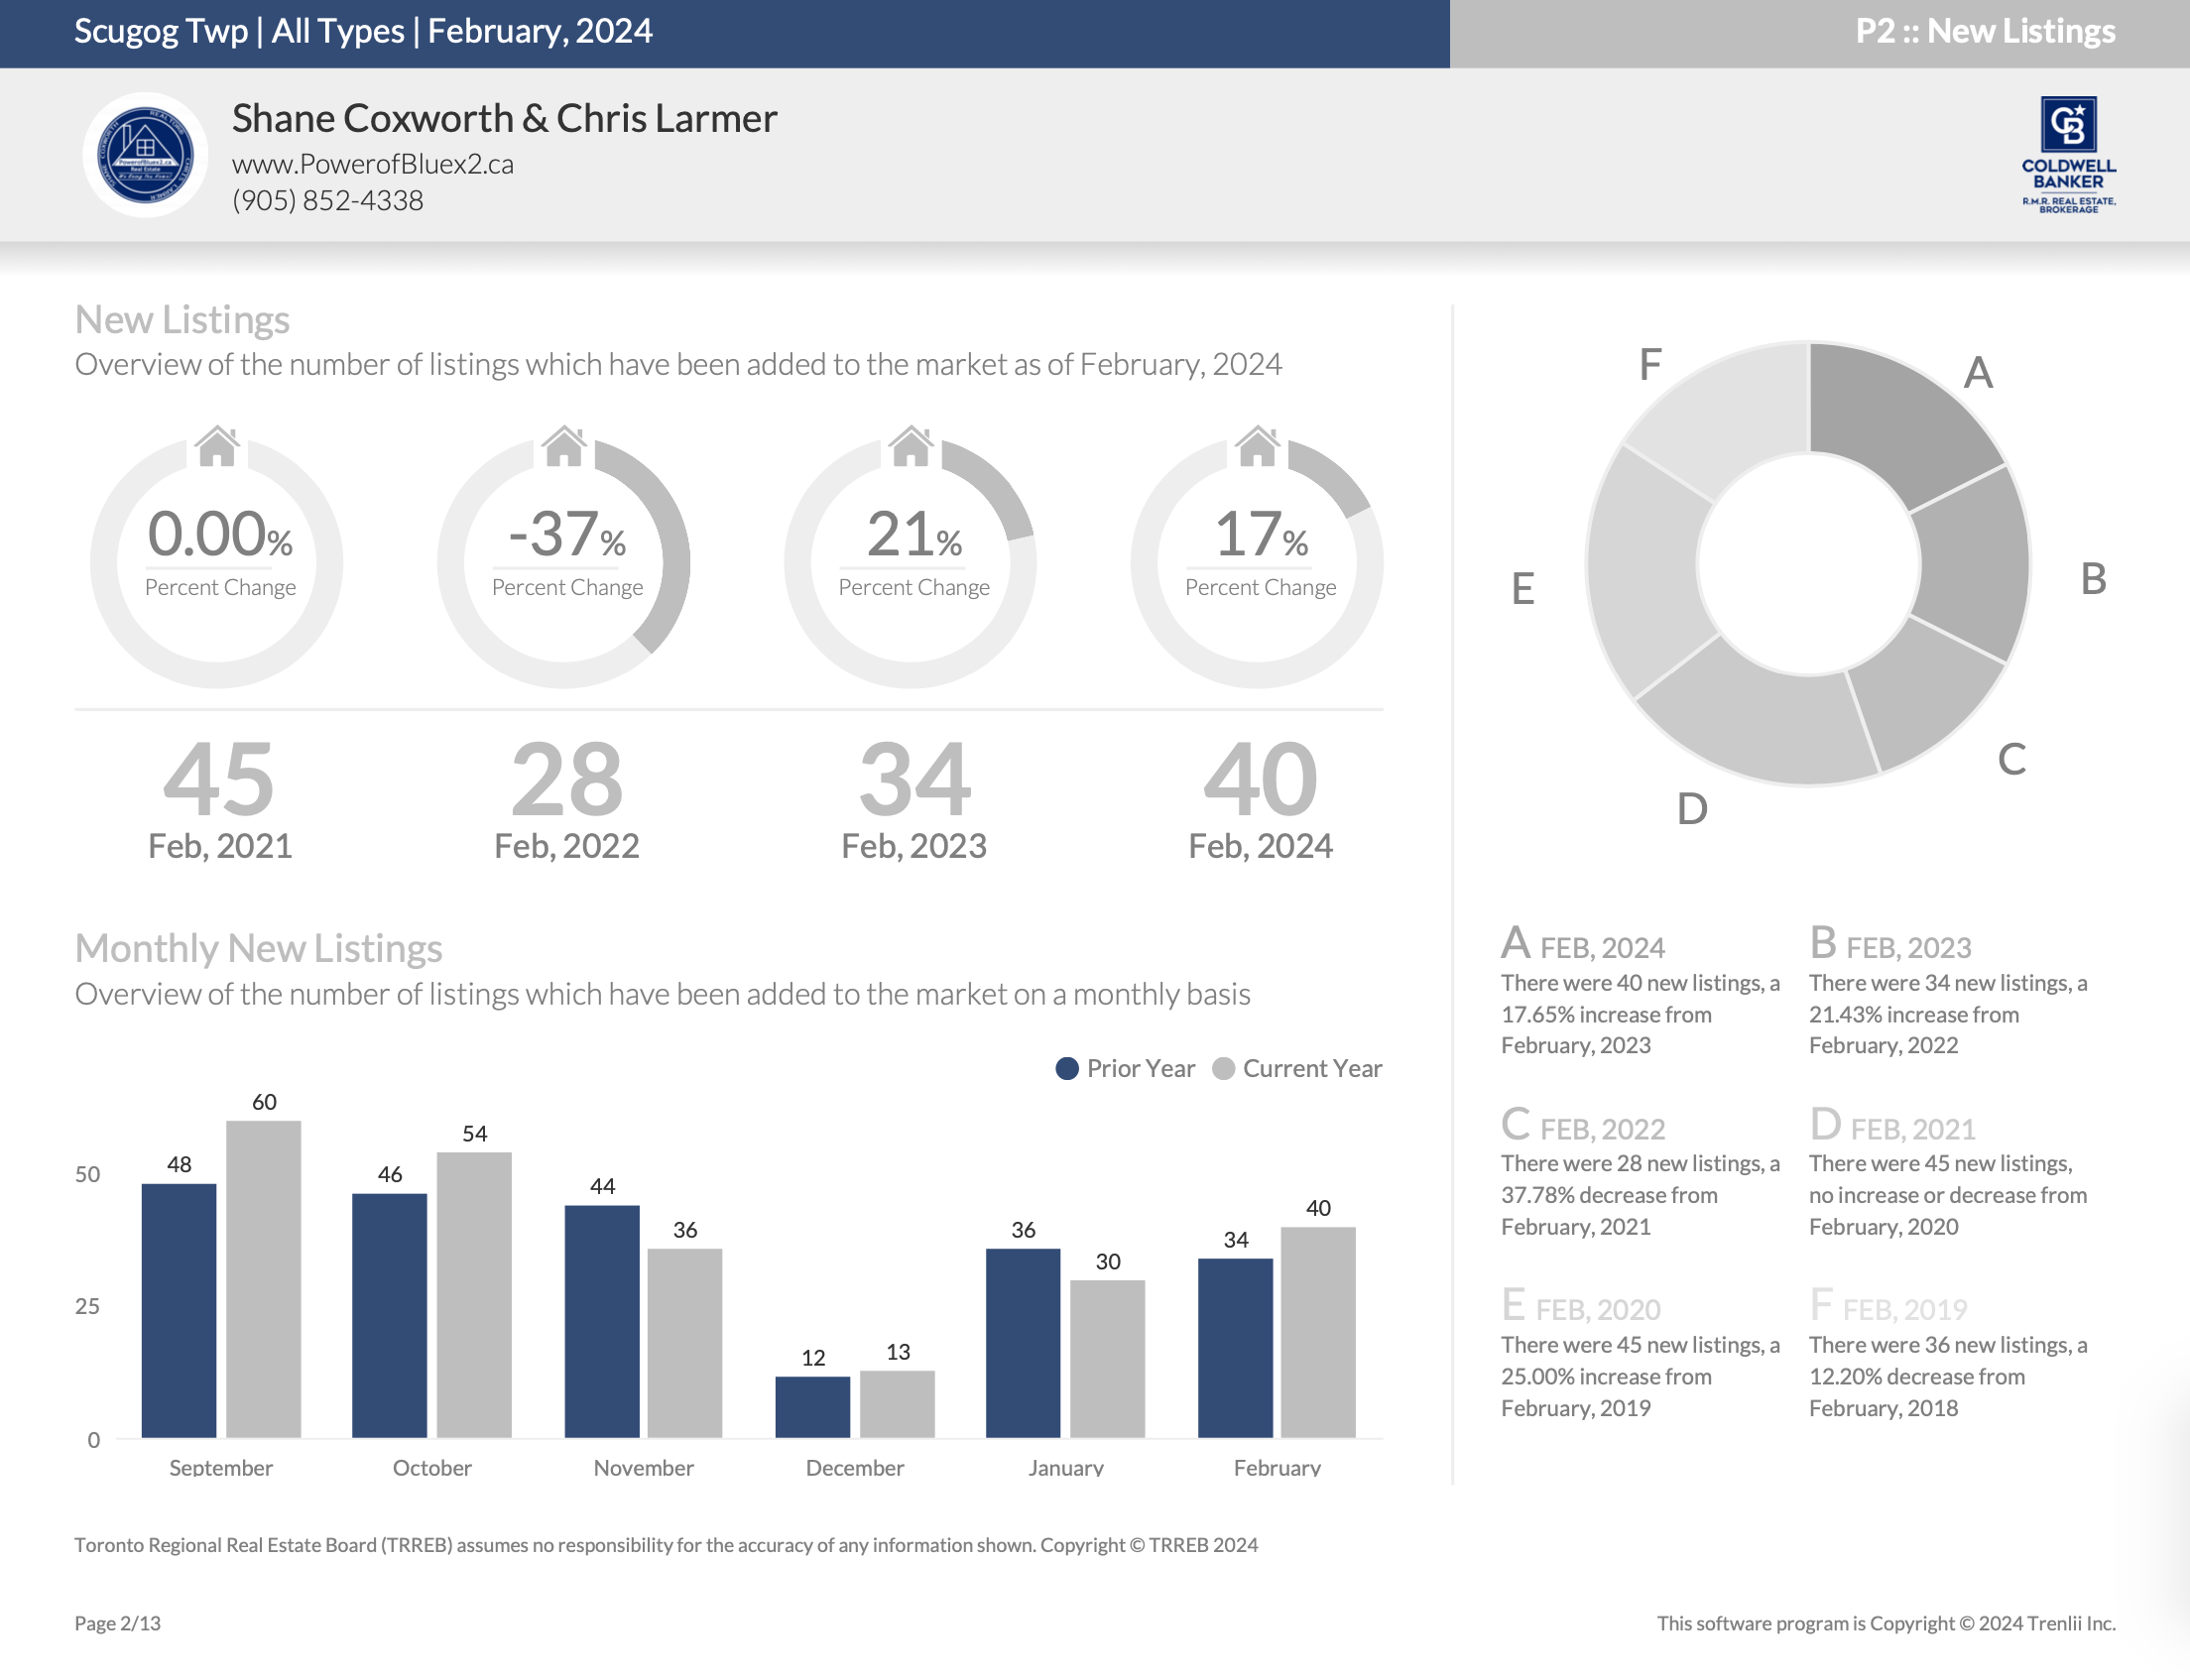
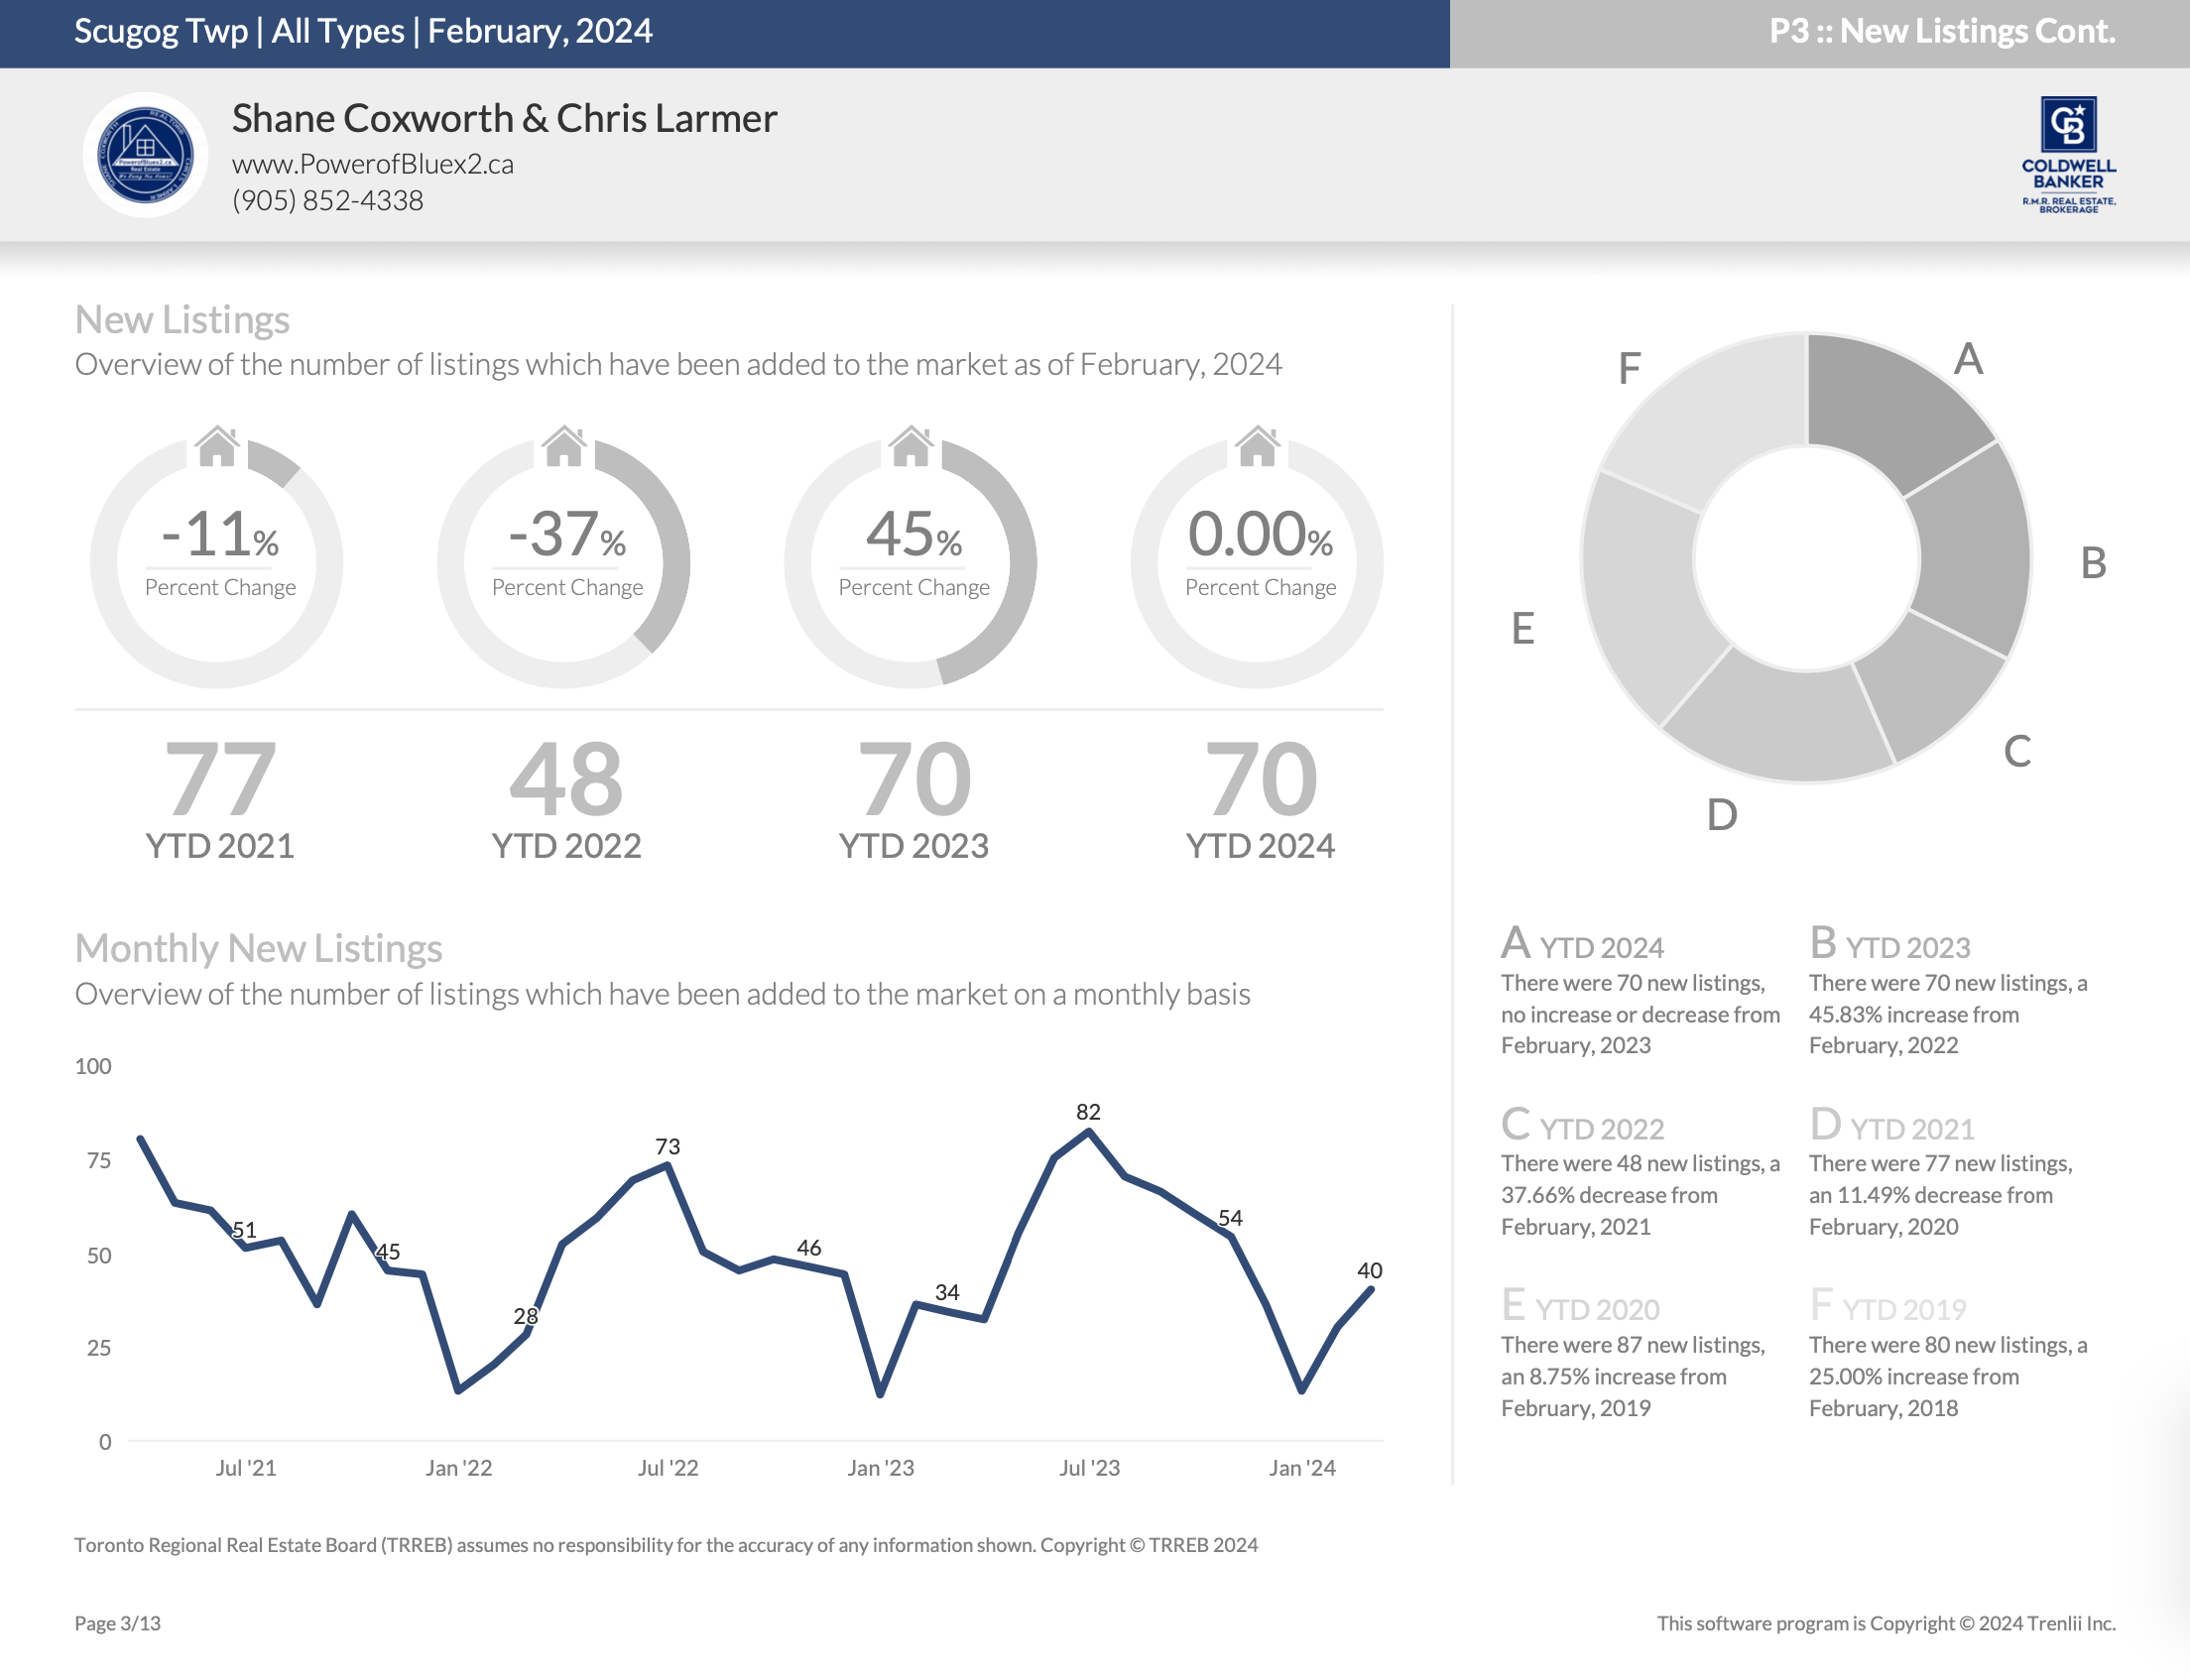
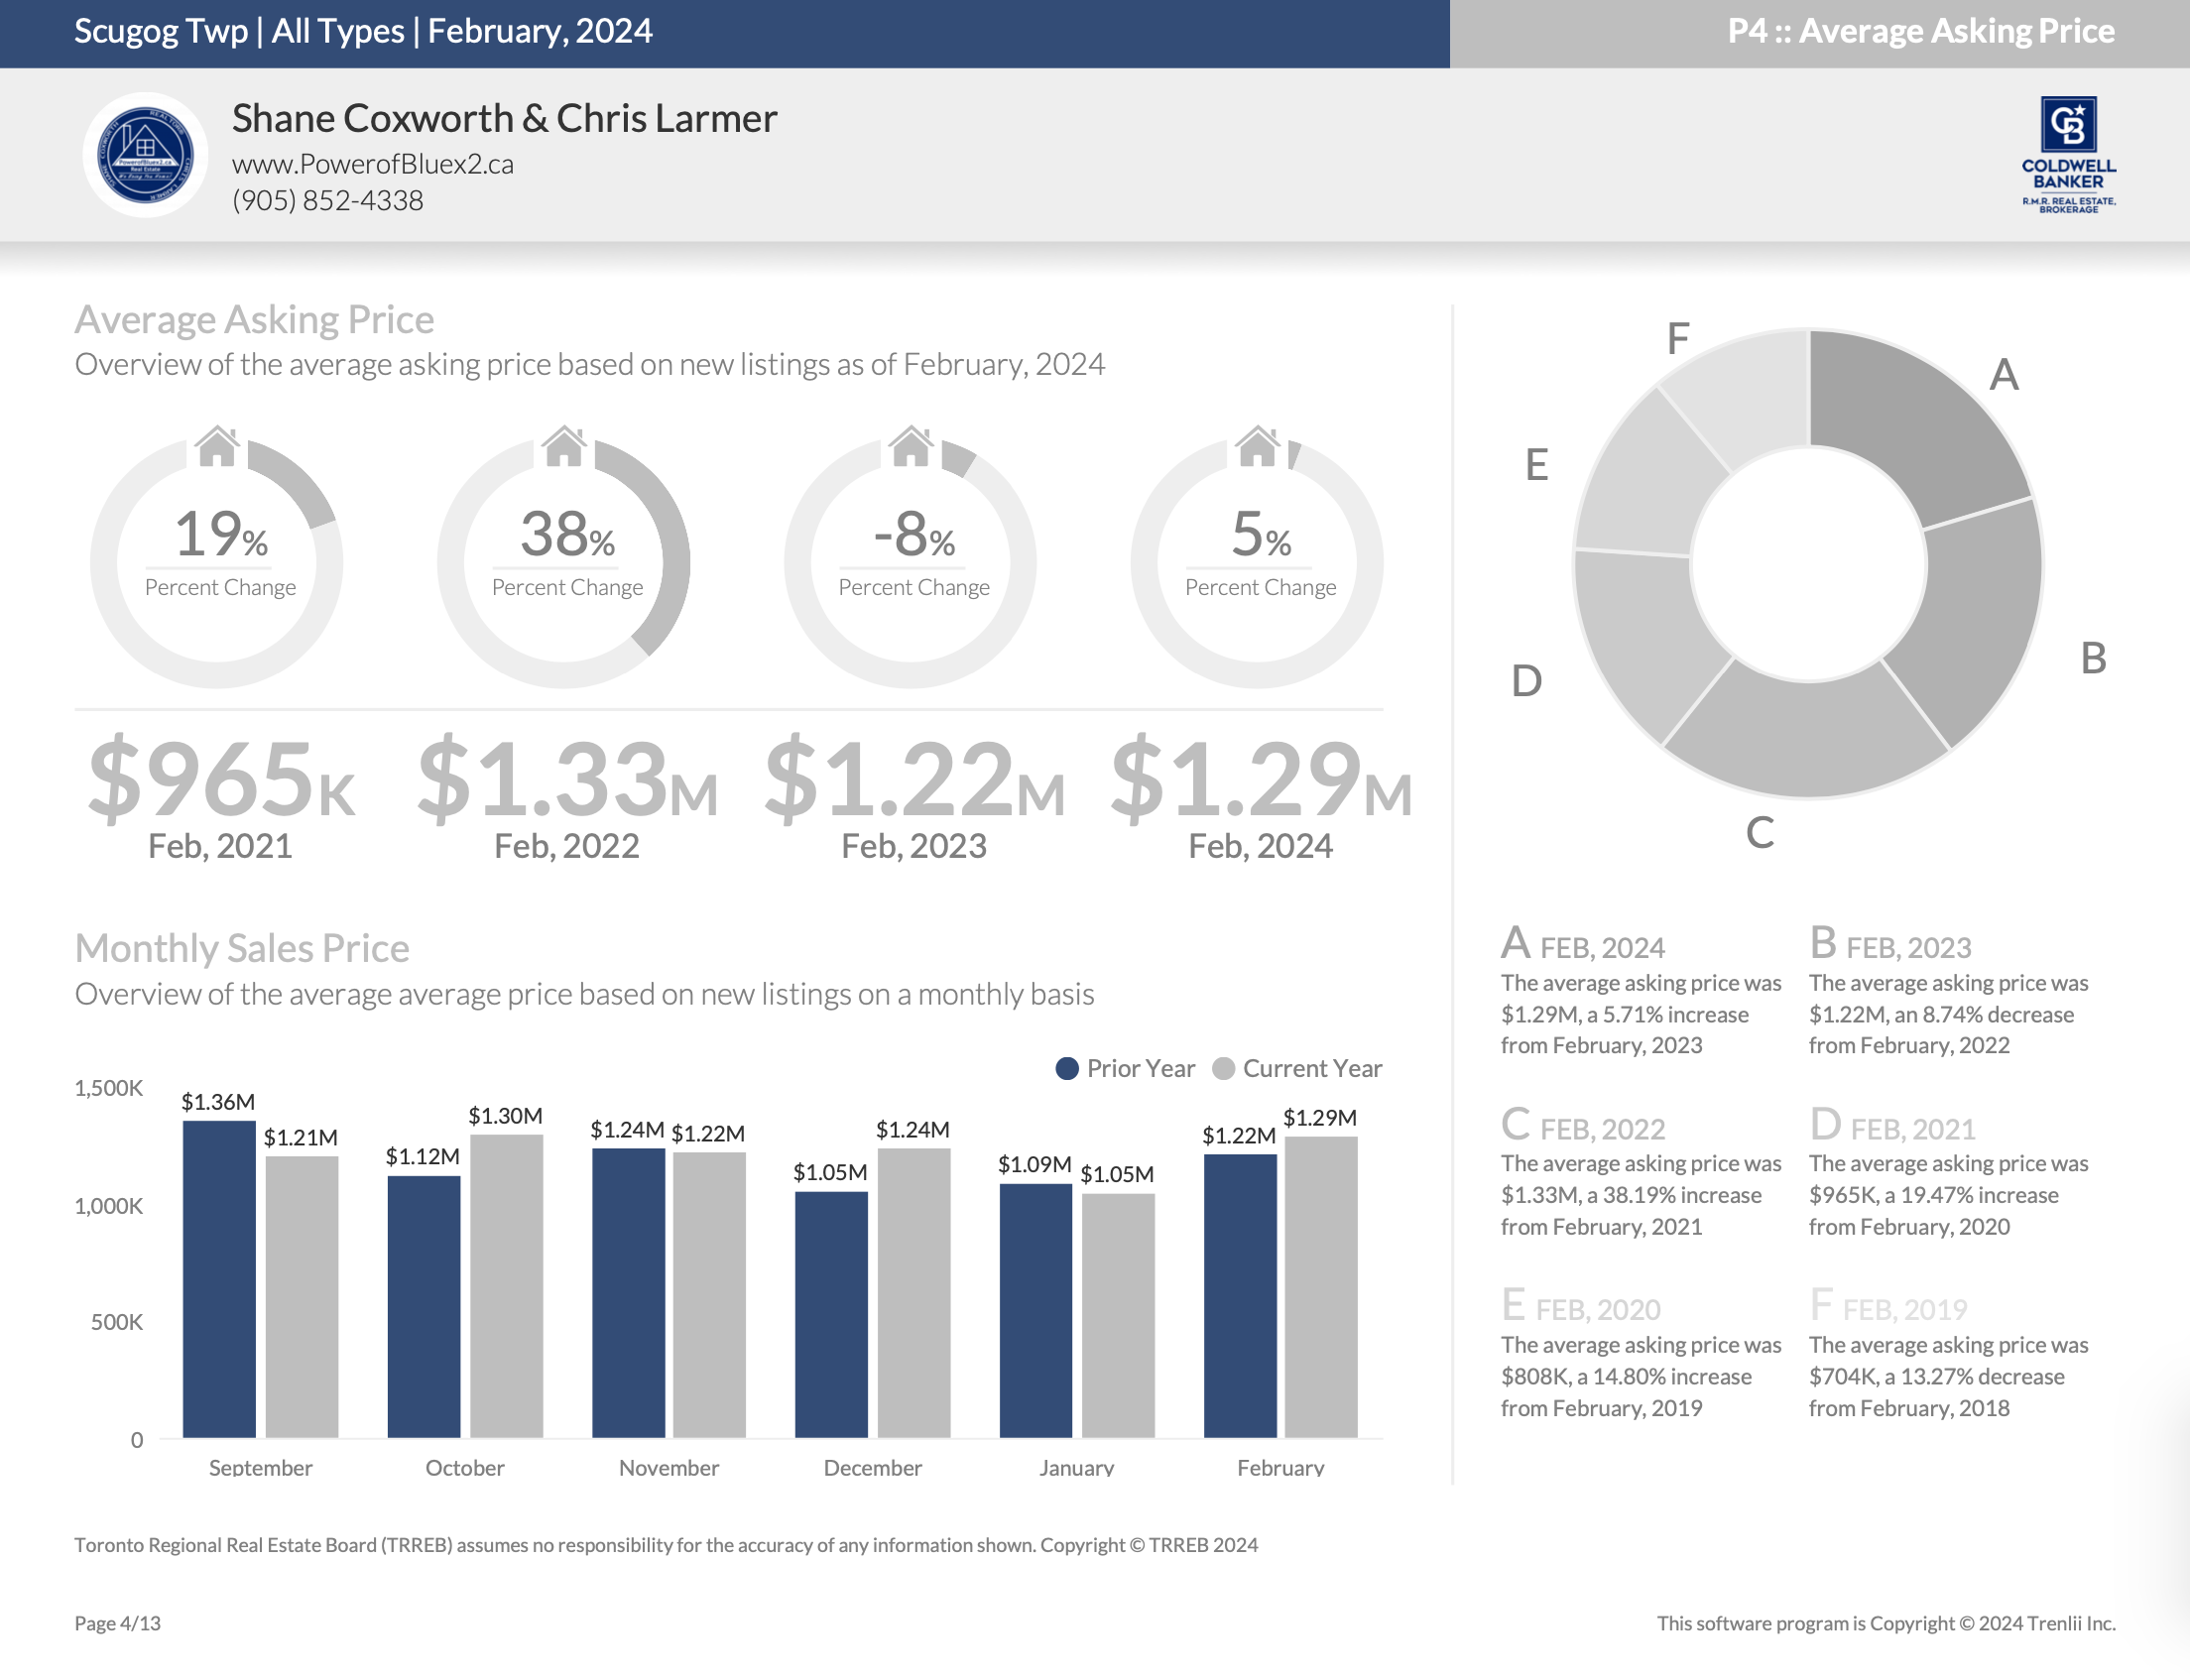
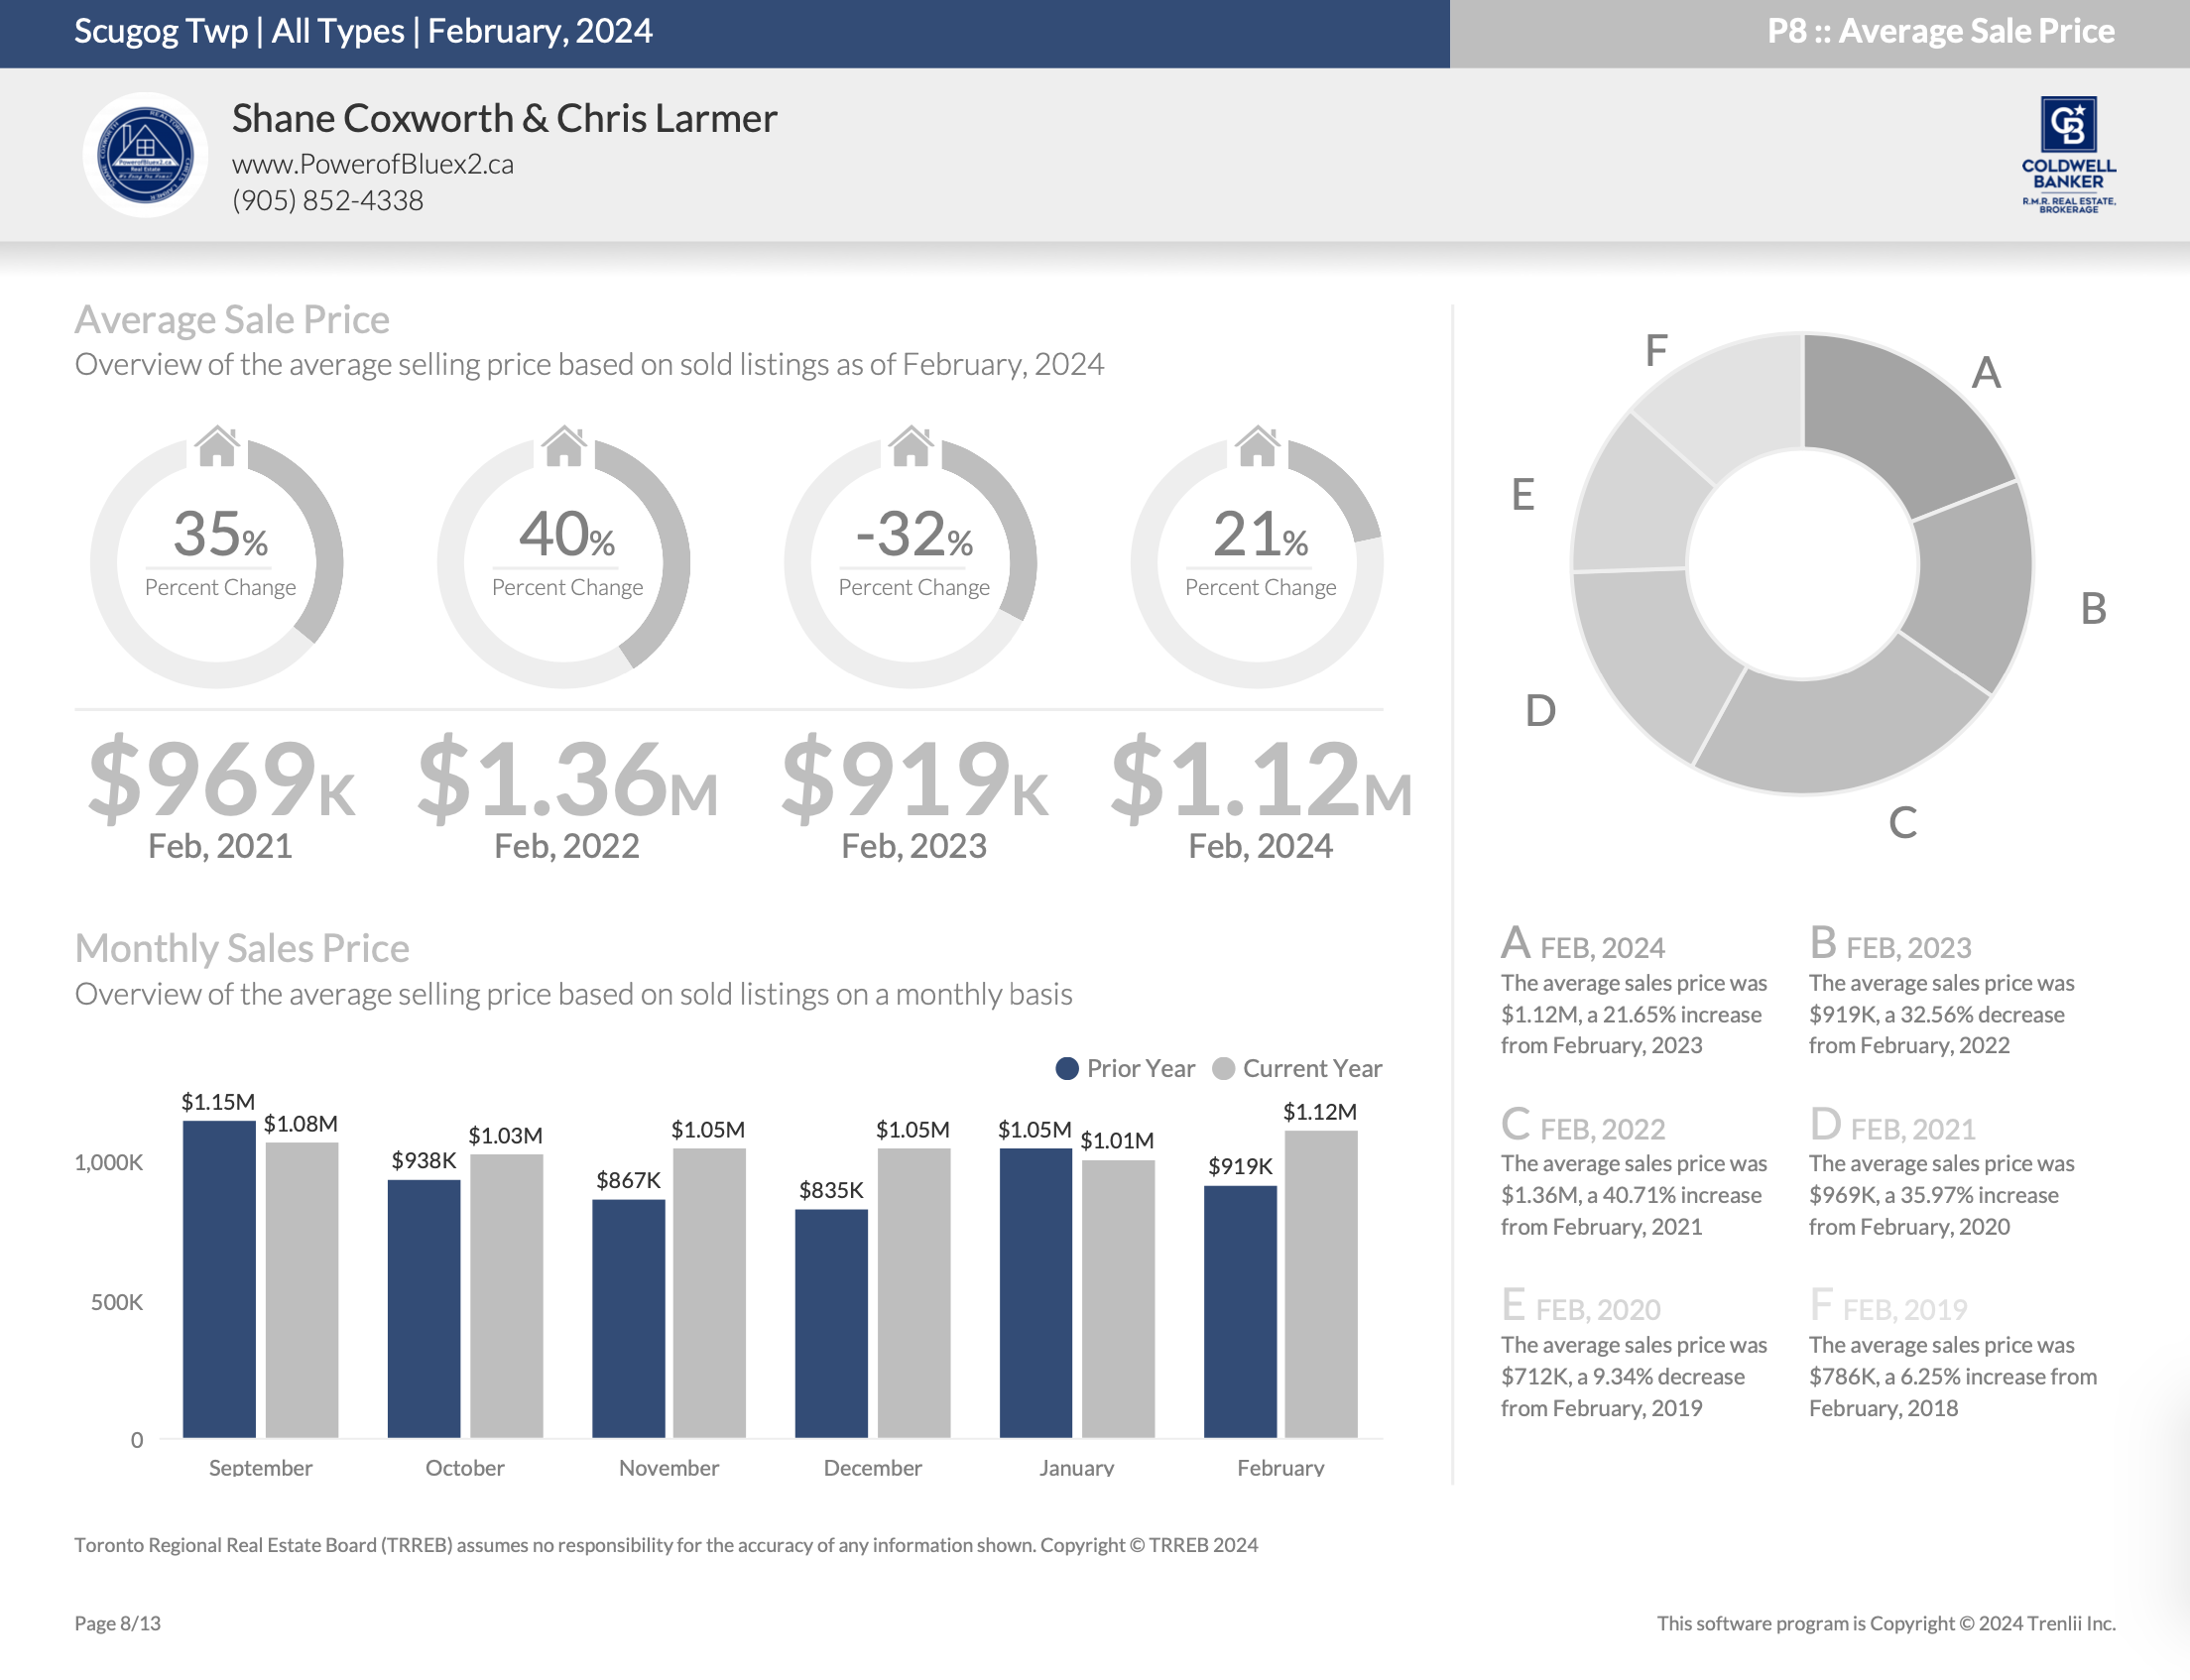
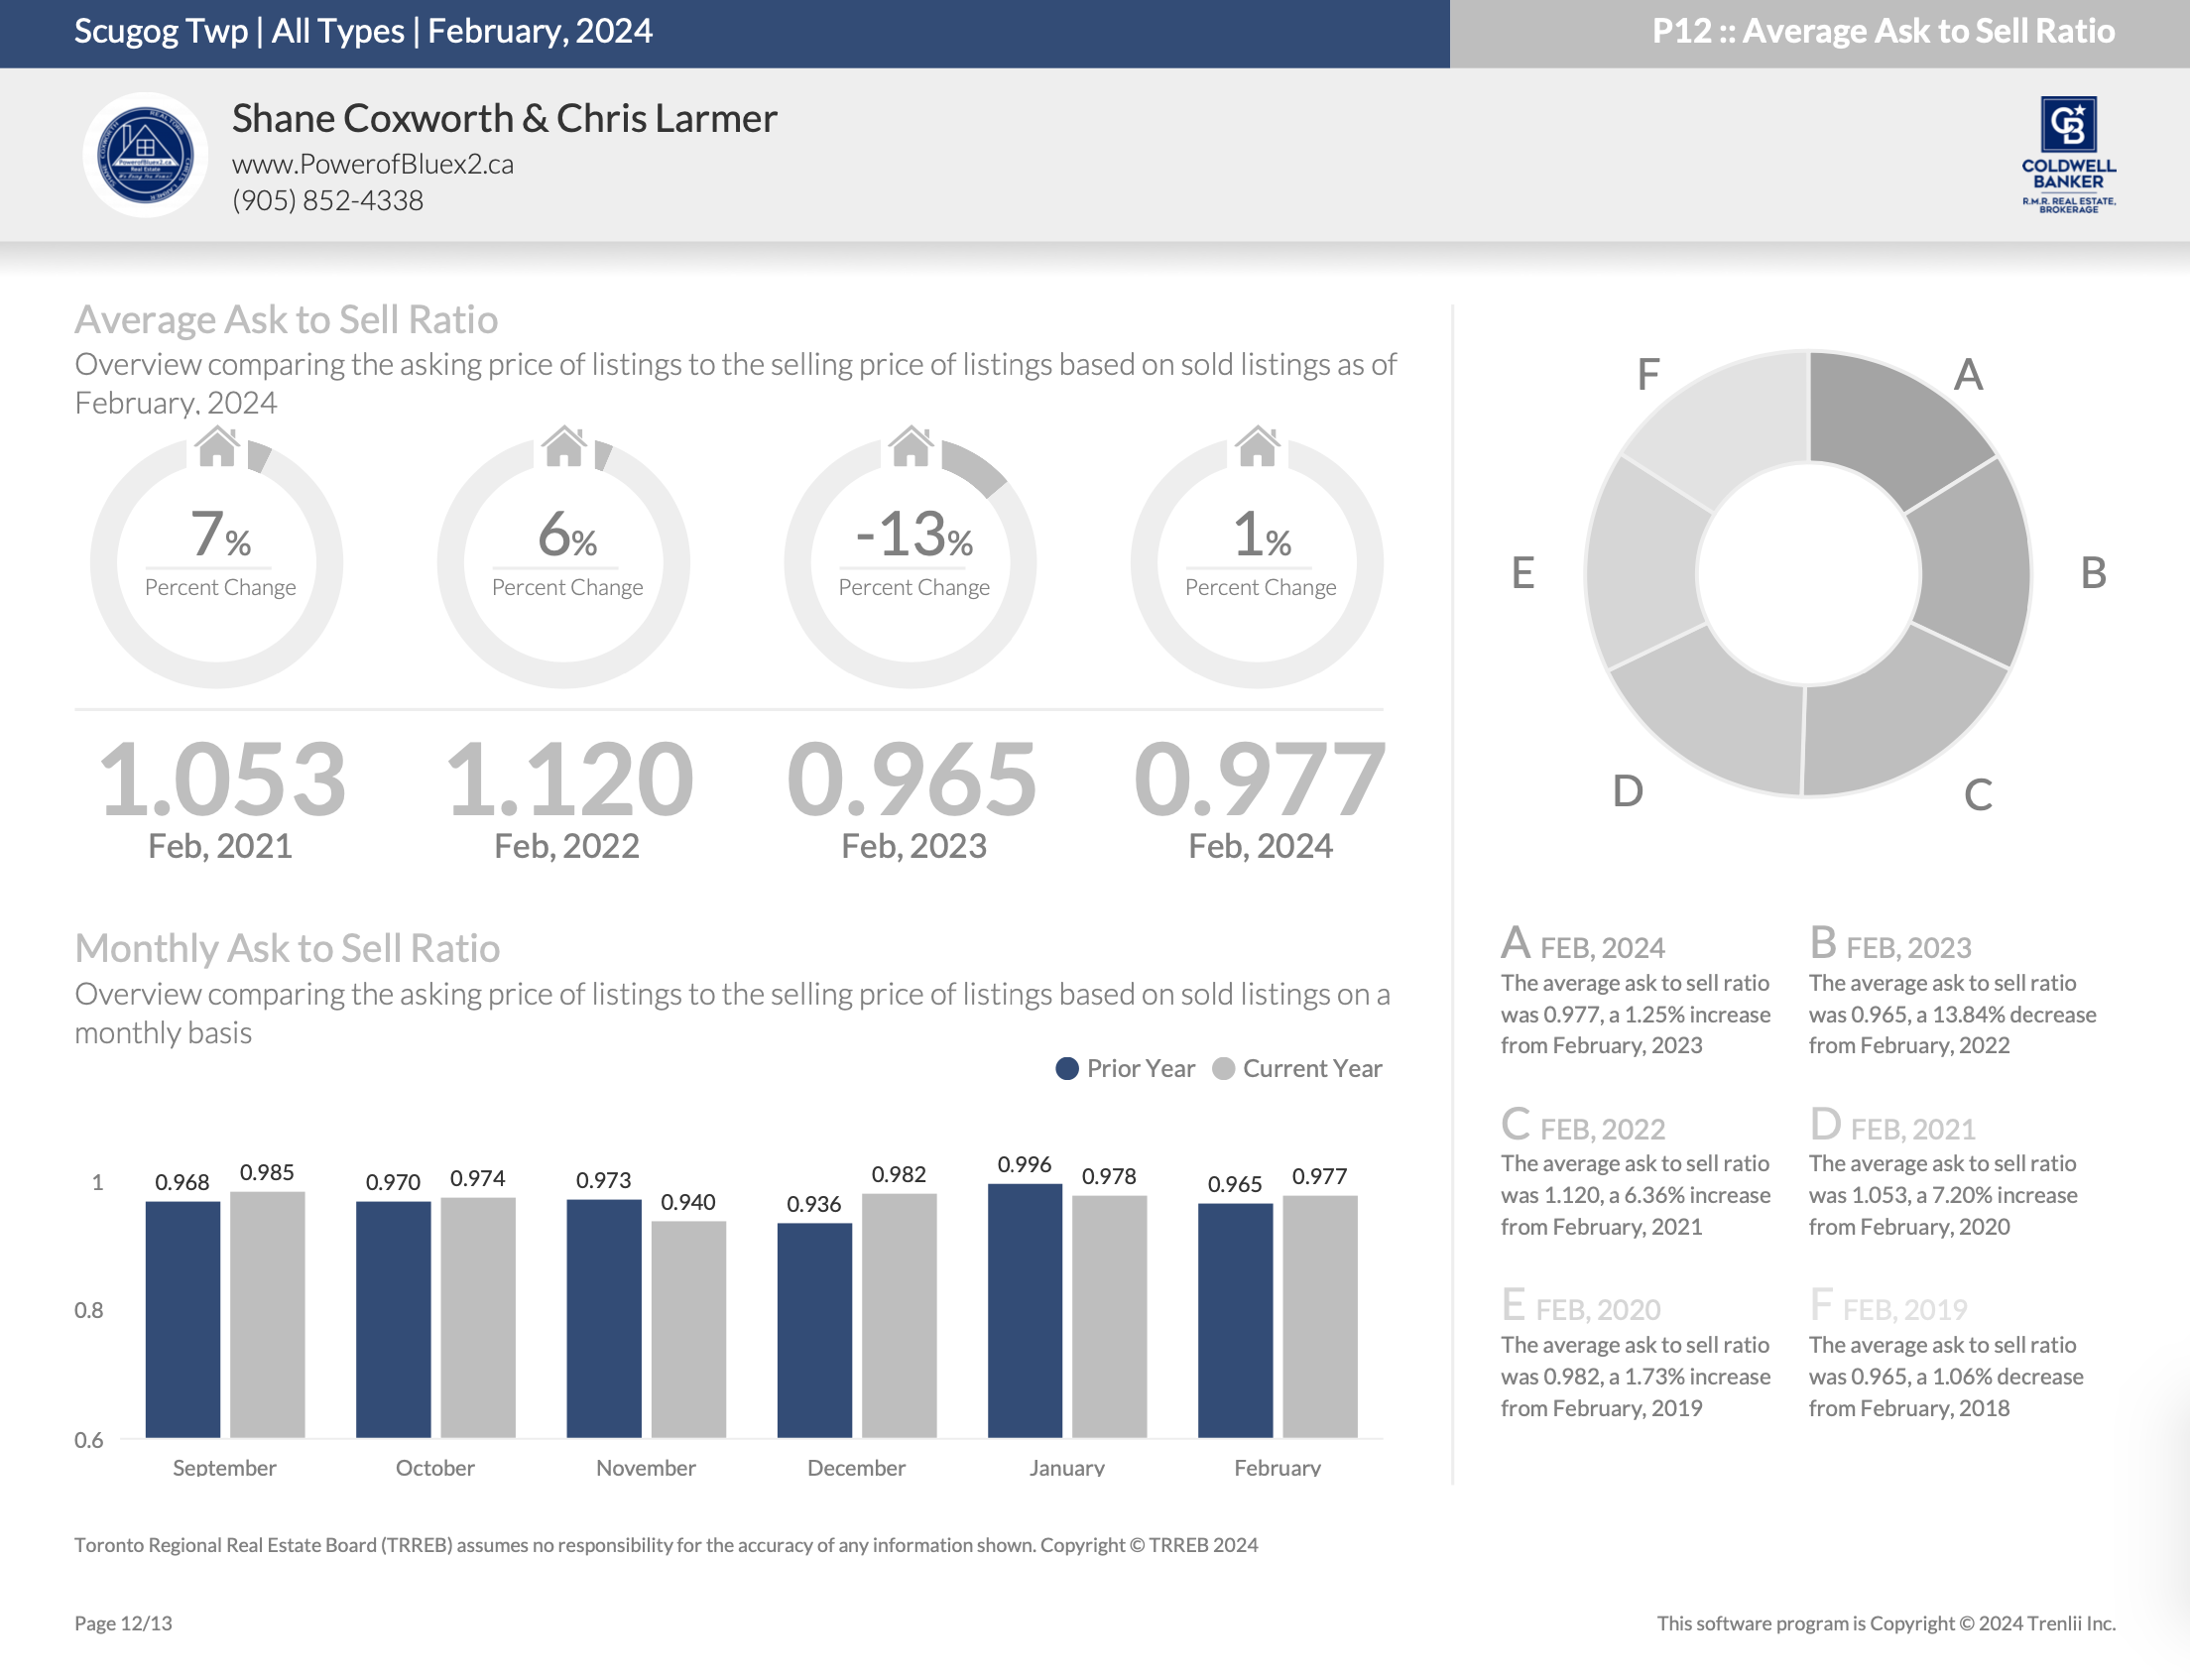
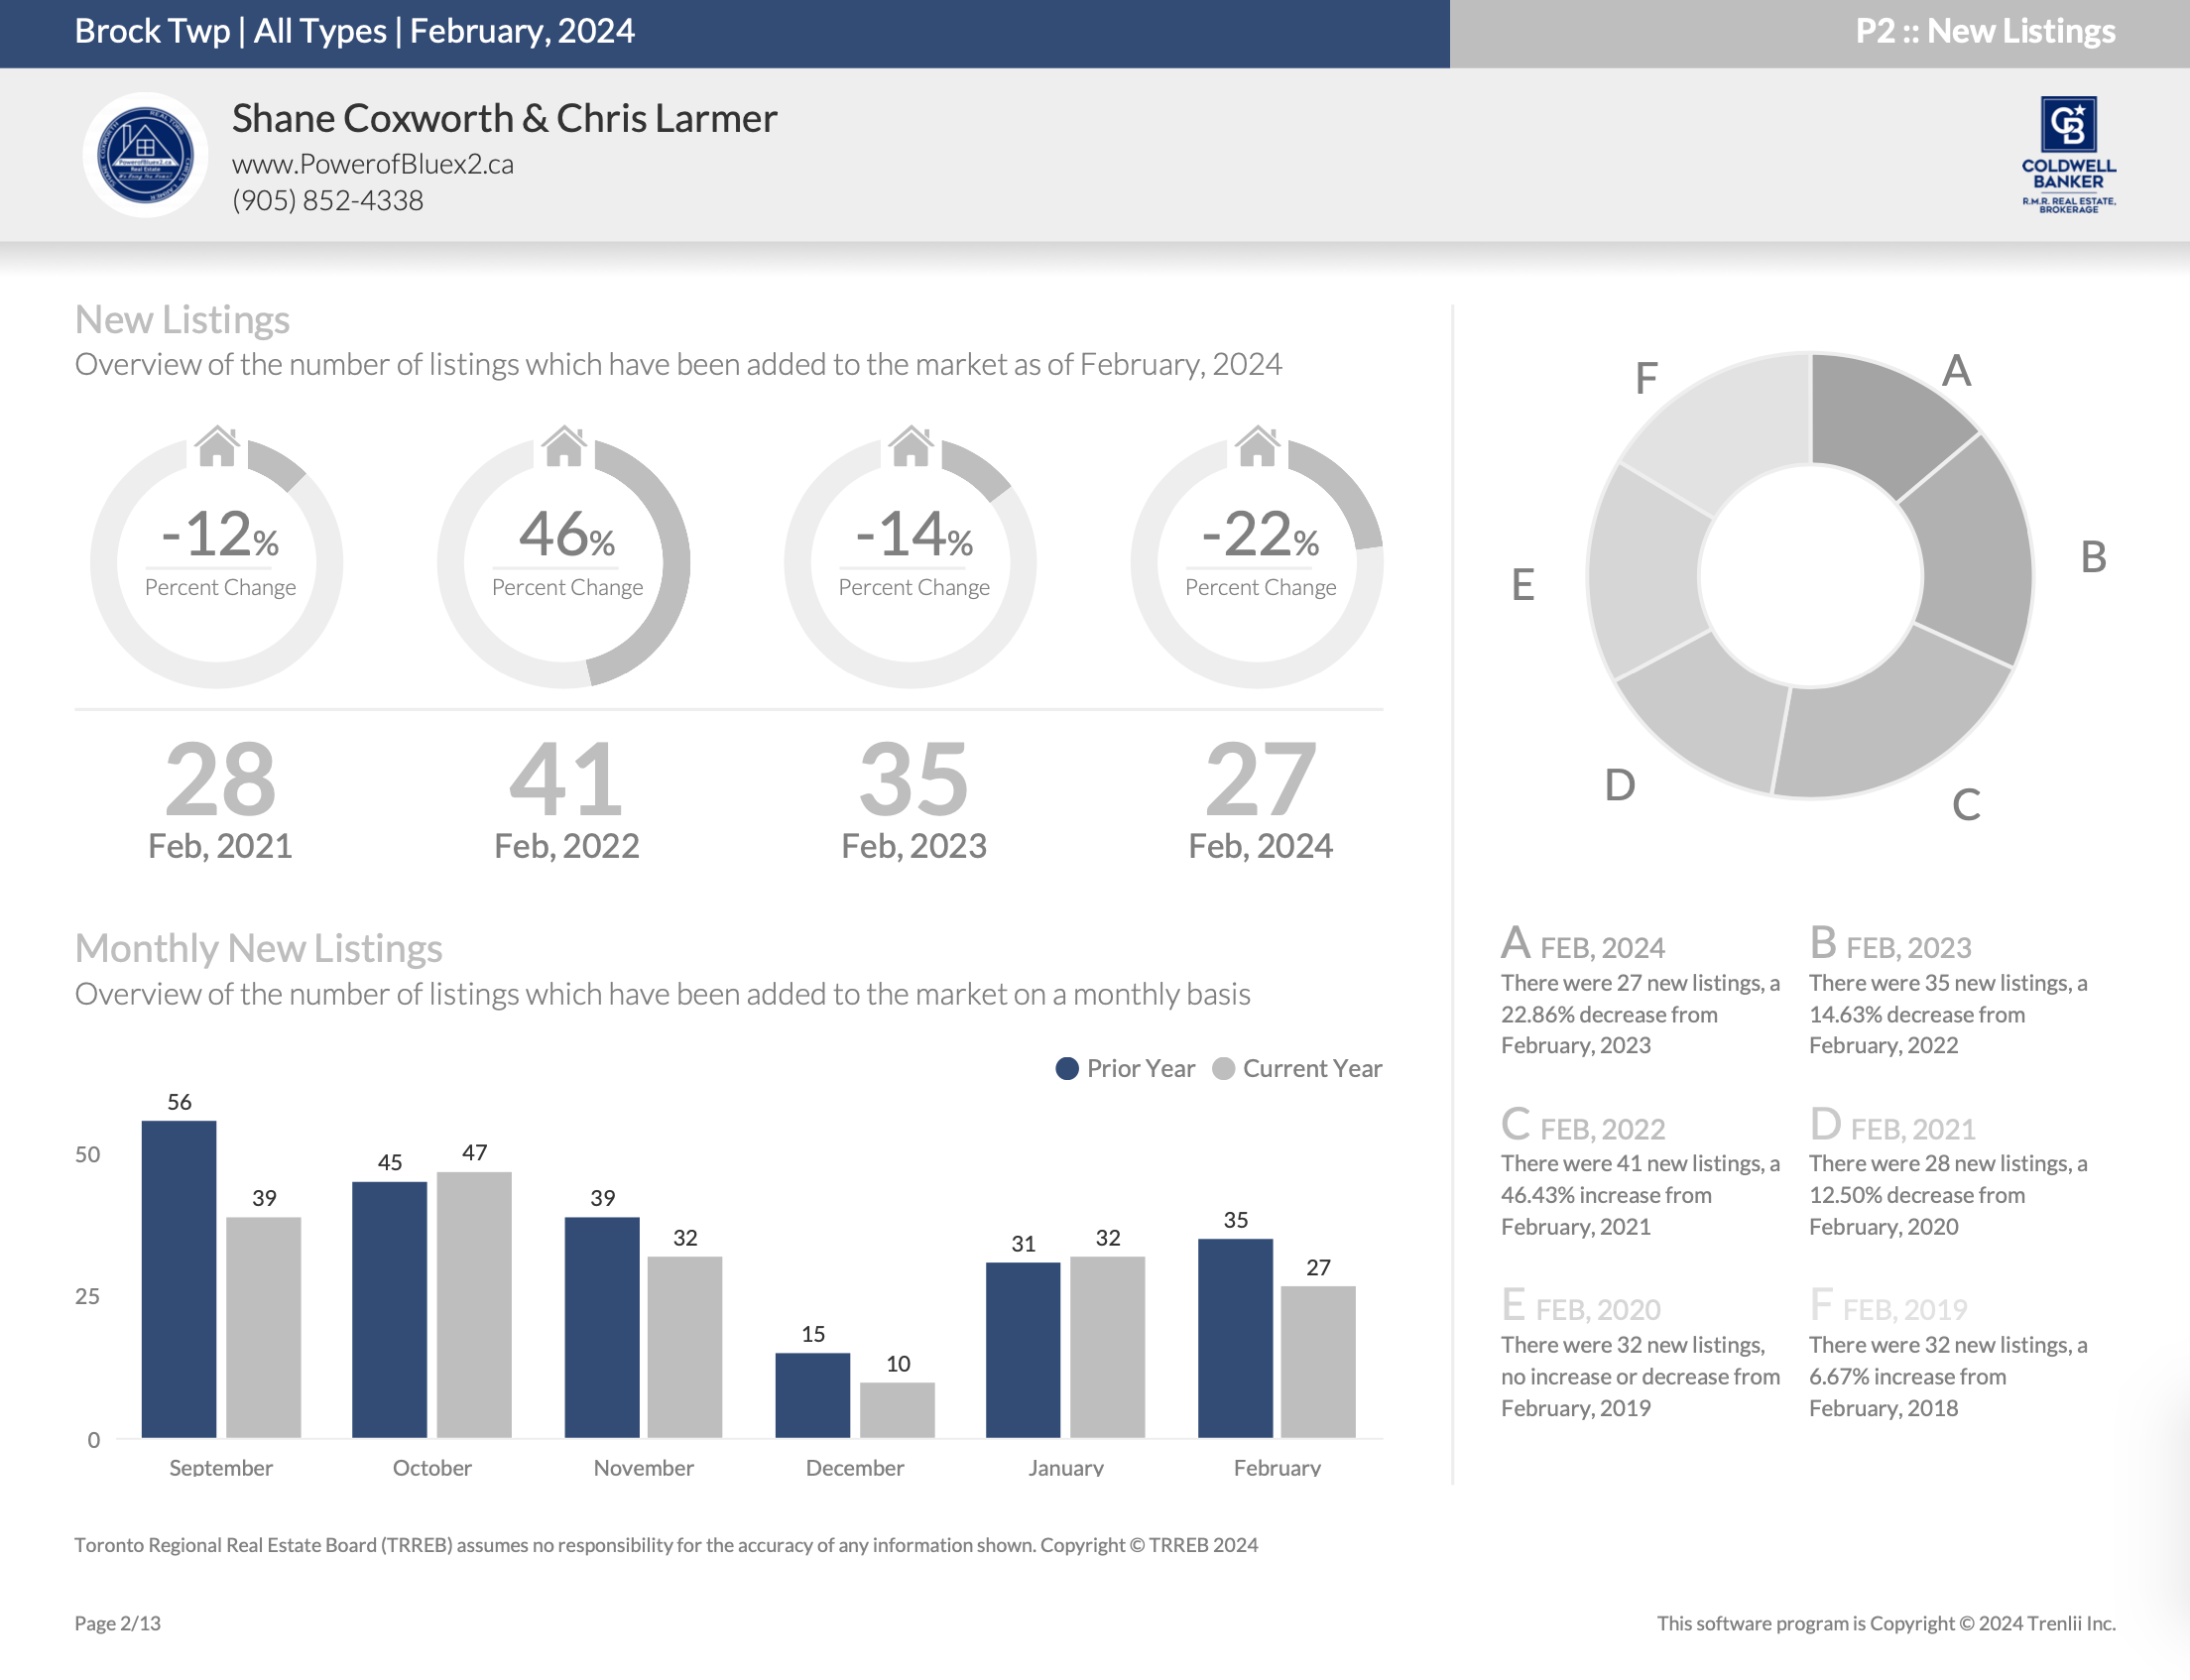
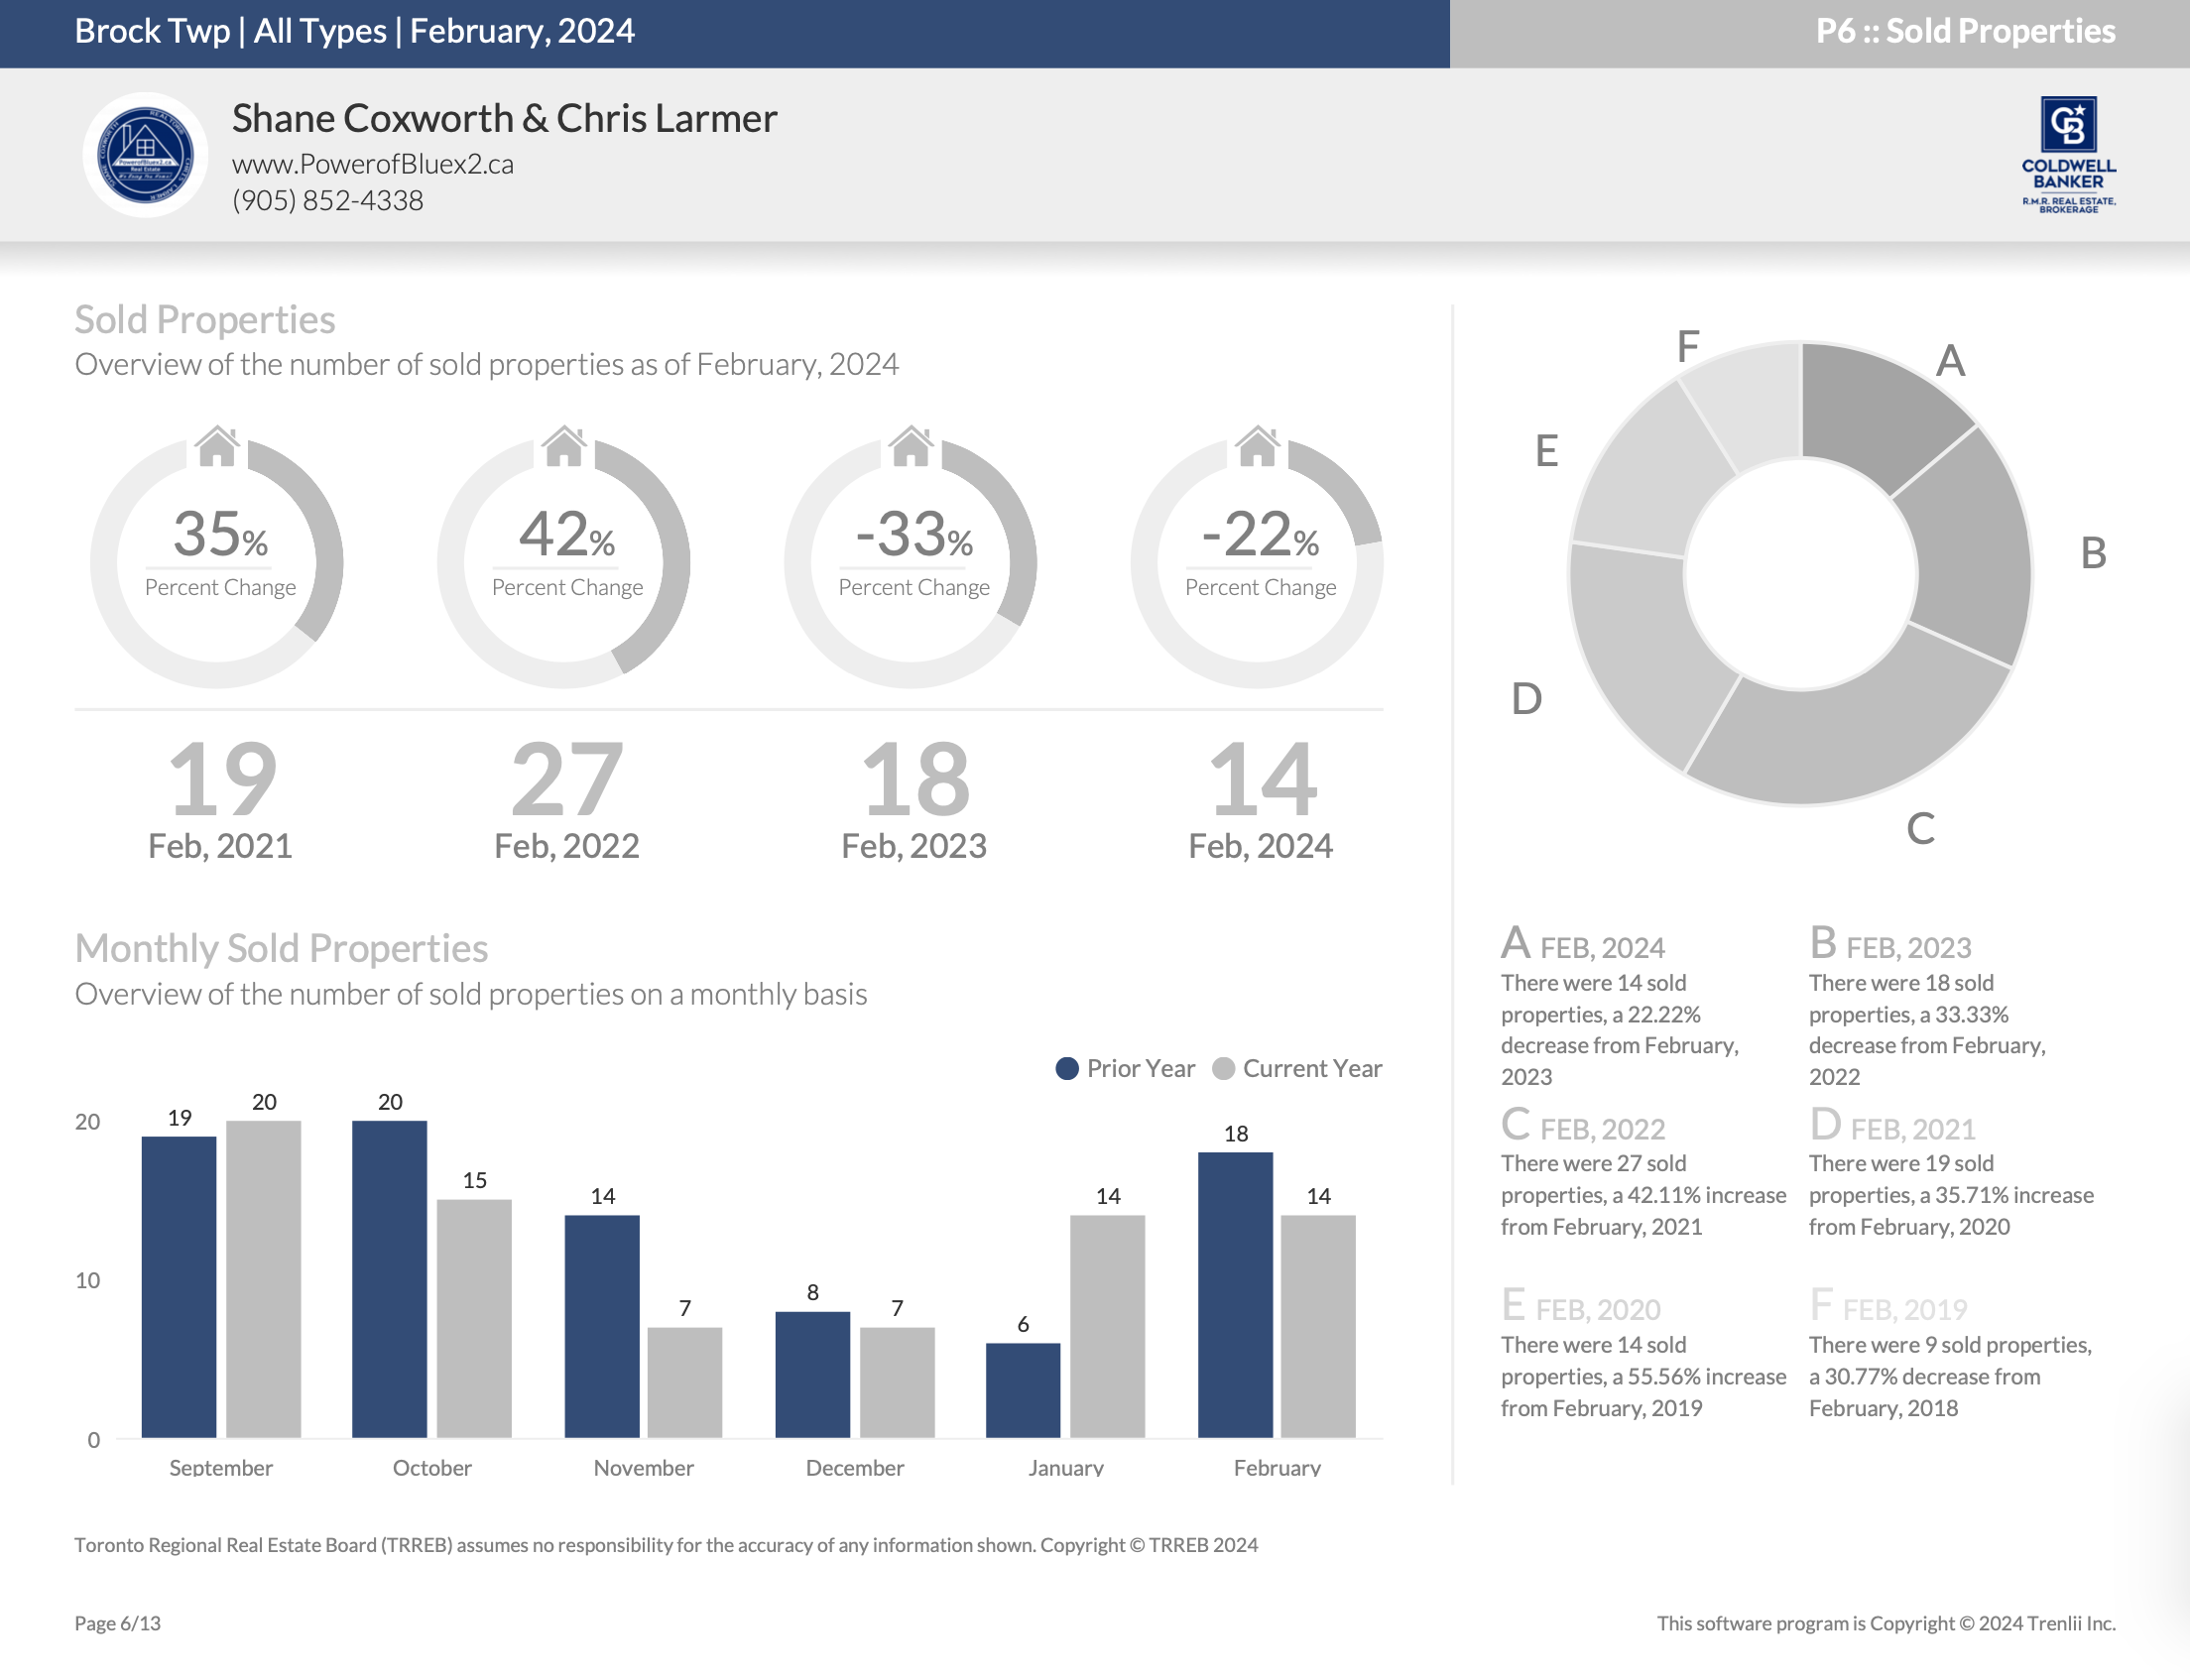
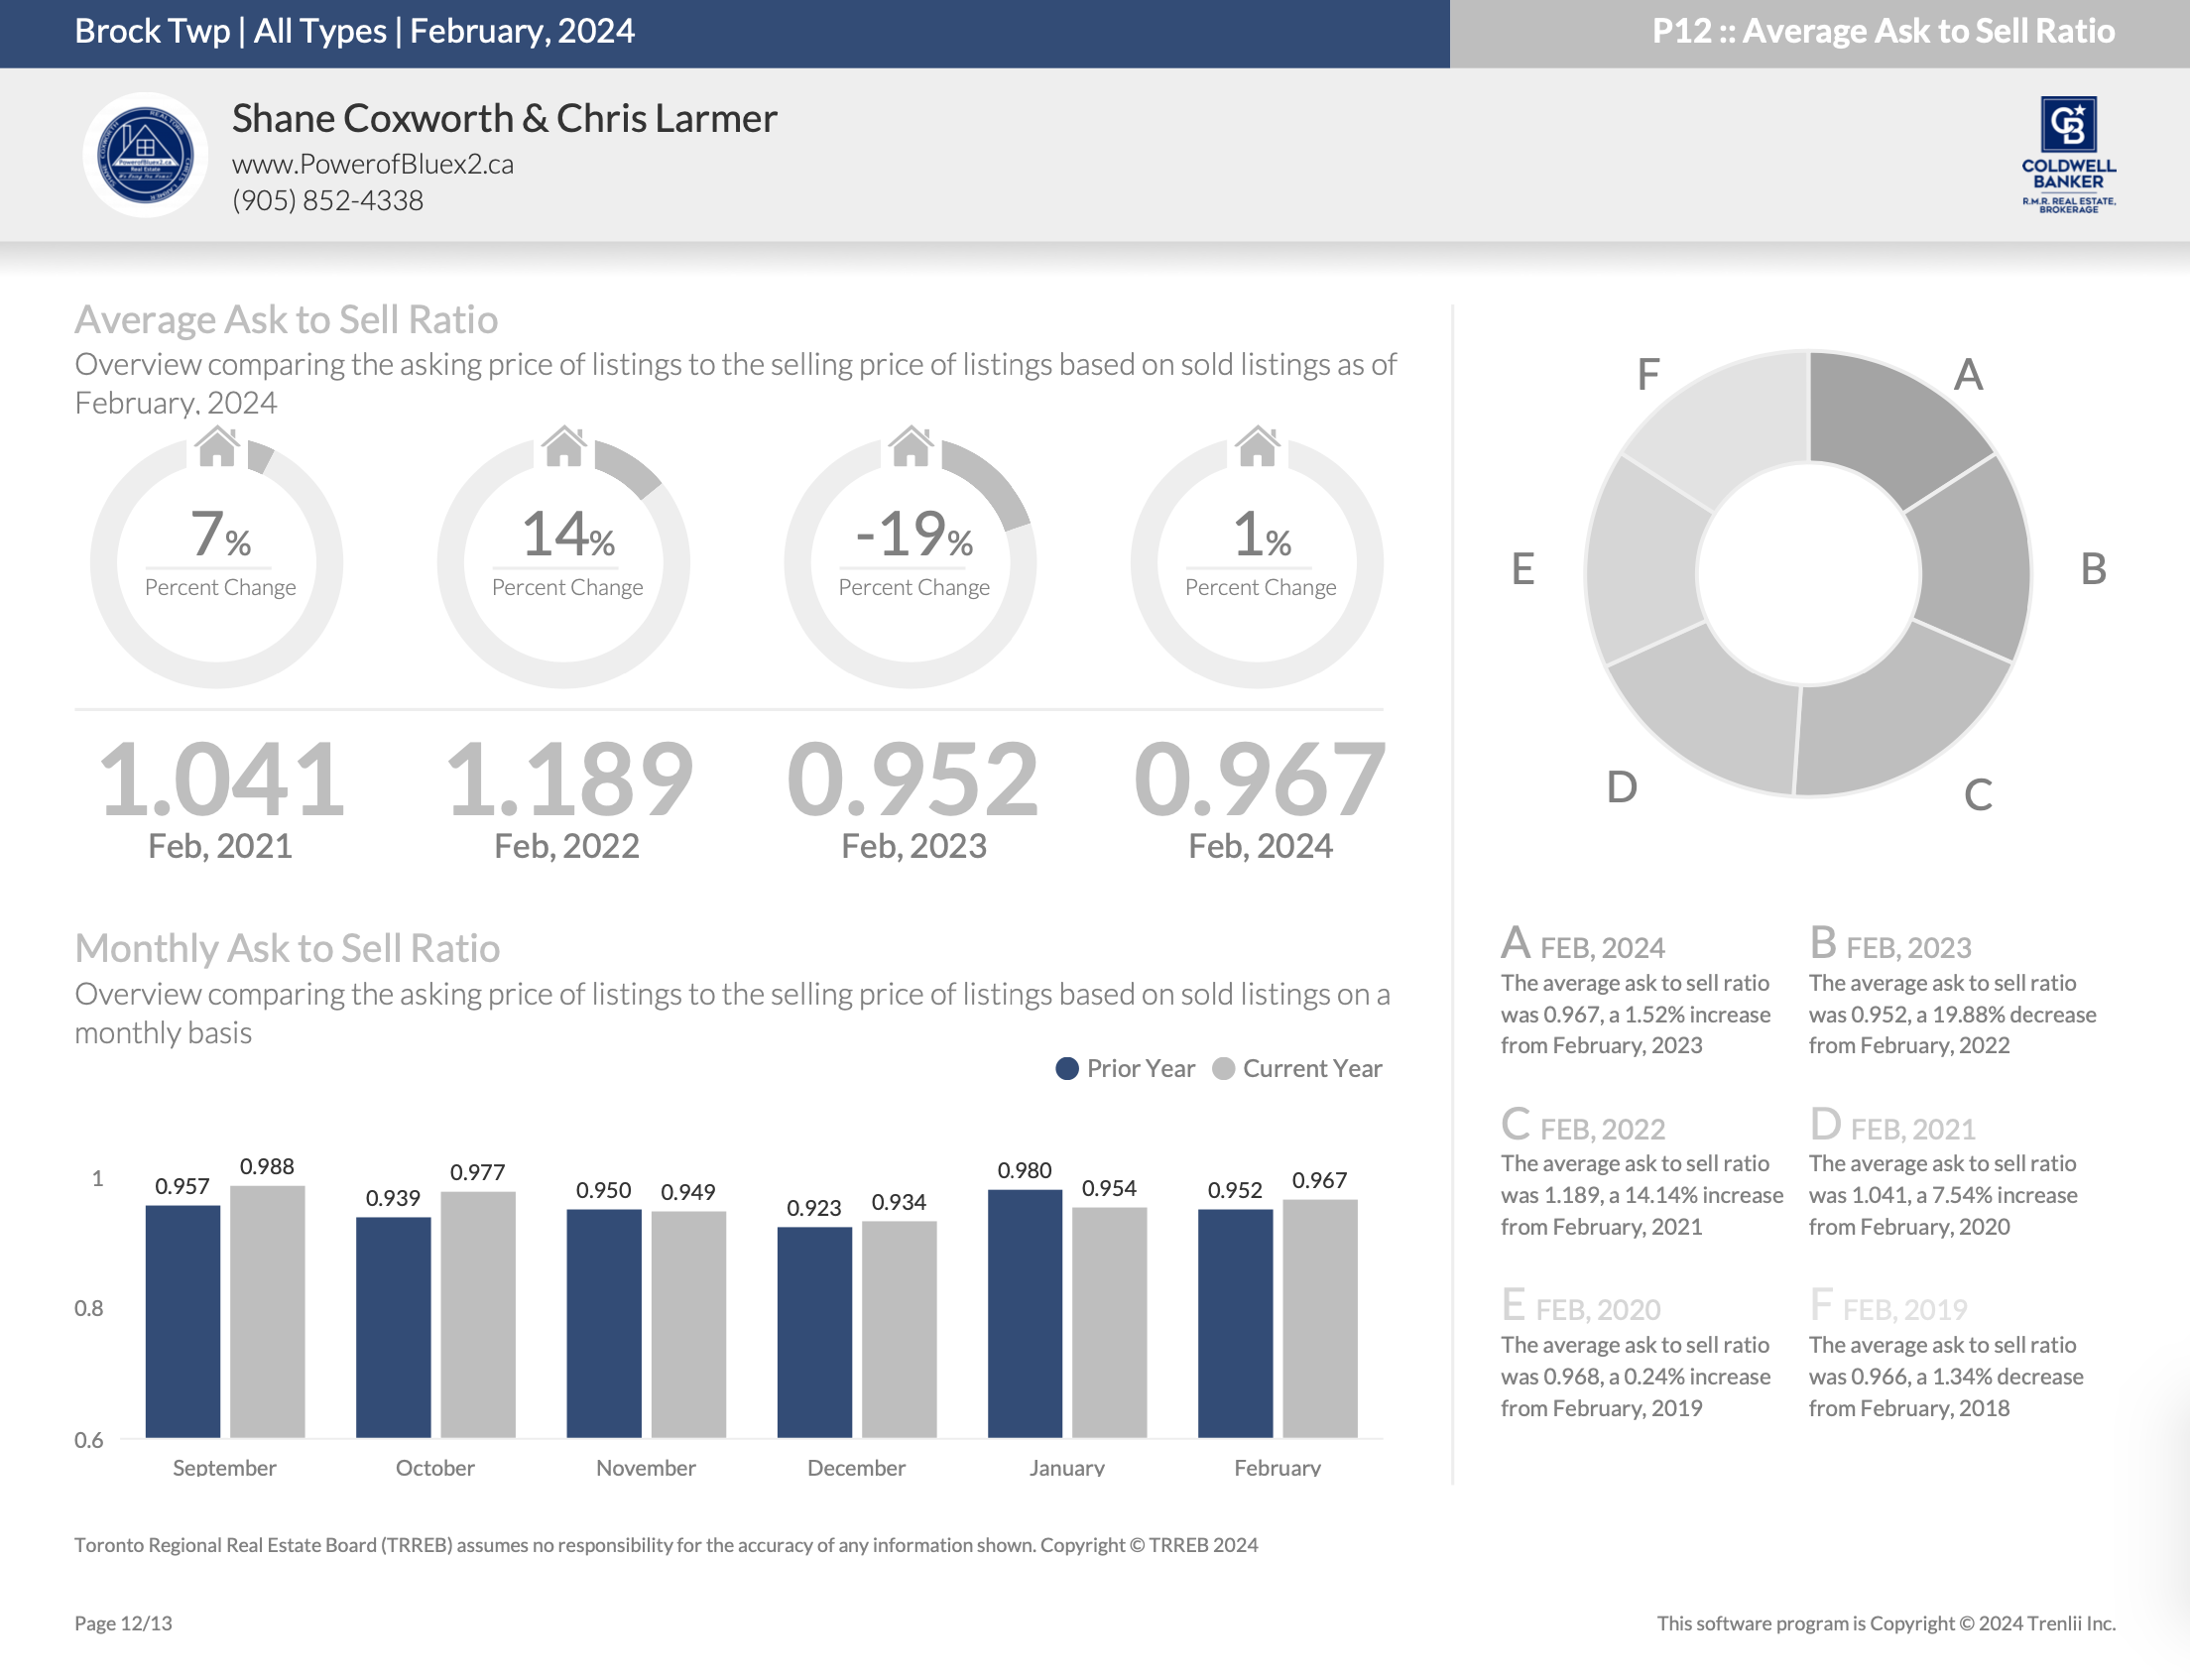
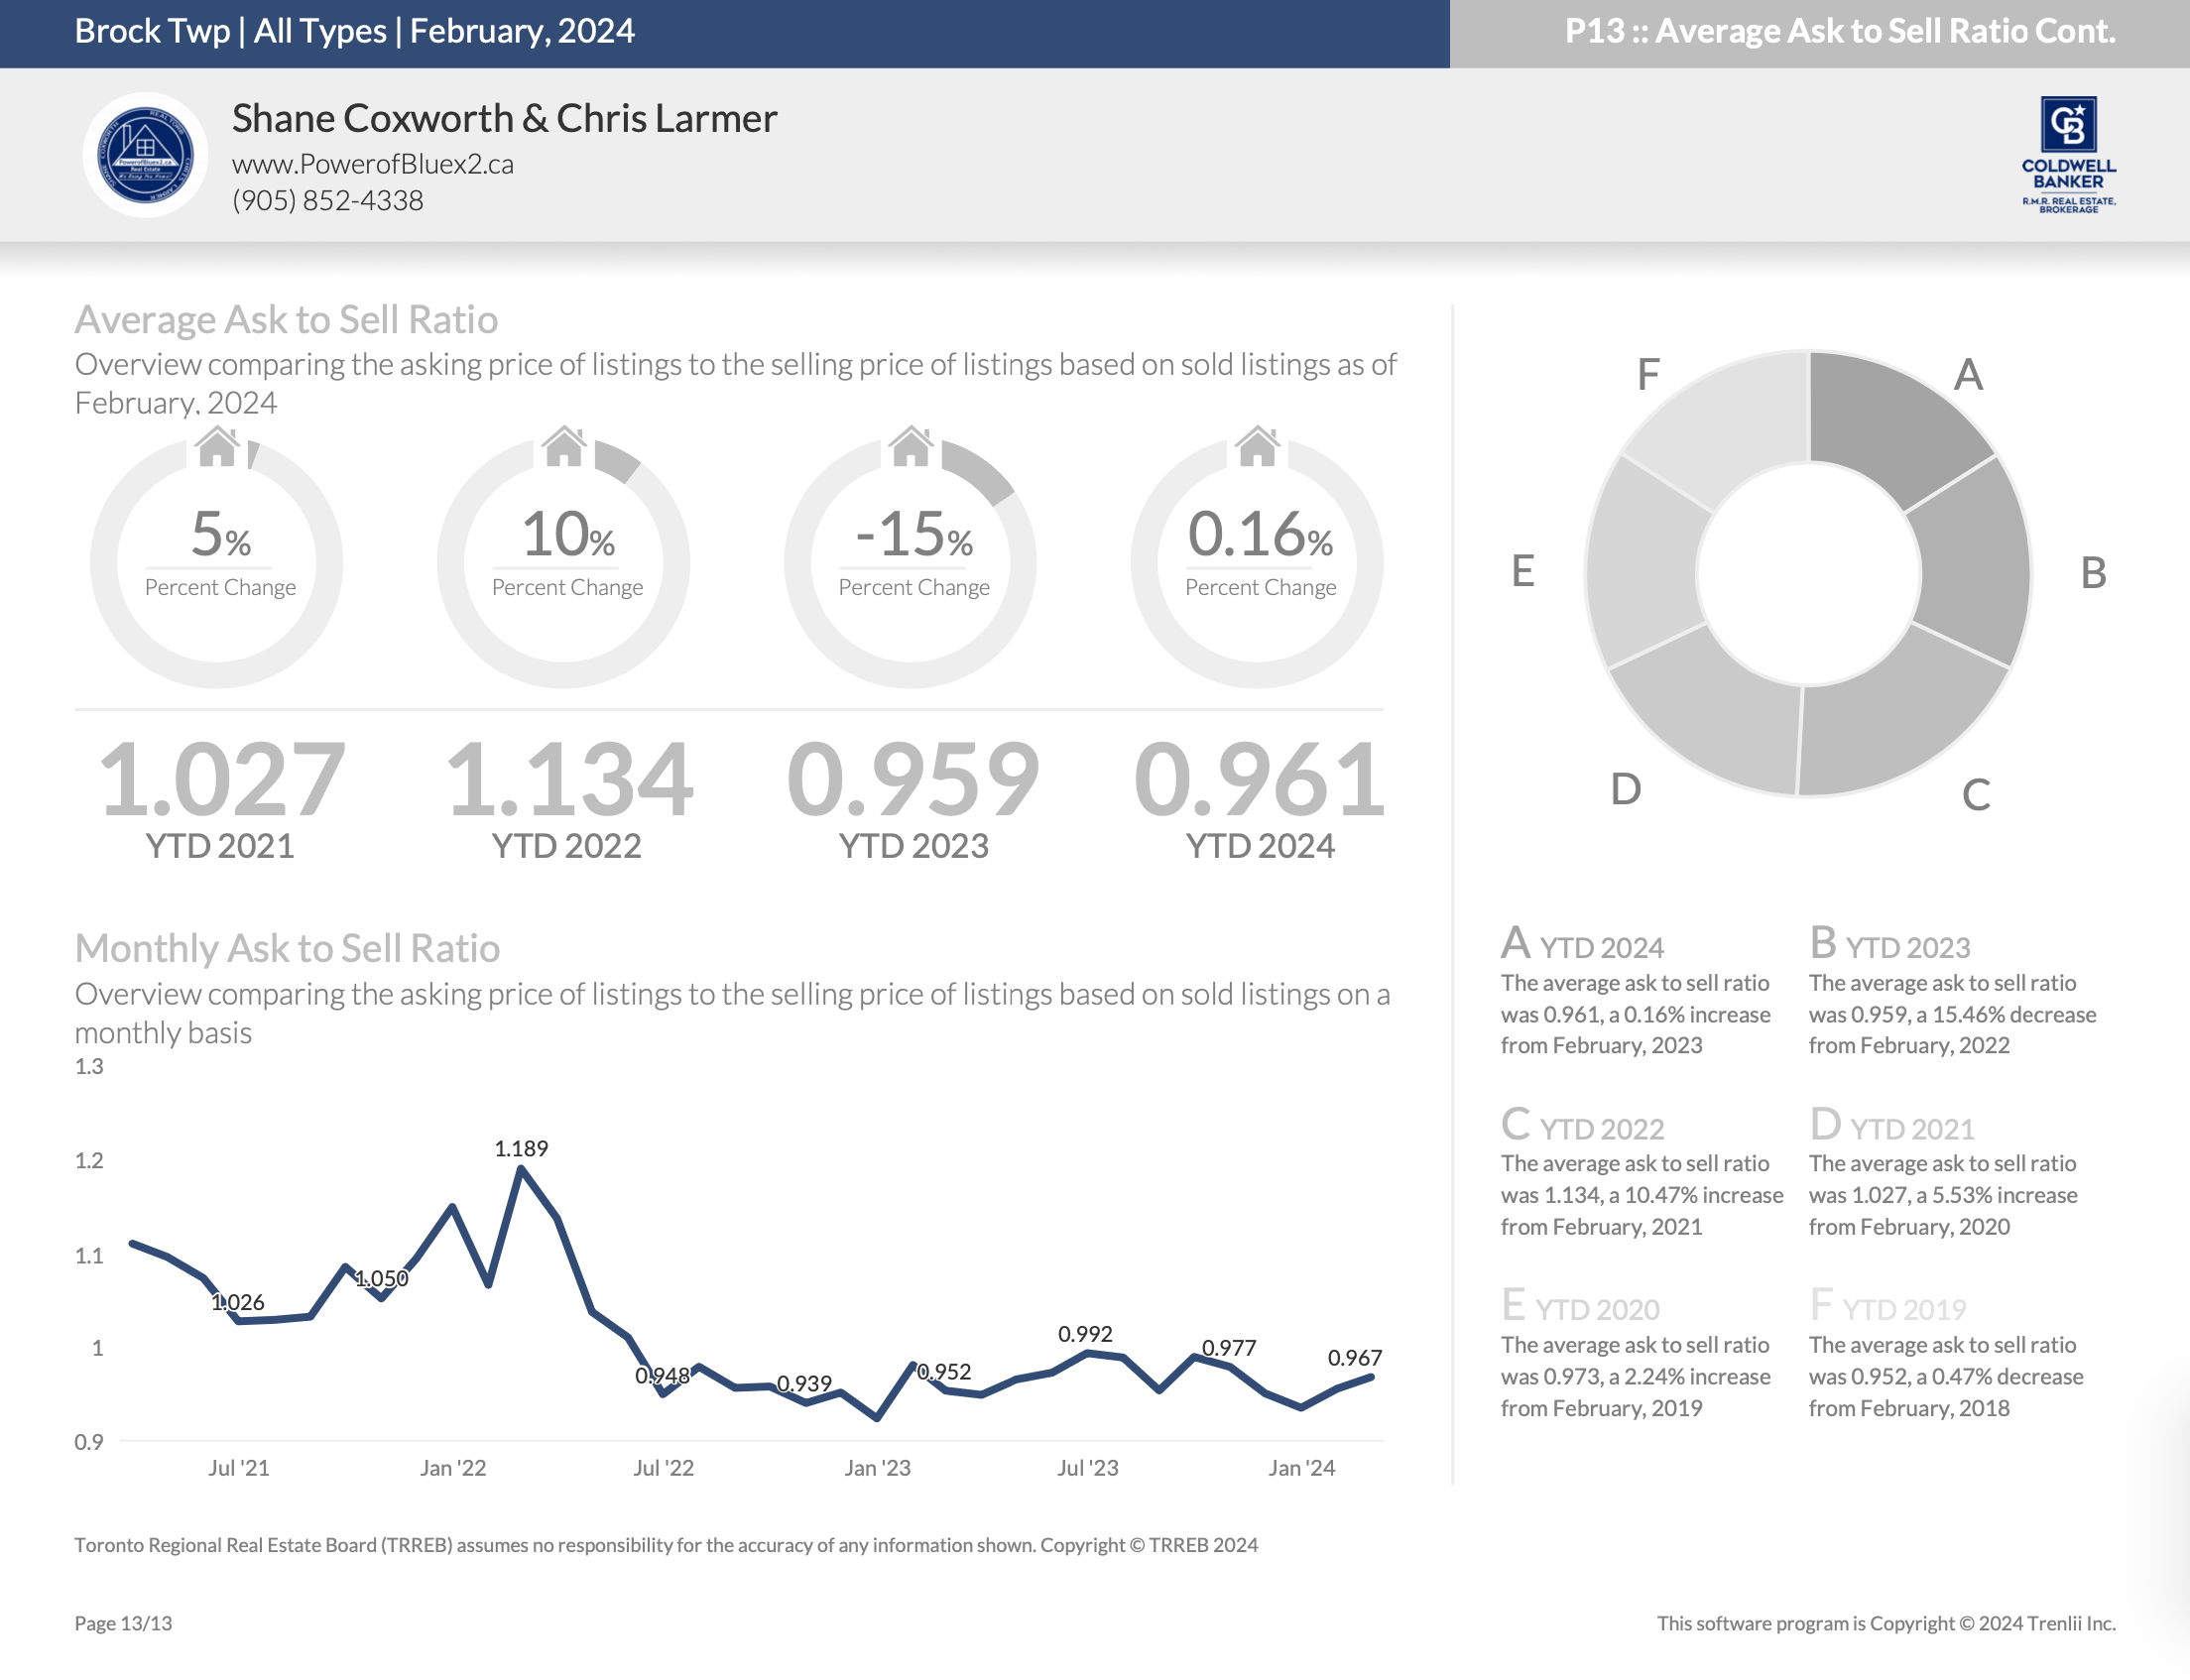
This housing report for Durham Region includes the number of new listings, average list price, number of properties sold, average selling price, average days on market and average asking price to selling price ratio for all property types within the Region of Durham.
Scroll to the bottom for links to take you to the housing market reports for Uxbridge, Scugog, Brock and the Kawartha Lakes.
From Toronto Regional Real Estate Board
Toronto Regional Real Estate Board – Market Stats At A Glance – February 2024
Check out our Uxbridge and Scugog Events Pages to keep up to date on whats going on around town. Click the links or scan the Code with your phone to take you directly there.
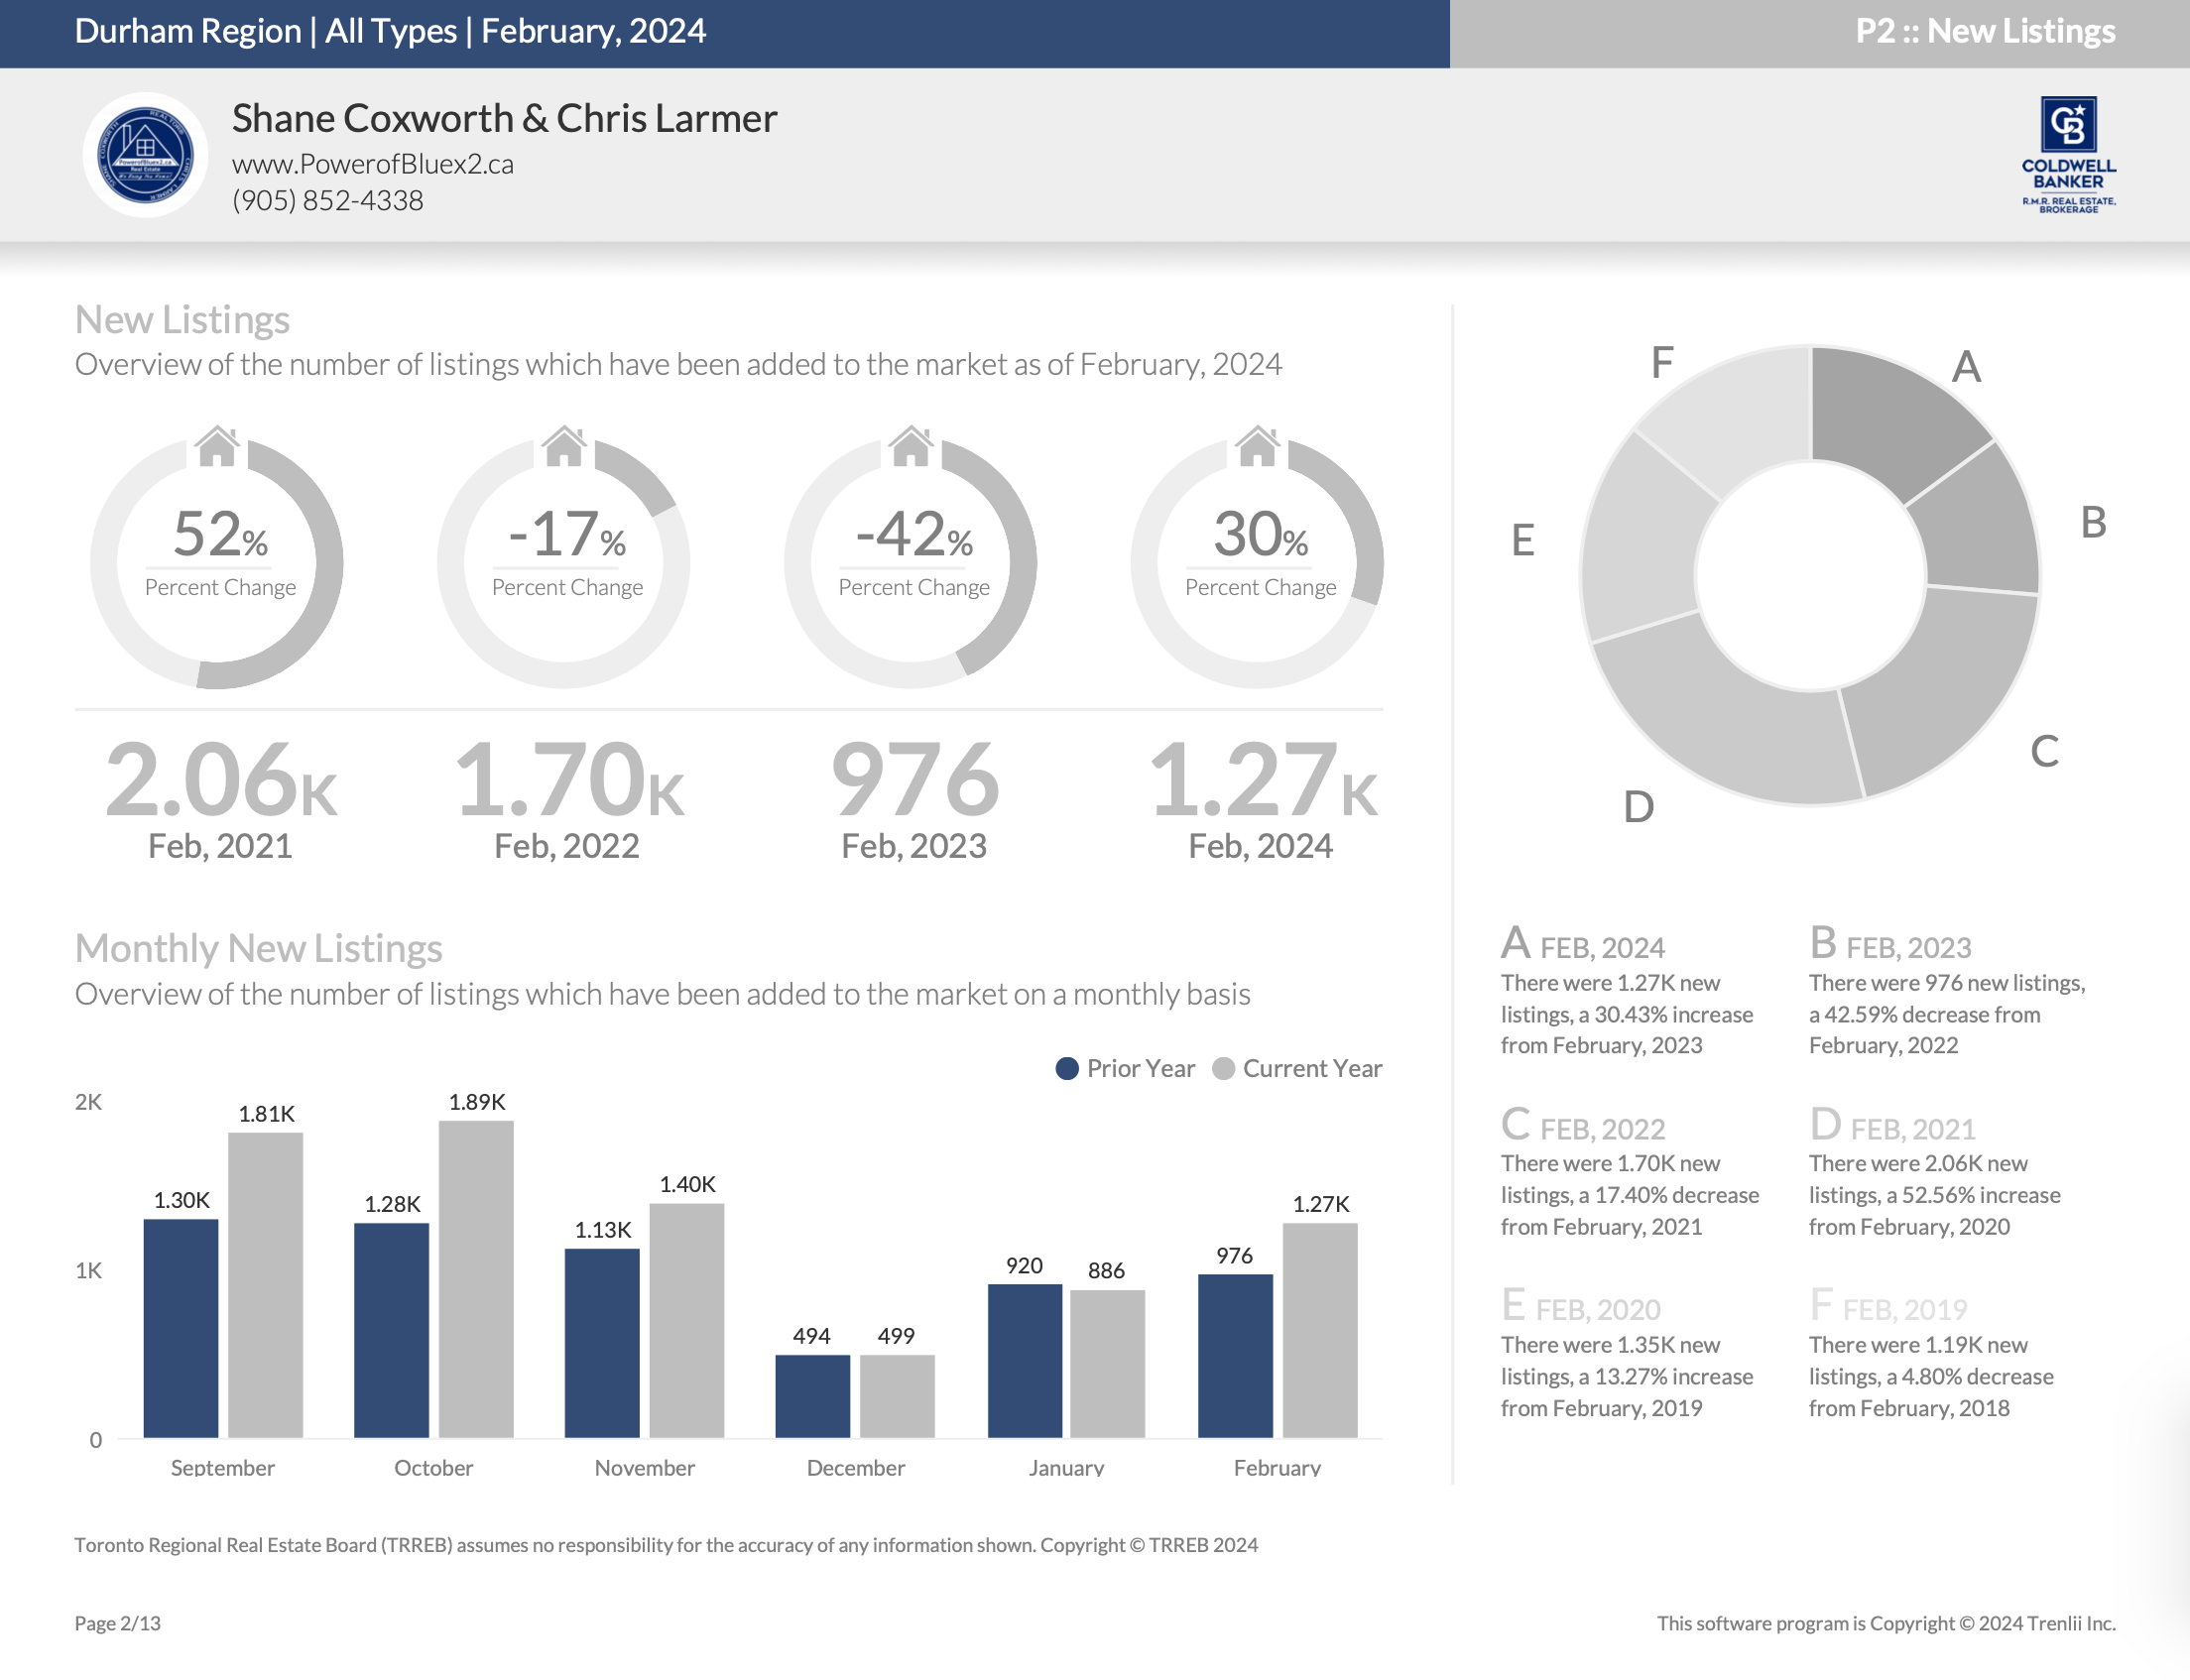
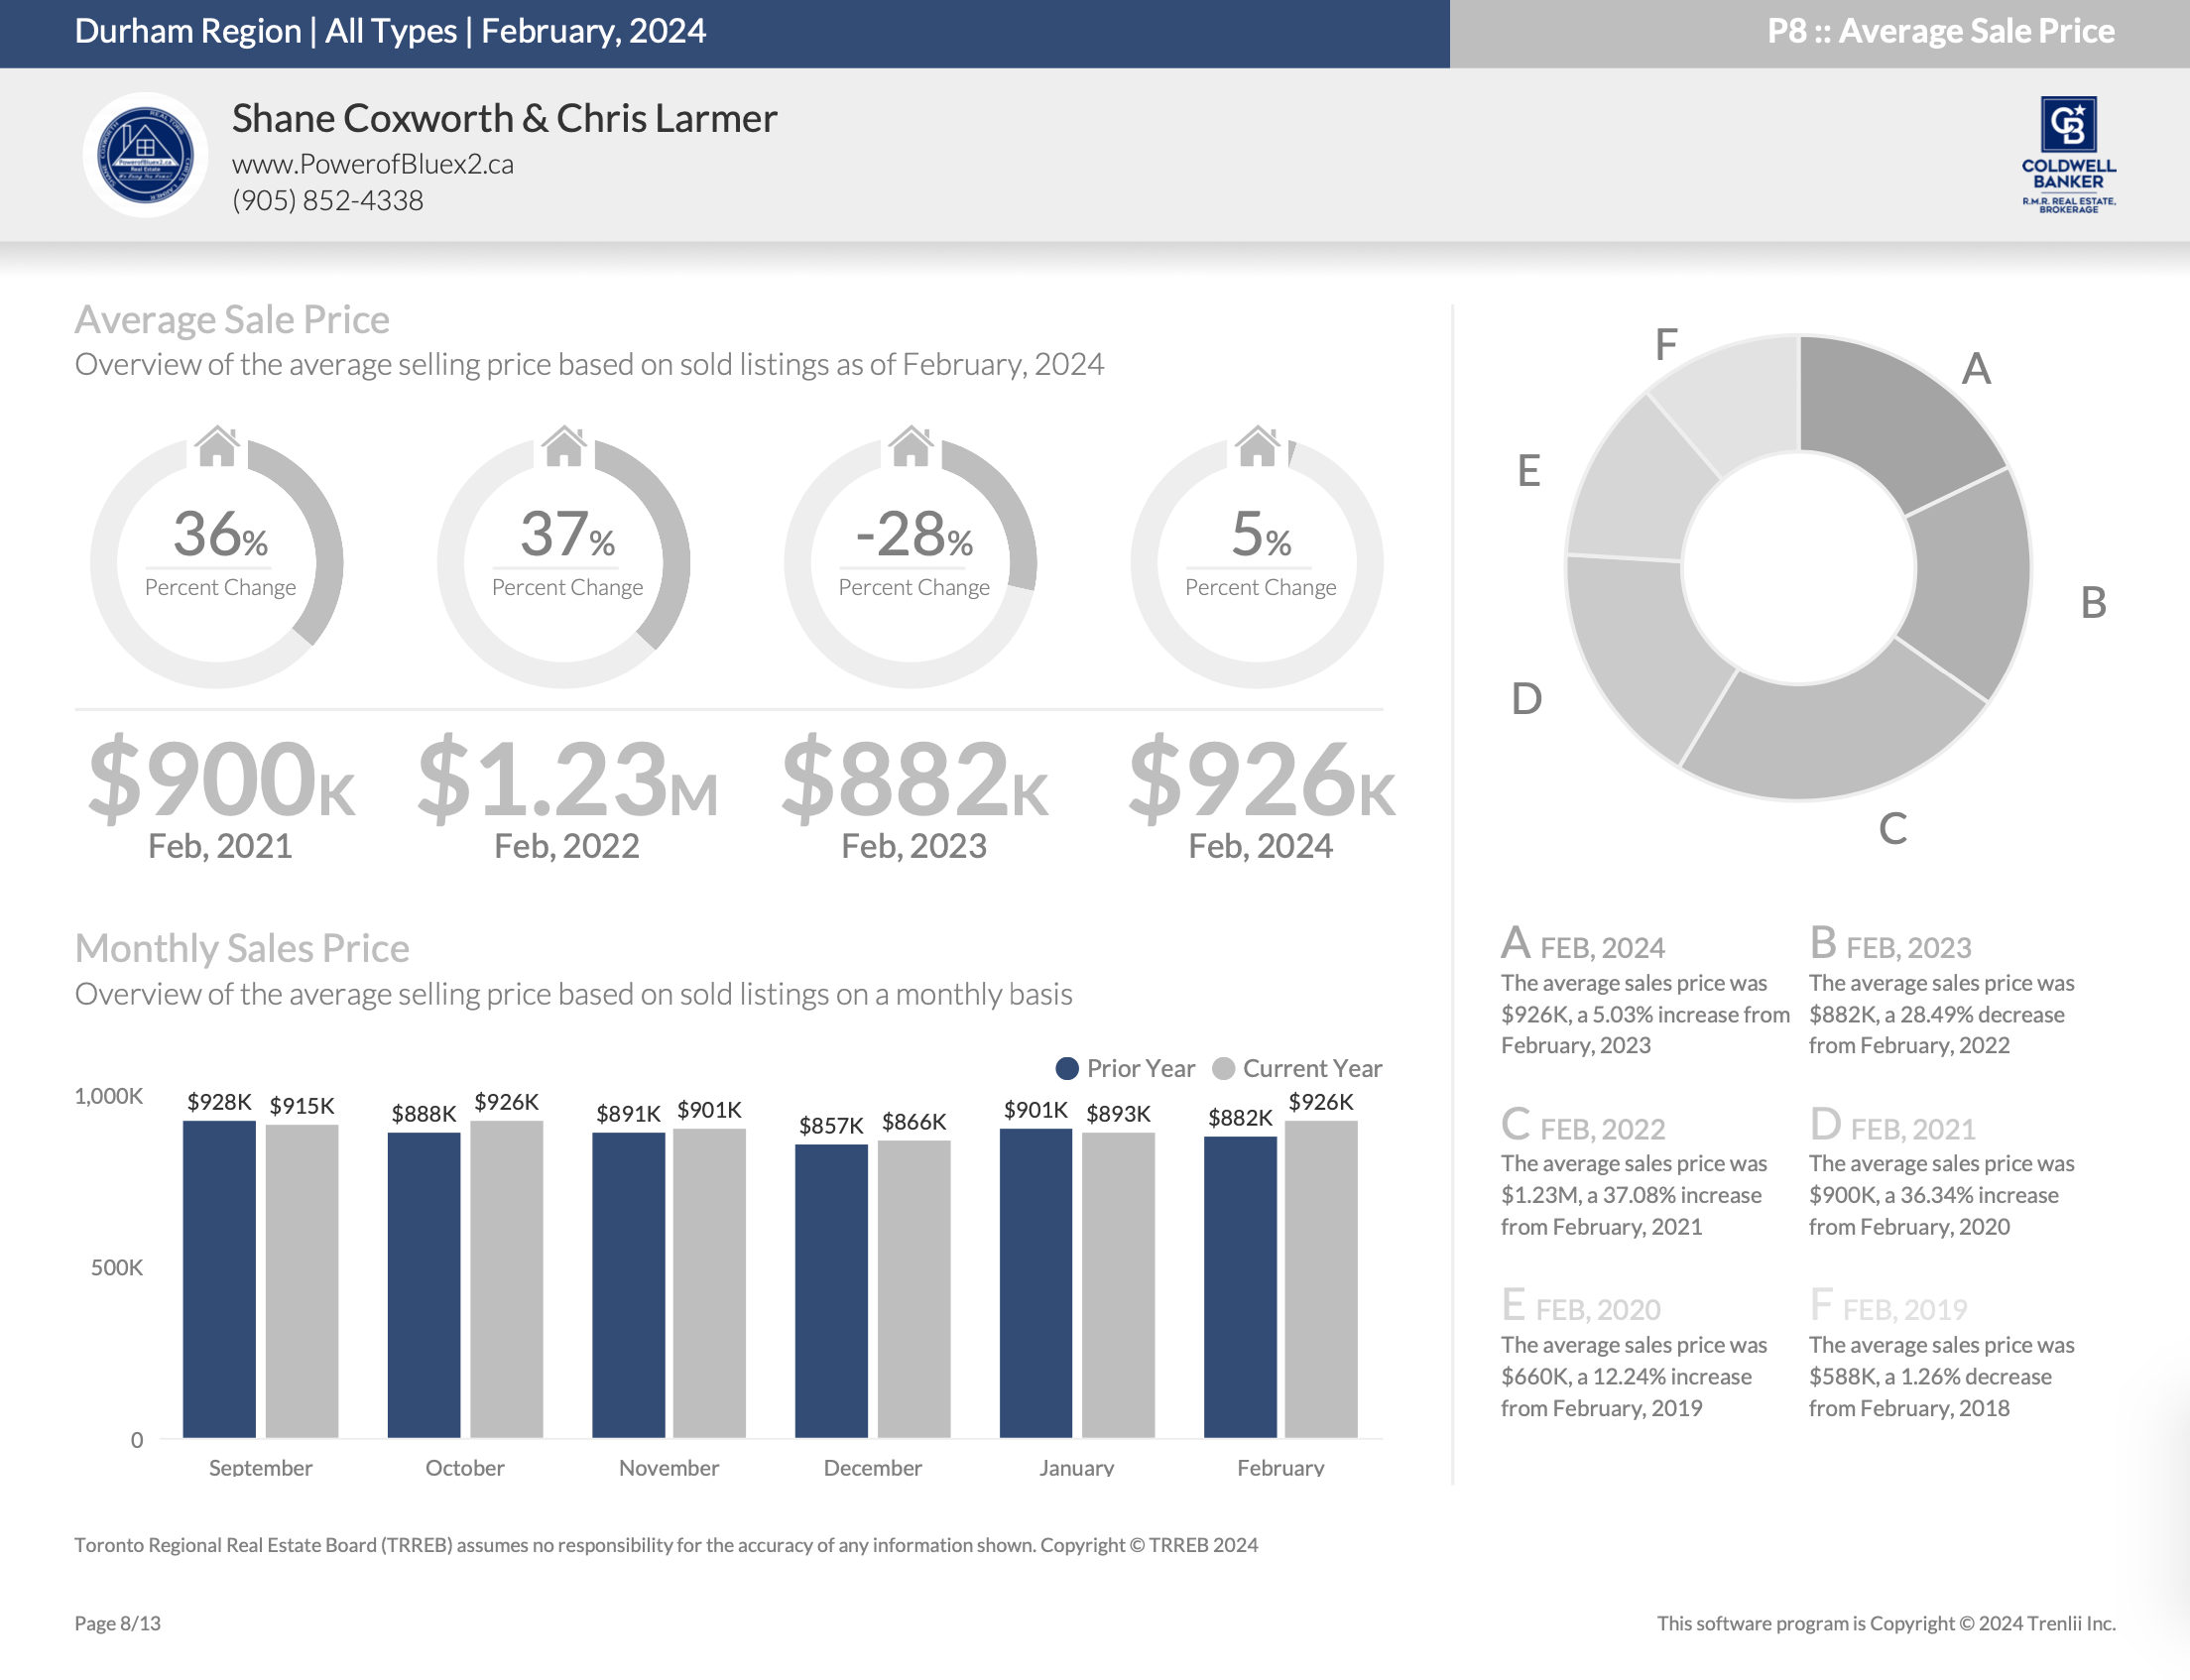
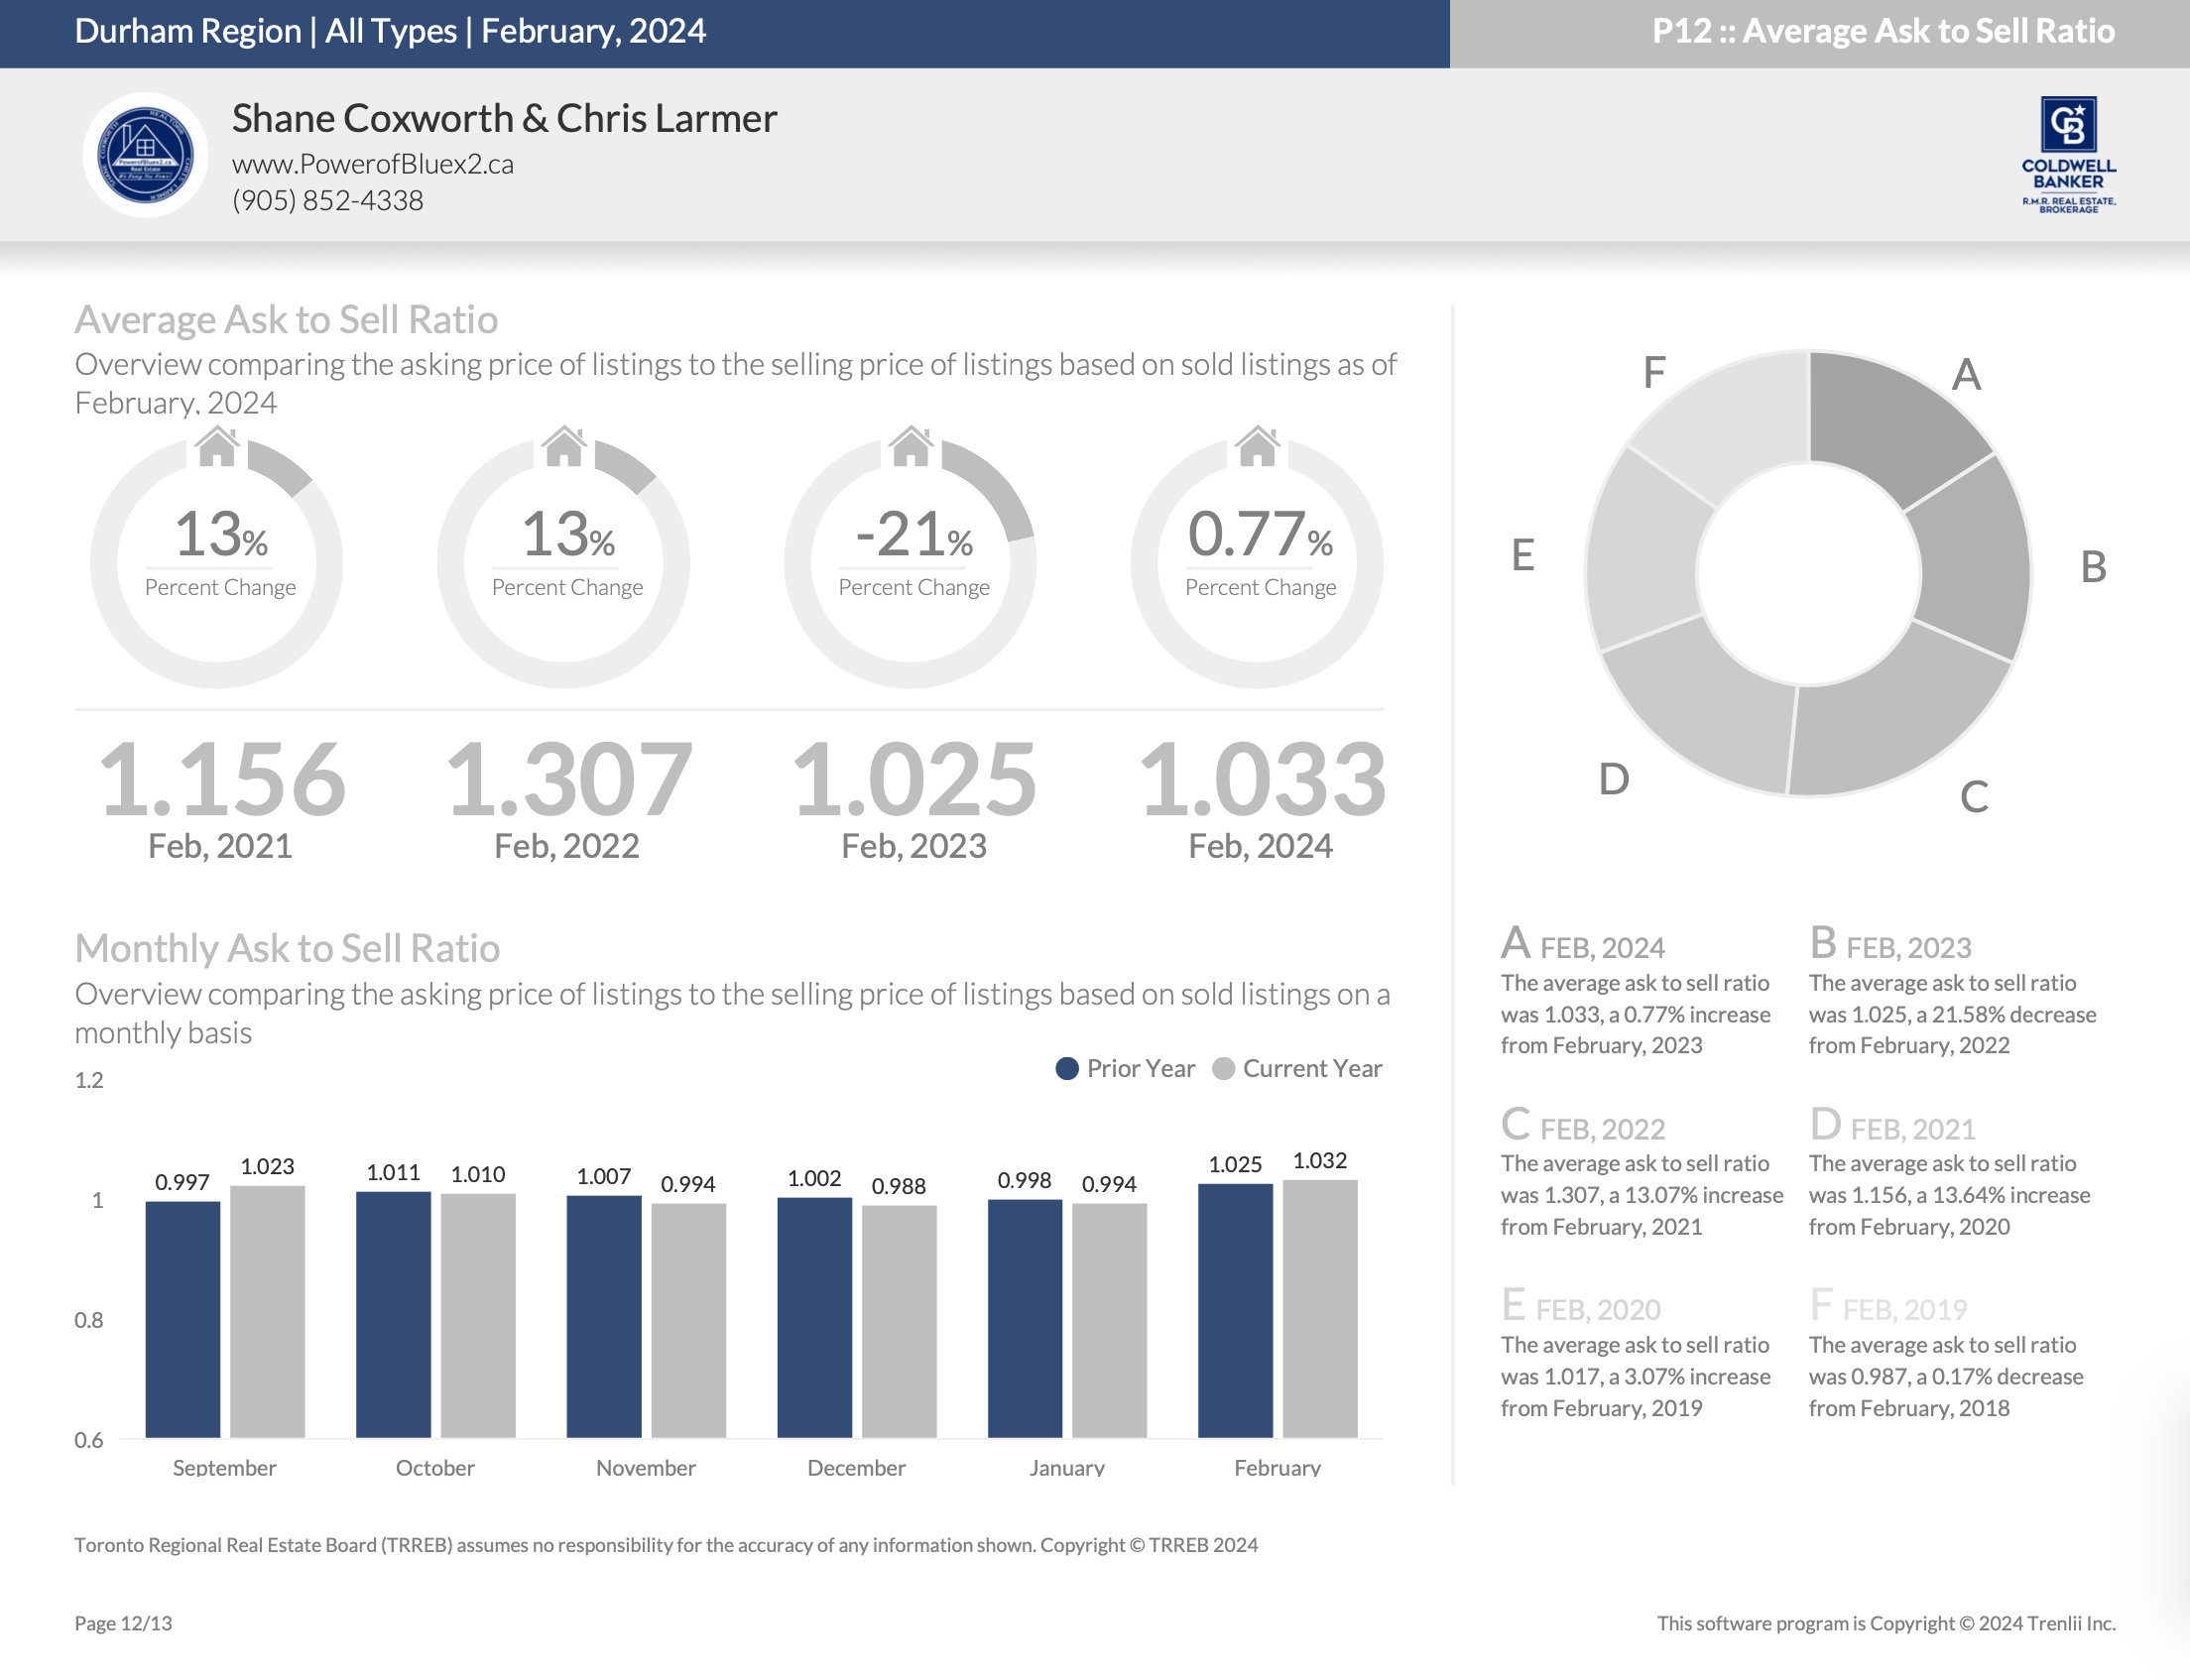
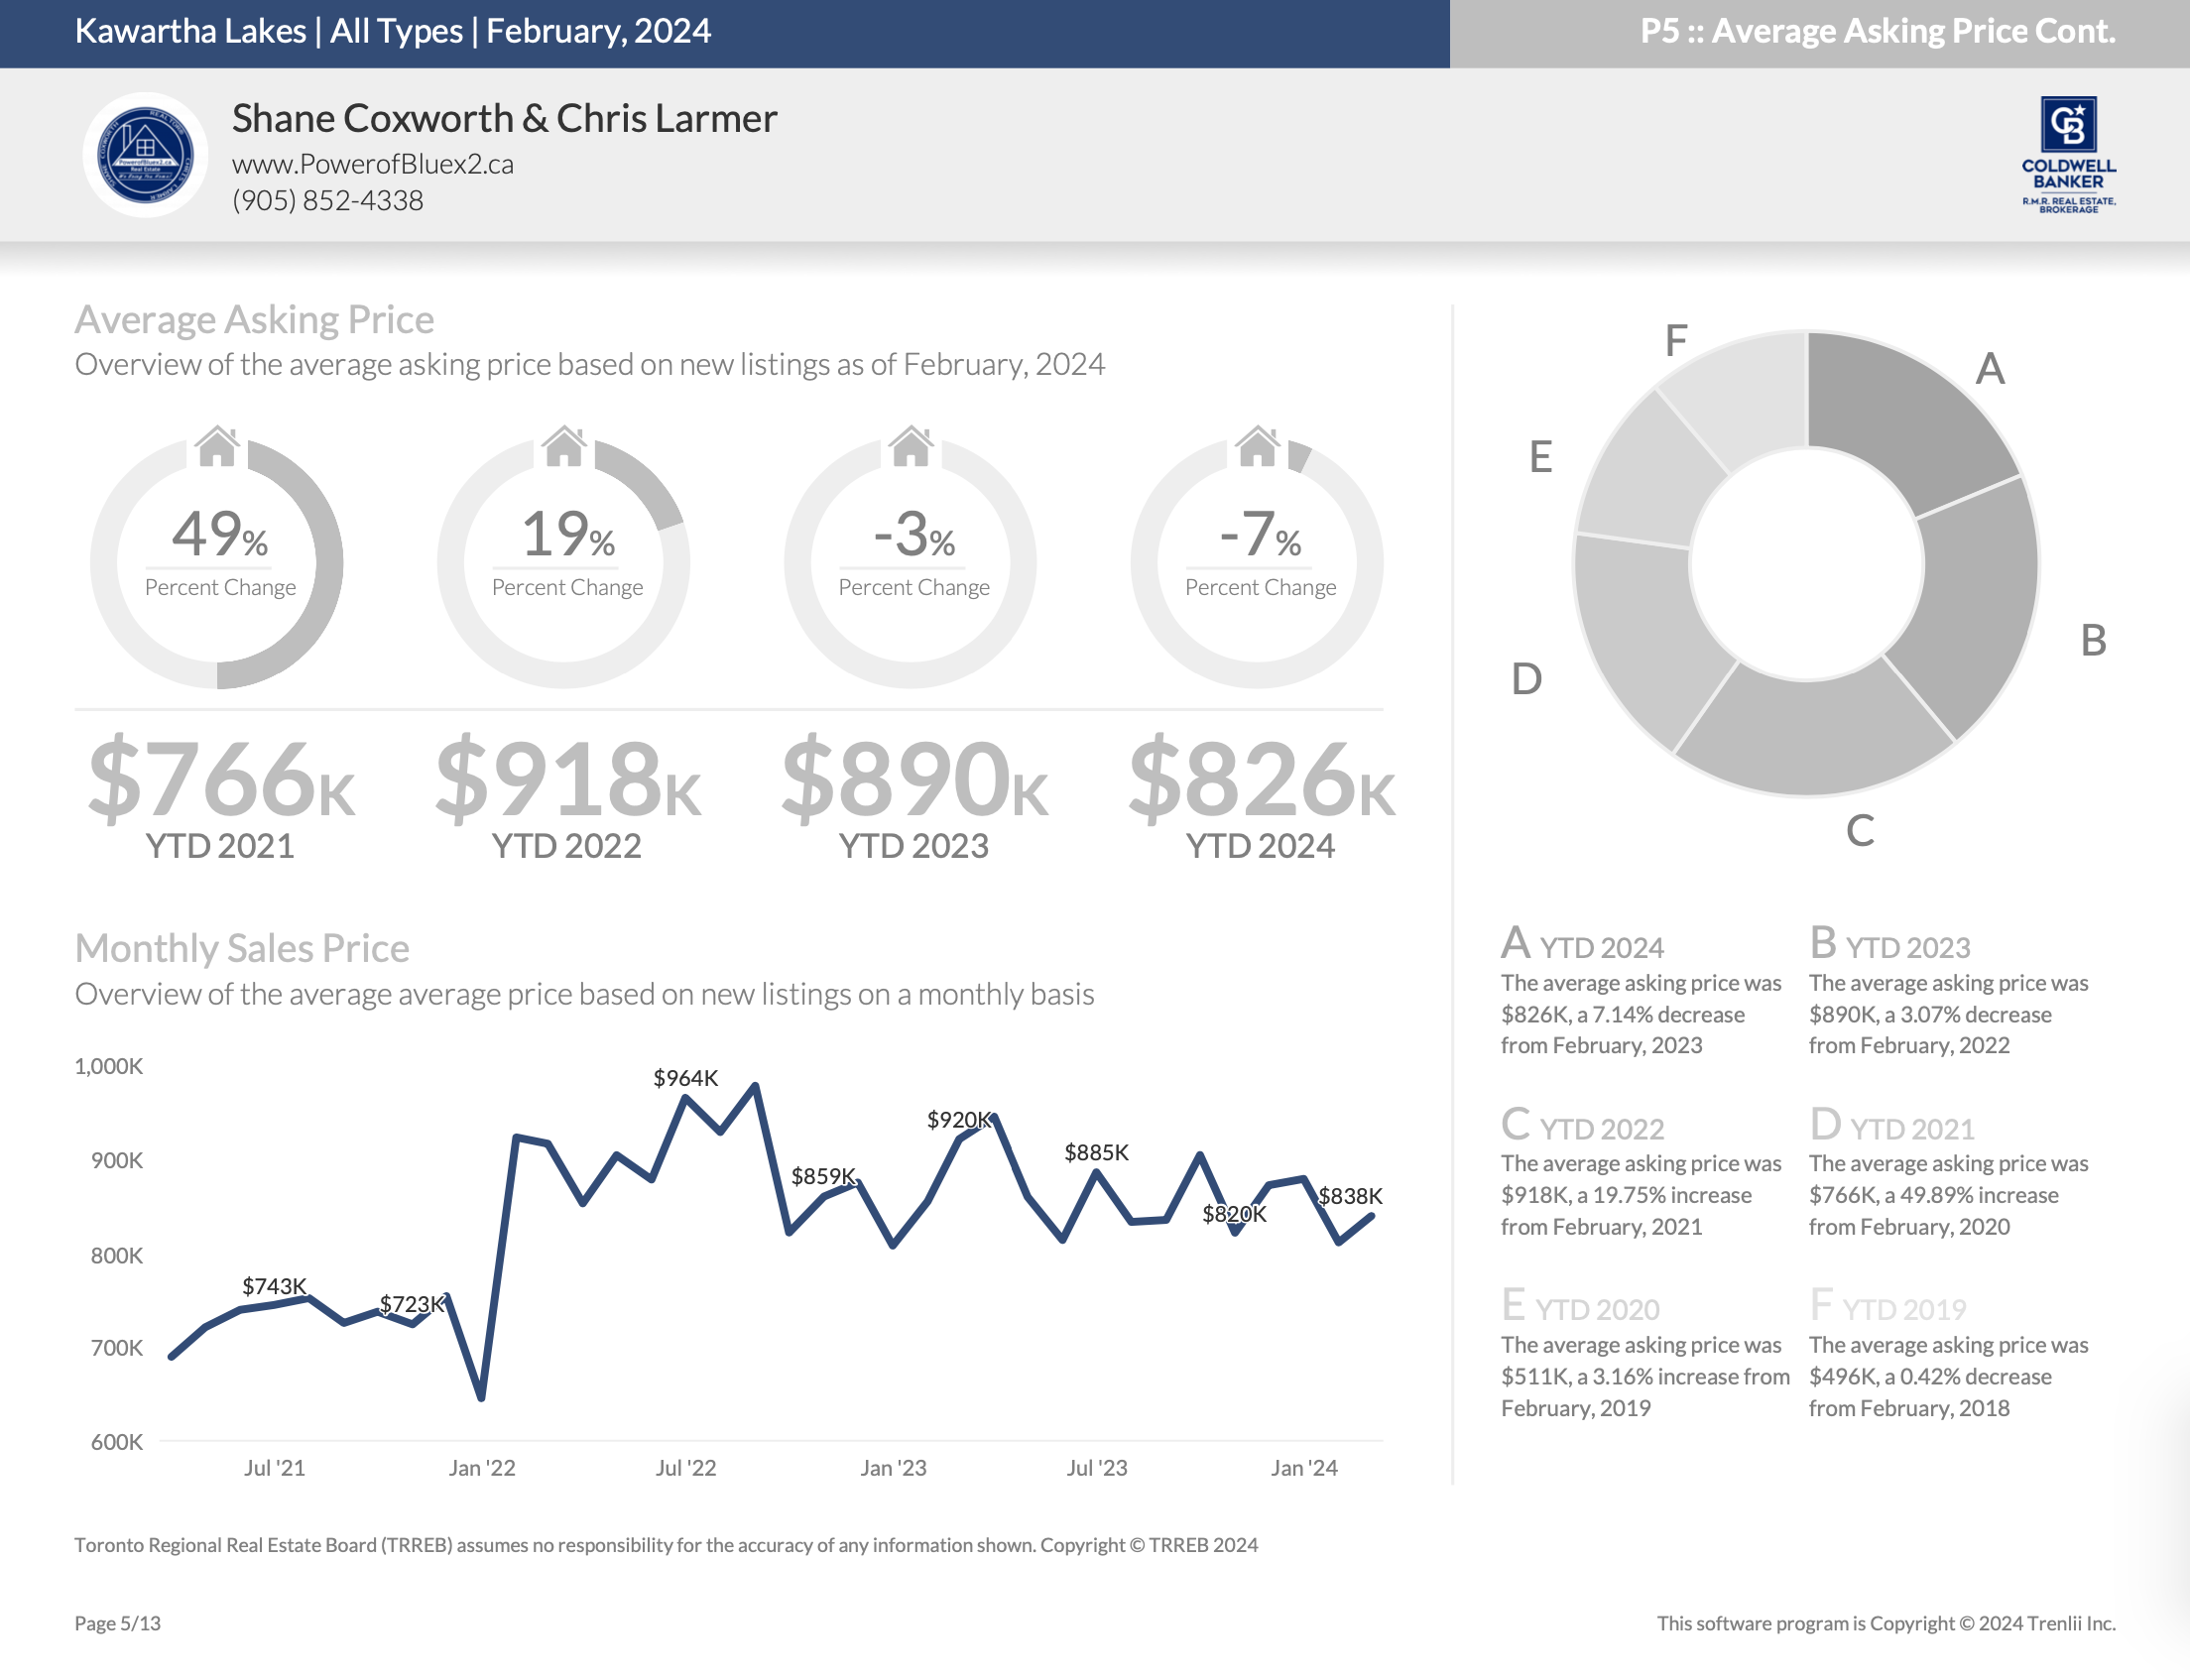
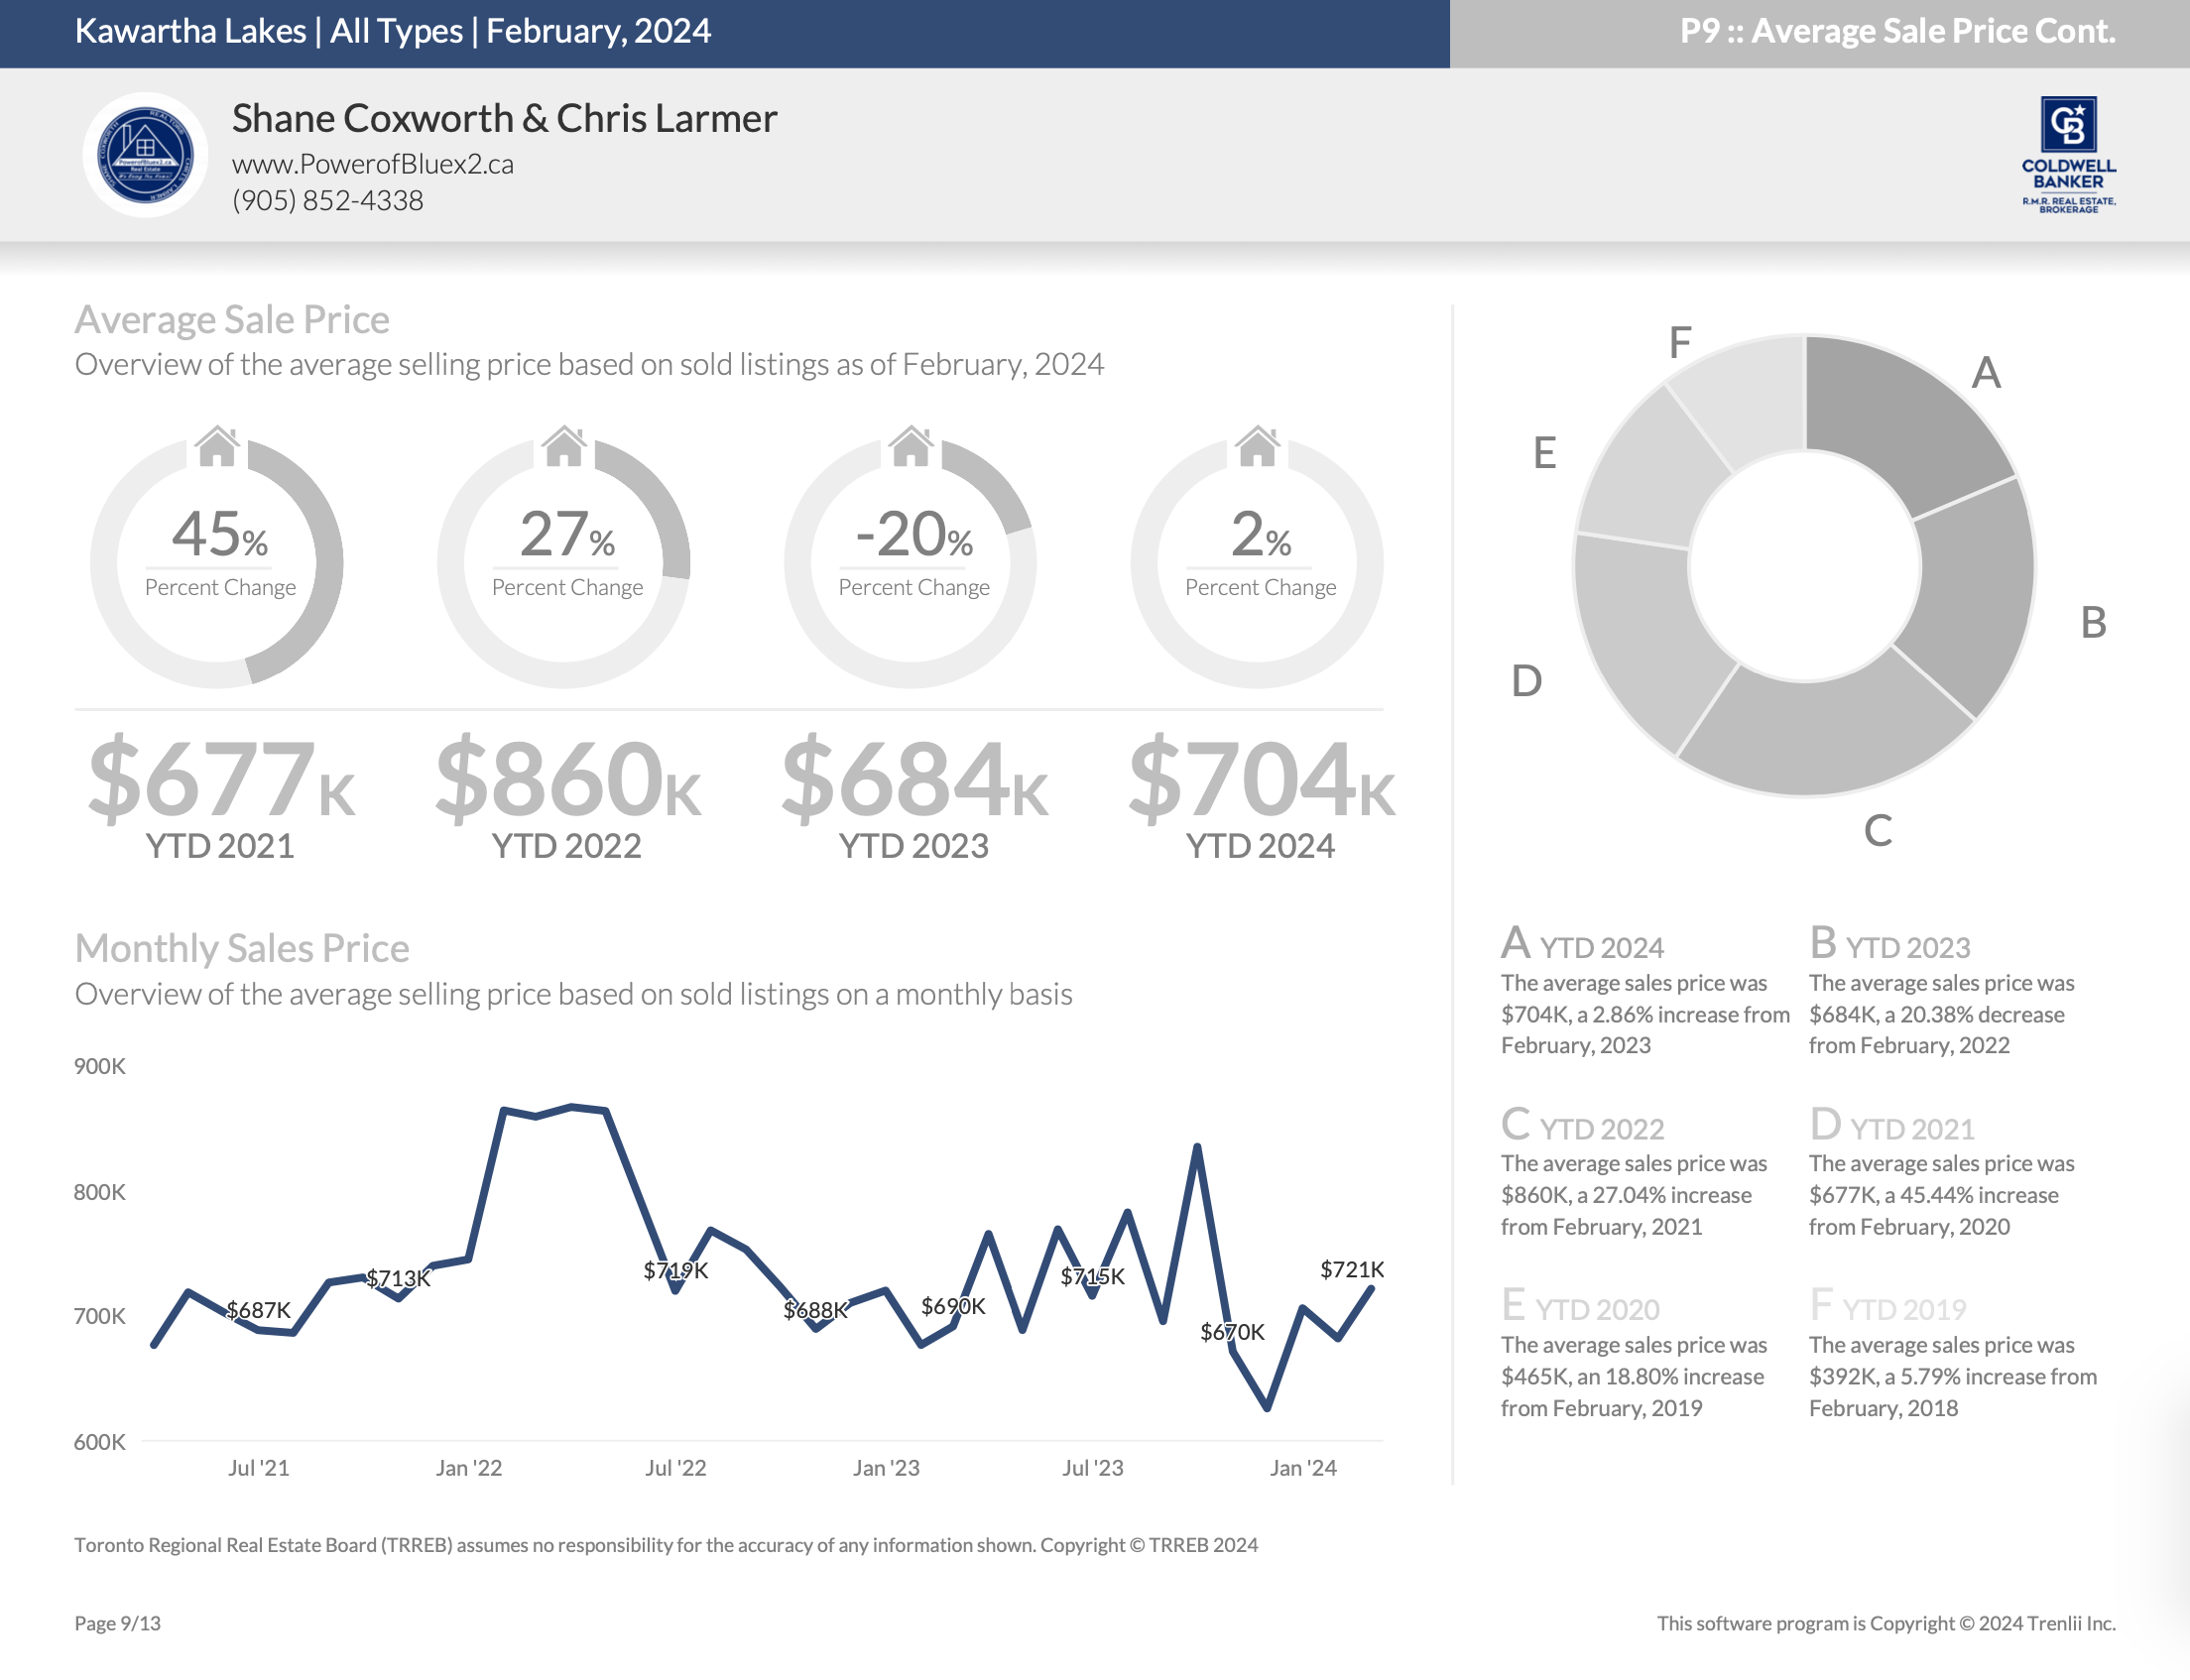
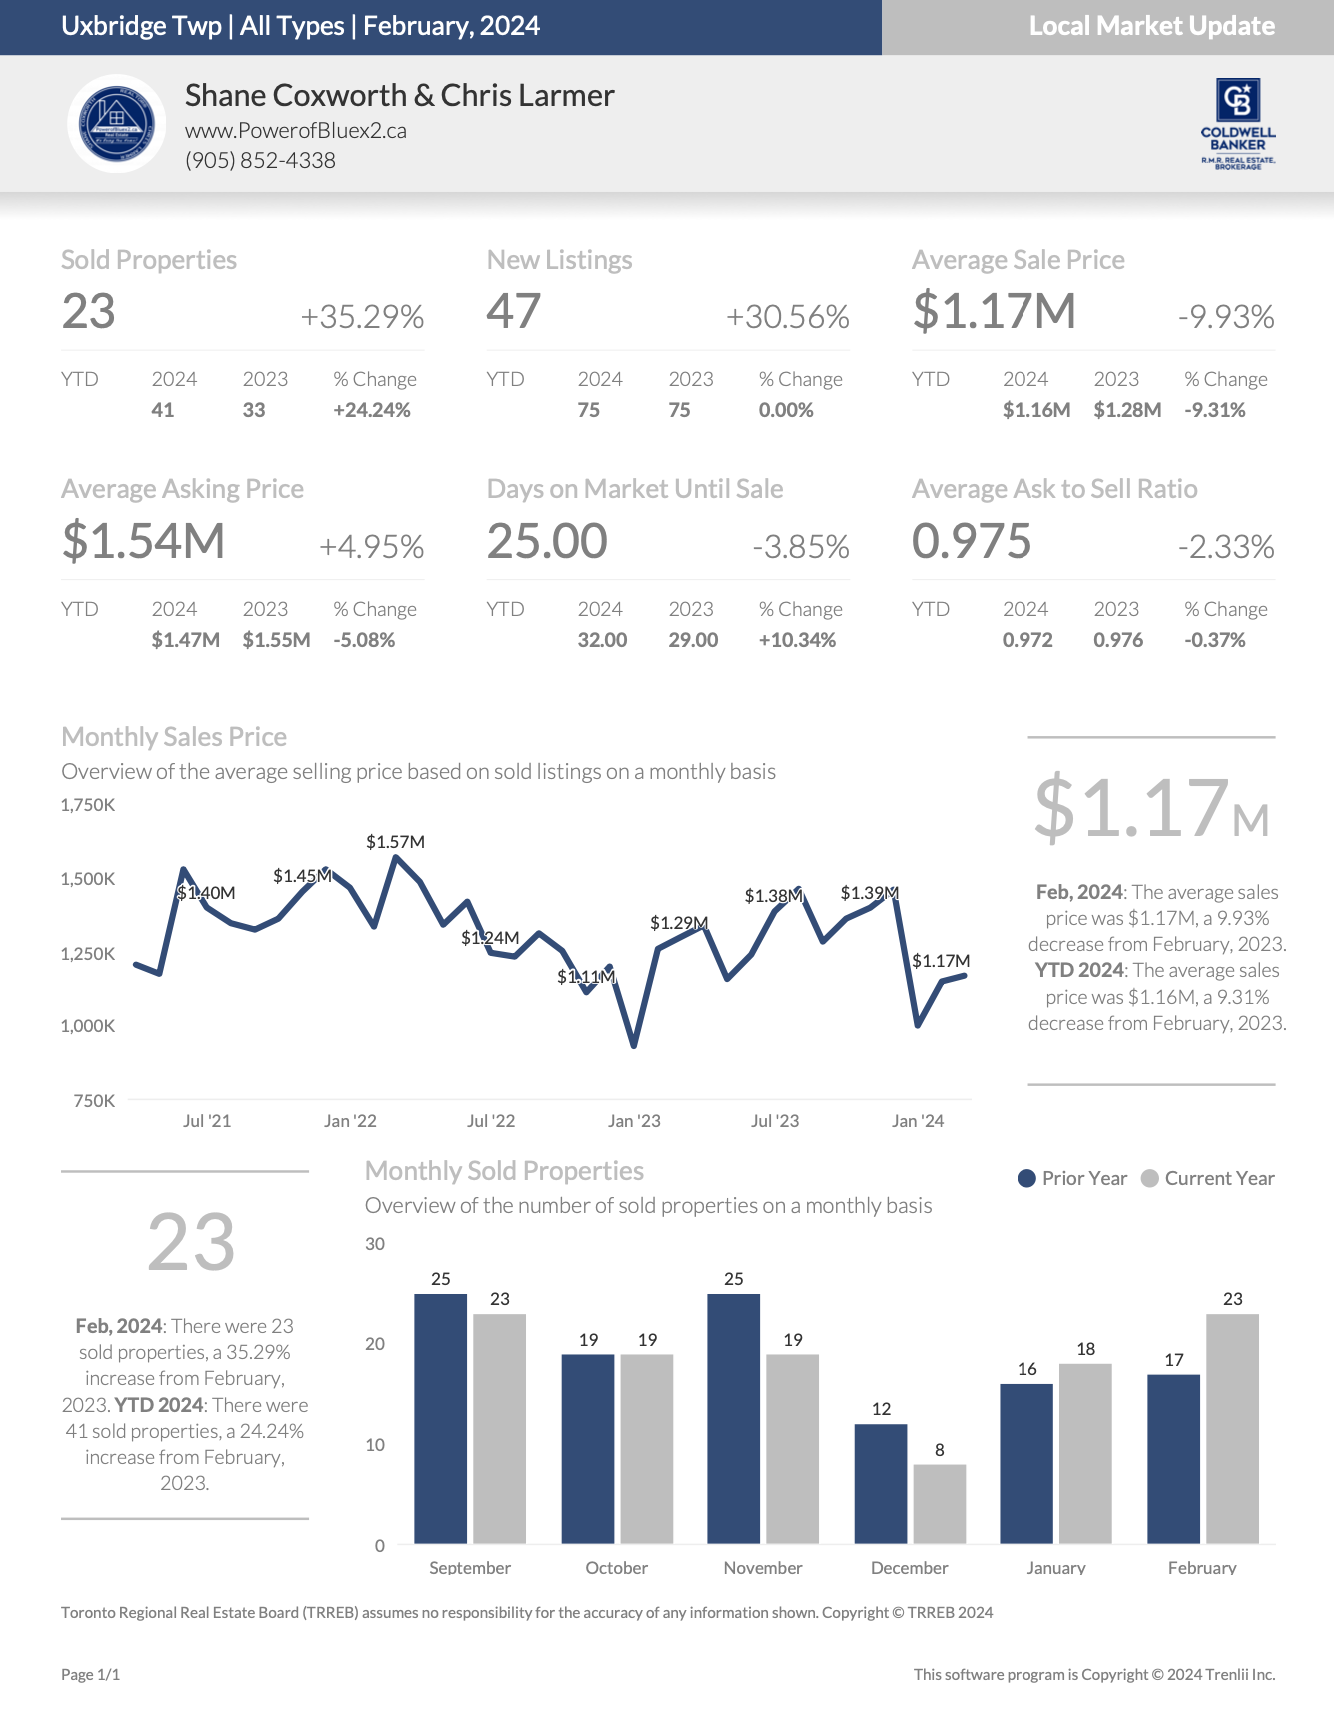
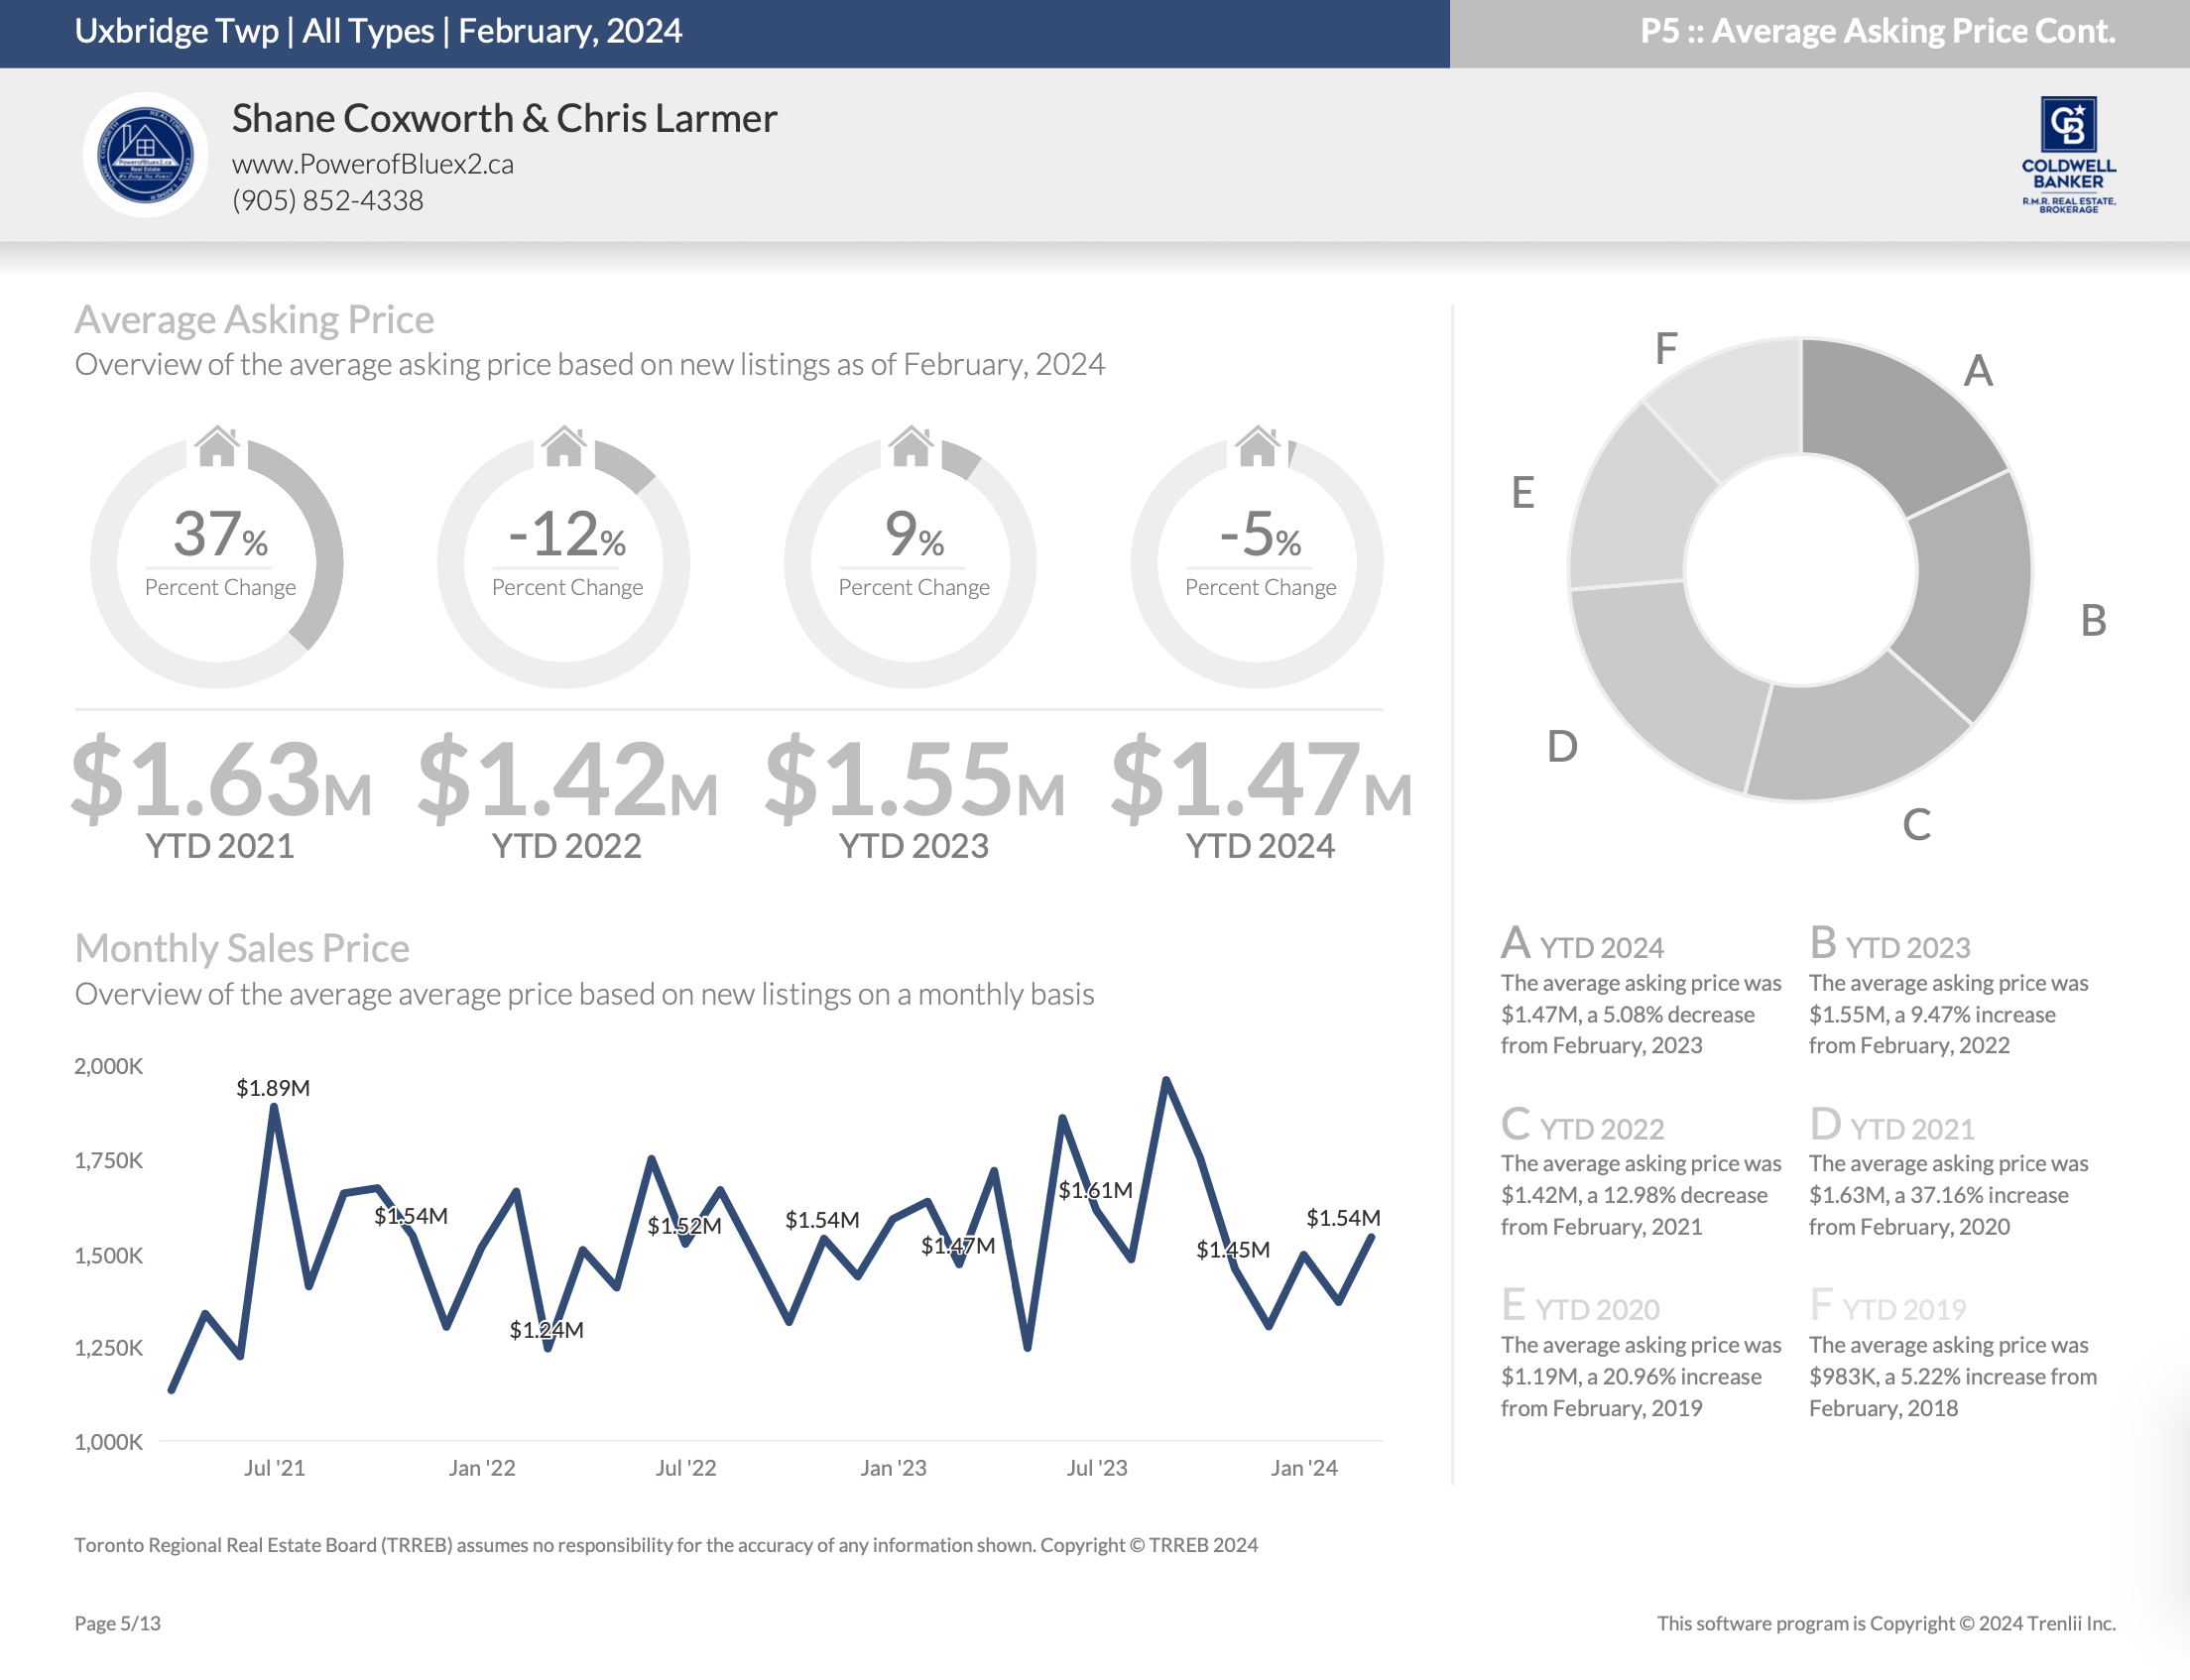
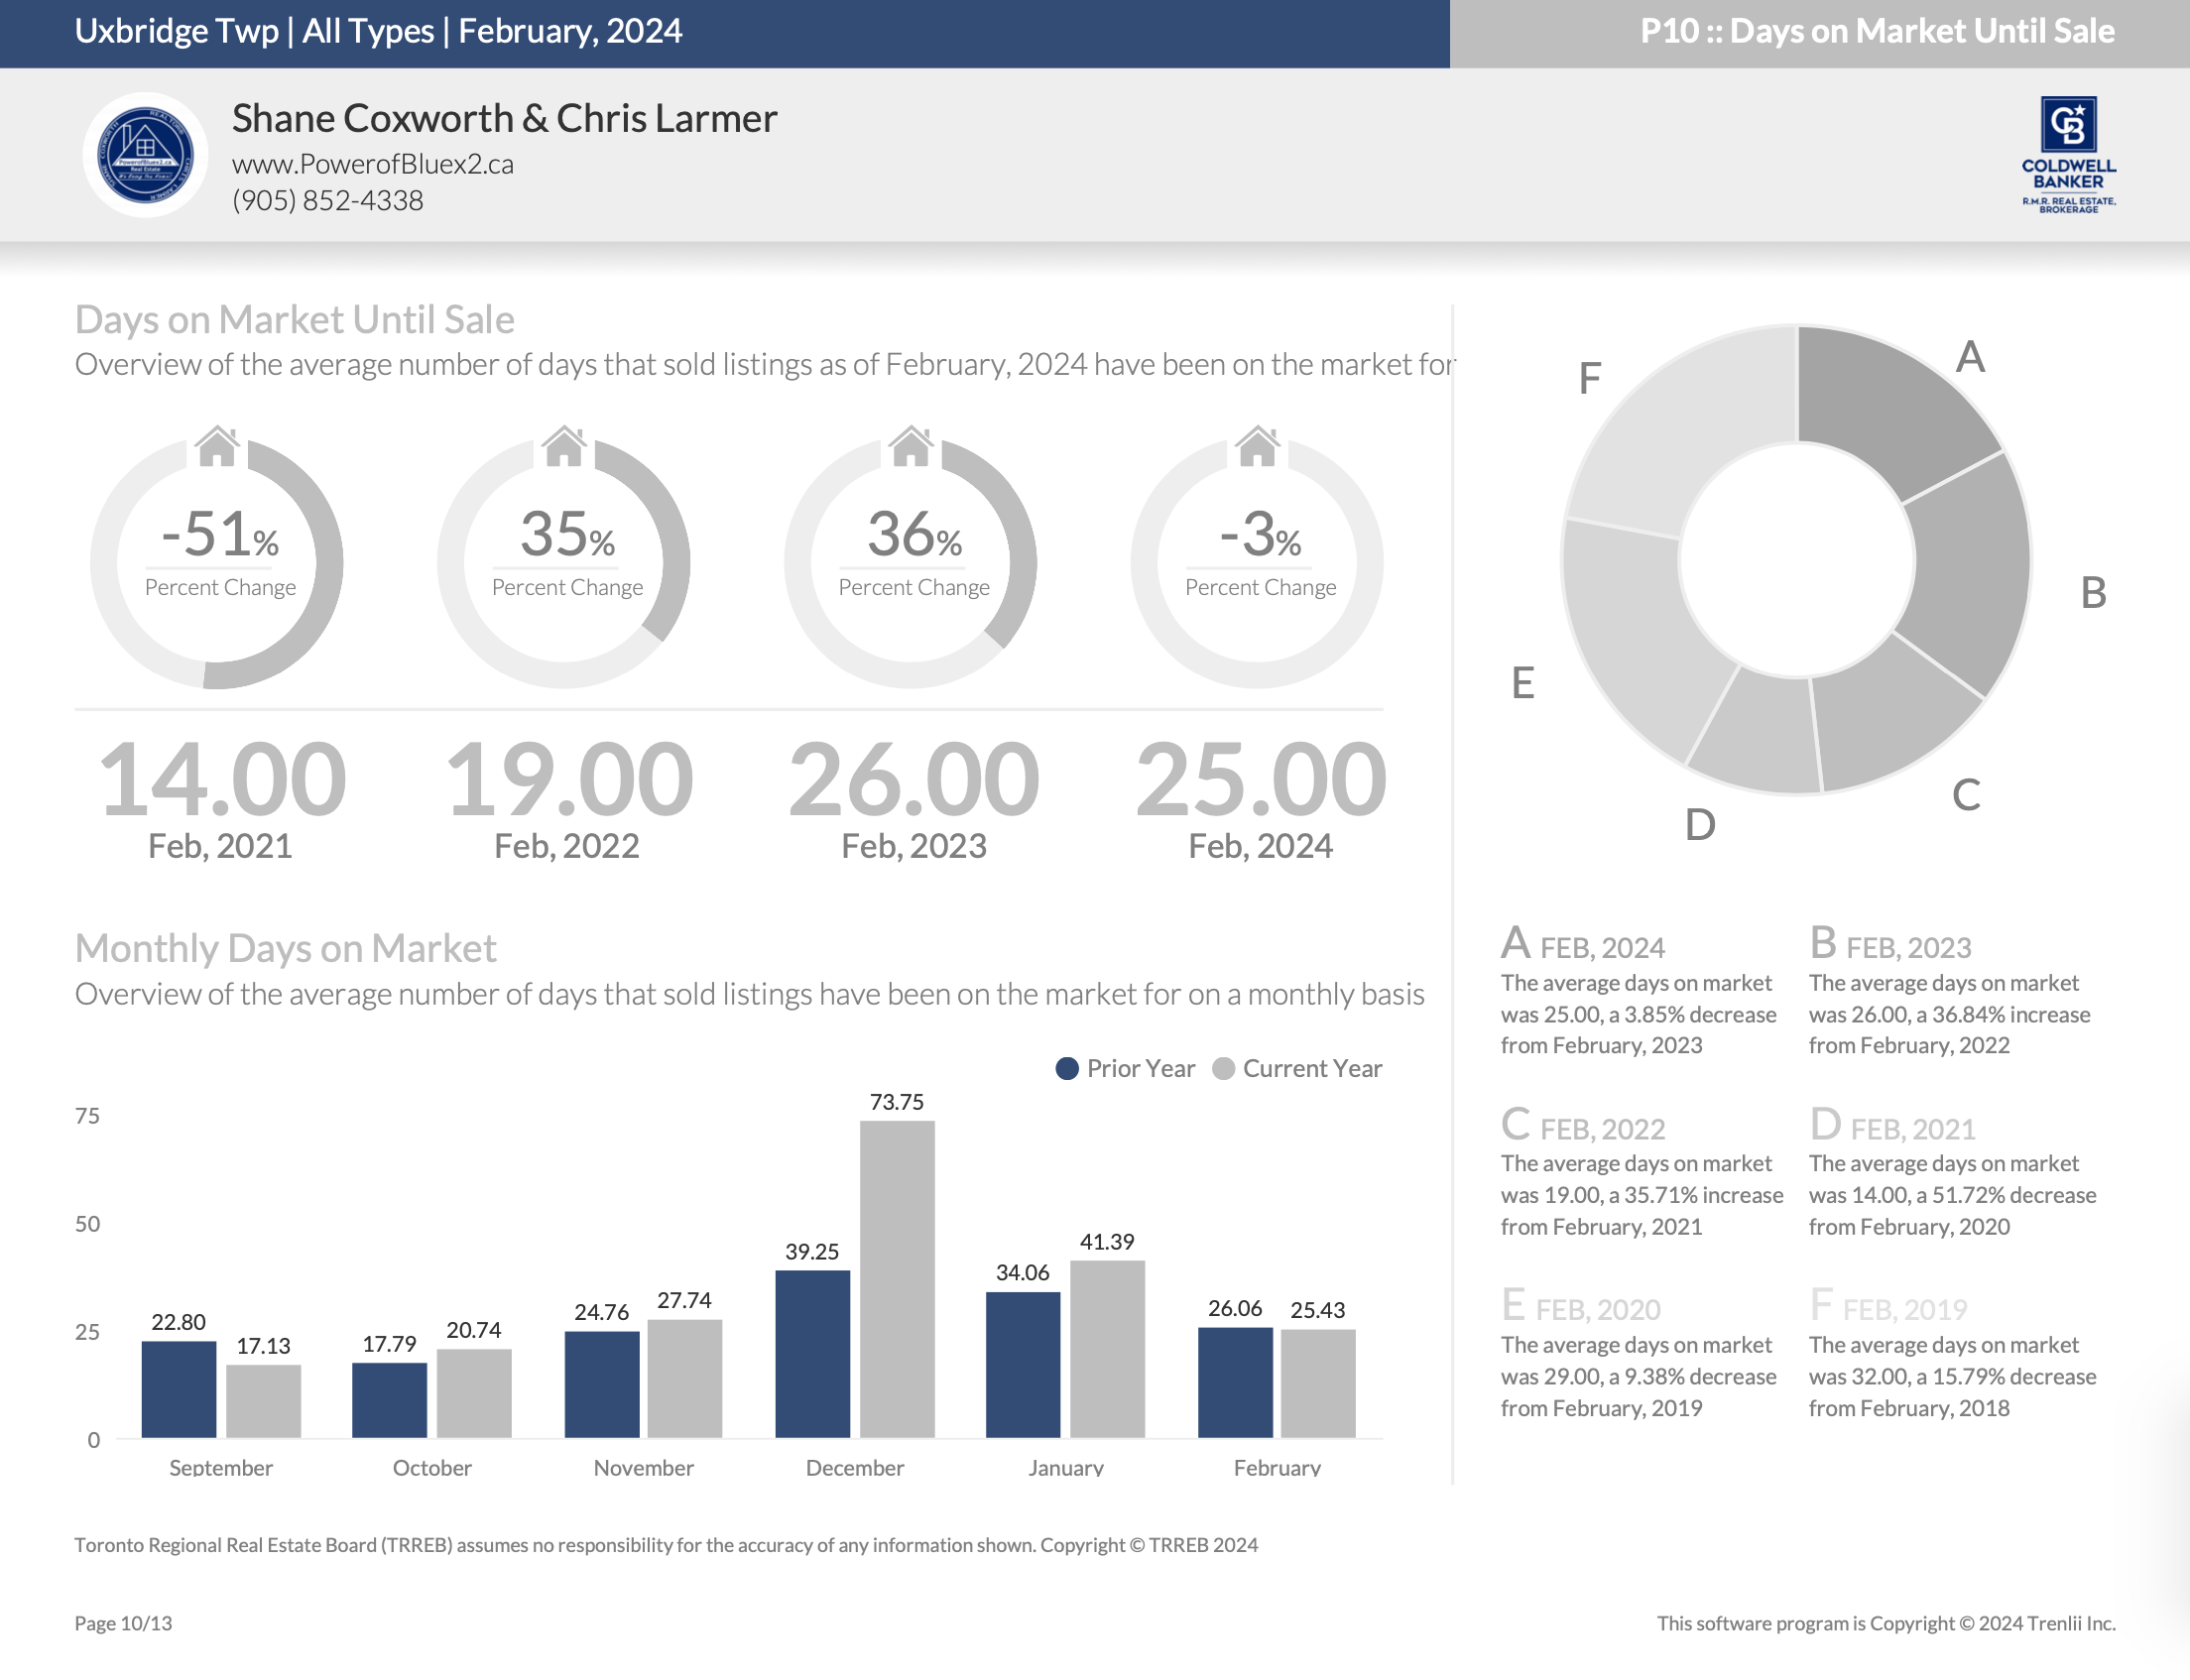
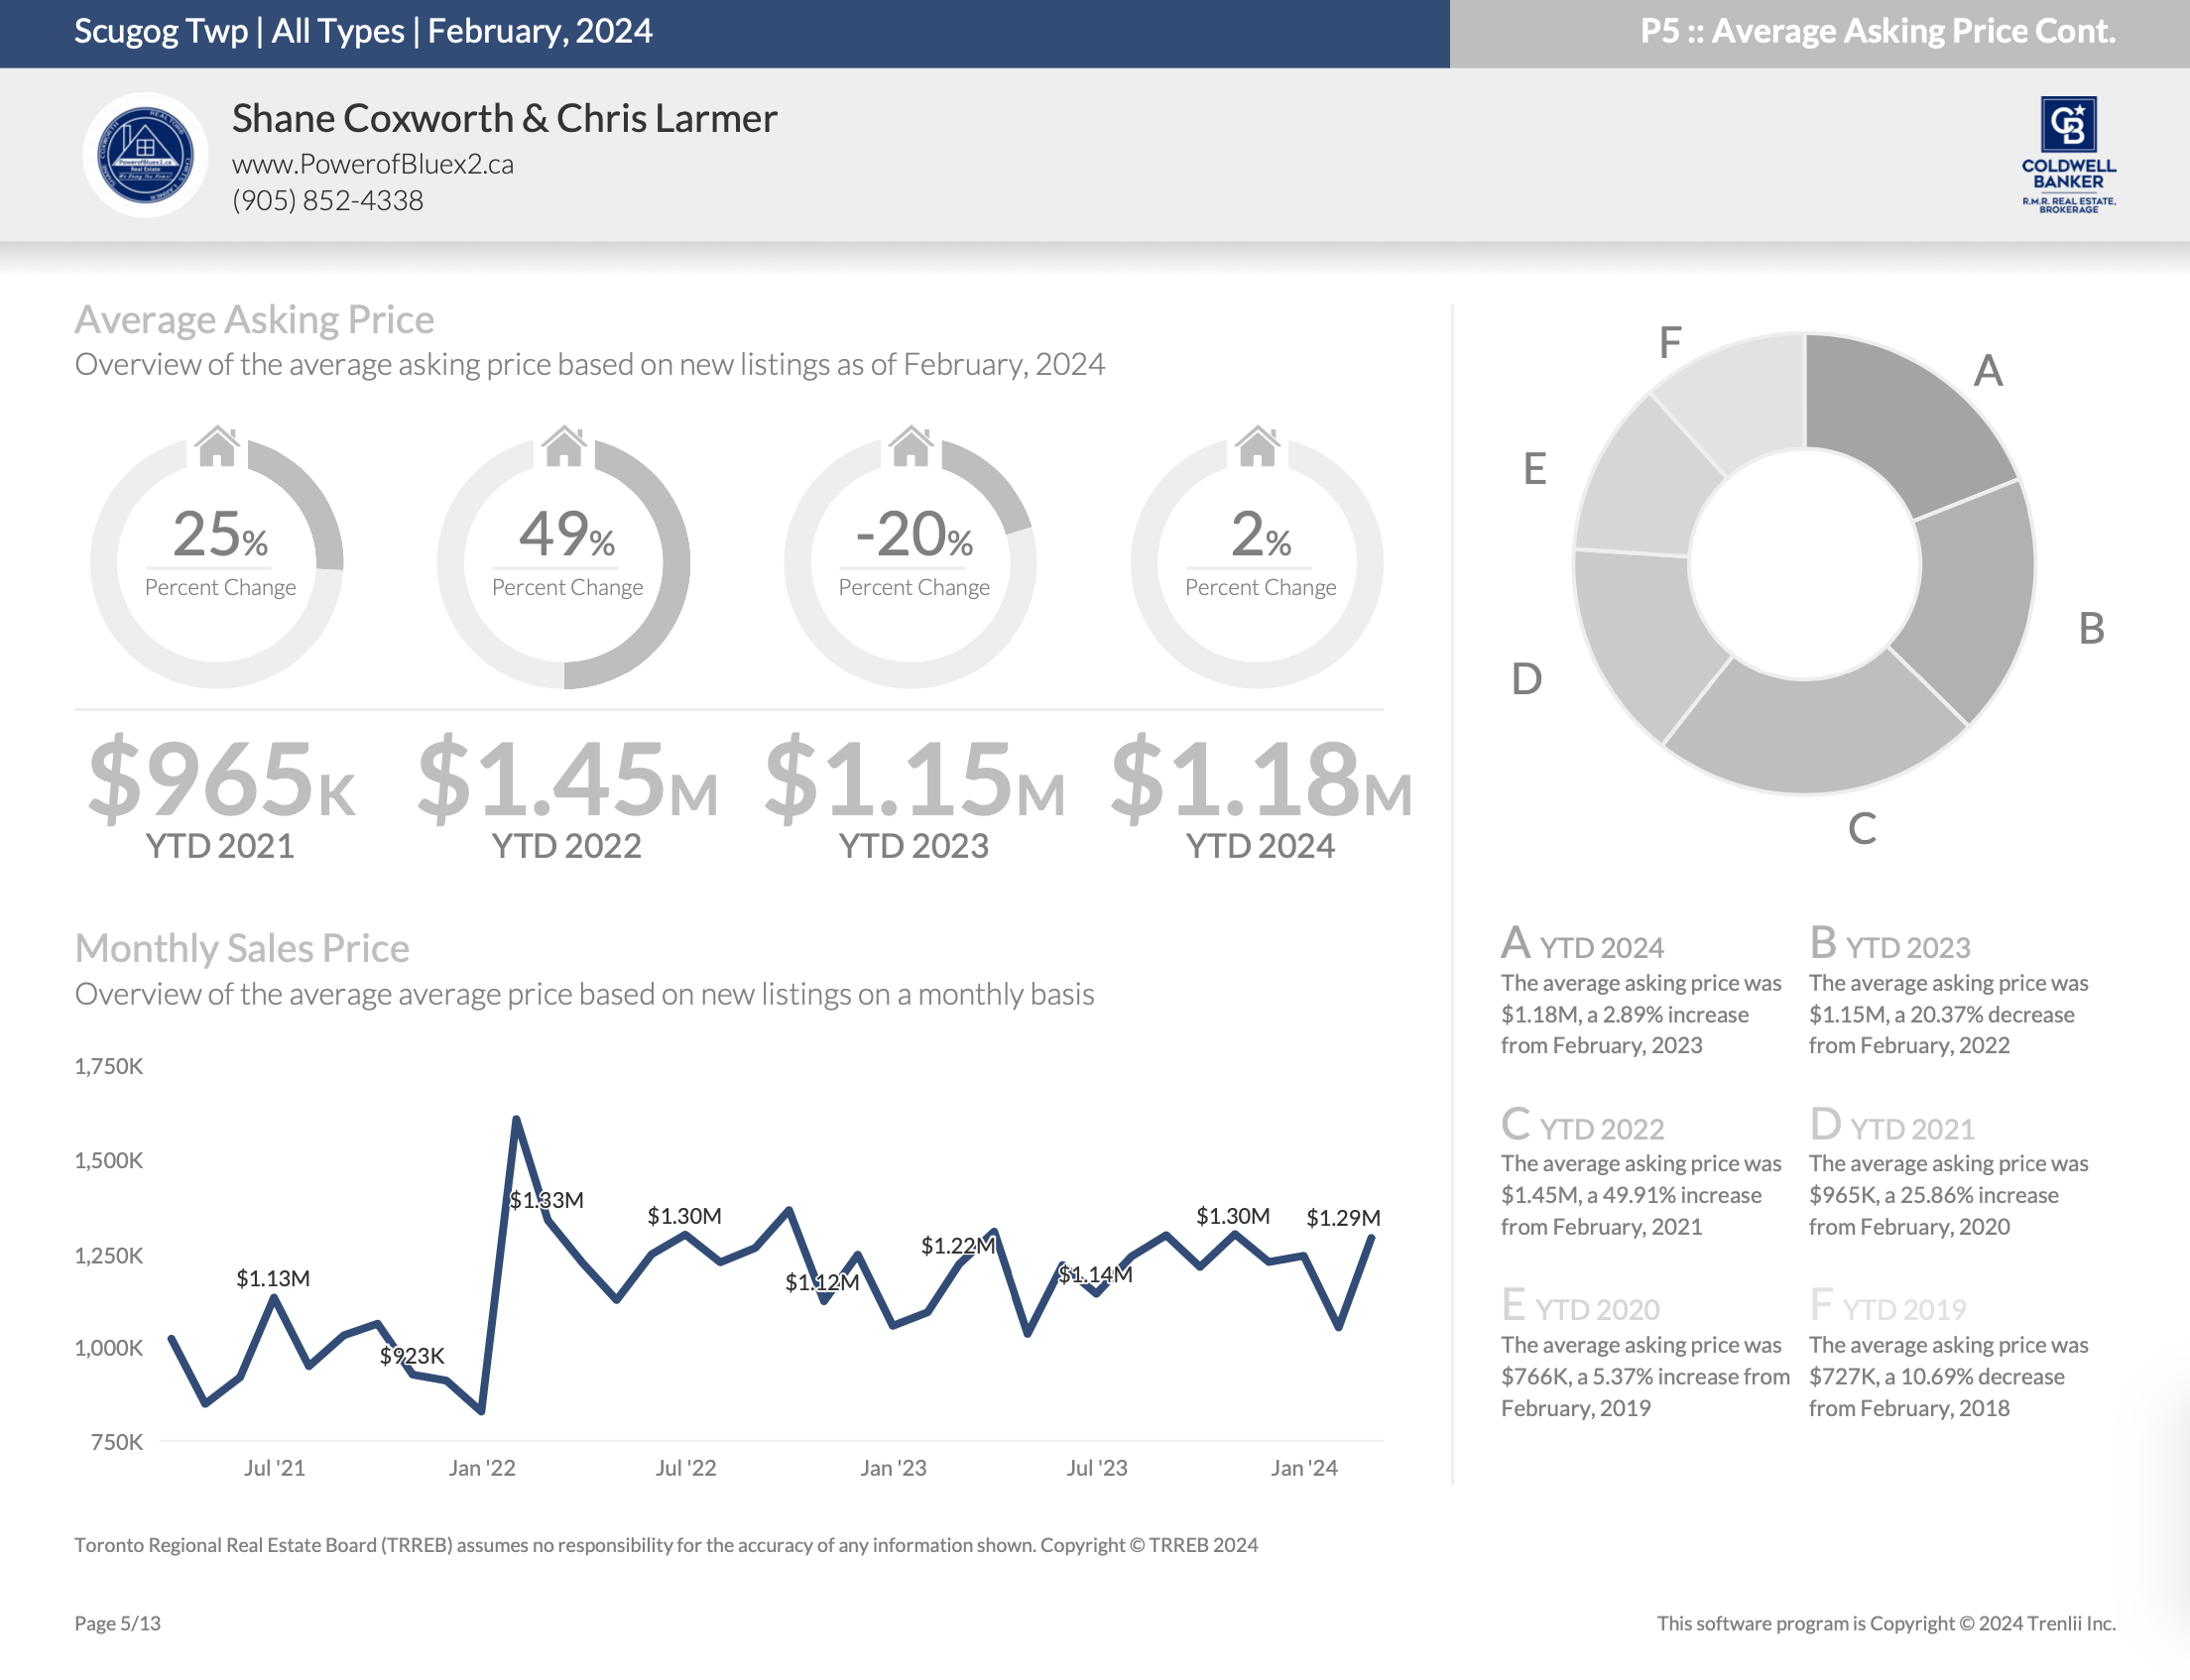
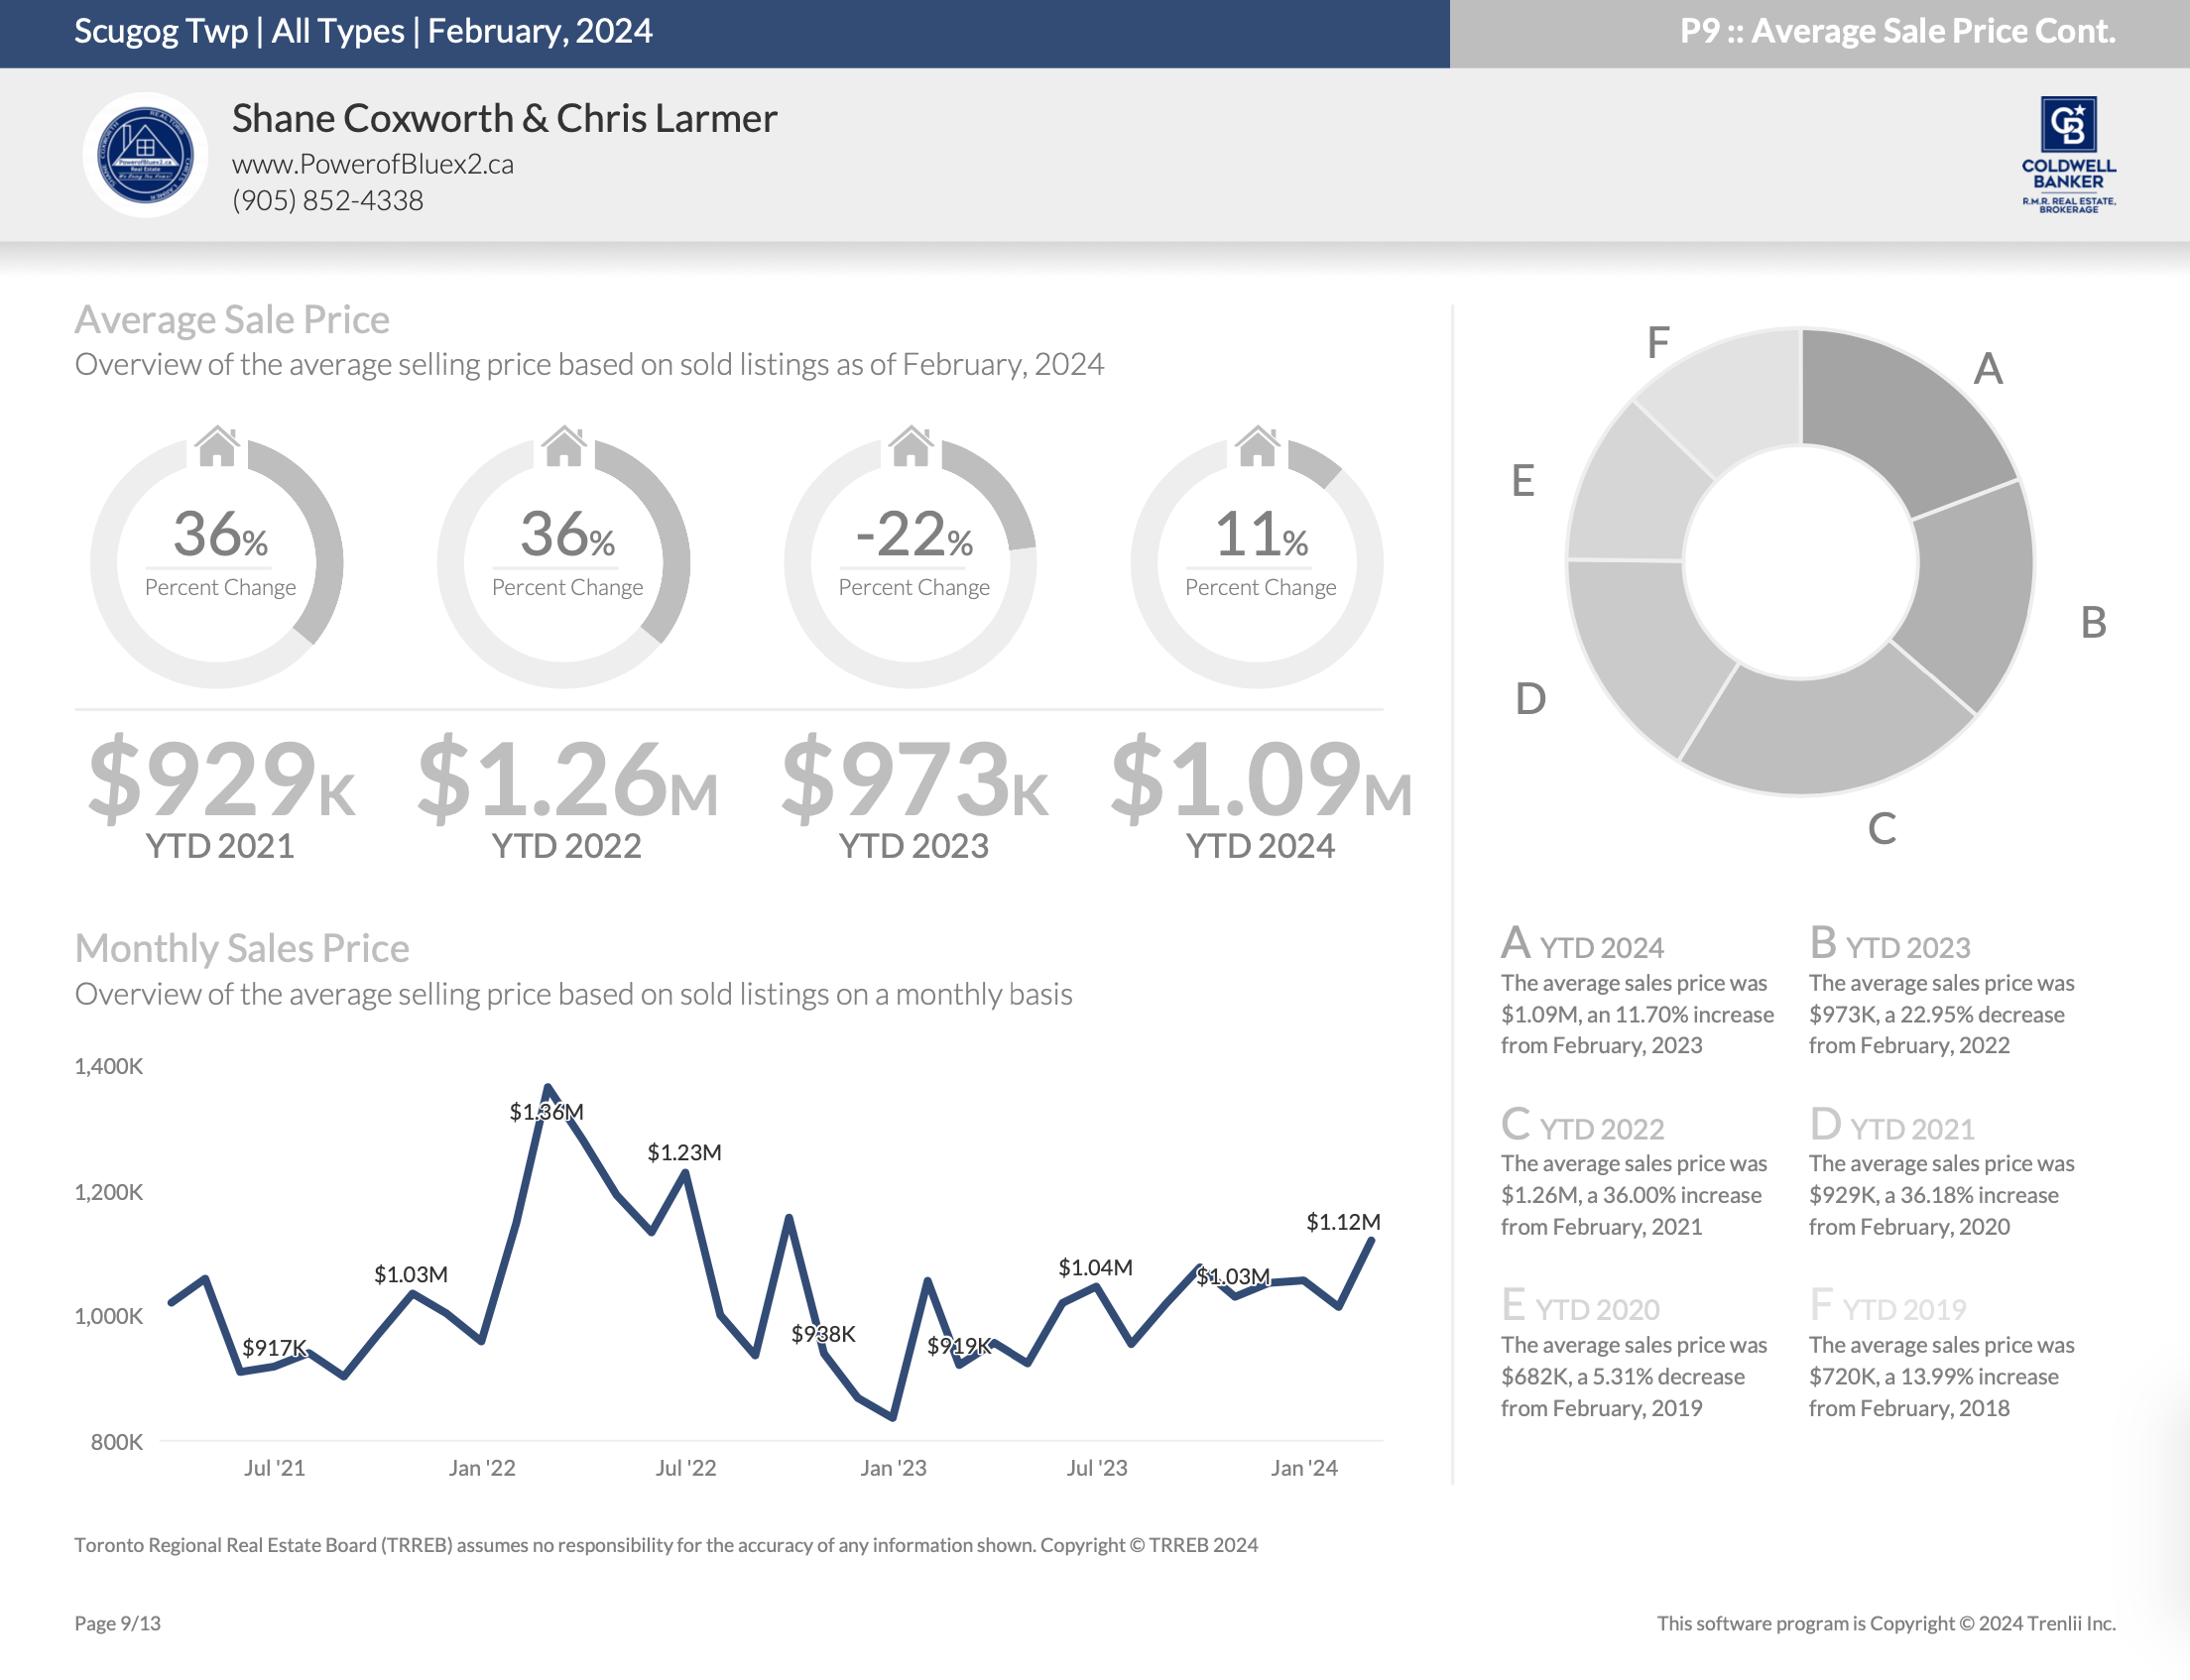
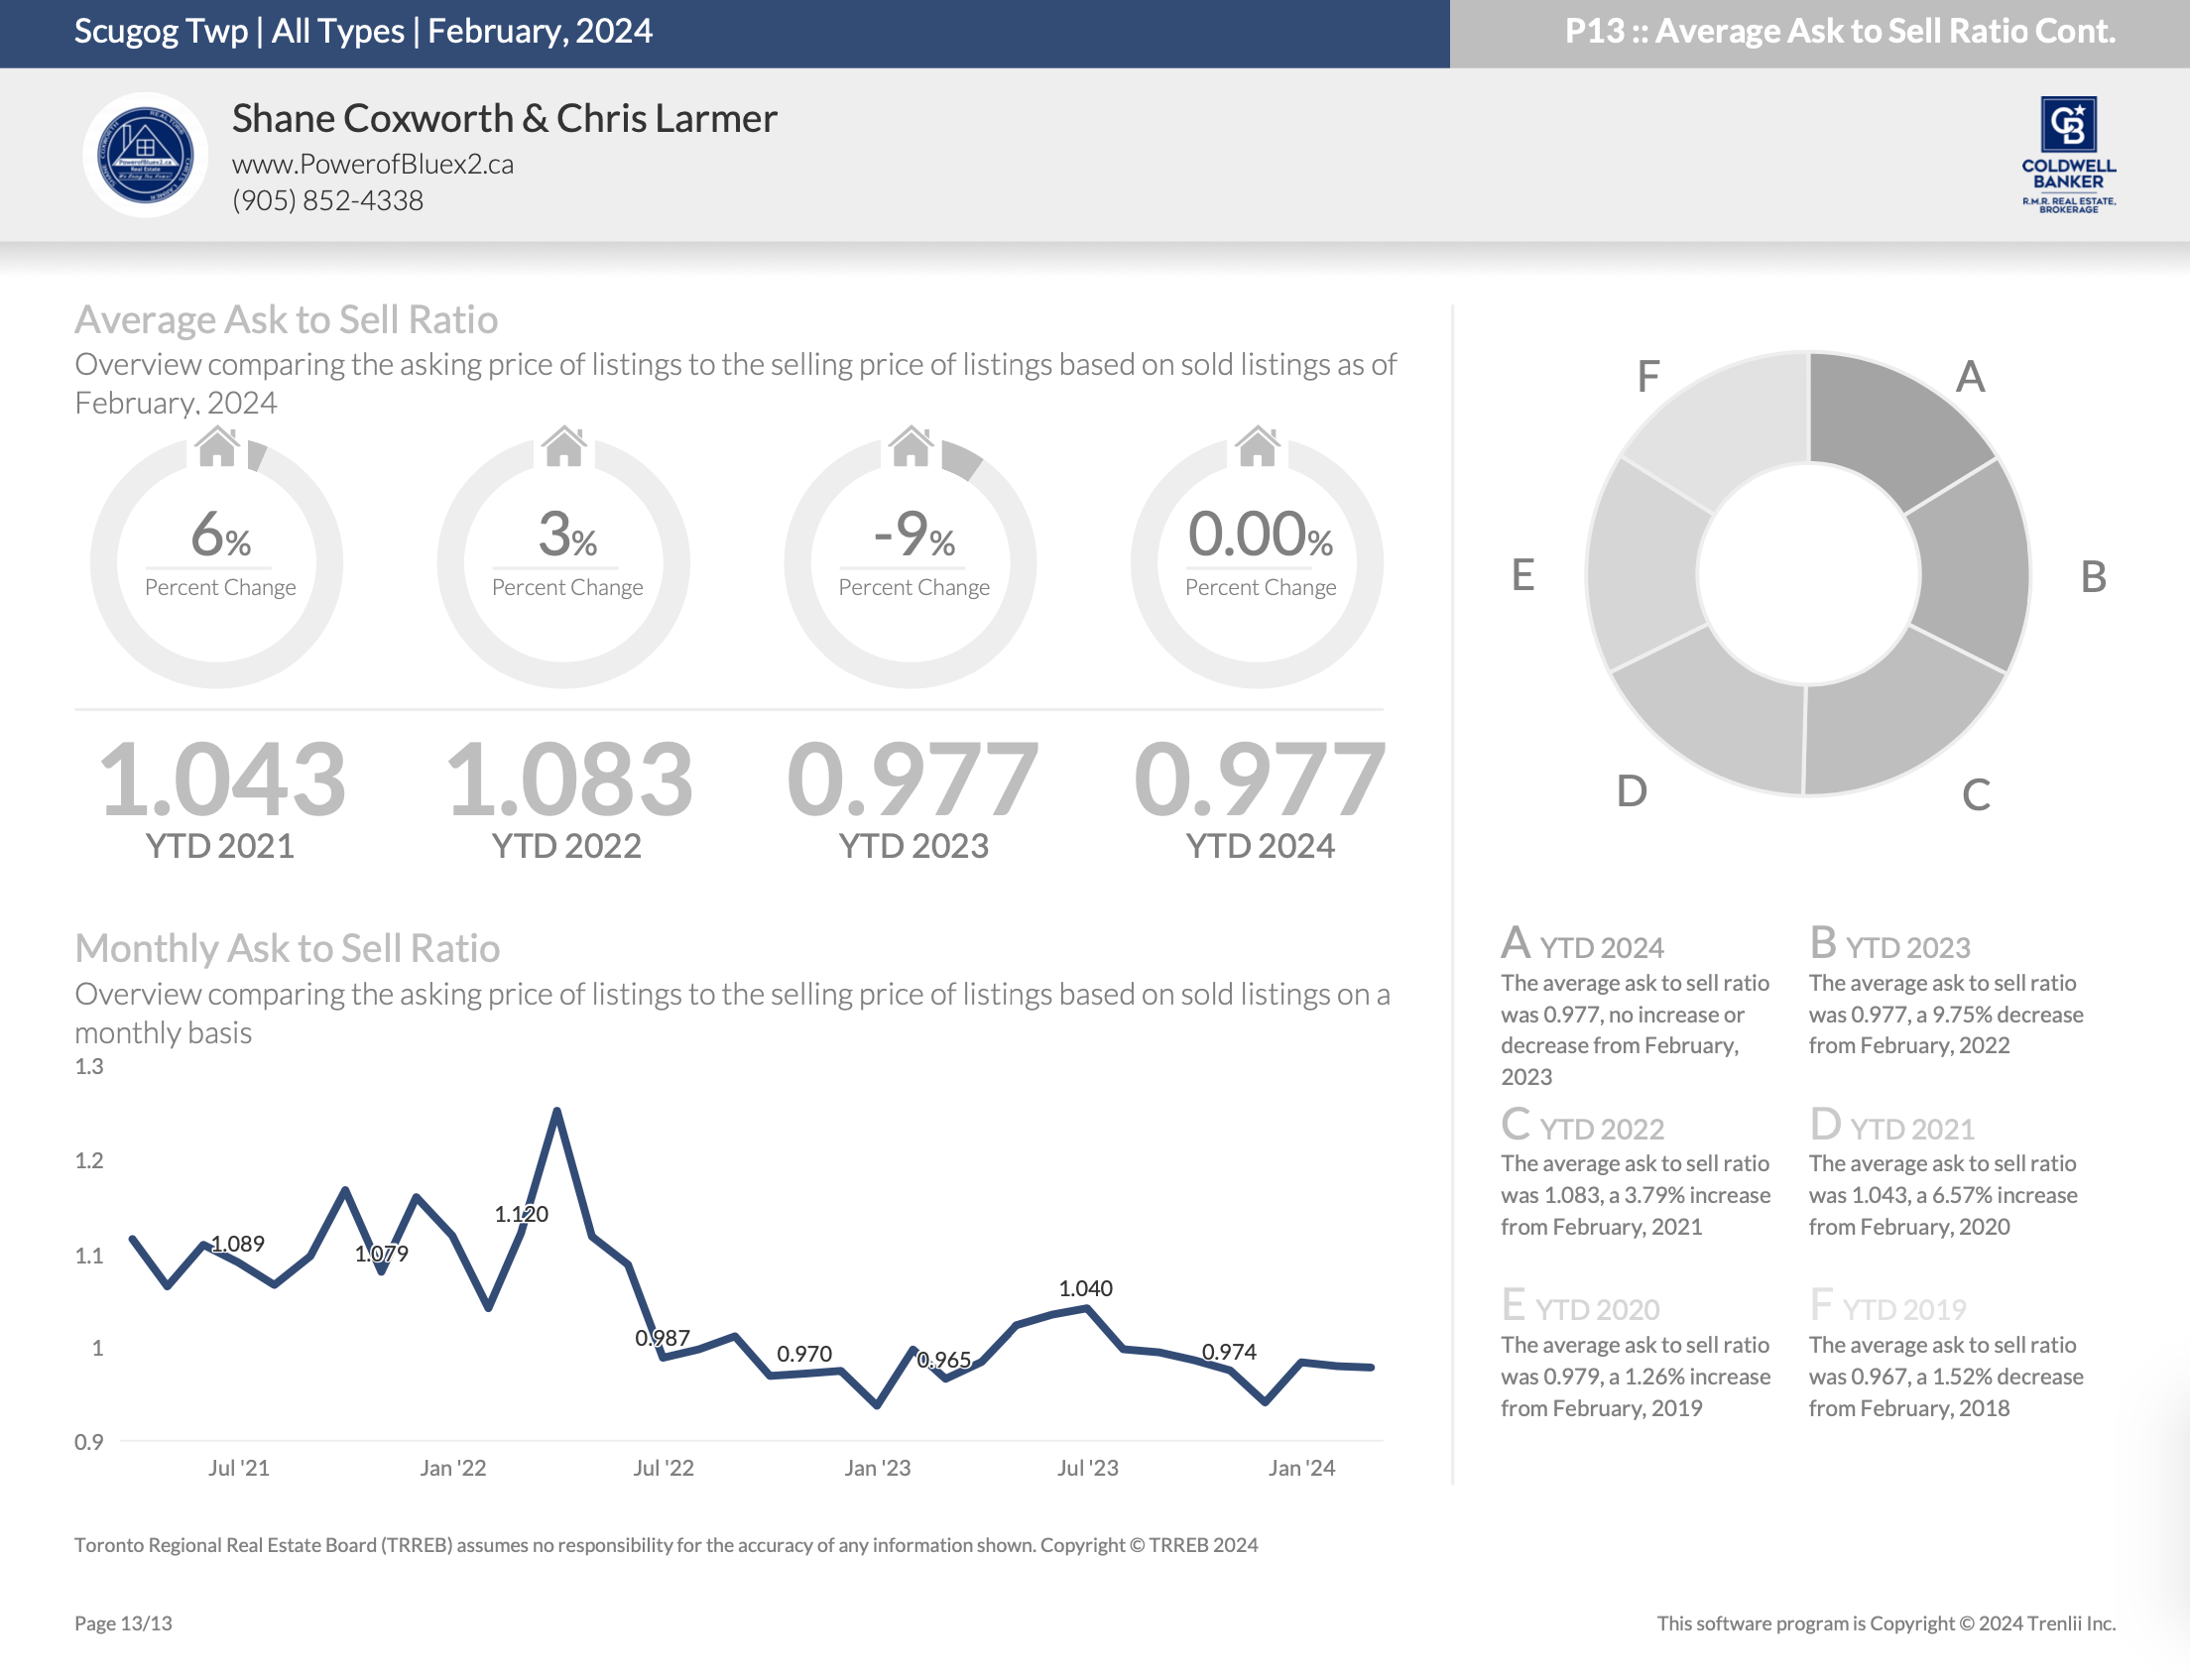
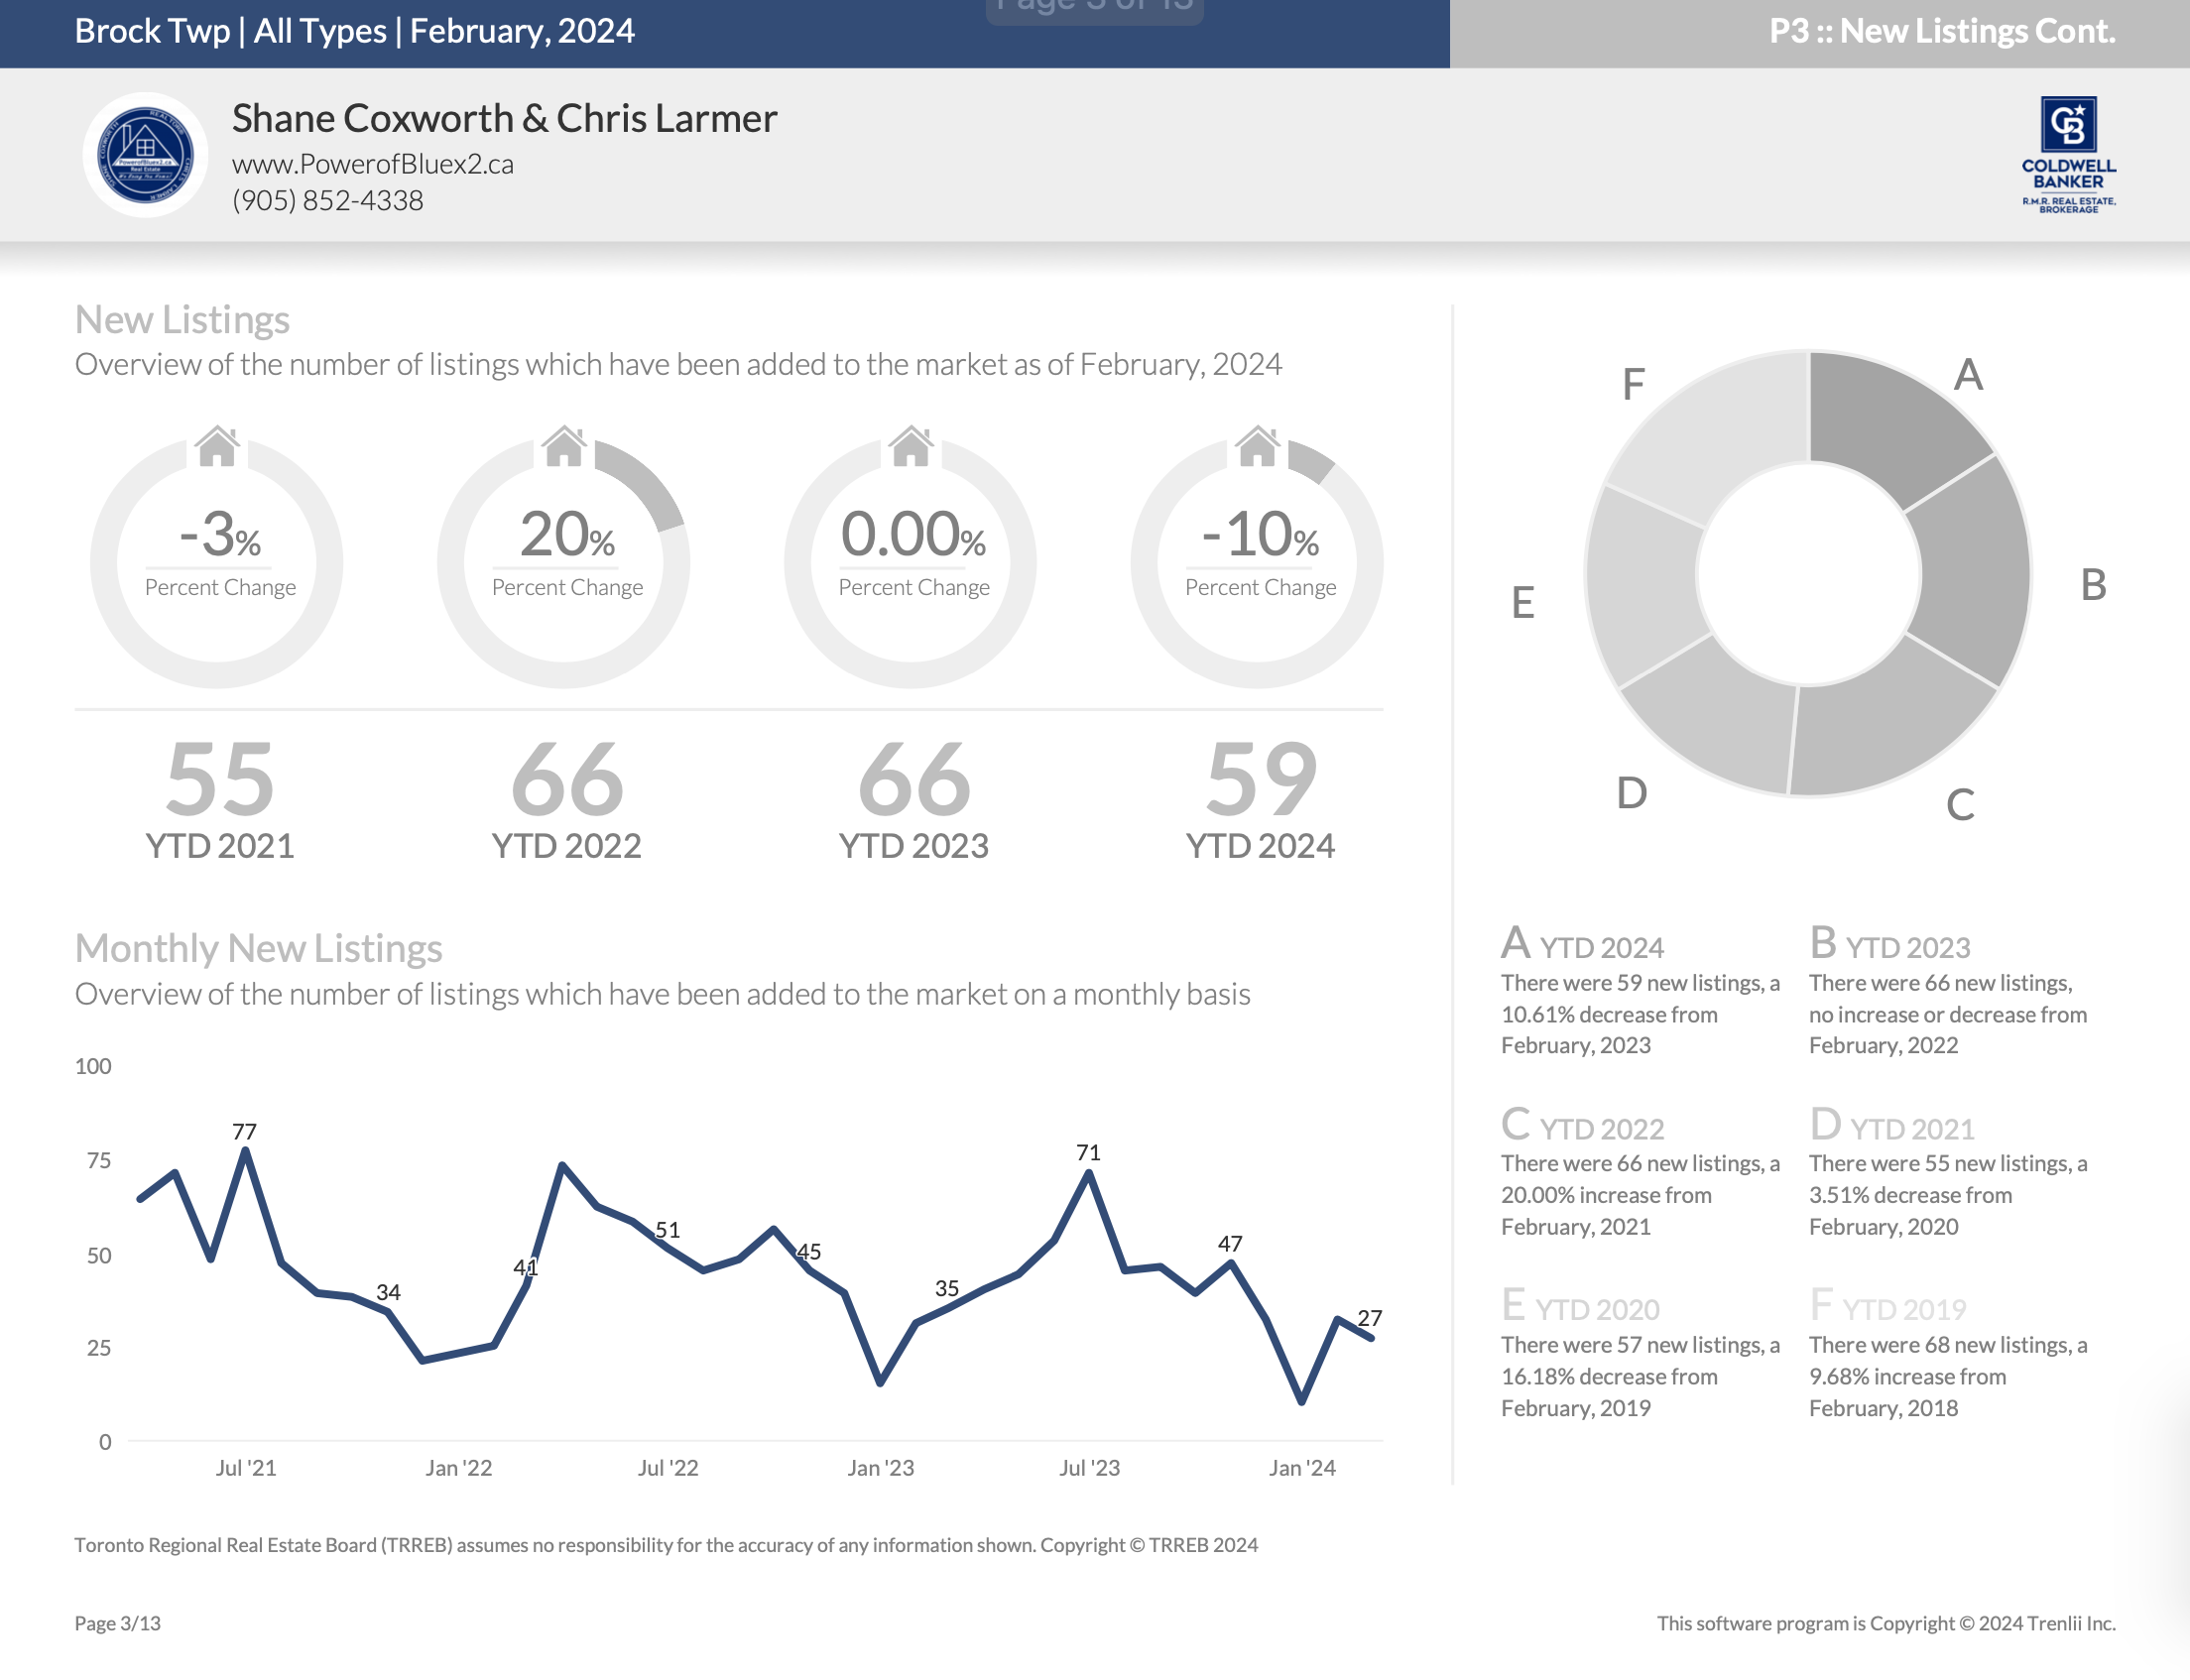
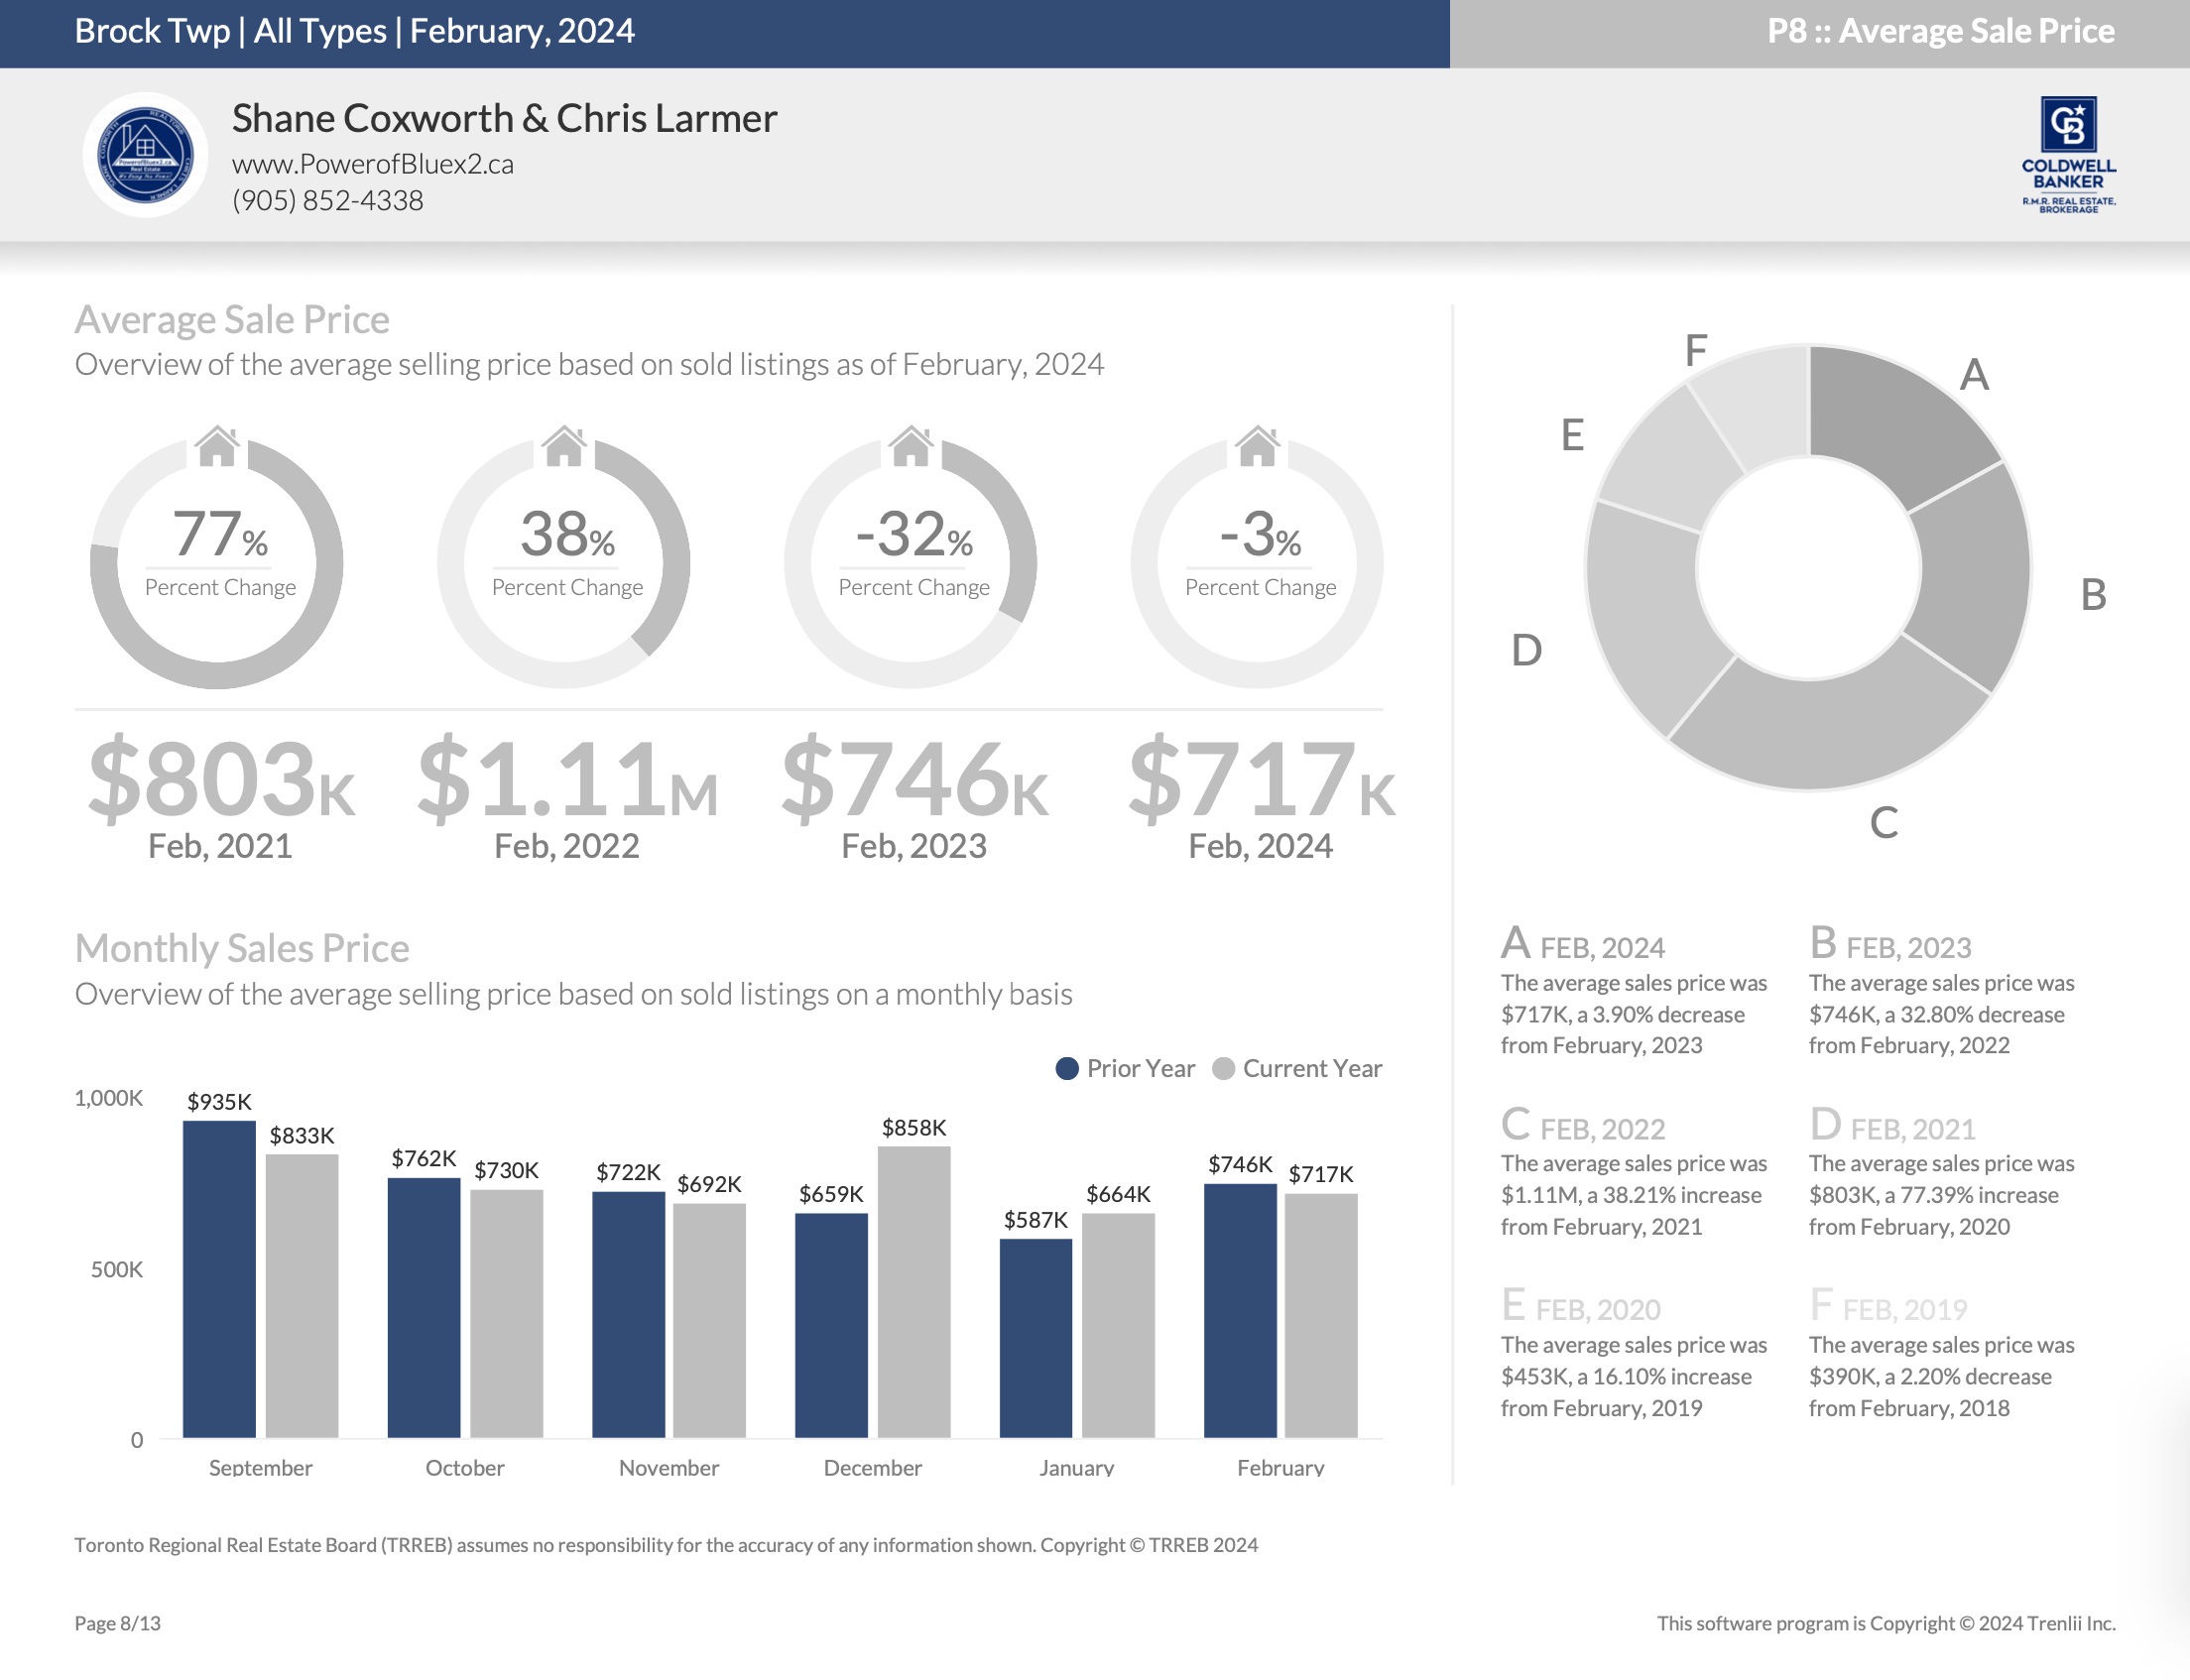
This housing report for Durham Region includes the number of new listings, average list price, number of properties sold, average selling price, average days on market and average asking price to selling price ratio for all property types within the Region of Durham.
Scroll to the bottom for links to take you to the housing market reports for Uxbridge, Scugog, Brock and the Kawartha Lakes.
From Toronto Regional Real Estate Board
Toronto Regional Real Estate Board – Market Stats At A Glance – February 2024
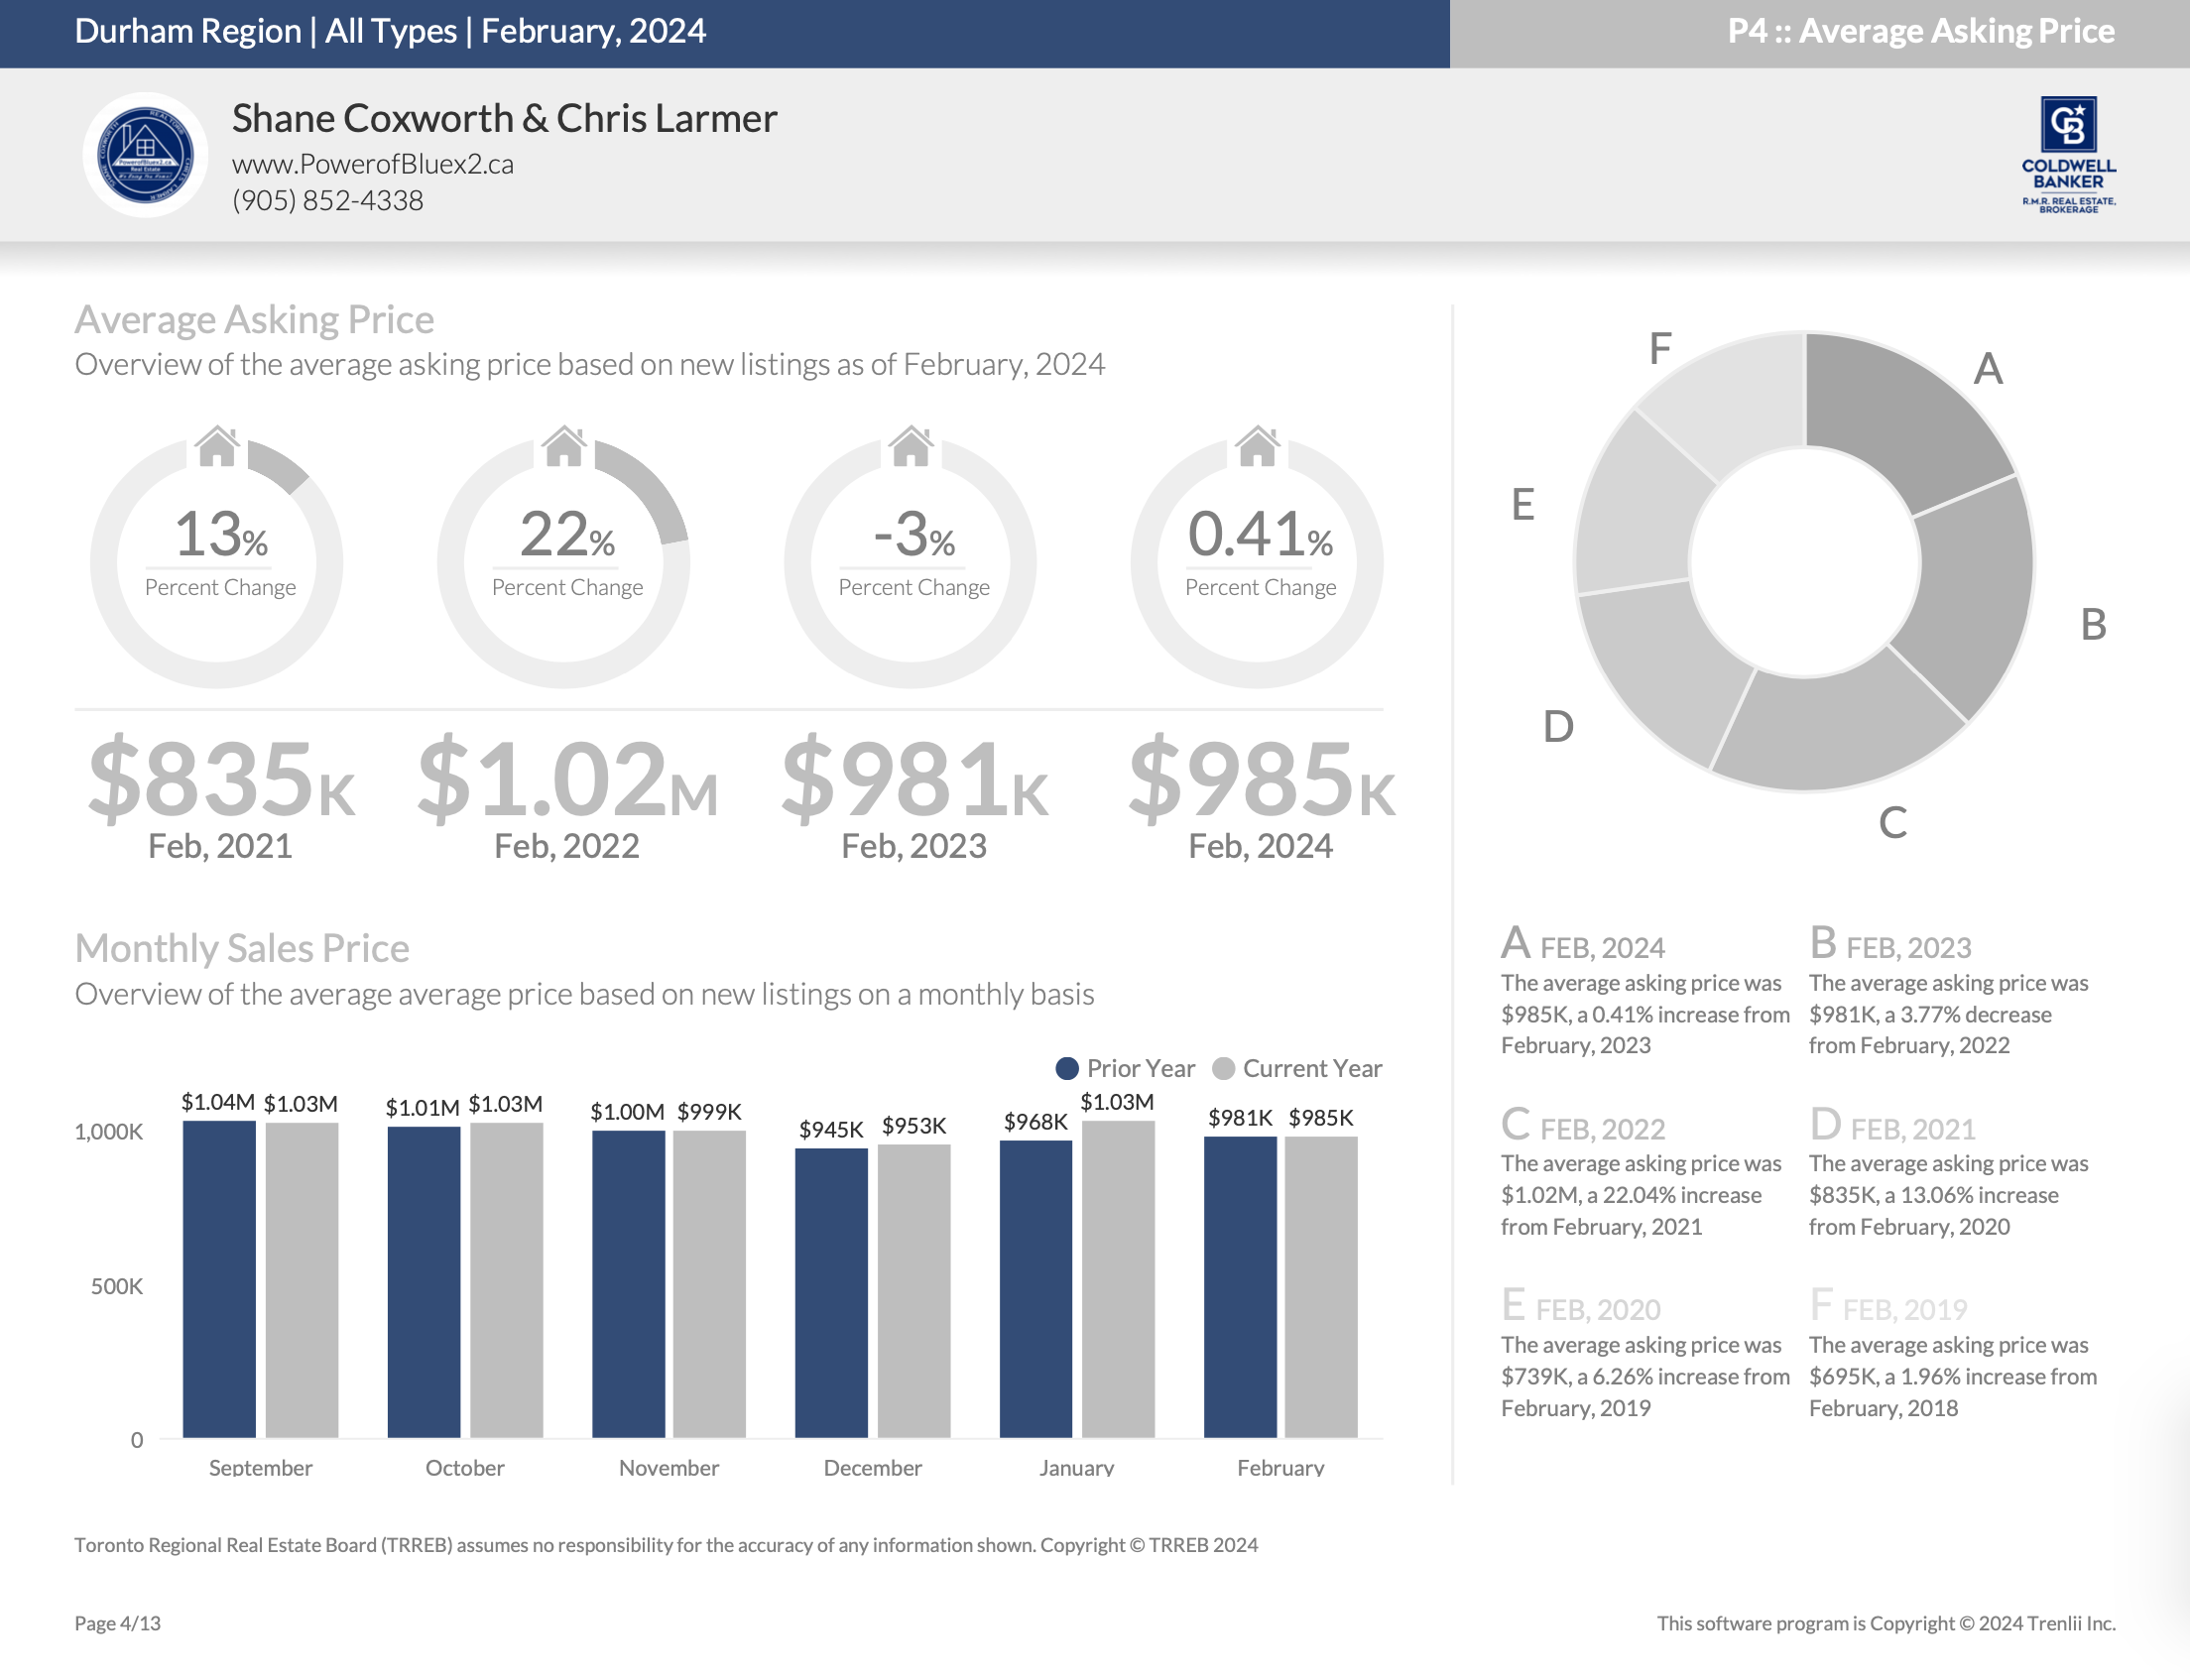
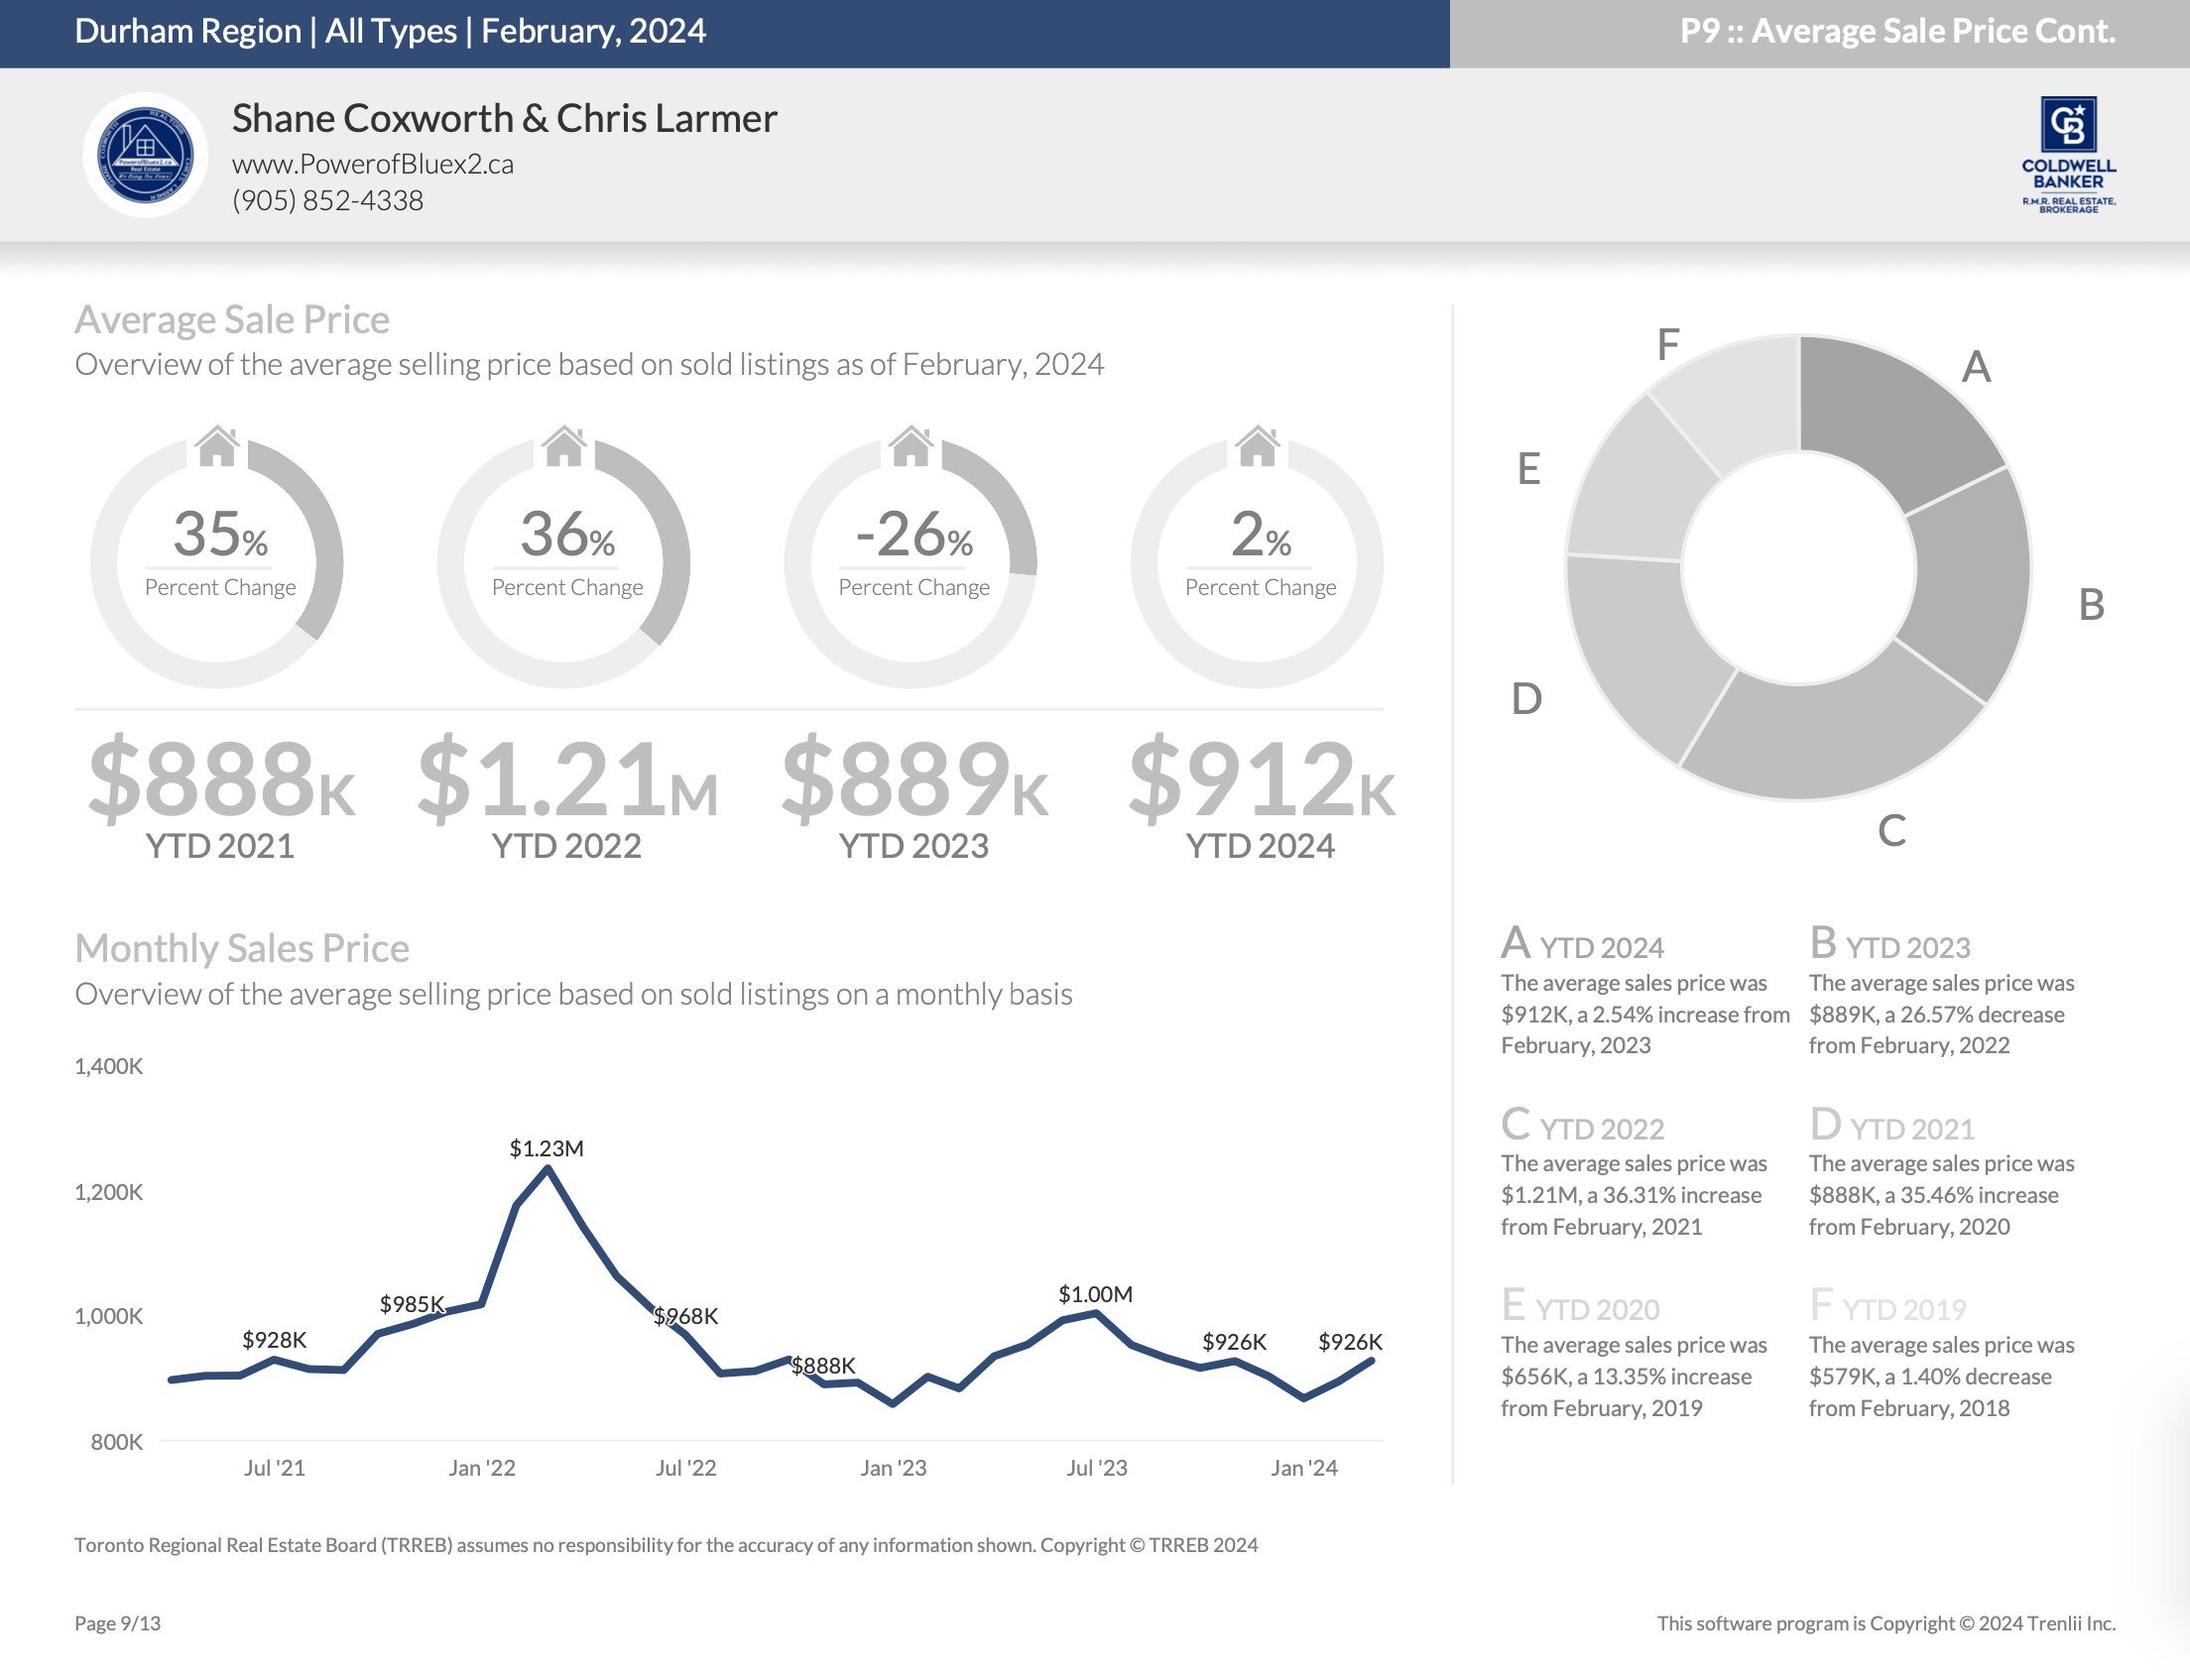
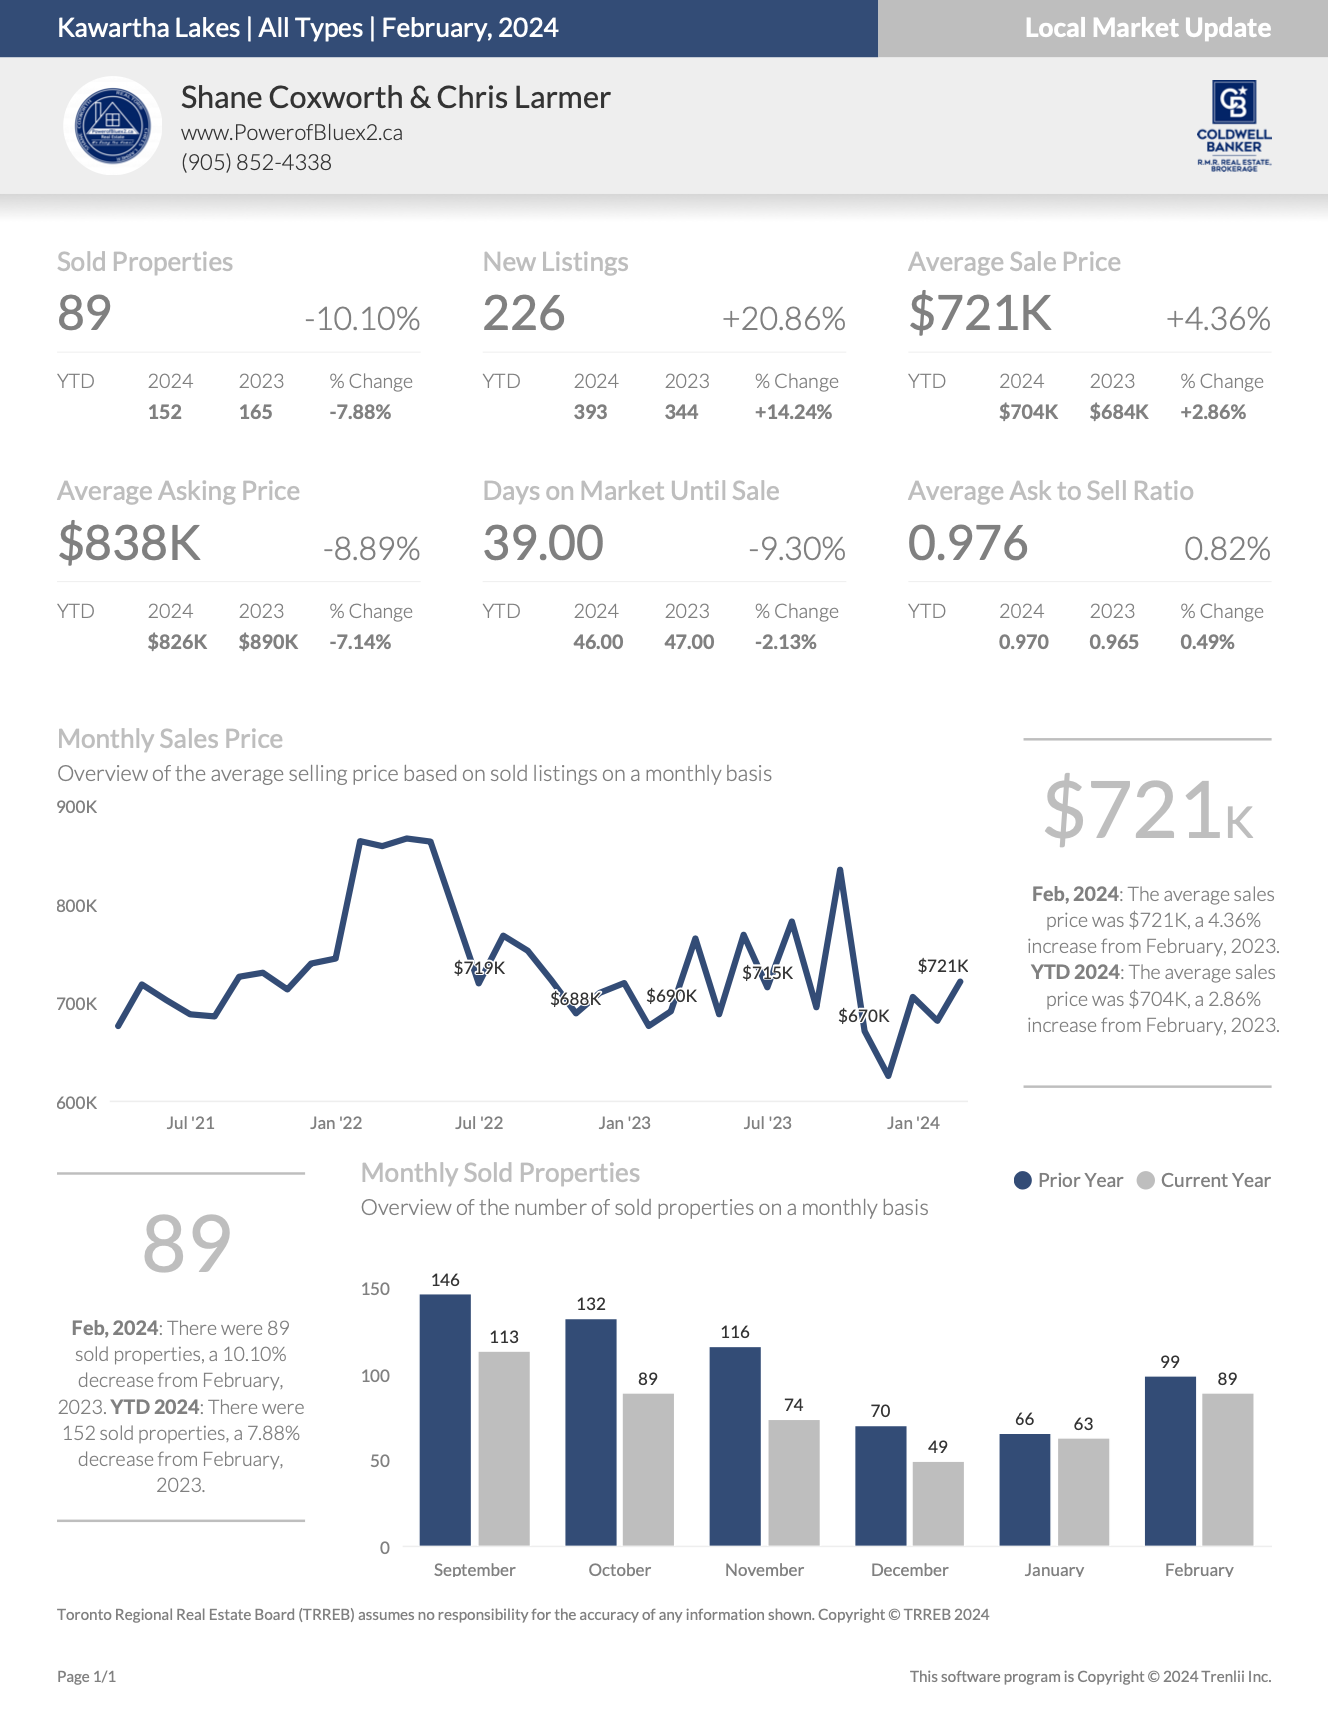
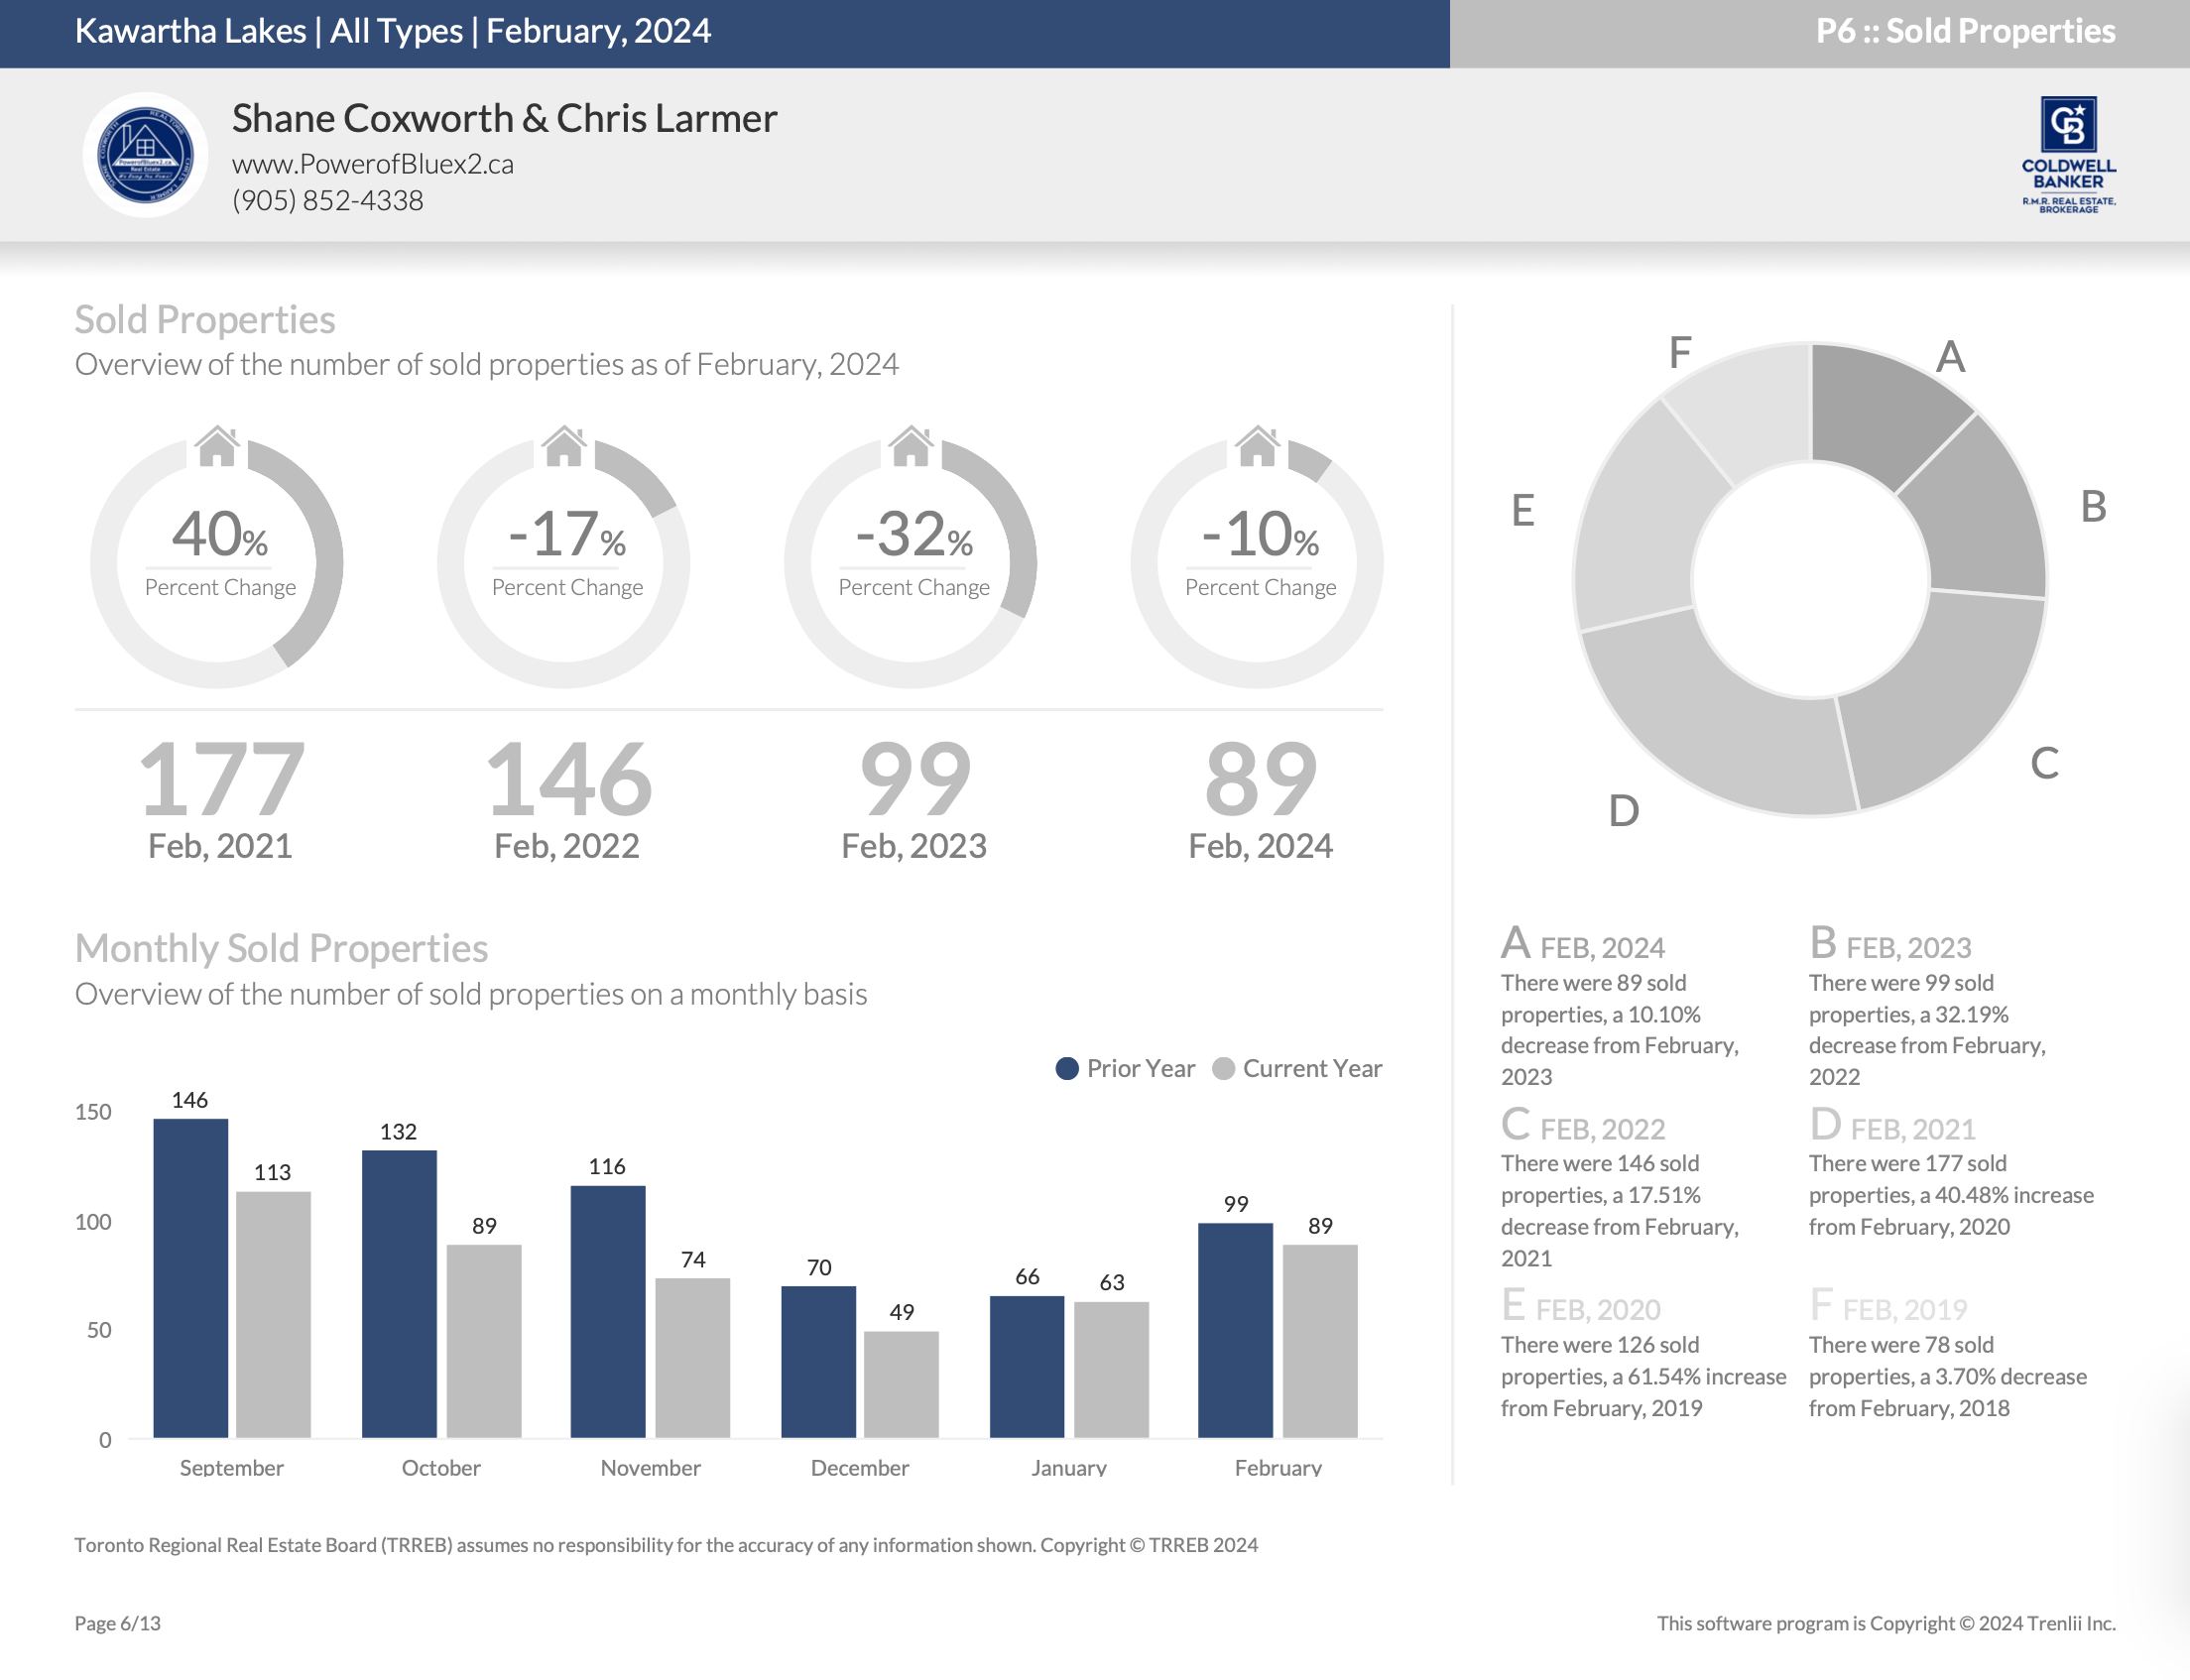
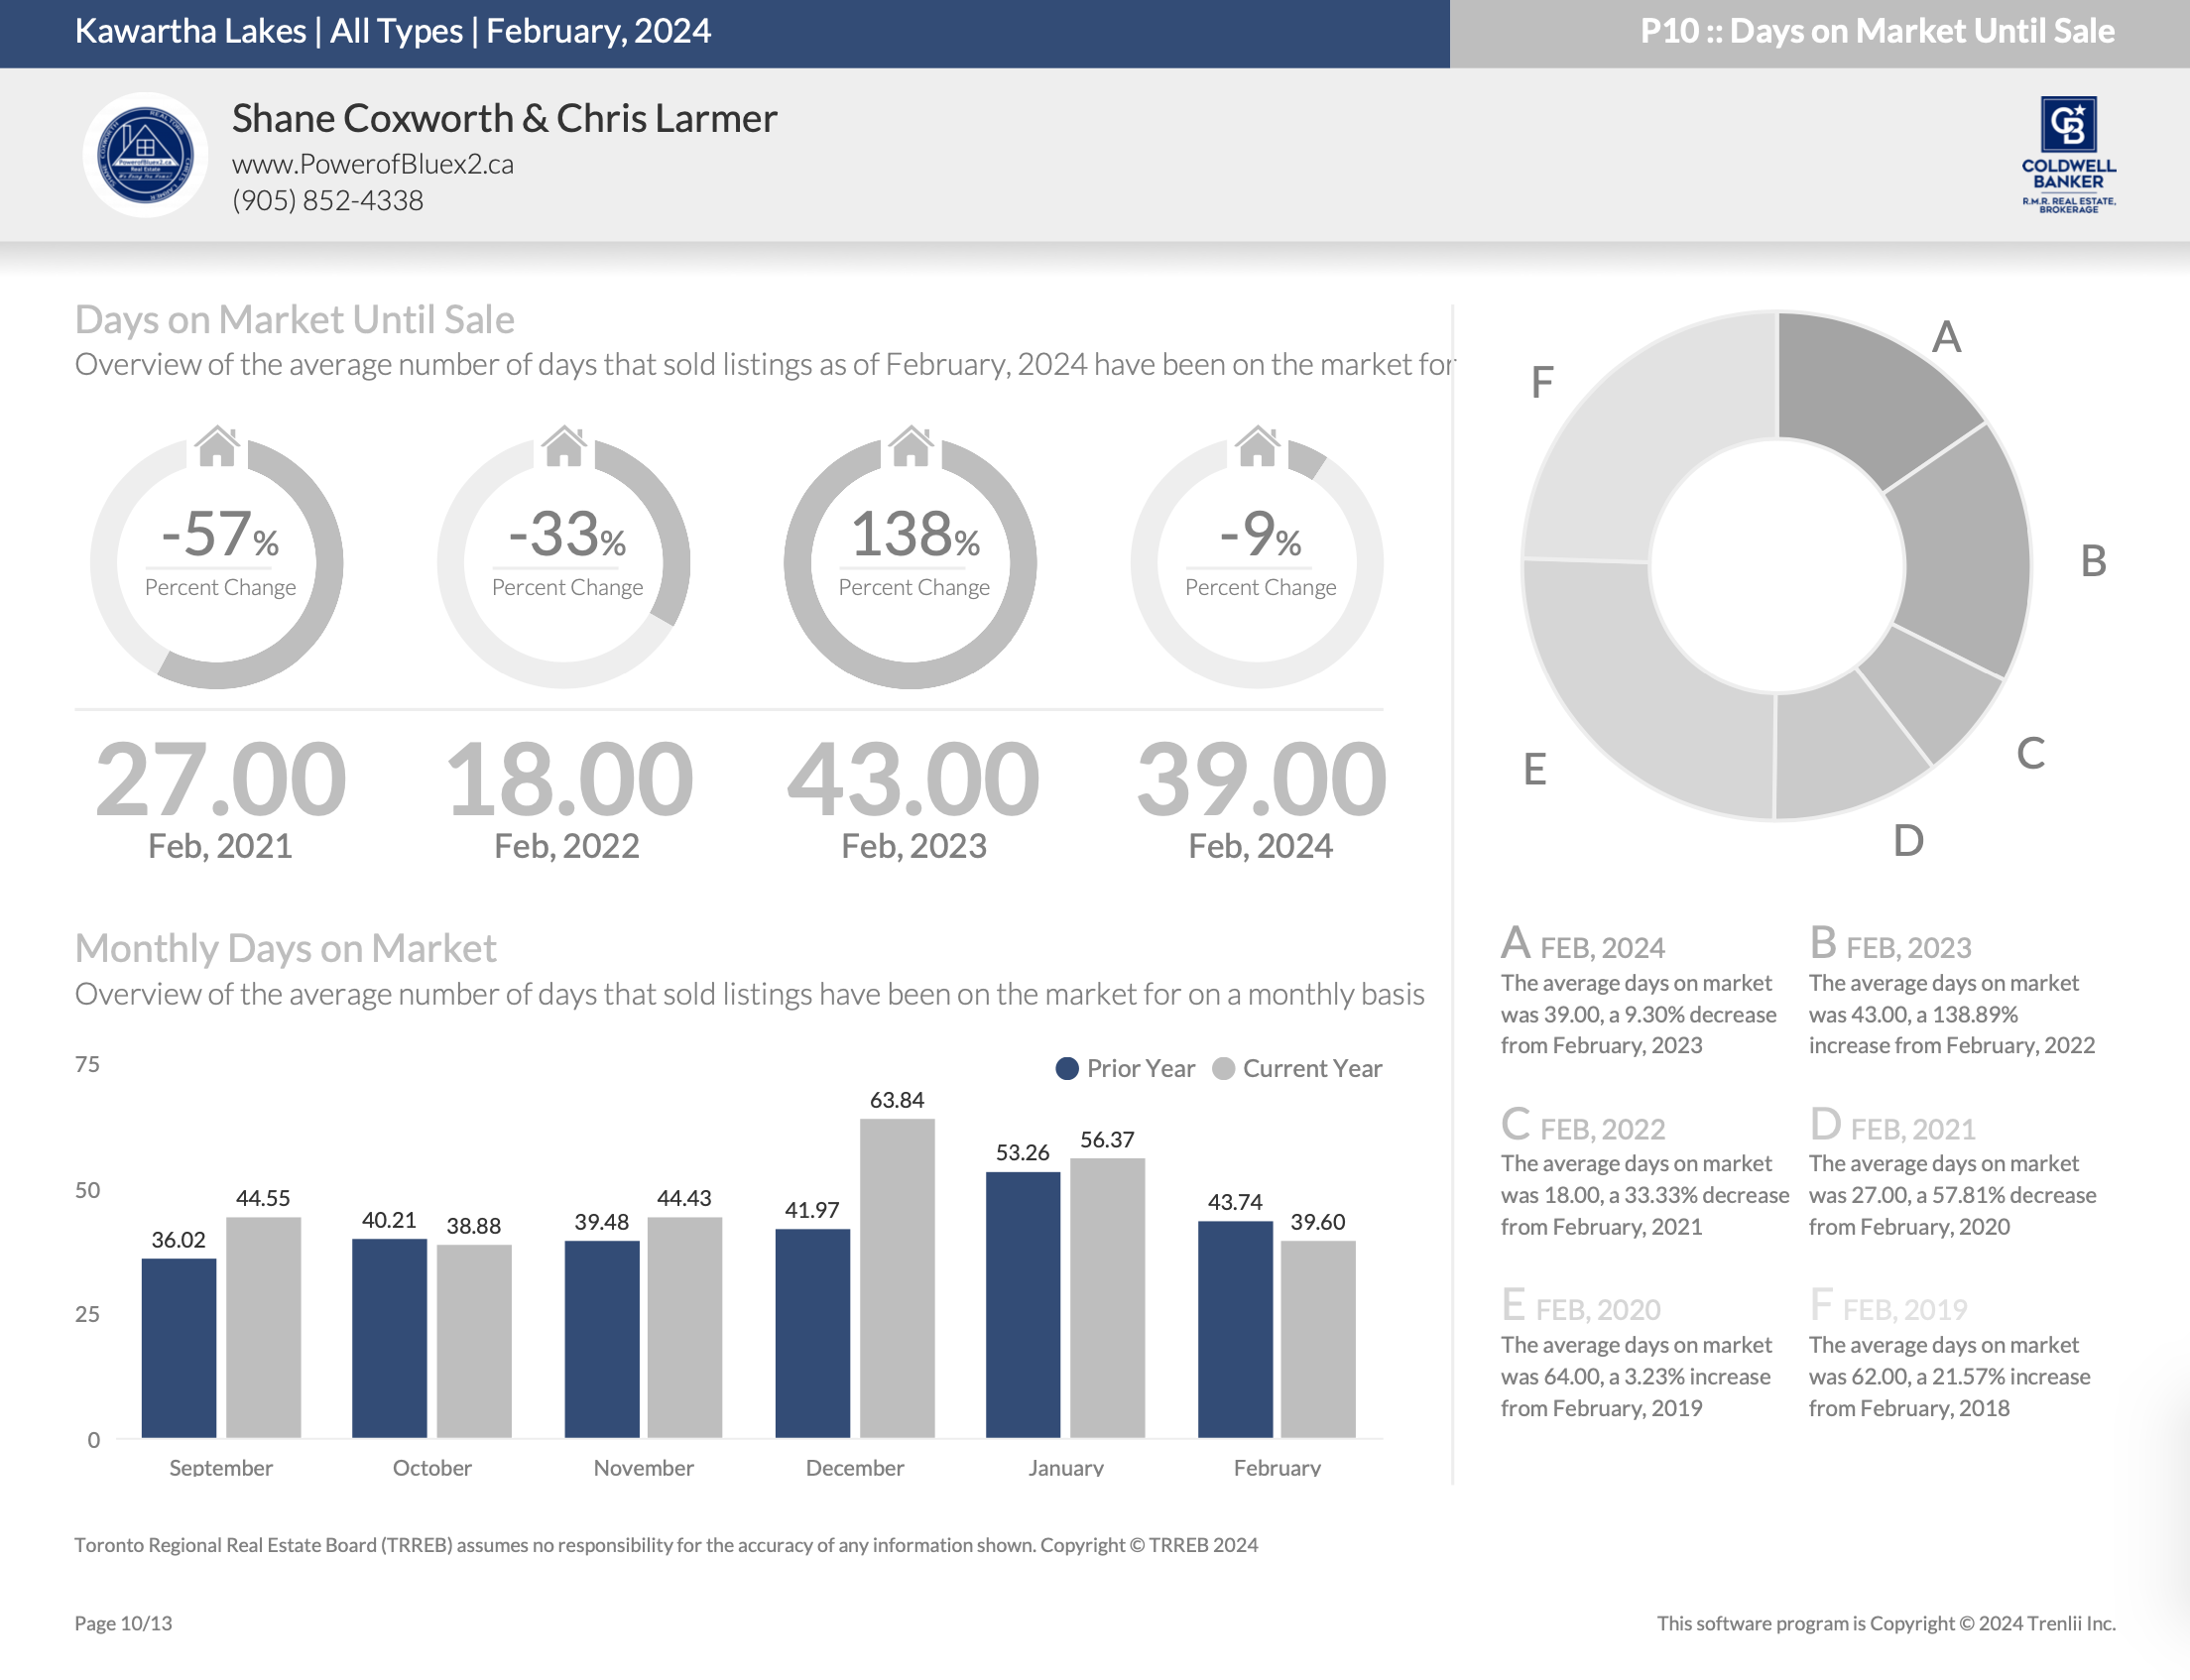
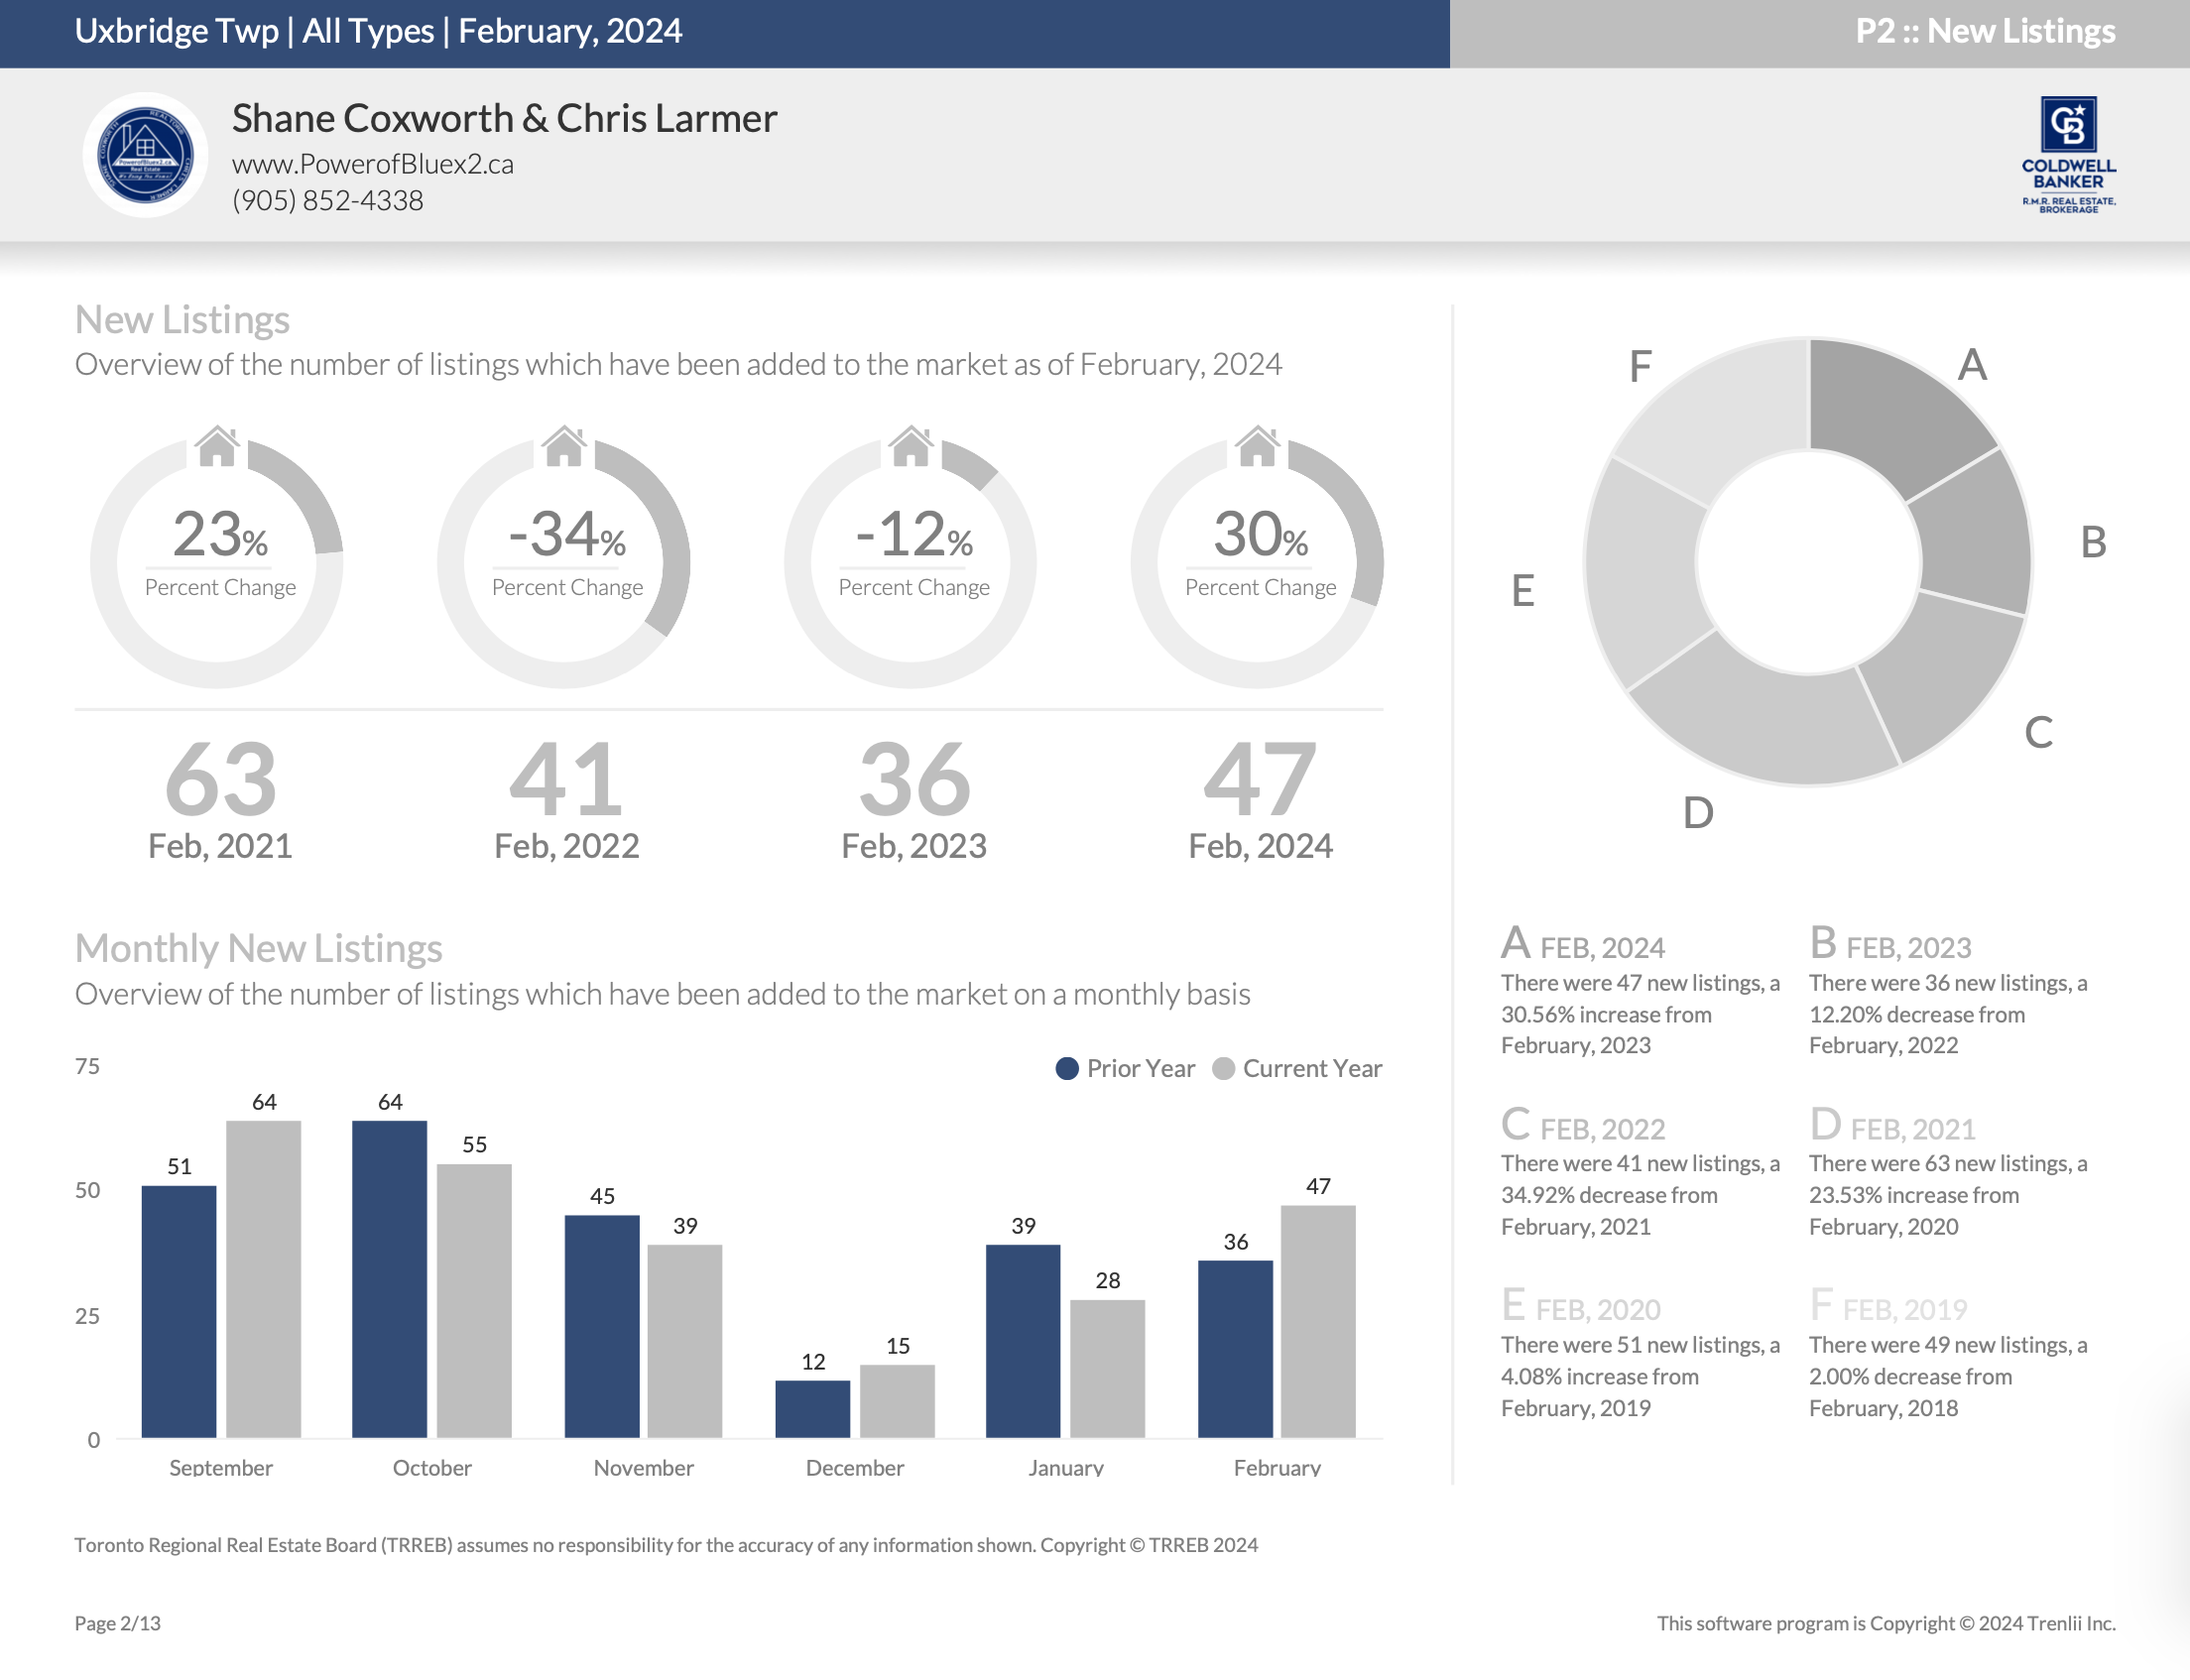
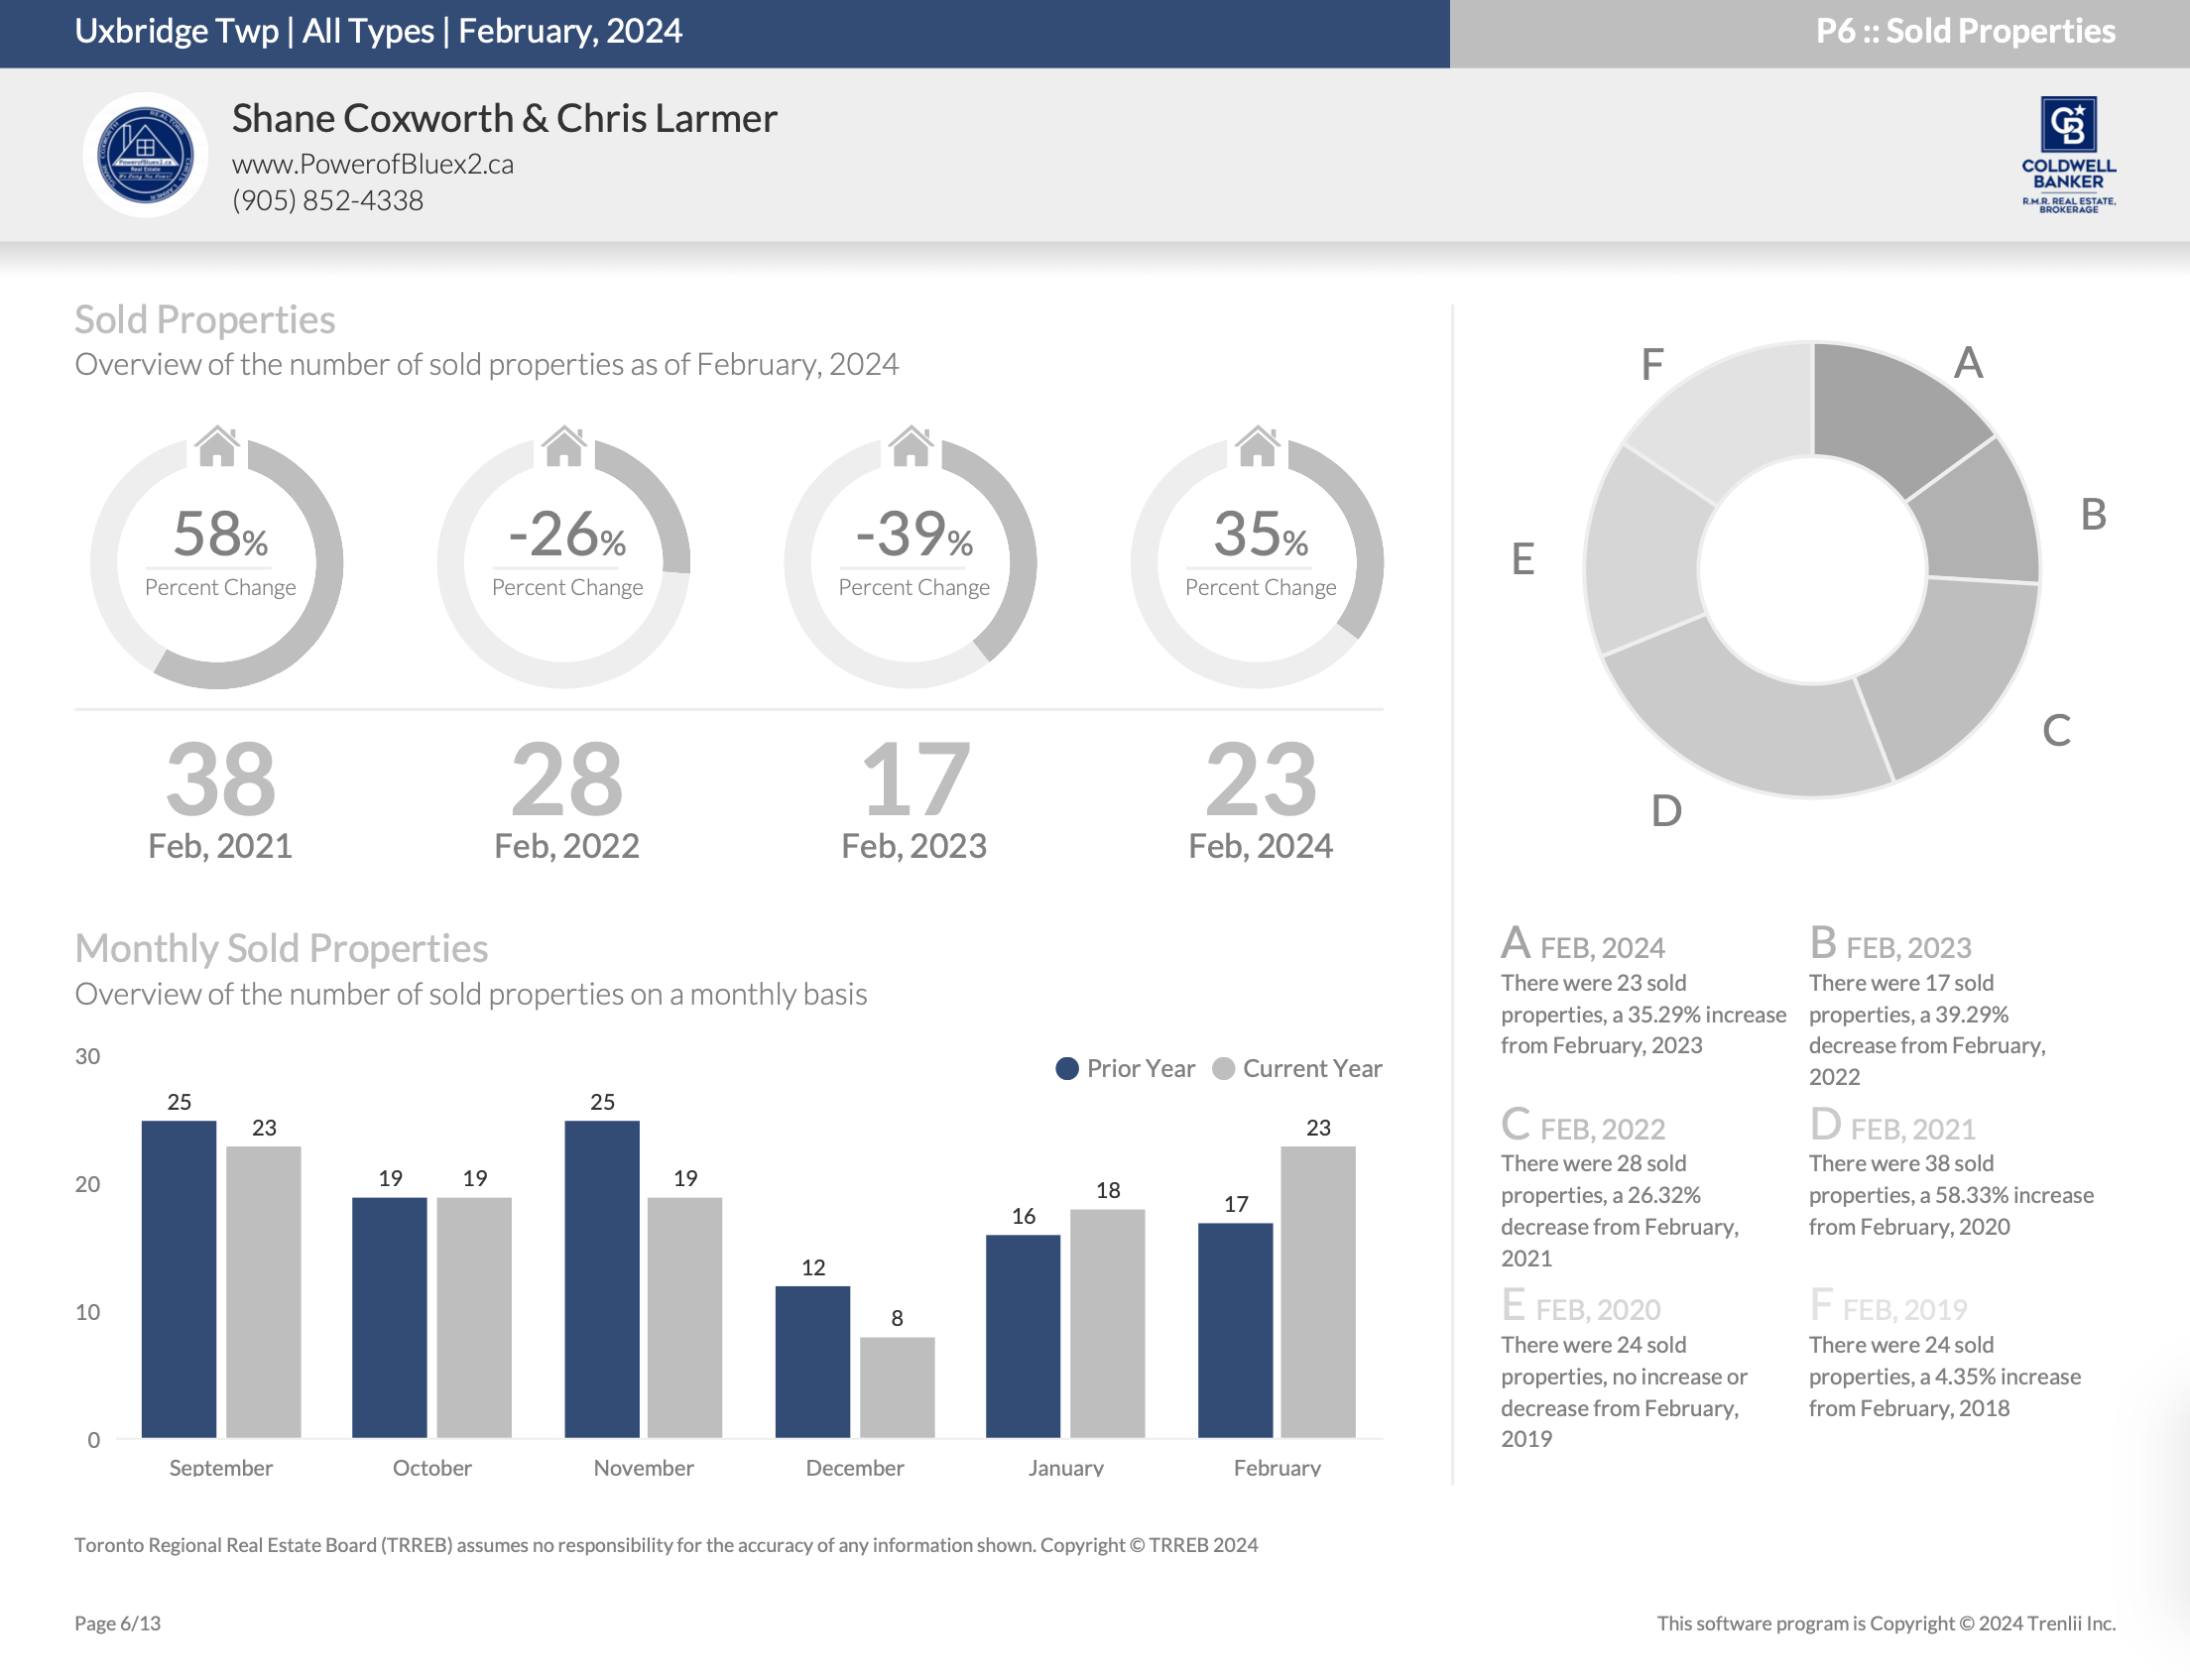
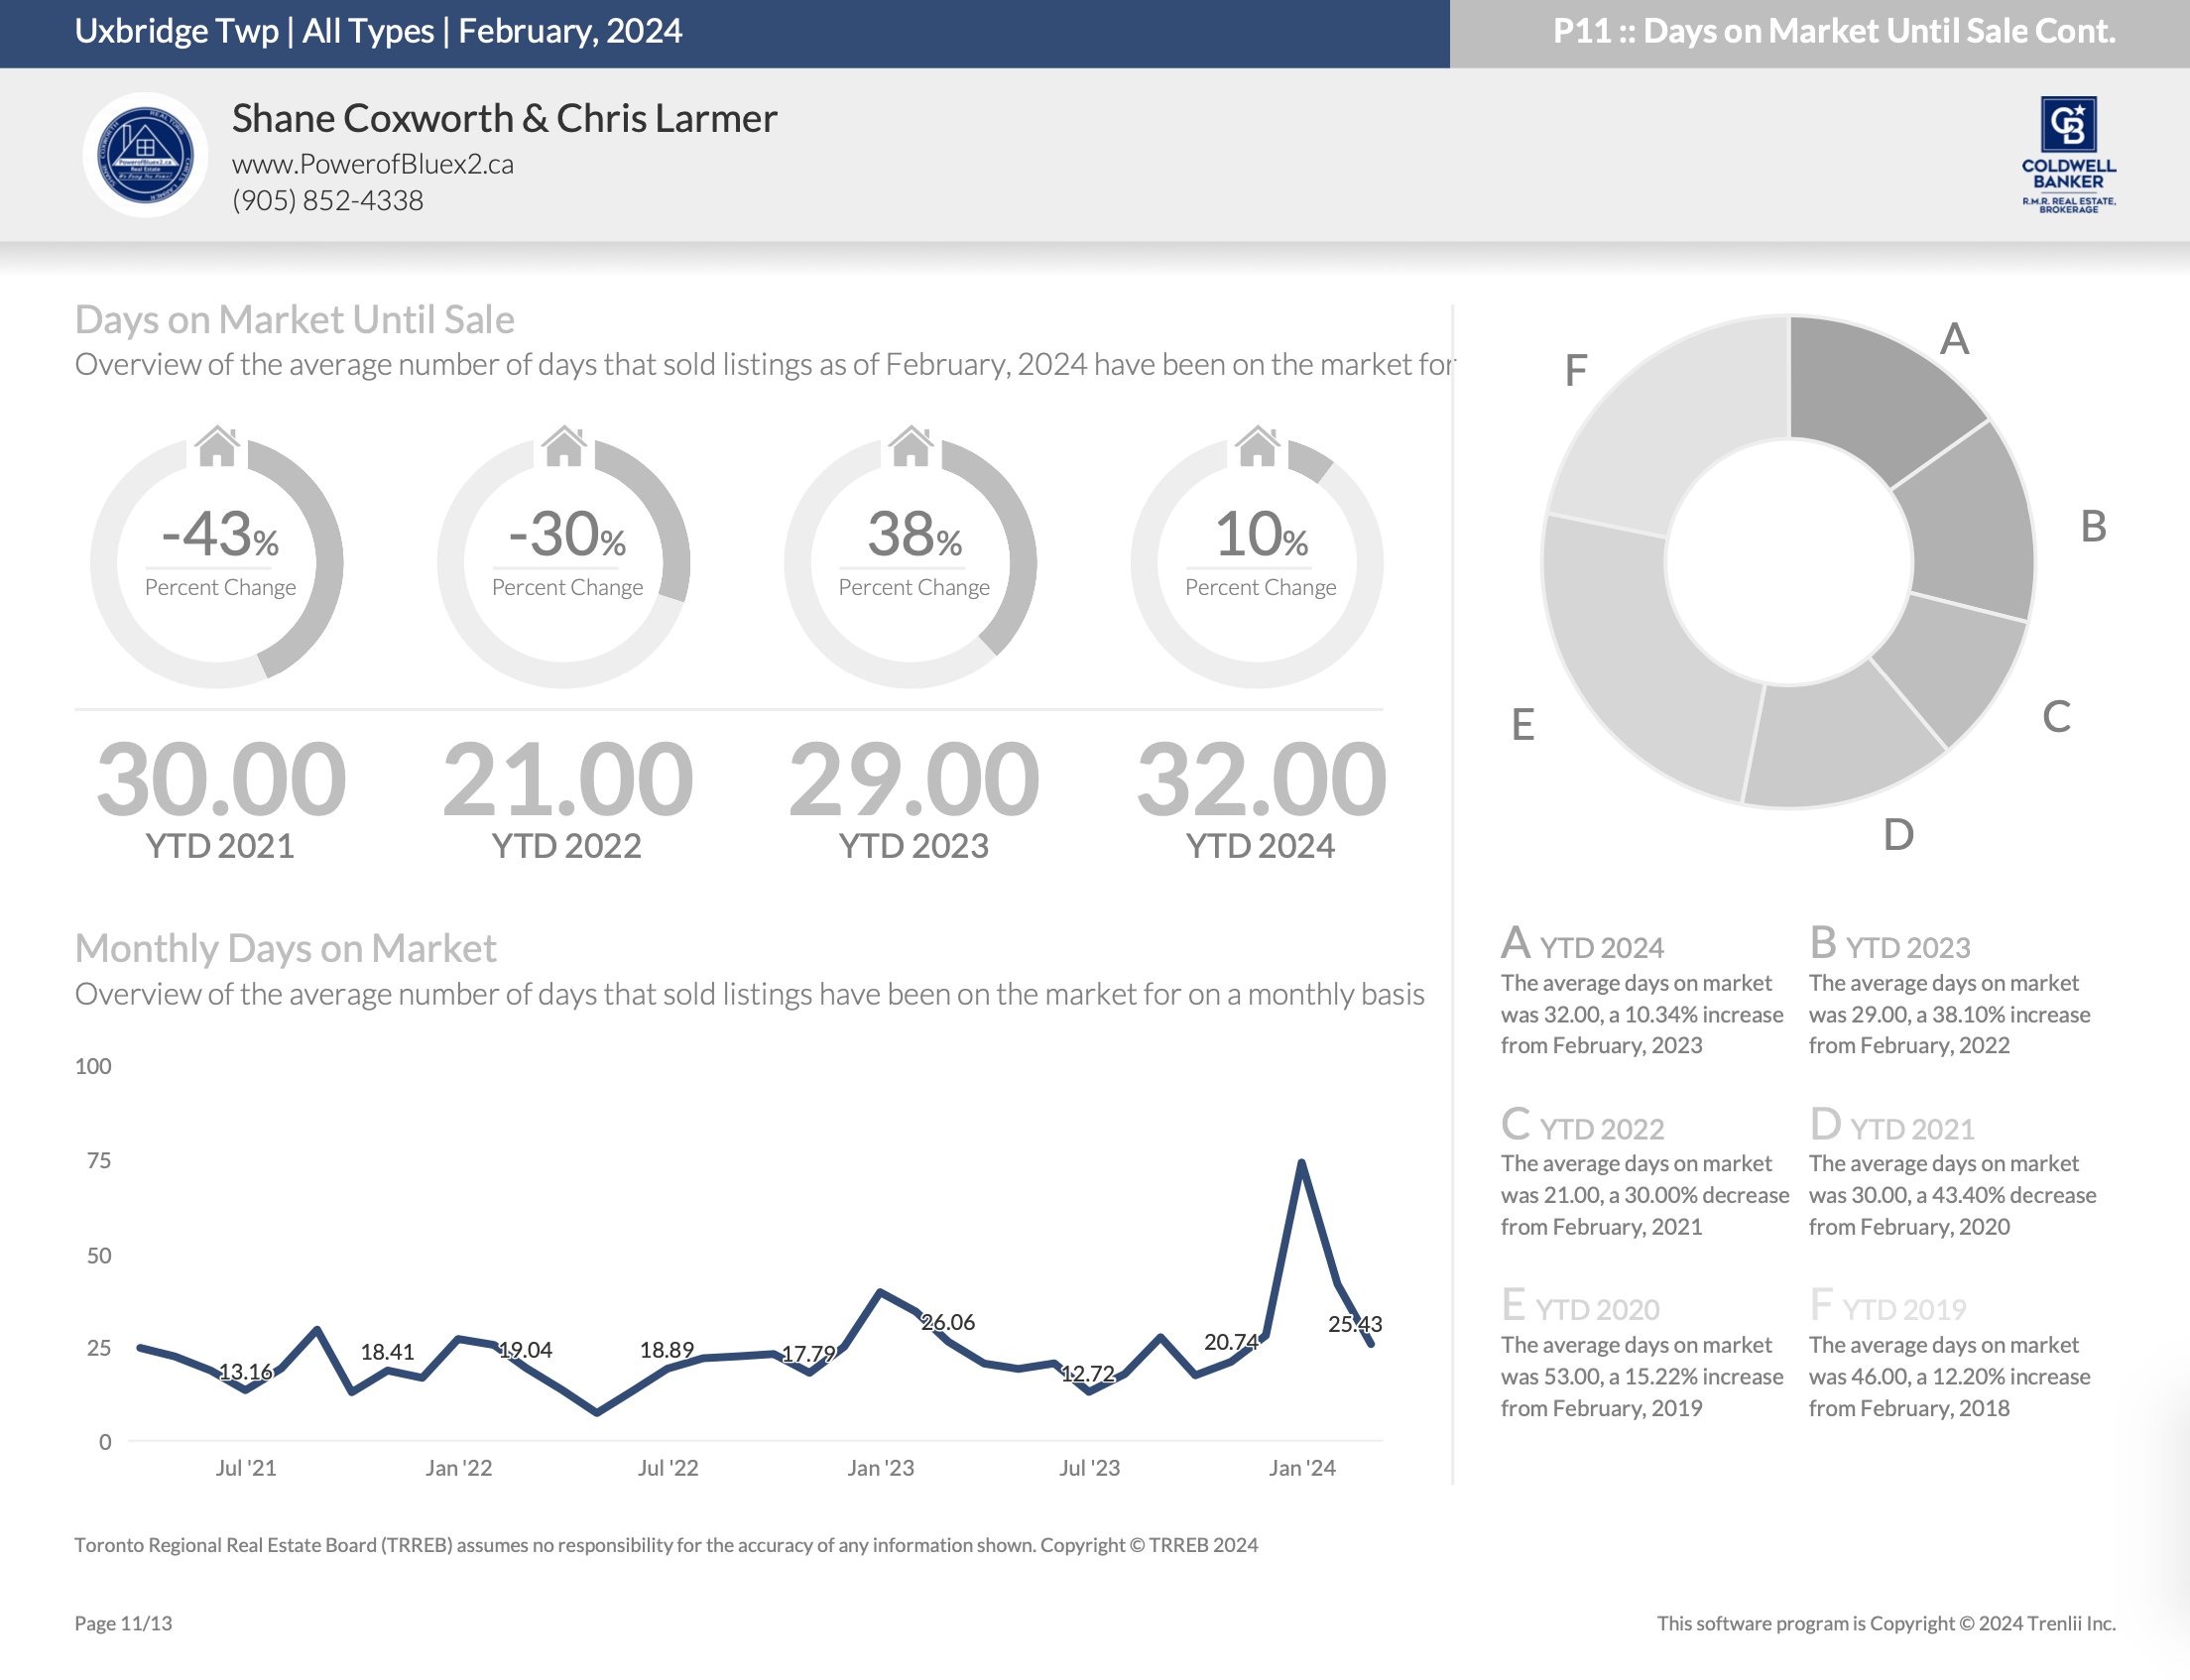
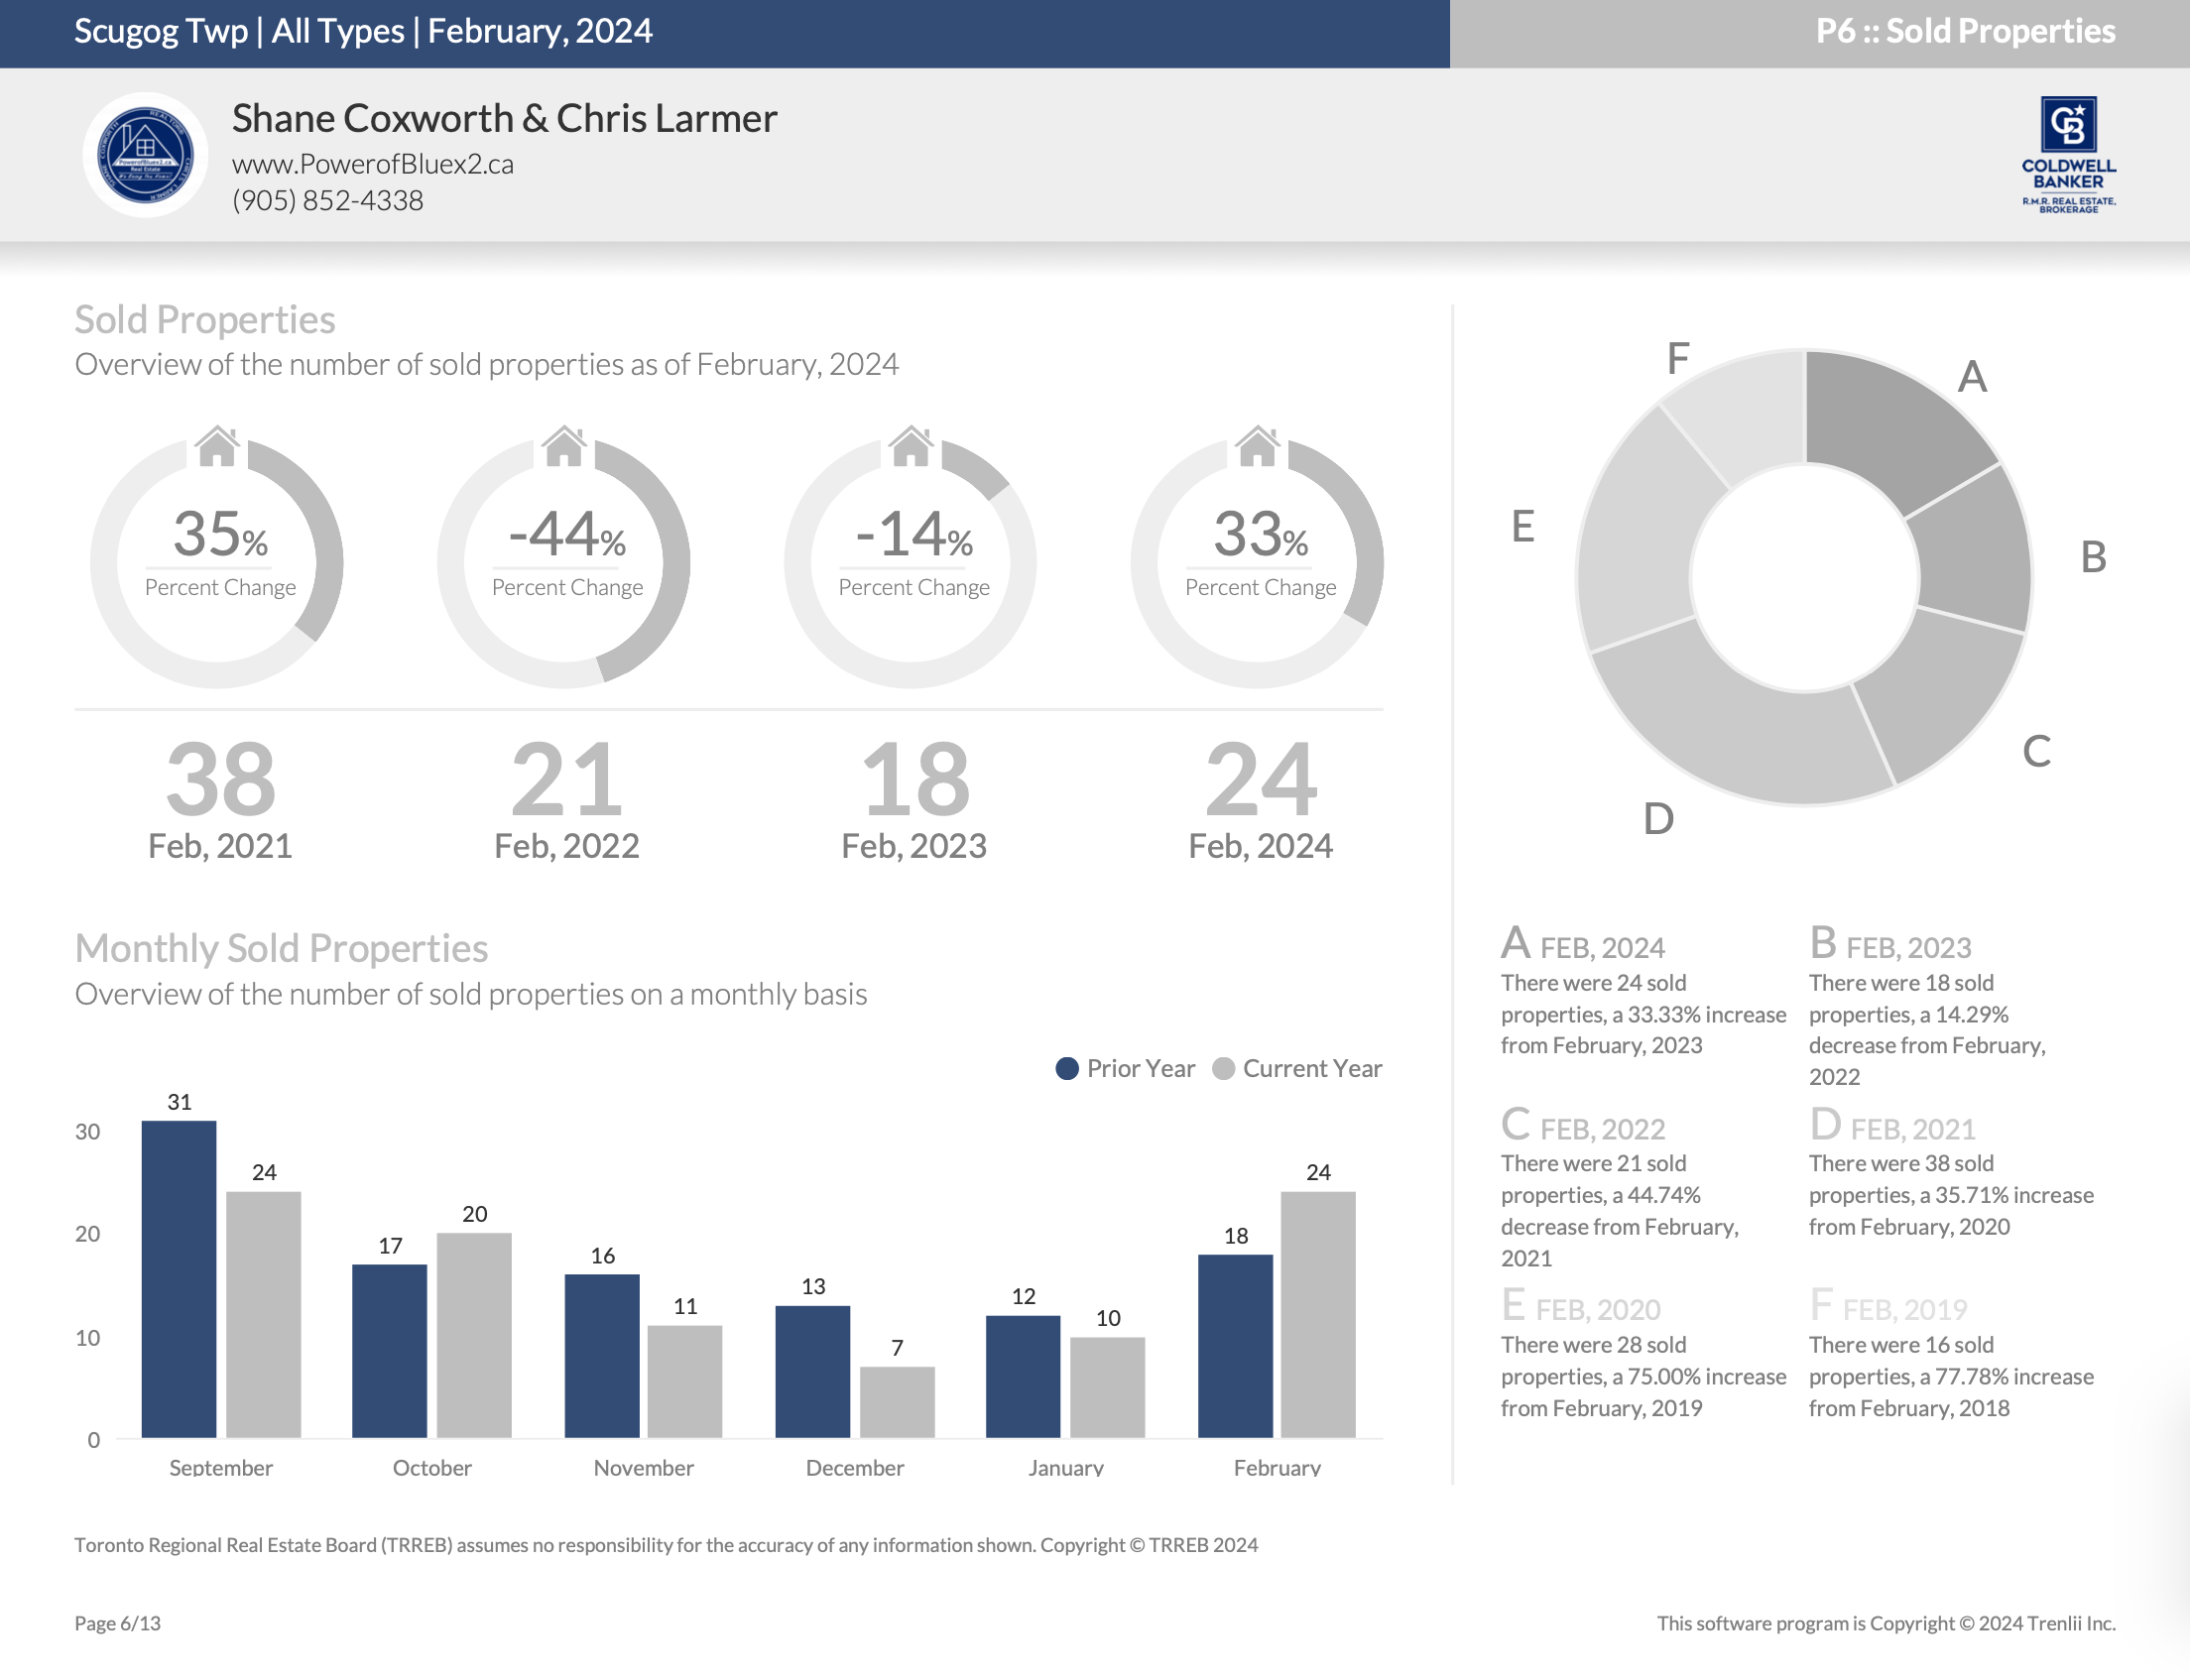
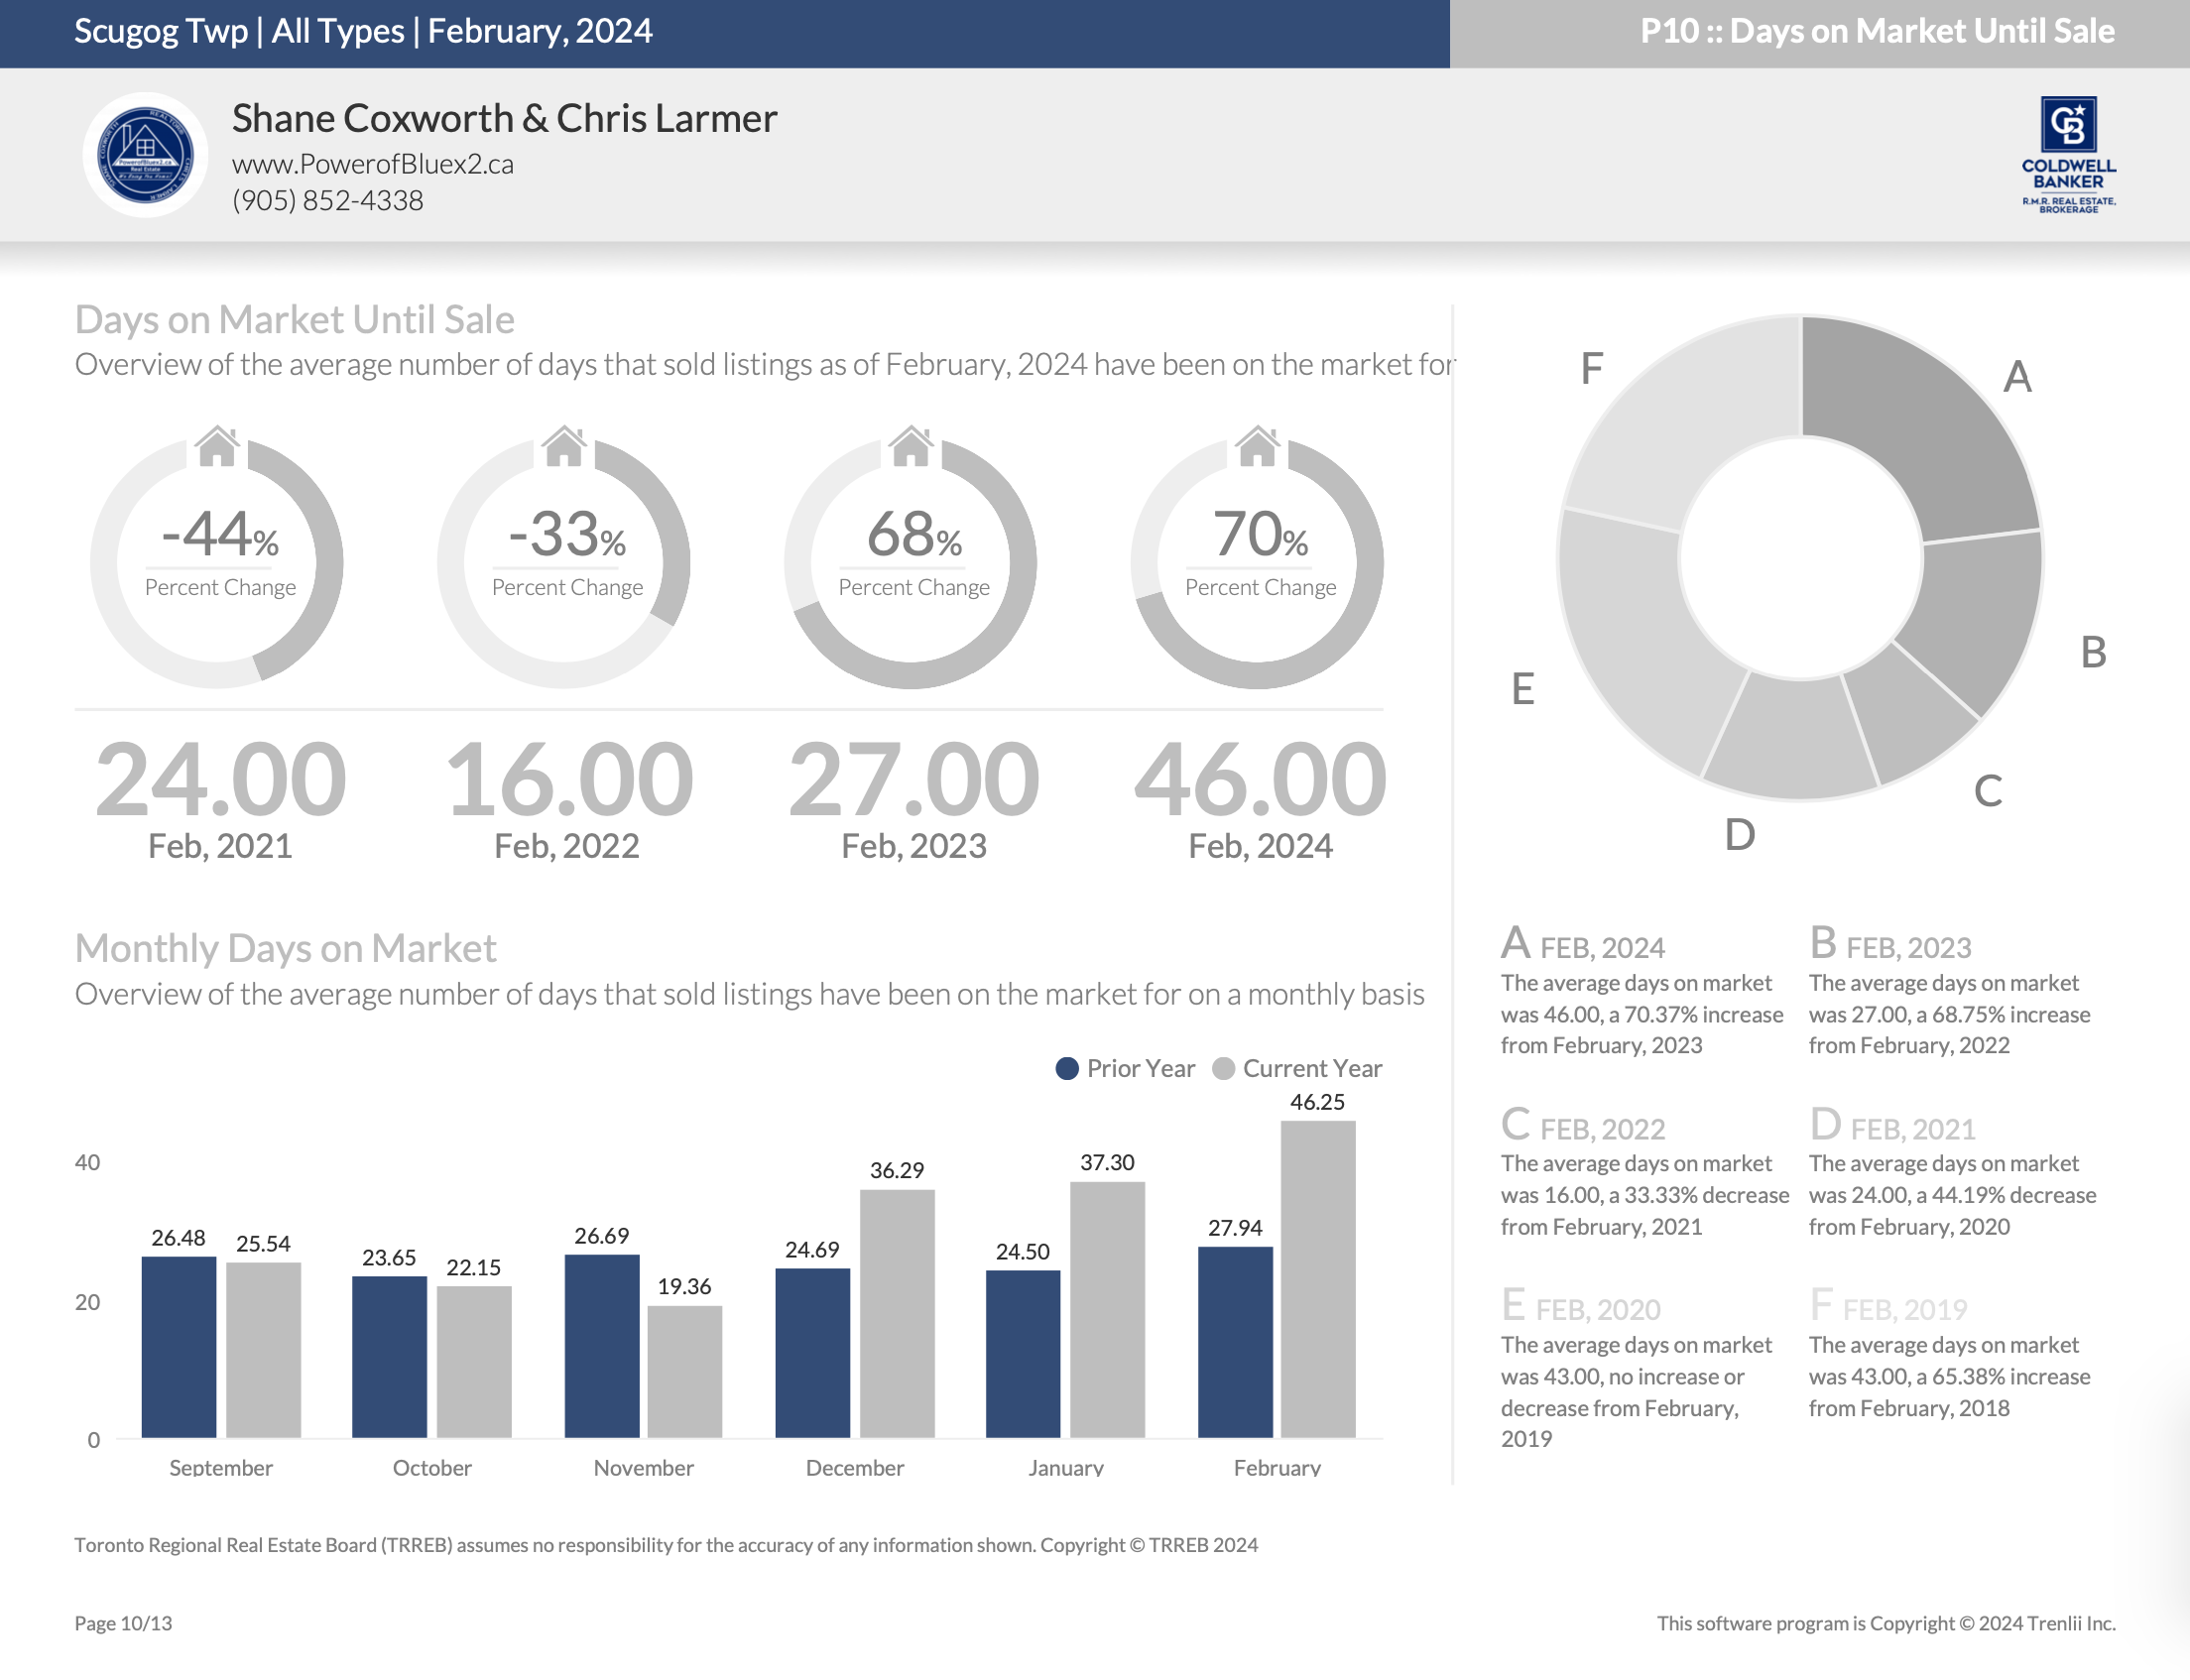
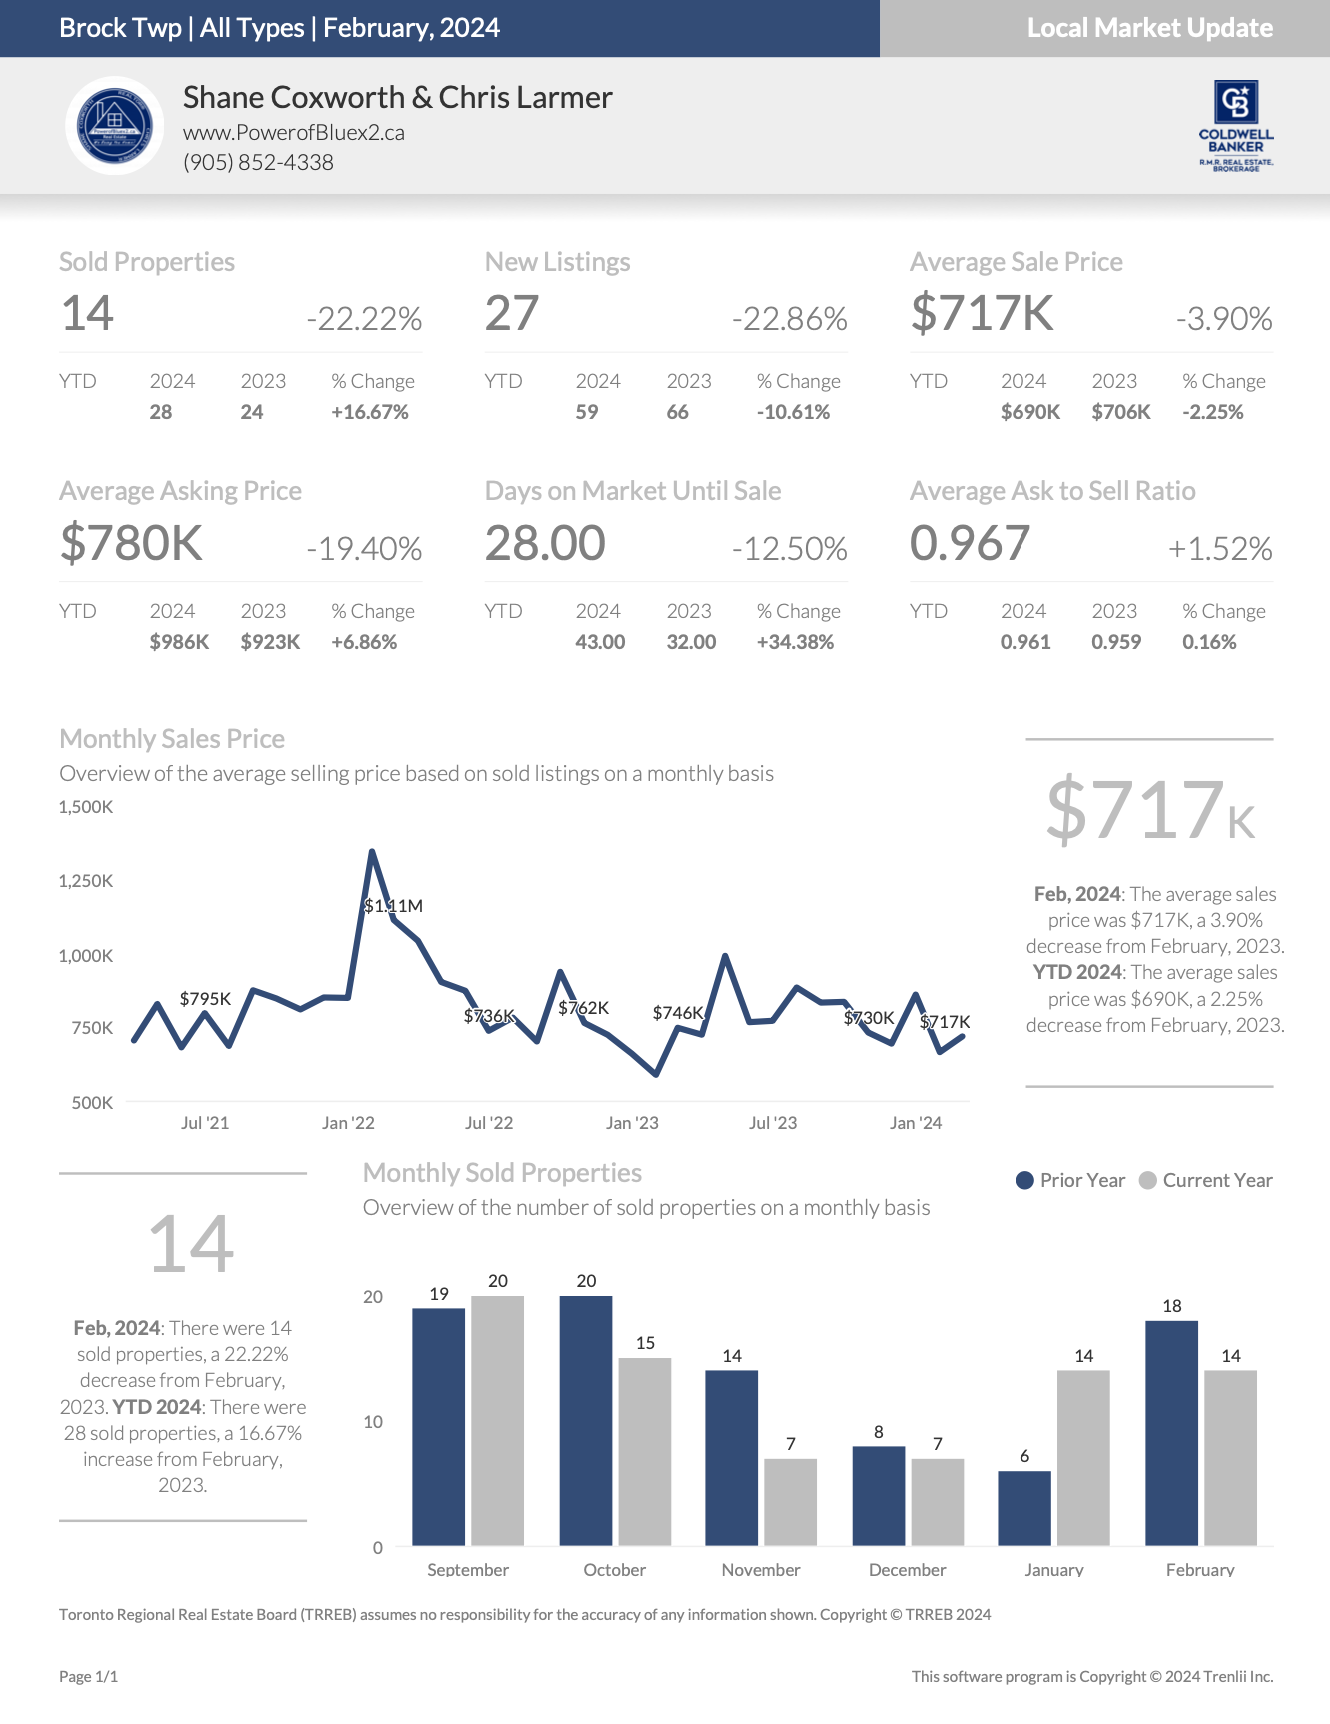
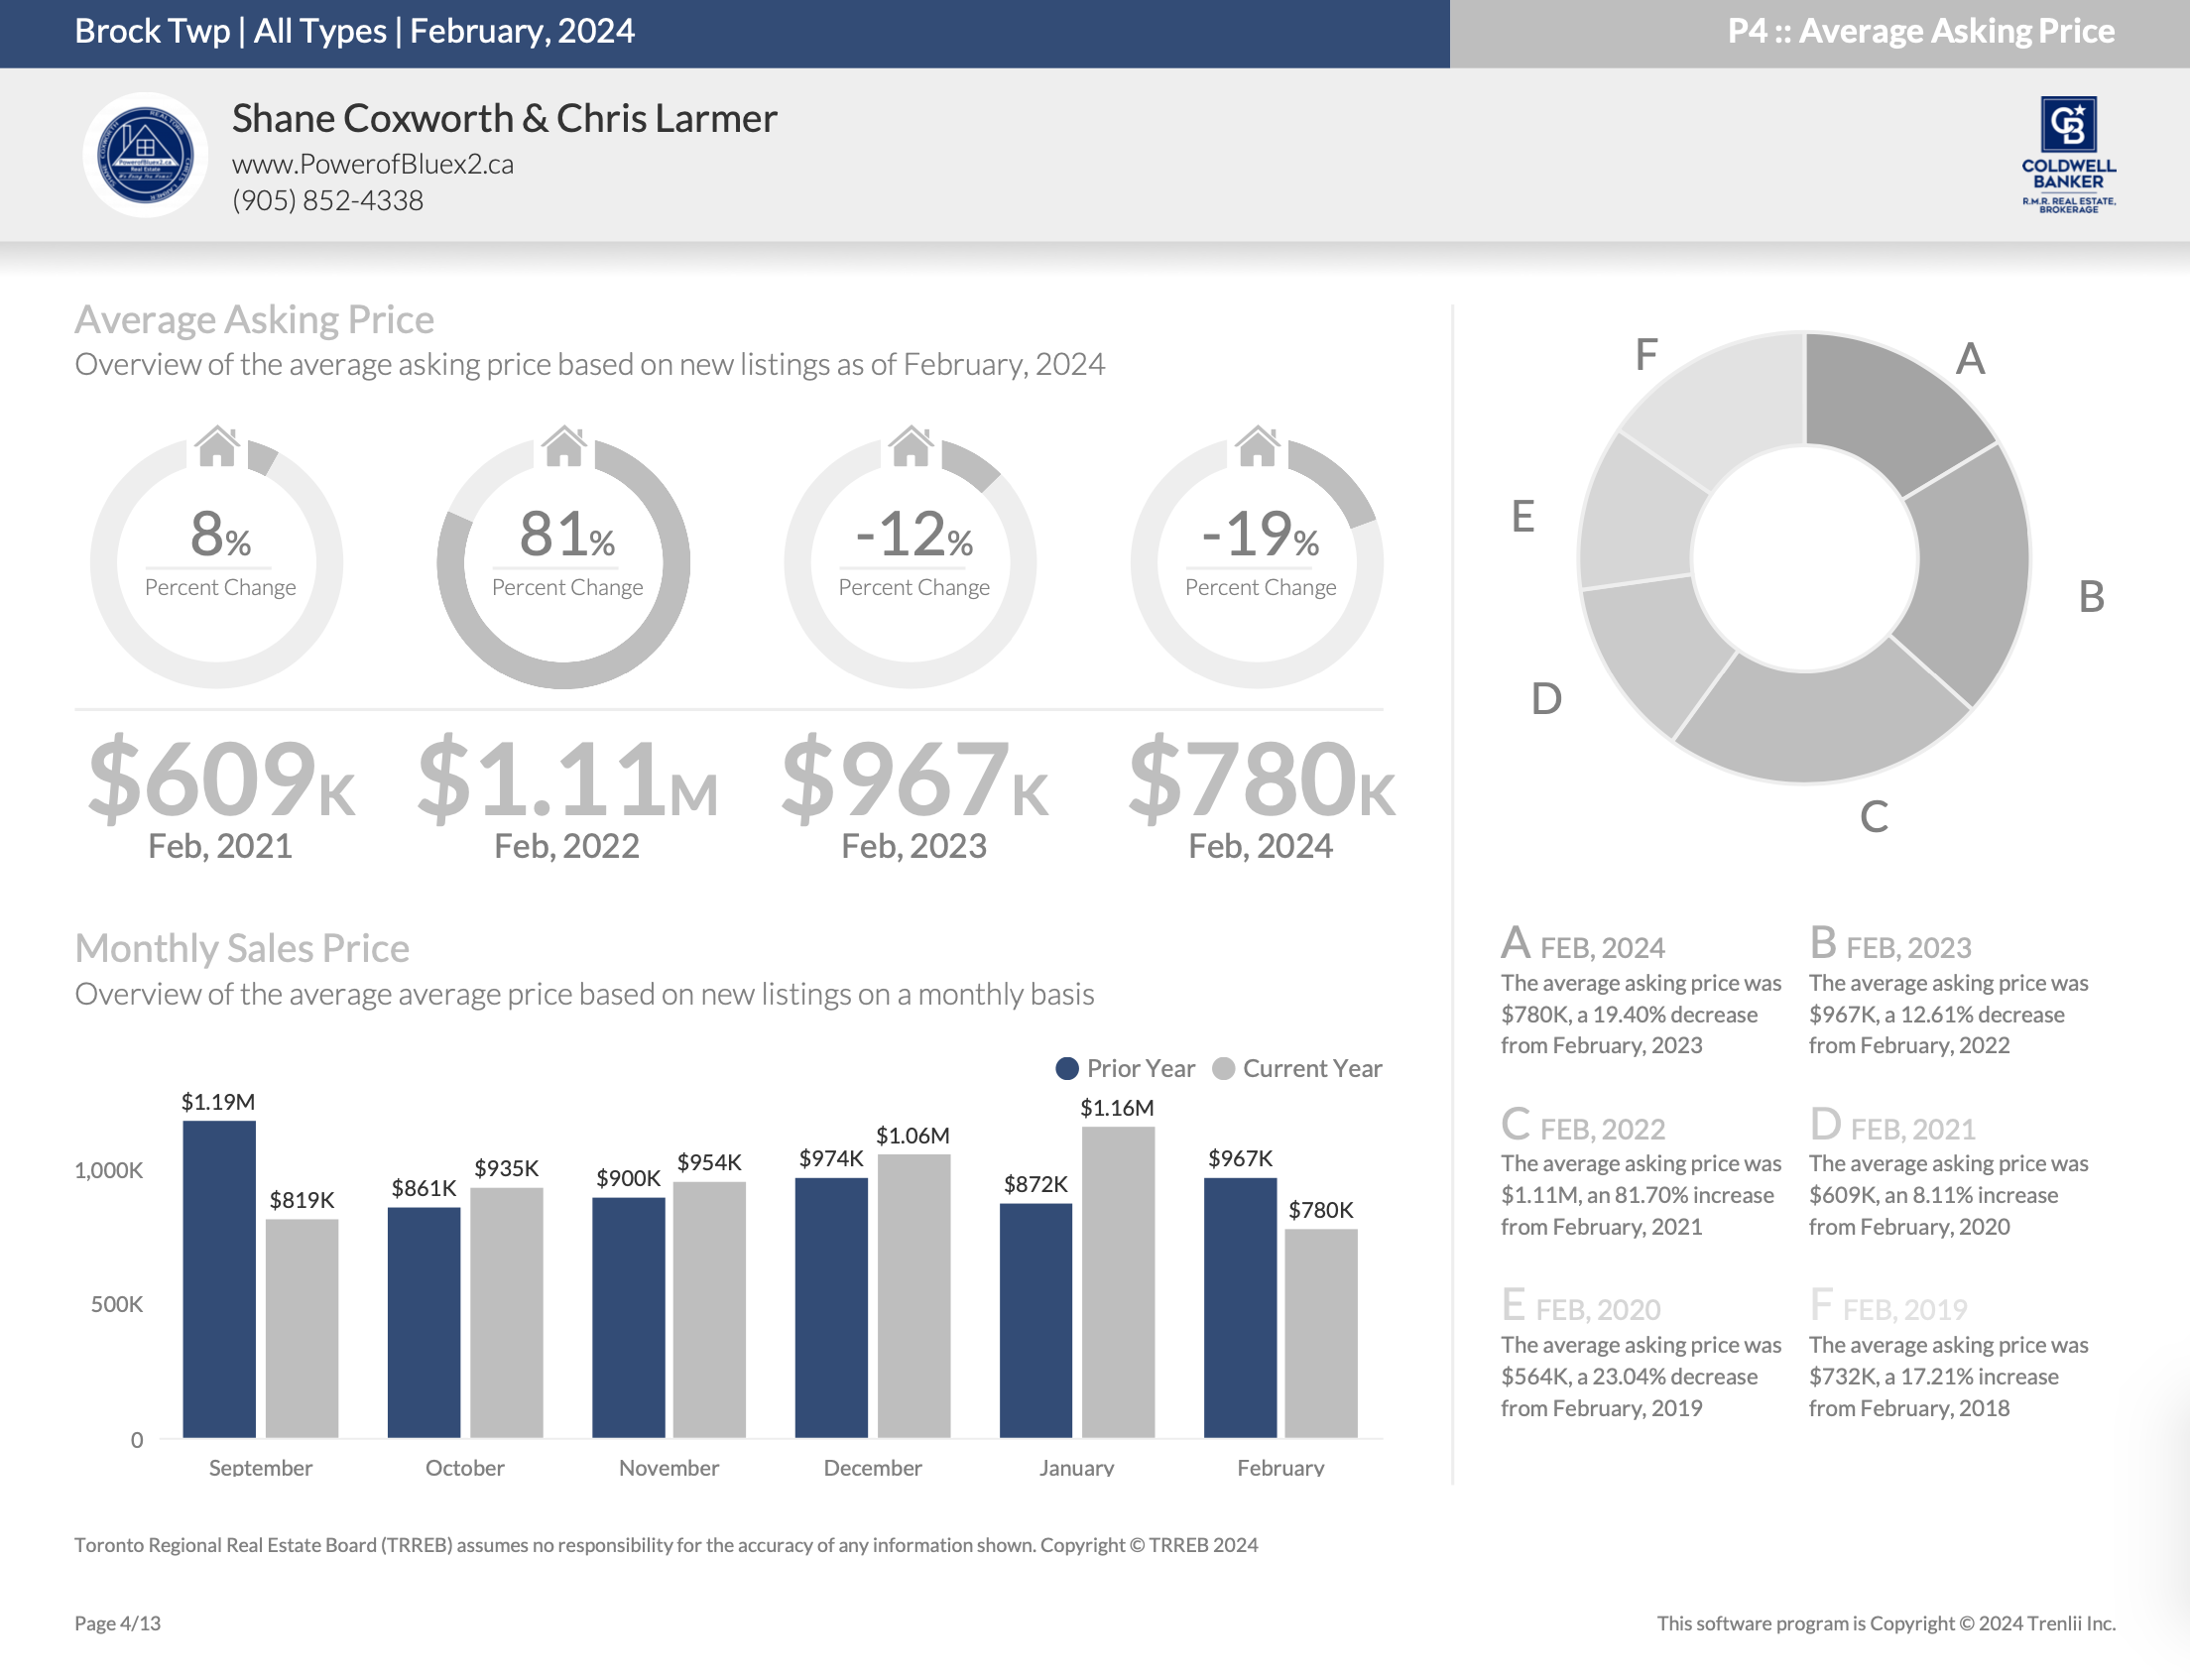
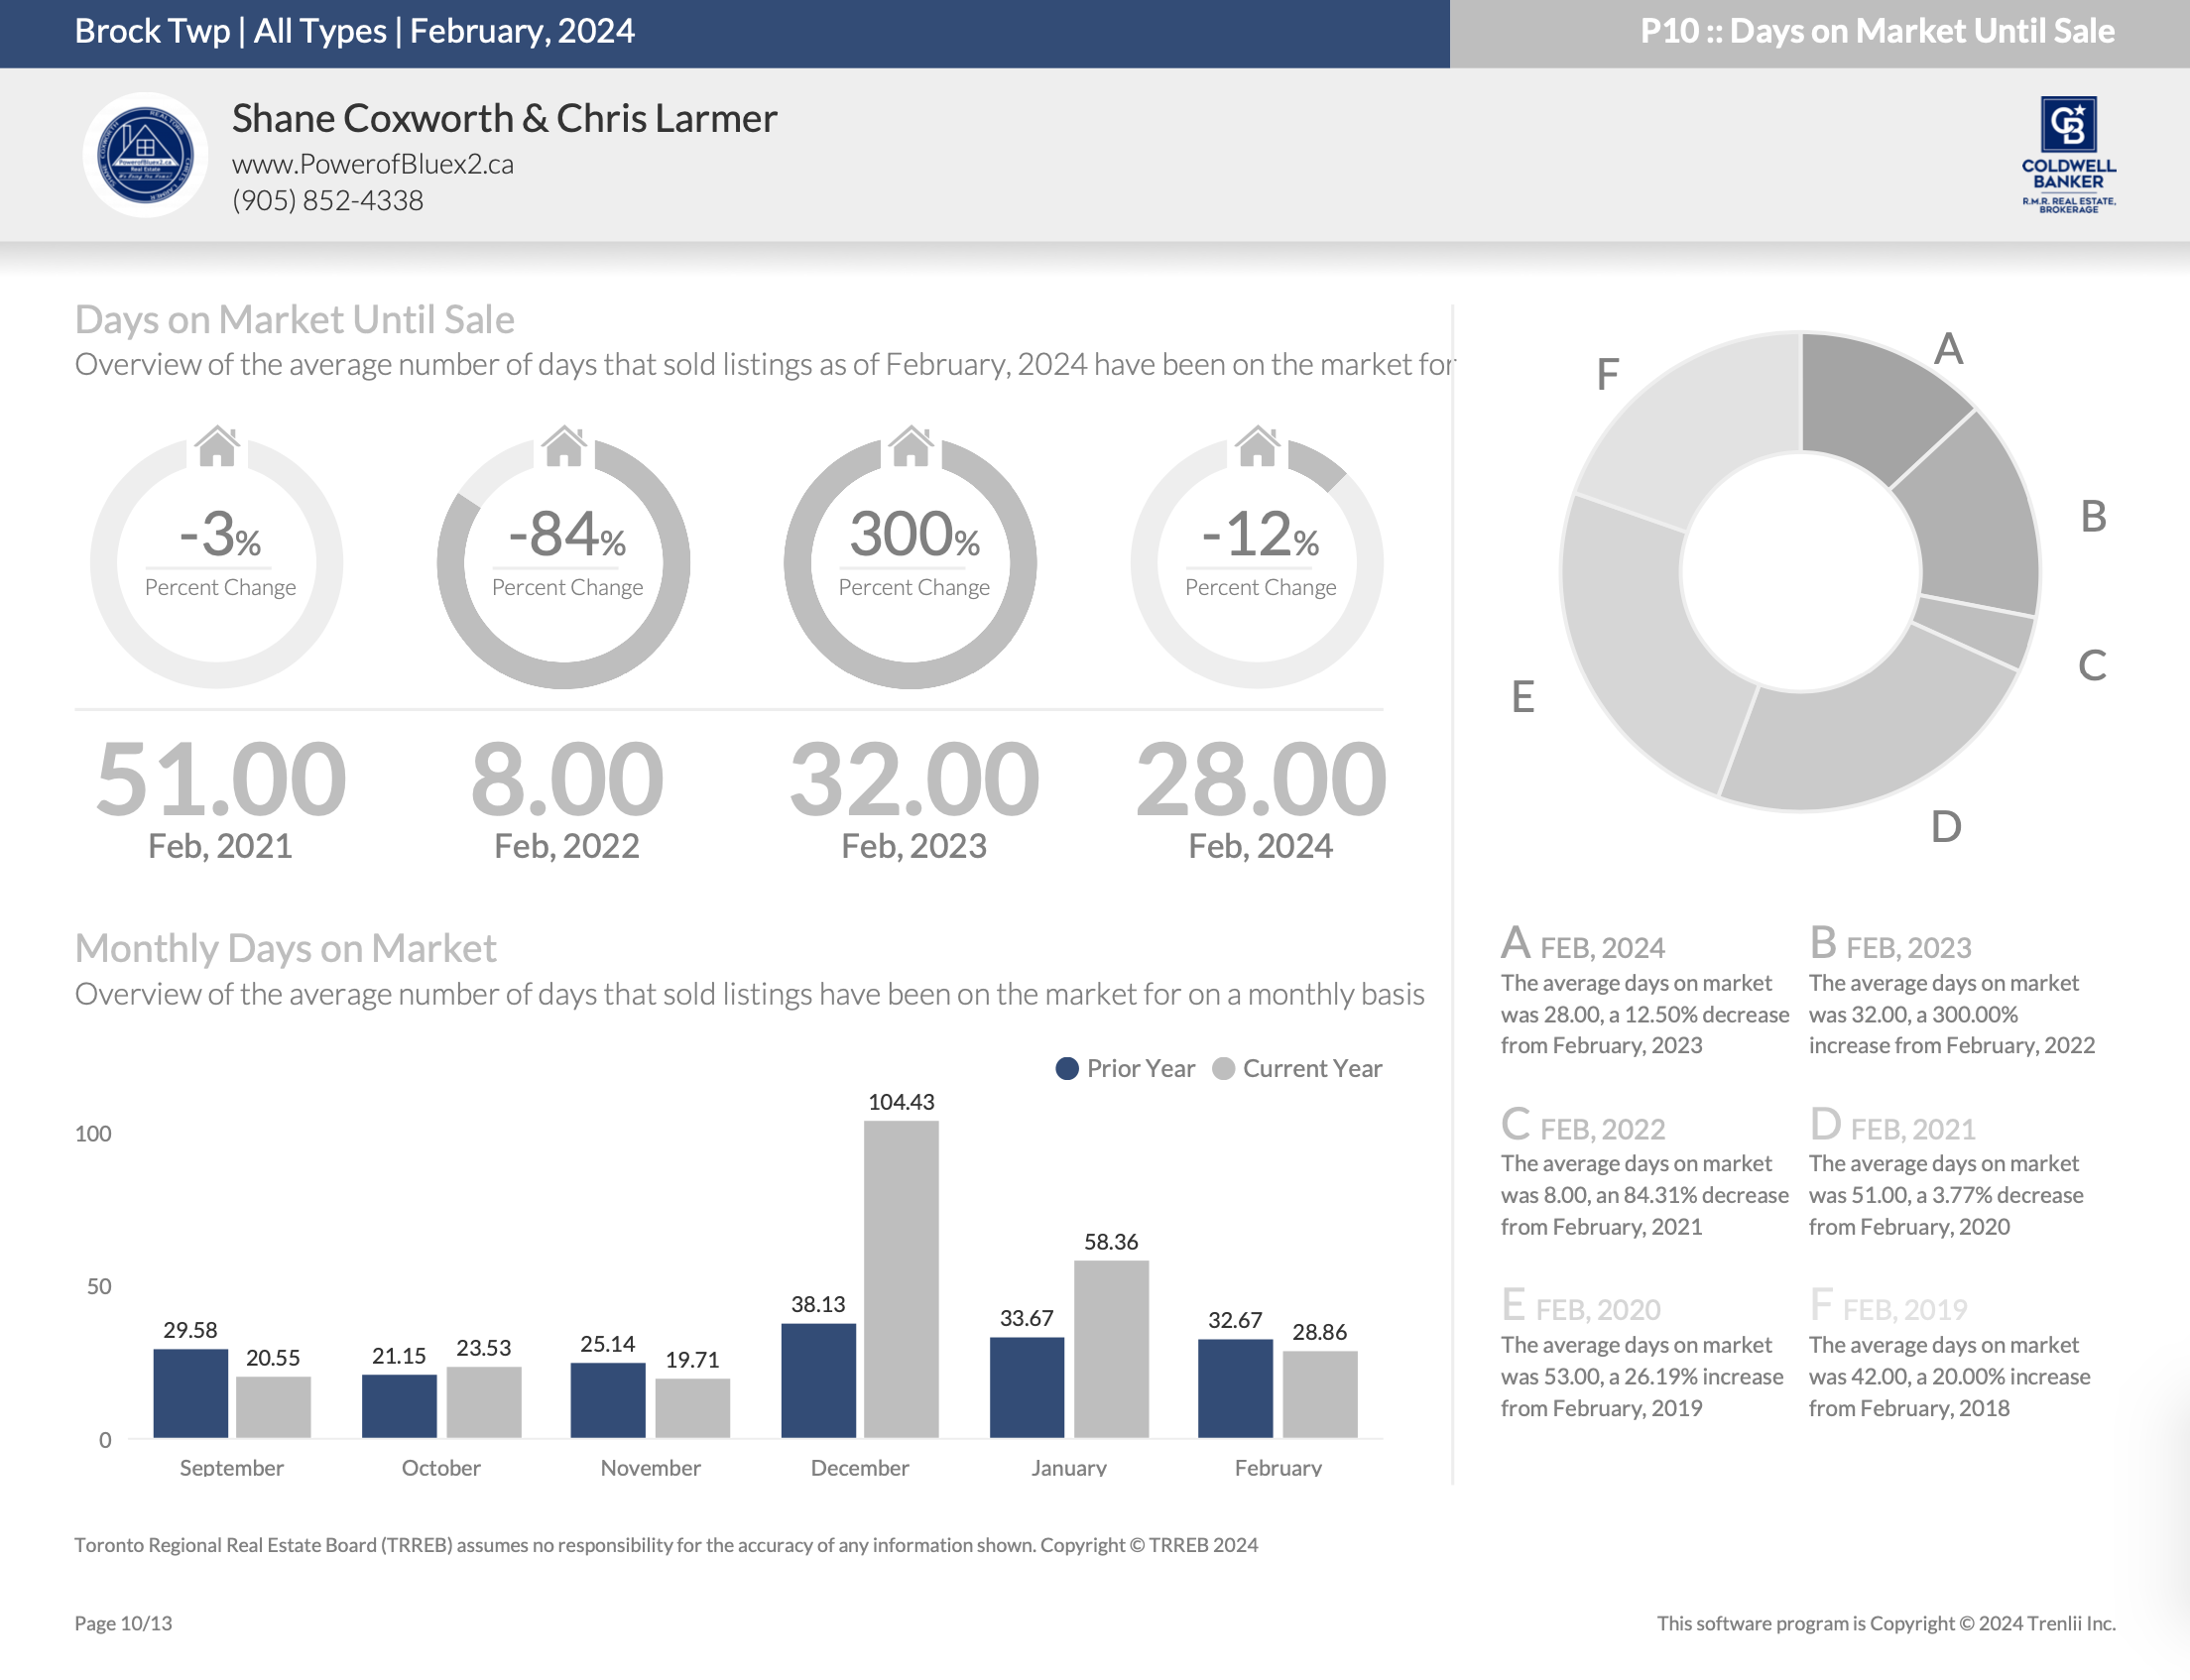
Check out our Uxbridge and Scugog Events Pages to keep up to date on whats going on around town. Click the links or scan the Code with your phone to take you directly there.
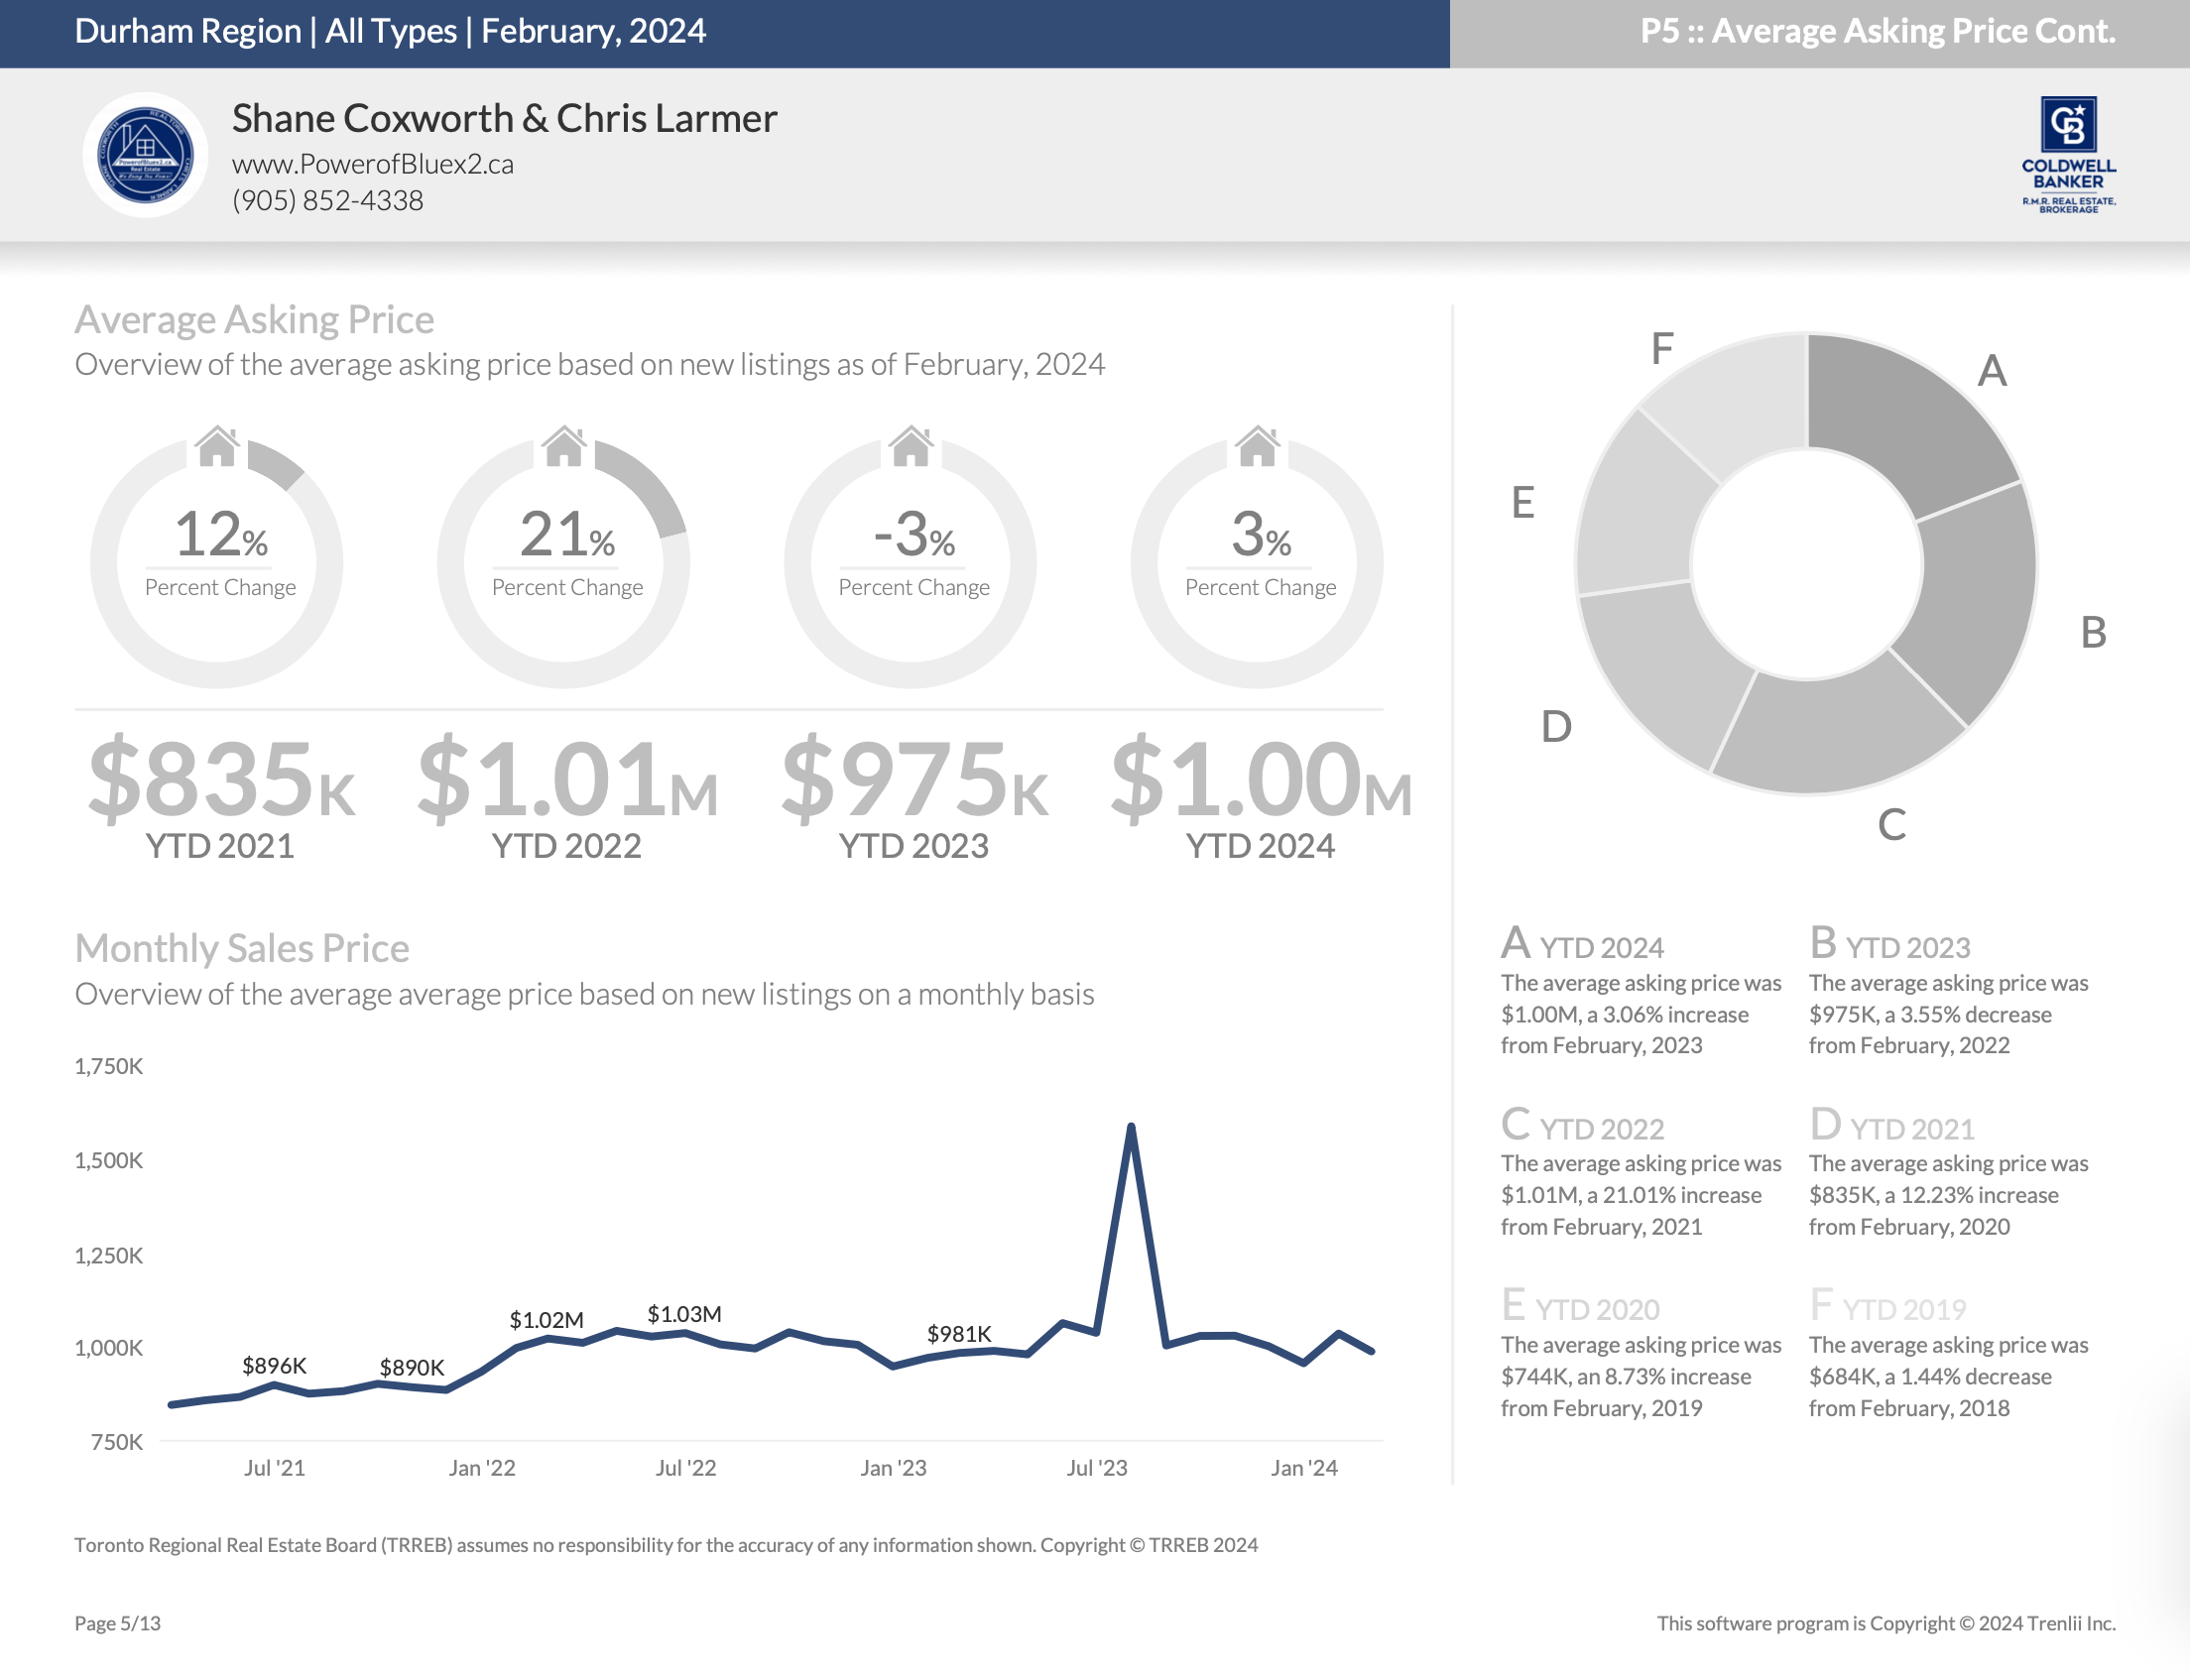
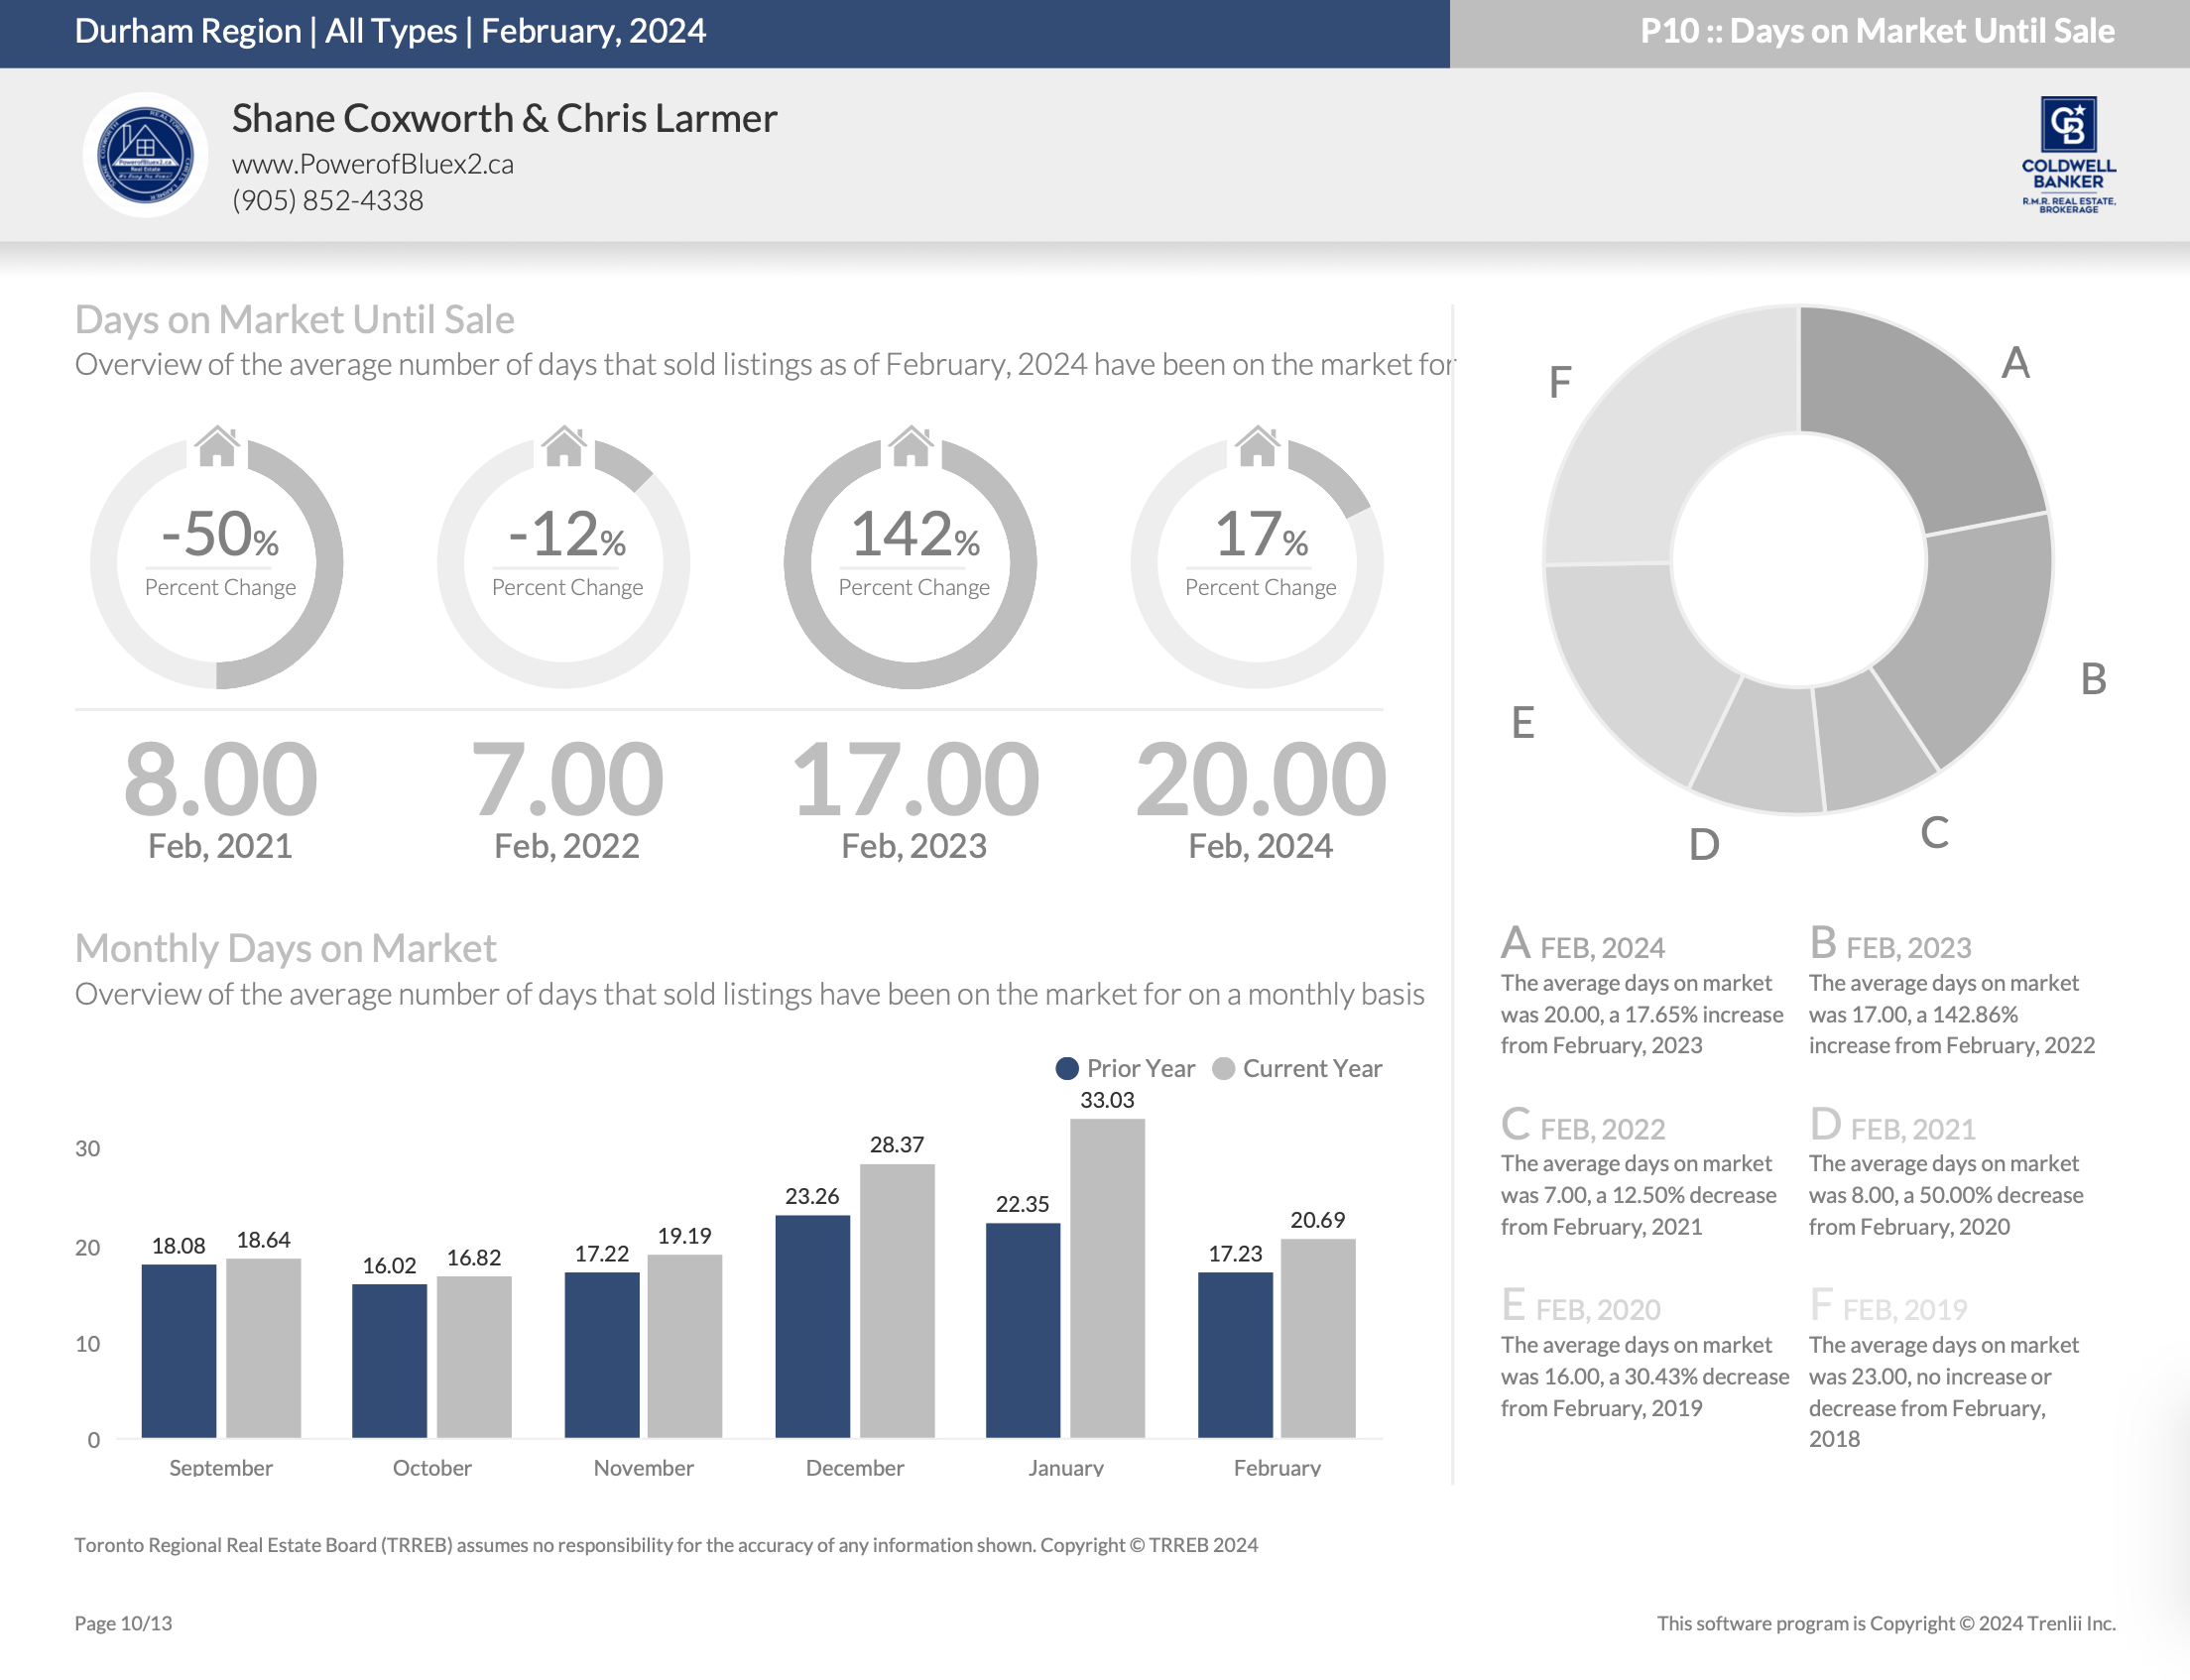
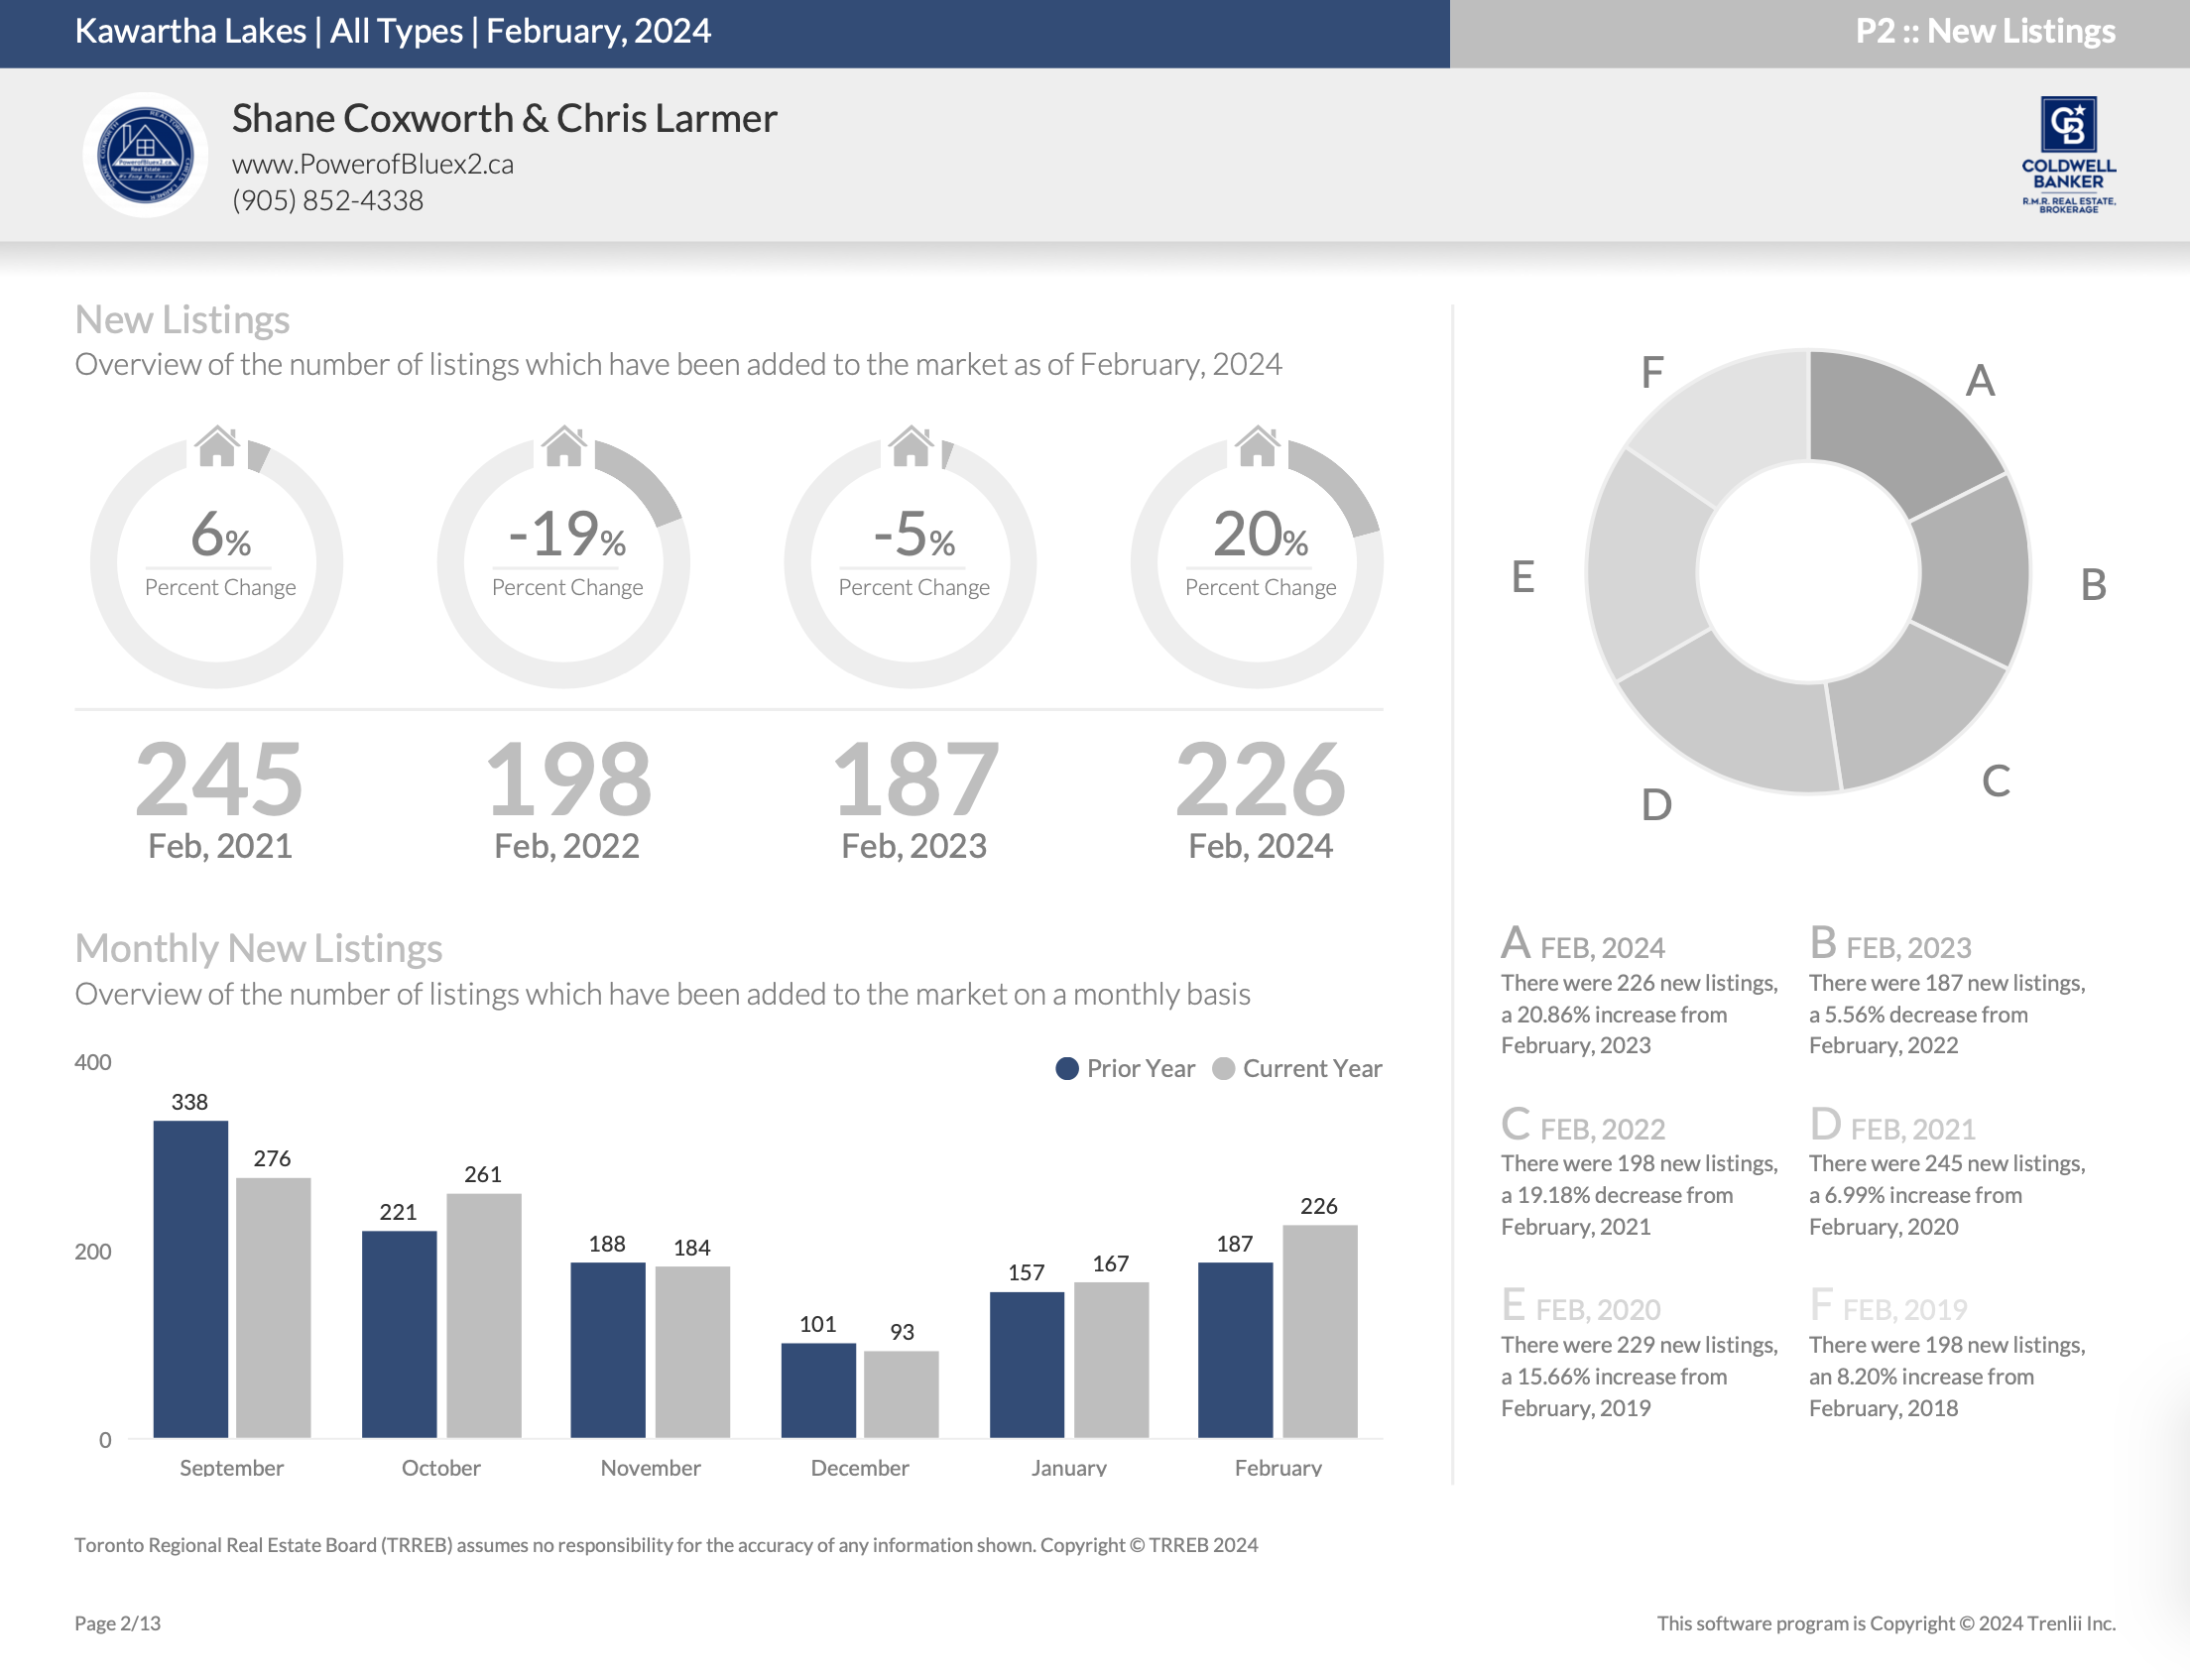
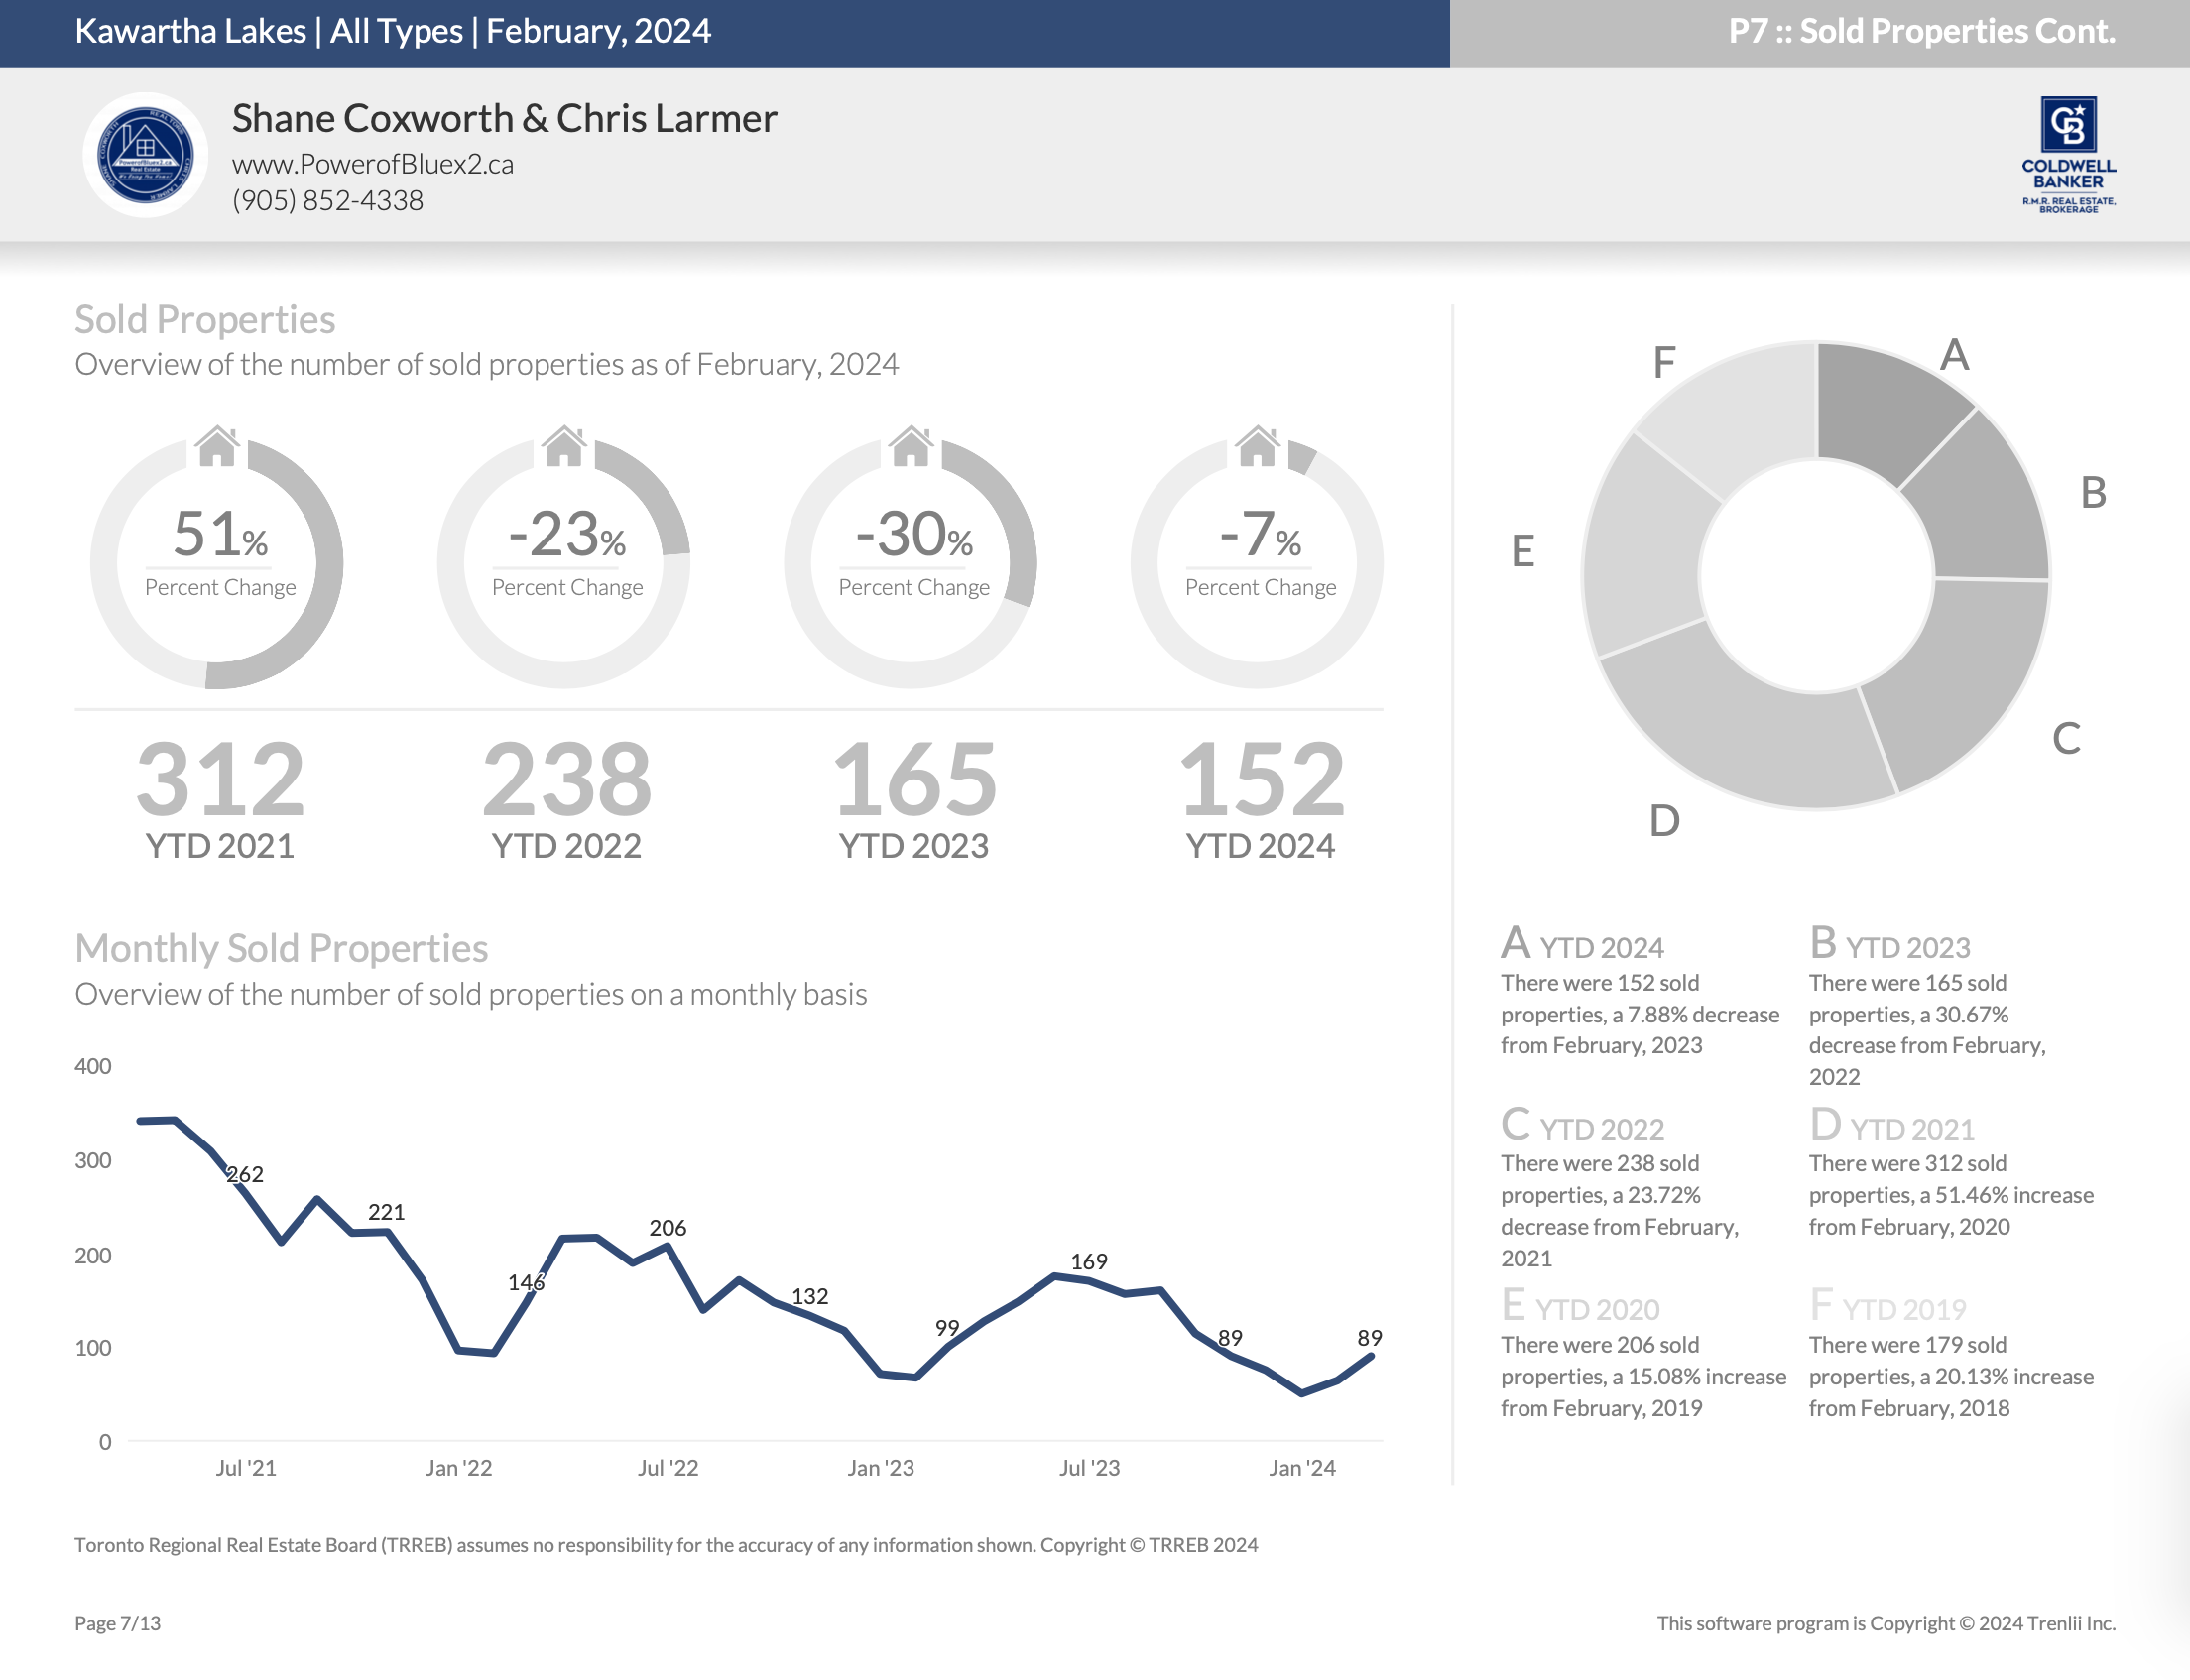
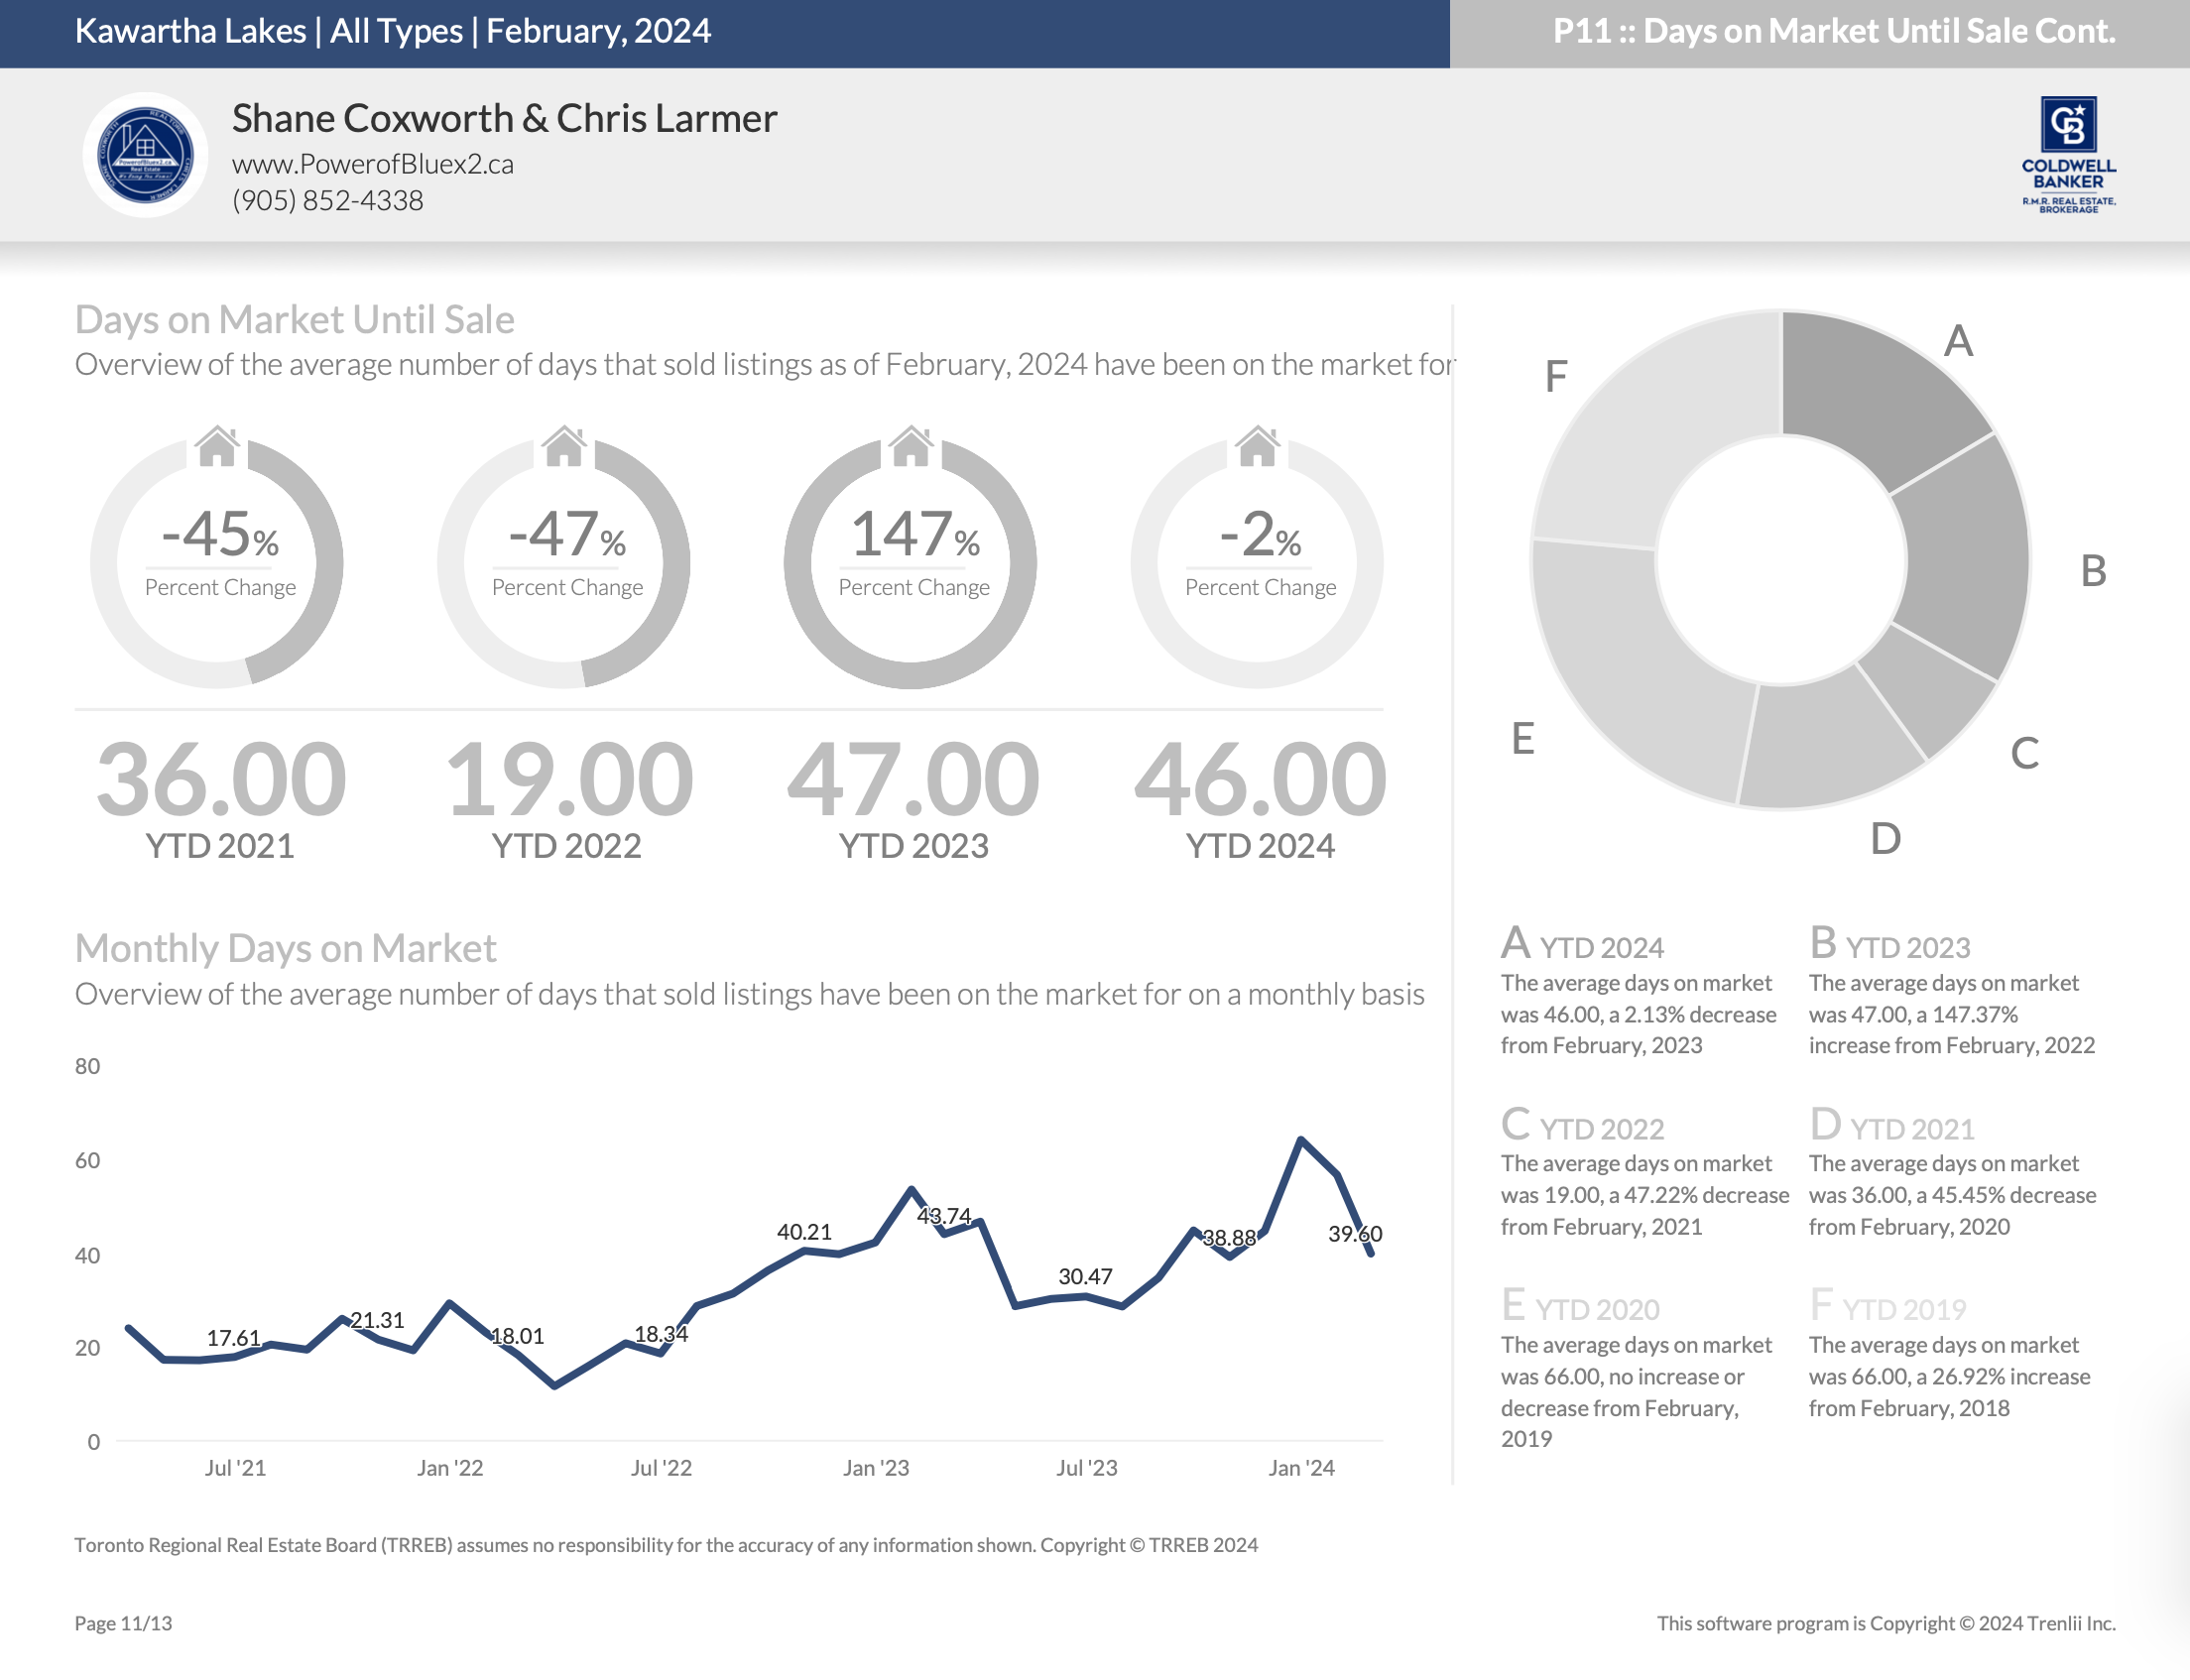
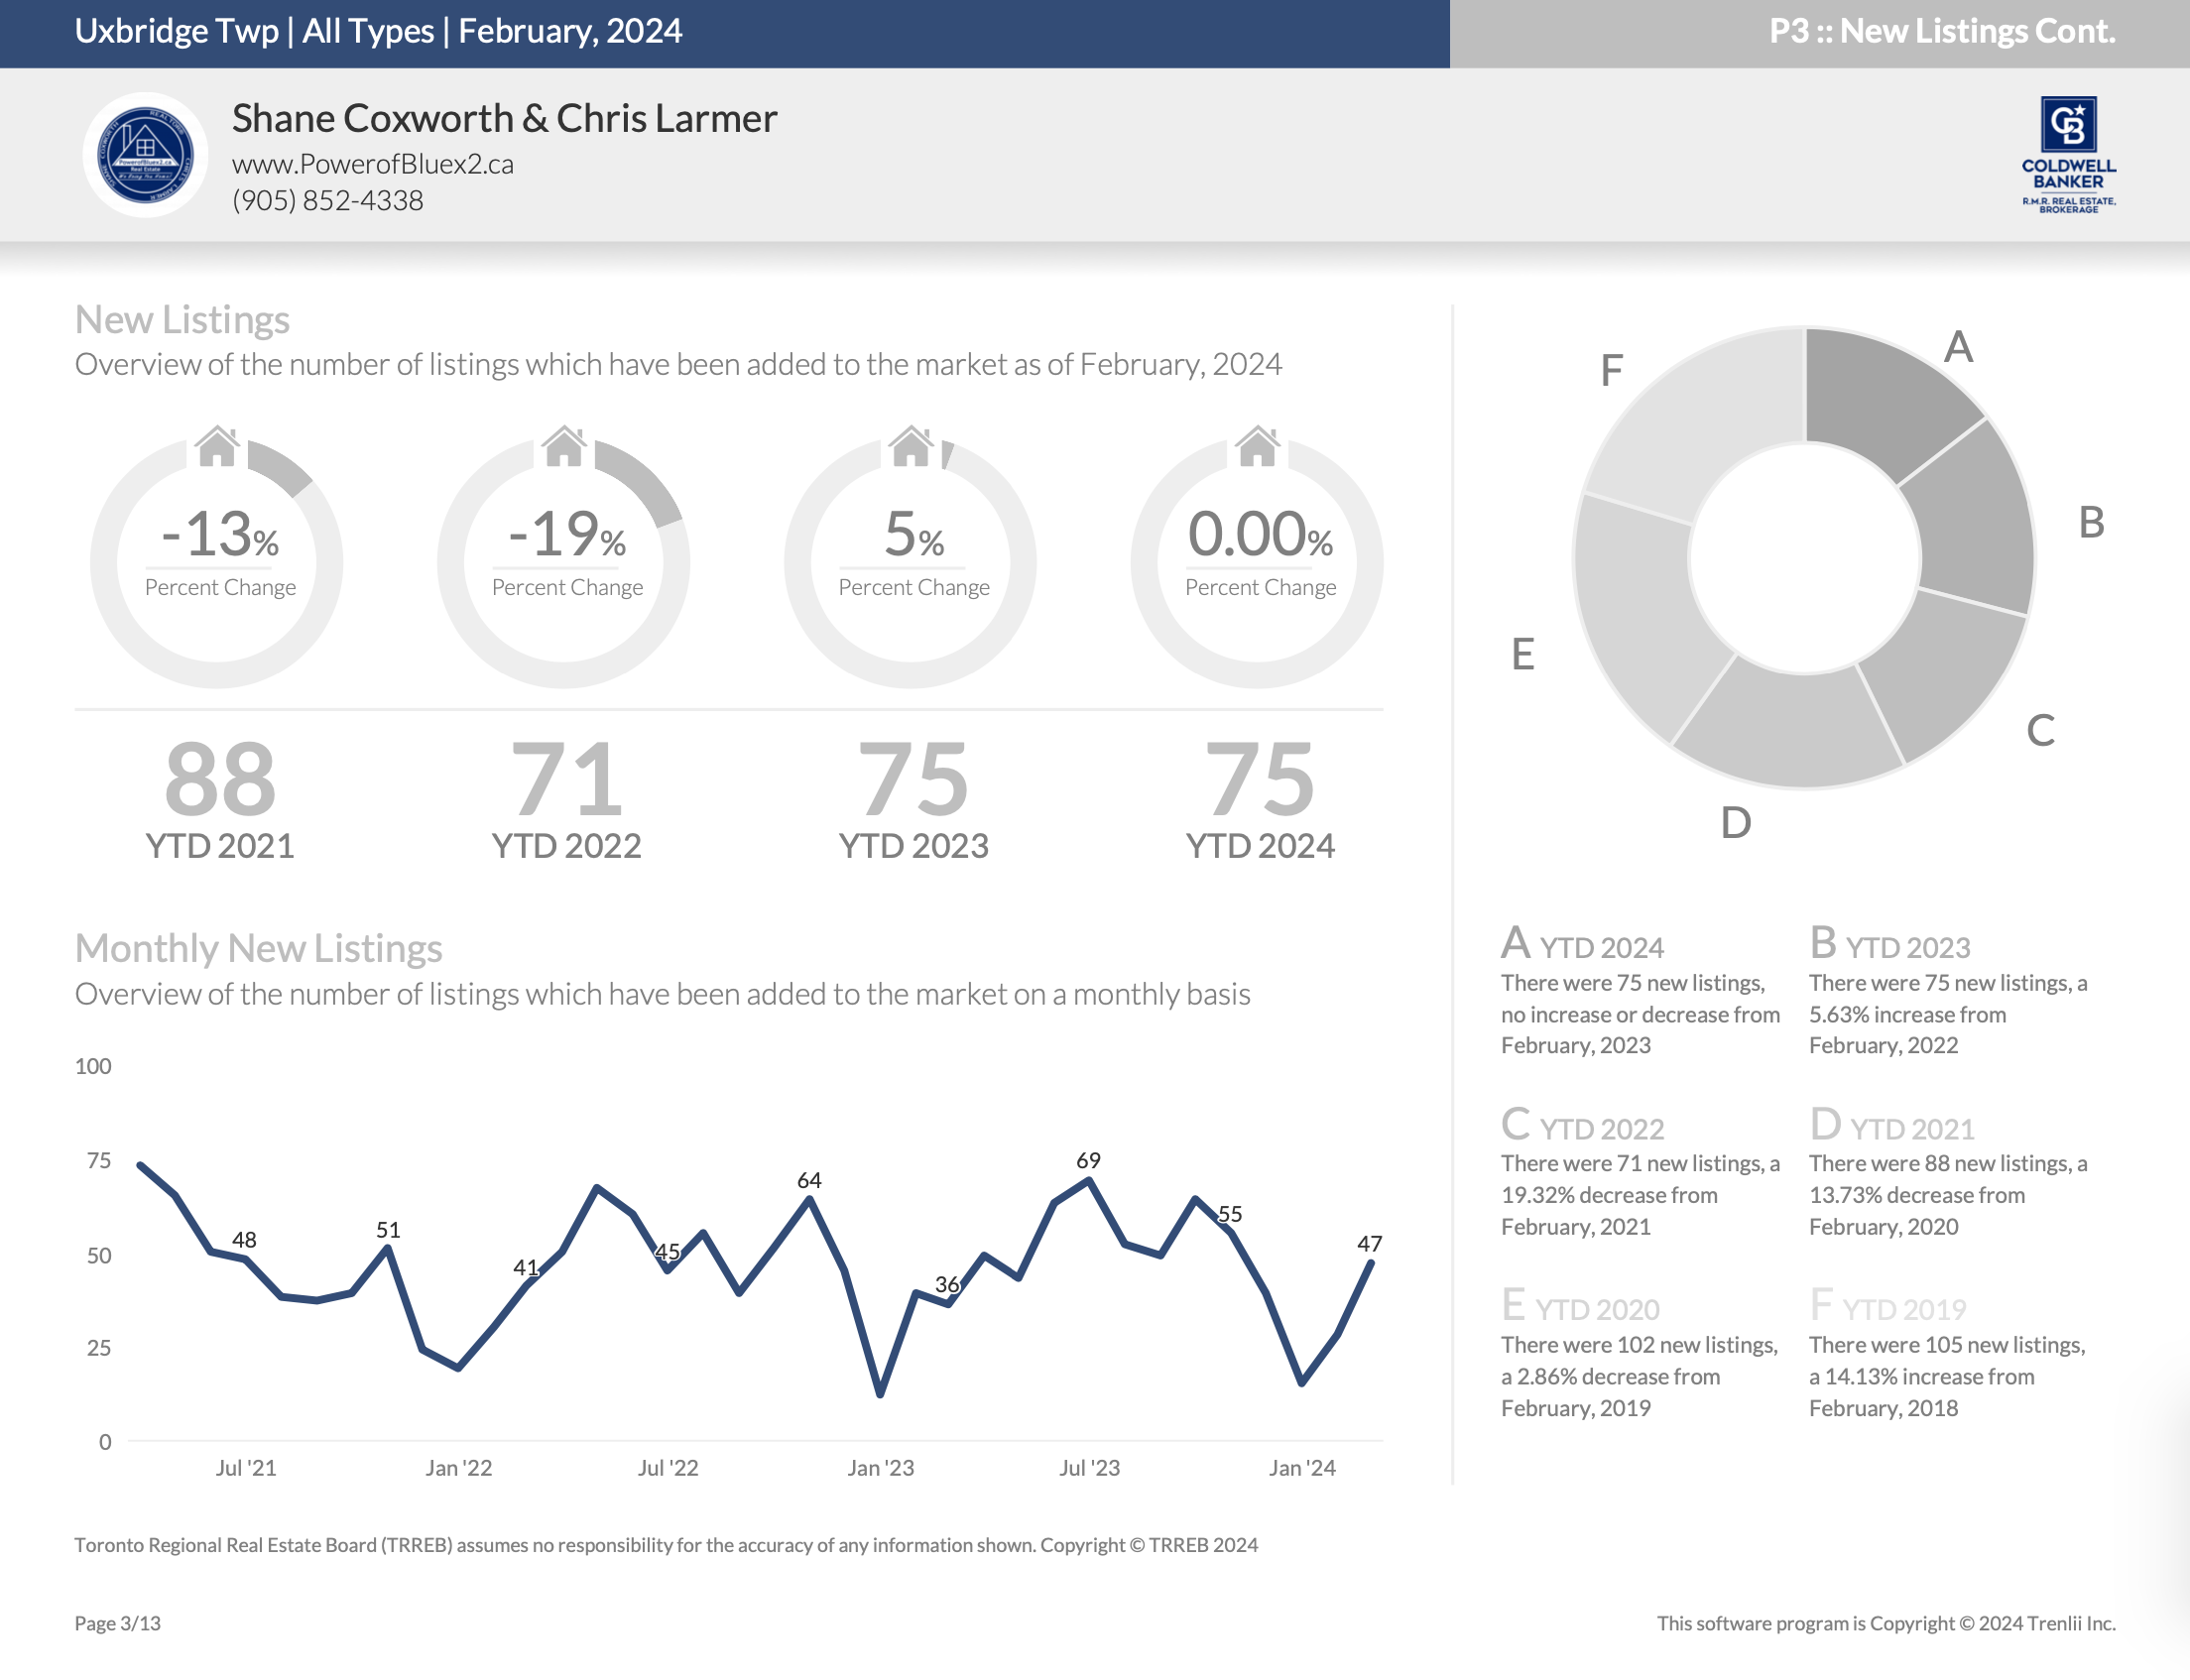
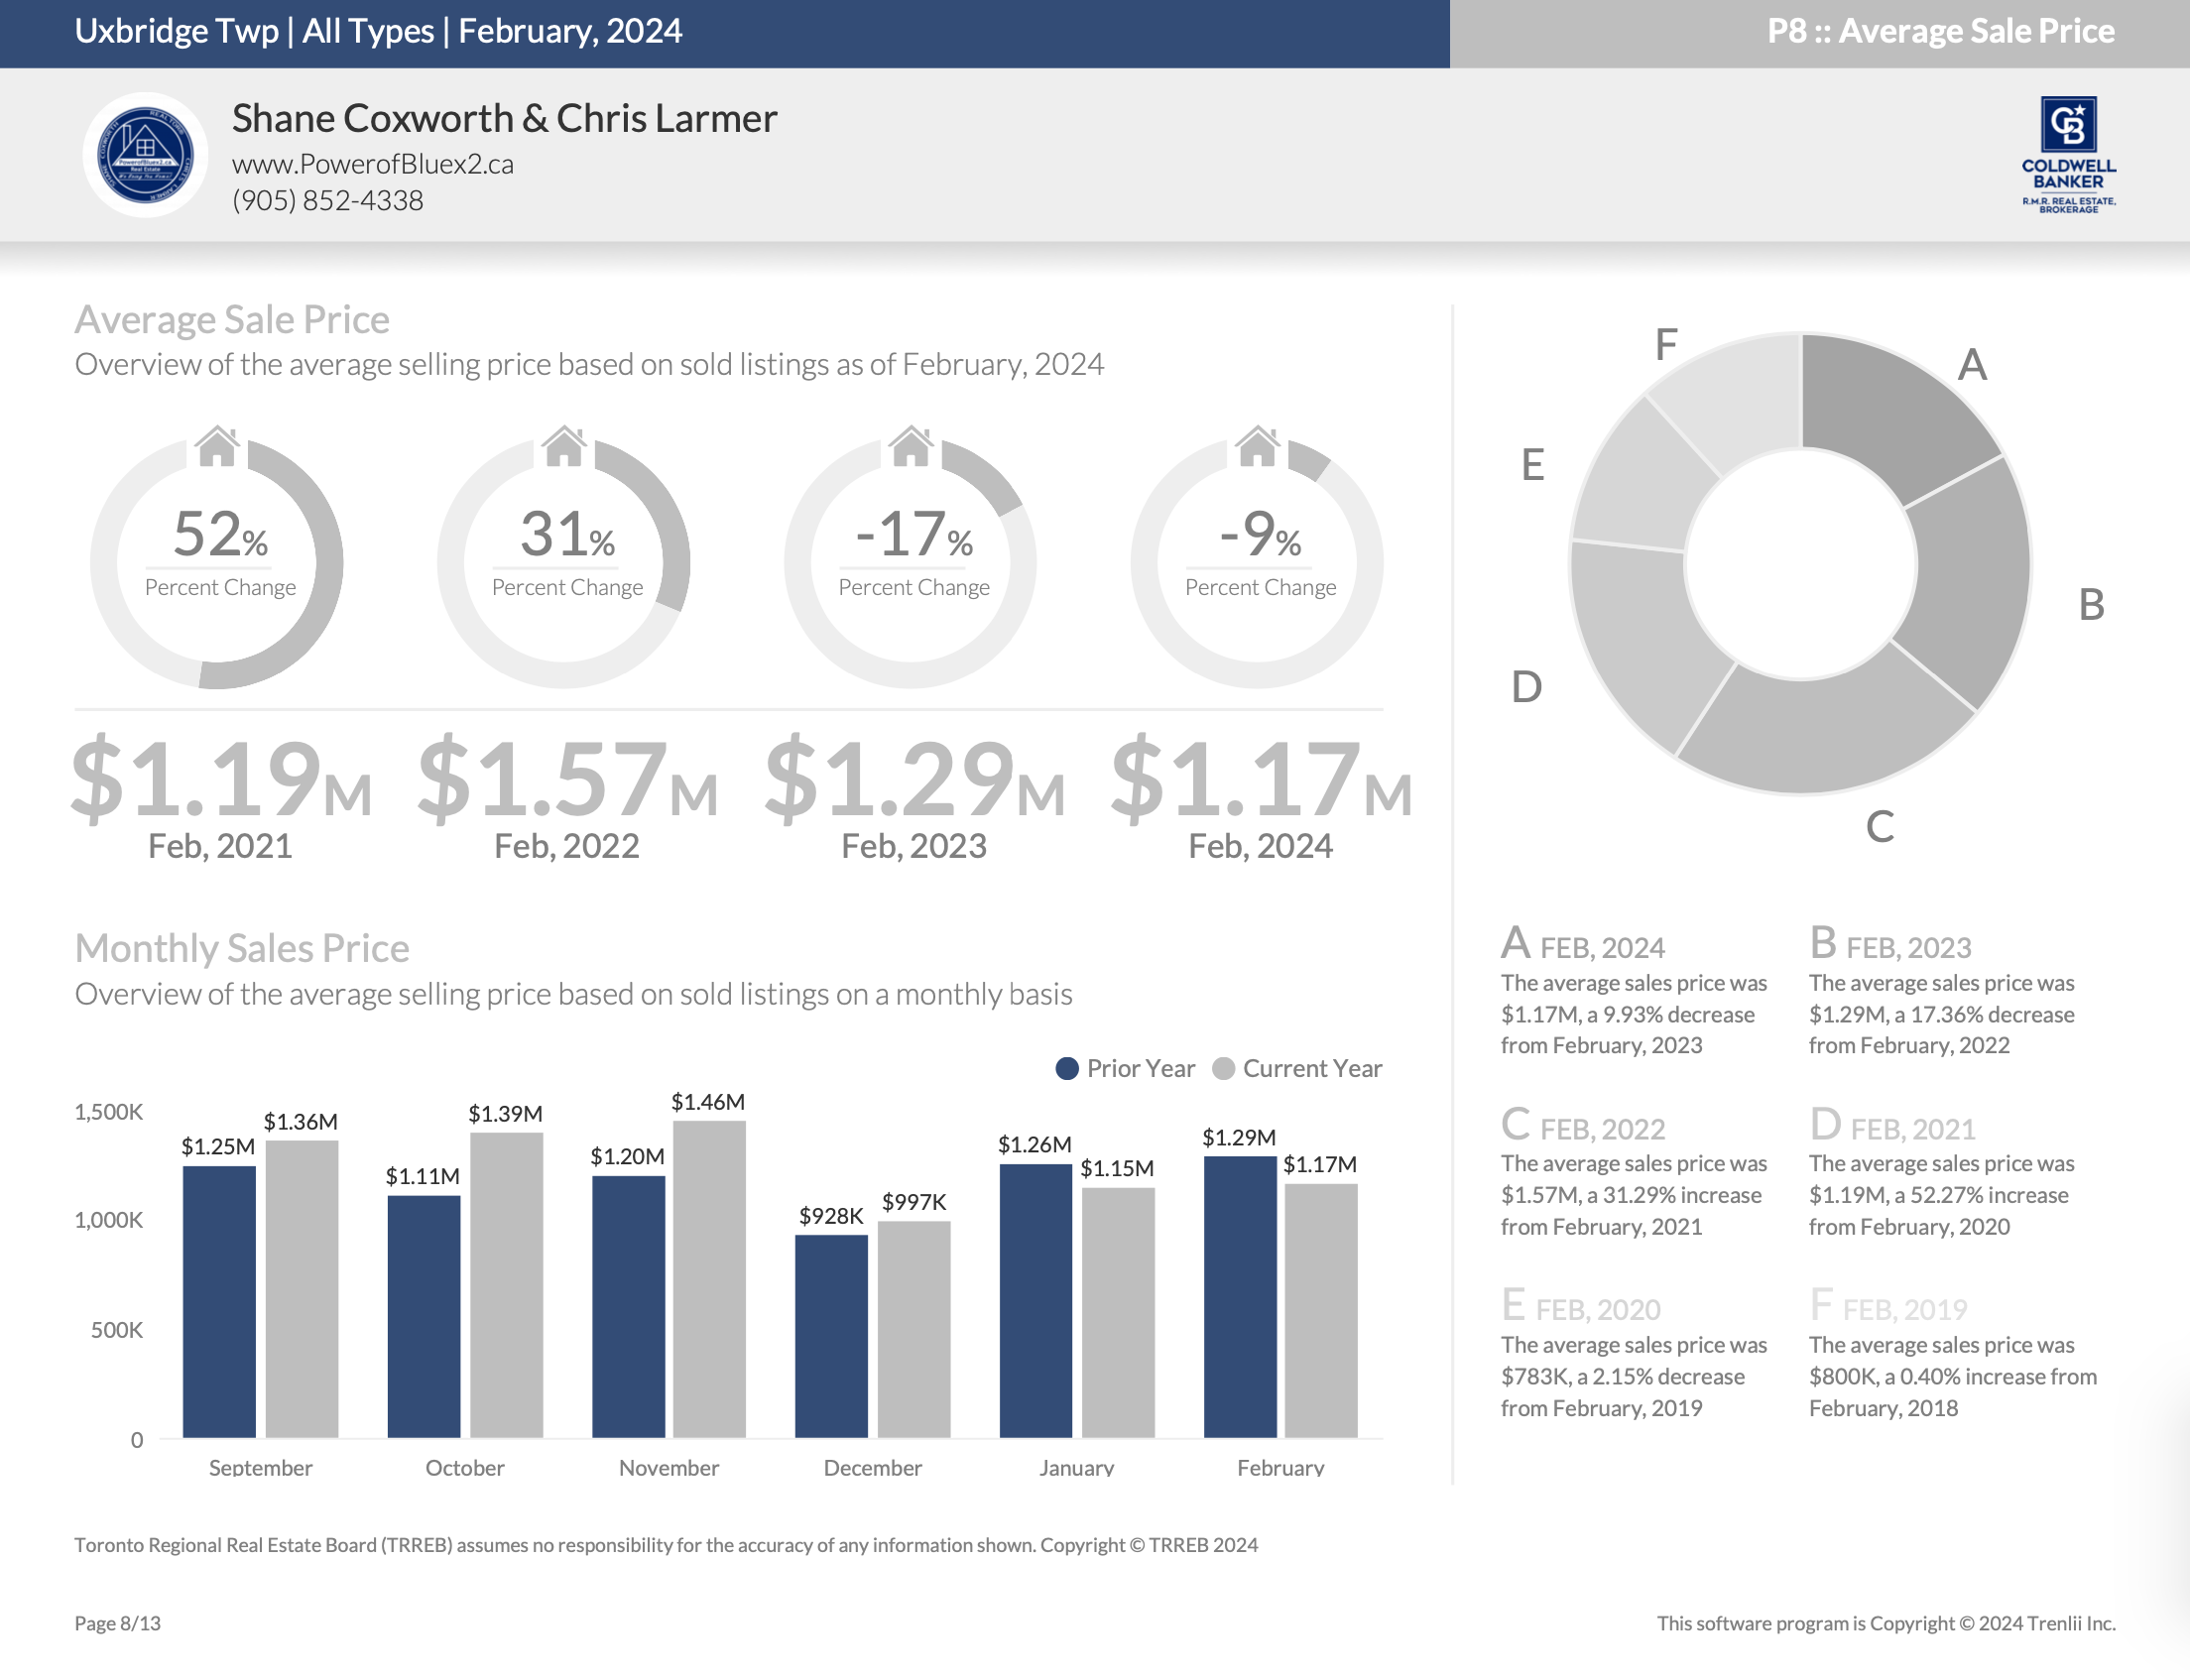
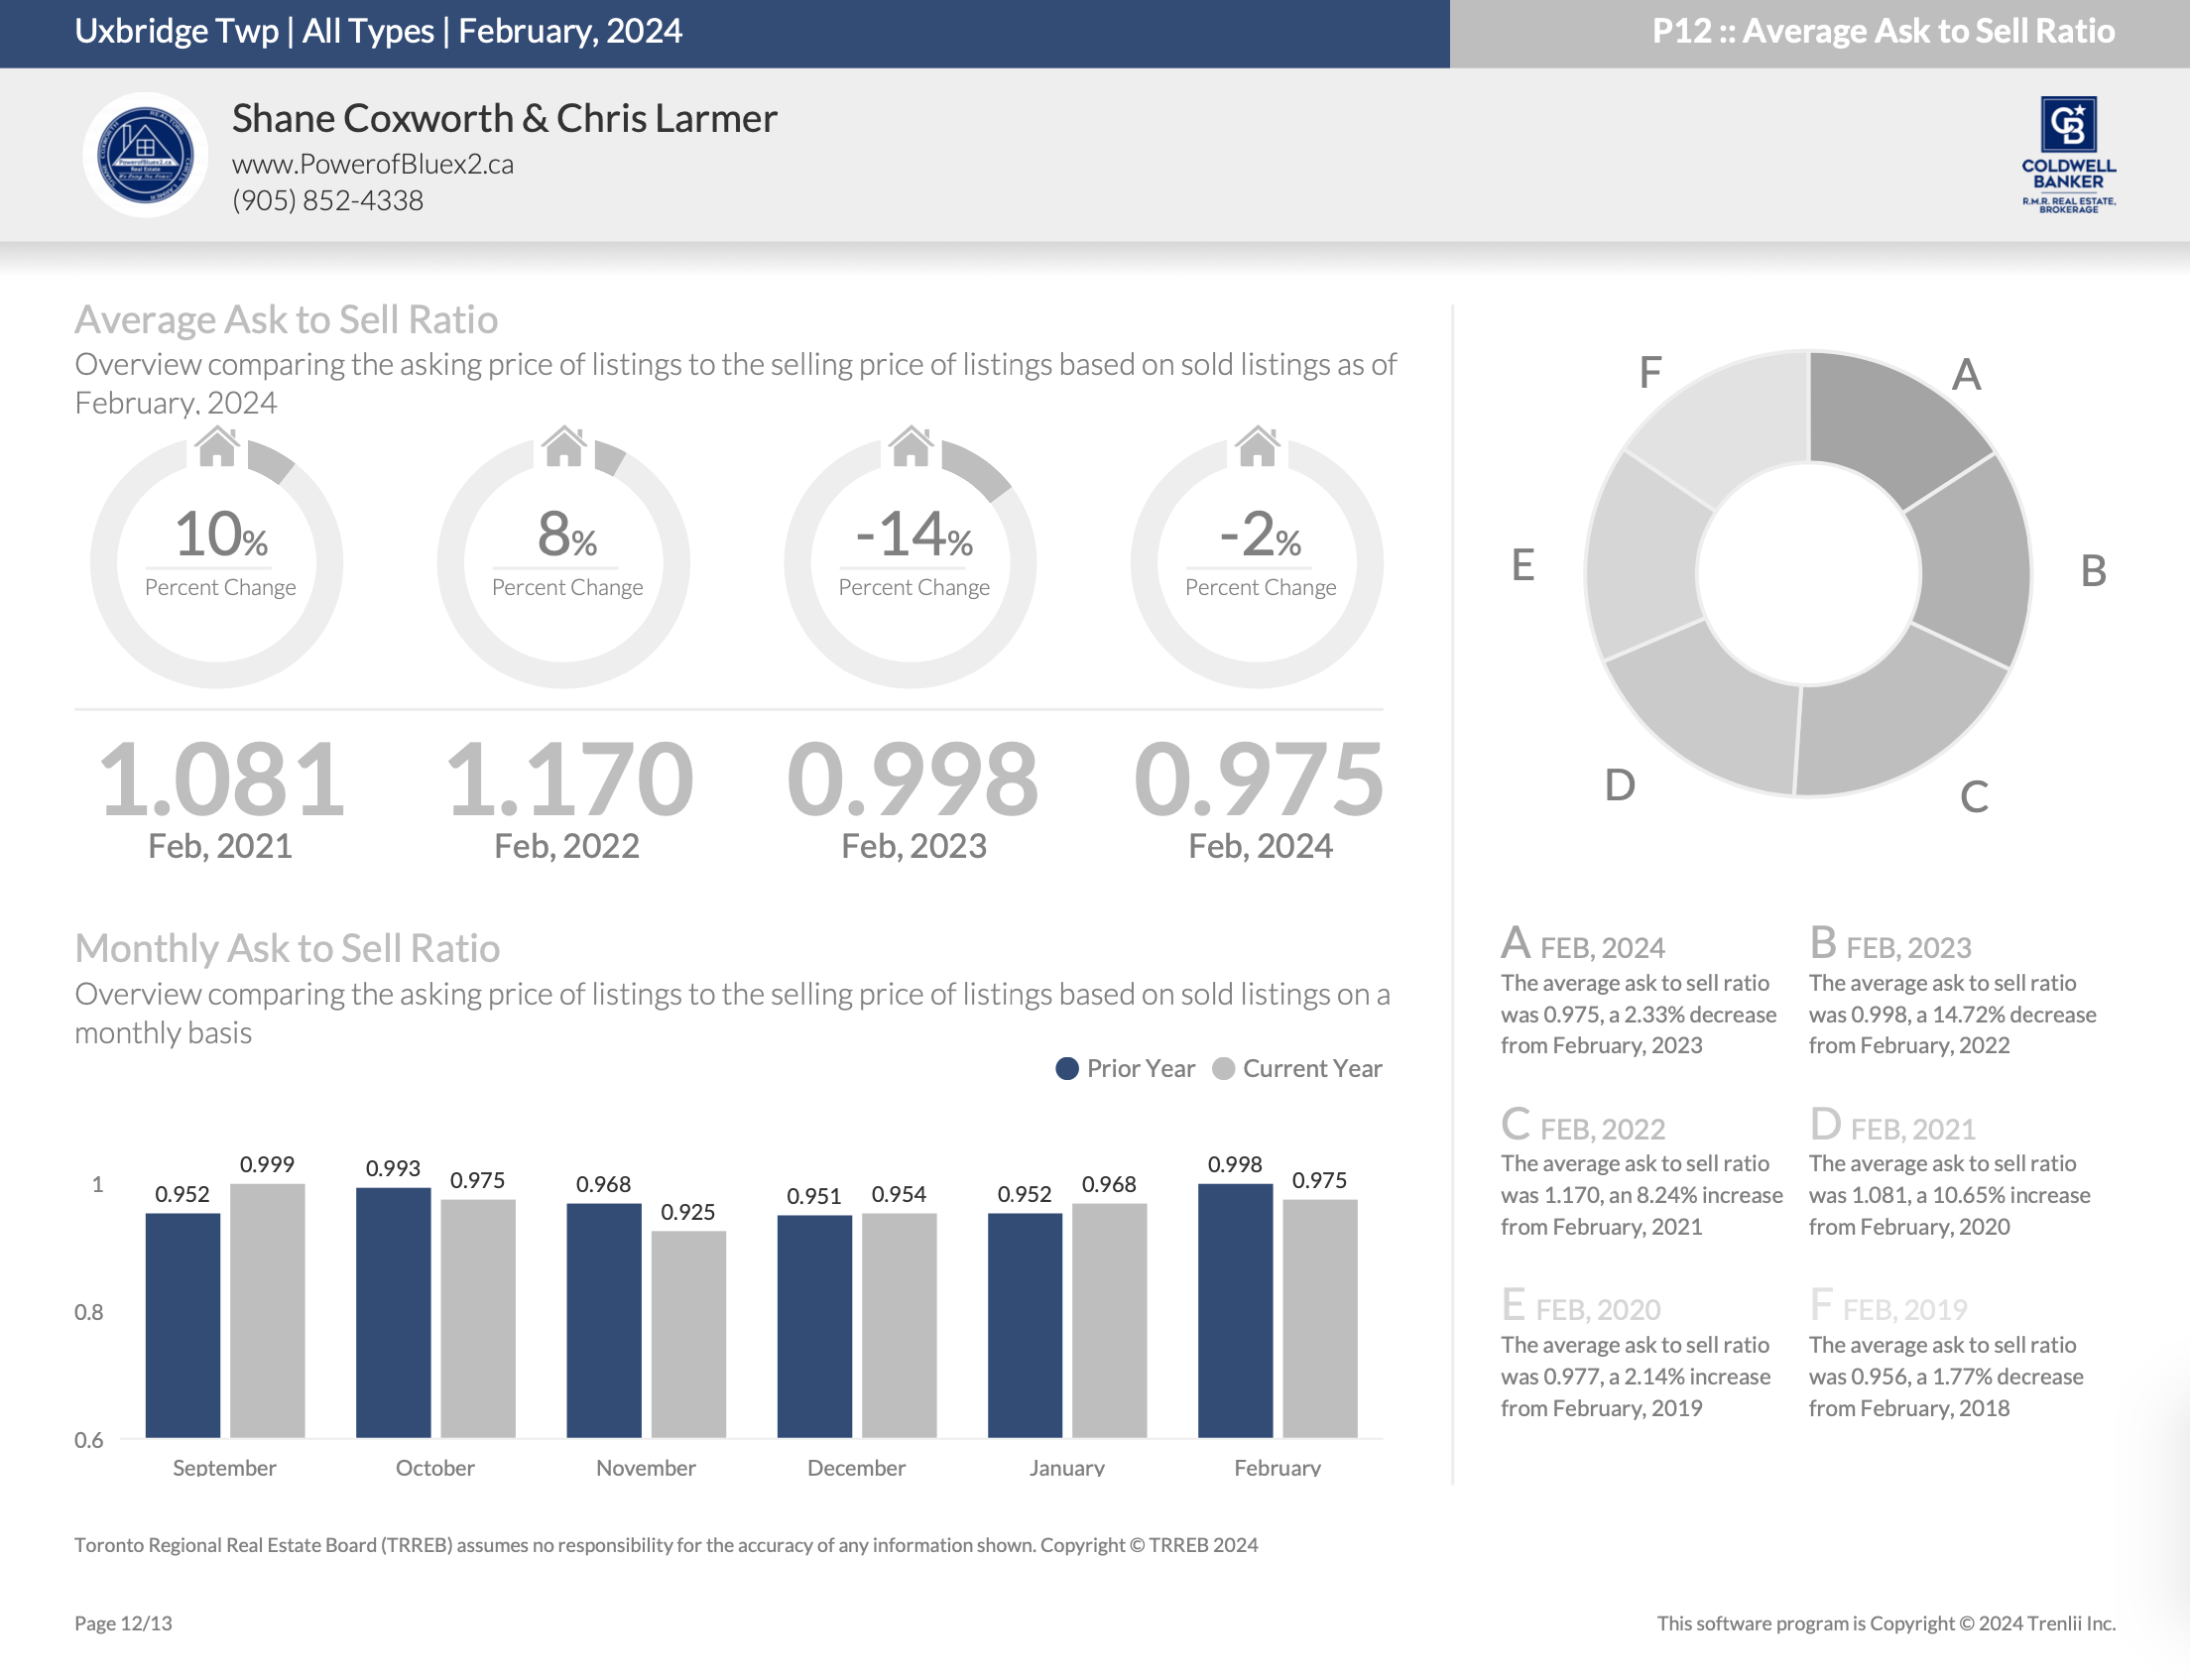
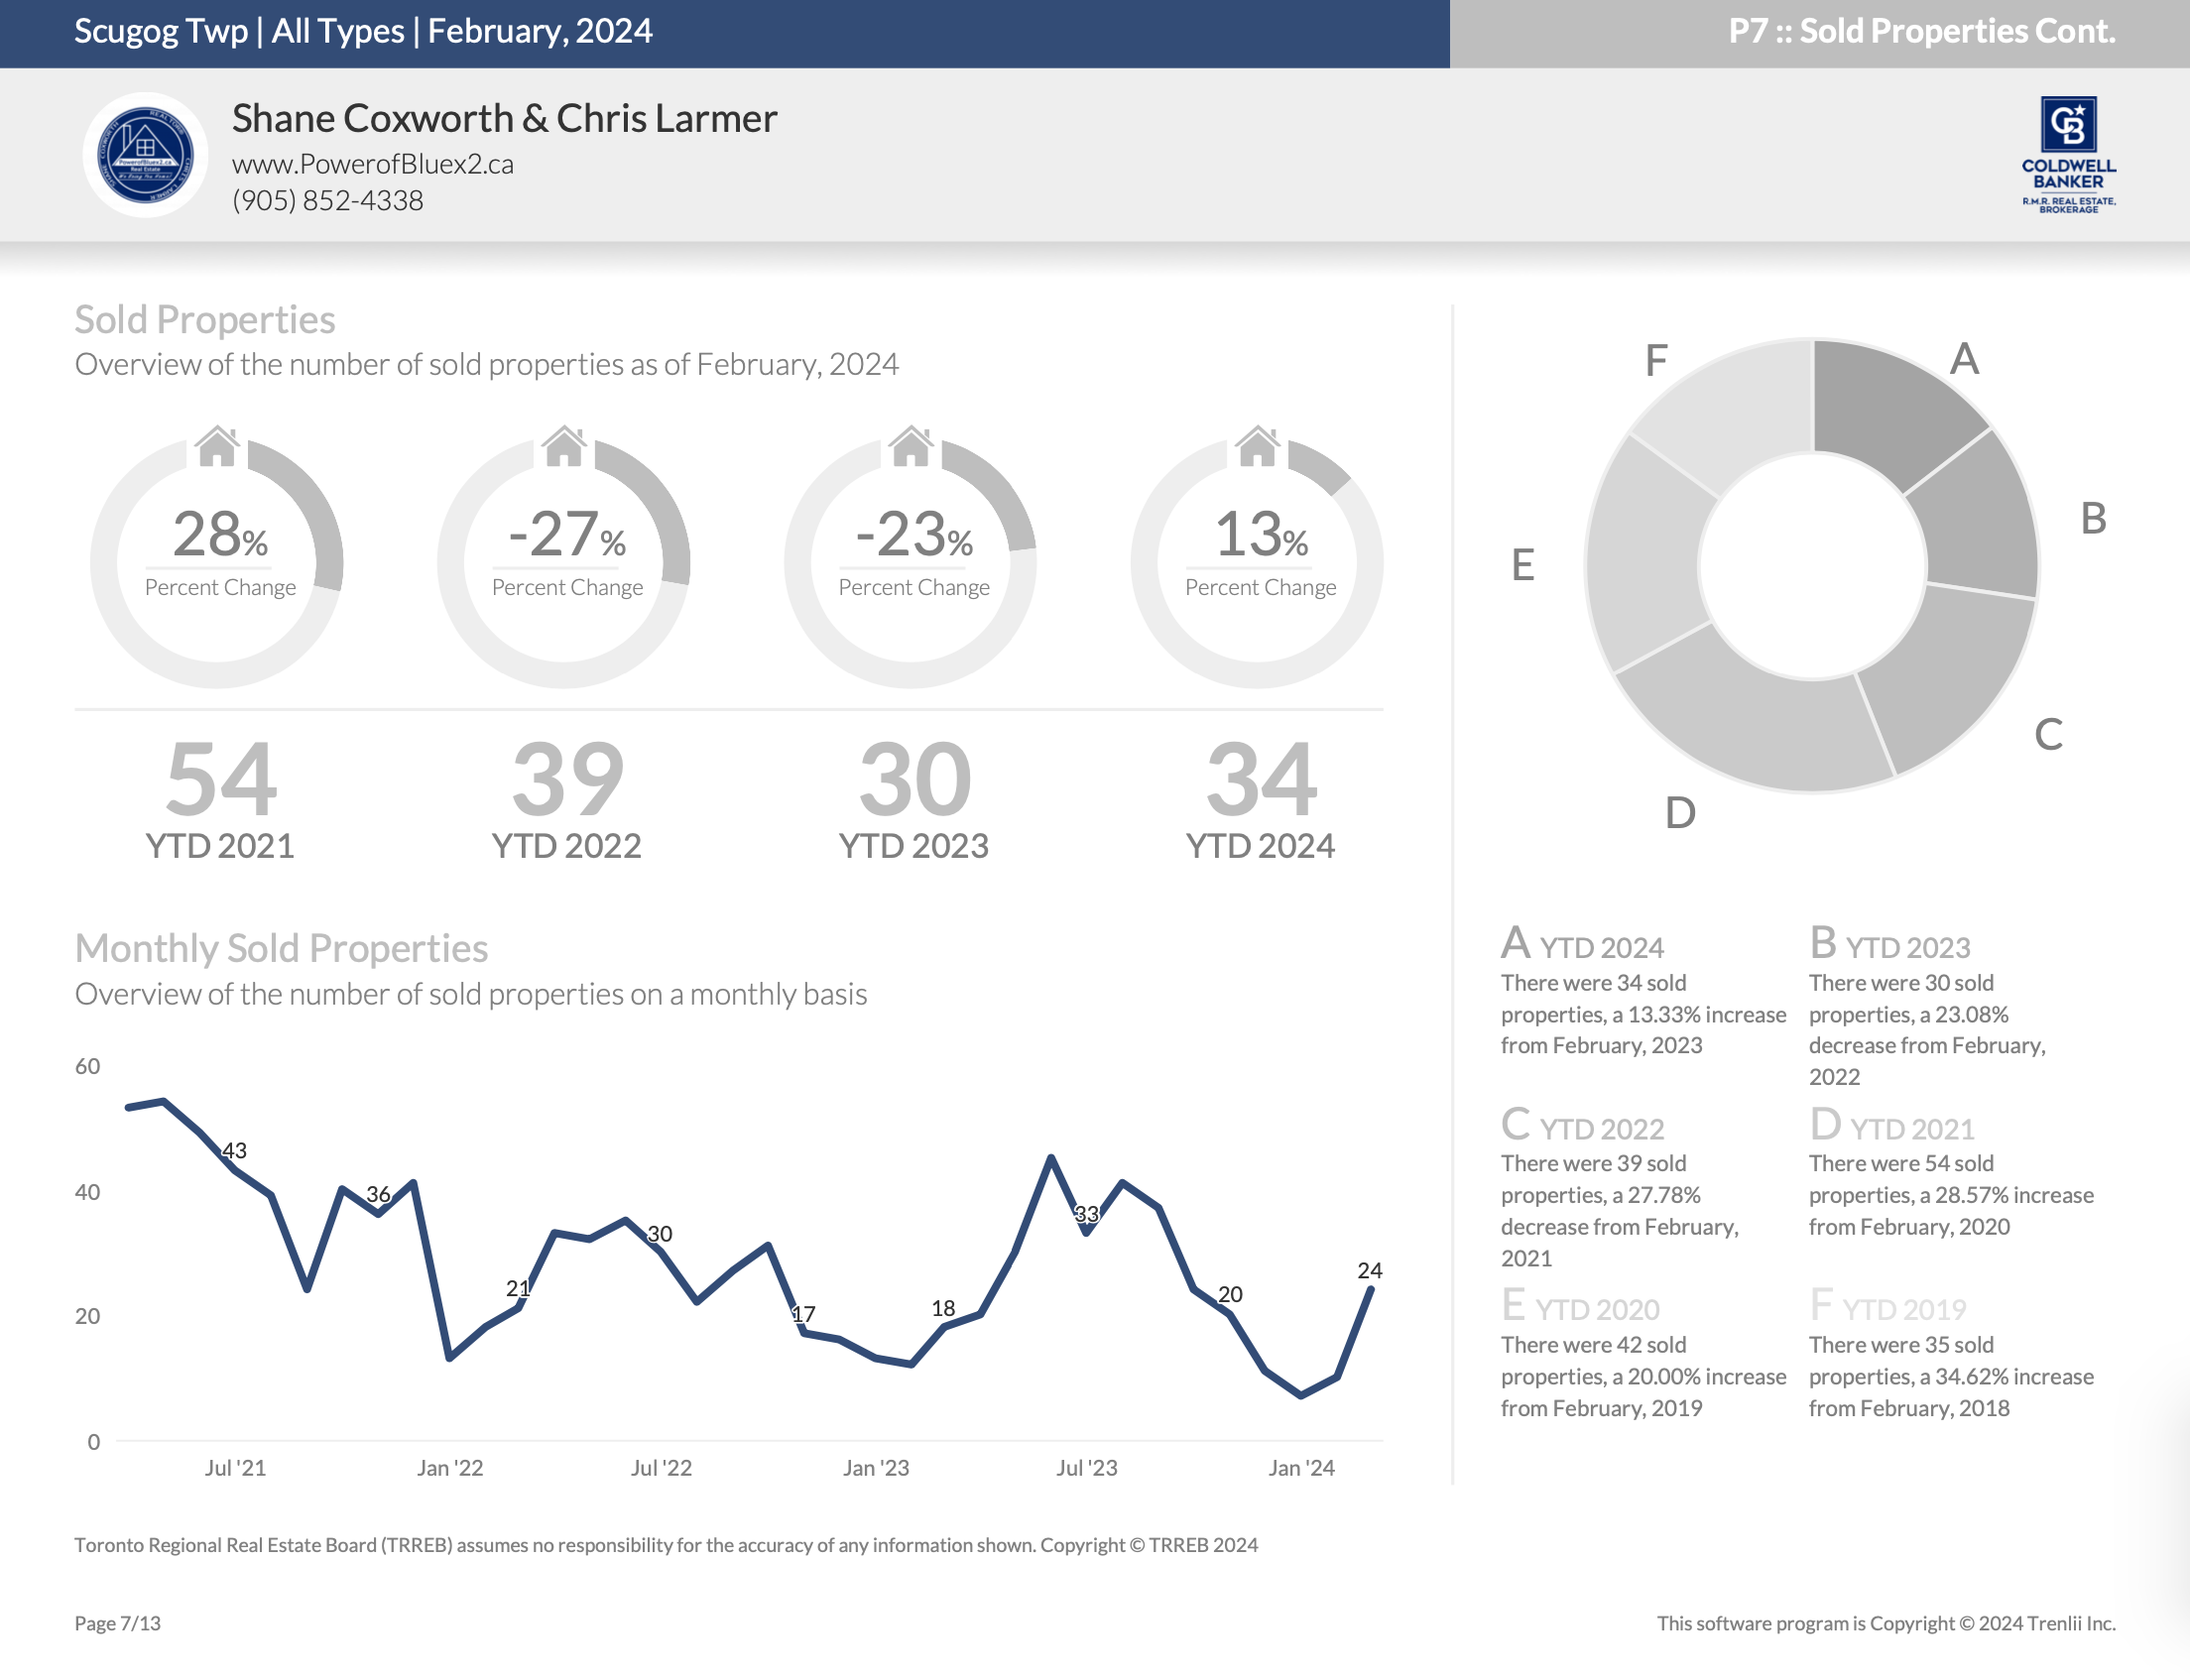
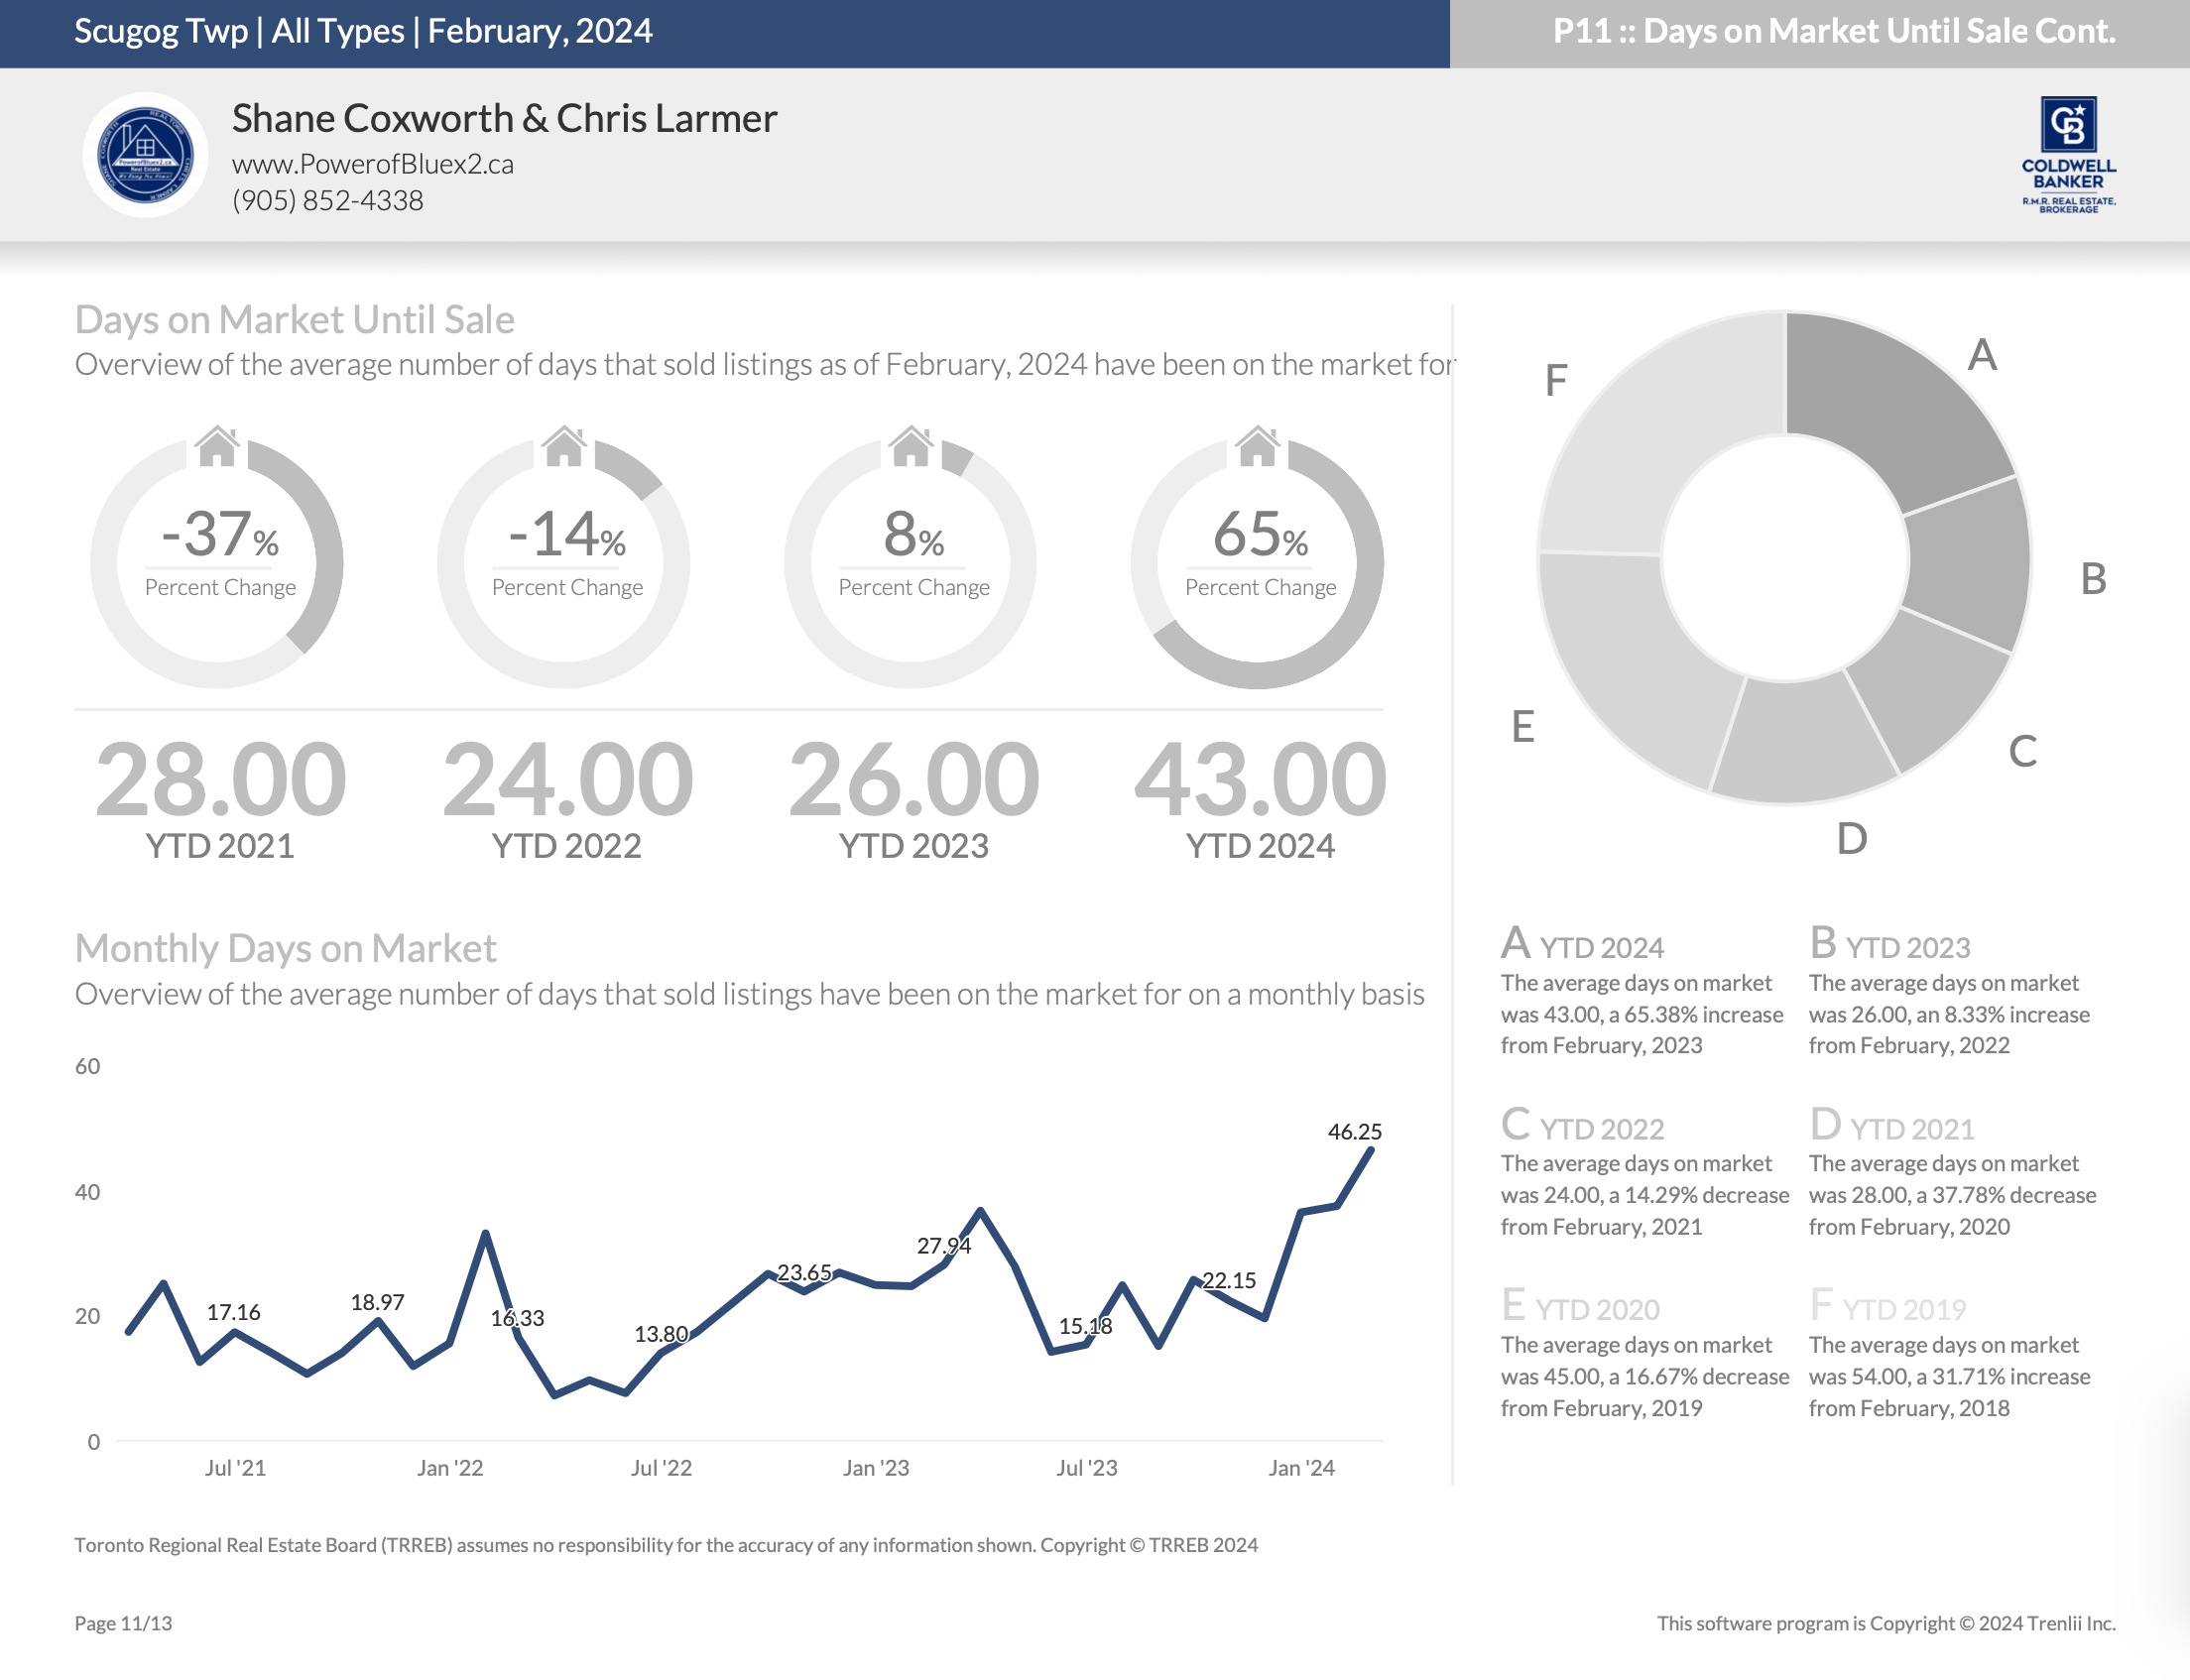
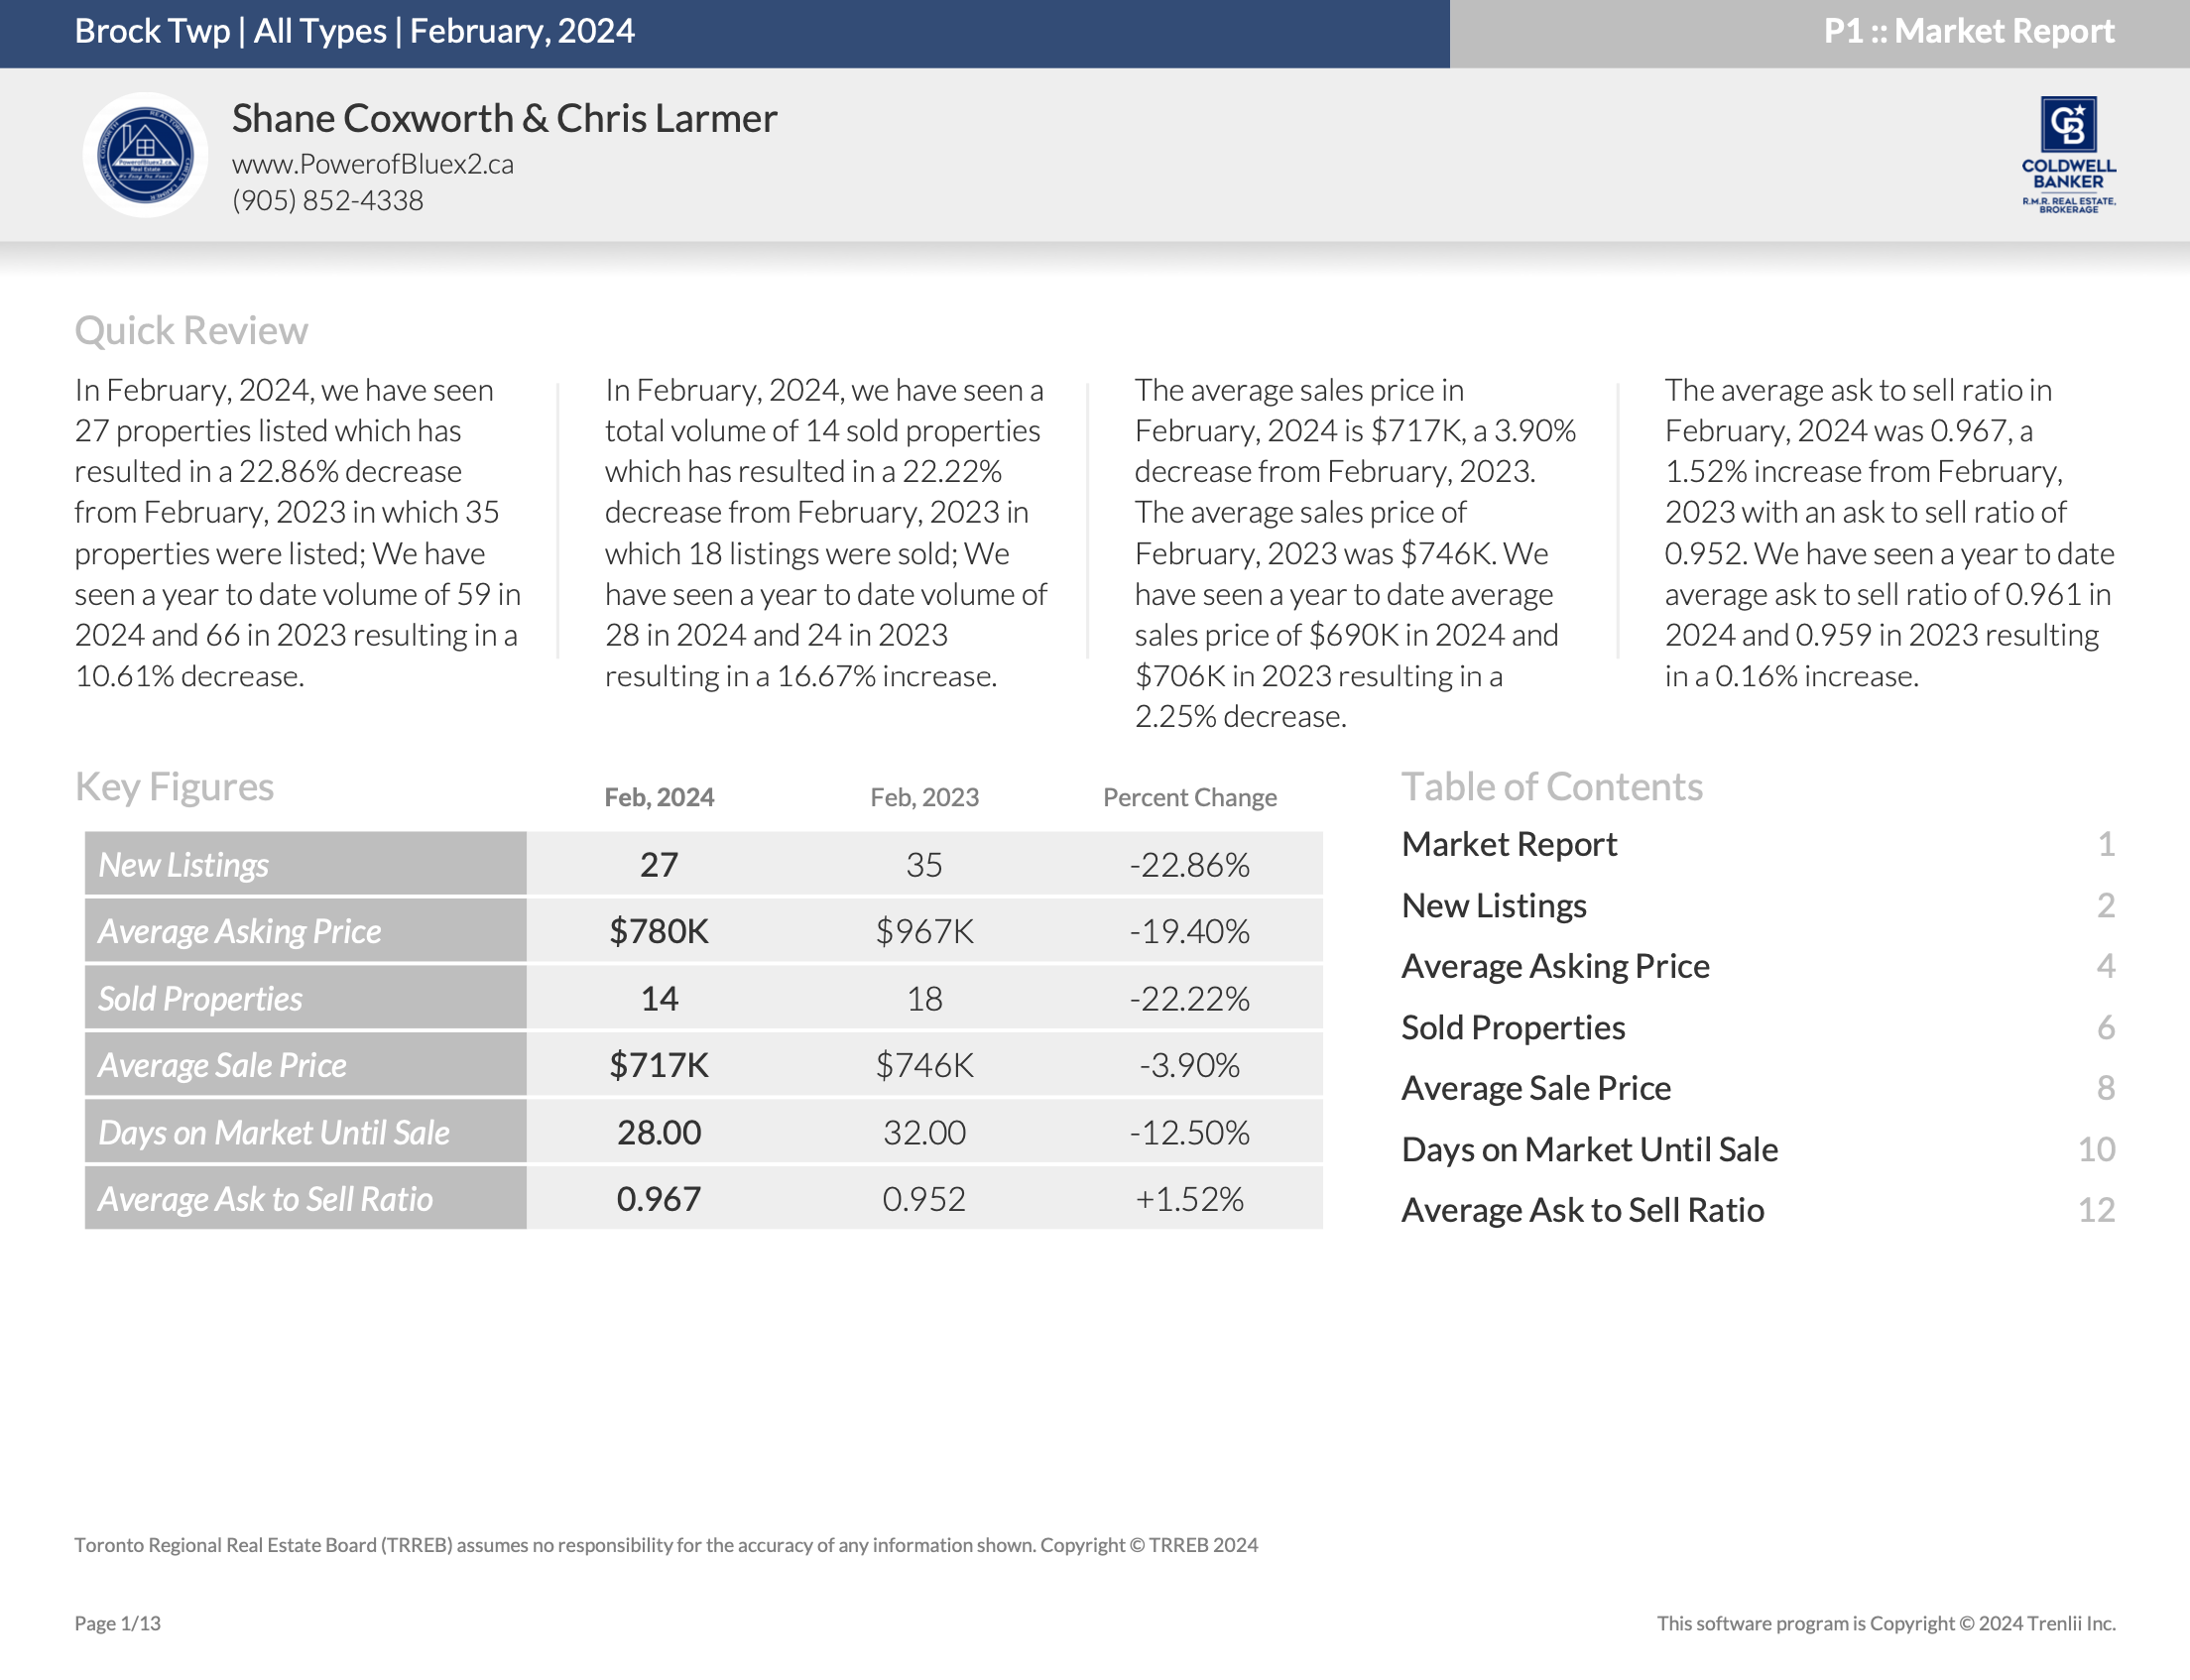
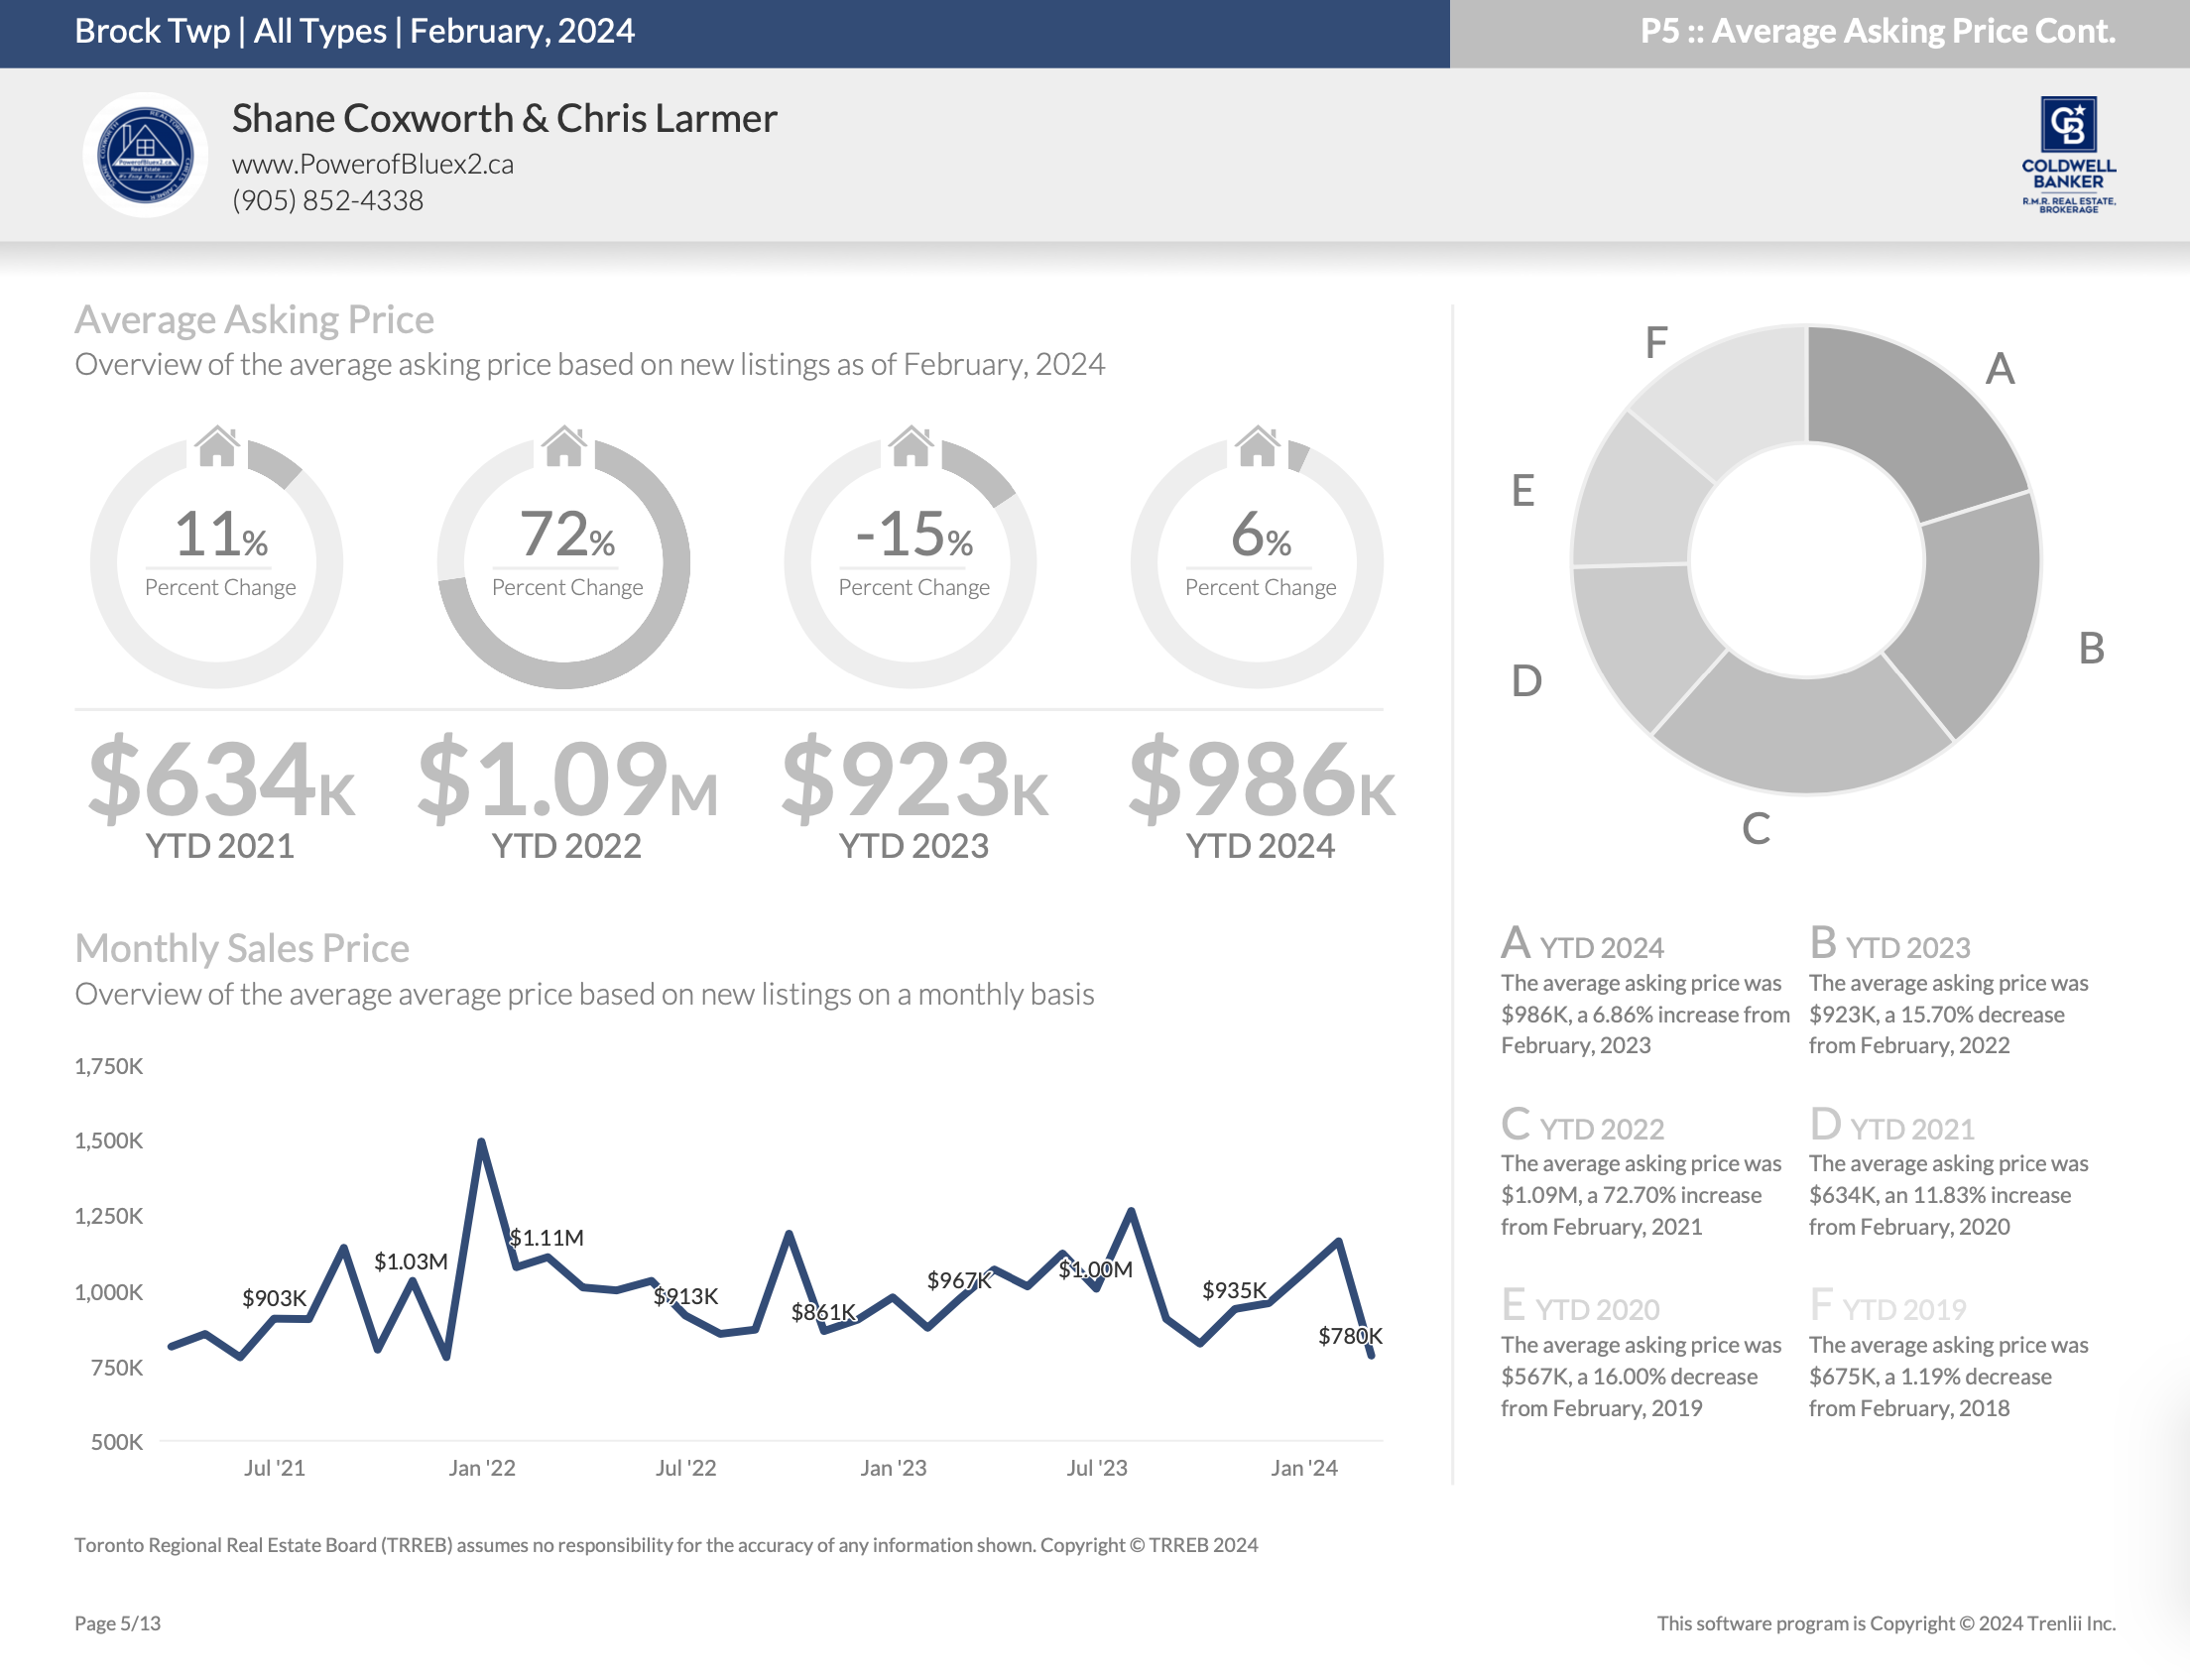
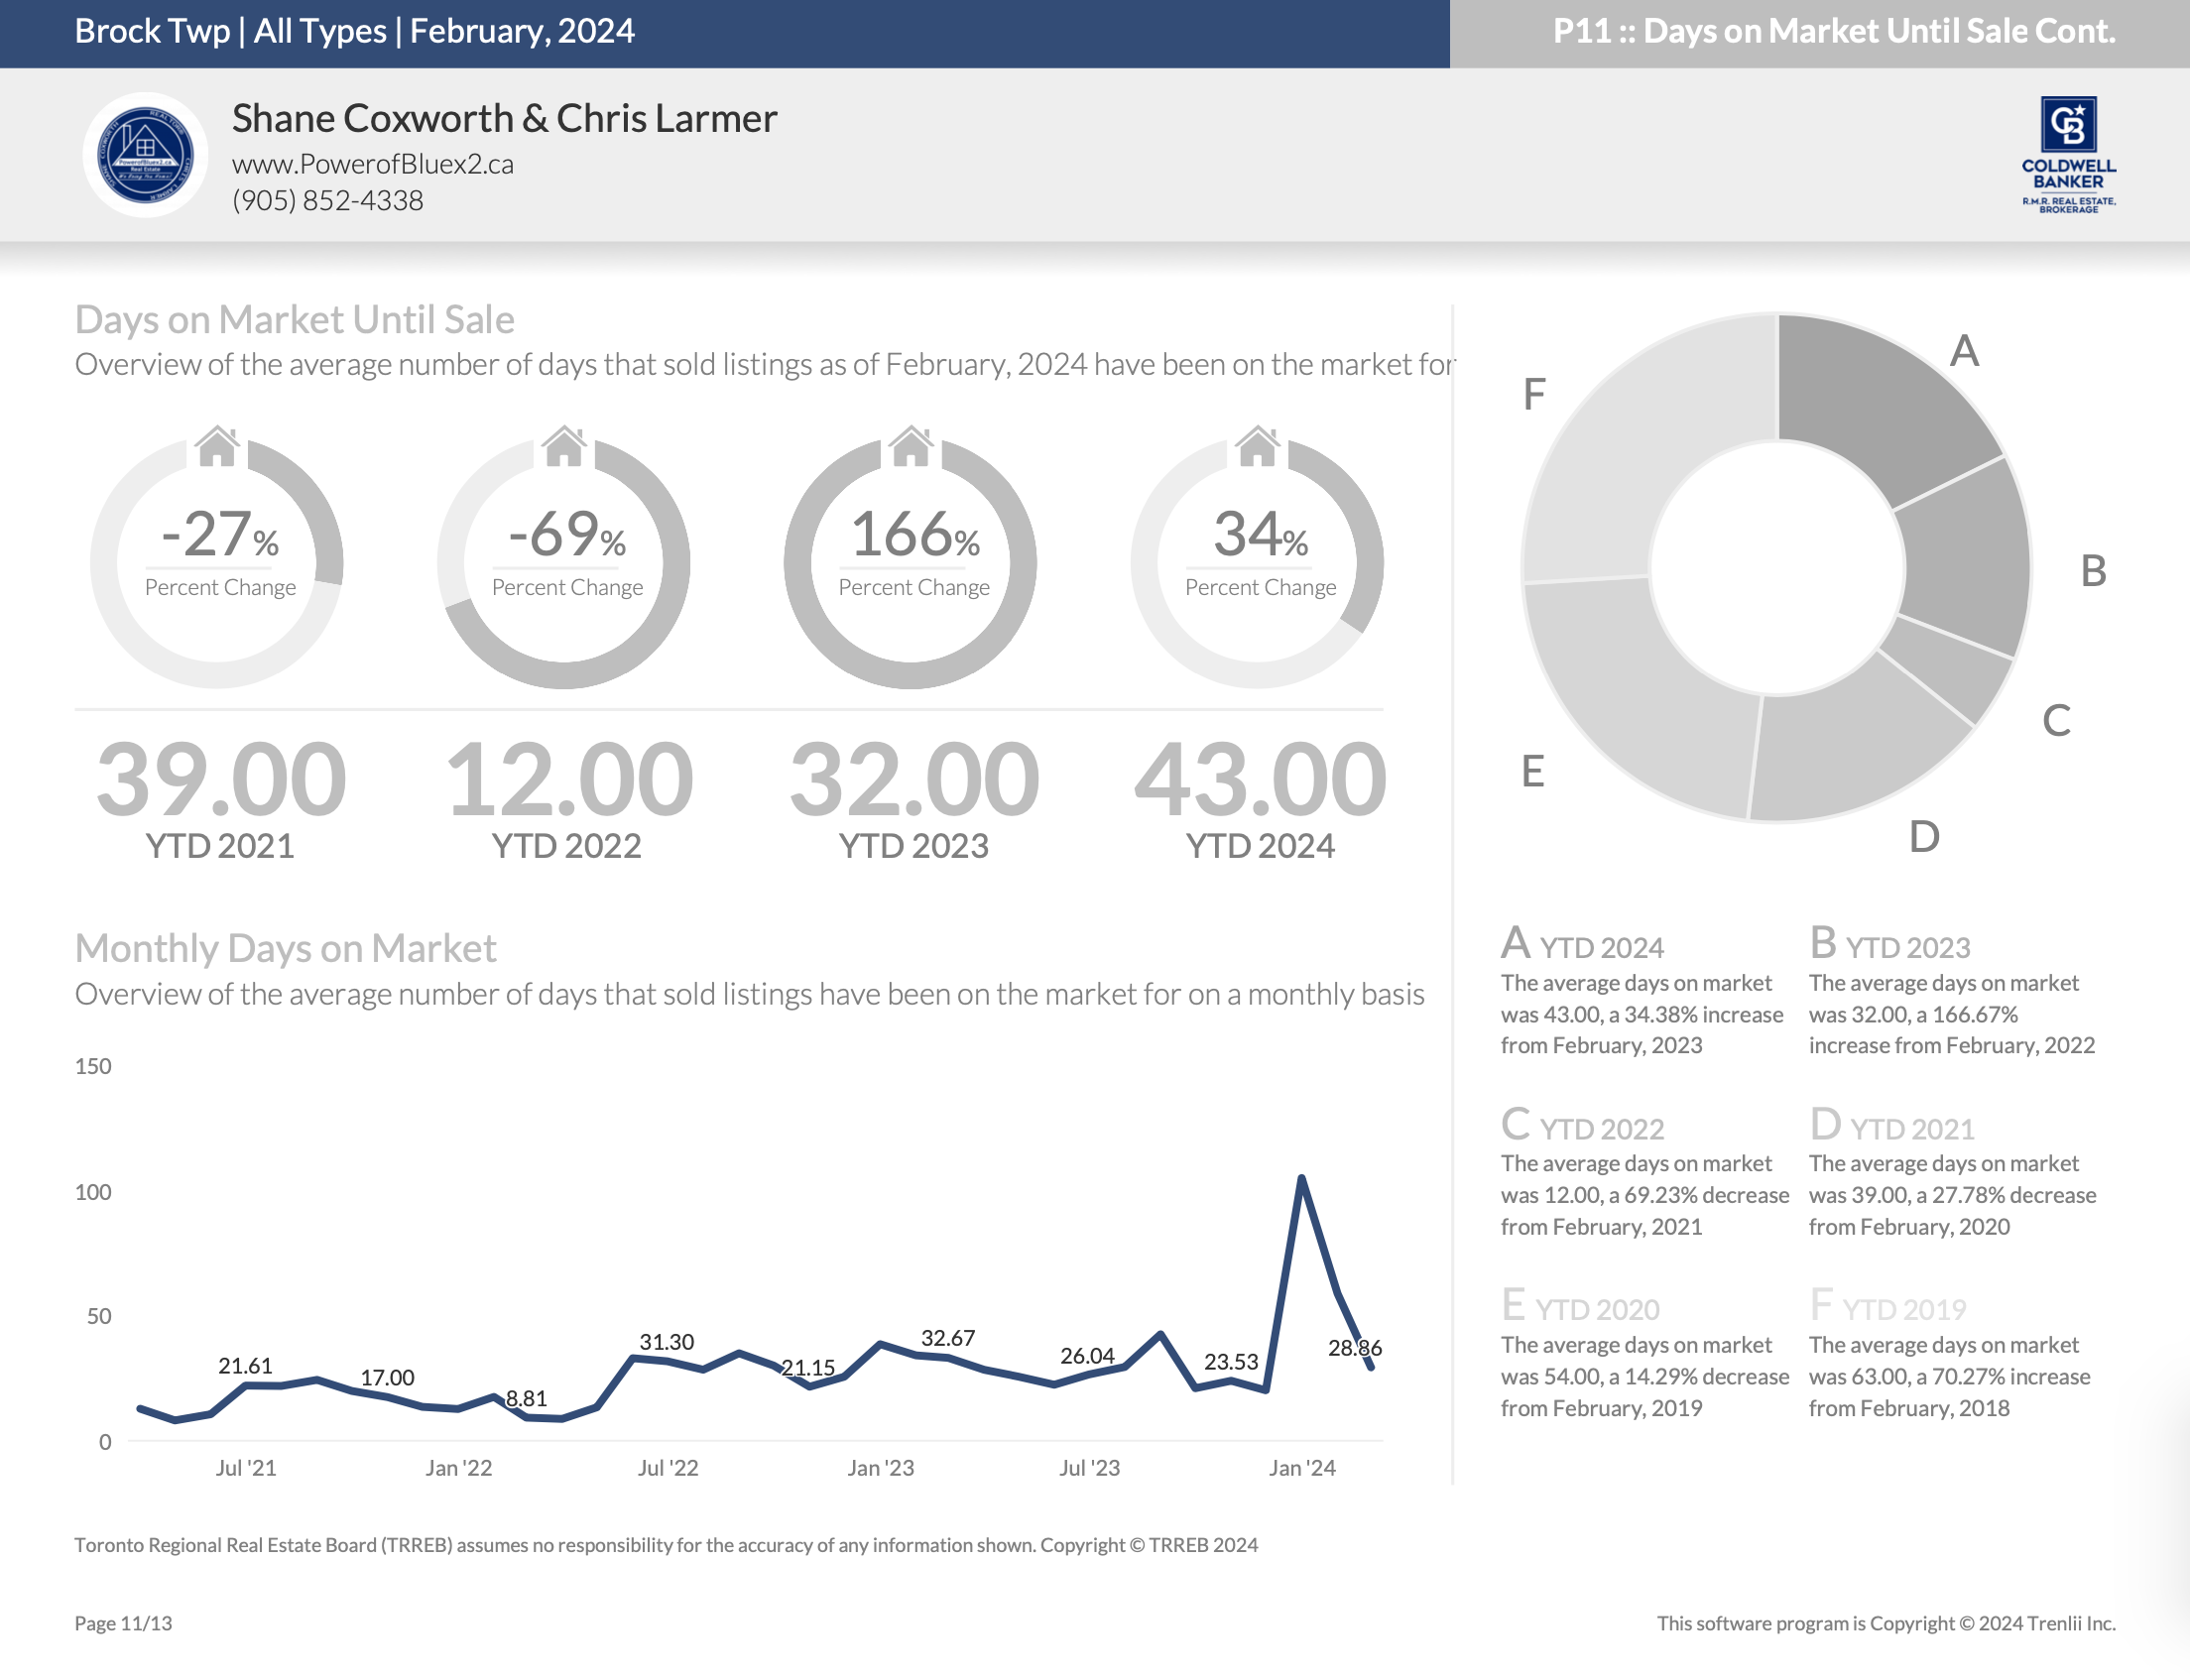
This housing report for Durham Region includes the number of new listings, average list price, number of properties sold, average selling price, average days on market and average asking price to selling price ratio for all property types within the Region of Durham.
Scroll to the bottom for links to take you to the housing market reports for Uxbridge, Scugog, Brock and the Kawartha Lakes.
From Toronto Regional Real Estate Board
Toronto Regional Real Estate Board – Market Stats At A Glance – February 2024
Check out our Uxbridge and Scugog Events Pages to keep up to date on whats going on around town. Click the links or scan the Code with your phone to take you directly there.
Check out our Uxbridge and Scugog Events Pages to keep up to date on whats going on around town. Click the links or scan the Code with your phone to take you directly there.
Discover The Second Wedge Brewing Co., a local gem inspired by Uxbridge’s scenic trails. Since 2015, they’ve ignited a passion for craft beer, evolving into more than just a neighbourhood brewery. As a hub for community gatherings, they champion local music, art, and small businesses, enriching Uxbridge’s cultural tapestry.
Their tasting room, bottle shop, and inviting beer garden have garnered loyal fans in town and beyond. With a diverse range of handcrafted beers, The Second Wedge offers a friendly atmosphere and a wide selection, making it perfect for grabbing a beer-to-go or enjoying an afternoon of relaxation.
At its core, The Second Wedge Brewing Co. embodies the spirit of Uxbridge—welcoming, creative, and vibrant. Whether you’re a local or a visitor, come experience the warmth of community and the taste of exceptional craft beer at The Second Wedge Brewing Co.
The History of the Second Wedge Brewing Co’s Building
Above photo is courtesy of The Second Wedge Facebook Page
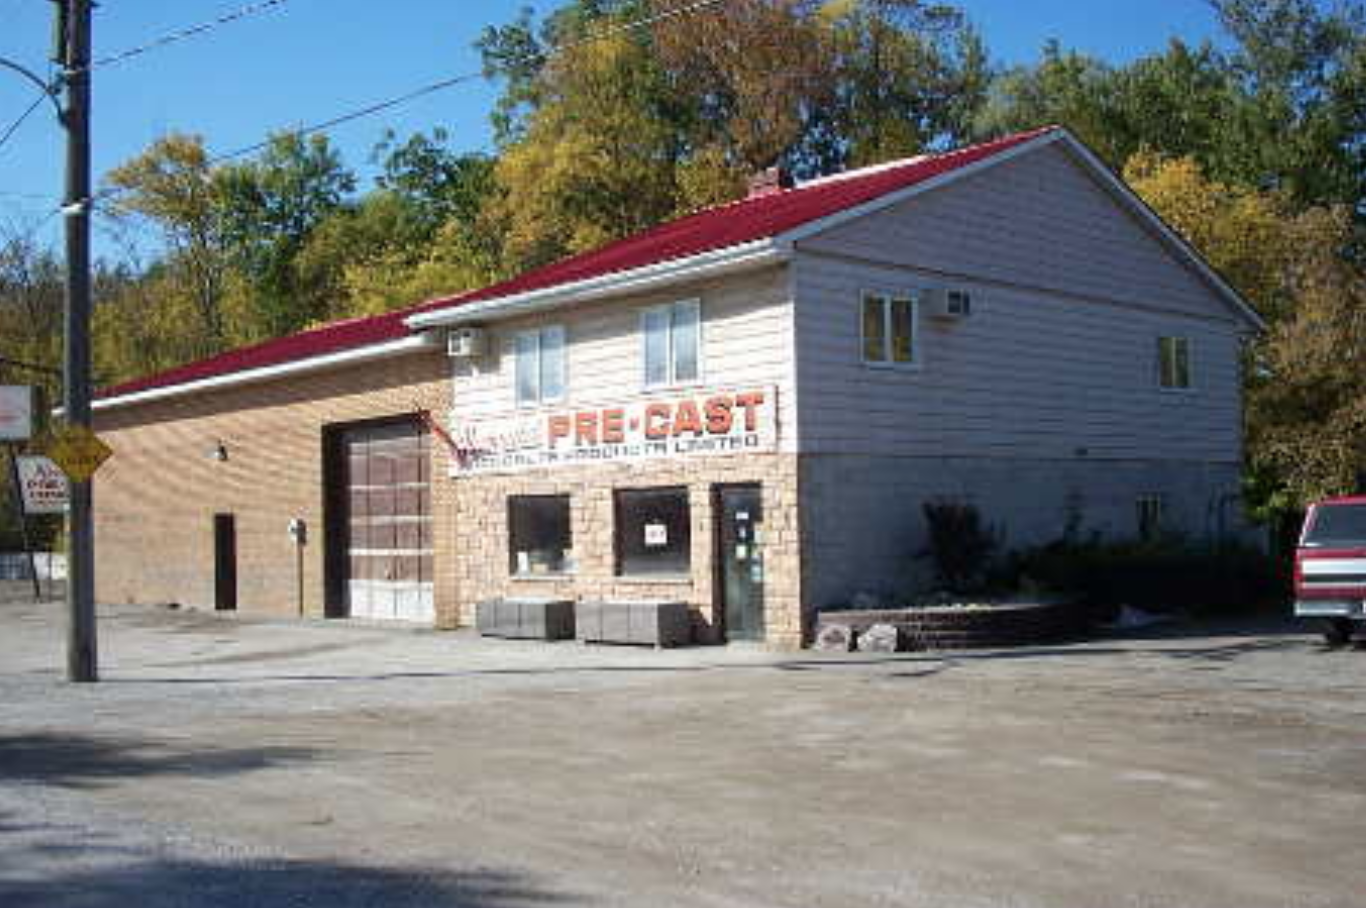
The journey of The Second Wedge Brewing Co. is a tale of resilience, determination, and the transformative power of passion. Situated in a building with a rich history, its story begins with Harvey Acton Ltd., the original occupant, which later relocated to a larger space east of town. The building then housed Newmarket Precast until 2004, when Freed Investments Inc. took ownership, followed by Decor Electric Ltd. in 2008.
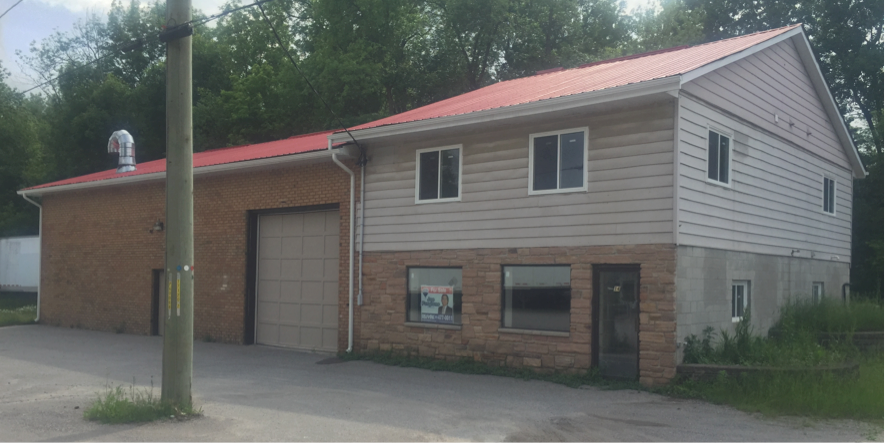
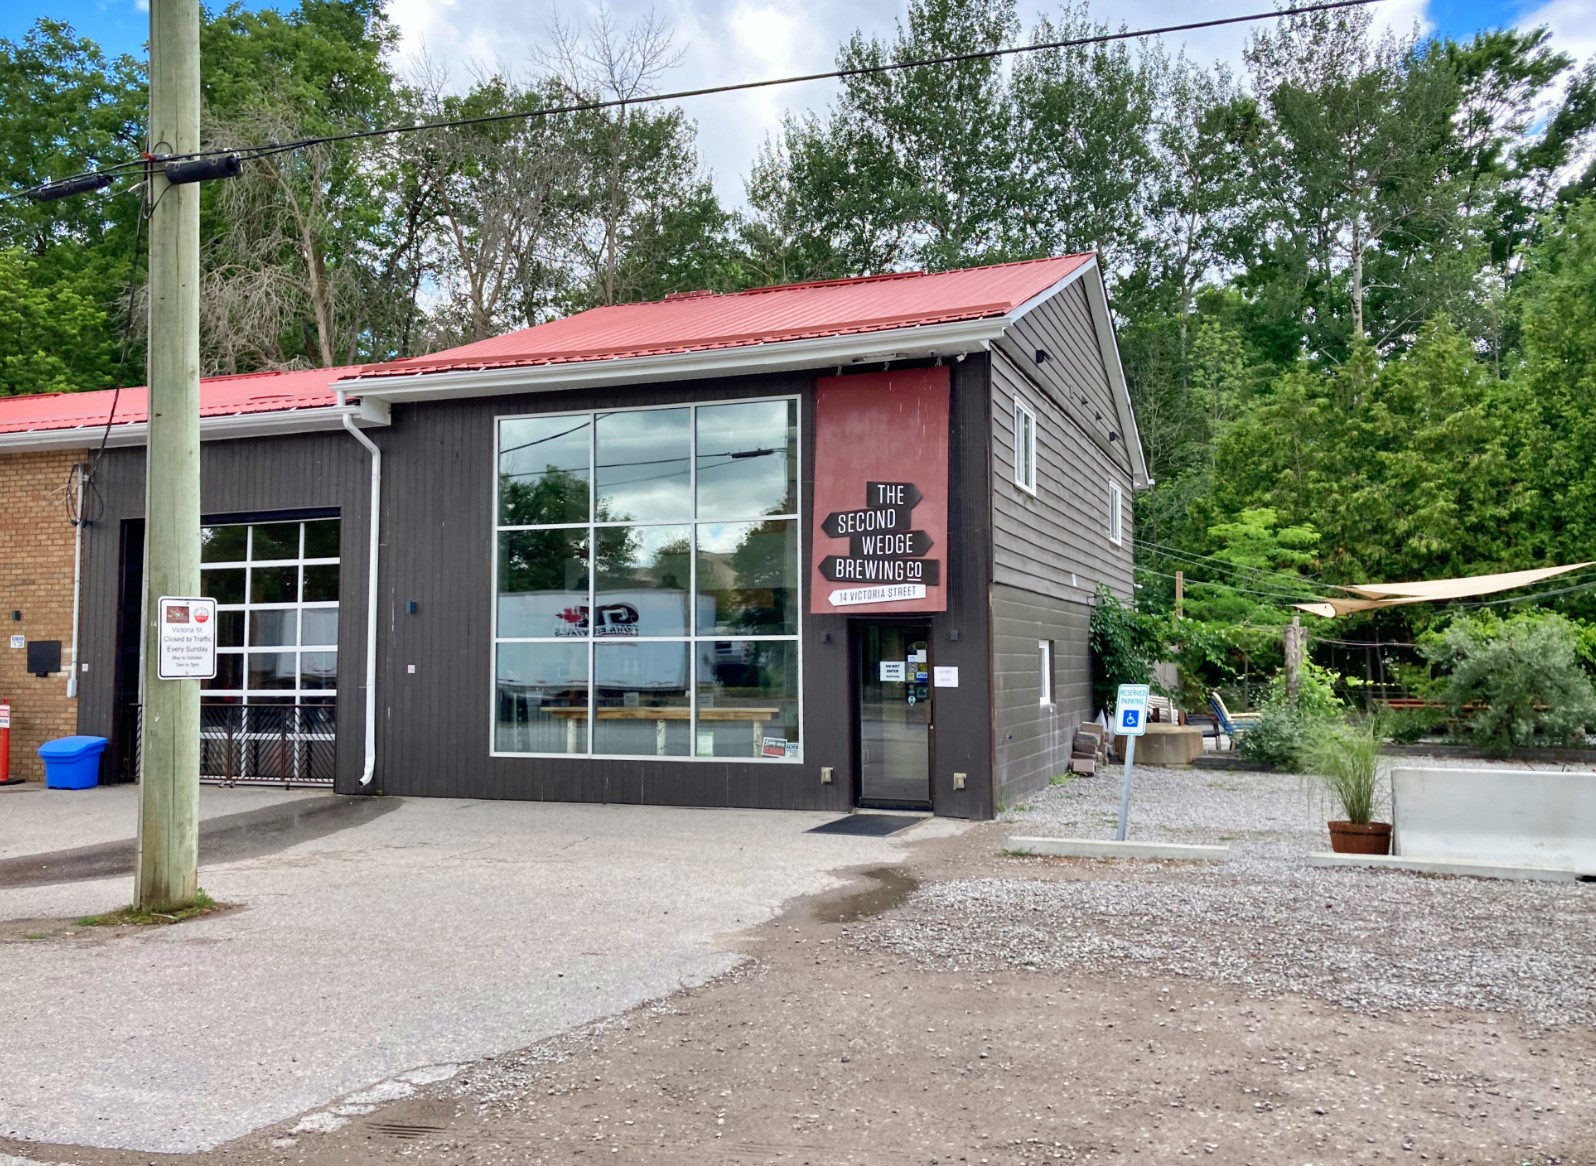
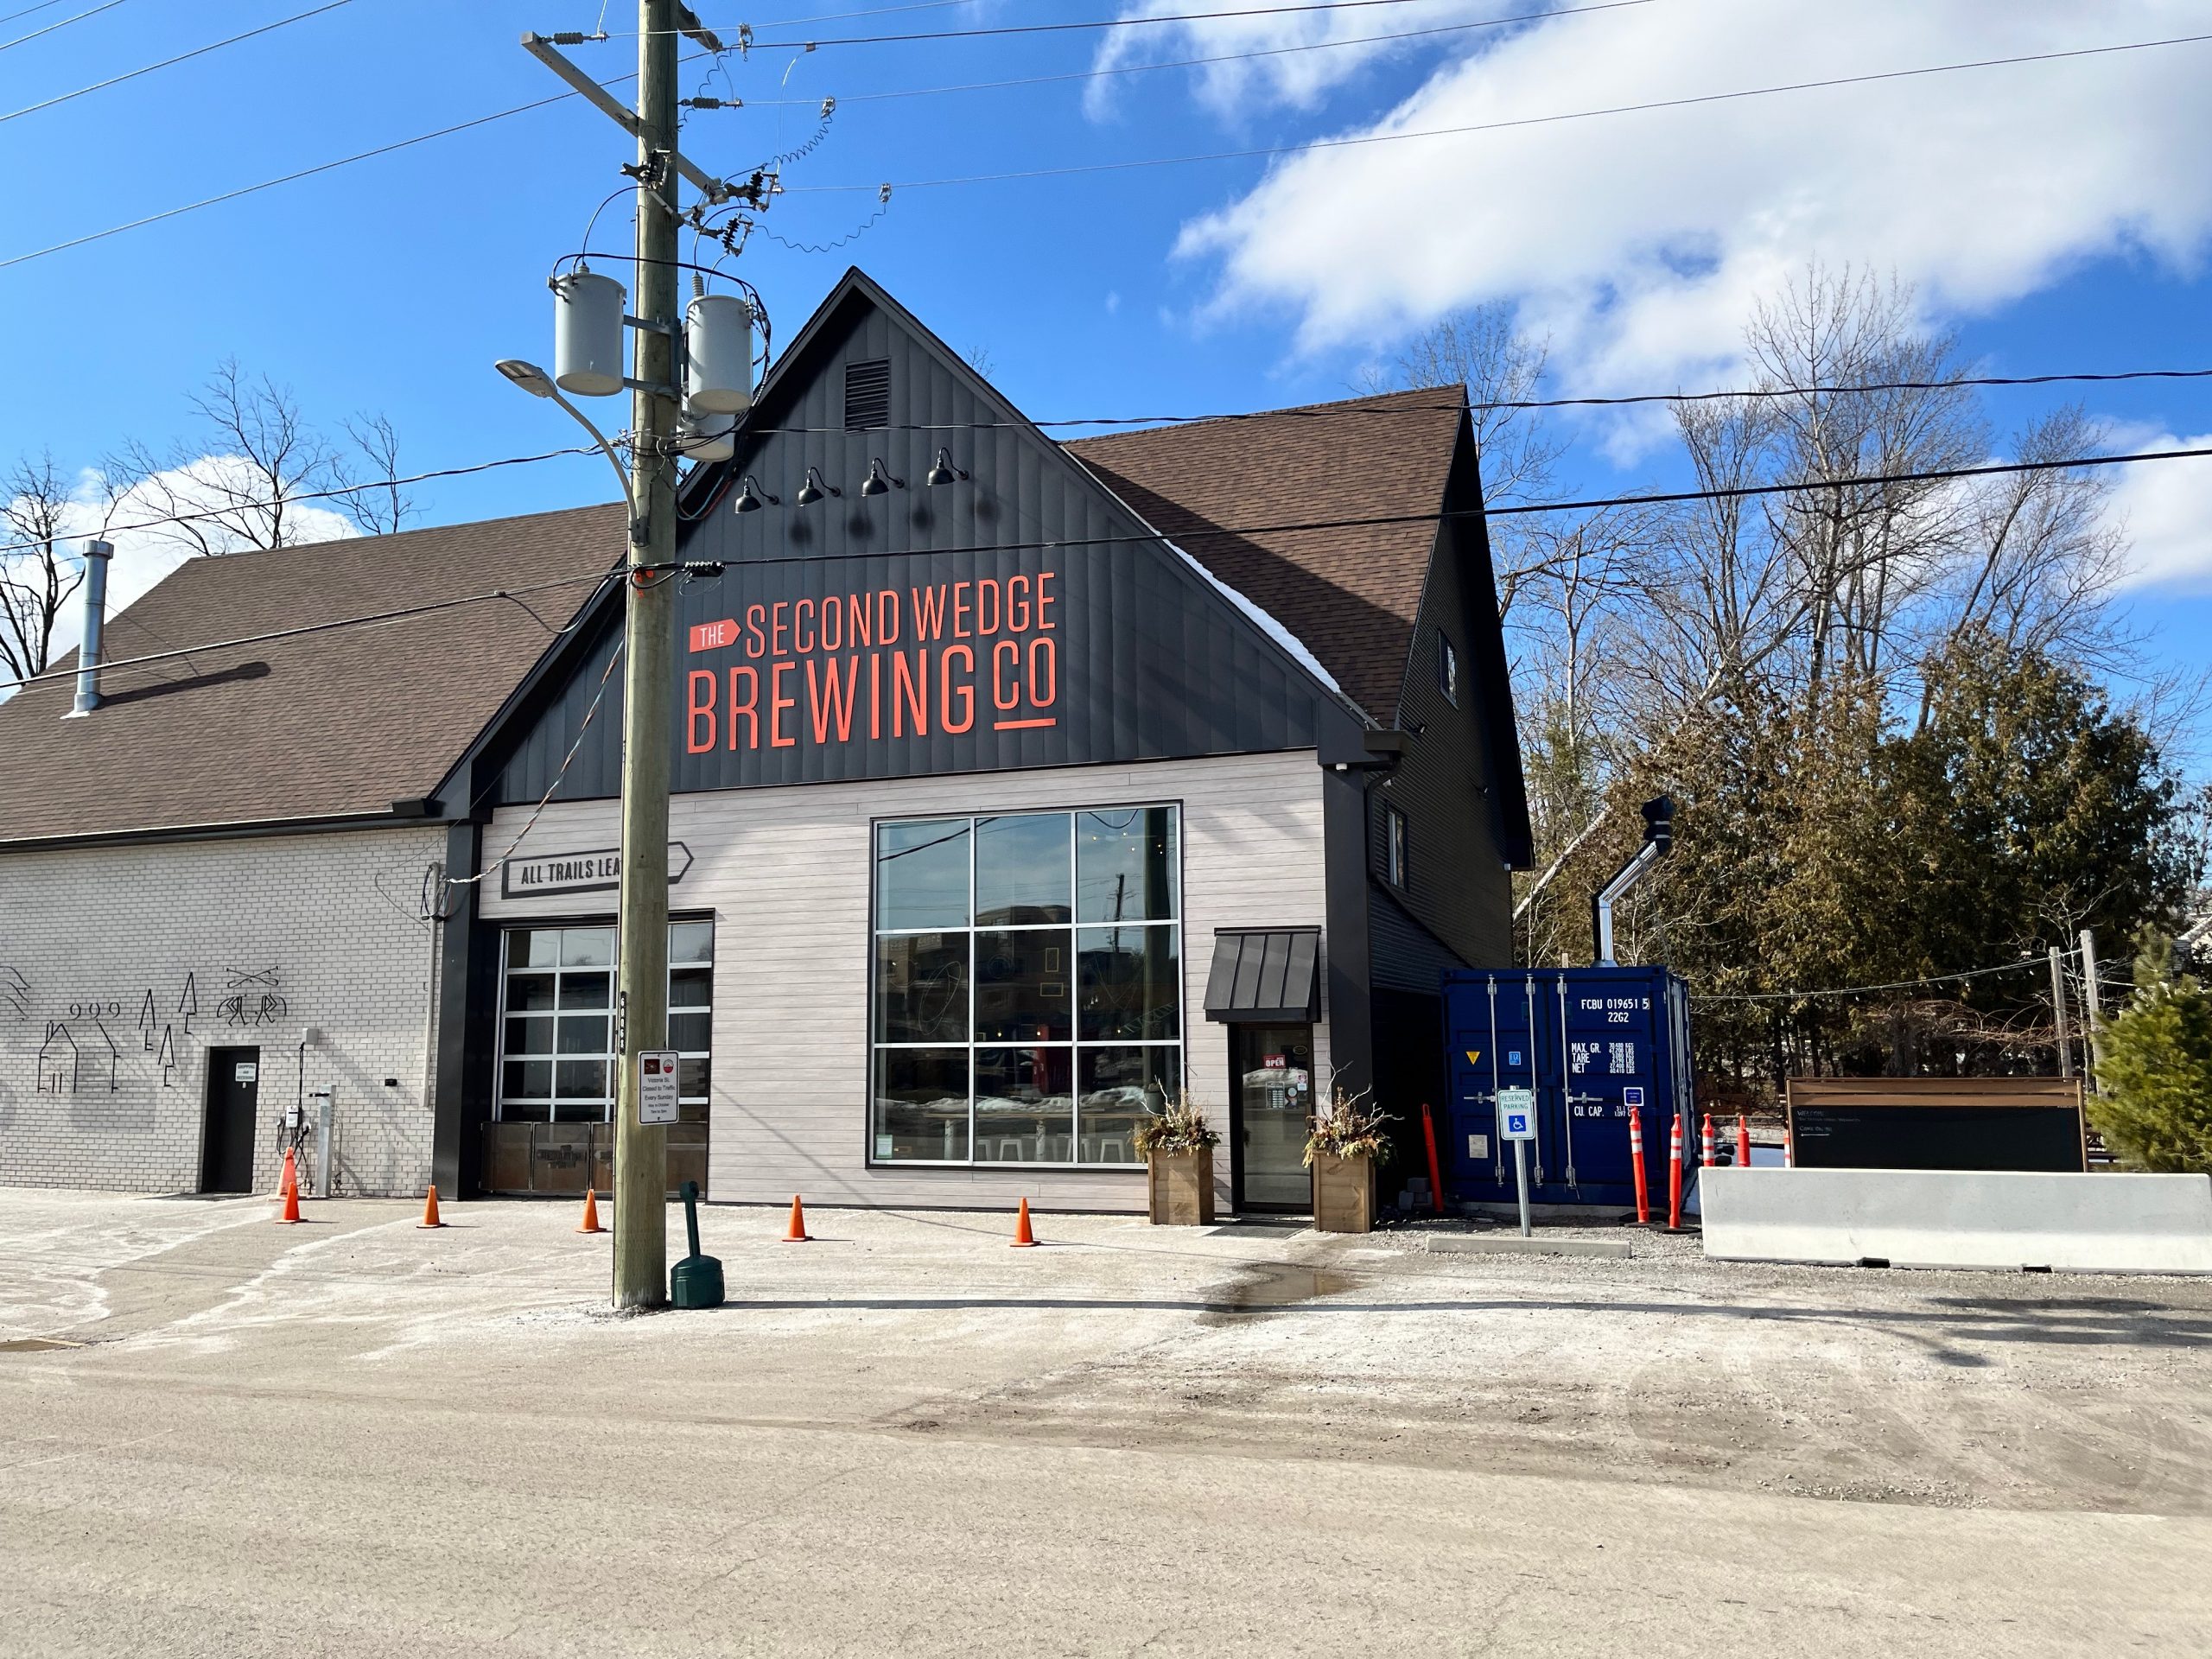
The above two photos are courtesy of the Toronto Regional Real Estate Board.
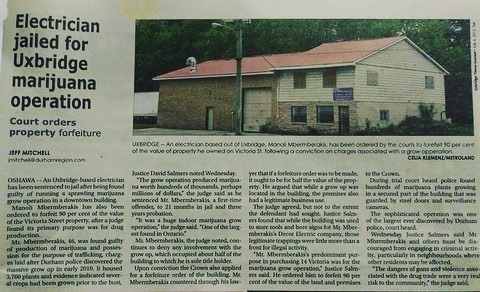
However, the building’s history took a dramatic turn when it was revealed to be the site of an illegal grow operation. Subsequent legal actions led to its sale once more.
The above article is from the Uxbridge Times-Journal
In July 2015, Rod and Joanne, after an extensive search, secured the lease and embarked on a journey to transform the space into The Second Wedge Brewing Co. Despite facing challenges, including a devastating tornado in May 2022, they persevered. After extensive renovations, they proudly reopened their doors on July 15, 2023, marking a triumphant return to the Uxbridge community.
In late 2015 The Second Wedge Brewing Co. opened its doors to the public.
The Second Wedge after the May 2022 tornado.
The Second Wedge – 2024
Today, The Second Wedge Brewing Co. stands as a testament to the power of passion, resilience, and community support—a beacon of craft beer excellence in a building with a storied past.
Visit The Second Wedge
Learn more about the history in Uxbridge by following our blog page Uxbridge History
Check out our Uxbridge and Scugog Events Pages to keep up to date on whats going on around town. Click the links or scan the Code with your phone to take you directly there.
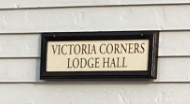
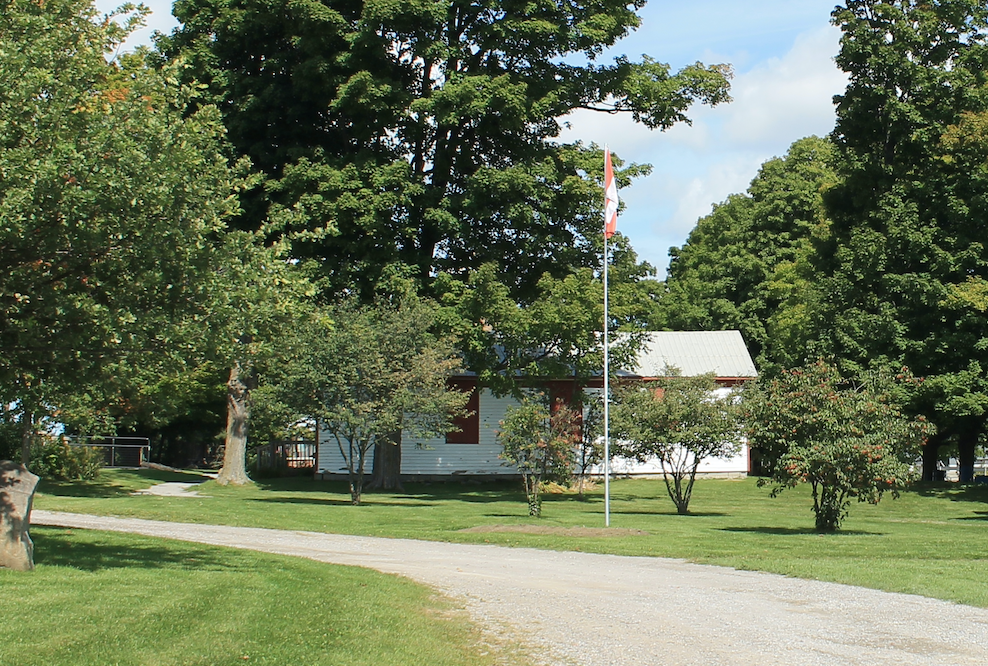
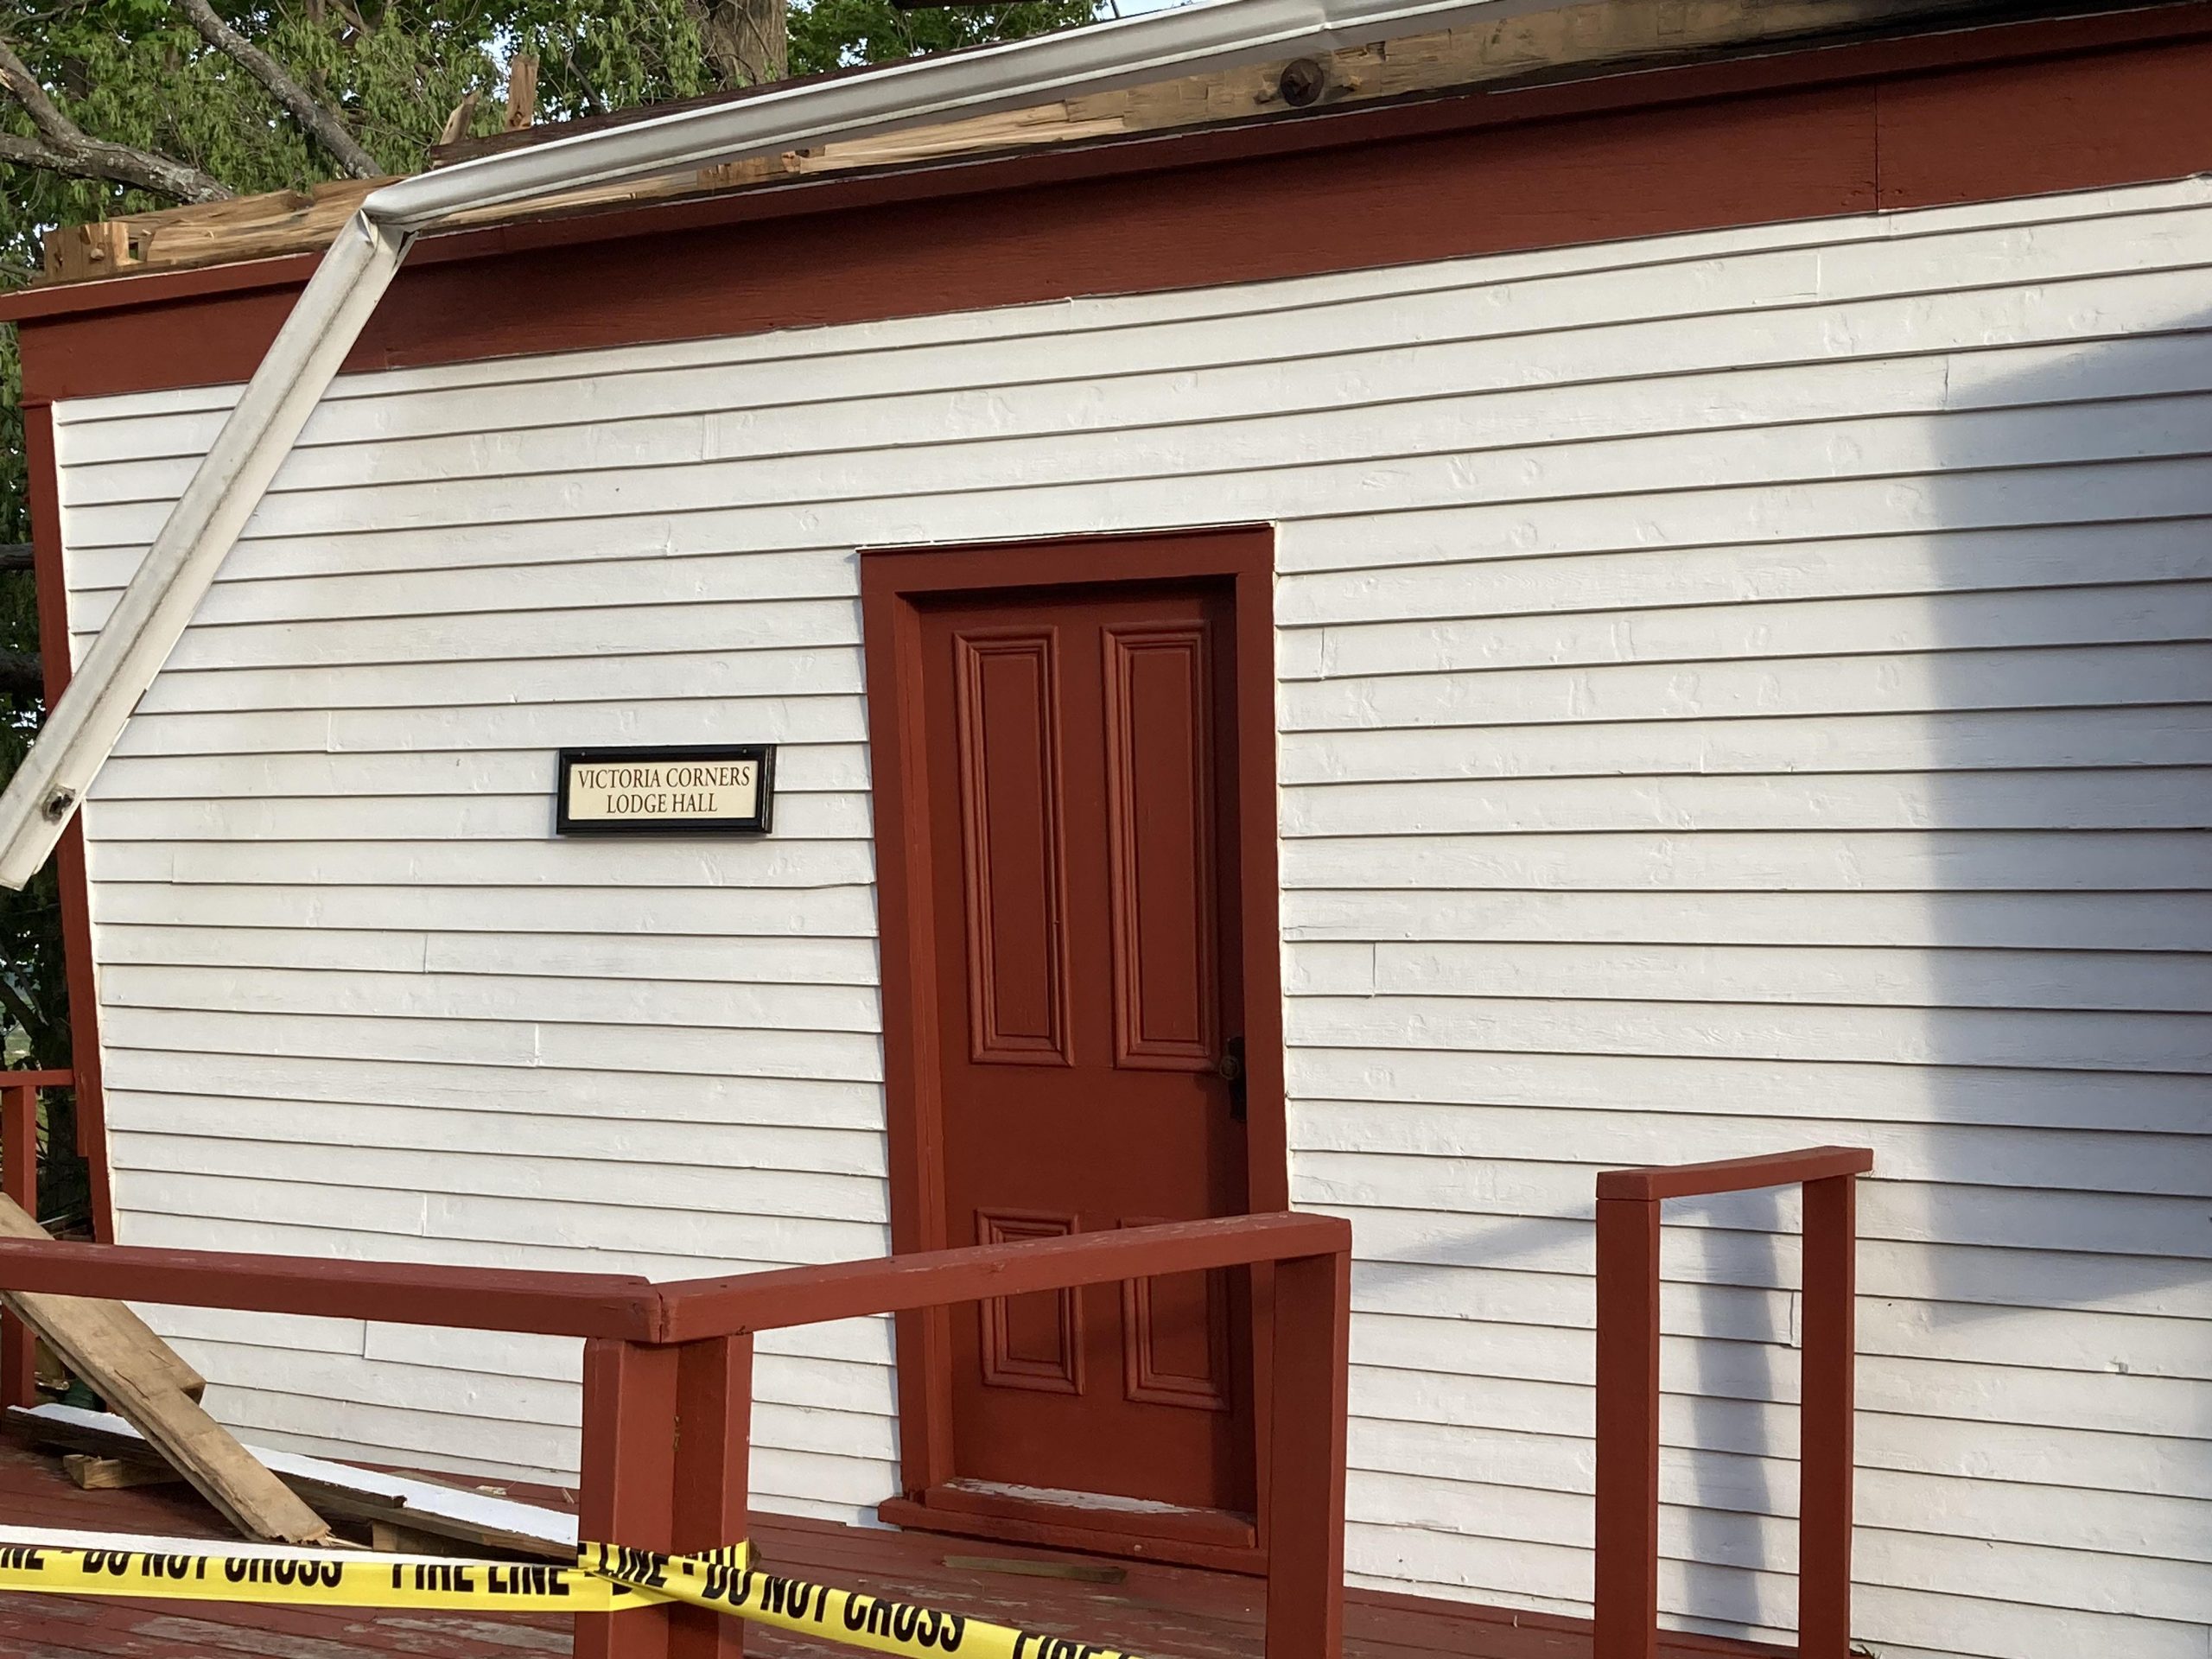
The Victoria Corners Lodge Hall is designated under the Ontario Heritage Act.
History
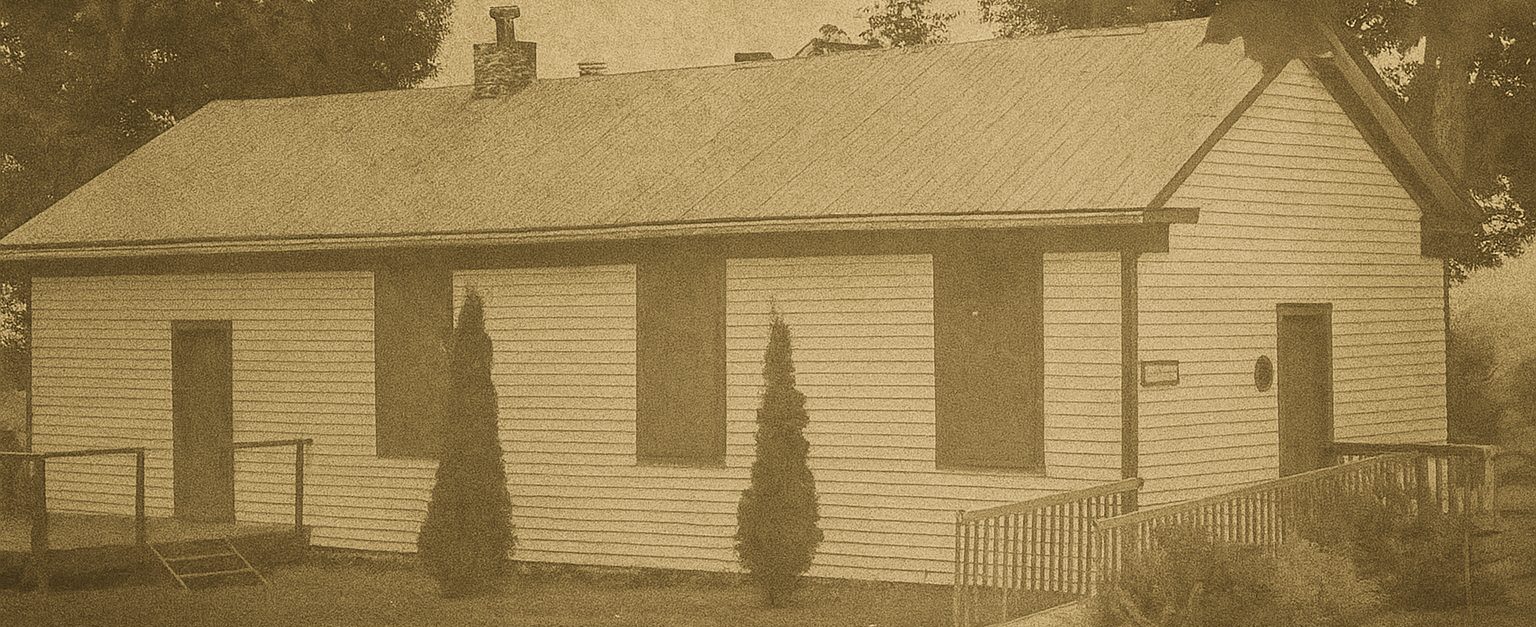
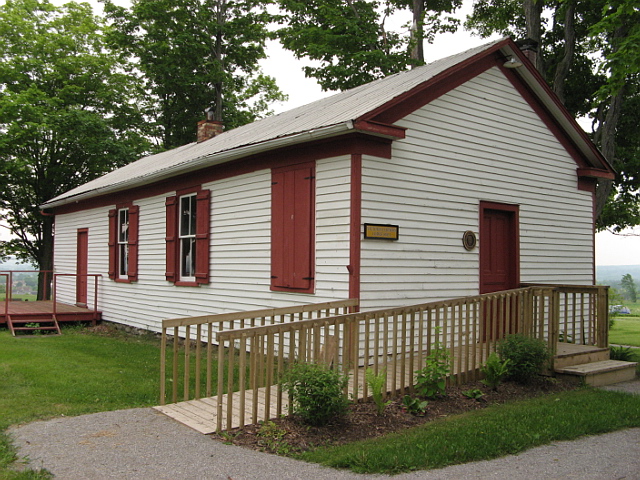
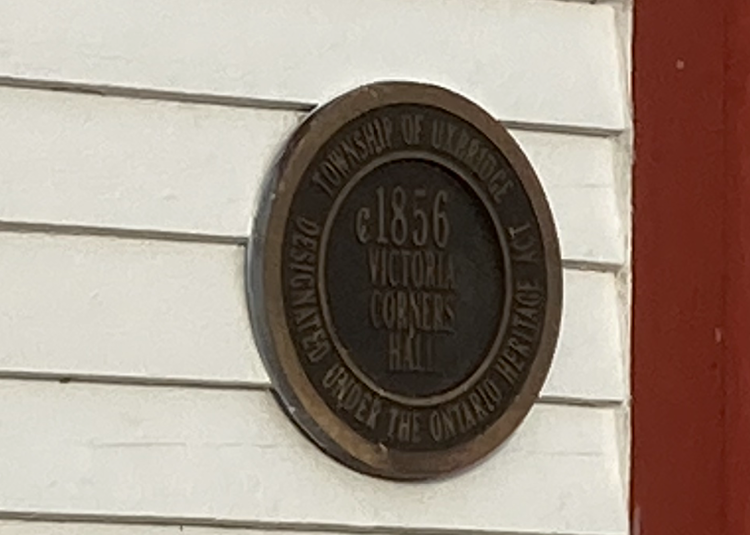
The Victoria Corners Lodge Hall, the oldest building at the Uxbridge Historical Centre, was a living testament to the rich history of Uxbridge. Originally situated on the south side of the road just east of Victoria Corners, northeast of Uxbridge, this historic structure had a storied past.
In its original location, the hall served as the meeting space for Loyal Orange Lodge No. 454, the Victoria Corners chapter of the fraternal, Protestant group known as the Orangemen. It stood as a gathering place, witnessing important discussions and events within the community.
Design
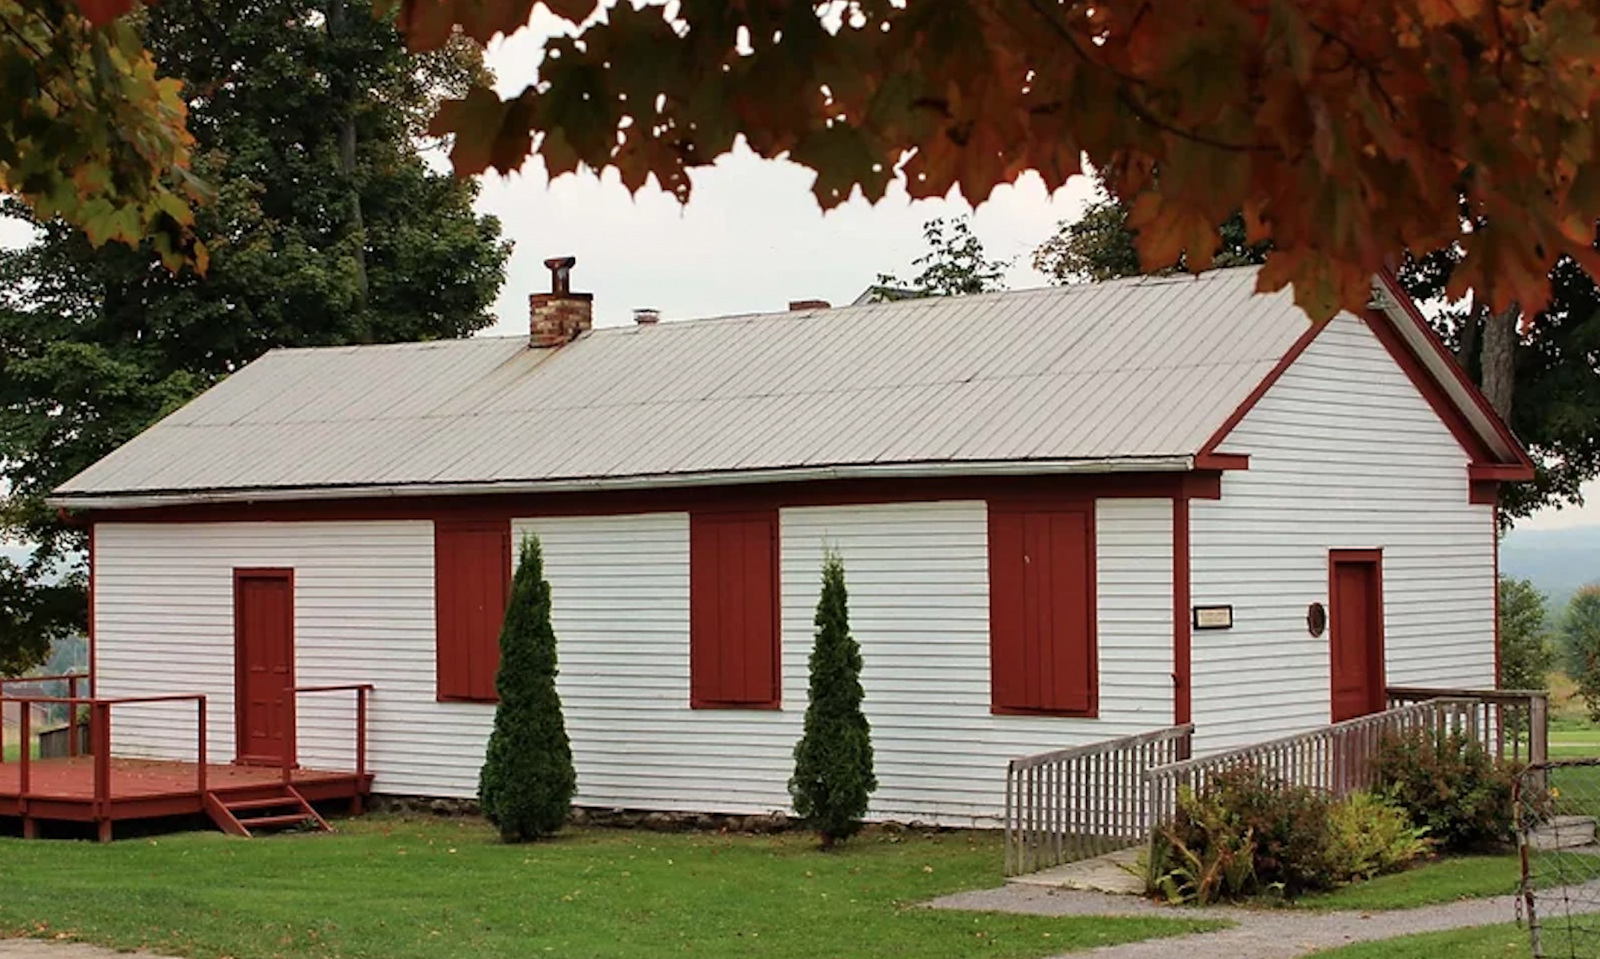
Constructed with plank walls, wood siding, and adorned with corner boards and returned eaves, the building exuded a simple yet timeless charm. It’s three windows, each protected by wood storm shutters, added to its character, offering a glimpse into a bygone era.
The interior of the hall was a reflection of its purpose, featuring an entryway, a small adjacent room, and a large meeting hall with a raised platform at the rear. Each corner and crevice held memories of the vibrant community life that once unfolded within its walls.
Relocation
In 1976, recognizing the historical significance of the hall, it was moved to the Uxbridge Historical Centre. This relocation ensured the preservation of its heritage and allowed future generations to connect with the town’s past.
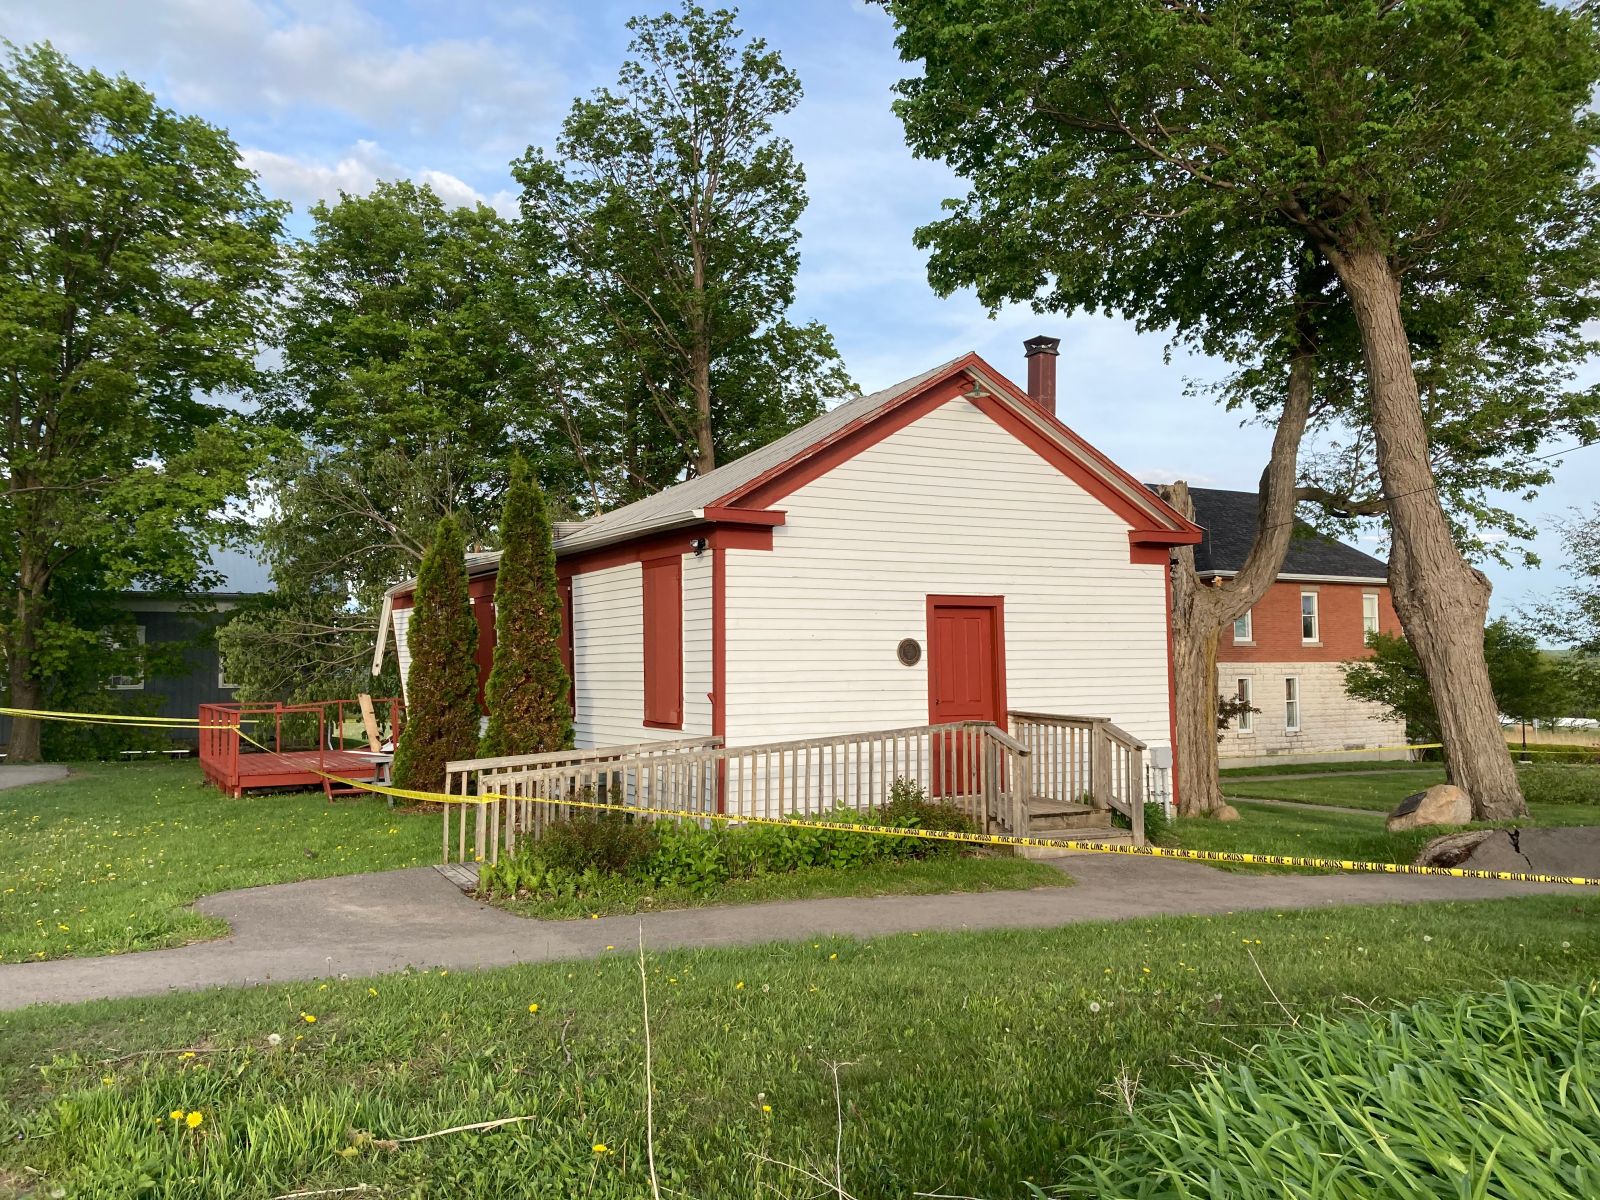
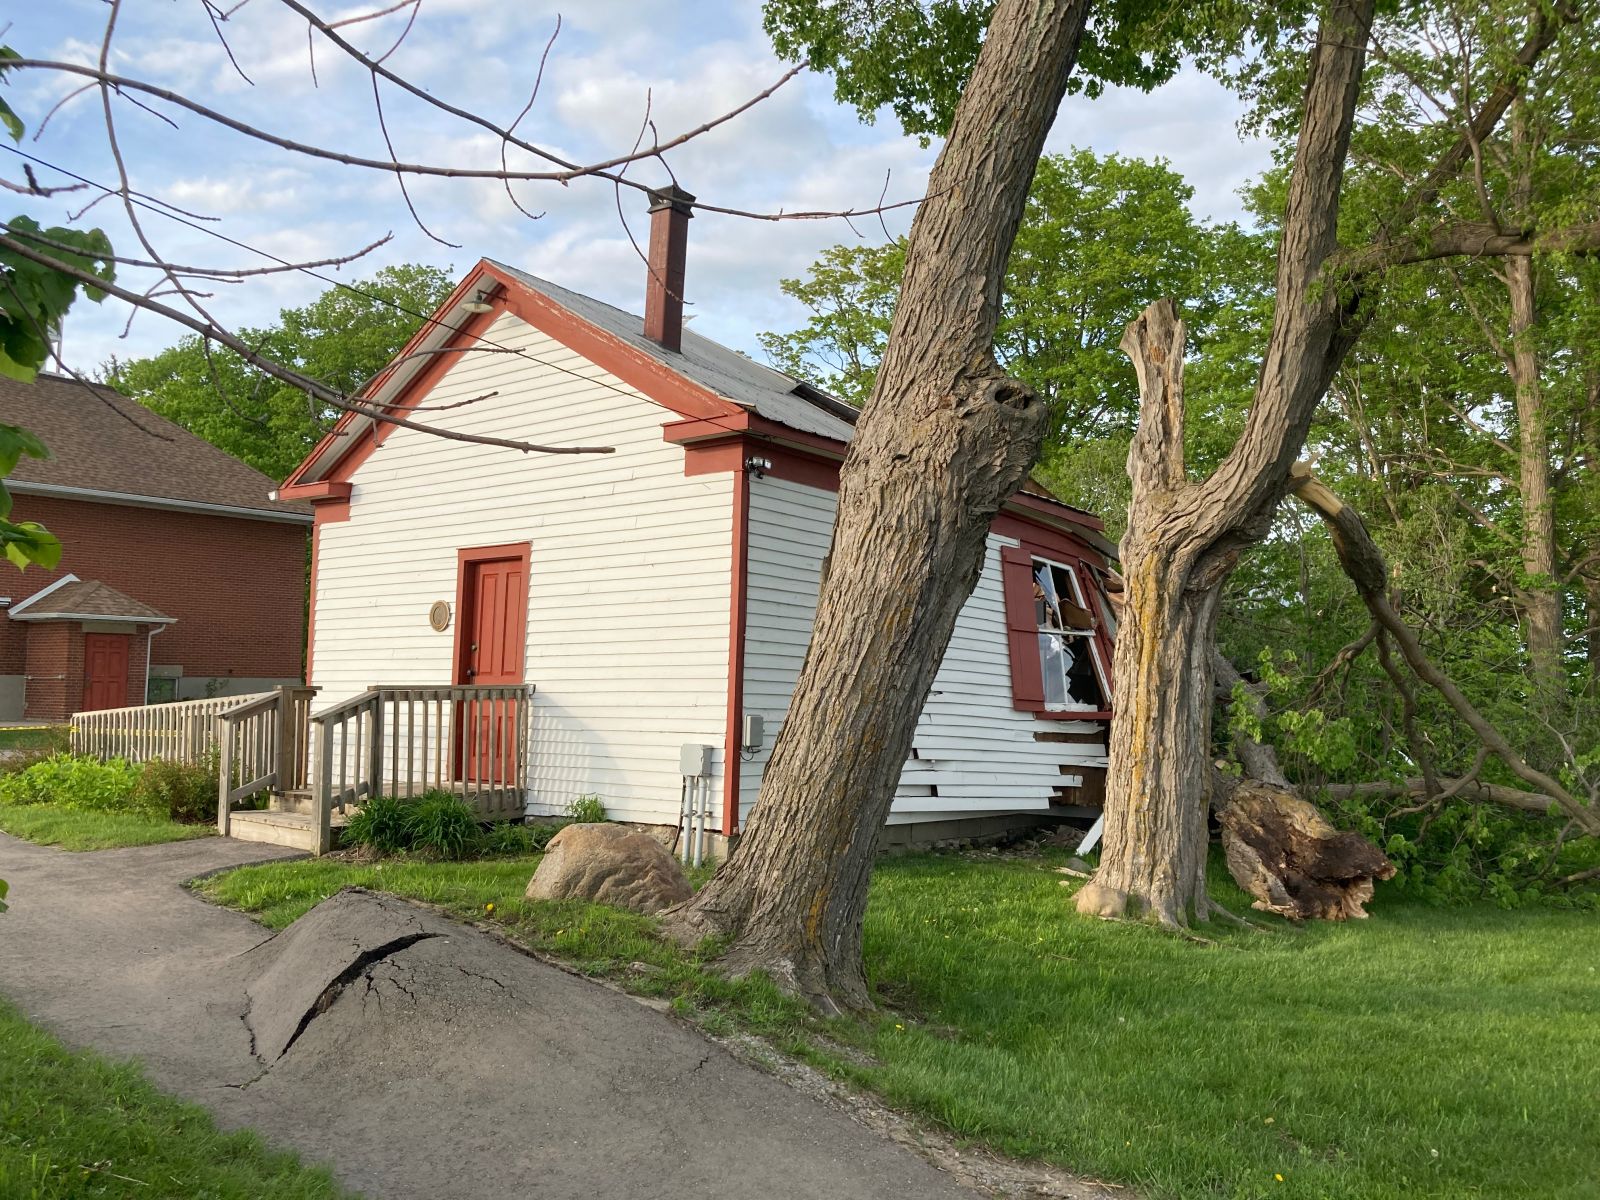
Tragedy Strikes
Tragically, the Victoria Corners Lodge Hall met an untimely end on Saturday, May 21 2022, when an EF2 tornado touched down in Uxbridge. A falling tree, victim to the tornado’s destructive force, brought about the hall’s demise. It was the first building to fall as the tornado carved its path of destruction through the town.
As we reflect on the loss of the Victoria Corners Lodge Hall, we honour the memories it held and the pivotal role it played in Uxbridge’s history. While the physical structure may be gone, its legacy lives on in the stories shared by the community. The hall’s resilience in the face of the tornado serves as a poignant reminder of the strength and unity embedded in the town’s roots.
In remembering the Victoria Corners Lodge Hall, we pay tribute to the threads that weave our community together, recognizing that even in the face of destruction, the spirit of our shared history endures.
First two photos courtesy of The Uxbridge Historical Centre and Uxbridge Public Library
Want to learn more about Uxbridge’s History. Follow our Blog HERE
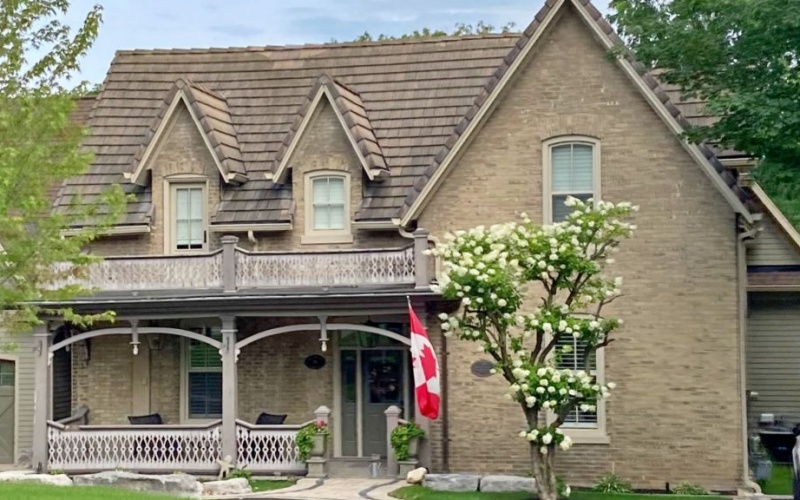
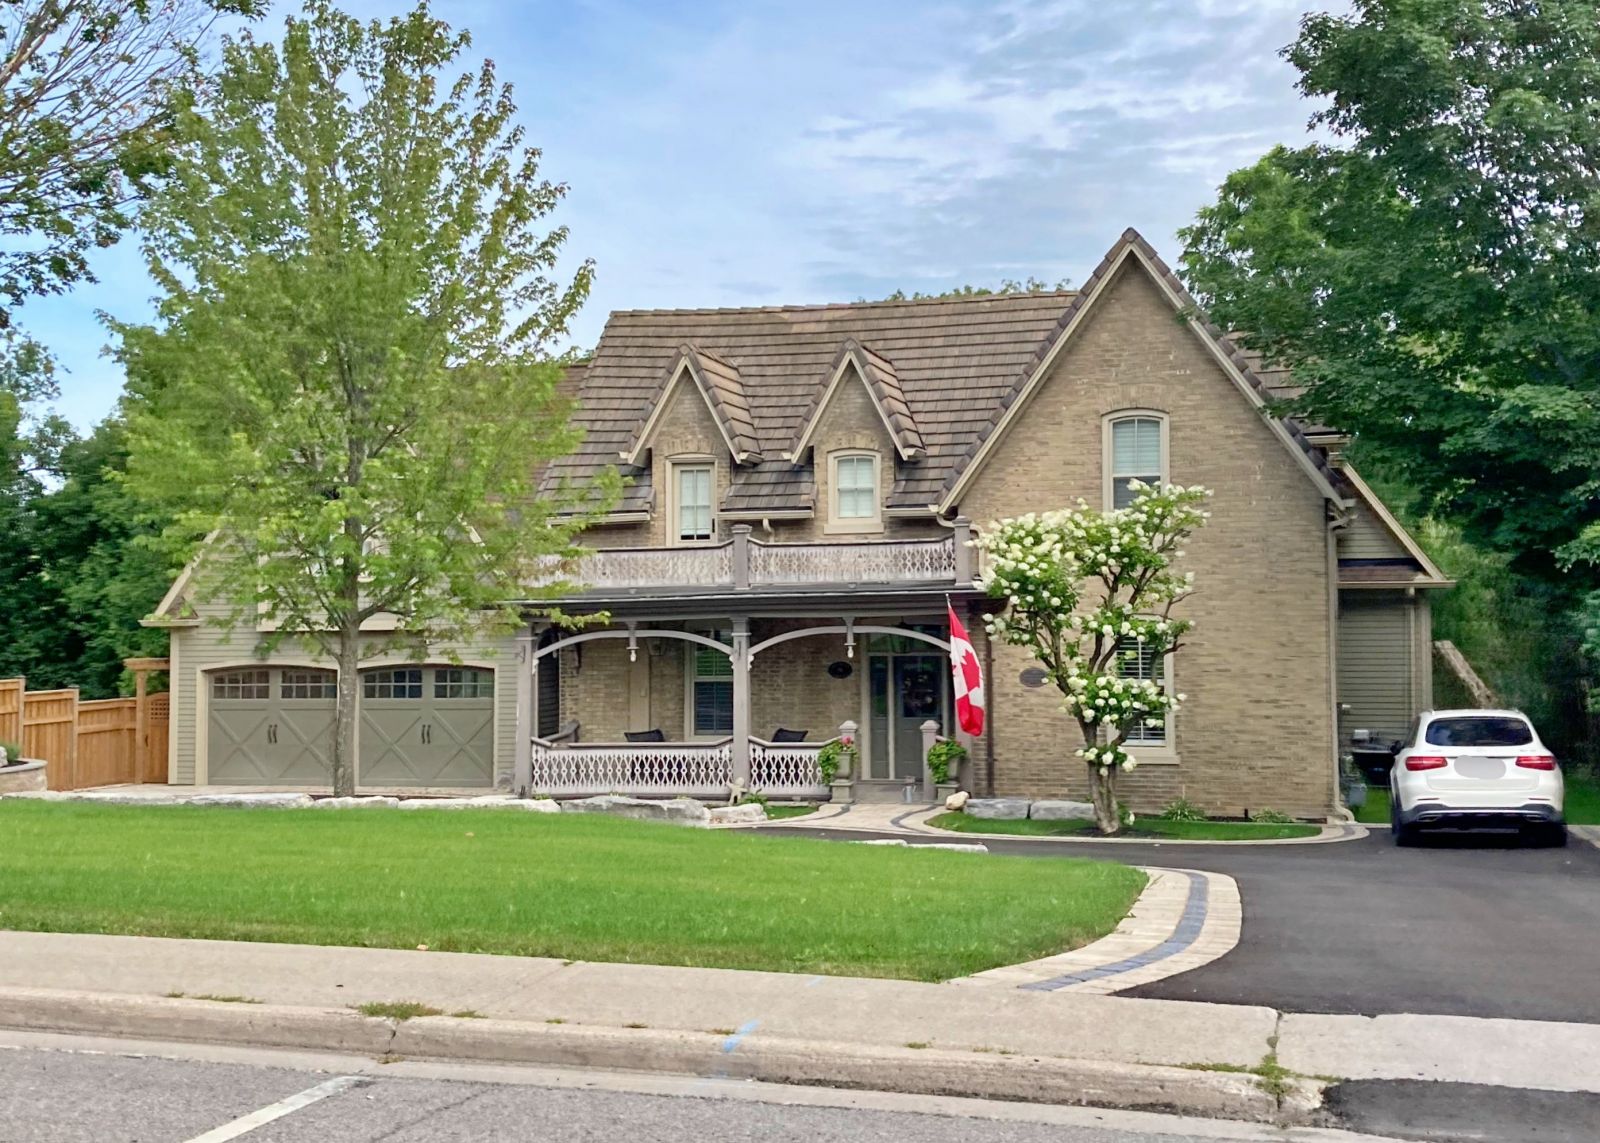
89 Toronto Street South was constructed around 1875. The imposing structure is believed to have been built by Joseph Gould, a pivotal figure in the early establishment of our town, for his daughter Elizabeth, following her marriage to Reverend Edward Cockburn, a distinguished Presbyterian Minister. Reverend Cockburn served congregations at both the Chalmers Church in Uxbridge and the St. Paul’s Church in Leaskdale, leaving an enduring legacy of spiritual guidance and community service.
In 1881, the house underwent a transformation, transitioning into a manse—a residence for Presbyterian ministers. This designation persisted for over a century, until 1981, making it a cornerstone of our town’s religious and social history.
One particularly notable aspect of the manse’s history is its association with Reverend Ewan MacDonald, husband of Lucy Maud Montgomery, renowned author of the beloved Anne of Green Gables series. During the vibrant 1920s, Reverend MacDonald frequently visited the Uxbridge Presbyterian Minister at this residence, adding a touch of literary and historical significance to its already illustrious past.
Today
In more recent times, the house underwent significant changes. In 2017, it found new ownership, leading to the addition of modern amenities and enhancements. An expansion at the rear, the addition of an attached garage, and the installation of a circular driveway have transformed the property, blending its storied past with contemporary comforts and conveniences.
Today, as the house stands amidst these updates and renovations, it serves as a tangible link to our town’s heritage—a reminder of its founding families, community leaders, and the enduring spirit that continues to shape our collective identity. Through its evolution, from a family home to a revered manse and now a modernized residence, this historic landmark remains a testament to the enduring legacy of those who came before us and the vibrant future that lies ahead.
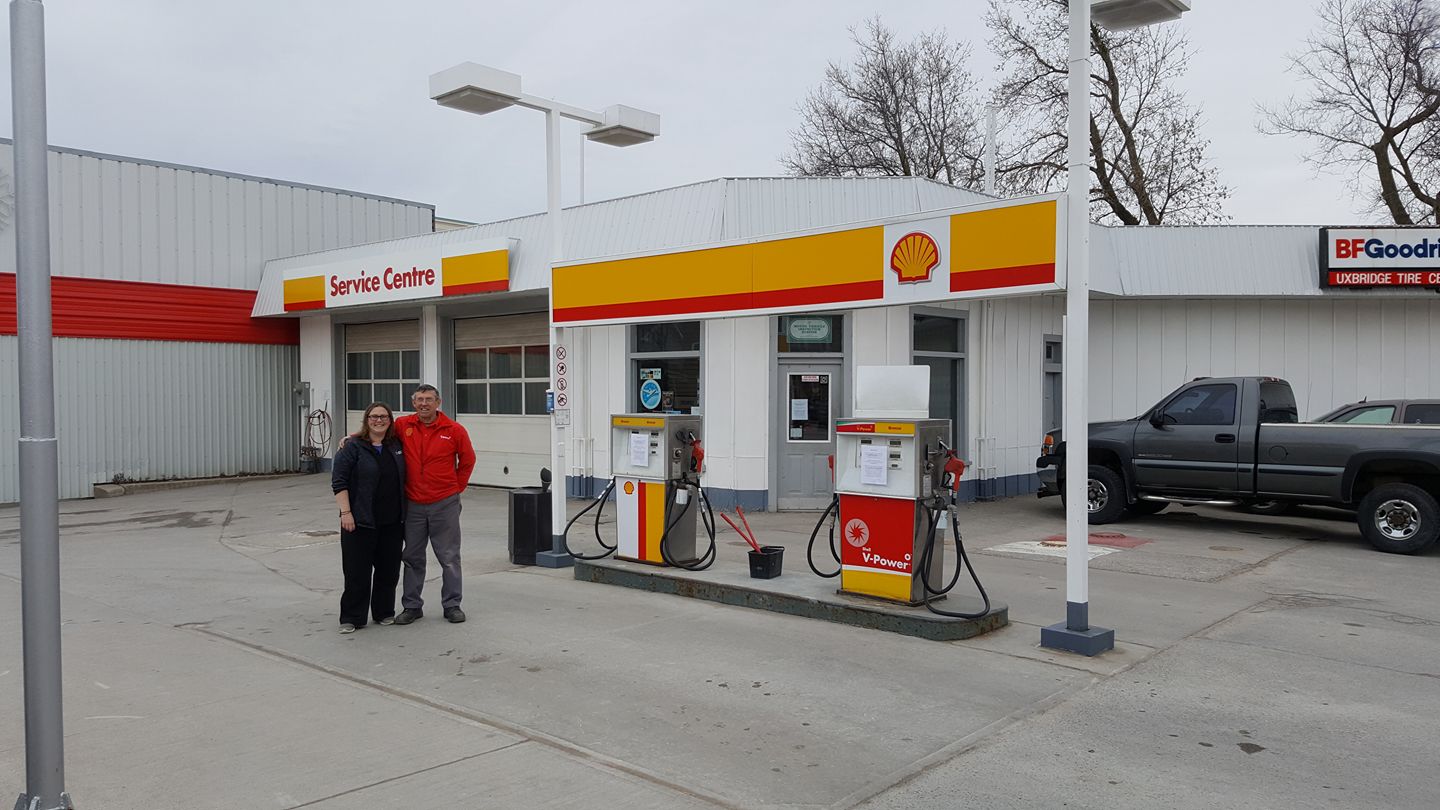
The above photo shows Tony Peck and his daughter Katy on the day of his retirement after 40 years of fuelling and service Uxbridge residents vehicles.
Back in 1976, Tony Peck and Peck Brothers Limited assumed ownership of the Uxbridge Shell Service Station located at the intersection of Brock and Spruce Streets. For decades, Tony poured his heart and soul into running the business, overseeing operations until his well-deserved retirement on February 28, 2017. This particular gas station held a special distinction in the region—it was among the few remaining establishments that provided full-service options to its patrons.
The staff at this station went beyond mere transactions; they epitomized hospitality, offering not just fuel but also complimentary services like oil checks and window cleaning. Their friendly demeanor and dedication to customer satisfaction set them apart in an era where such personalized service was becoming increasingly rare.
As a child, I have vivid memories of riding our bikes to the station. Beside the service center doors, we found a lifeline for us youngsters—a pump offering free air to fill our tires. These simple acts of generosity and community spirit transformed the station from a mere refueling stop into a cherished cornerstone of local memories and traditions.
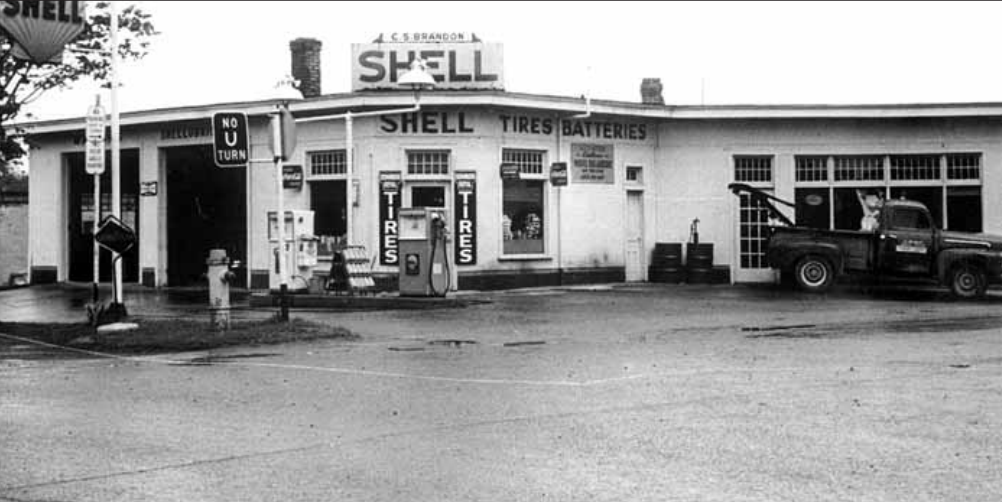
The above photo courtesy of Uxbridge The Good Old Days by: Peter Hvidsten, shows the service station around the 1950’s when it was the C.S. Brandon’s Shell Station.
In June 2017, the long-standing service station was demolished, and its fuel tanks were removed, marking the end of an era. Years of environmental contamination were addressed through thorough site cleanup. Although the physical structure vanished, memories of countless visits lingered, symbolizing the station’s impact on the community.
Read more about the history in Uxbridge in our blog HERE.
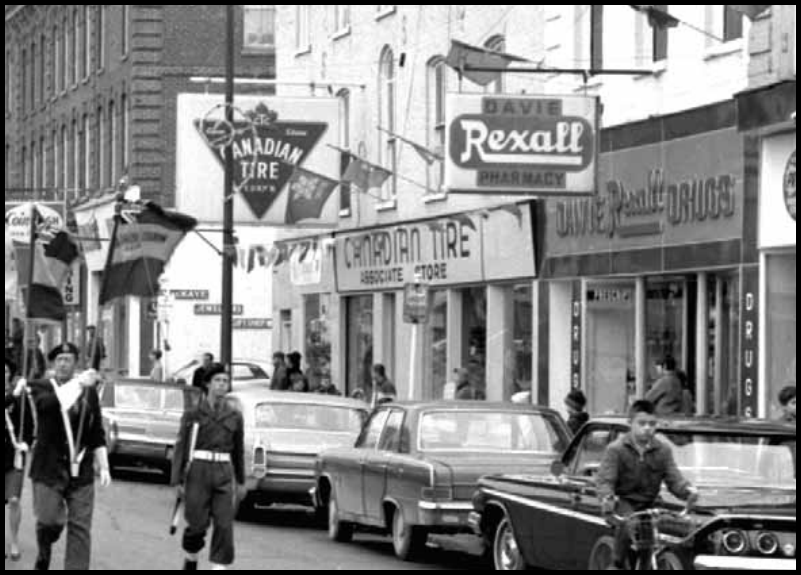
Nestled in the heart of Uxbridge, Canadian Tire has been a cornerstone of the community for almost a century, evolving alongside the town itself. From its humble beginnings in the historic Parish Block on Brock Street East to its modern-day location on Toronto Street South, the journey of Canadian Tire in Uxbridge is a testament to resilience, growth, and adaptability.
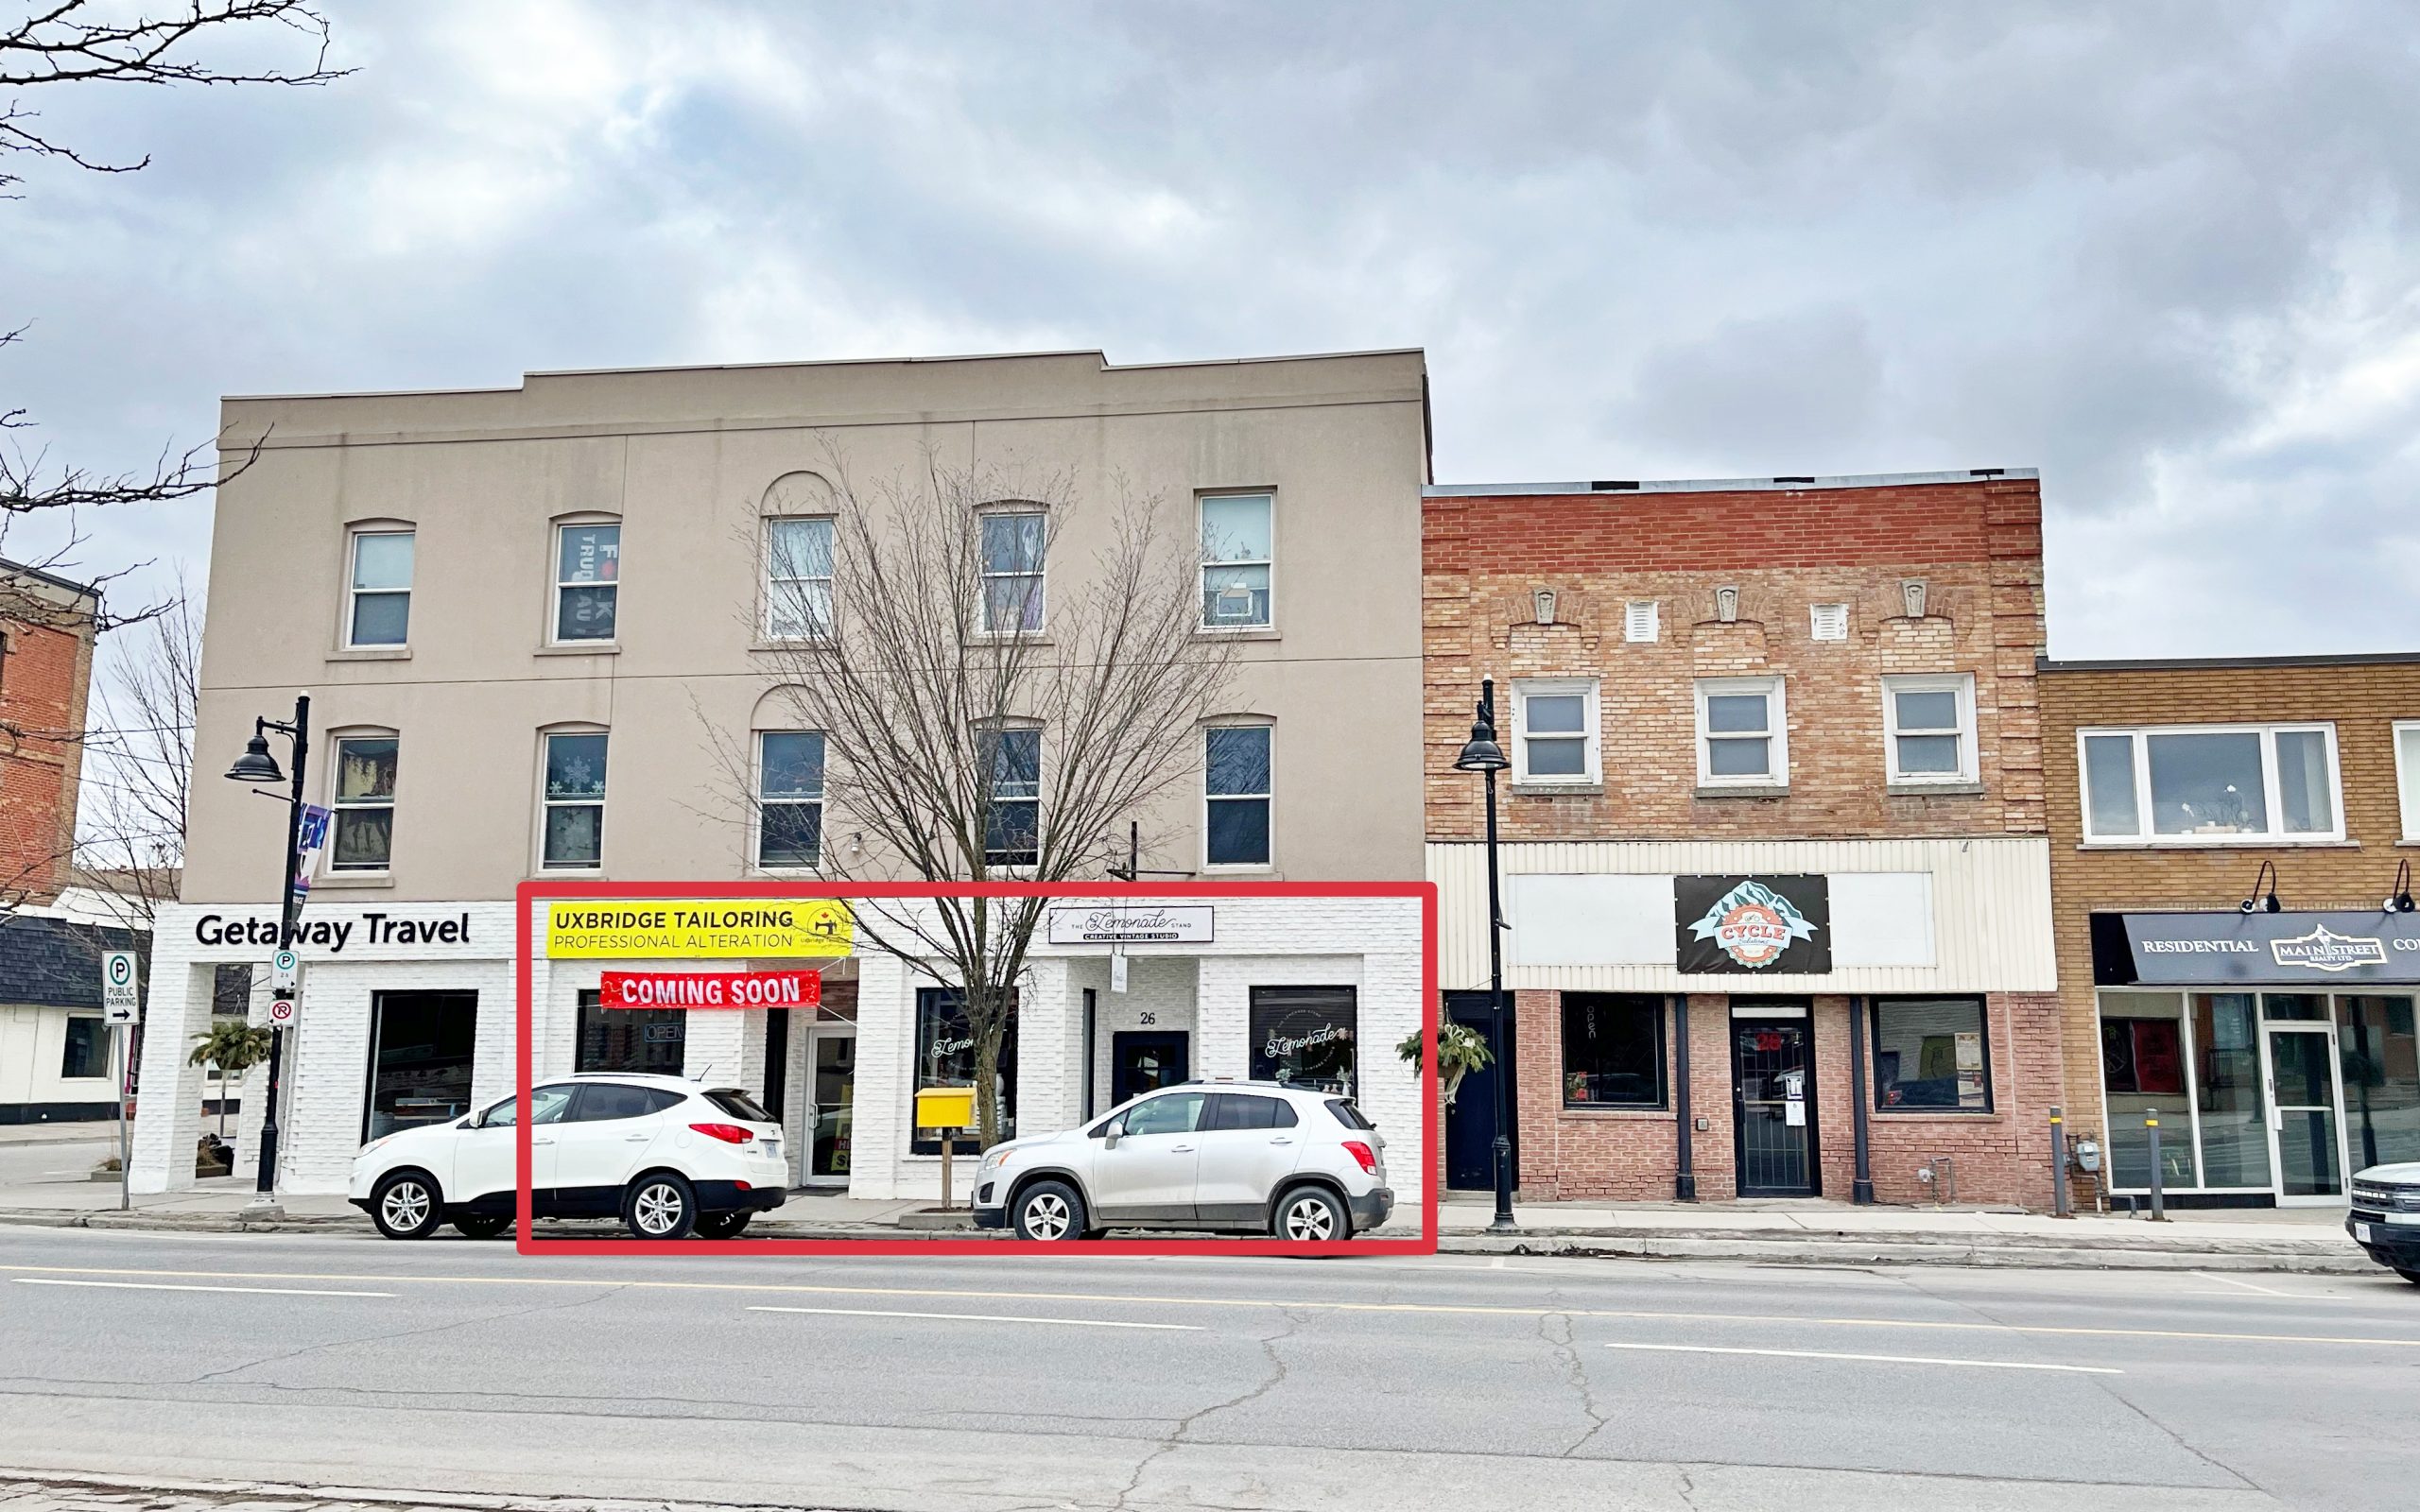
24 & 26 Brock Street East
The story begins at 24 & 26 Brock Street East, where the first Canadian Tire store in Uxbridge found its home. Situated just west of Bascom Street, this brick structure, built in 1870, was part of the pioneering wave of brick buildings that shaped Uxbridge’s downtown landscape.
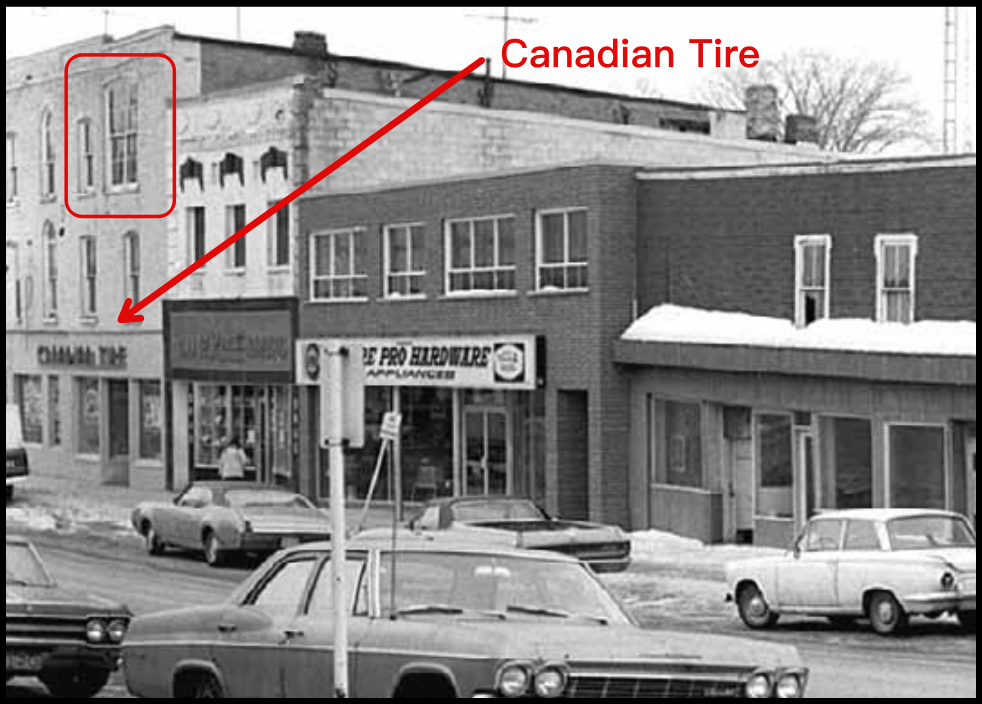
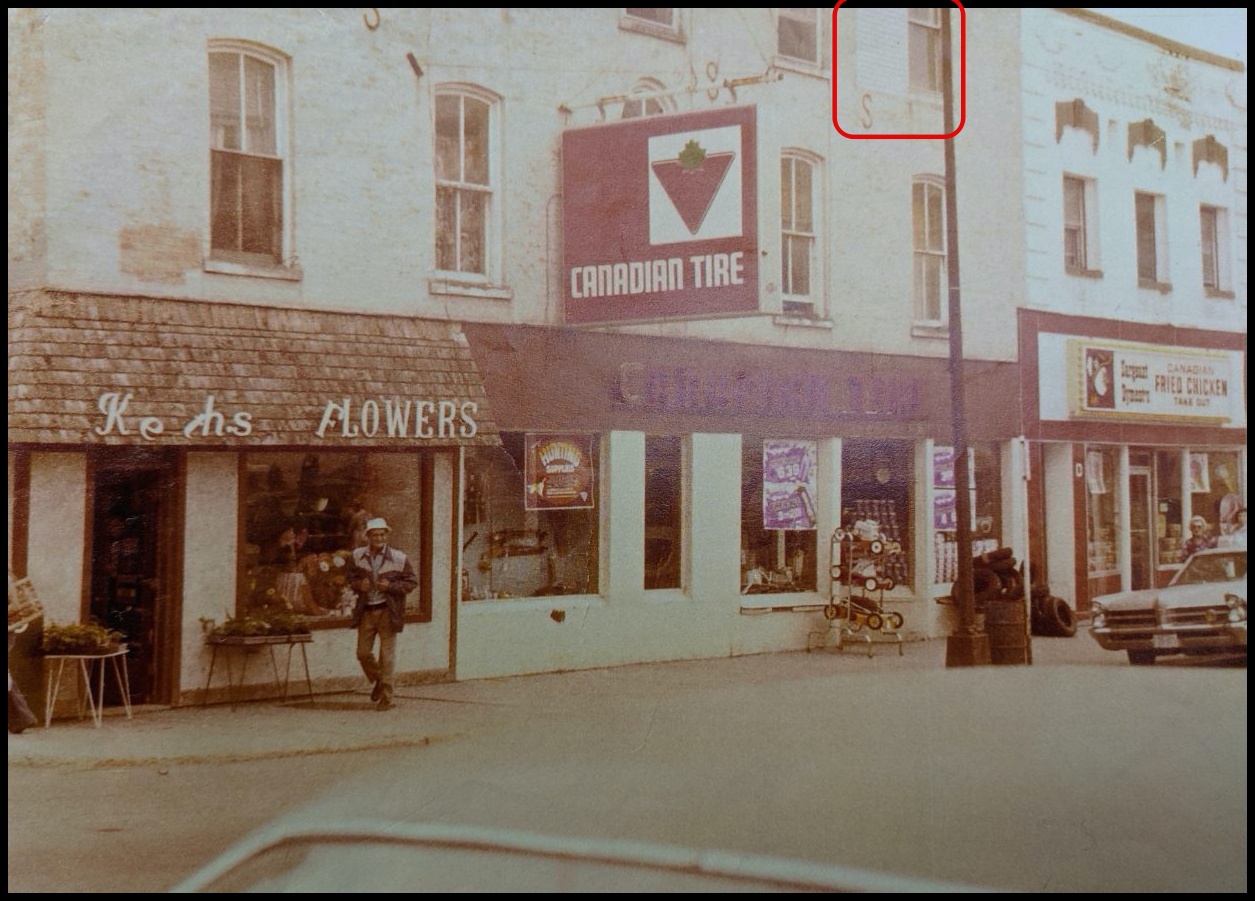
On another historical note in the above photo. The large window in the red square was the location of Canadian Artist, David Milne’s studio in the 1940’s. Later in the early 1950’s the same studio was used by Toronto Star cartoonist Duncan Macpherson.
In the next photo you will notice that part of the big window has been bricked in. Also note the ‘S’ shaped building-washers that were used to stabilize the building.
2024
Pictured above is the same strip of Brock Street taken in 2024. The Canadian Tire Store was located where the Lemonade Stand and the new Uxbridge Tailoring are today. Note the building has been renovated and the ‘S’ shaped building washers and the remnants of the large window have been covered over.
24 Spruce Street – Late 1950’s
In the late 1950s, the store underwent a transition, relocating to the corner of Spruce Street and Albert Street under the ownership of Associate Dealer Bob Wells. While no visual records capture this chapter of Canadian Tire’s history, the move marked a period of growth and expansion as the town flourished.
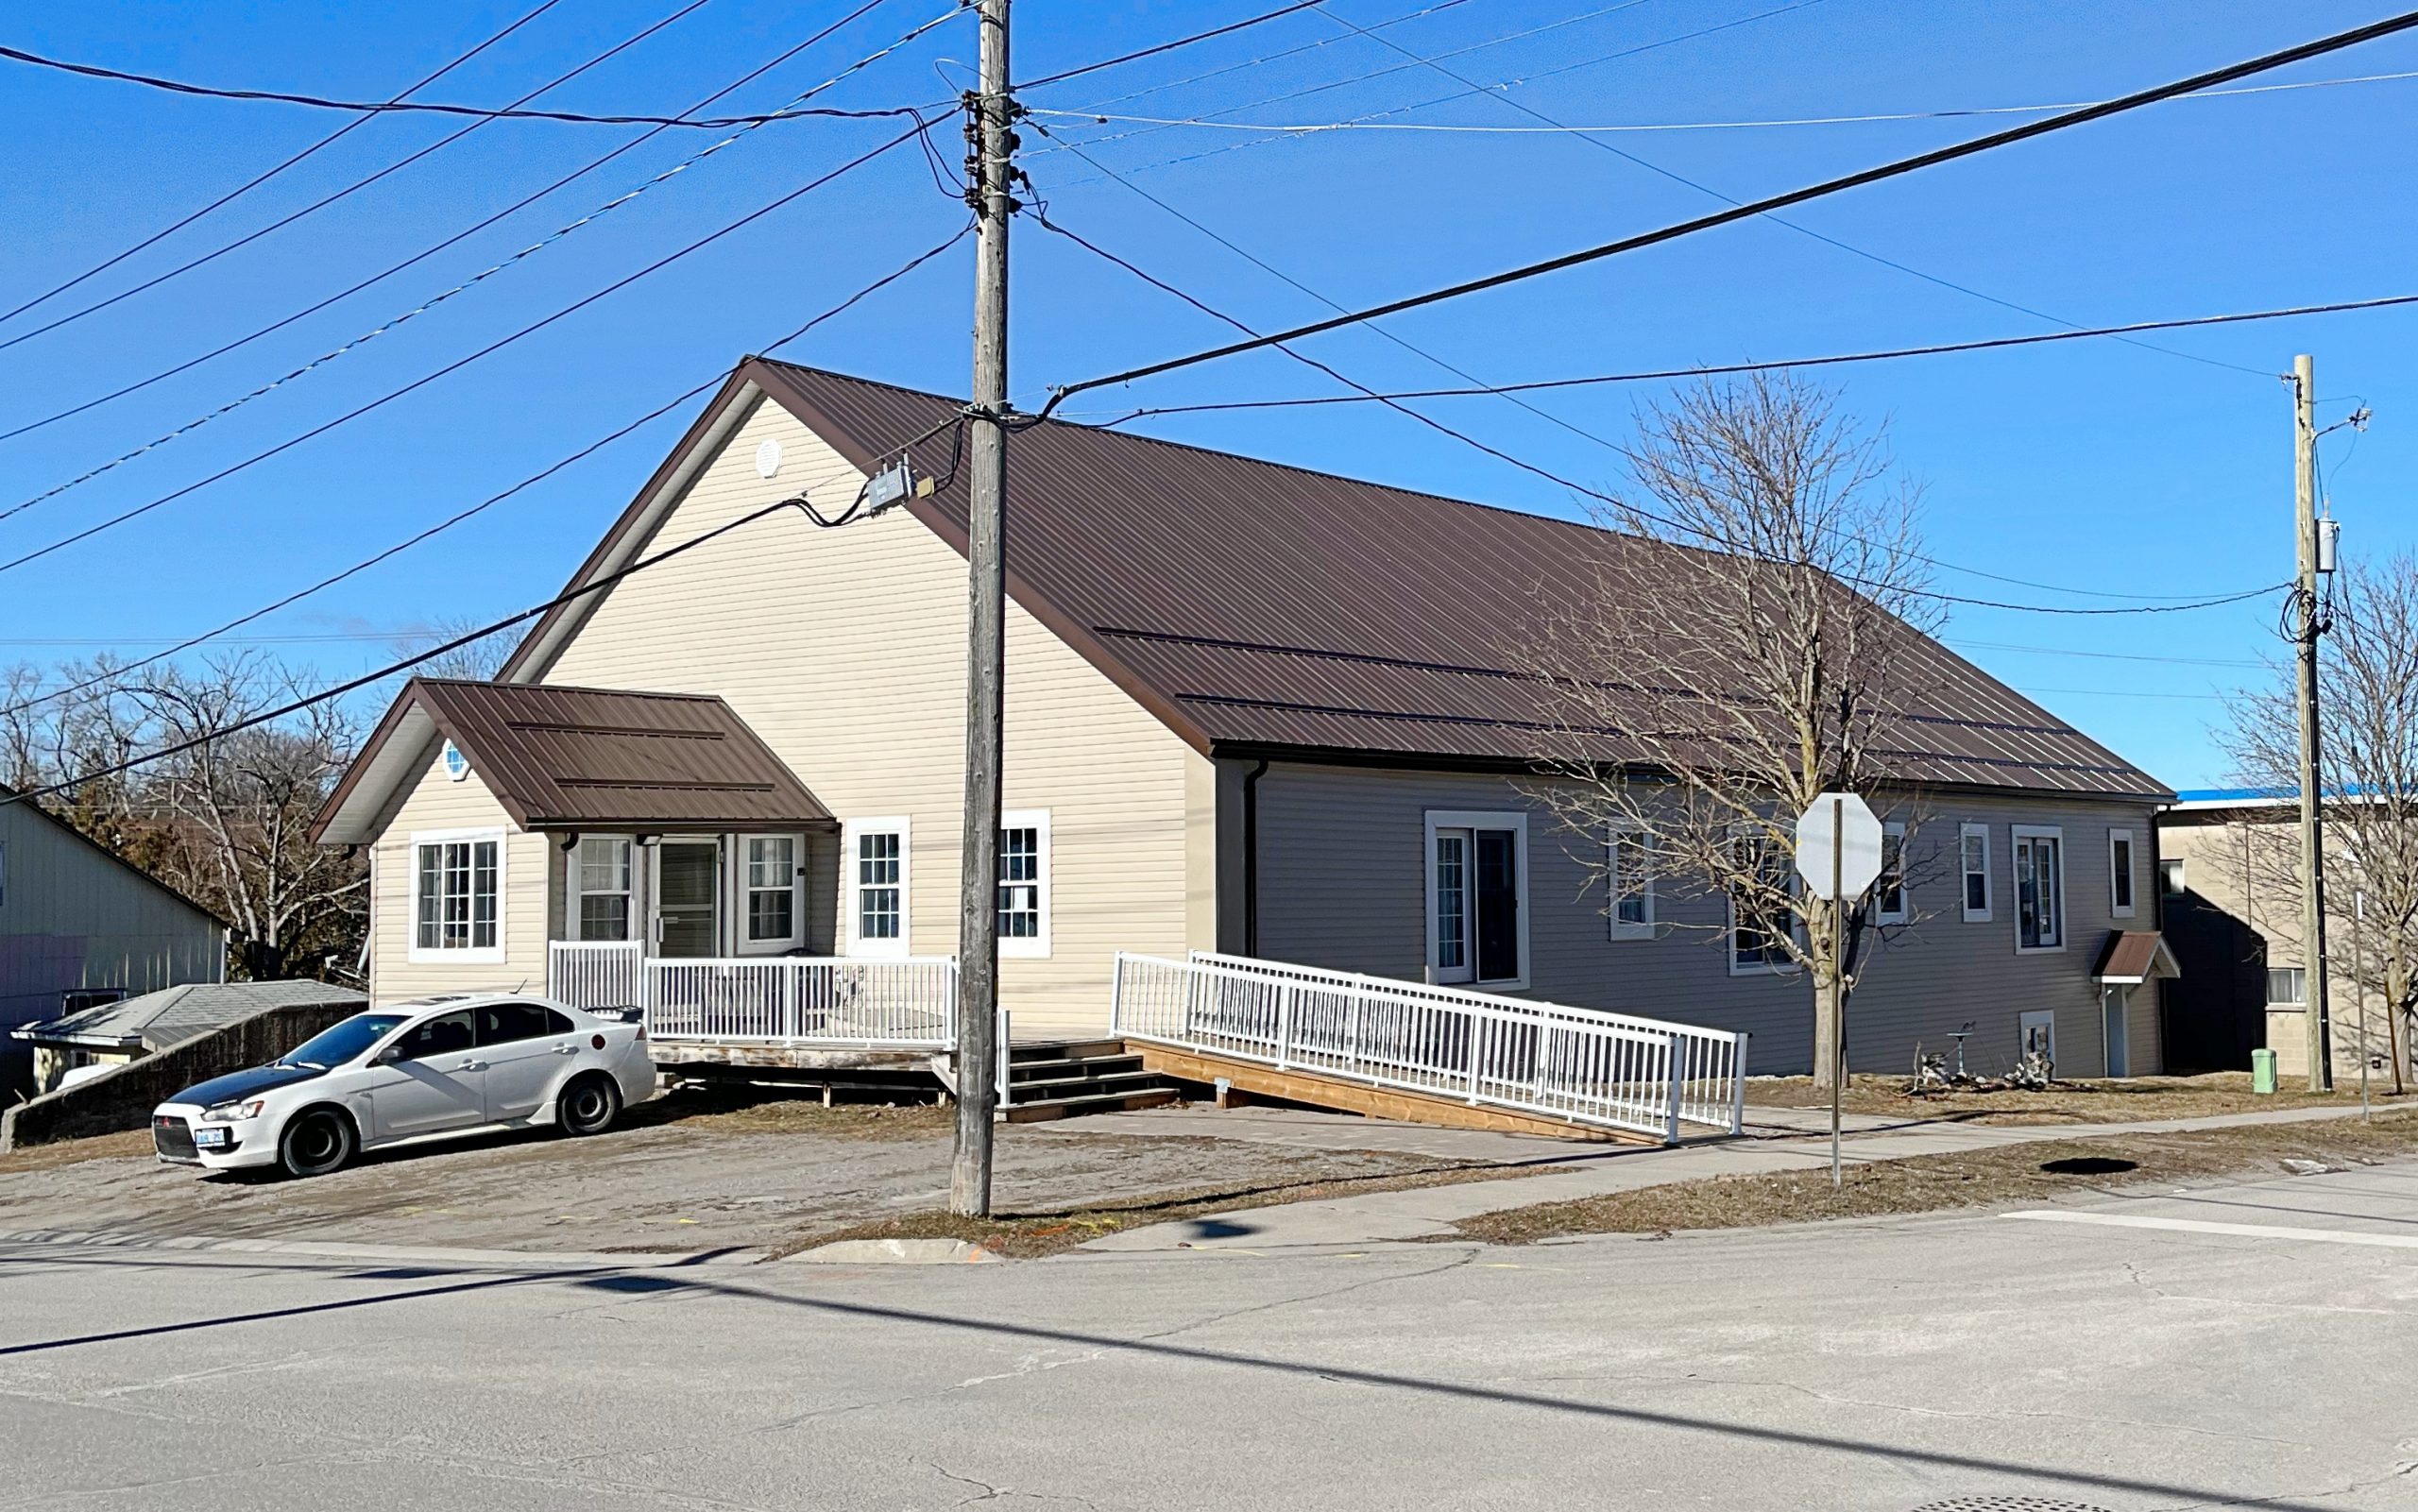
1 Banff Road – Early 1970’s
The next milestone in Canadian Tire’s journey came in the early 1970s when the store relocated once again, this time to the corner of Toronto Street and Banff Road. Owned by Associate Dealers Norm Kane and later Kevin Shay, this new location reflected the town’s burgeoning population and demand for modern retail amenities. Although the property is now under different ownership, remnants of Canadian Tire’s legacy remain in the form of service bays and a service entrance, serving as a nod to its past.
In 1994 I (Shane) started my Canadian Tire career part-time in the sports/seasonal department at the Banff Road location.
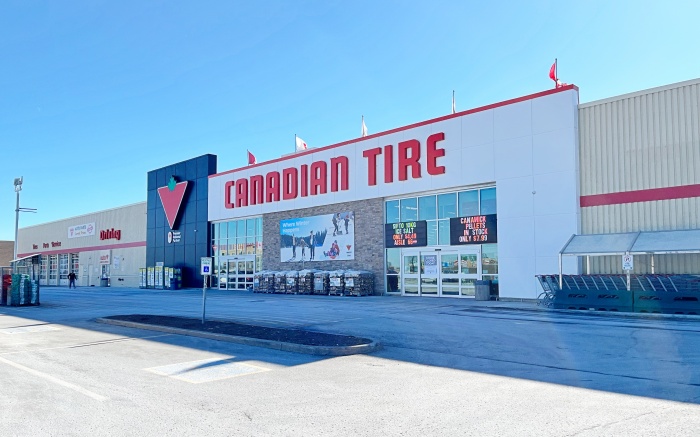
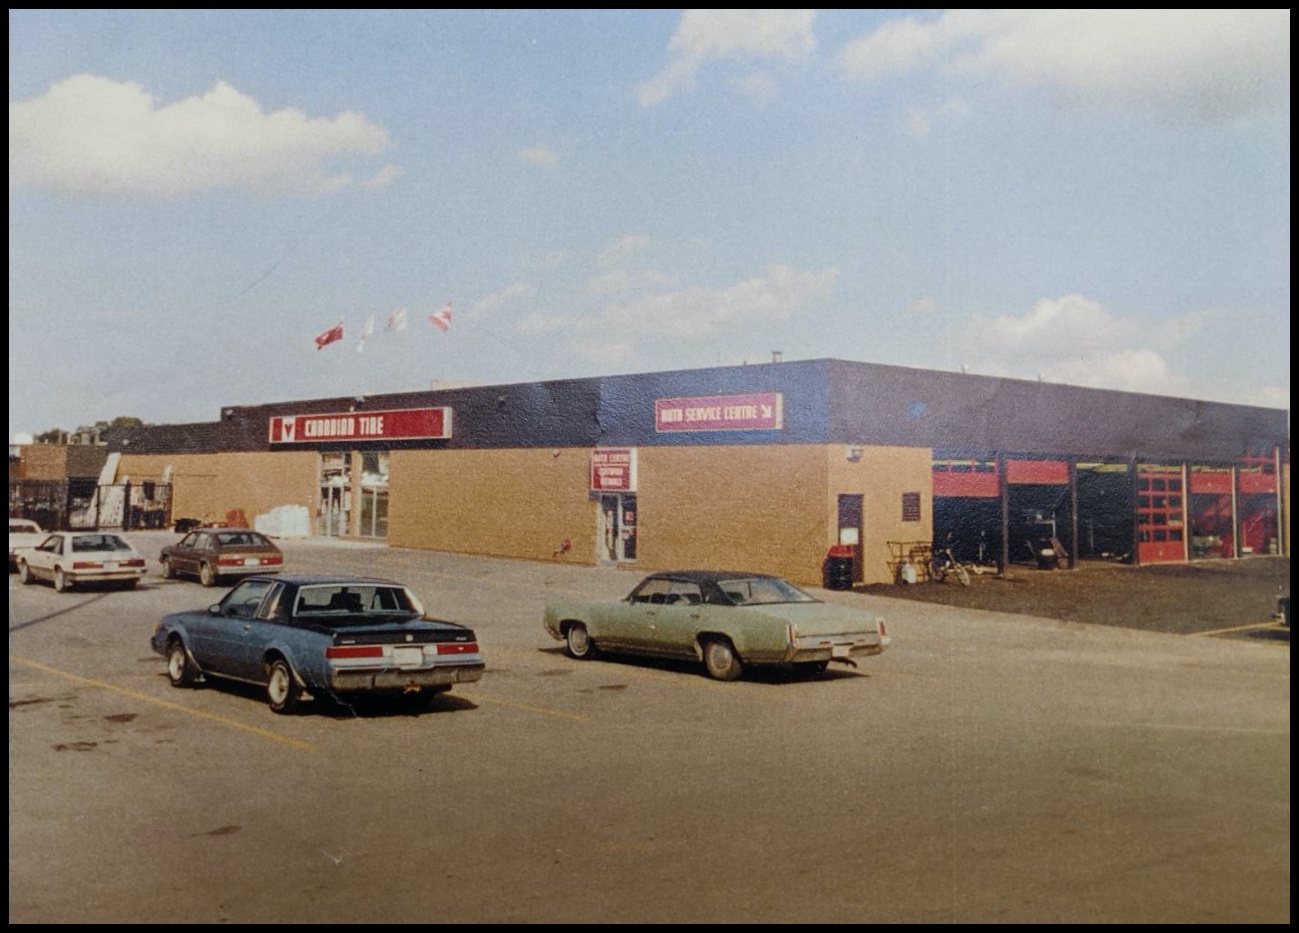
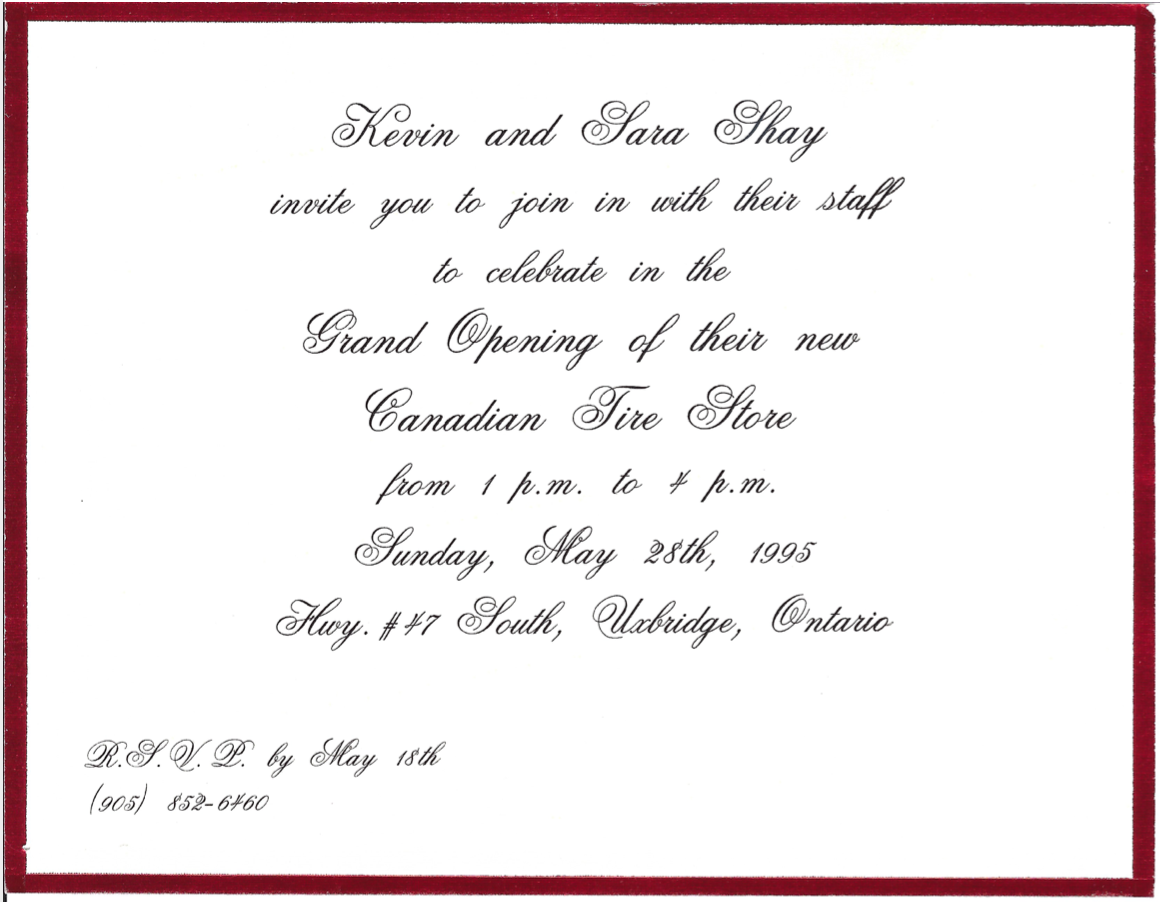
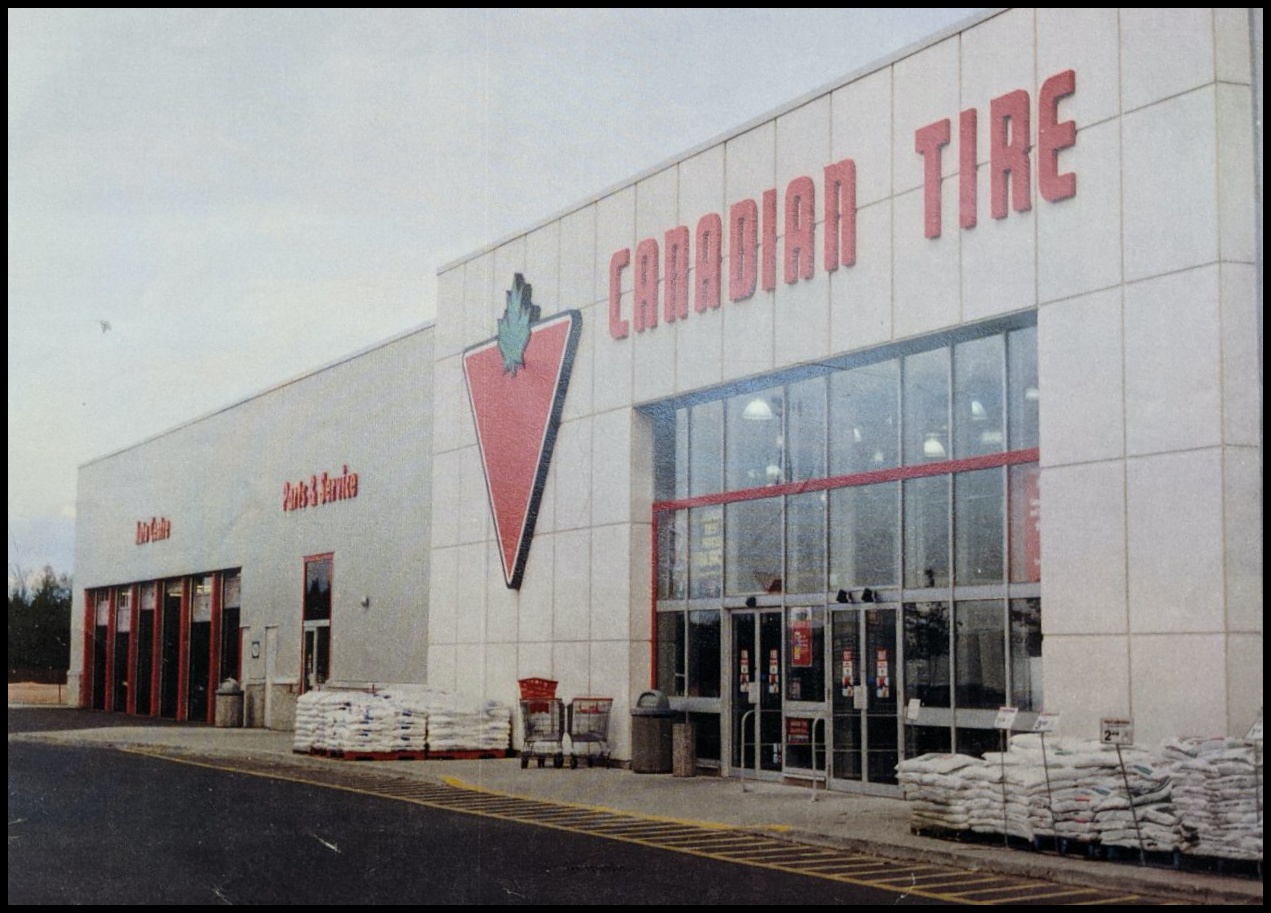
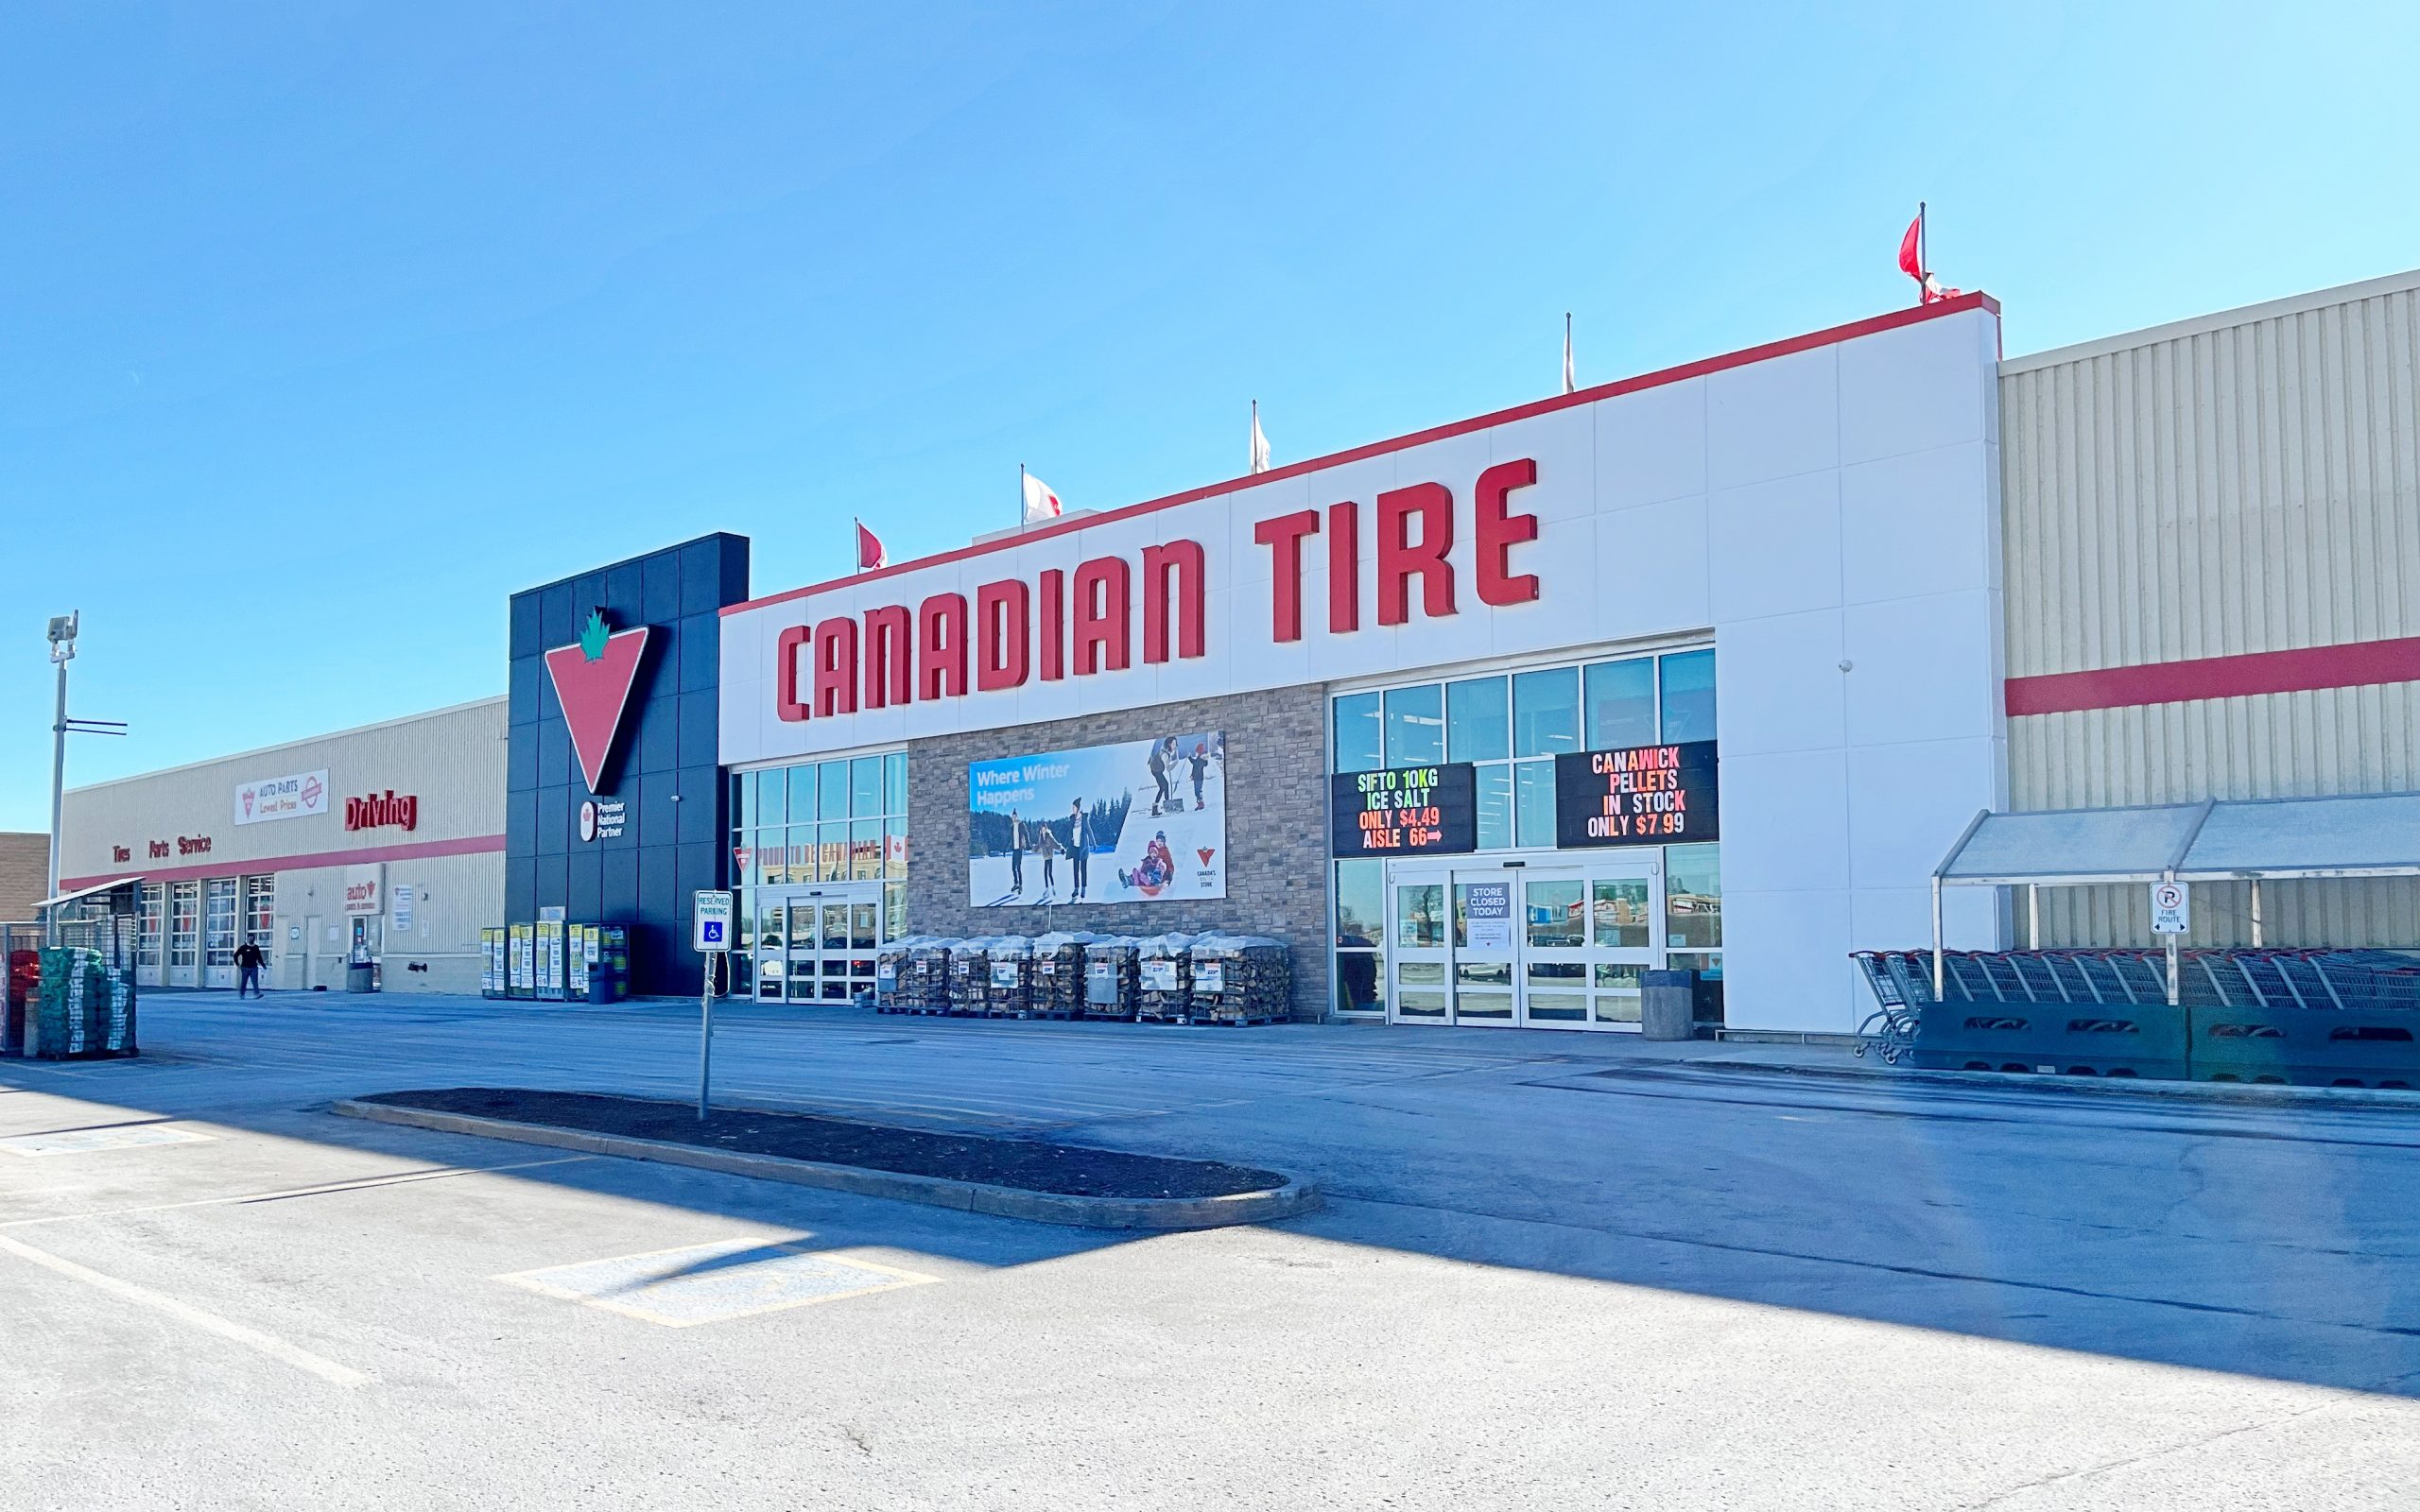
327 Toronto Street South – 1995 to present
However, it was in 1995 that Canadian Tire in Uxbridge reached a defining moment in its history. Under the continued ownership of Associate Dealer Kevin Shay, the store moved to its current location at 327 Toronto Street South. This relocation coincided with the introduction of the new “Class Of” store concept, showcasing wider aisles, brighter lights, and an expanded product selection. The store was taken over by Associate Dealer Patrick Higgins (Mr. Uxbridge) in 1998 and over the years, the store has undergone numerous renovations and expansions, including the addition of a full-service garden centre, further cementing its place as a vital retail hub in the community.
Today, Canadian Tire in Uxbridge stands as a symbol of endurance and adaptation, bridging the gap between tradition and modernity. Its journey from the quaint streets of downtown to its current bustling location mirrors the evolution of Uxbridge itself, reminding us of the rich history and vibrant spirit that define this charming town. As Canadian Tire continues to serve generations of Uxbridge residents, its story remains intertwined with the fabric of the community, a testament to the enduring legacy of a Canadian icon.
I continued my CTC career at the new location working for Kevin Shay. I helped Kevin open this new location then followed him when he opened the new Whitby location on Consumers Dr by the 401. When Kevin left the Whitby store I stayed on for a few years but ultimately came back to work for Pat. During my time I helped Pat renovate the store 3 times, one being when the addition went on the west end.
For a century, the iconic red triangle of Canadian Tire has stood as one of the most recognizable logos in Canadian history. Yet, its familiar form today belies a journey of evolution and transformation. Take a journey through time and uncover the fascinating evolution of Canadian Tire’s visual identity over the past century.
Check out our Uxbridge and Scugog Events Pages to keep up to date on whats going on around town. Click the links or scan the Code with your phone to take you directly there.

 Facebook
 X
X
 Pinterest
 Copy Link