

 Facebook
 X
X
 Pinterest
 Copy Link

Brock Housing August 2026

Each office is independently owned and operated


Housing Market Report for August 2026
Here is the Township of Brock Housing August 2026 report (all housing types), with reports from the Canadian Real Estate Association, and Toronto Regional Real Estate Board included.
This housing report for Durham Region includes the number of new listings, average list price, number of properties sold, average selling price, average days on market and average asking price to selling price ratio for all property types within the Region of Durham.
Scroll to the bottom for links to take you to the housing market reports for Durham Region, Uxbridge and Scugog.


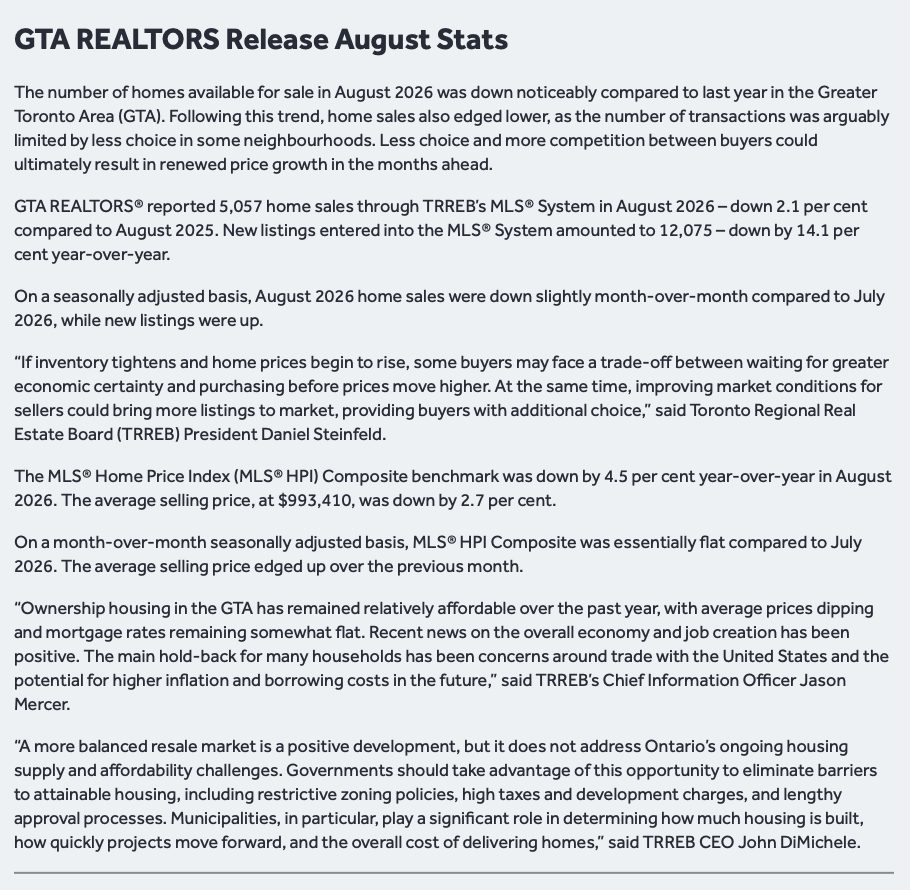
From Toronto Regional Real Estate Board
Please note: The PropTx MLS® System, of which TRREB is a part, has added a number of new client boards over the last year. Many of these boards’ Members trade within the Greater Toronto Area and broader Greater Golden Horseshoe regions. As a result, historic data have been updated to reflect the addition of these boards’ listings and transactions. This means historic data have changed relative to previously published static reports. To view updated historic data, click here.
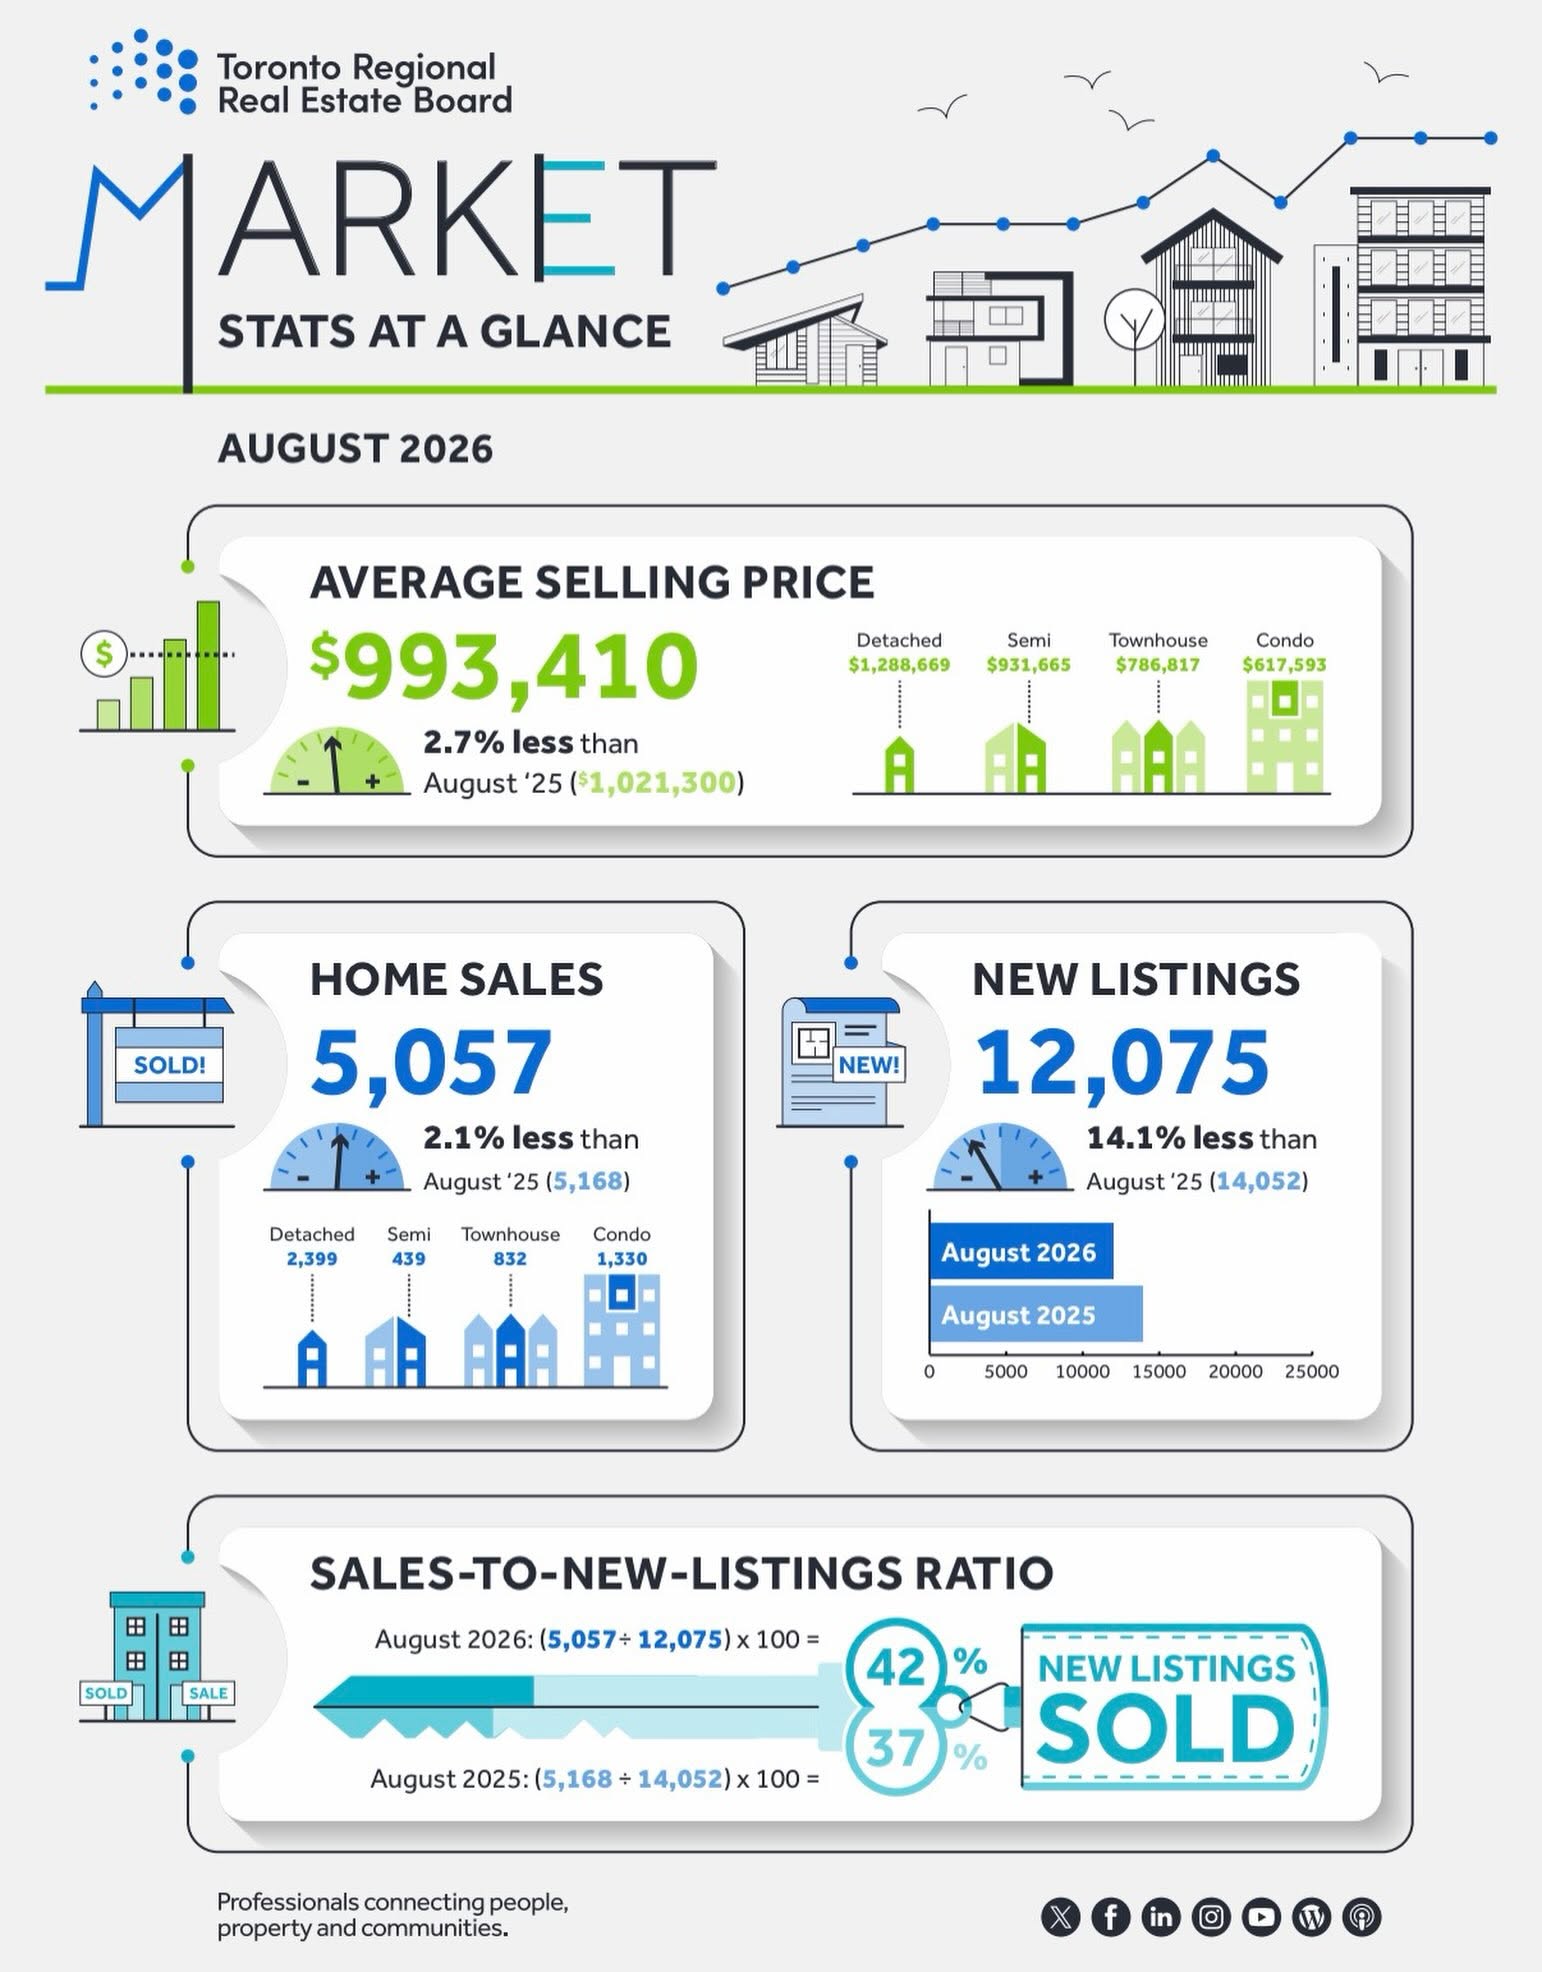
Toronto Regional Real Estate Board – Market Stats At A Glance – August 2026
Read the Toronto Regional Real Estate Board Market Watch Report
Brock Township Real Estate Market Analysis – August 2026
The Township of Brock real estate market remained firmly in buyer’s market territory in August 2026, with increased new listings, longer selling times, and a softer sale-to-list price ratio. While the average selling price edged higher from July and sales activity improved slightly, buyers continue to benefit from greater choice and negotiating power.
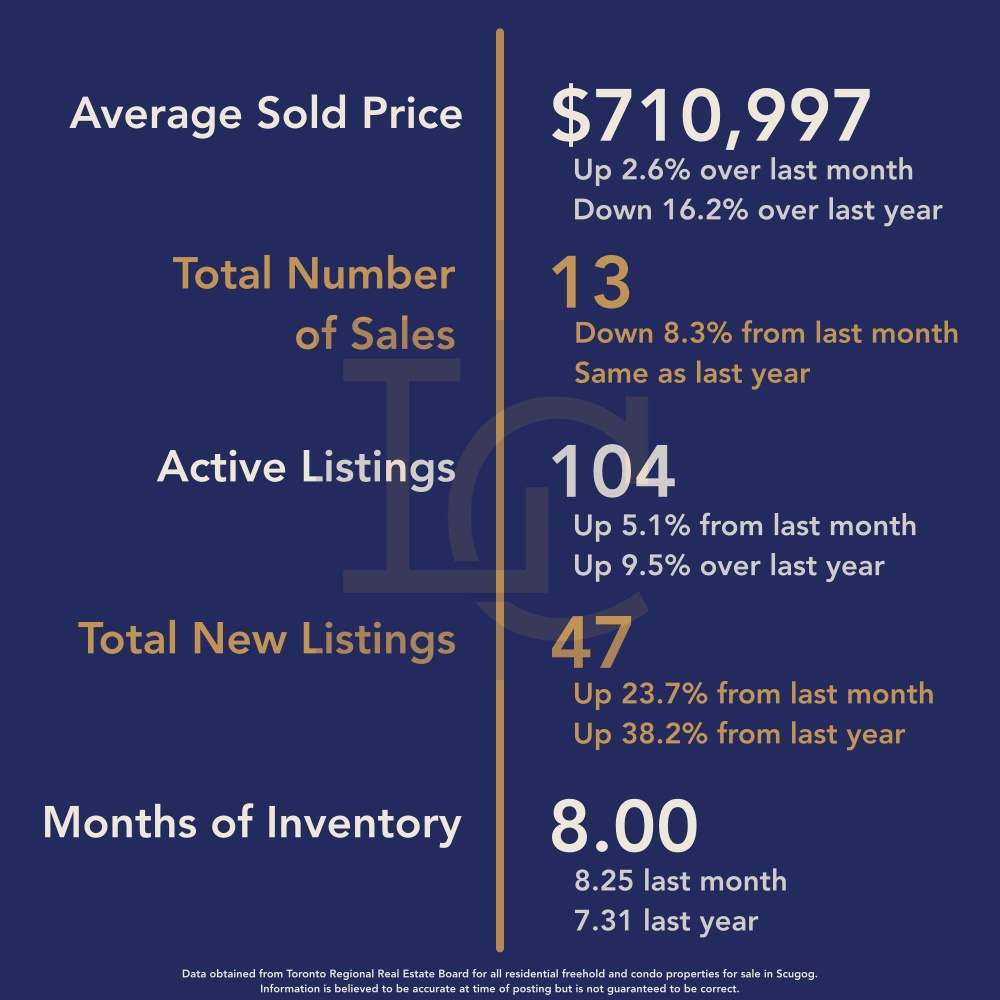
August 2026
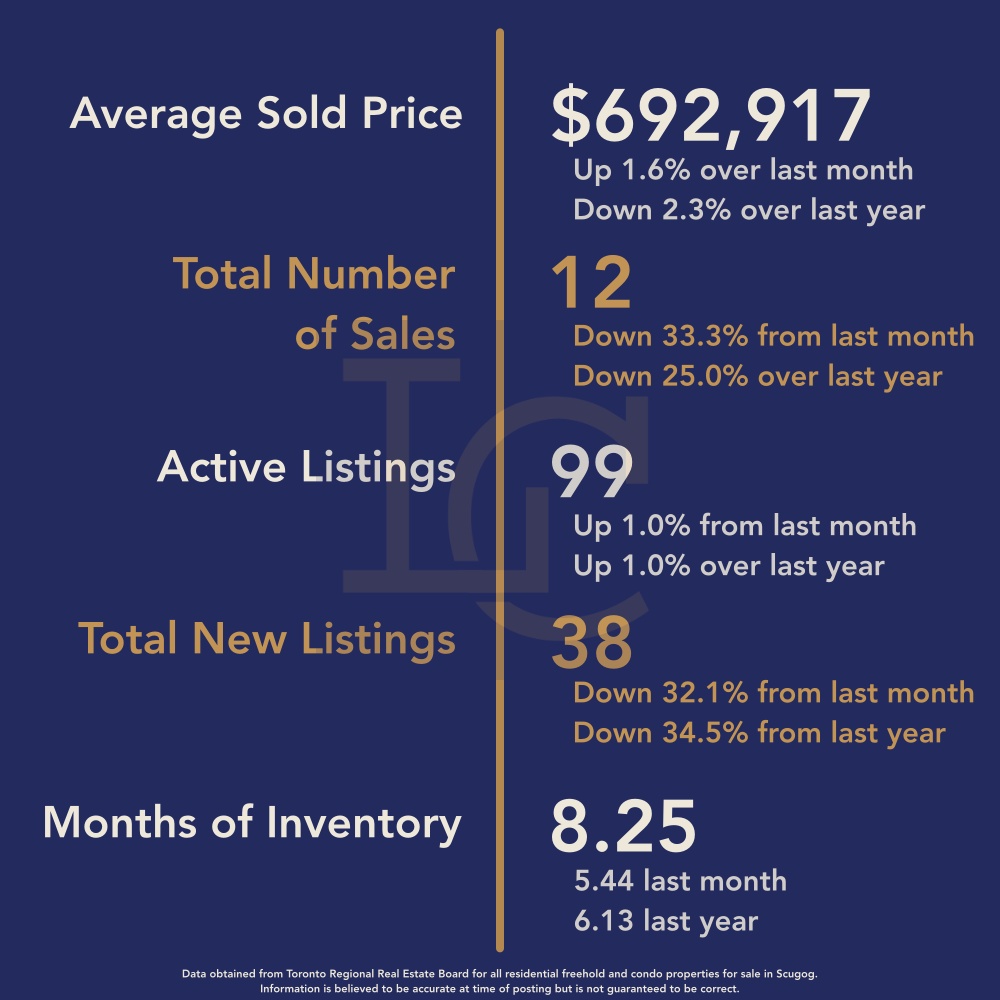
July 2026
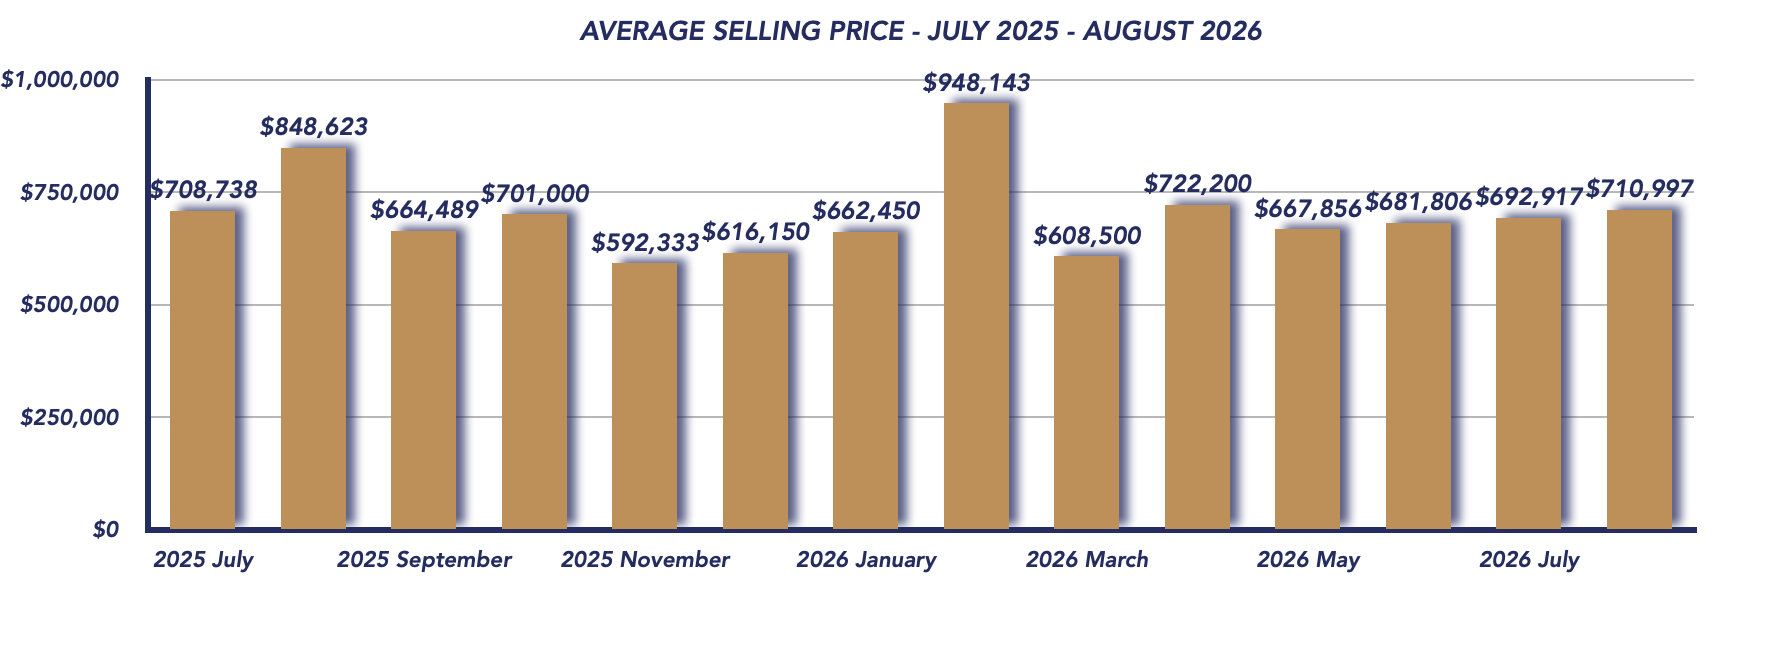
Average Selling Price Edges Higher
The average selling price in August 2026 was $710,997, representing a 1.6% increase from July’s $692,917, but a significant 16.2% decrease from August 2025’s $848,623.
The year-over-year comparison requires some context. August 2025’s average was influenced by two properties that sold for more than $1.5 million, which pushed that month’s average considerably higher. As we’ve seen throughout Brock Township, a relatively small number of transactions can allow a handful of higher-priced sales to have a significant impact on the monthly average.
The modest increase from July therefore provides a better indication of the current direction of pricing than the larger year-over-year decline alone.
Sales Activity Improves Slightly
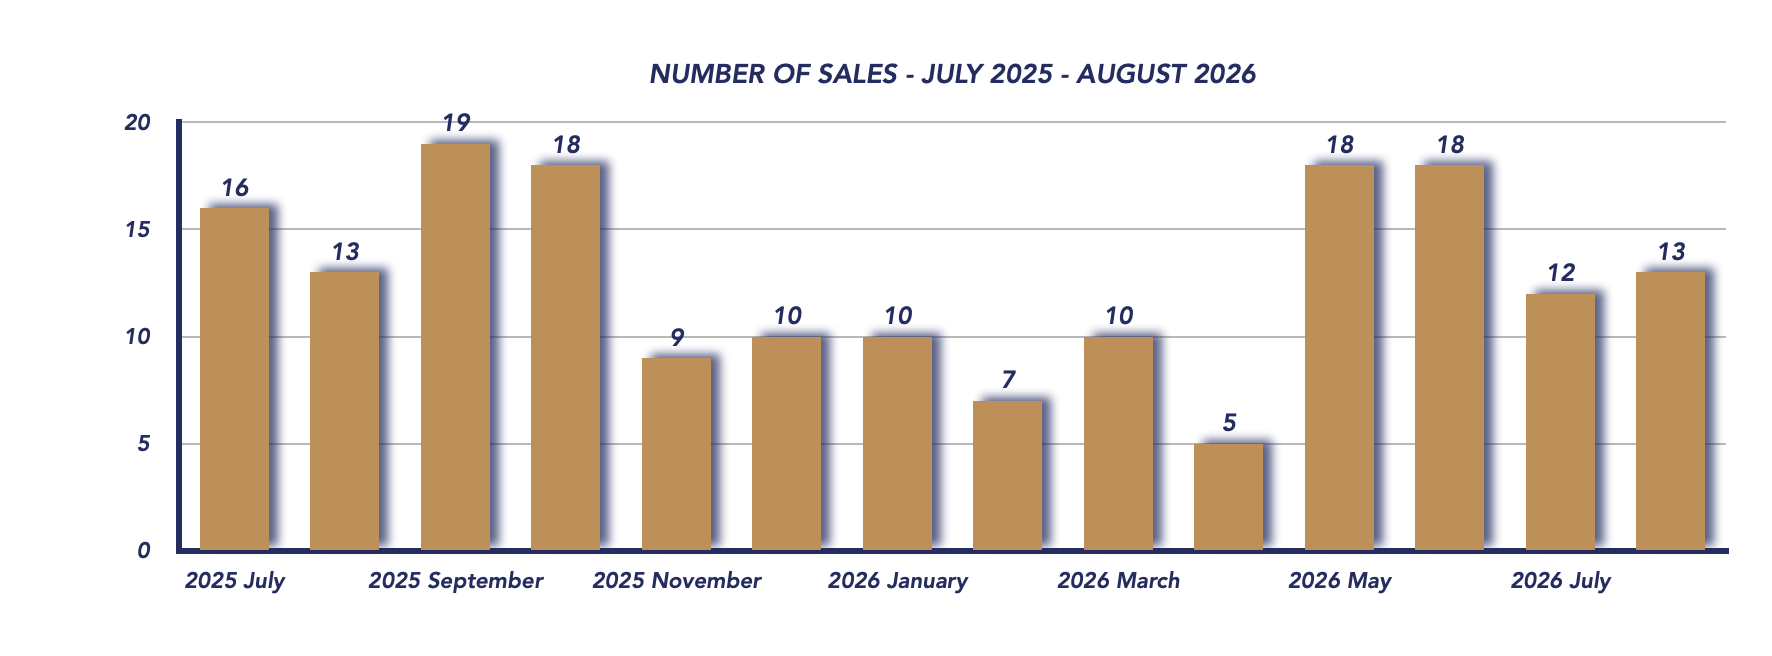
A total of 13 properties sold in August, up slightly from 12 sales in July and matching the 13 sales recorded in August 2025.
While the month-over-month improvement is encouraging, sales activity remains relatively modest compared with the amount of inventory available. Buyers are still active, but they appear to be taking their time and being selective before committing to a purchase.
Sale-to-List Price Ratio Declines
The sale-to-list price ratio fell to 95%, compared with 96% in July and 98% in August 2025.
This means properties sold, on average, for approximately 5% below their asking price. The declining ratio reinforces the negotiating advantage buyers currently have, particularly when properties have been sitting on the market for an extended period.
For sellers, pricing appropriately from the beginning is becoming increasingly important. With buyers having more options, overpriced properties may face longer selling times and eventual price adjustments.
New Listings Increase
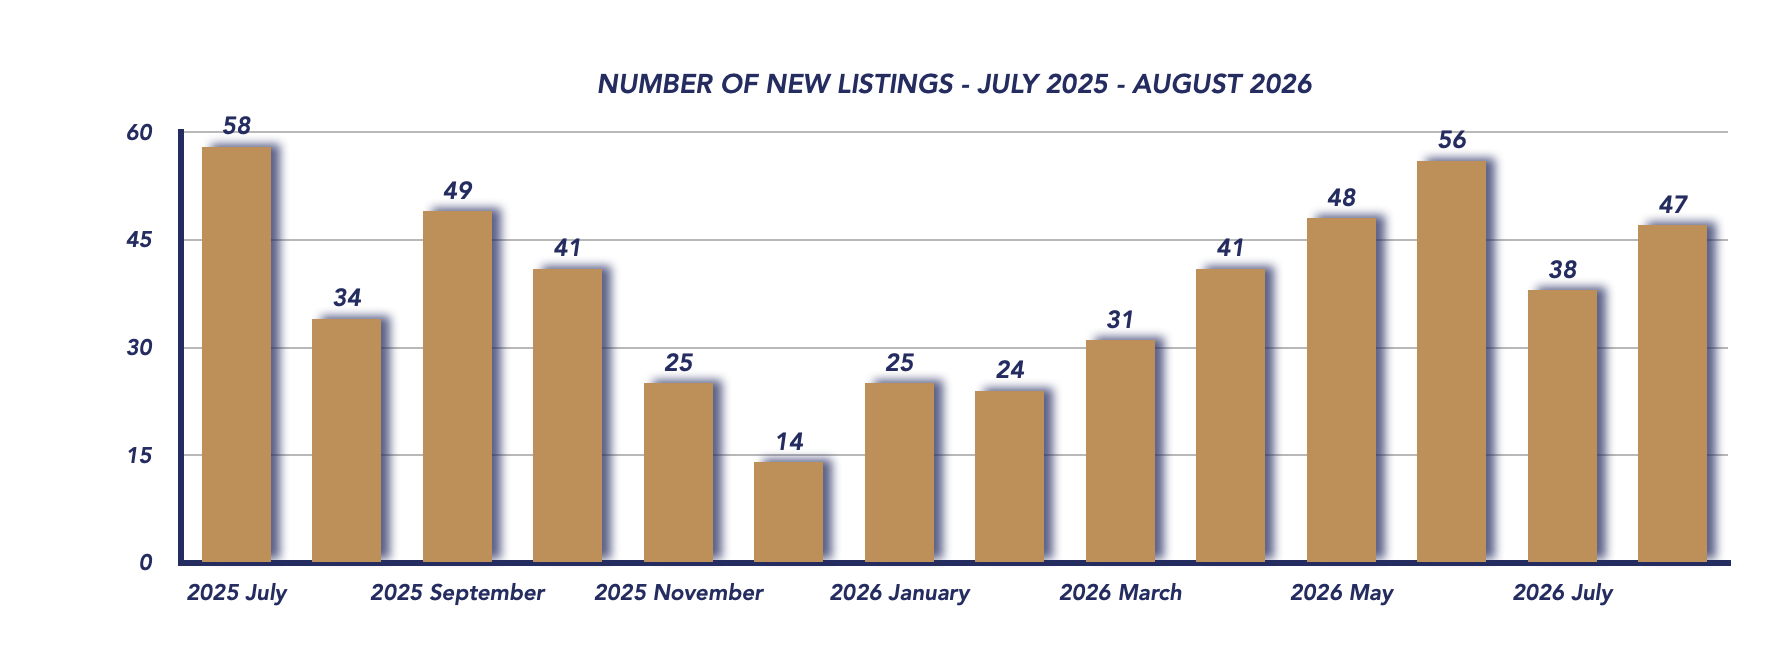
There were 47 new listings in August, up from 38 in July and considerably higher than the 34 new listings recorded in August 2025.
The increase in new listings means buyers continue to have a healthy selection of properties to consider. With sales activity remaining relatively modest, the additional supply is helping maintain buyer-friendly conditions across Brock Township.
Properties Taking Longer to Sell
The average days on market increased to 65 days, up significantly from 39 days in July and above the 50 days recorded in August 2025.
This increase suggests buyers are feeling less urgency and are taking more time to compare properties, negotiate and make purchasing decisions.
For sellers, patience may be required. Homes that are well presented and competitively priced can still attract buyers, but the overall market is giving purchasers more time to consider their options.
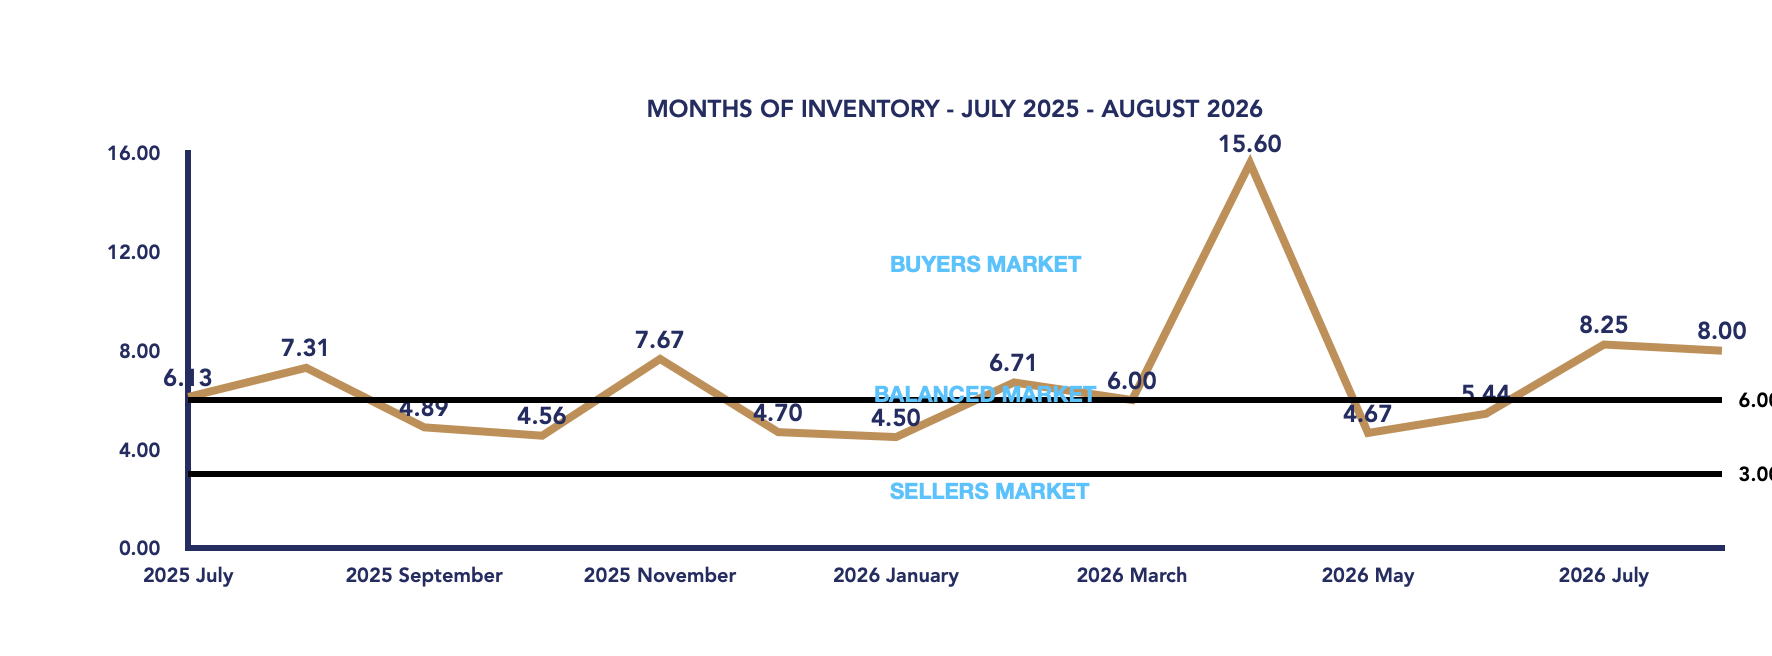
Months of Inventory Remains in Buyer’s Market Territory
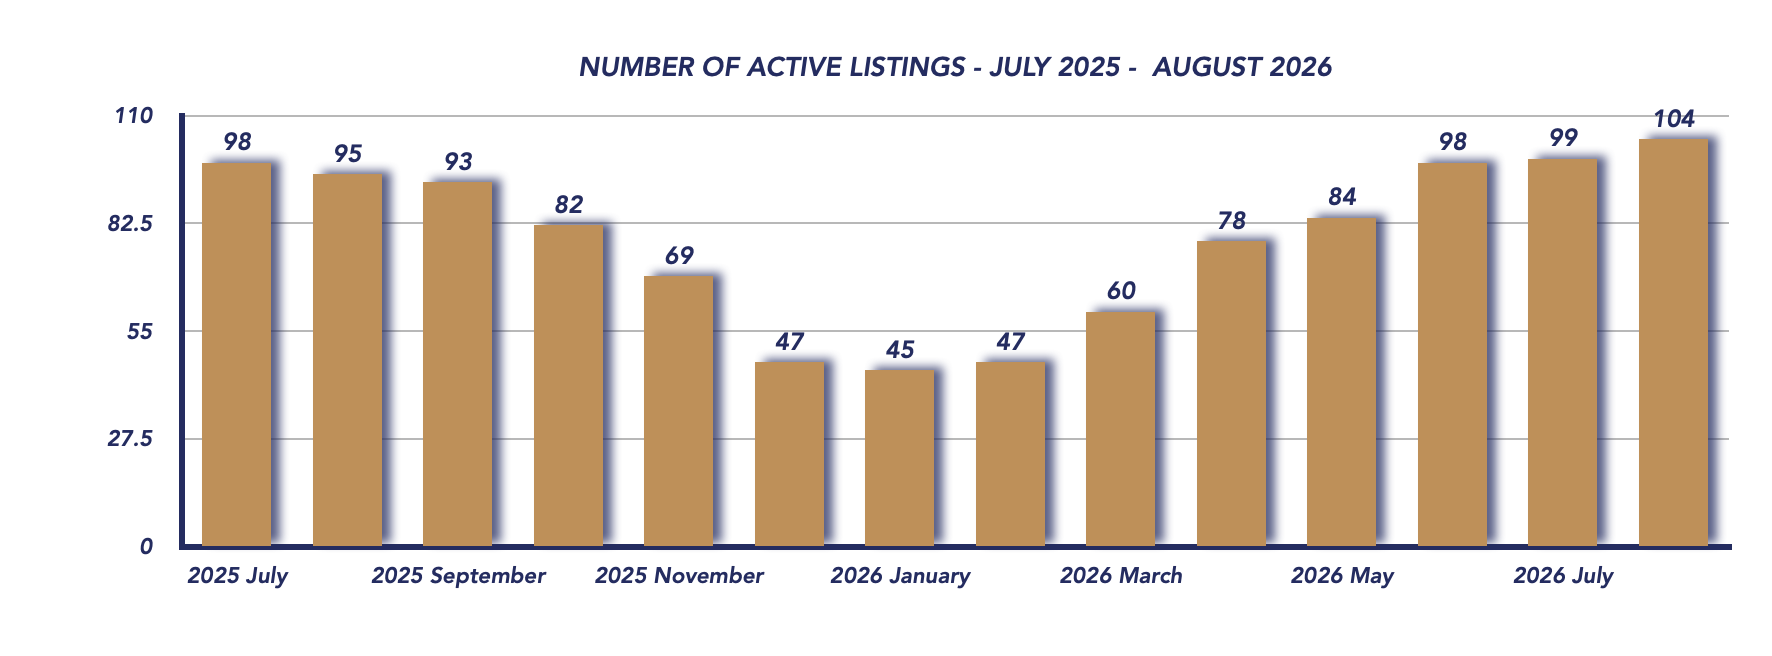
Months of inventory dipped slightly to 8.00 months, compared with 8.25 months in July, but remains above the 7.31 months recorded in August 2025.
Although the slight month-over-month decline is a move in the right direction, 8 months of inventory keeps Brock Township firmly in buyer’s market territory.
The combination of increased listings, longer selling times and a lower sale-to-list price ratio continues to provide buyers with considerable choice and negotiating leverage.
Conclusion
August 2026 delivered a mixed picture for the Brock Township housing market. The average selling price increased modestly to $710,997, and sales improved slightly, but other indicators continue to favour buyers.
More properties came onto the market, homes took longer to sell, and the sale-to-list price ratio declined to 95%. With 8 months of inventory, buyers remain in a strong position to take their time, compare available properties and negotiate.
For sellers, the current market makes accurate pricing, strong presentation and realistic expectations increasingly important. As we head into the fall market, the key indicators to watch will be whether buyer activity strengthens and whether the increased supply of listings begins to be absorbed.
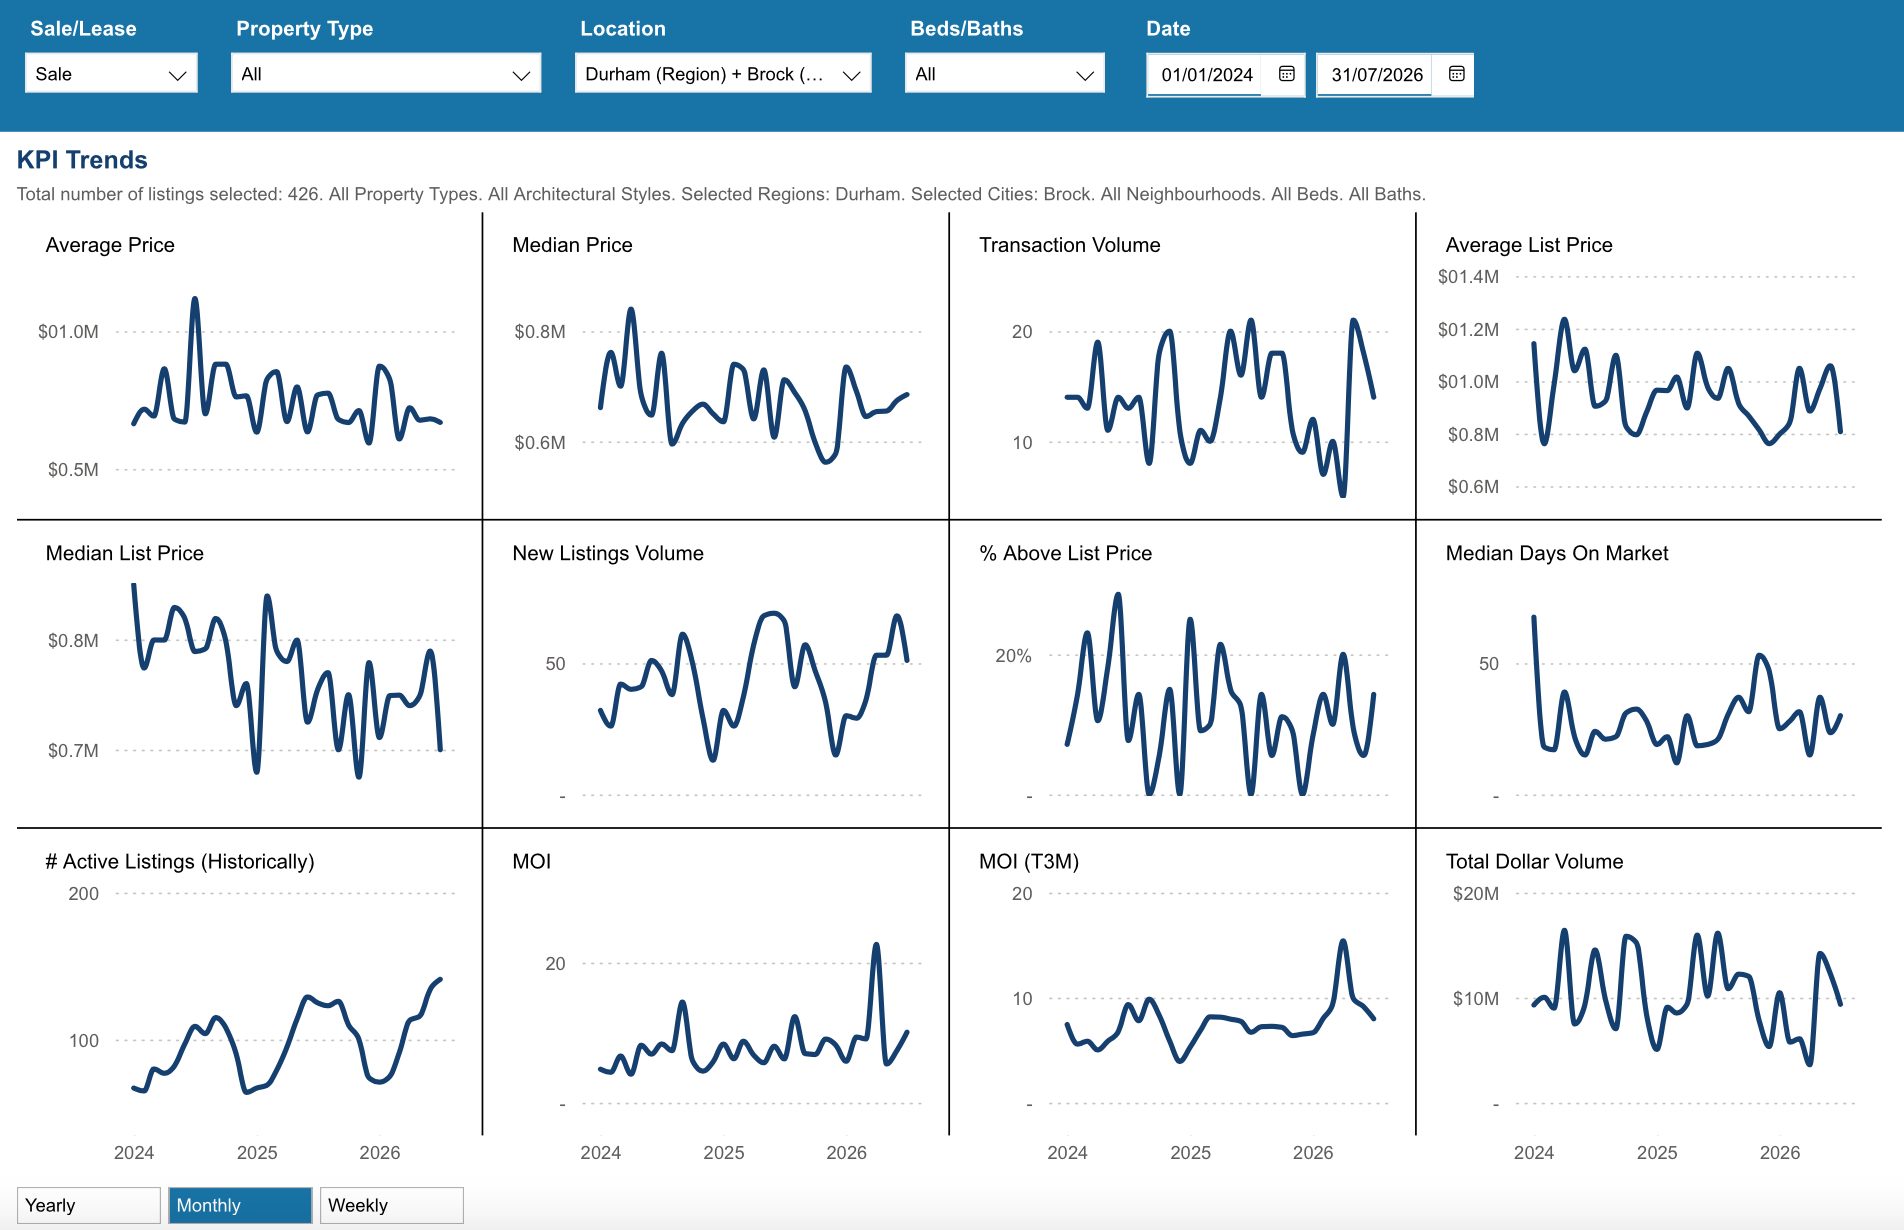
Key Performance Indicators (KPIs) from January 2024 through July 2025 provide a clear snapshot of how the Township of Brock real estate market has evolved across all property types, architectural styles, and home configurations
*Information is believed to be accurate at time of posting but is not guaranteed to be correct. Some values may vary slightly based on the exact date and time the reports were generated. Market stats are provided by TRREB (Toronto Regional Real Estate Board) and are based on sales for the month of Attached/Row/Townhouses, Condo Apartments, Condo Townhouses, Detached, Detached with Common Elements, Link Homes and Semi-detached. *Some values may vary slightly based on the exact date and time the reports were generated.
Not intended as a solicitation if your property is already listed by another broker. Affiliated real estate agents are independent contractor sales associates, not employees. ©2021 Coldwell Banker. All Rights Reserved. Coldwell Banker and the Coldwell Banker logos are trademarks of Coldwell Banker Real Estate LLC. The Coldwell Banker® System is comprised of company owned offices which are owned by a subsidiary of Realogy Brokerage Group LLC and franchised offices which are independently owned and operated. The Coldwell Banker System fully supports the principles of the Fair Housing Act and the Equal Opportunity Act.
Click below for more reports
Check out our Uxbridge and Scugog Events Pages to keep up to date on whats going on around town. Click the links or scan the Code with your phone to take you directly there.

UXBRIDGE EVENTS

SCUGOG EVENTS



