Facebook
 X
X
 Pinterest
 Copy Link
Kawartha Lakes Housing December 2023
![]()
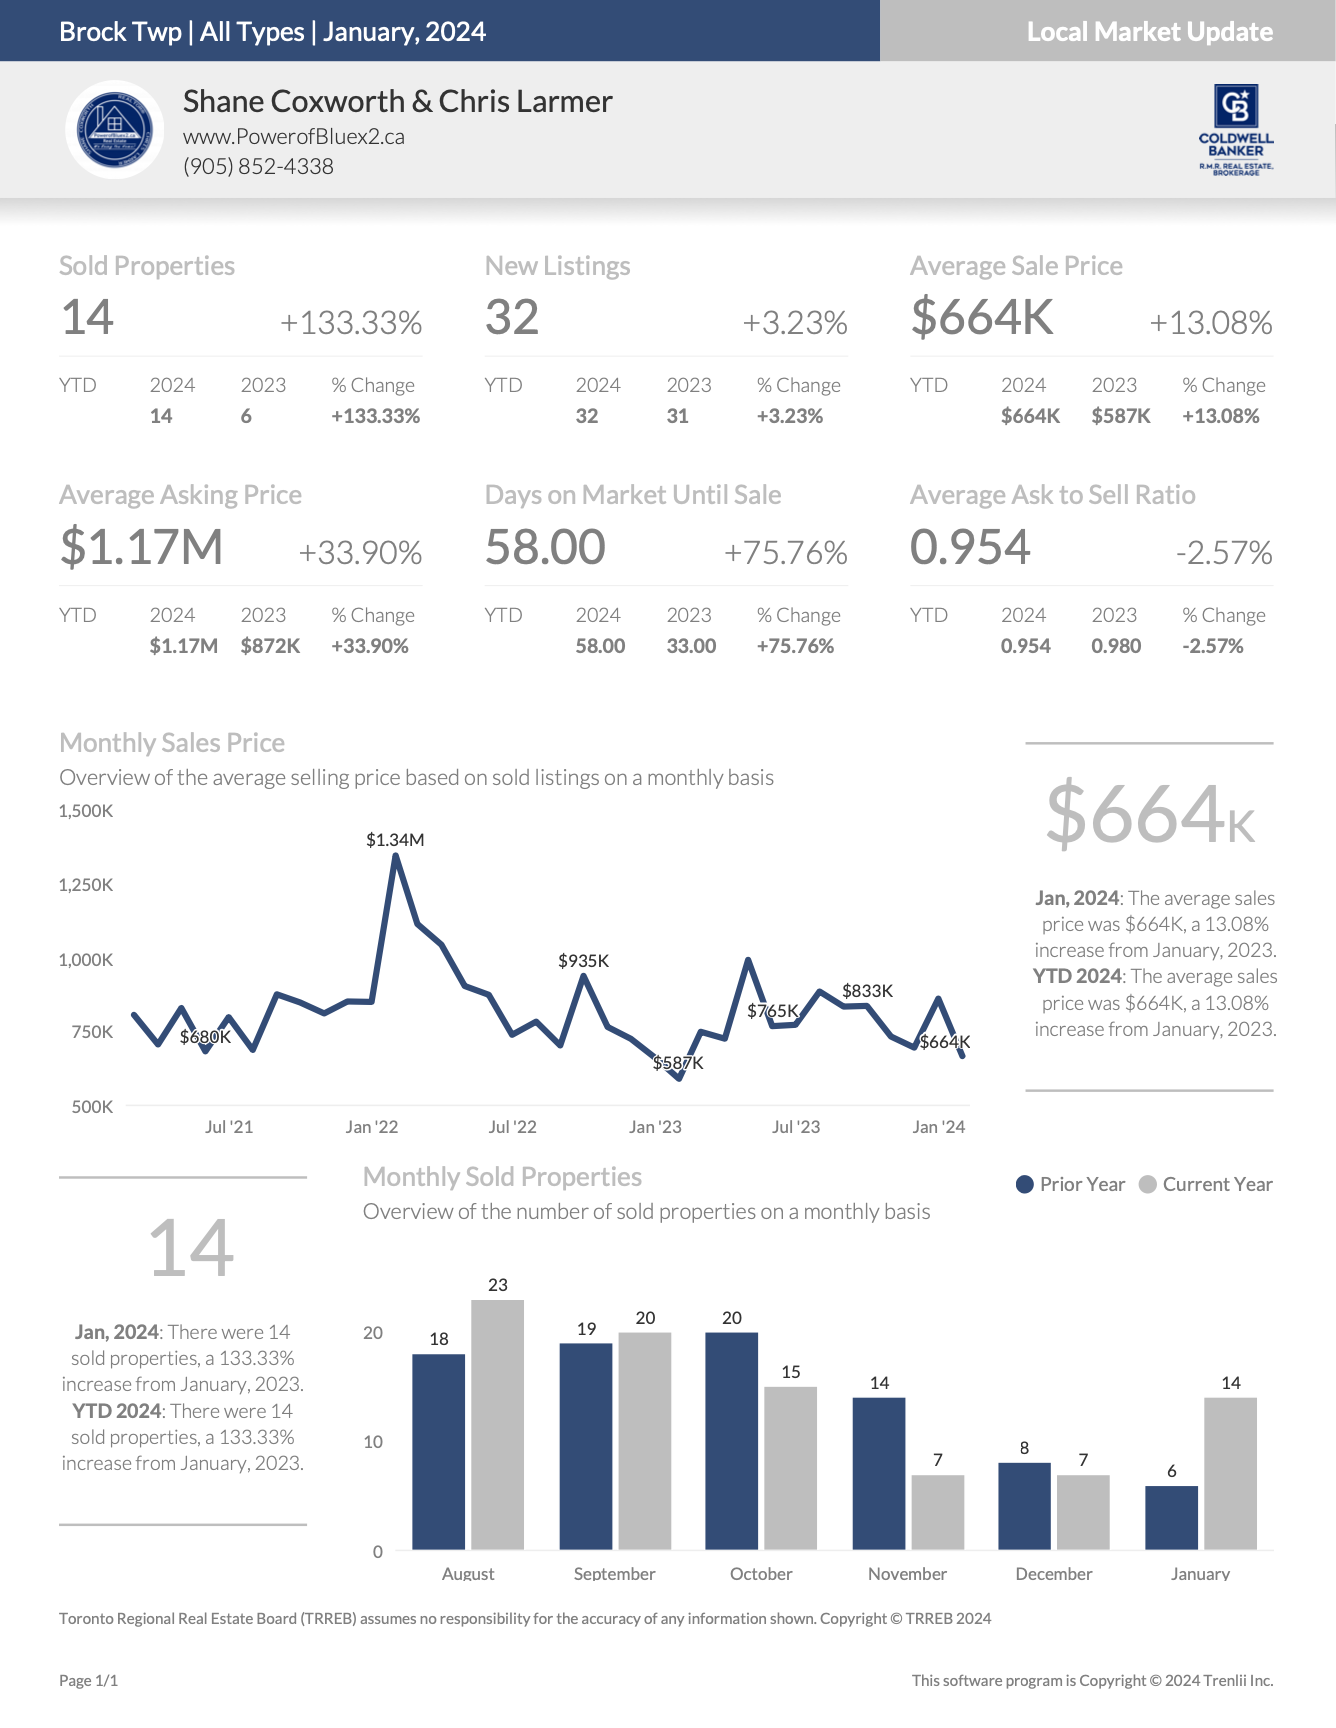
Housing Market Report for January 2024
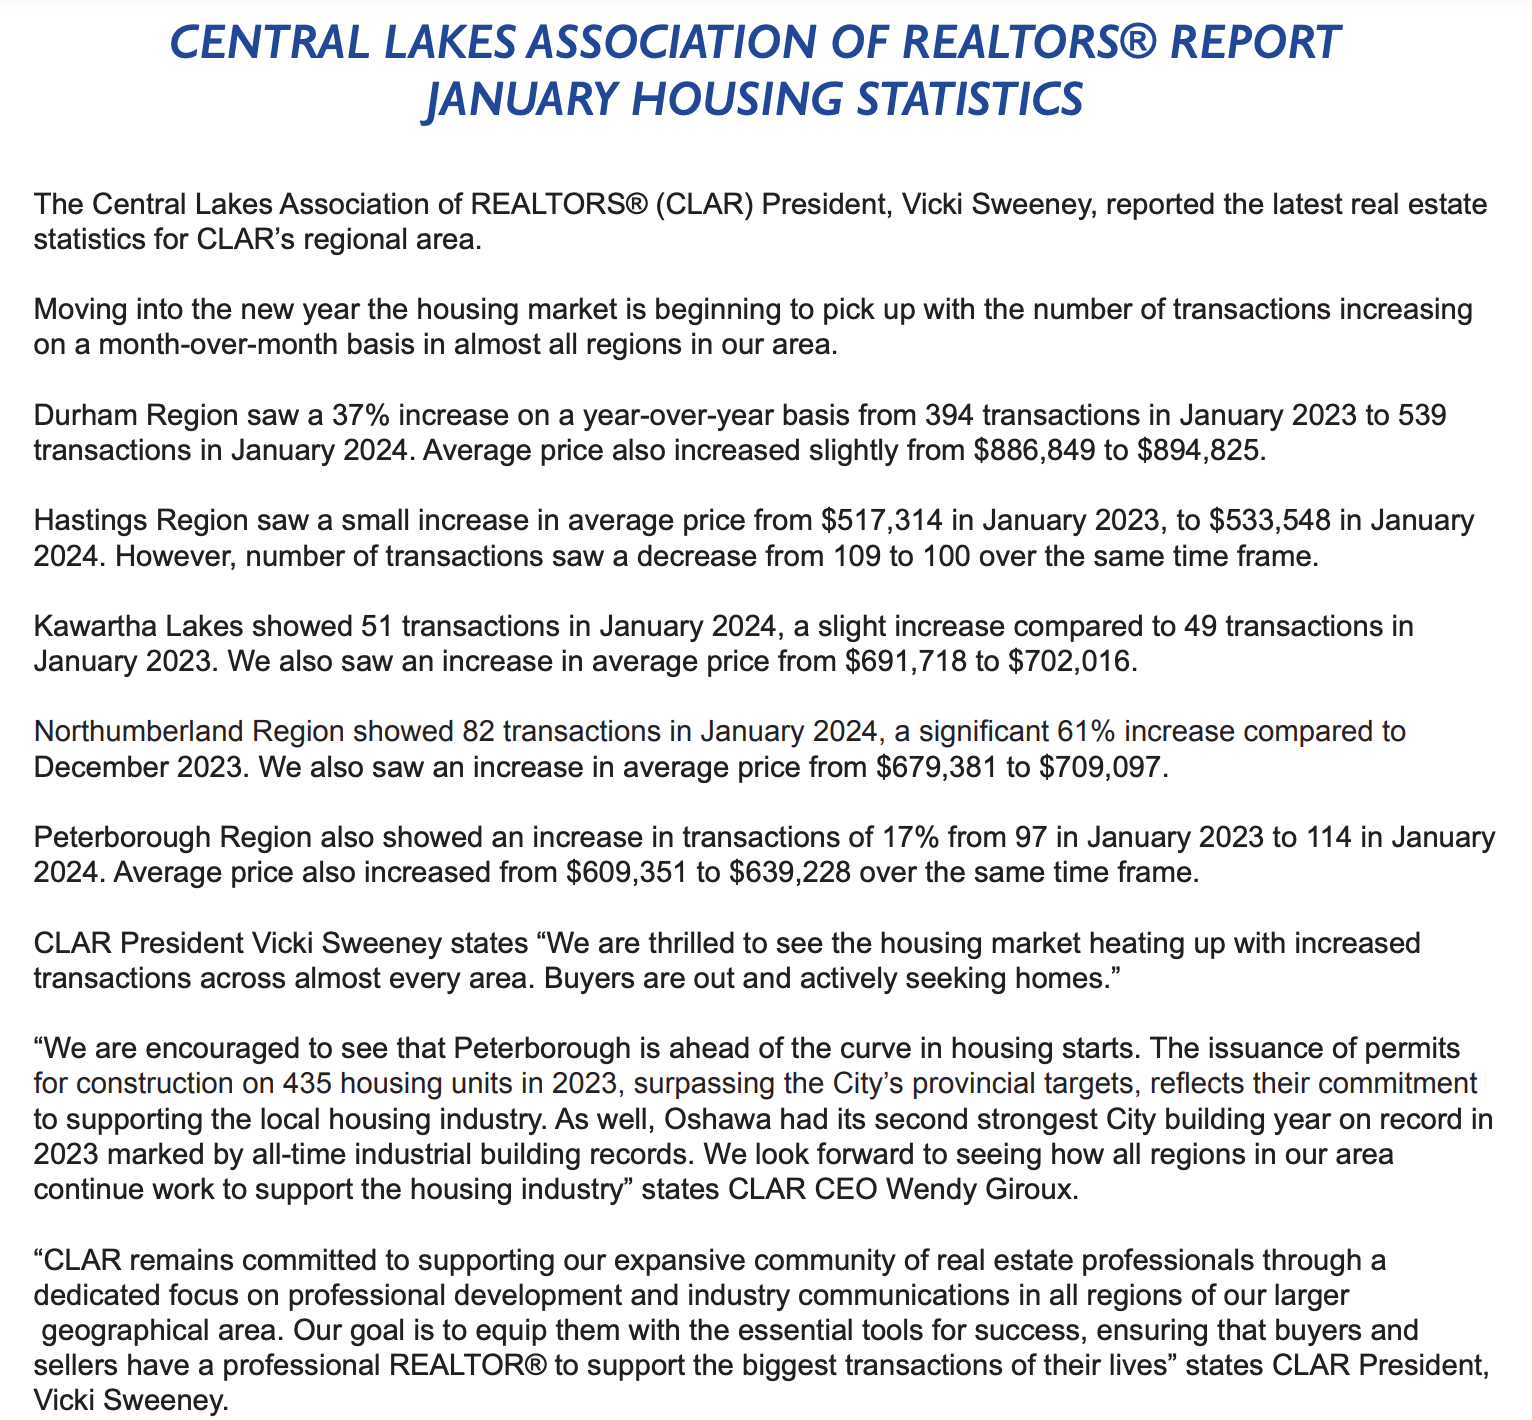
Here is the Kawartha Lakes Housing January 2024 report (all housing types), with reports from the Canadian Real Estate Association, Toronto Regional Real Estate Board included.
This housing report for Kawartha Lakes includes the number of new listings, average list price, number of properties sold, average selling price, average days on market and average asking price to selling price ratio for all property types within the Kawartha Lakes.
Scroll to the bottom for links to take you to the housing market reports for Durham, Uxbridge, Scugog and Brock.
![]()
![]()
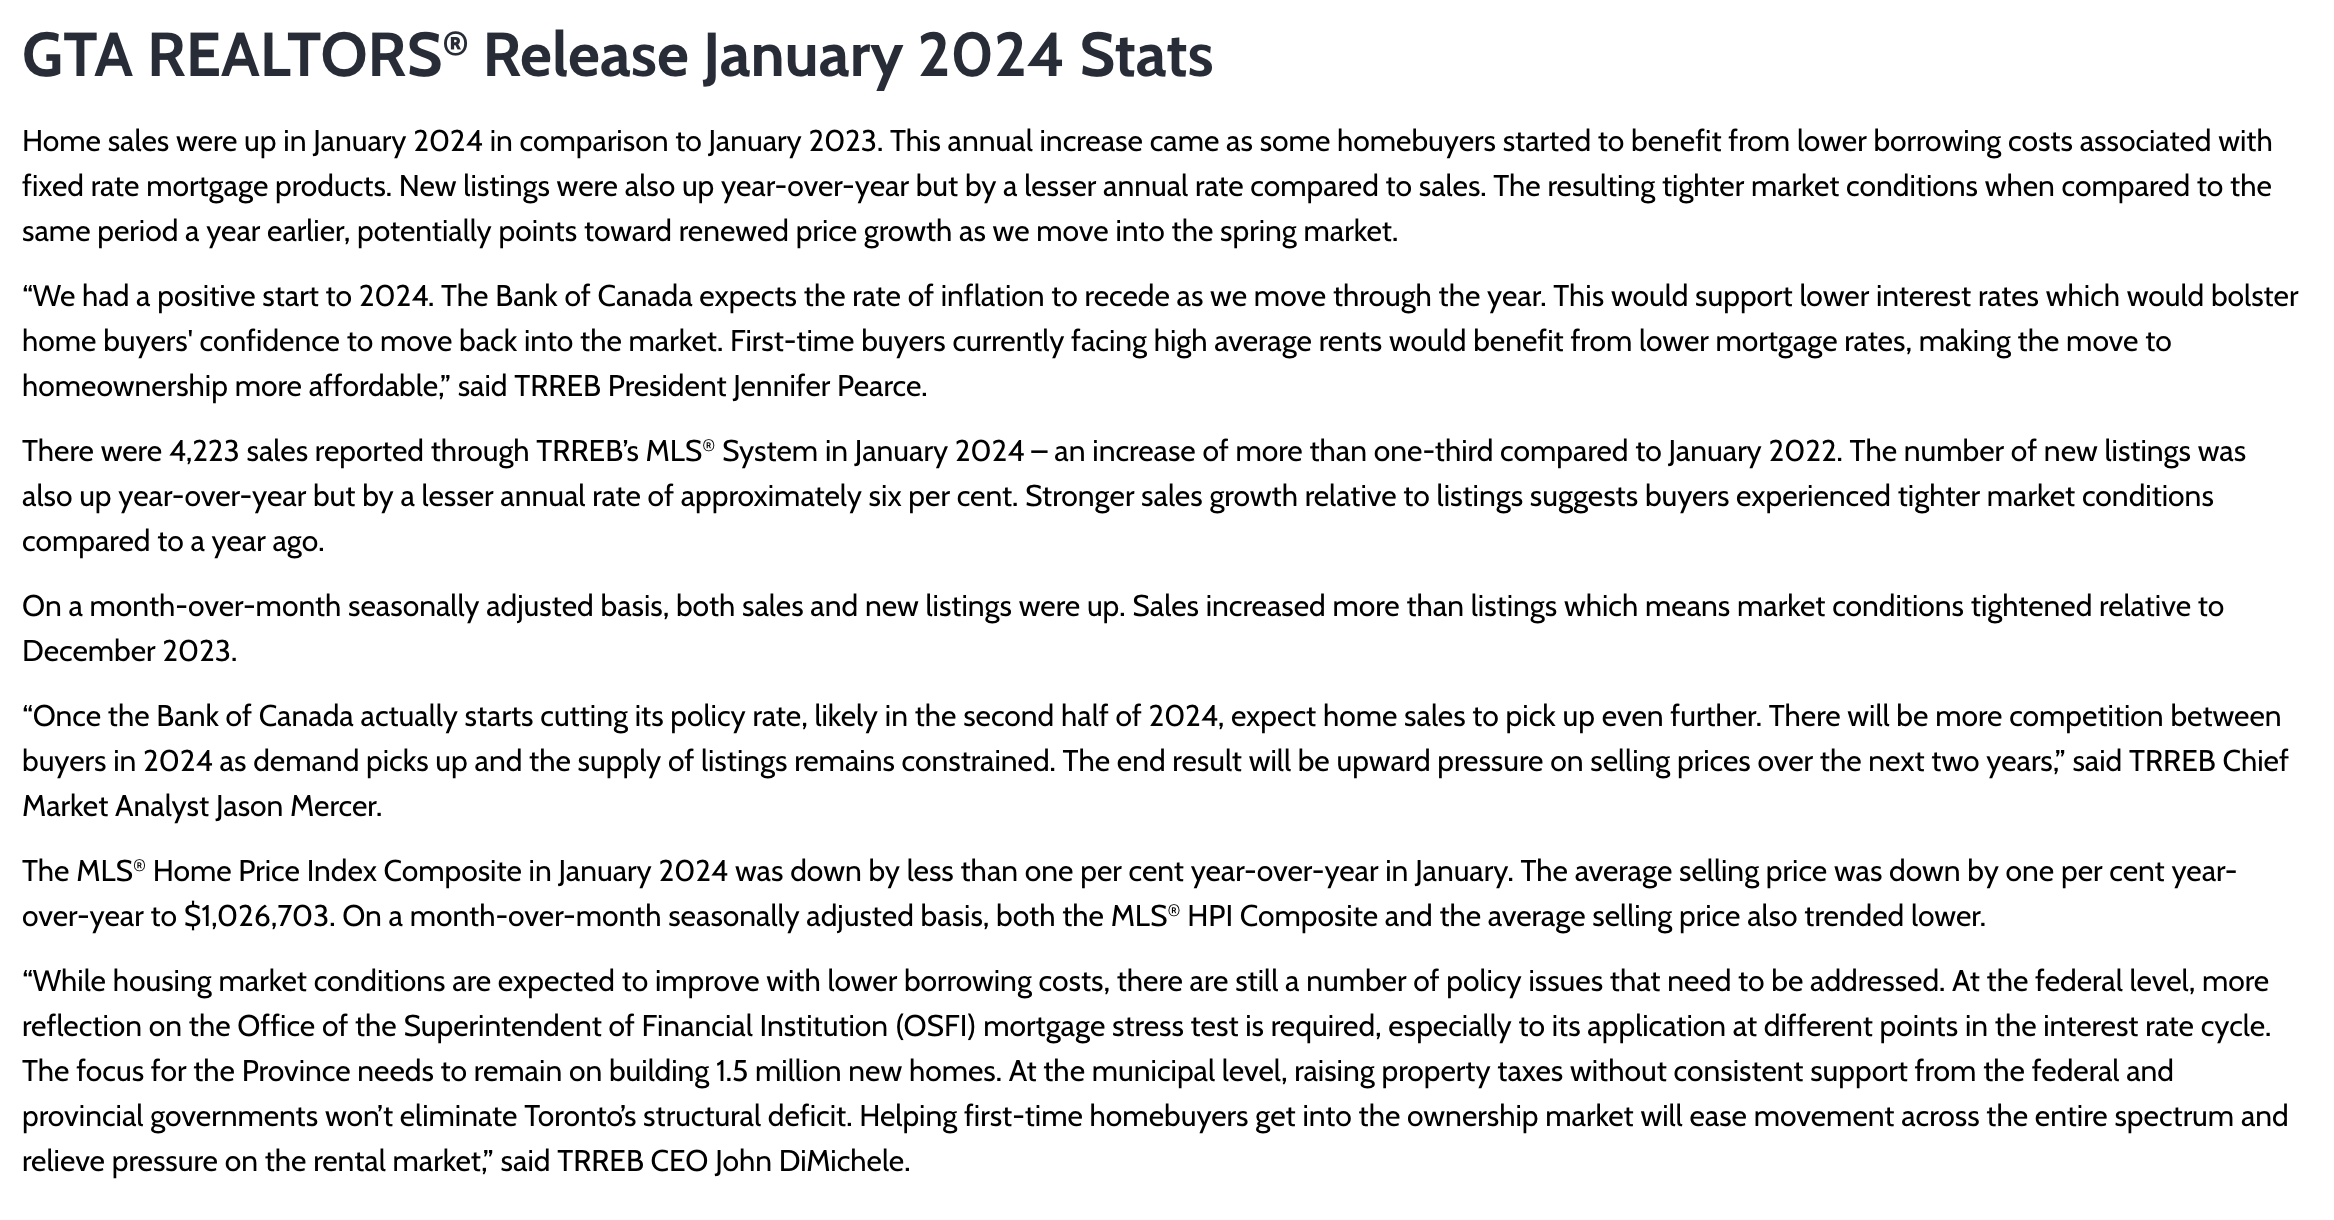
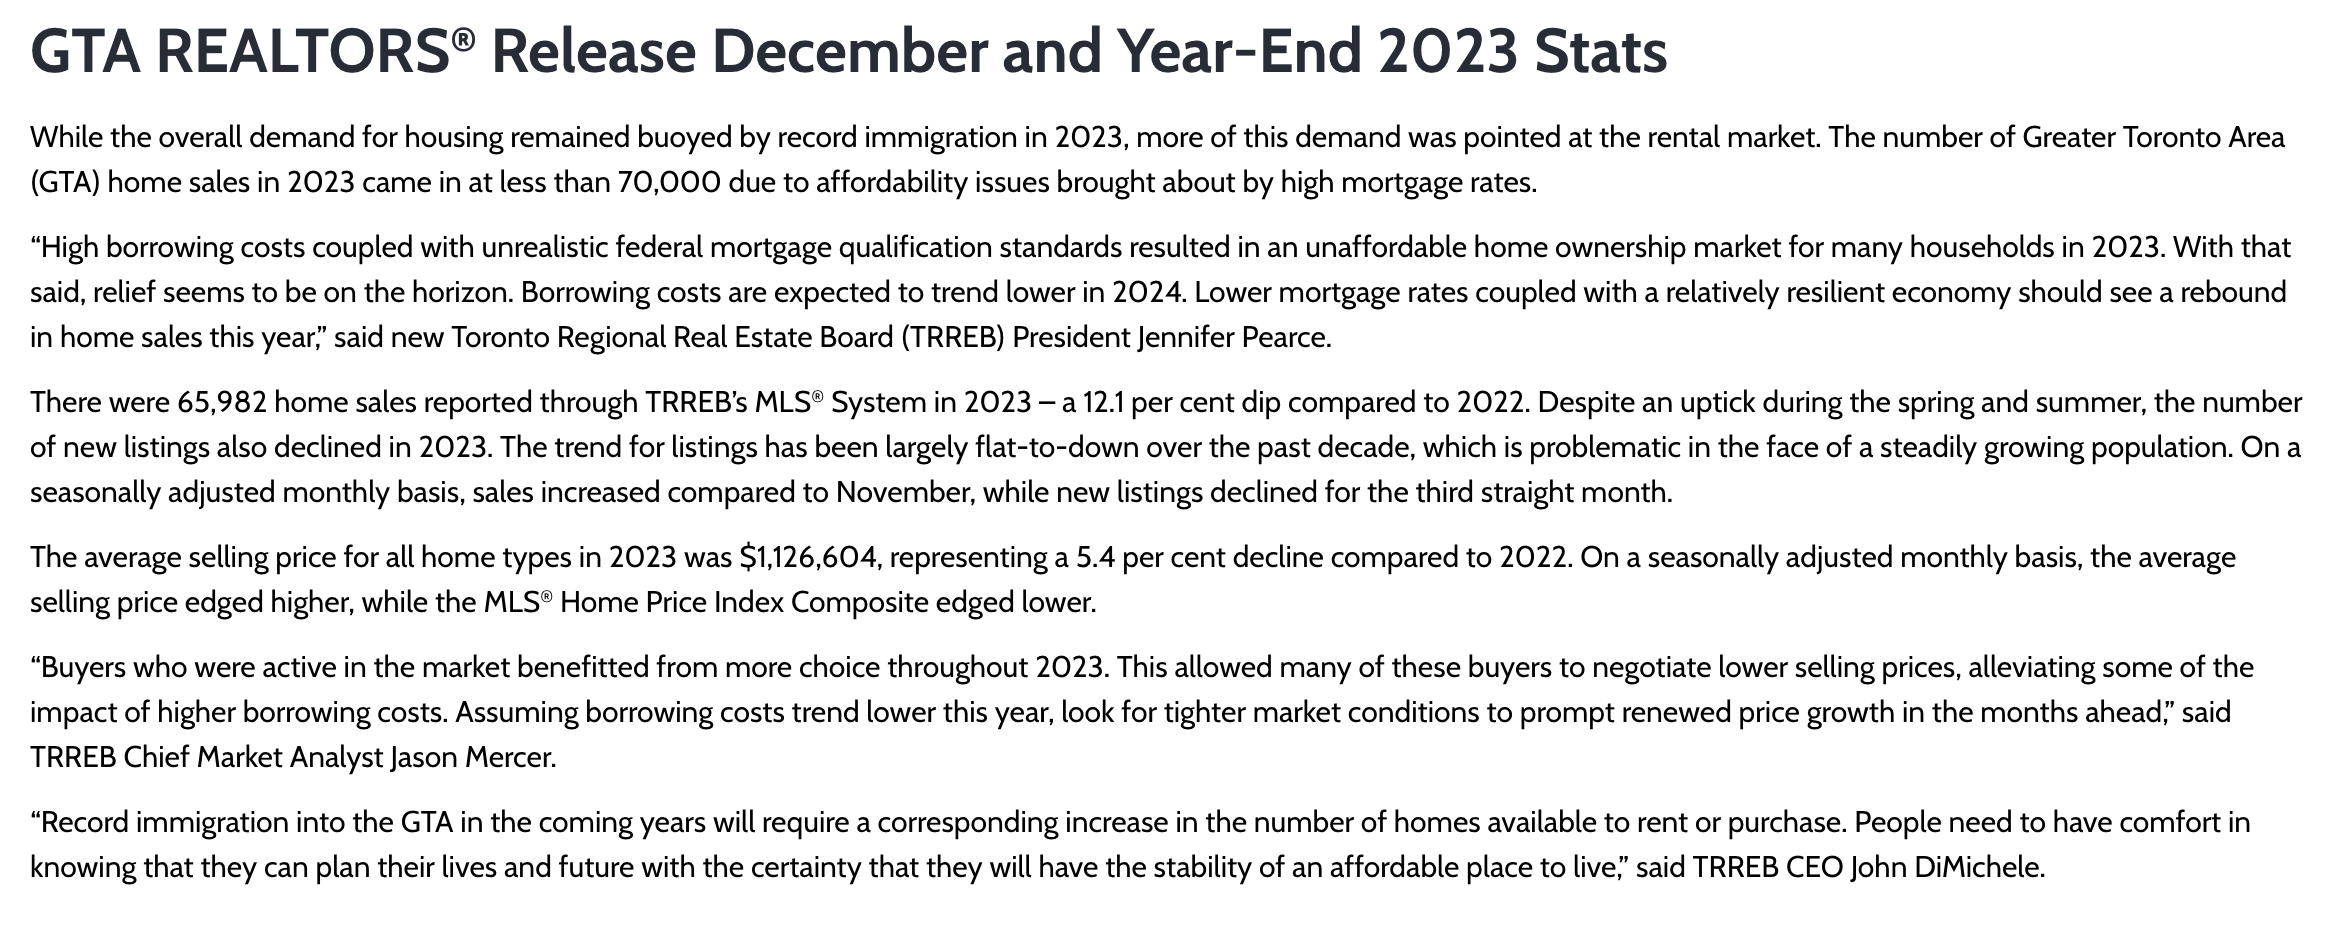
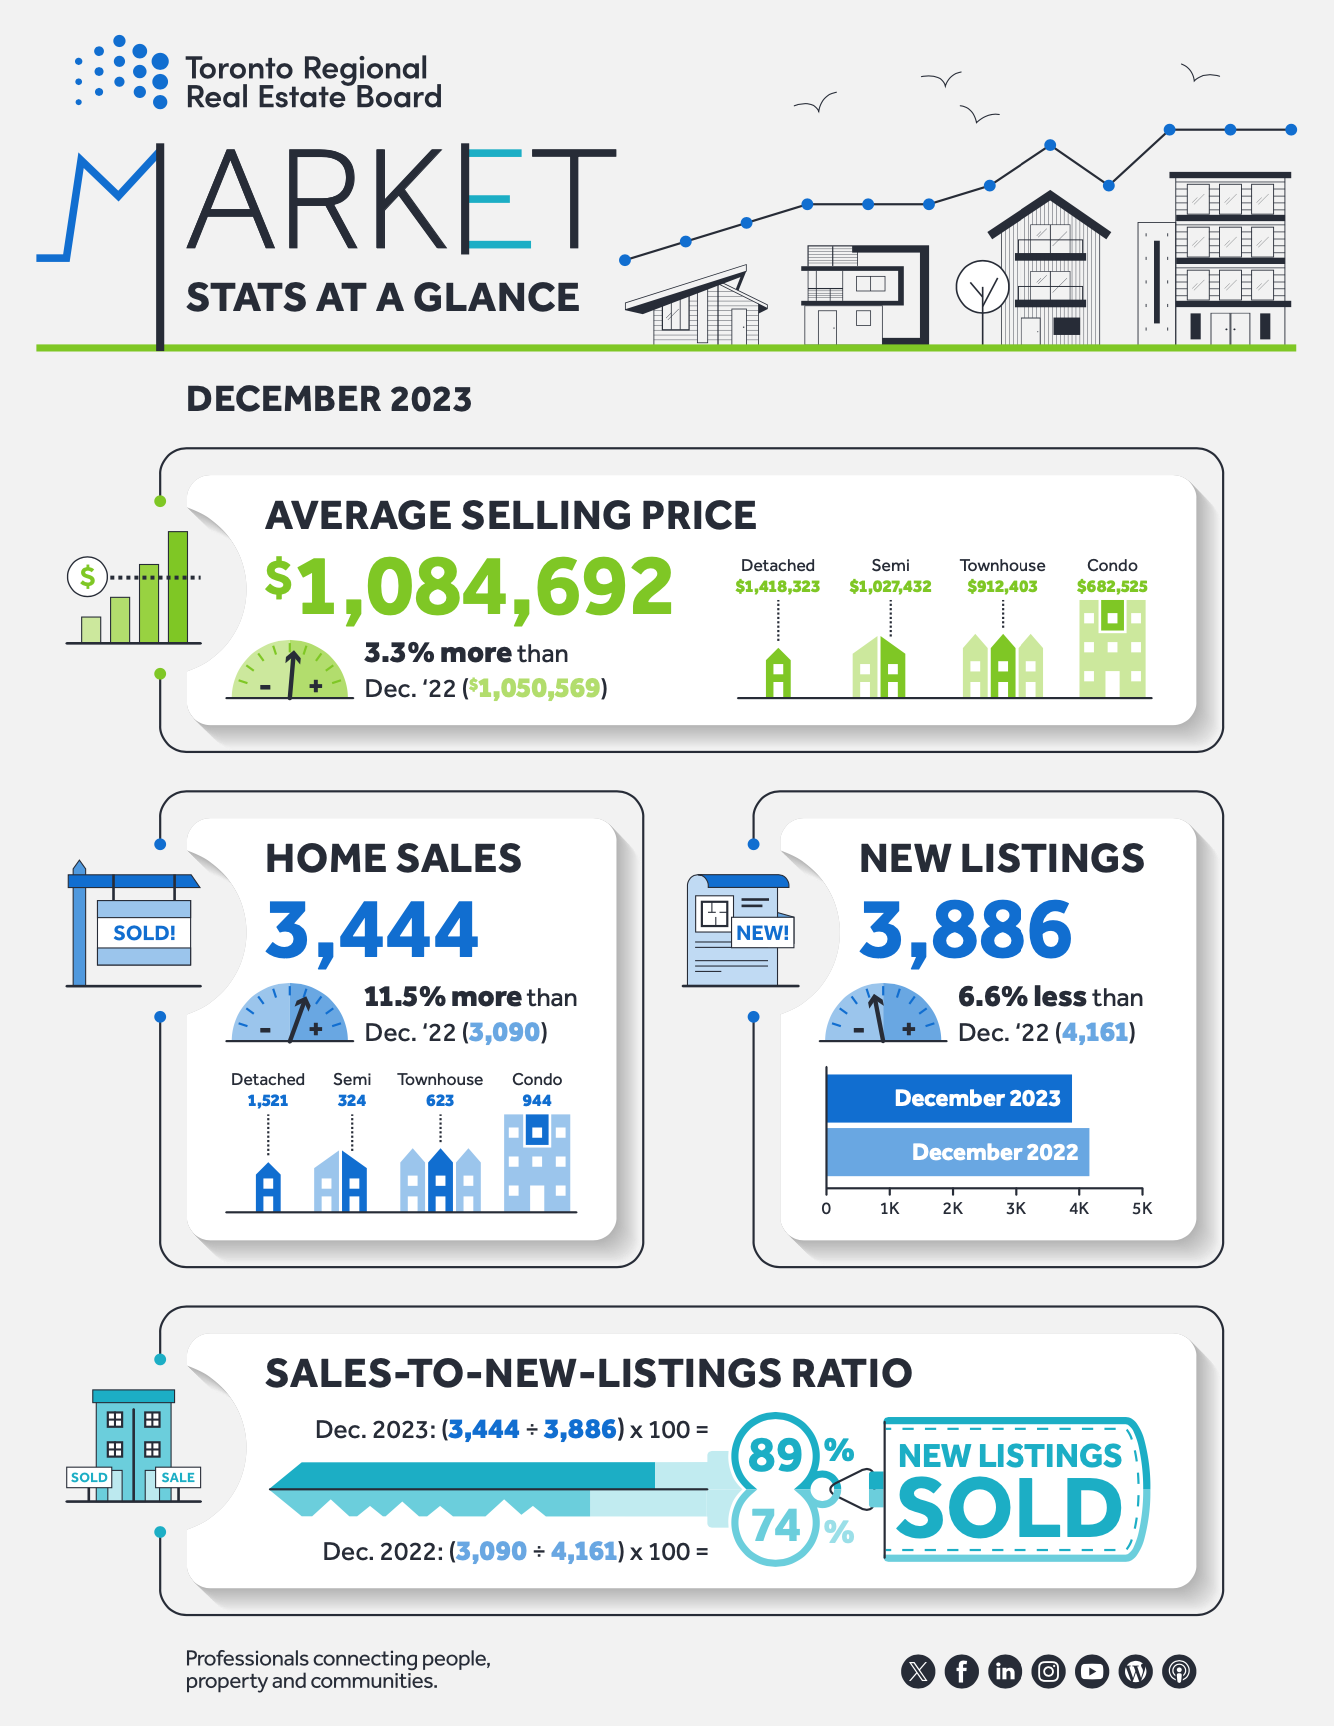
From Toronto Regional Real Estate Board
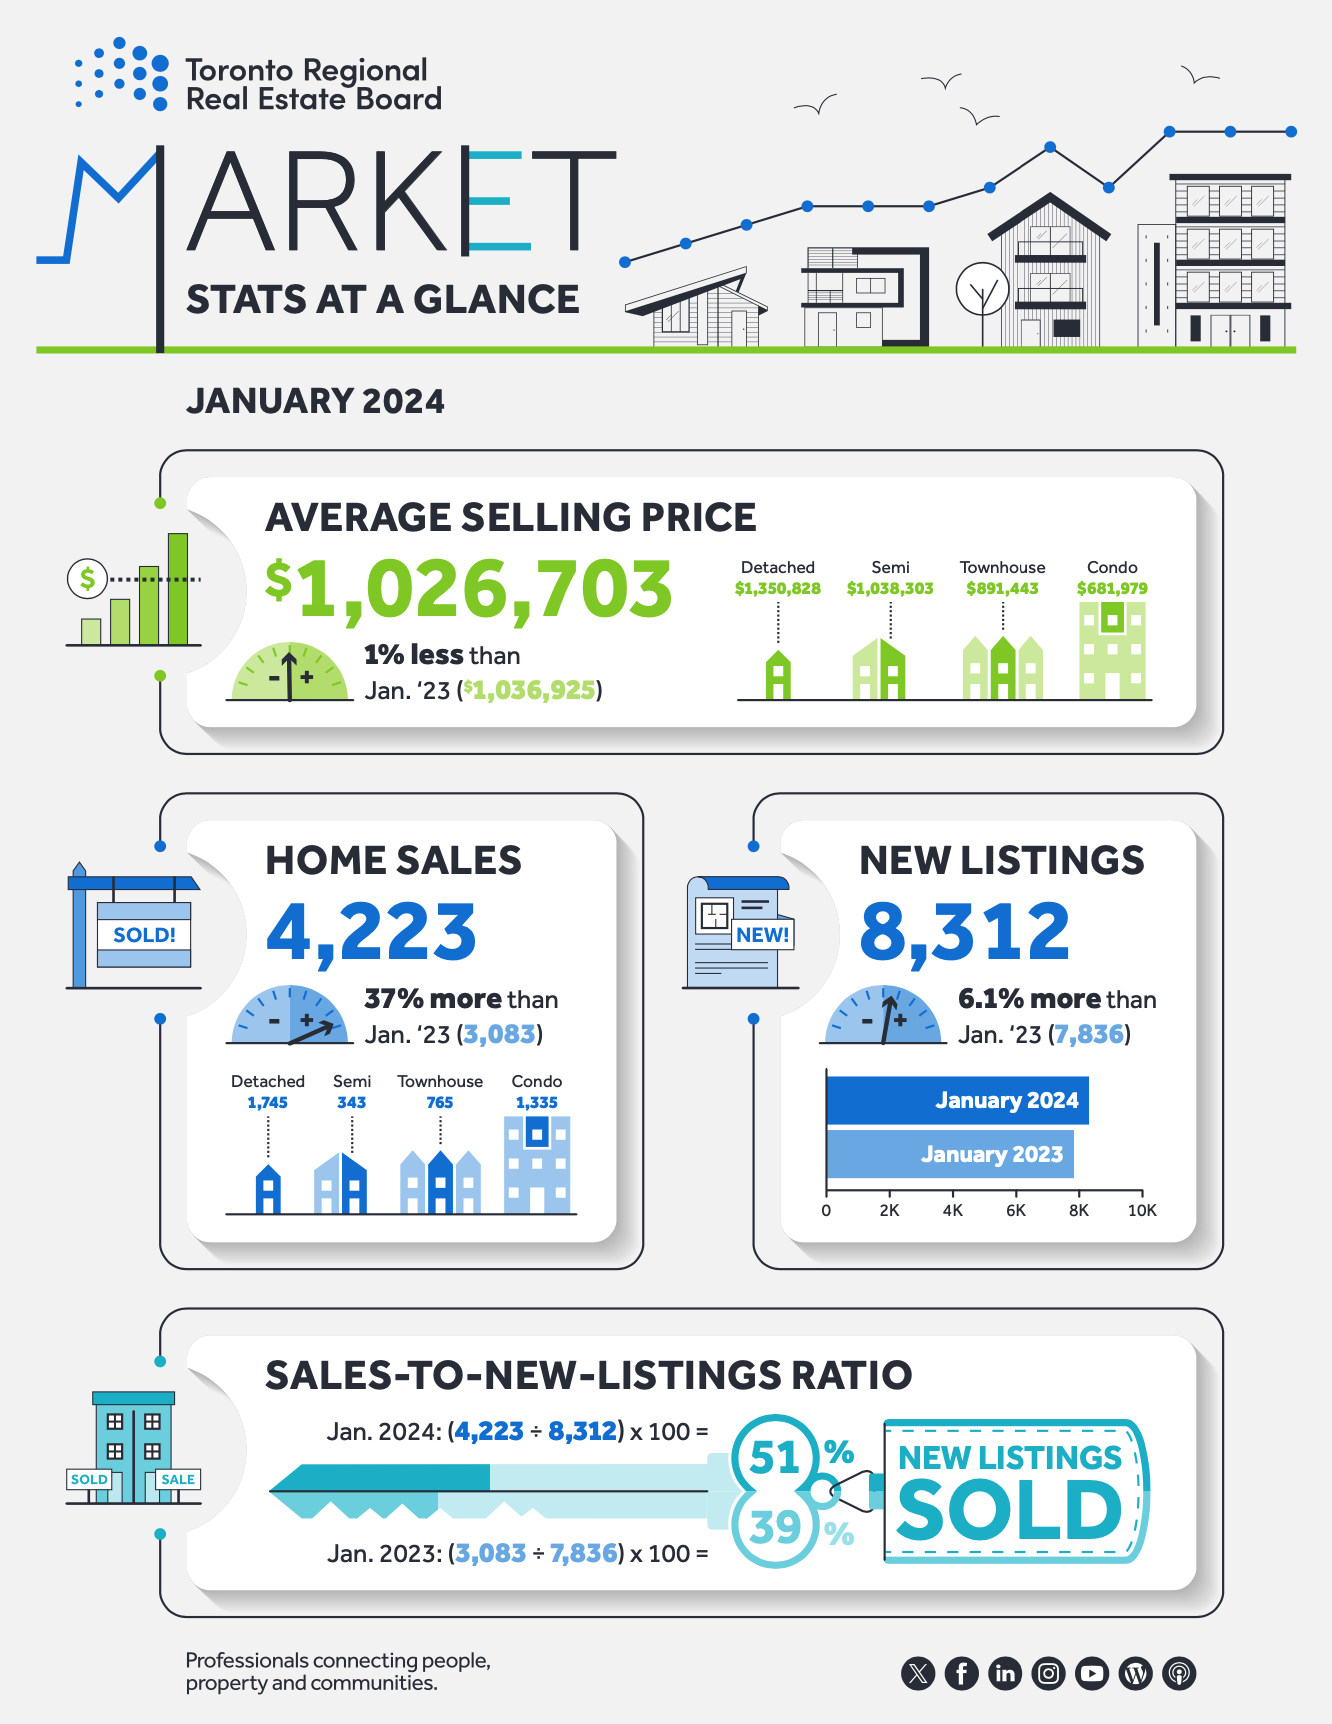
Toronto Regional Real Estate Board – Market Stats At A Glance – January 2024
Read the Toronto Regional Real Estate Board Market Watch Report
![]()
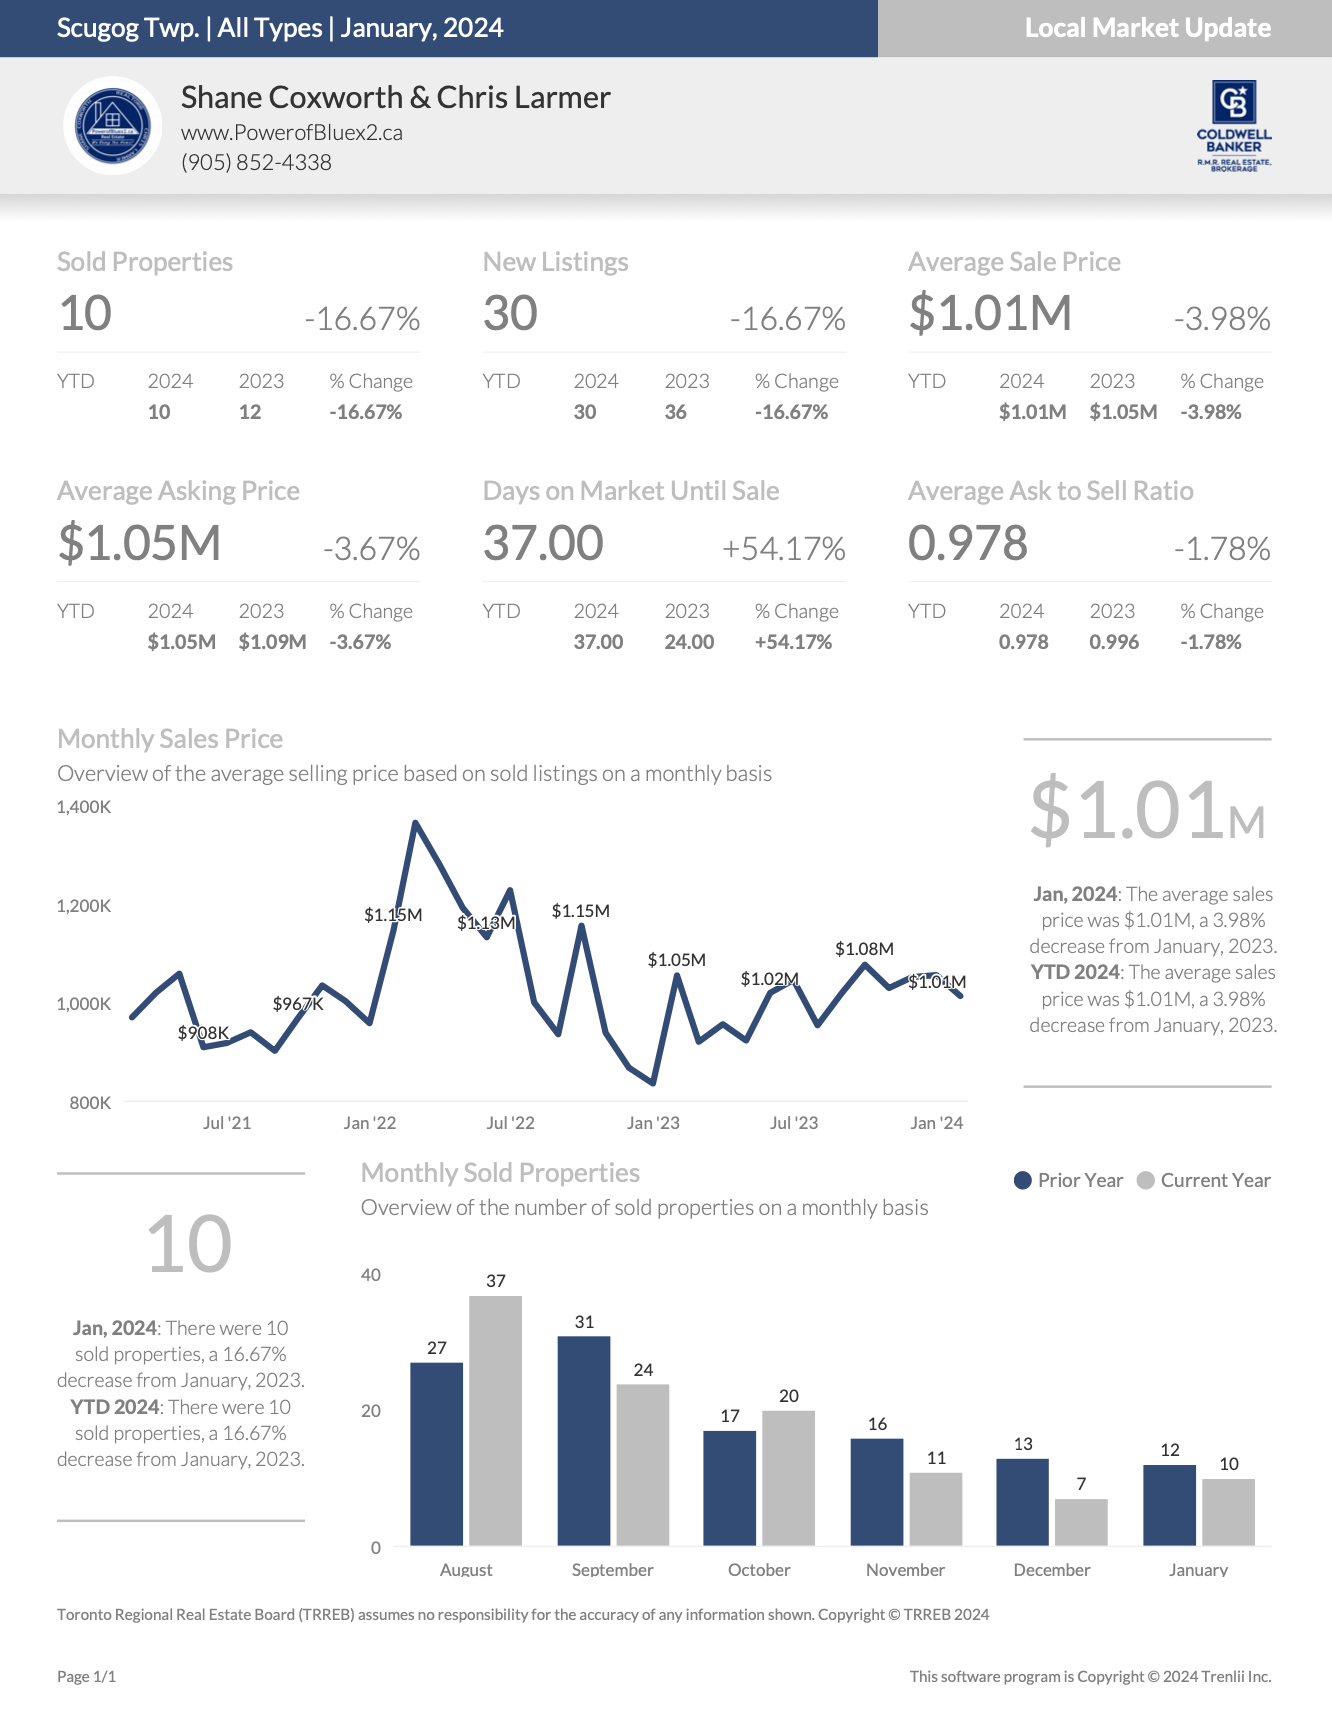
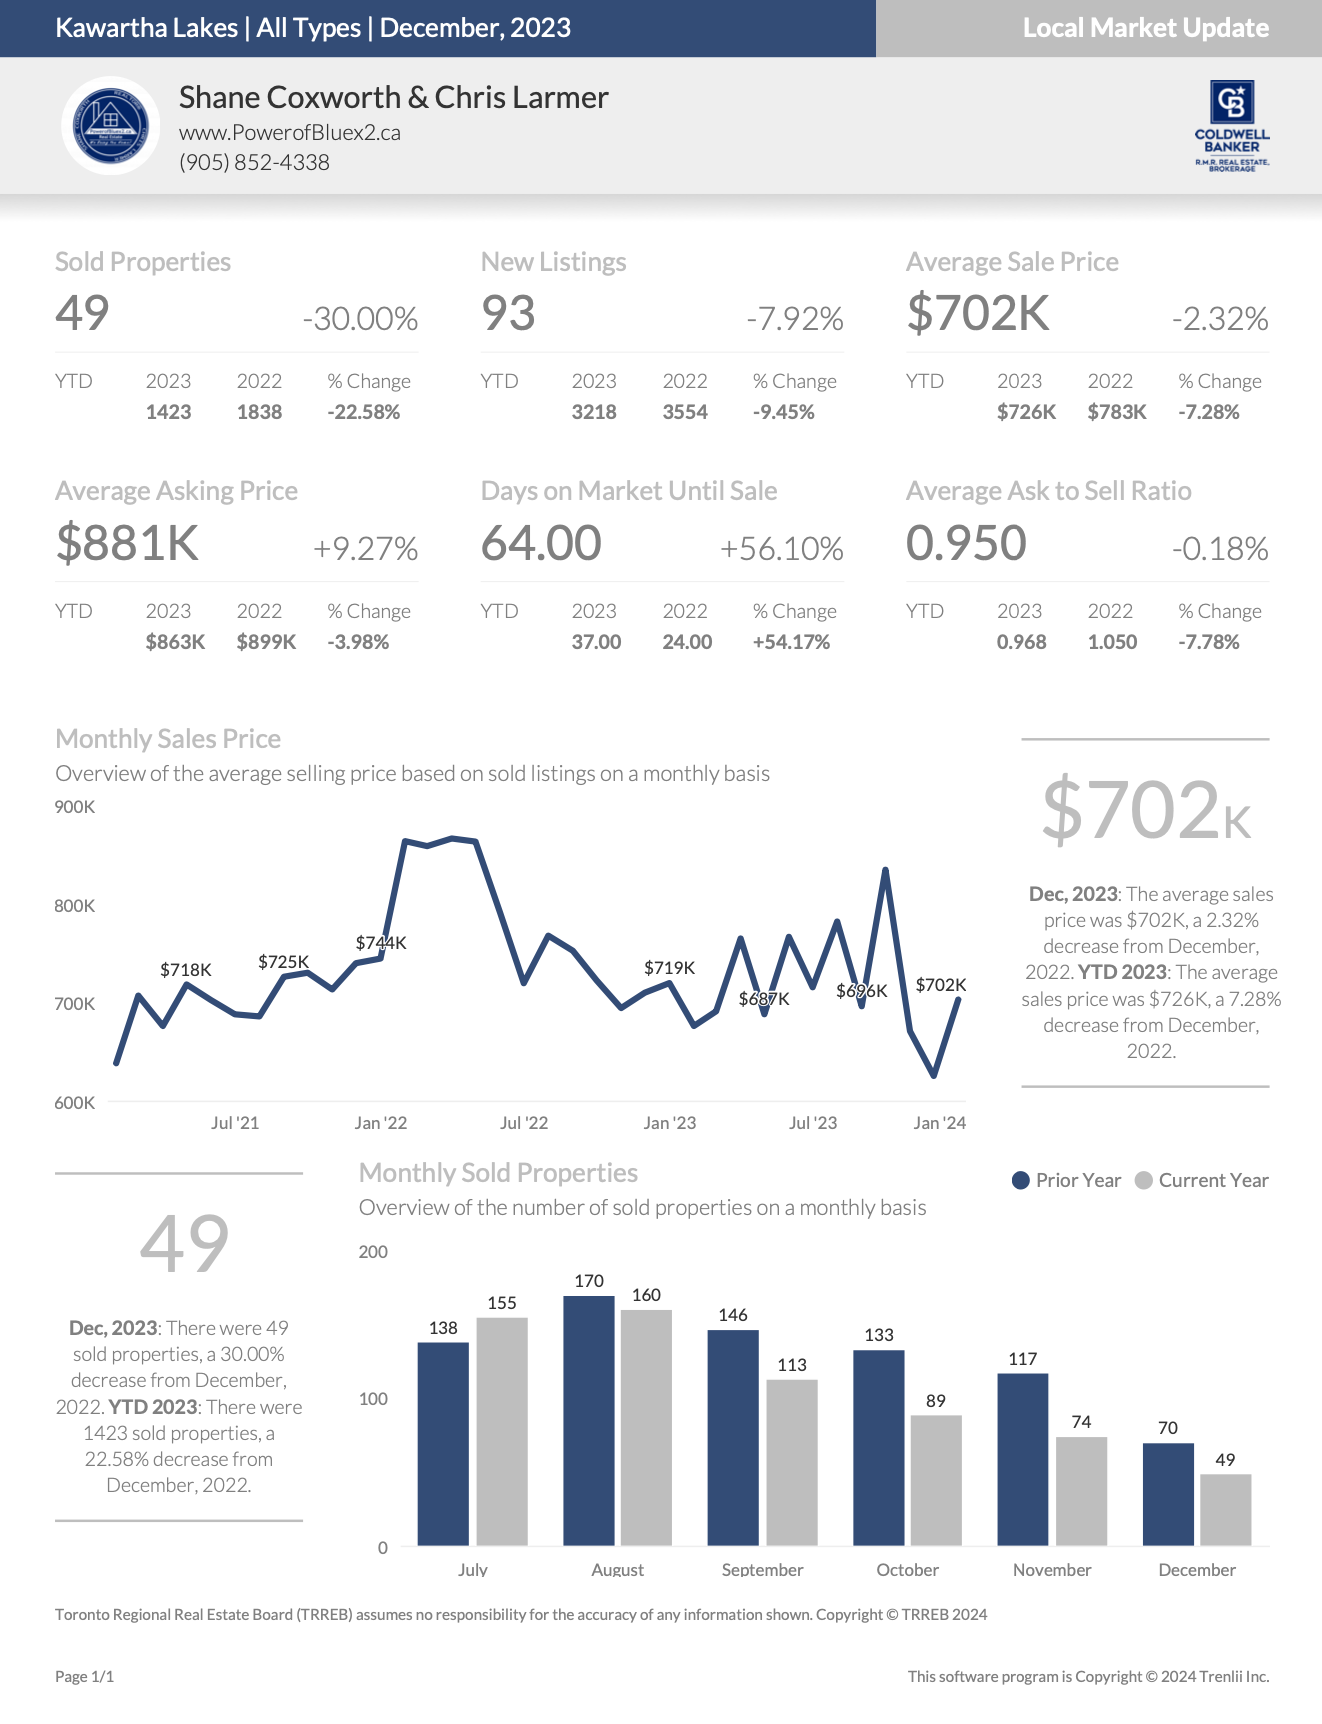
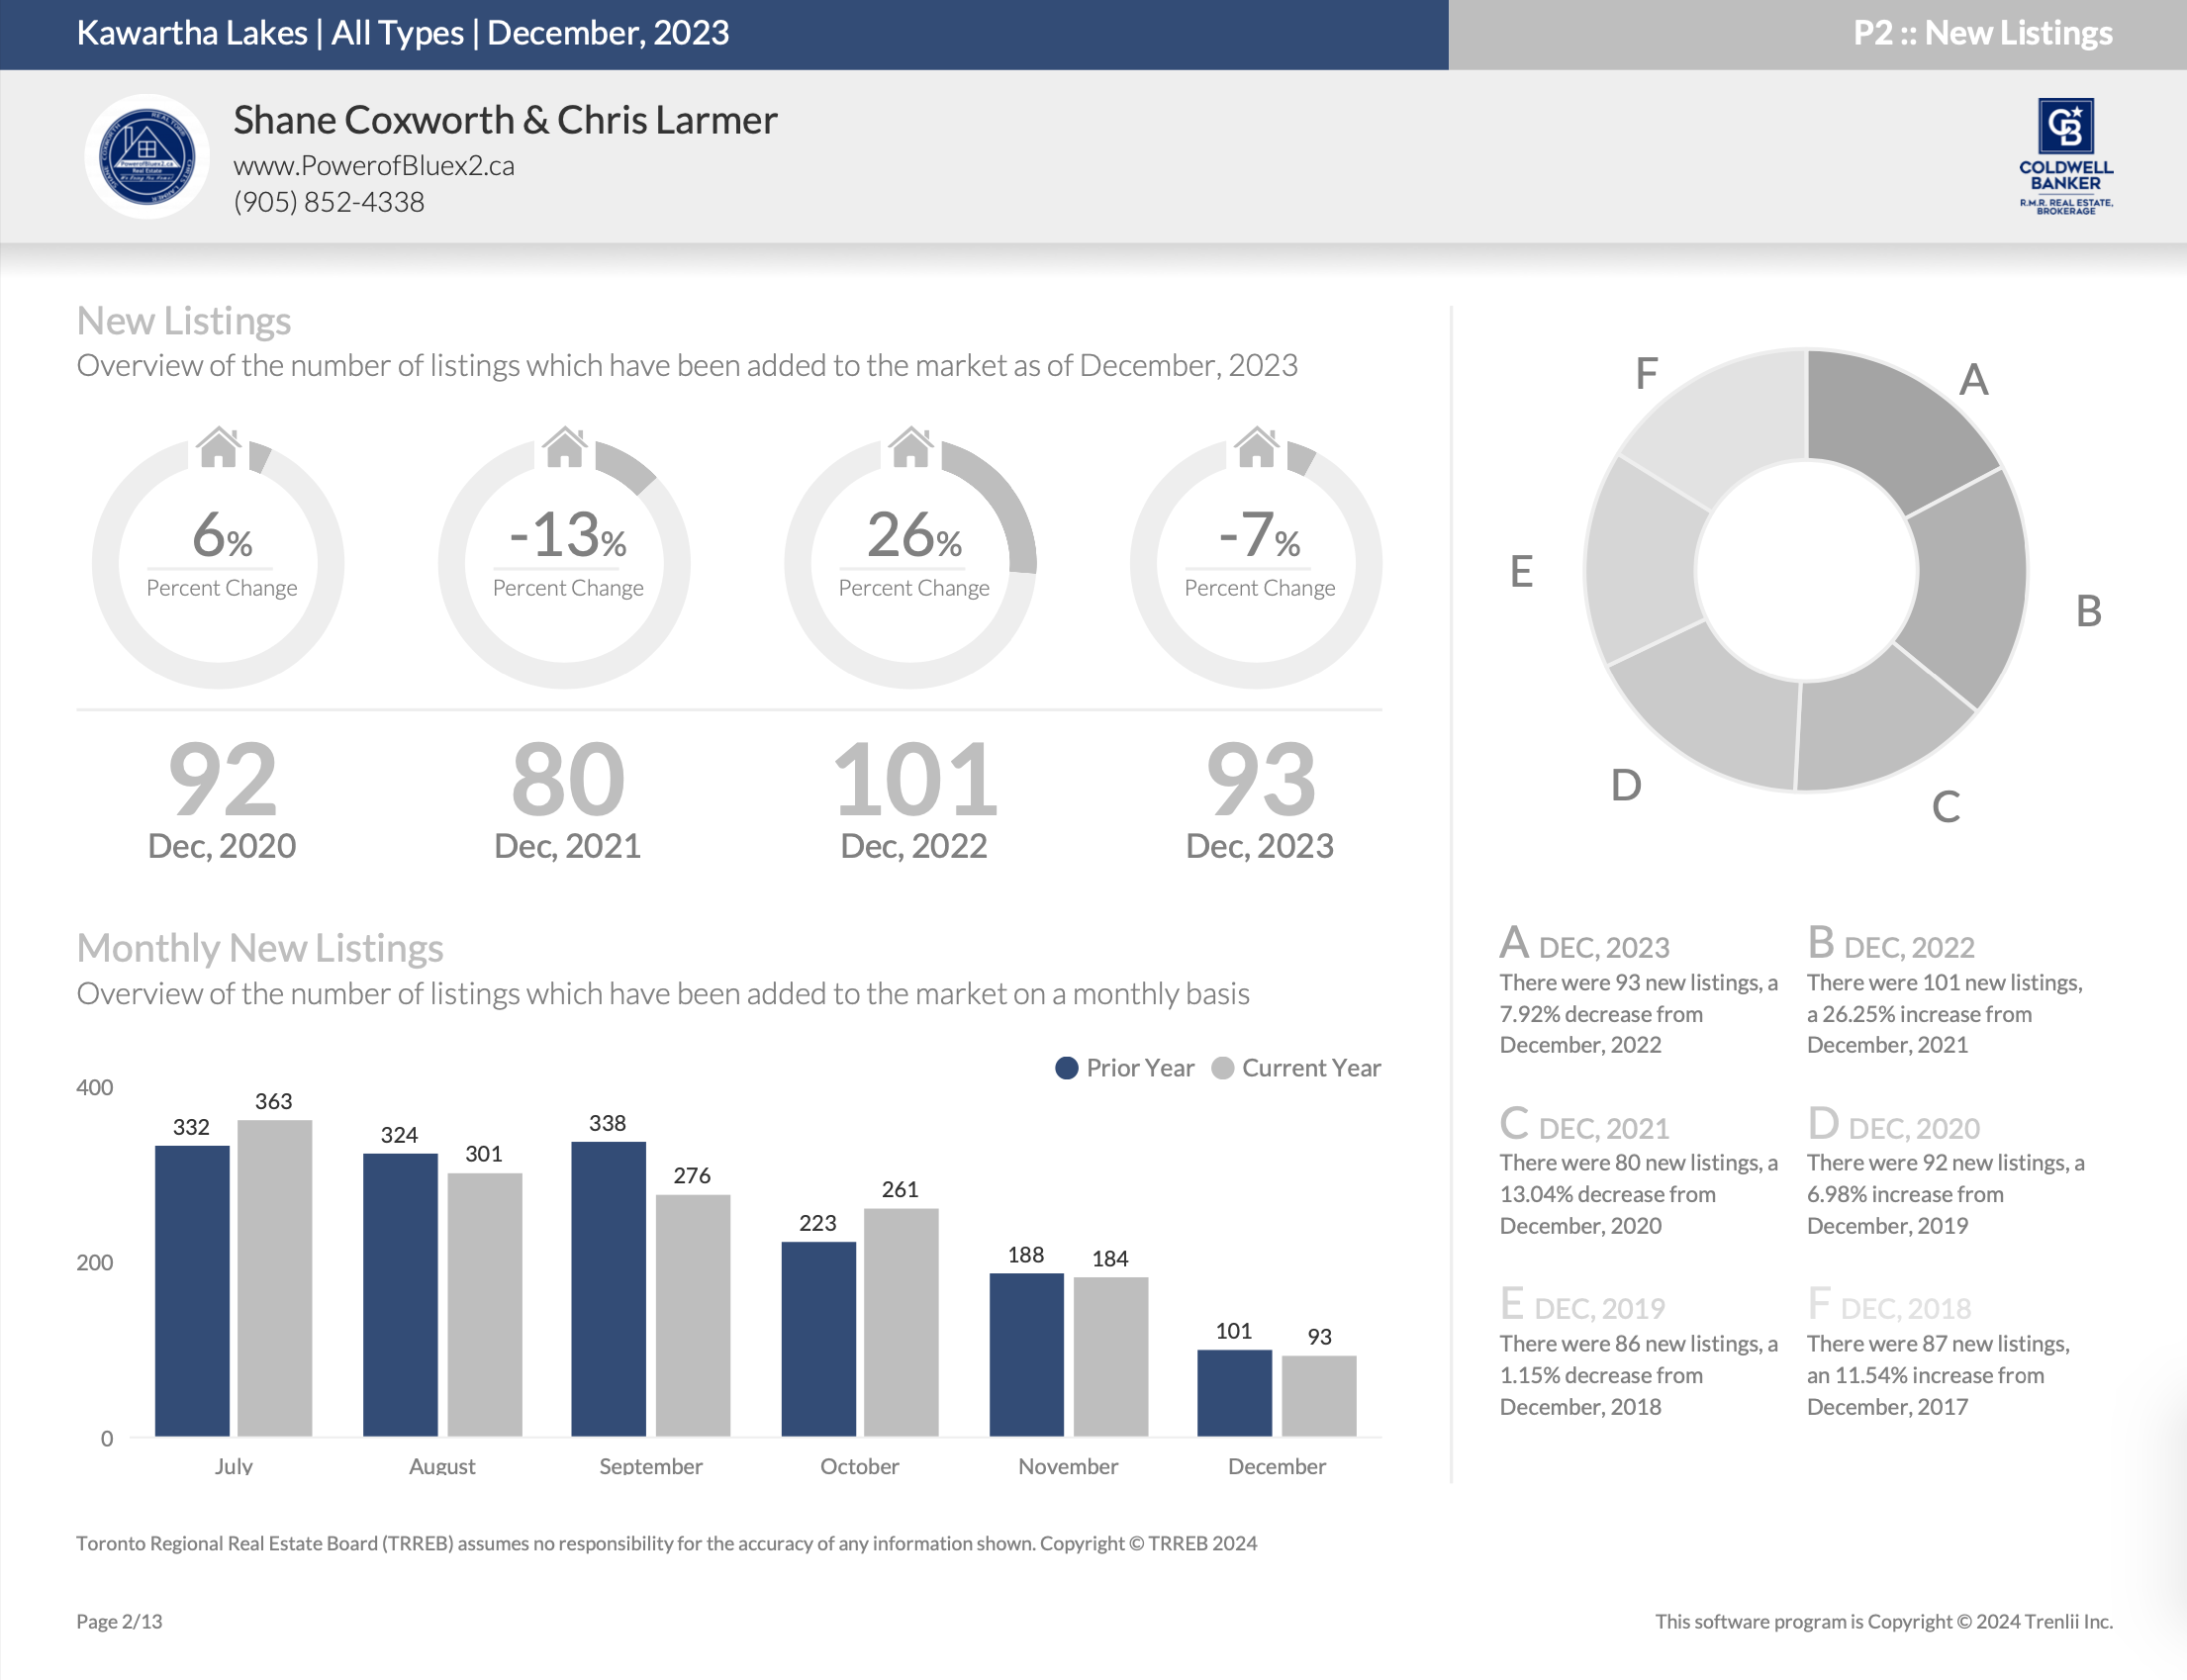
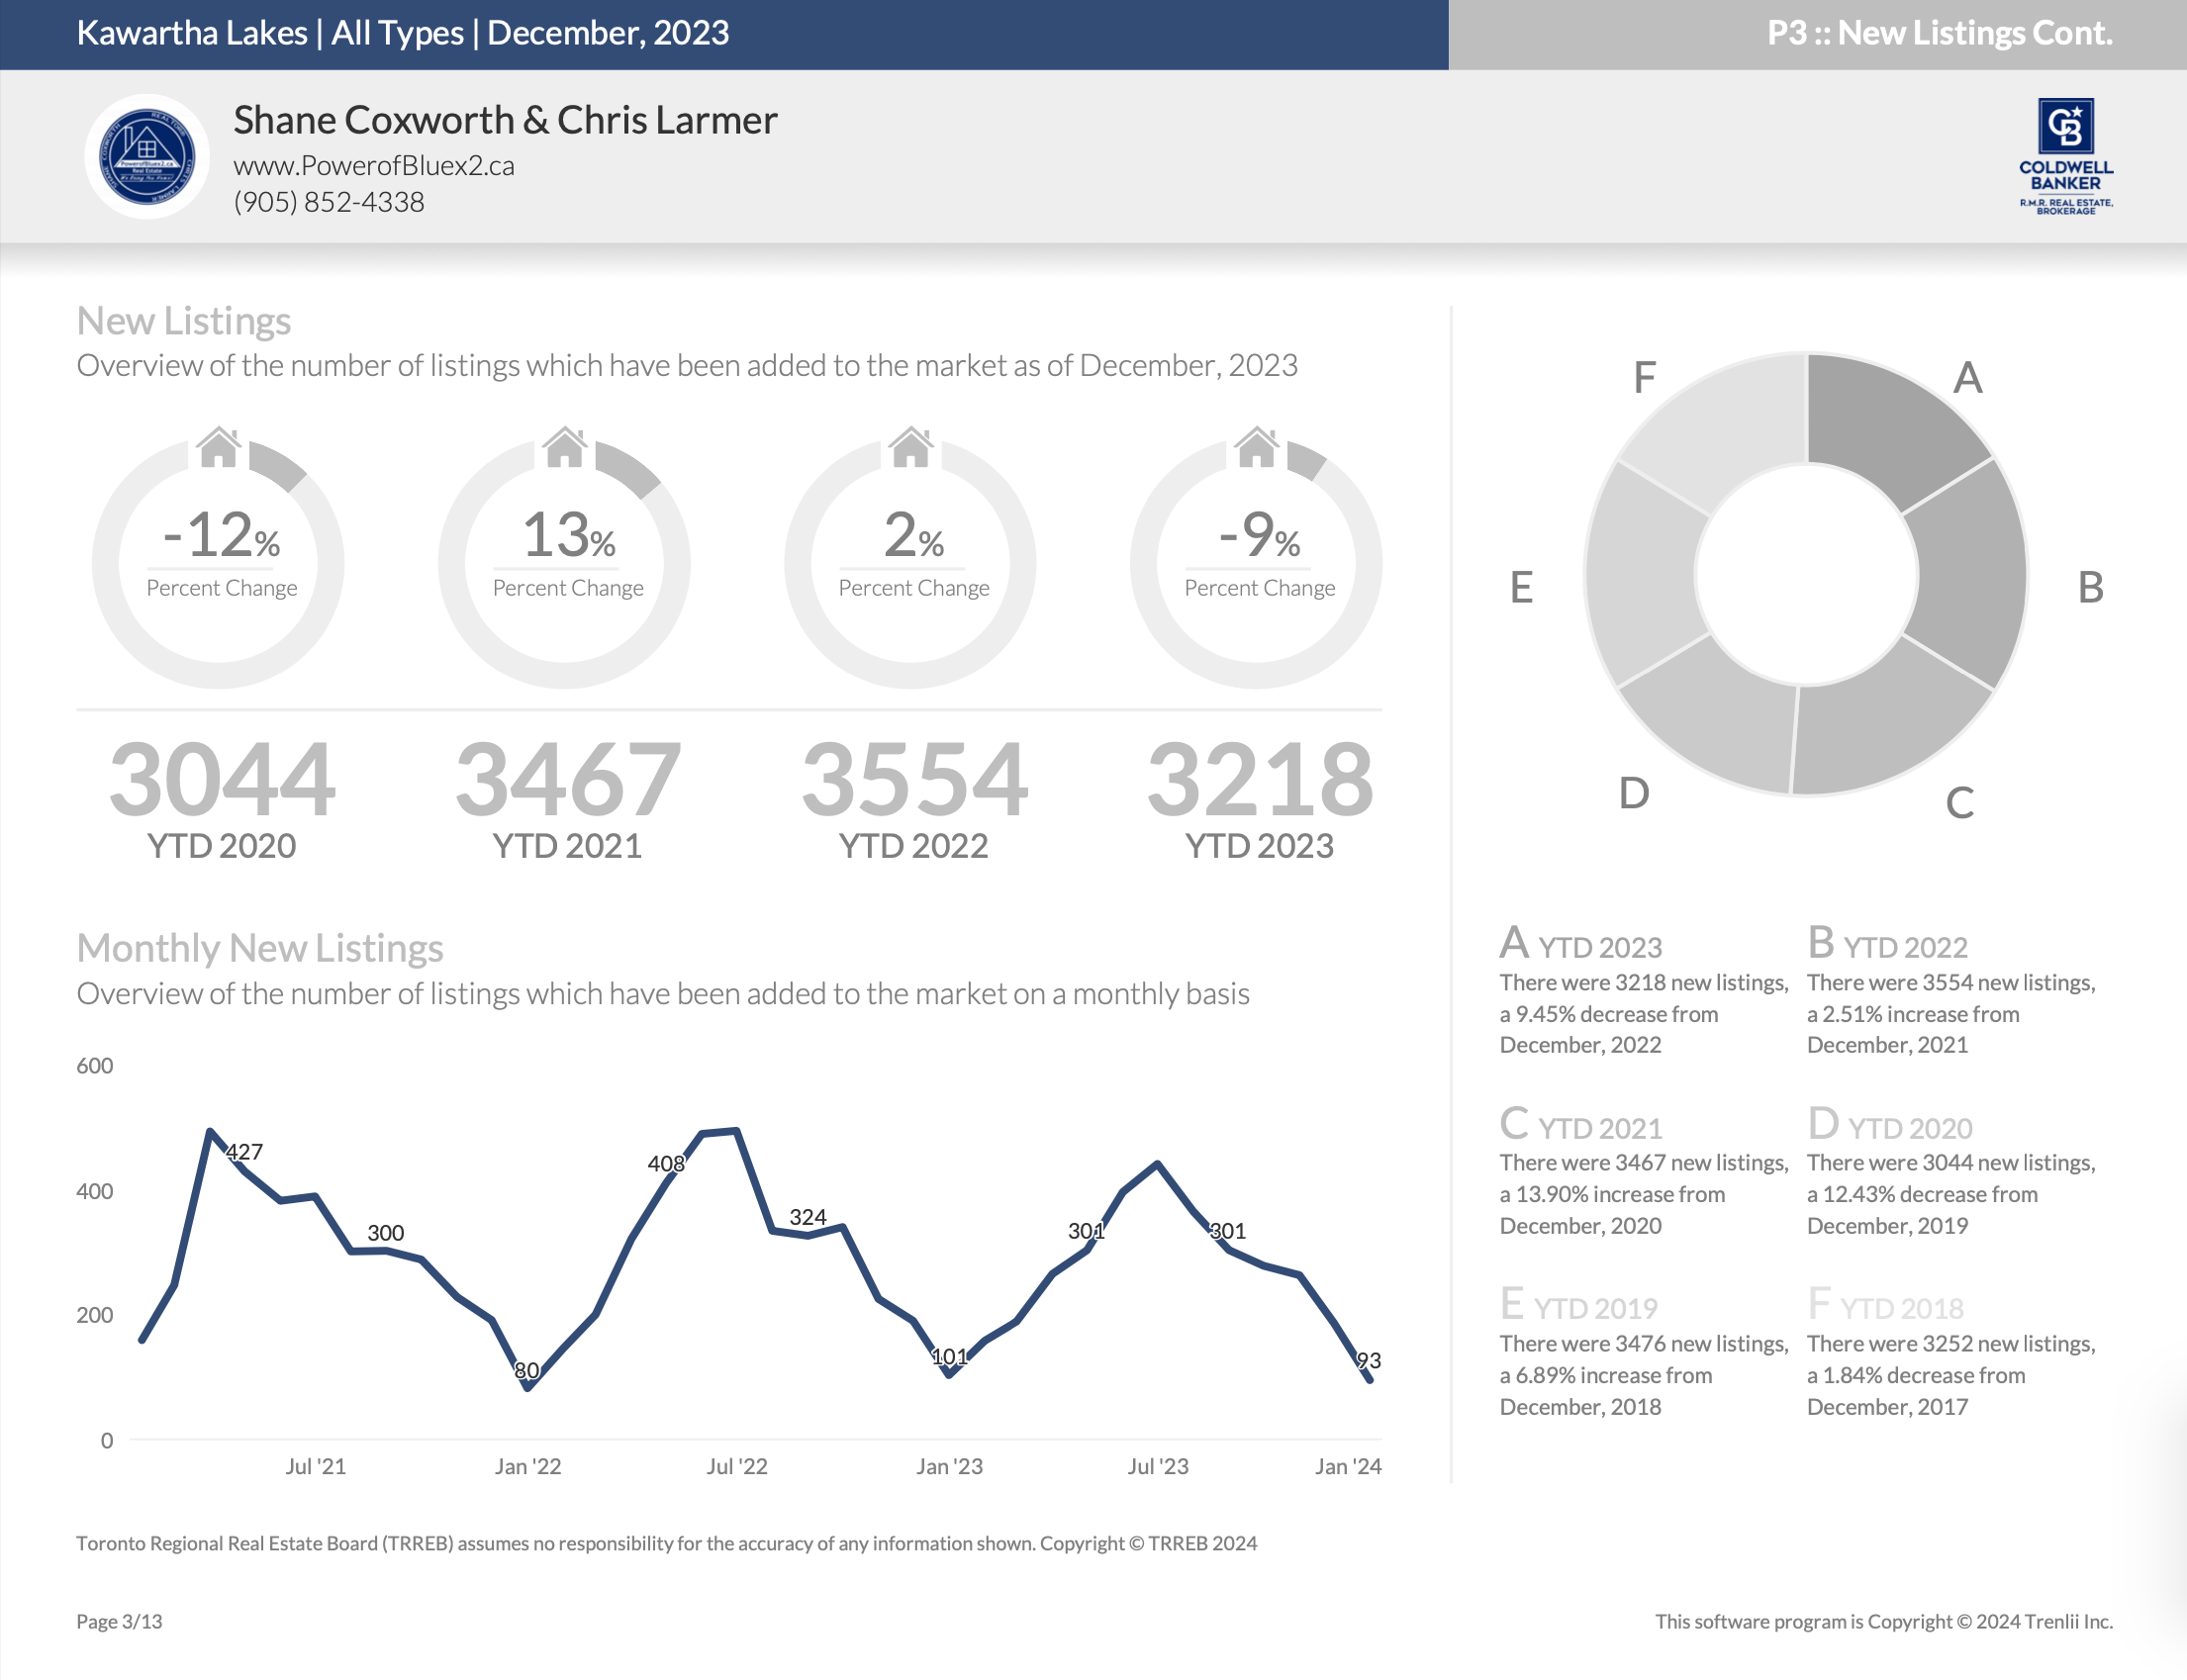
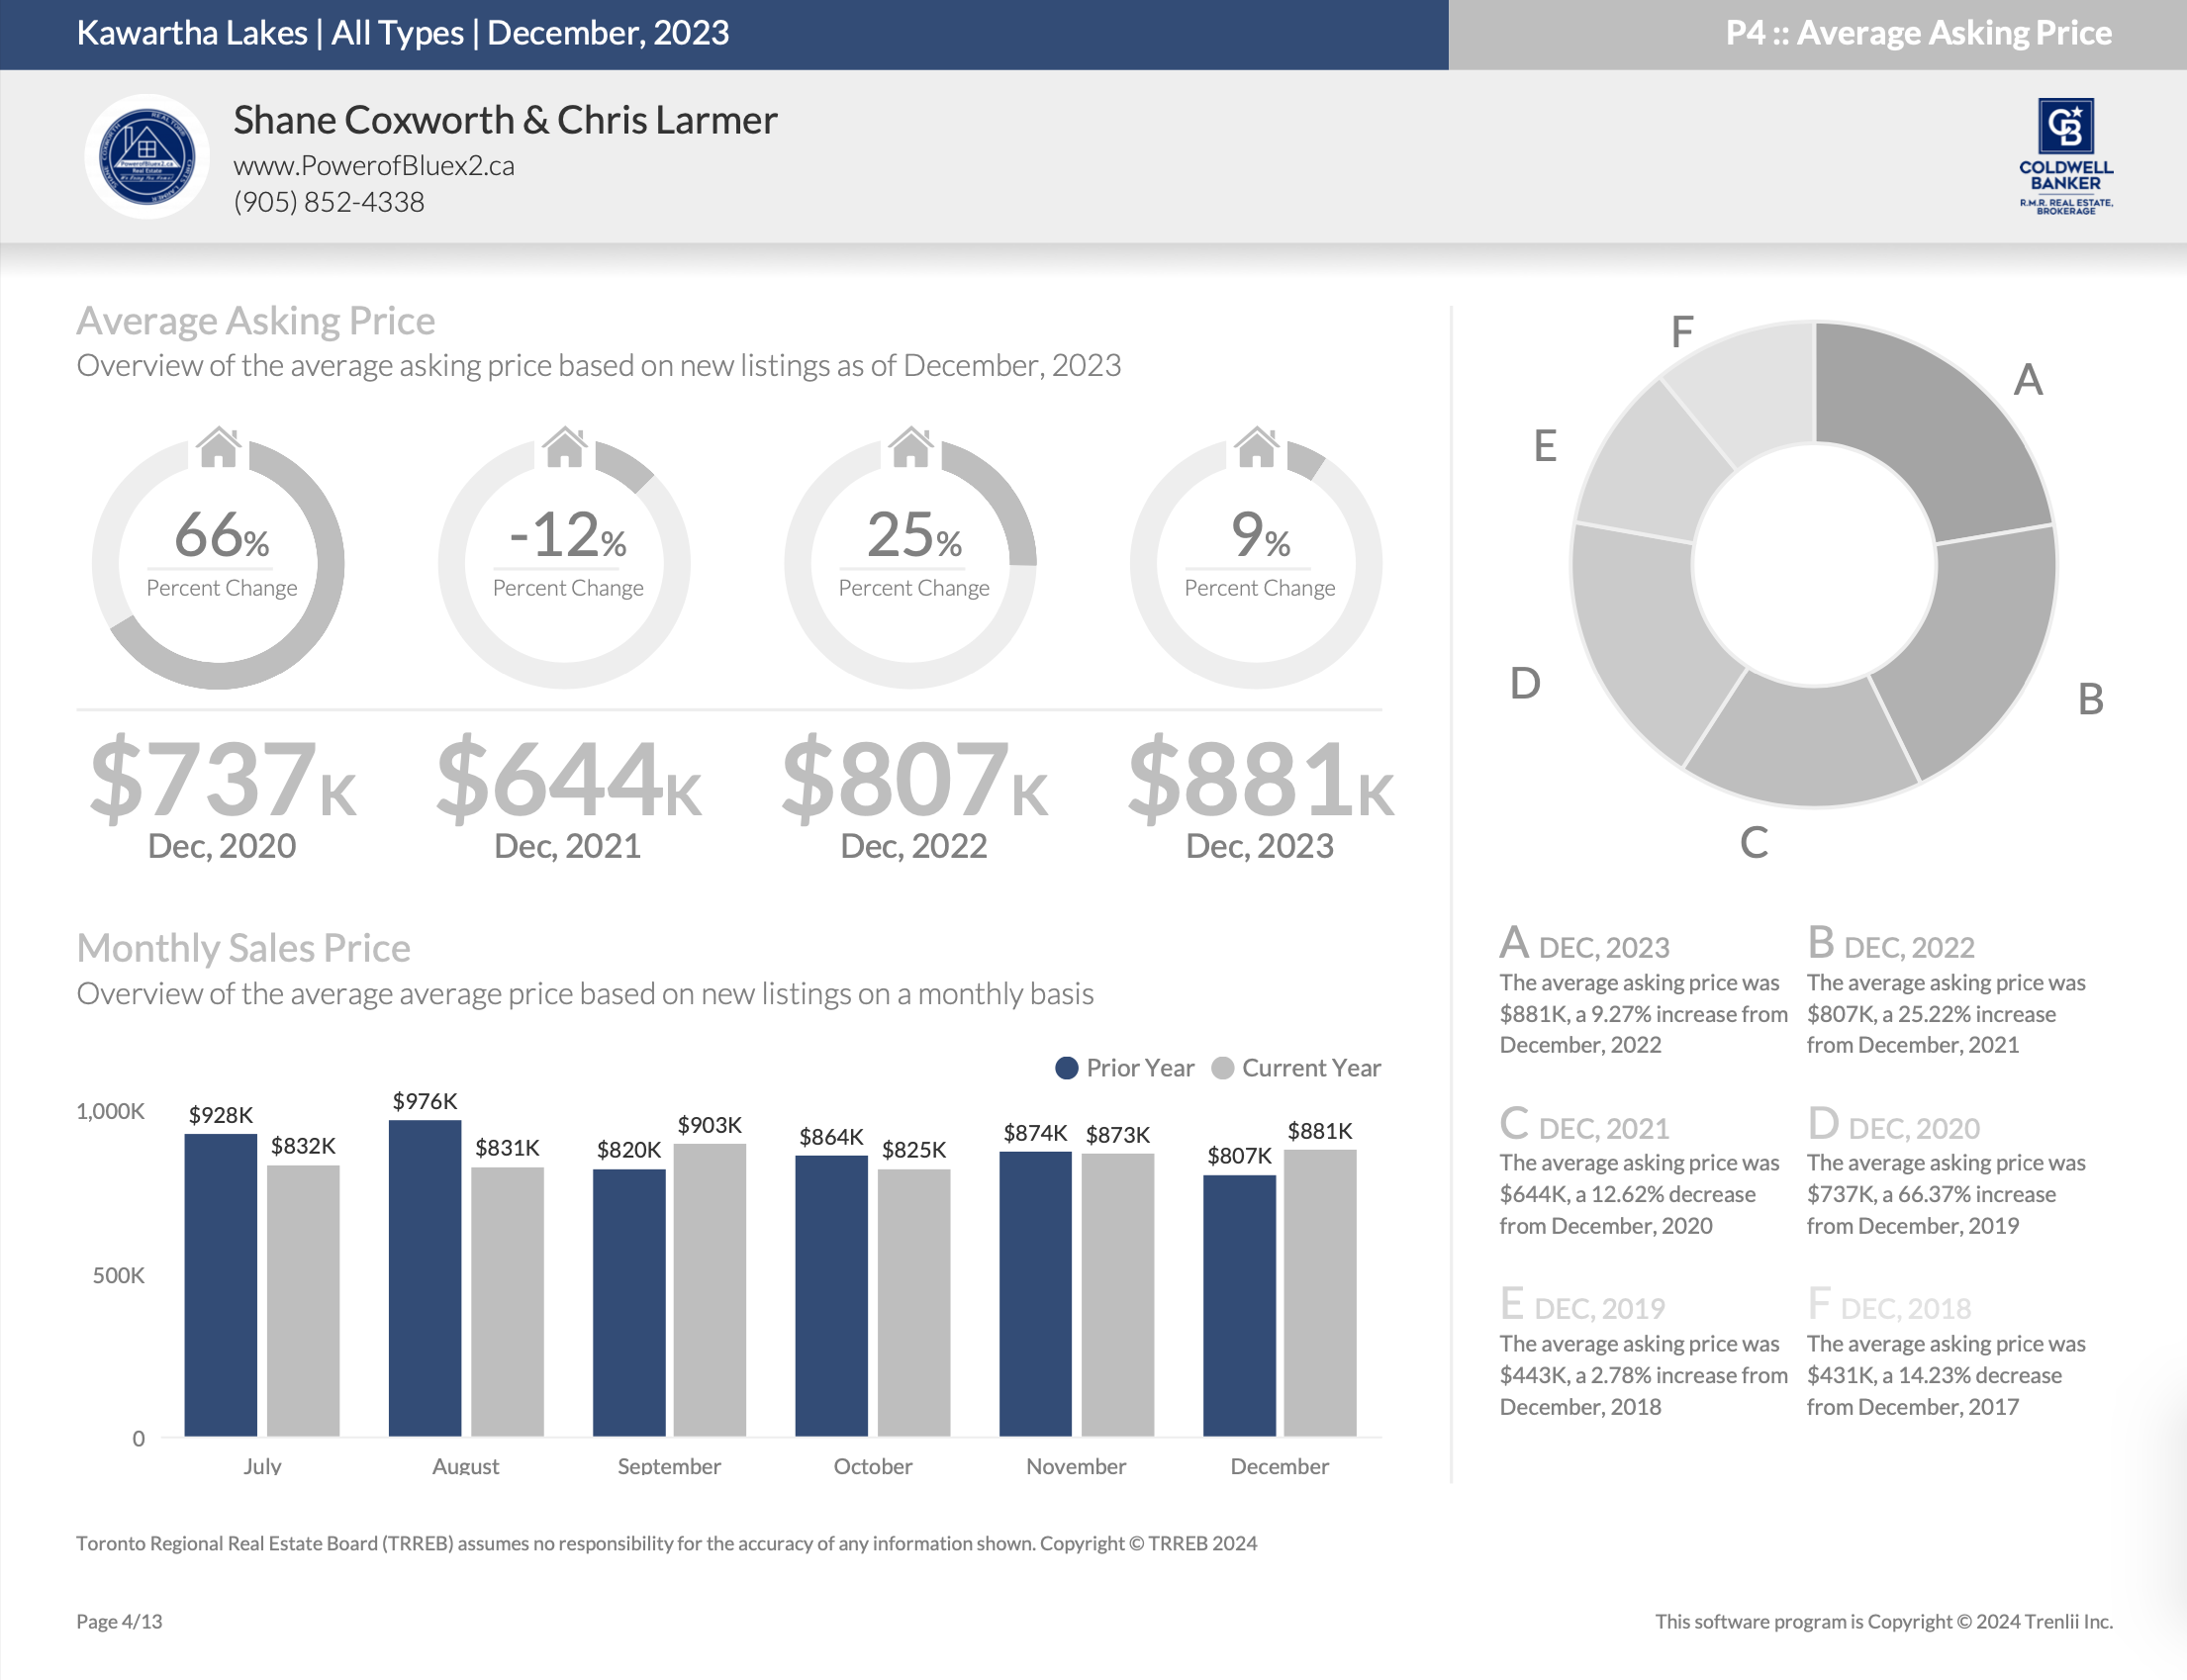
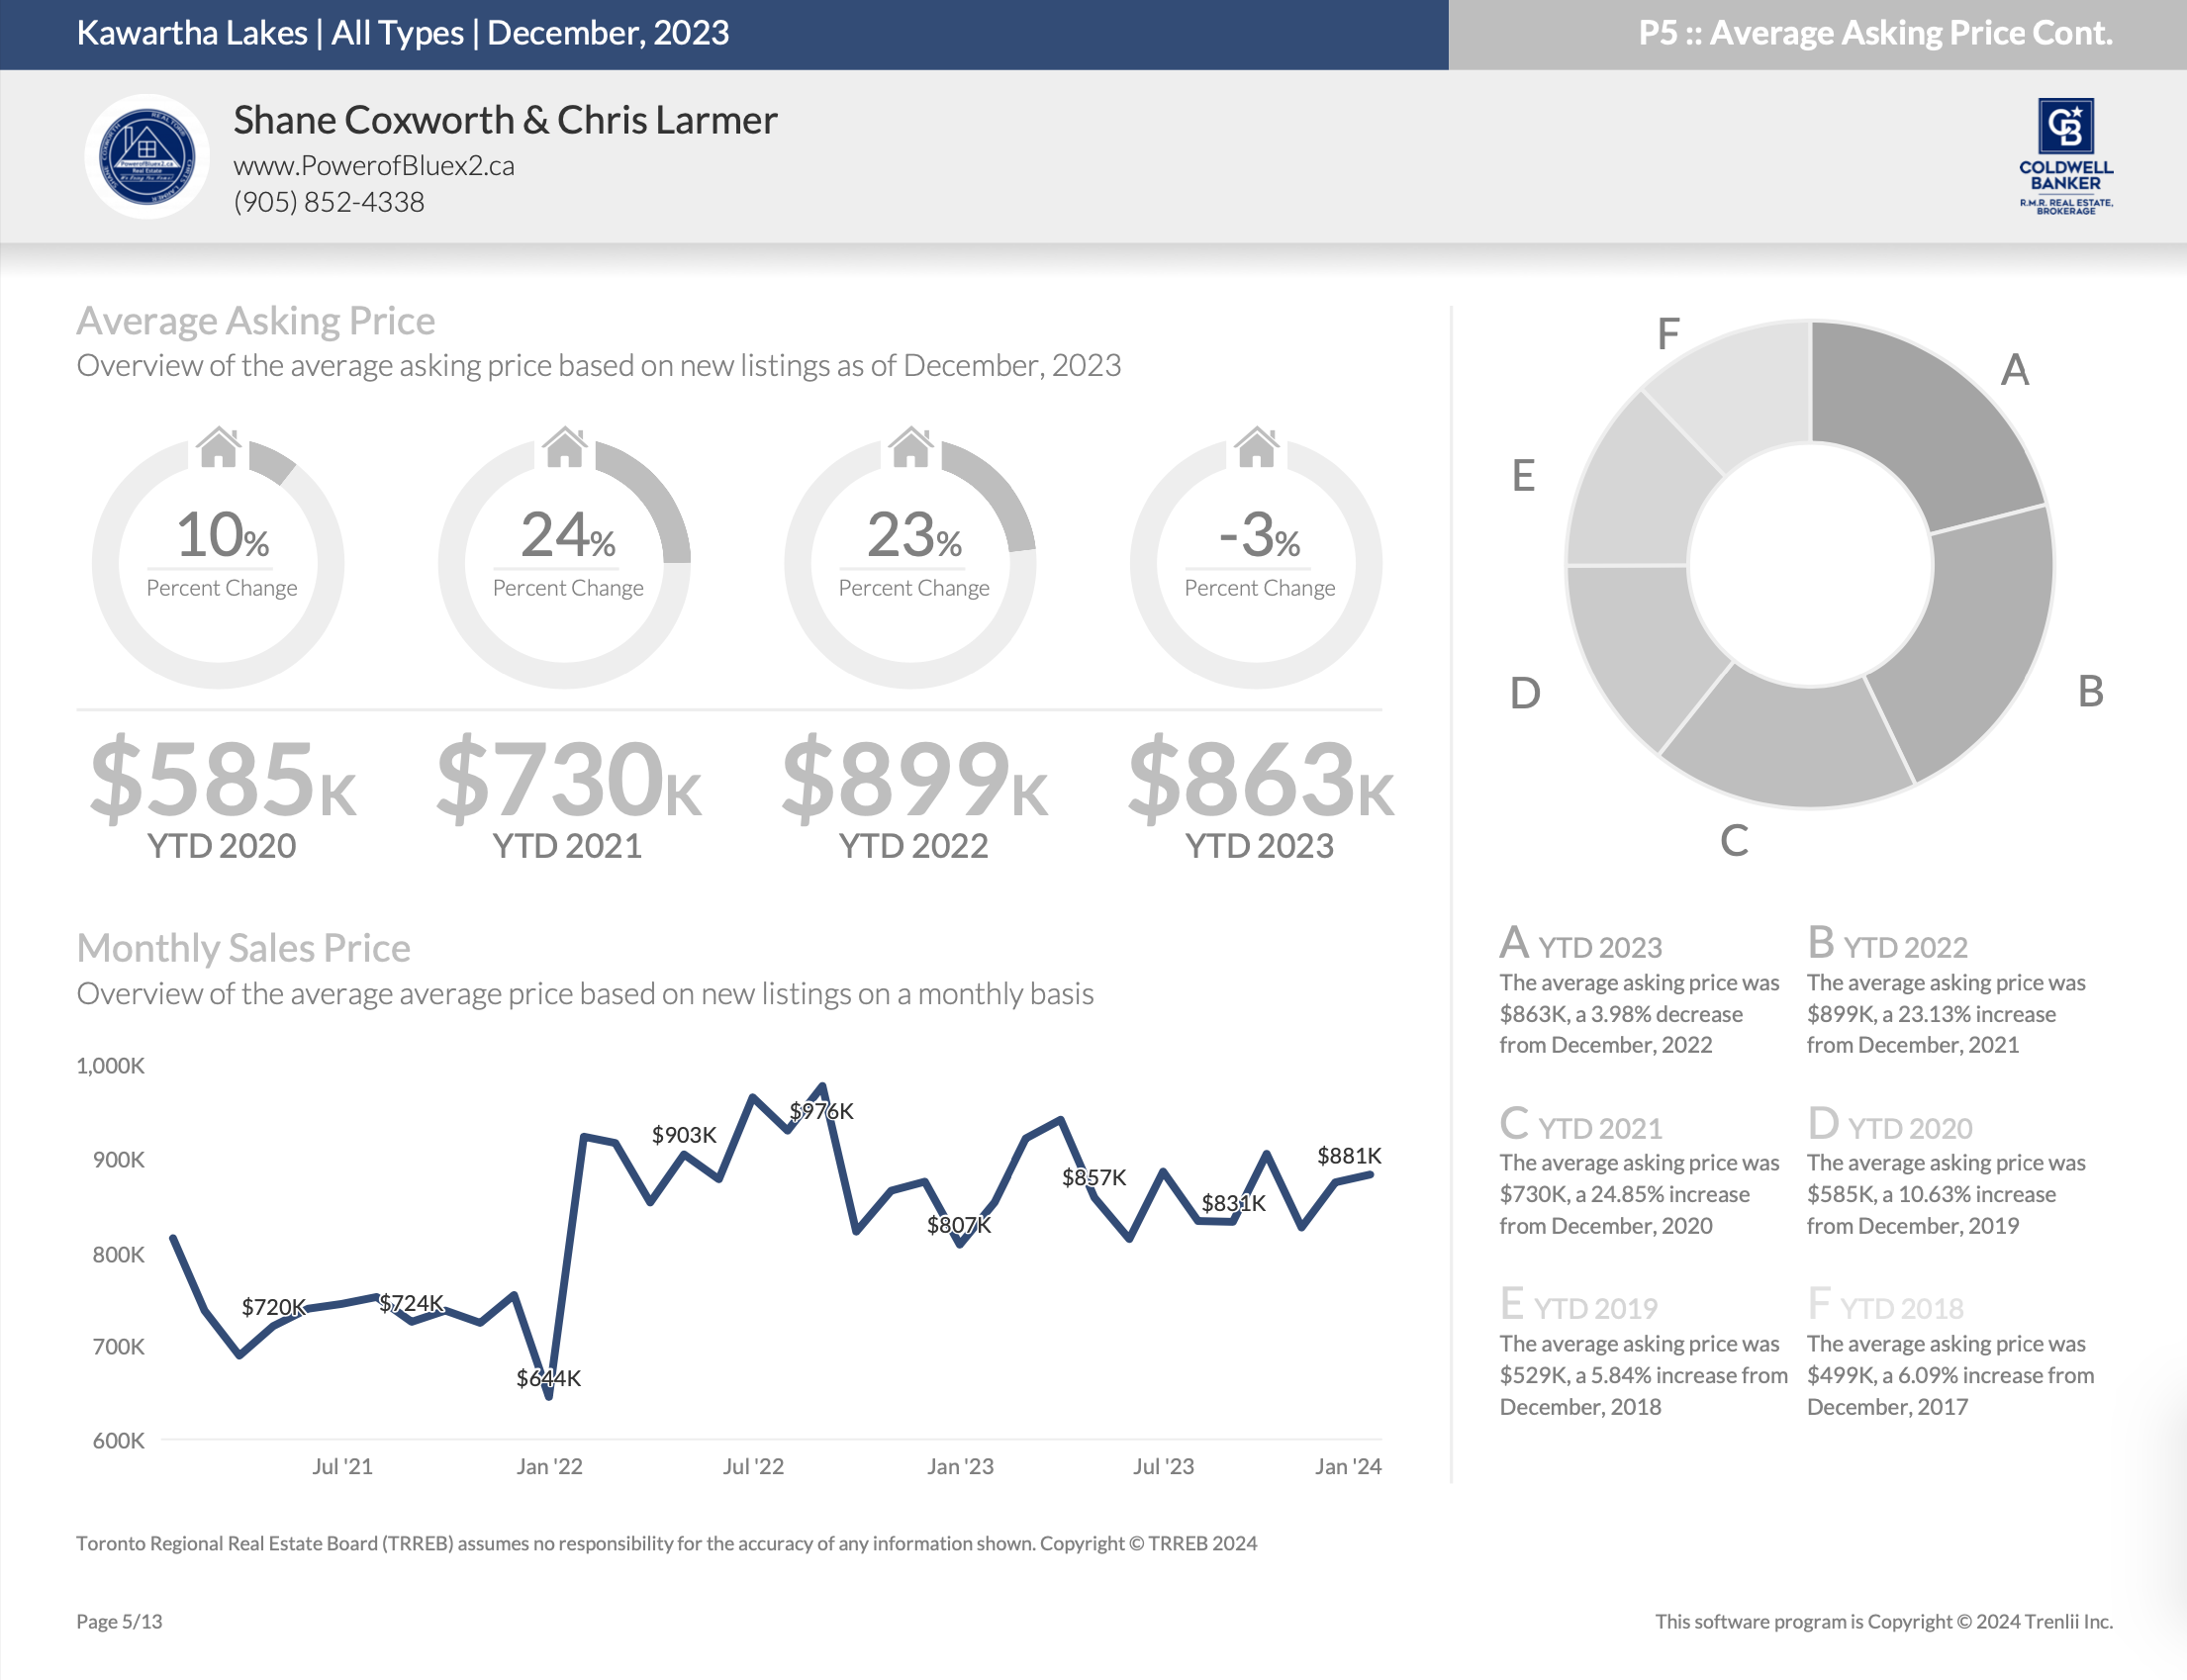
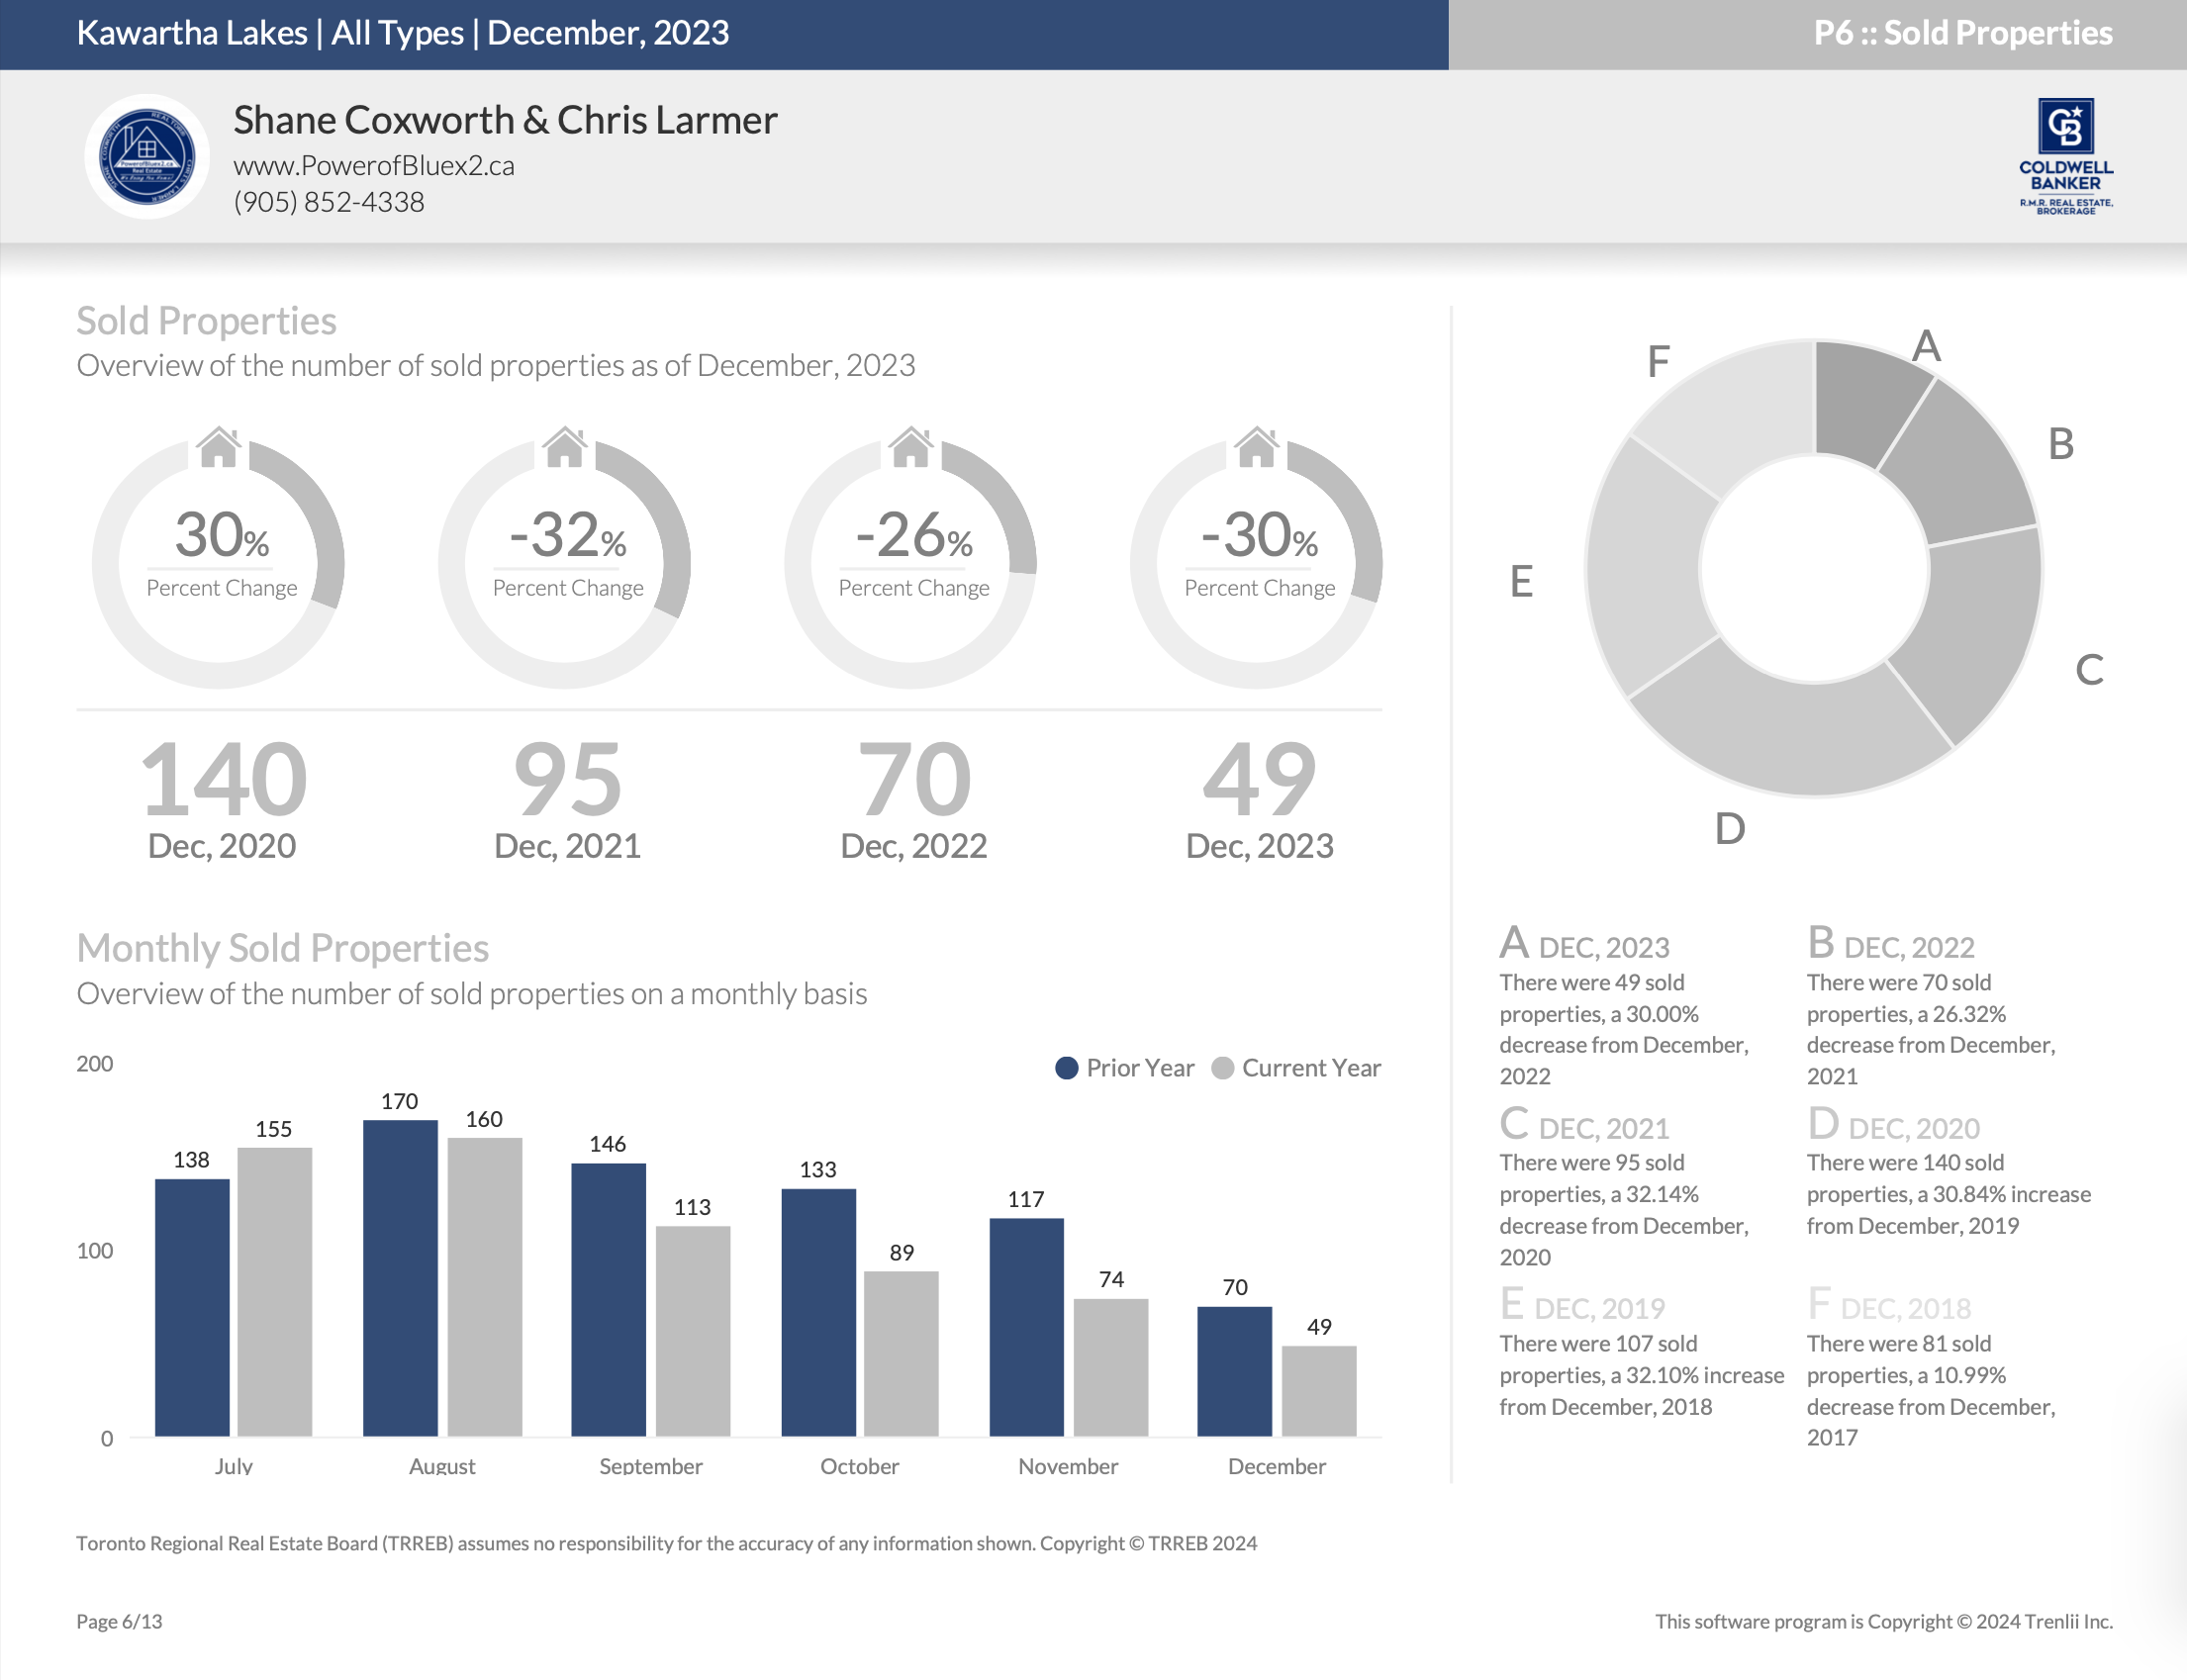
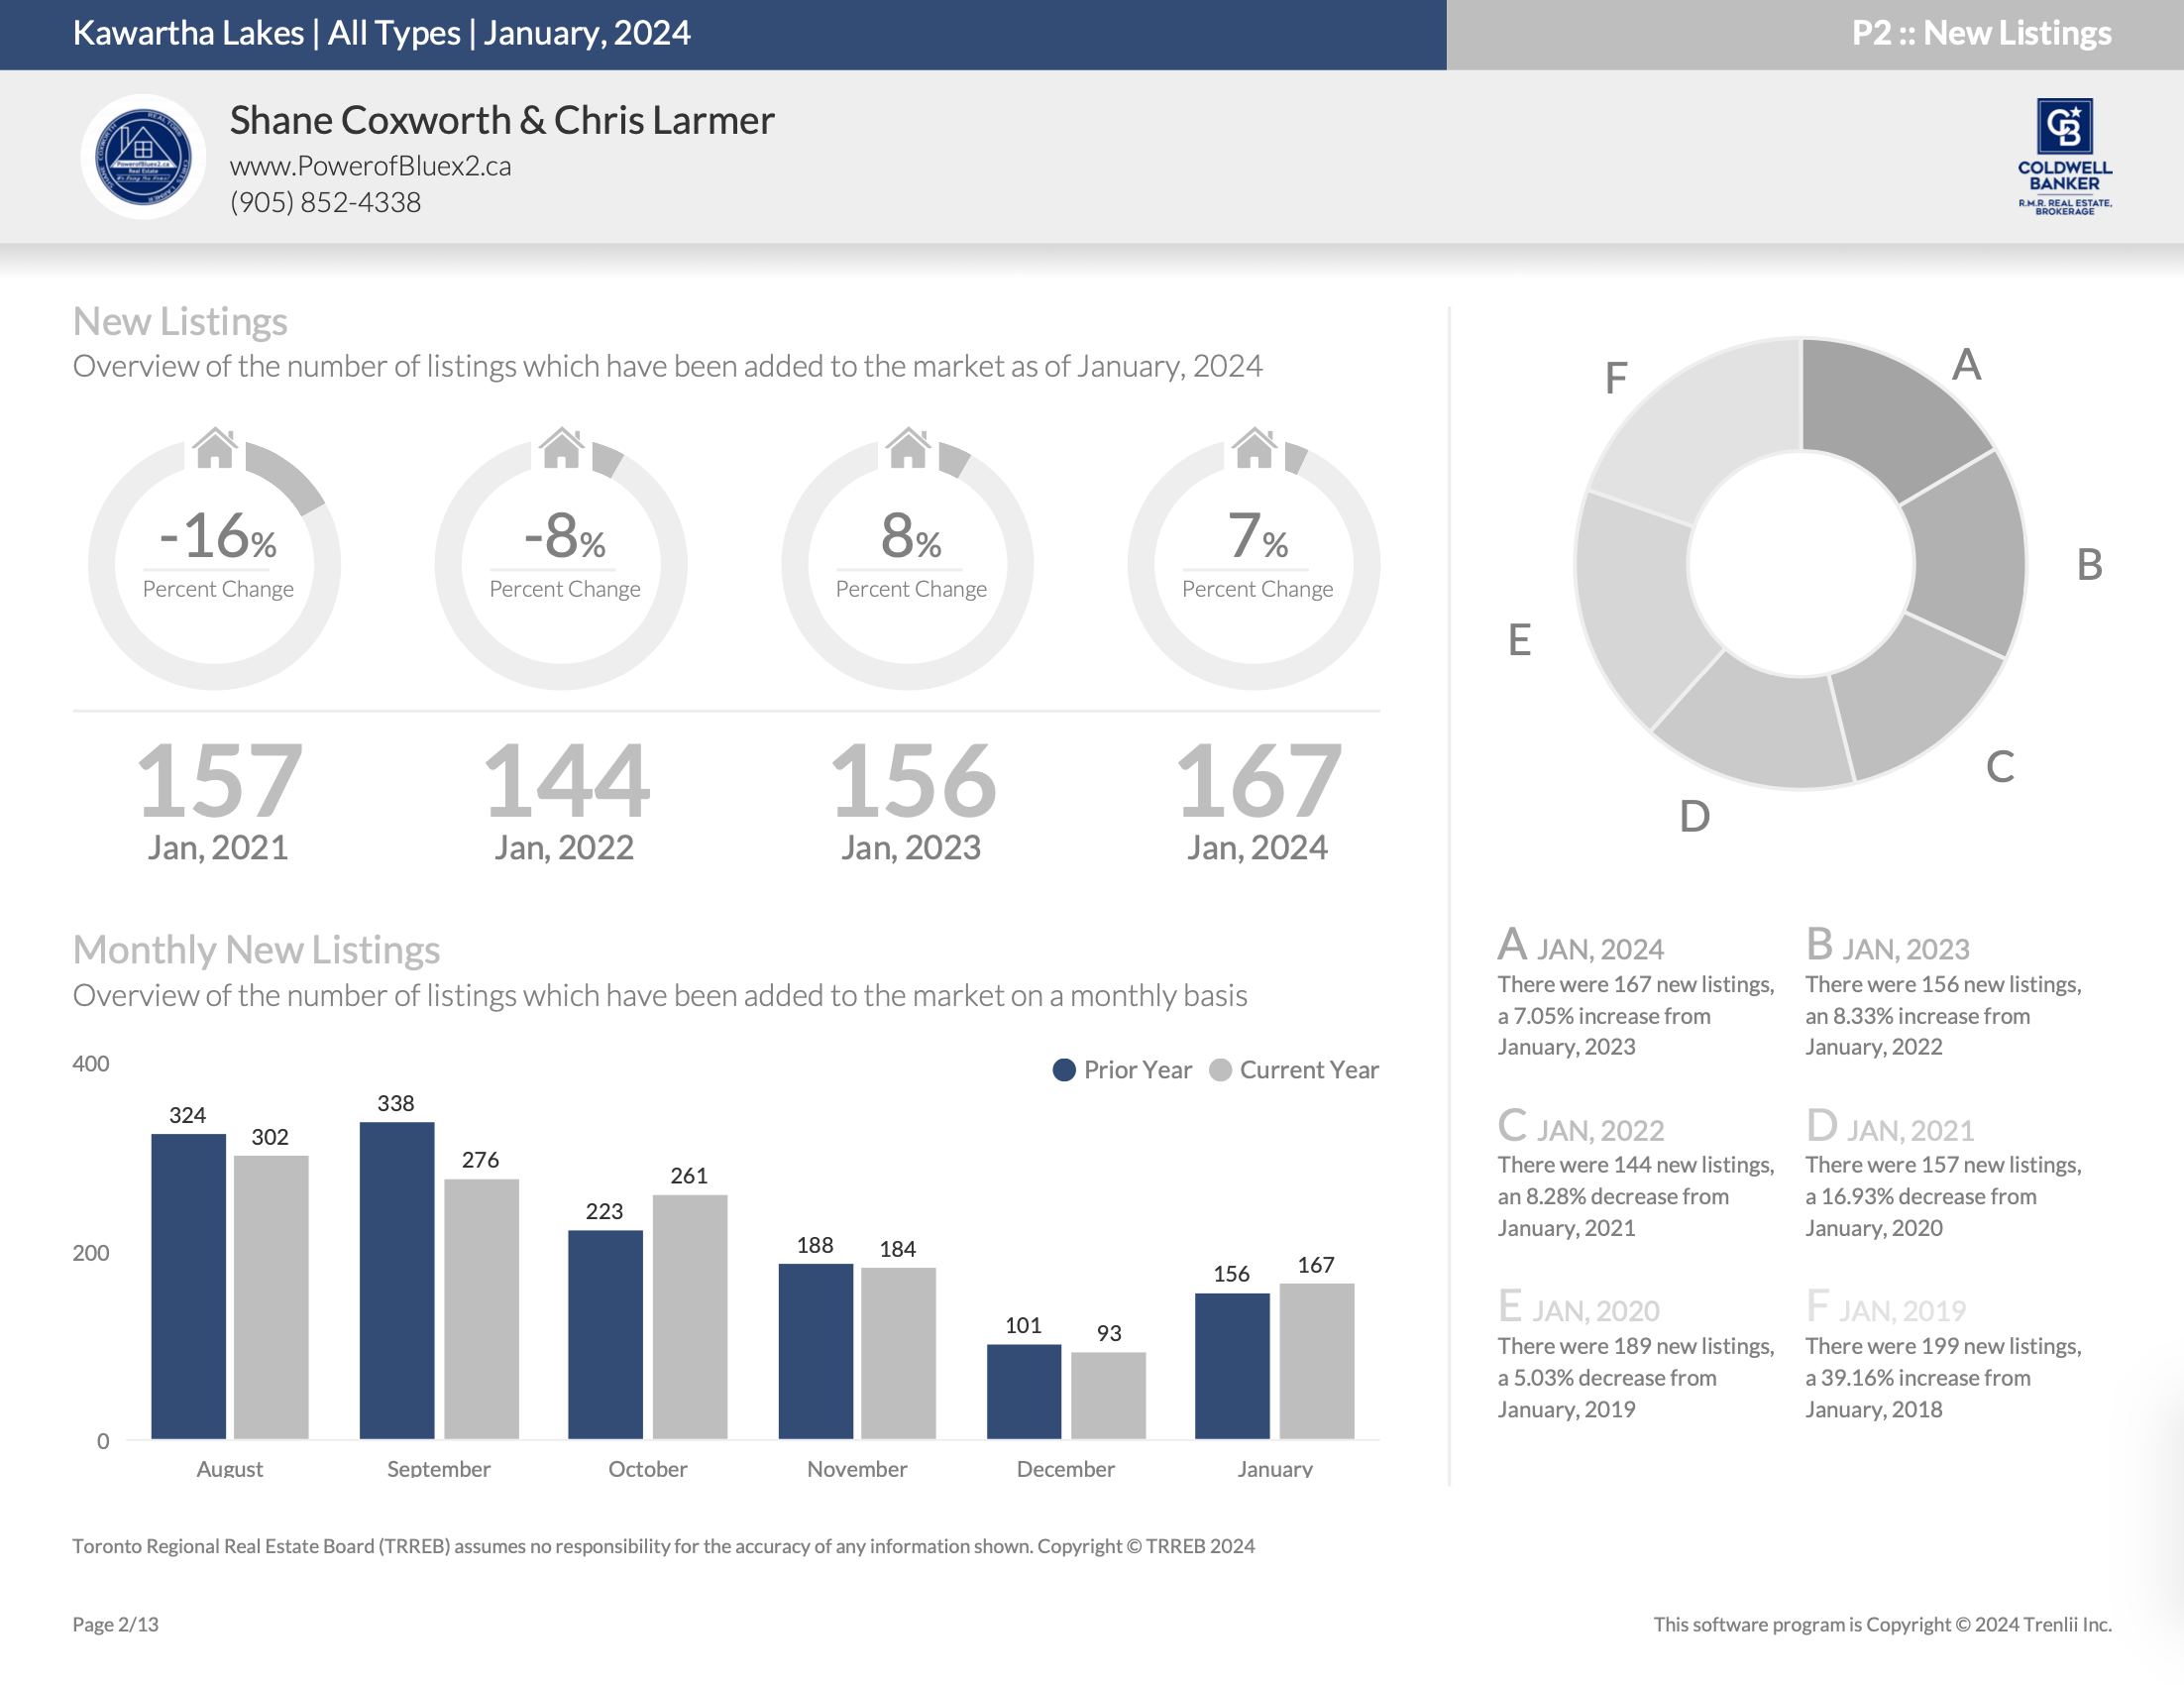
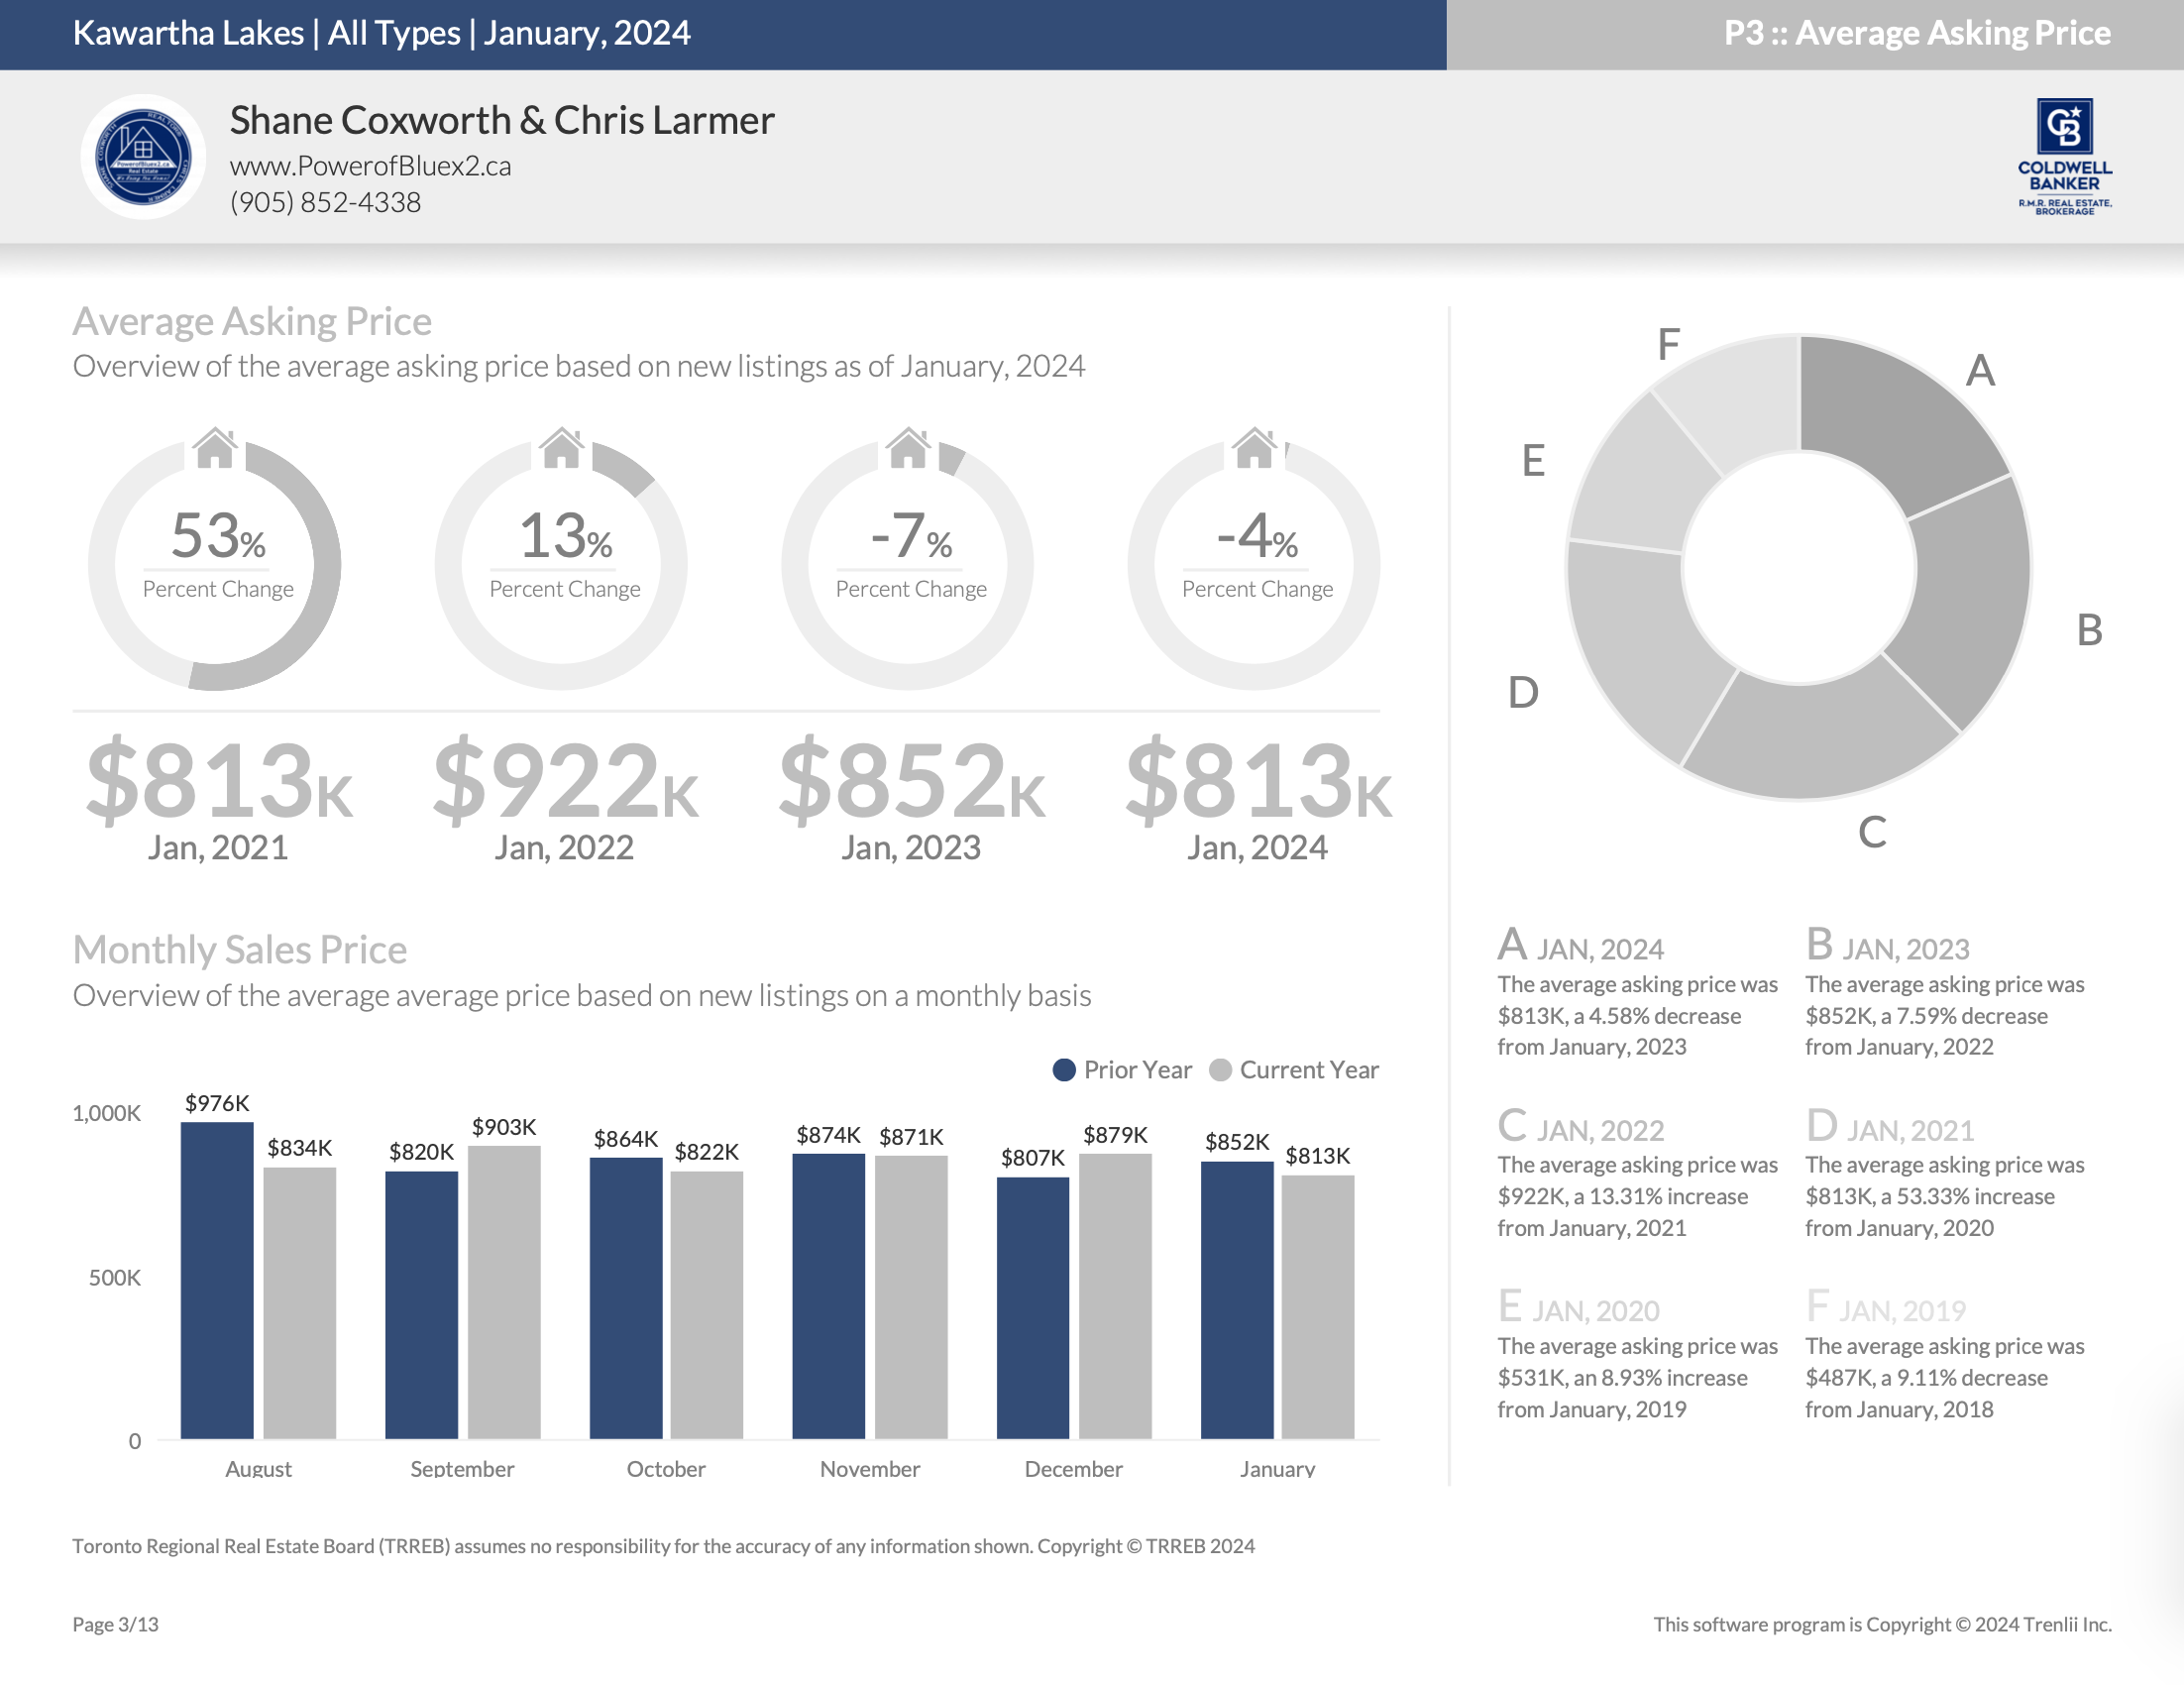
Kawartha Lakes Full Report
*Some values may vary slightly based on the exact date and time the reports were generated.
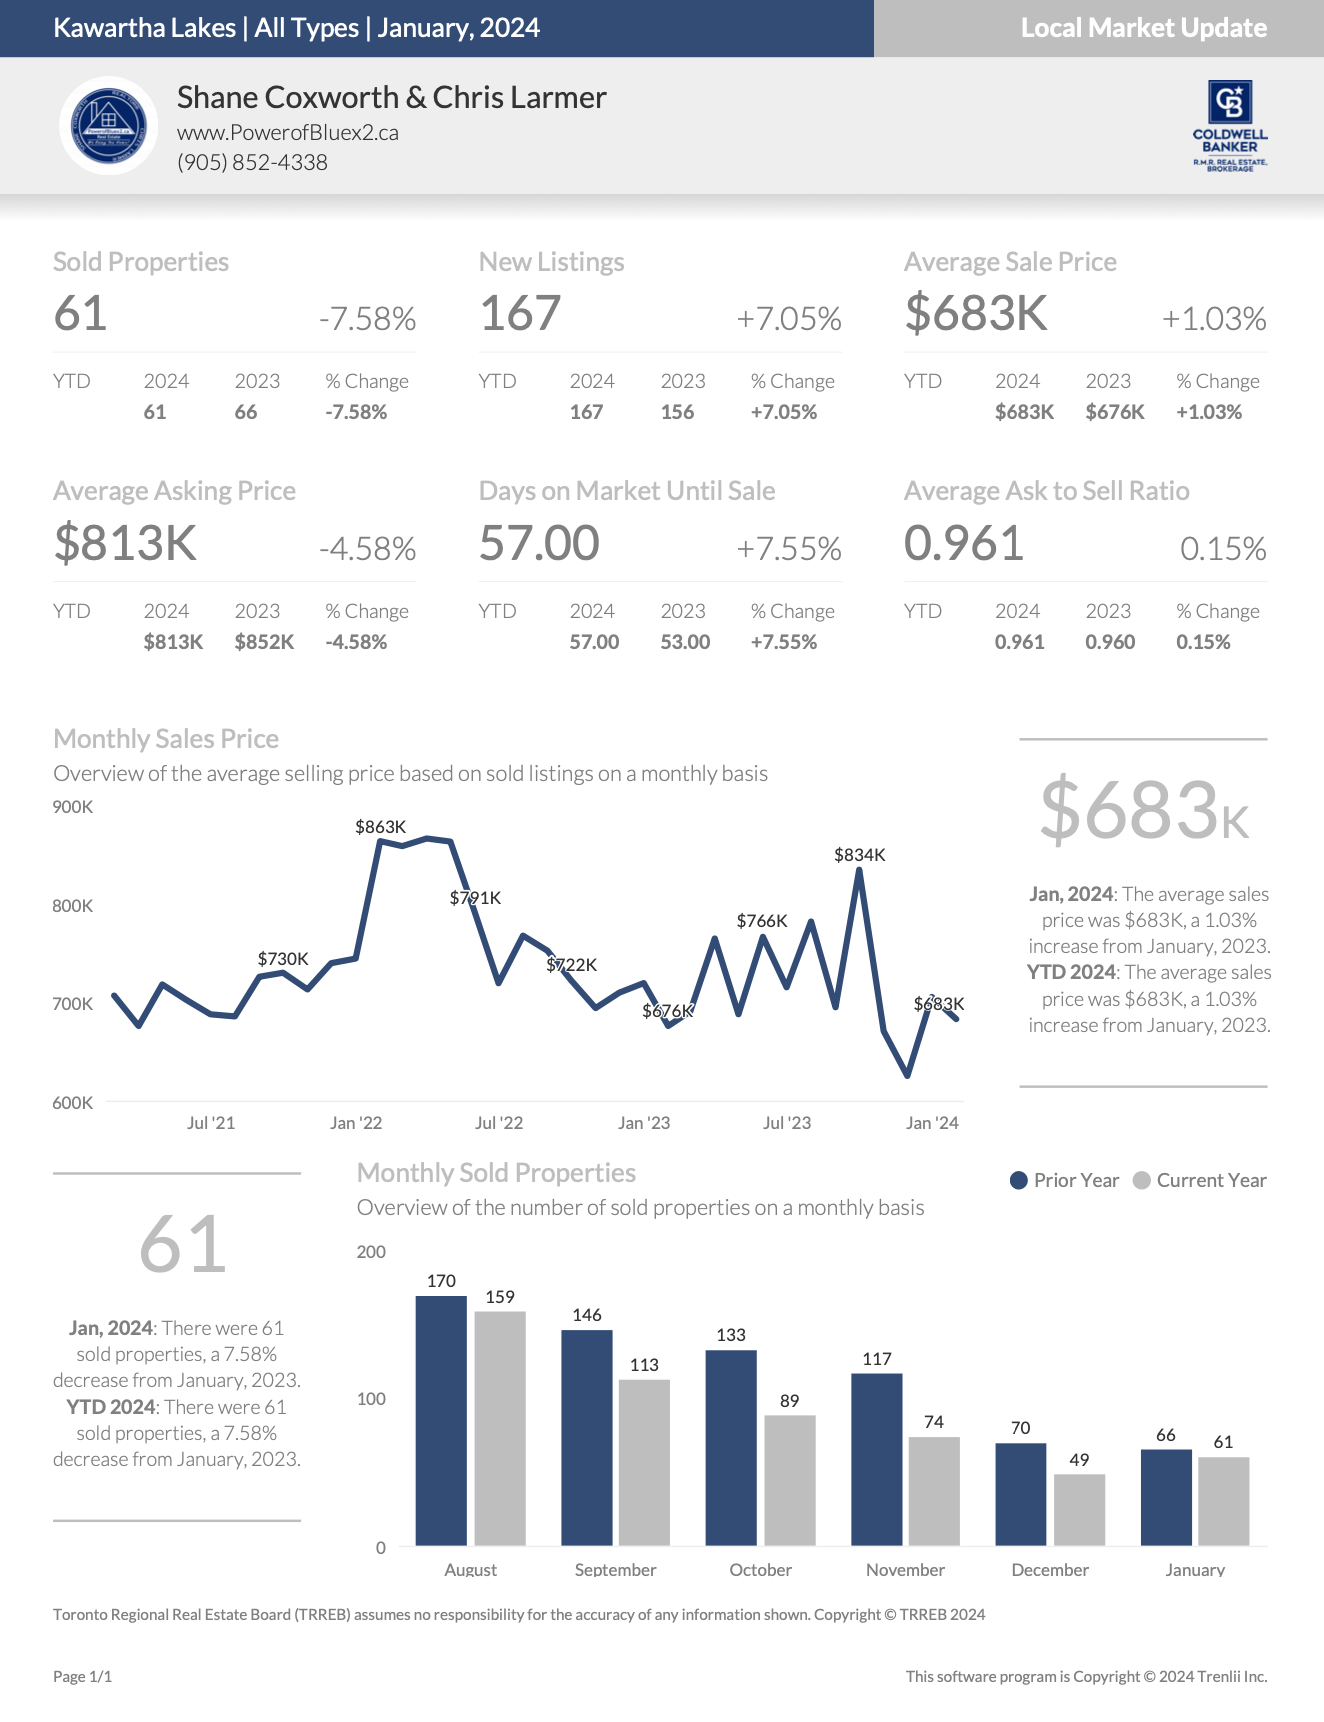
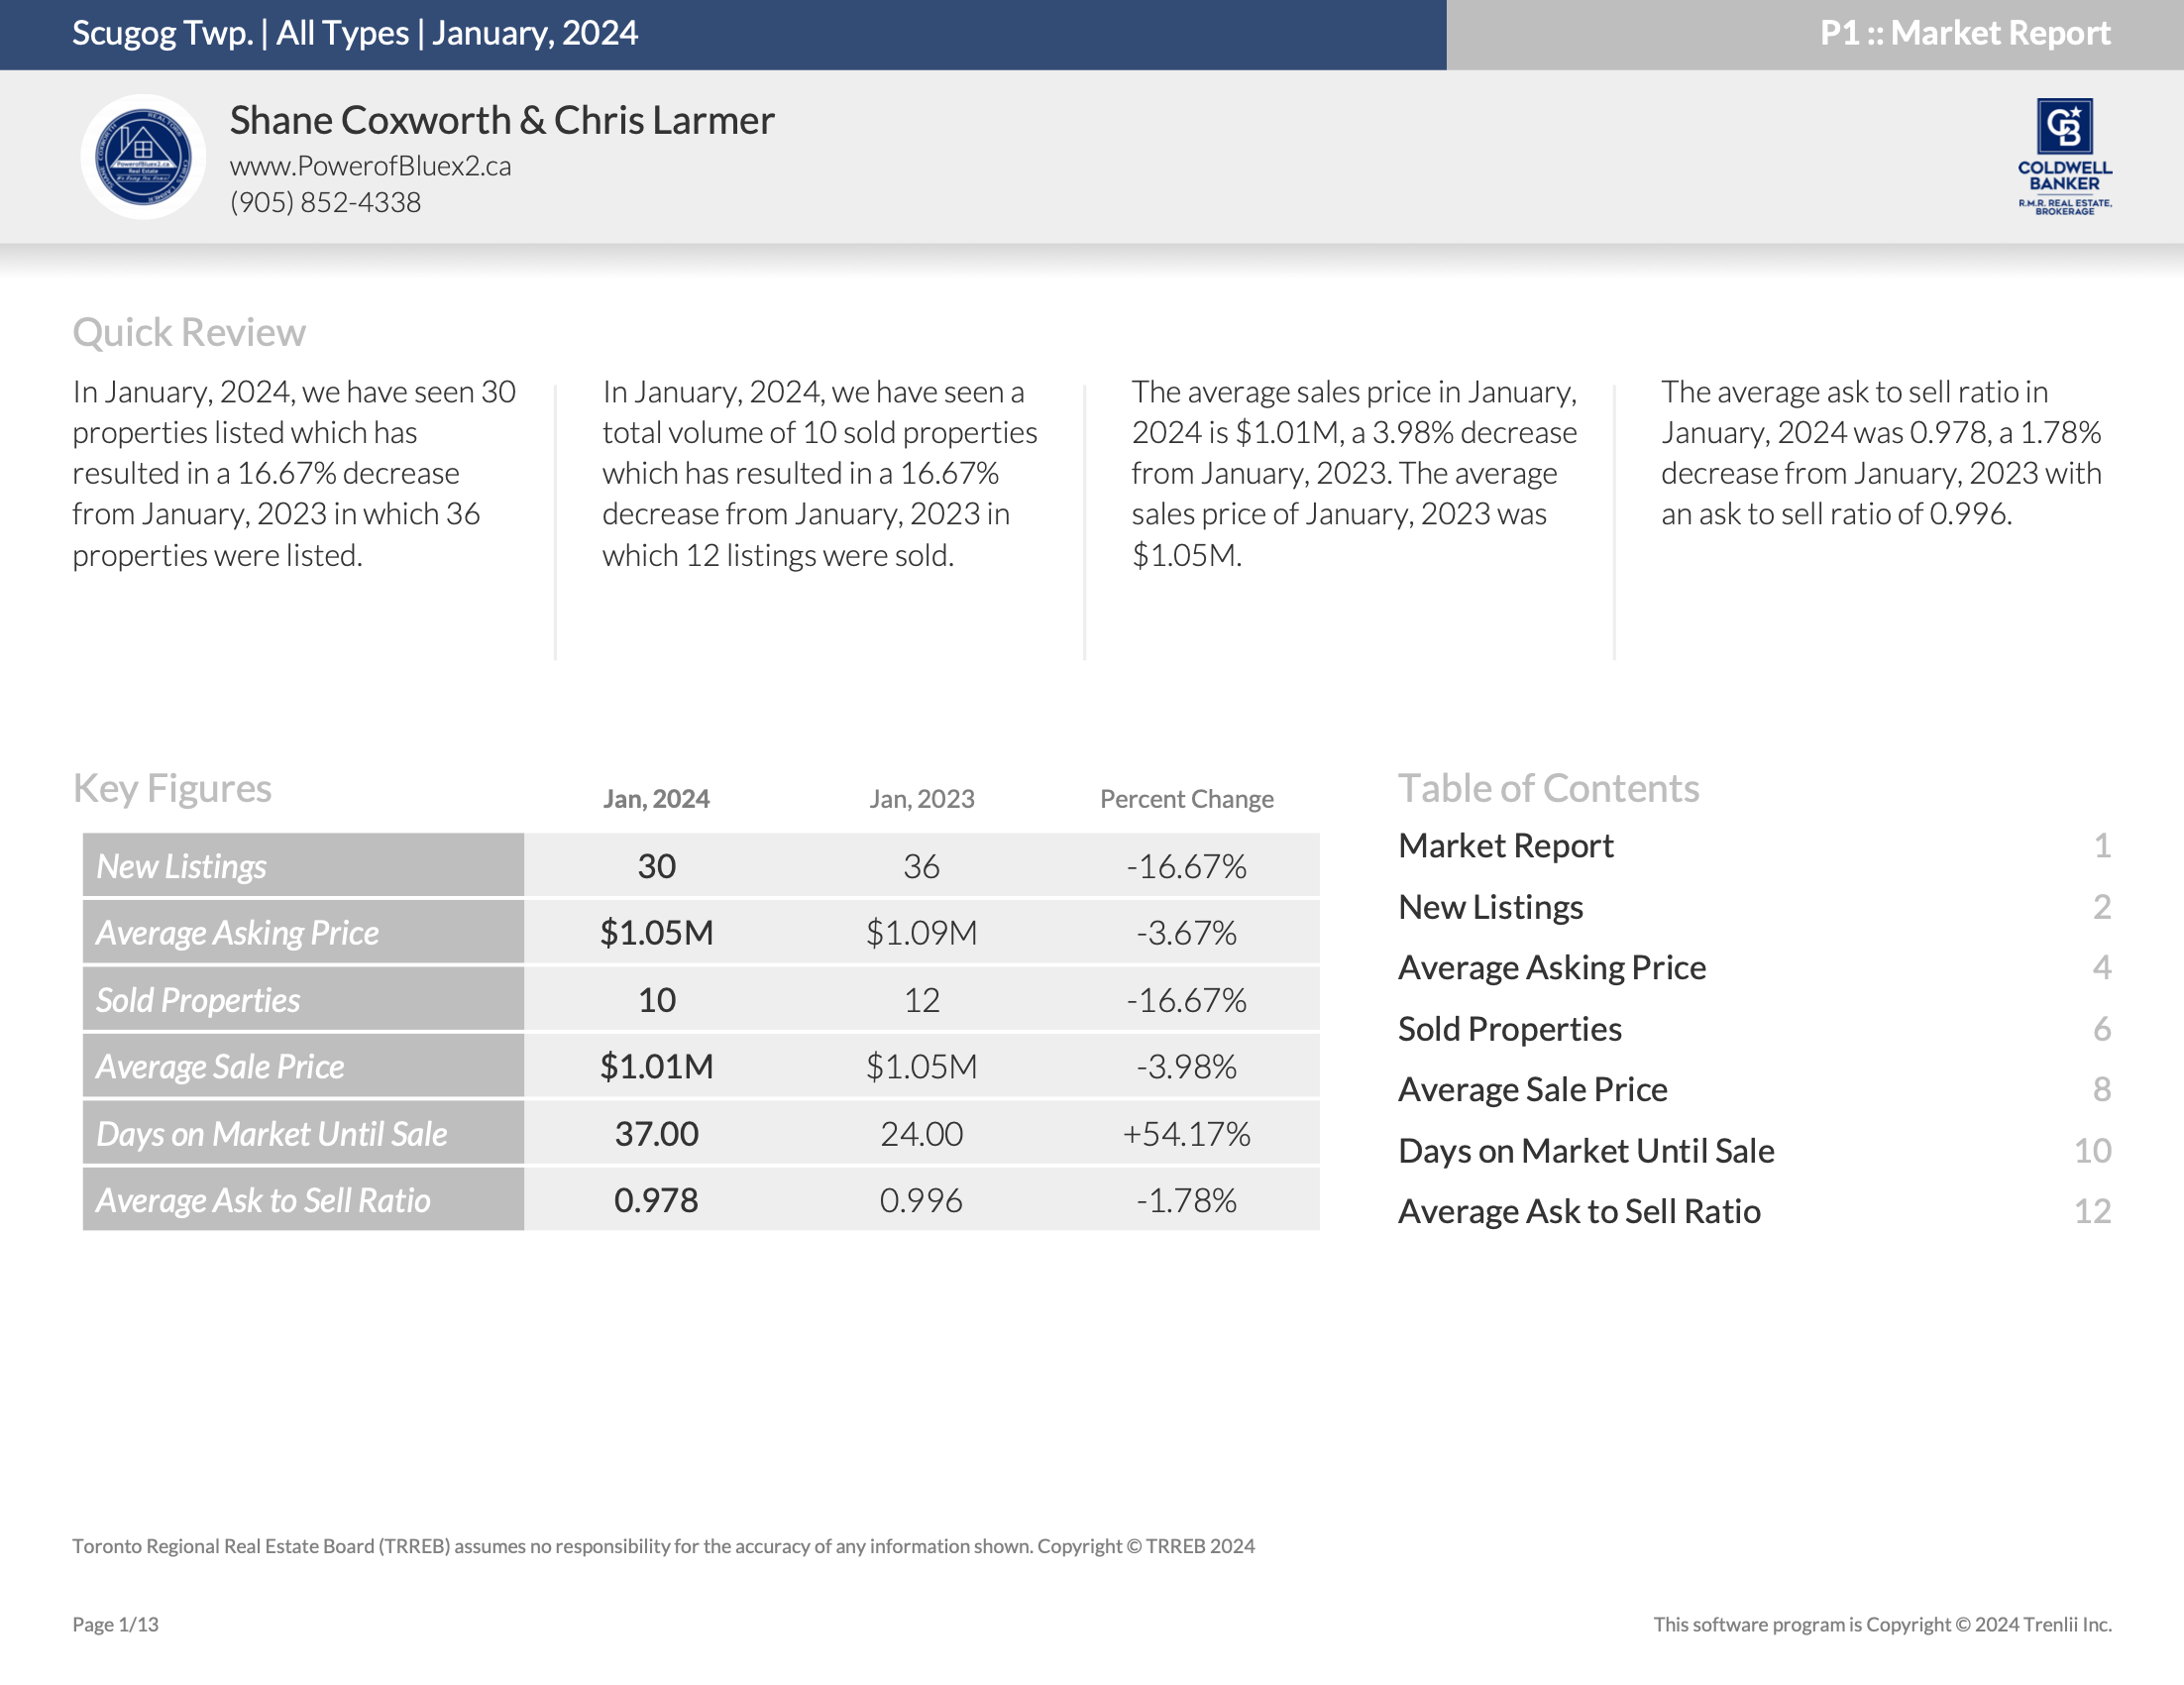
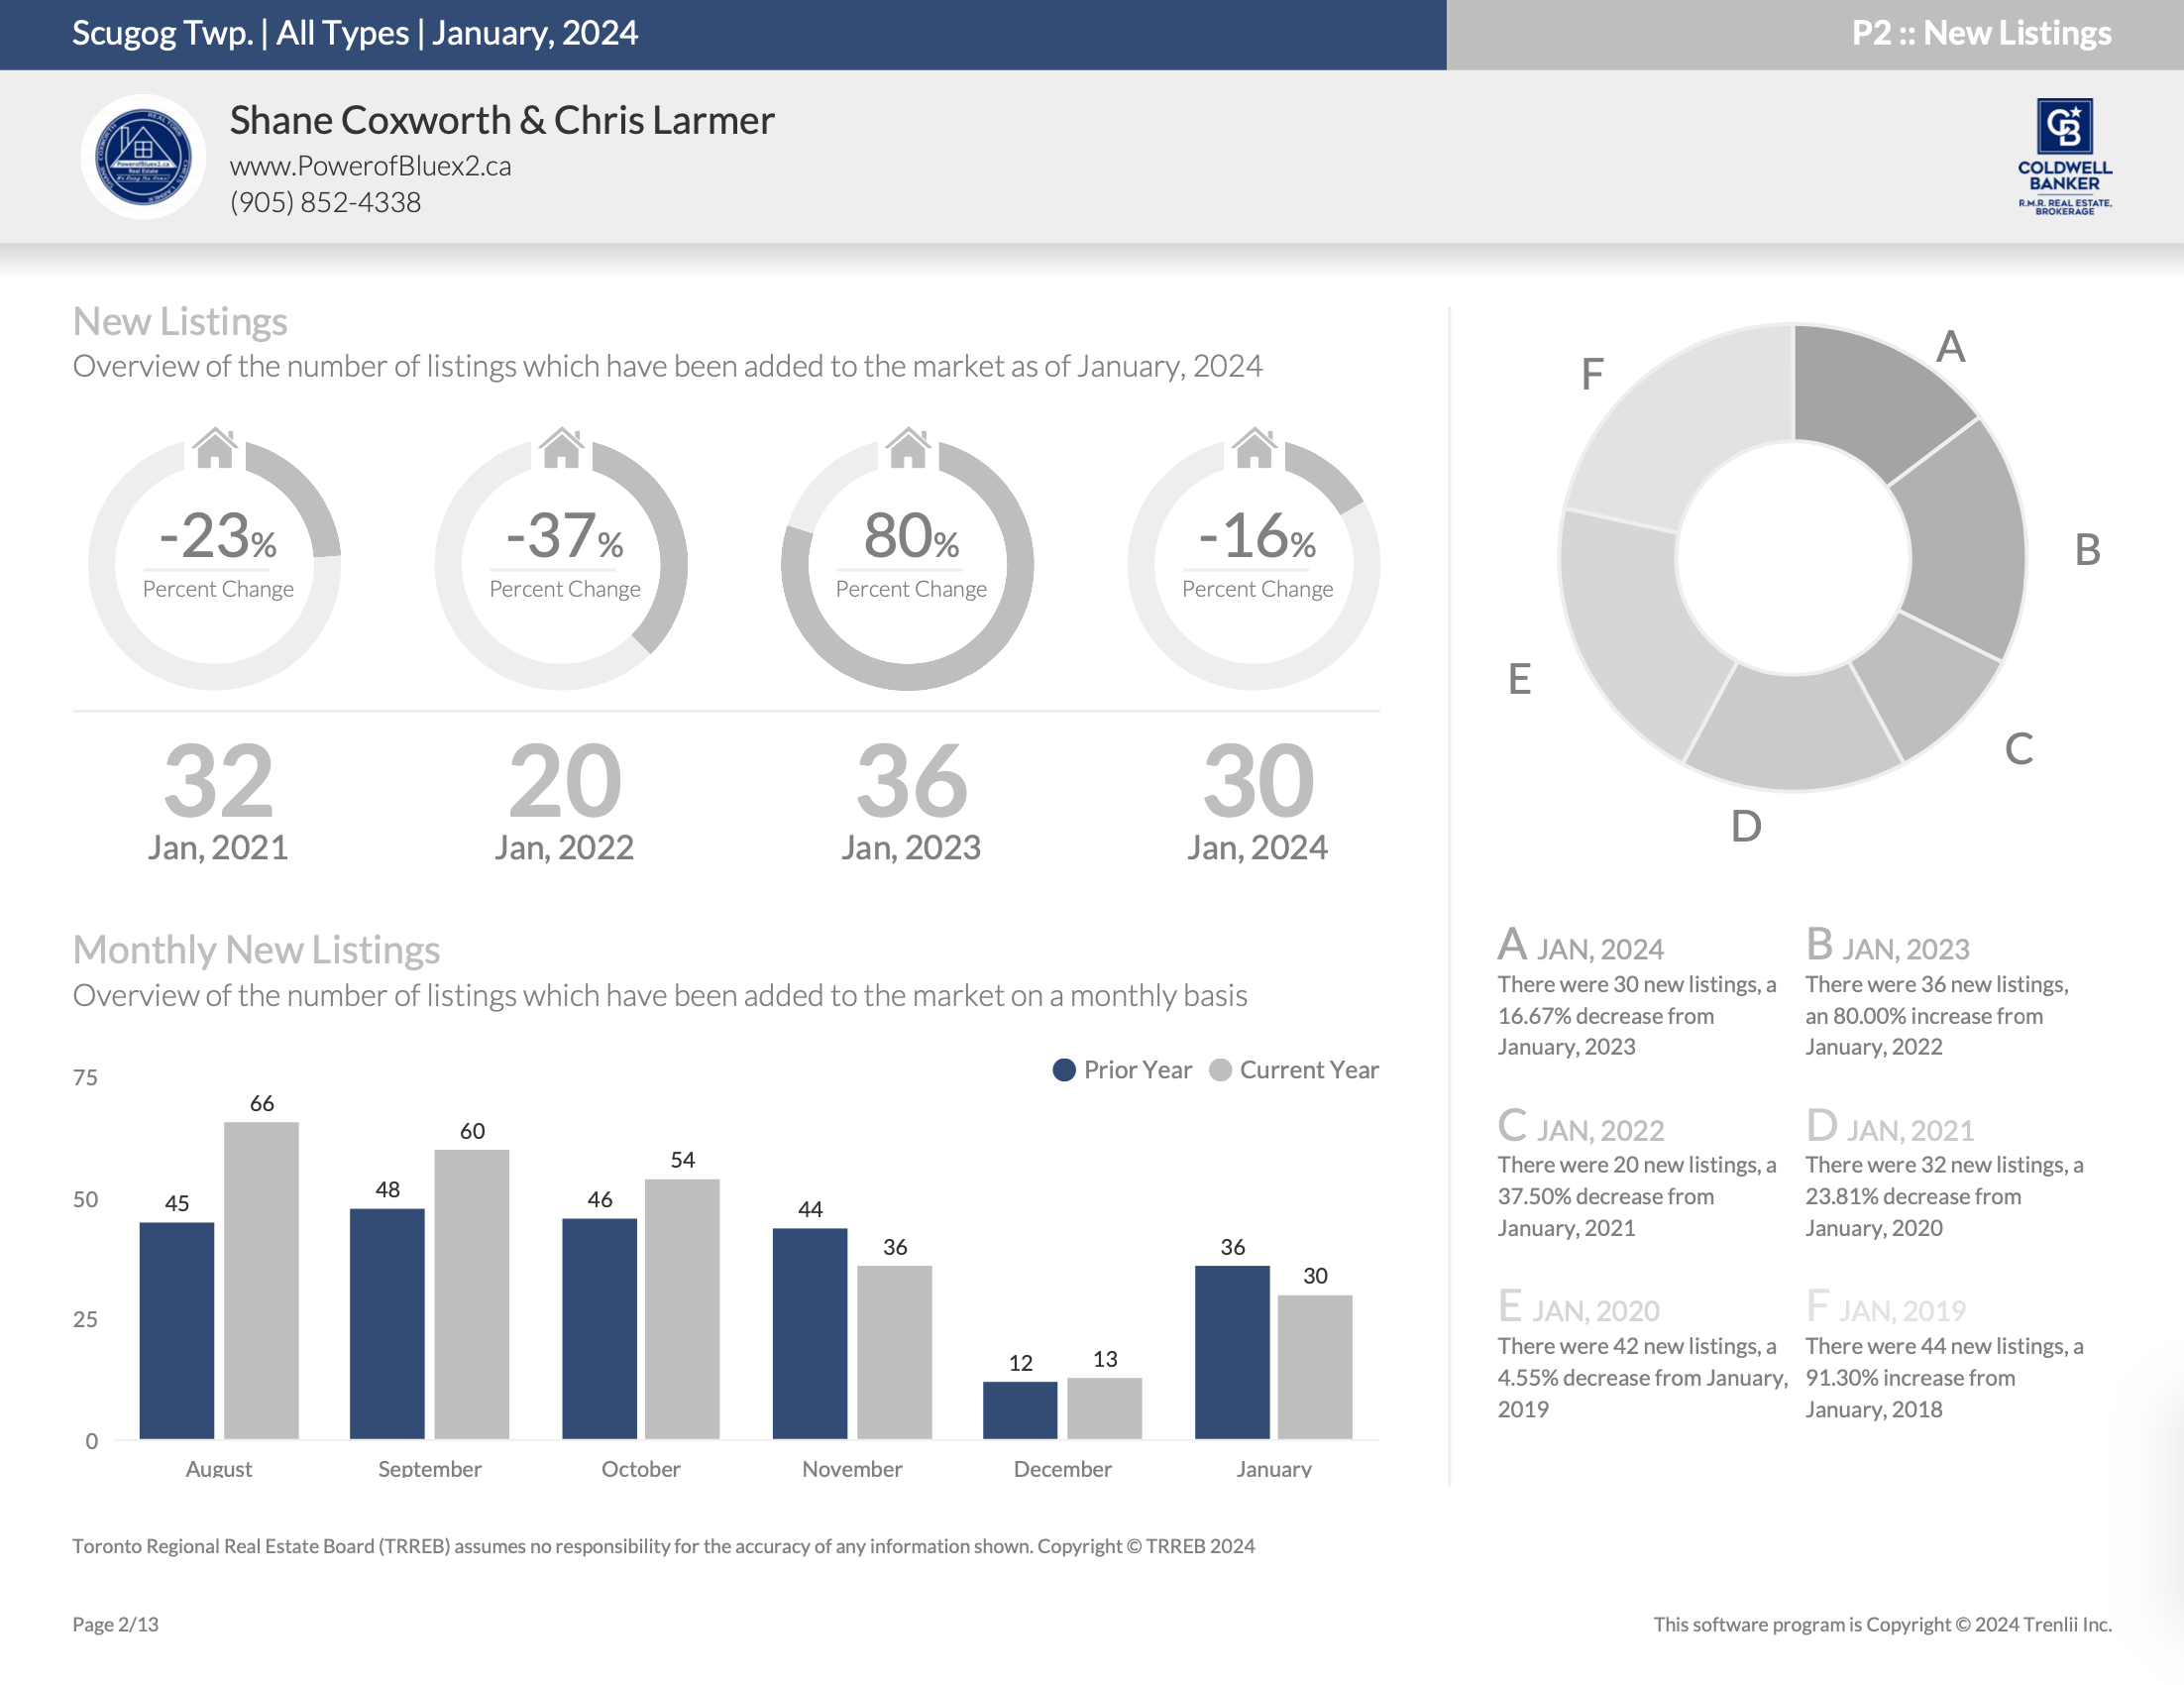
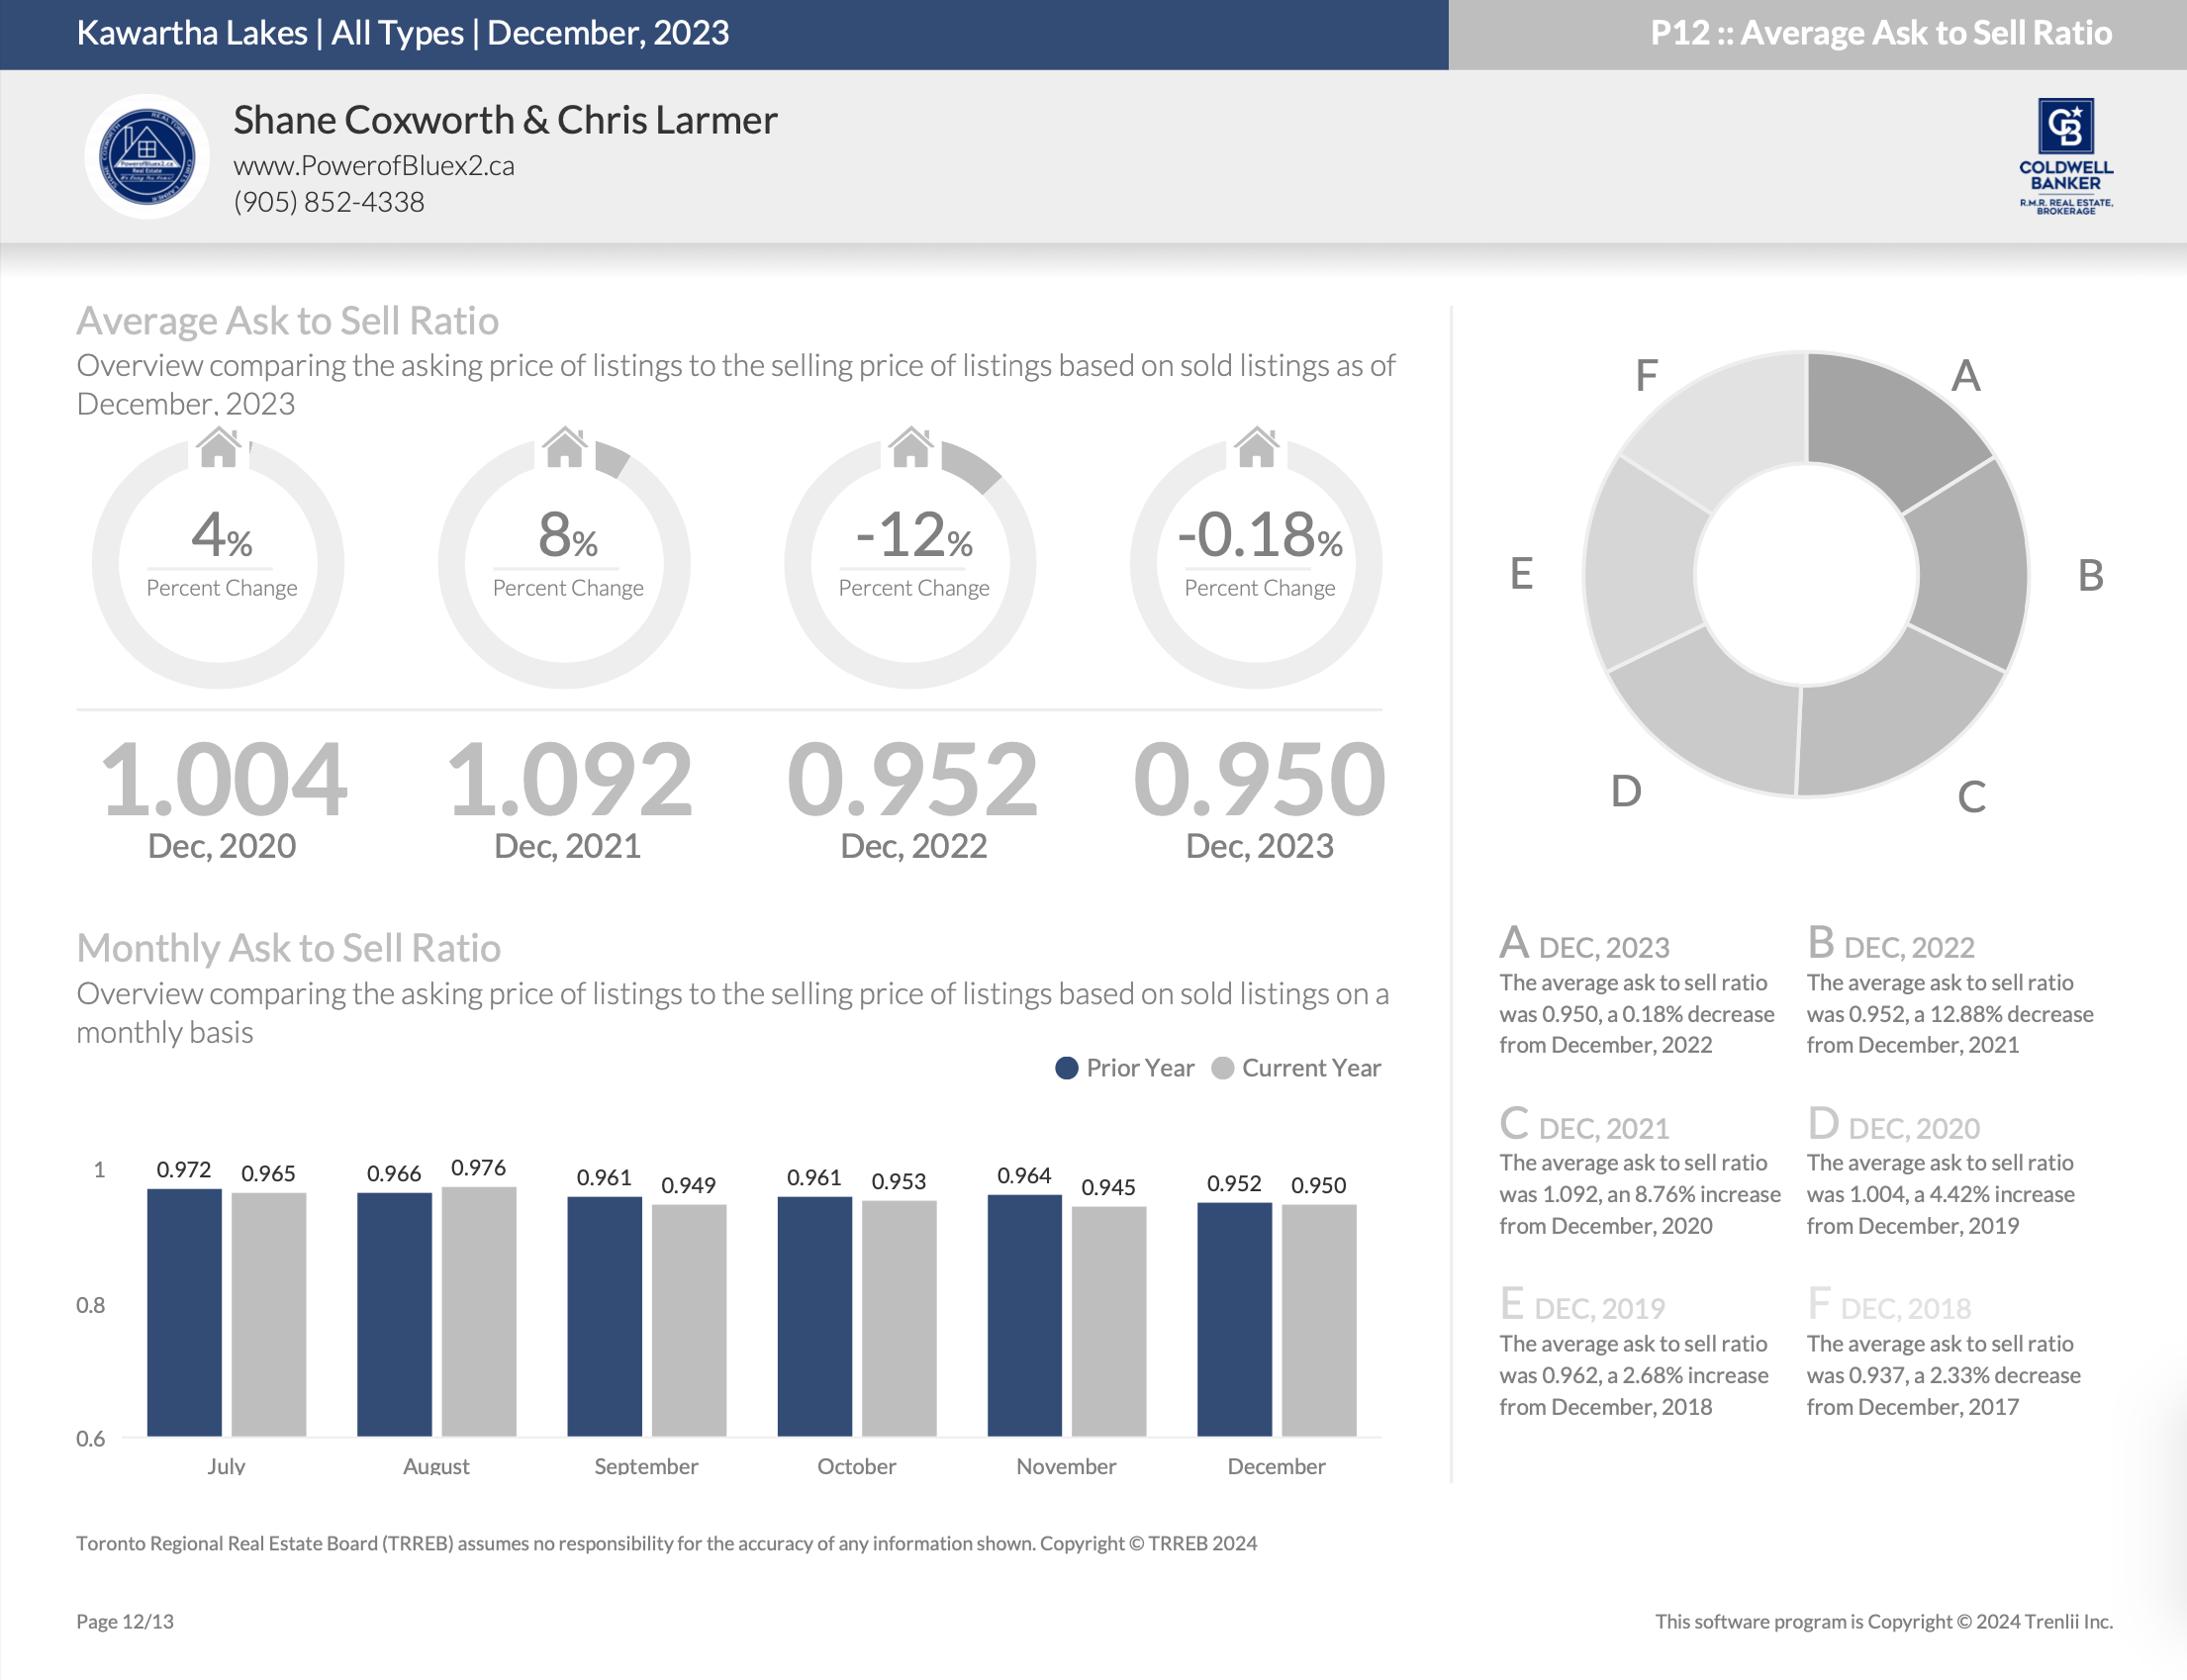
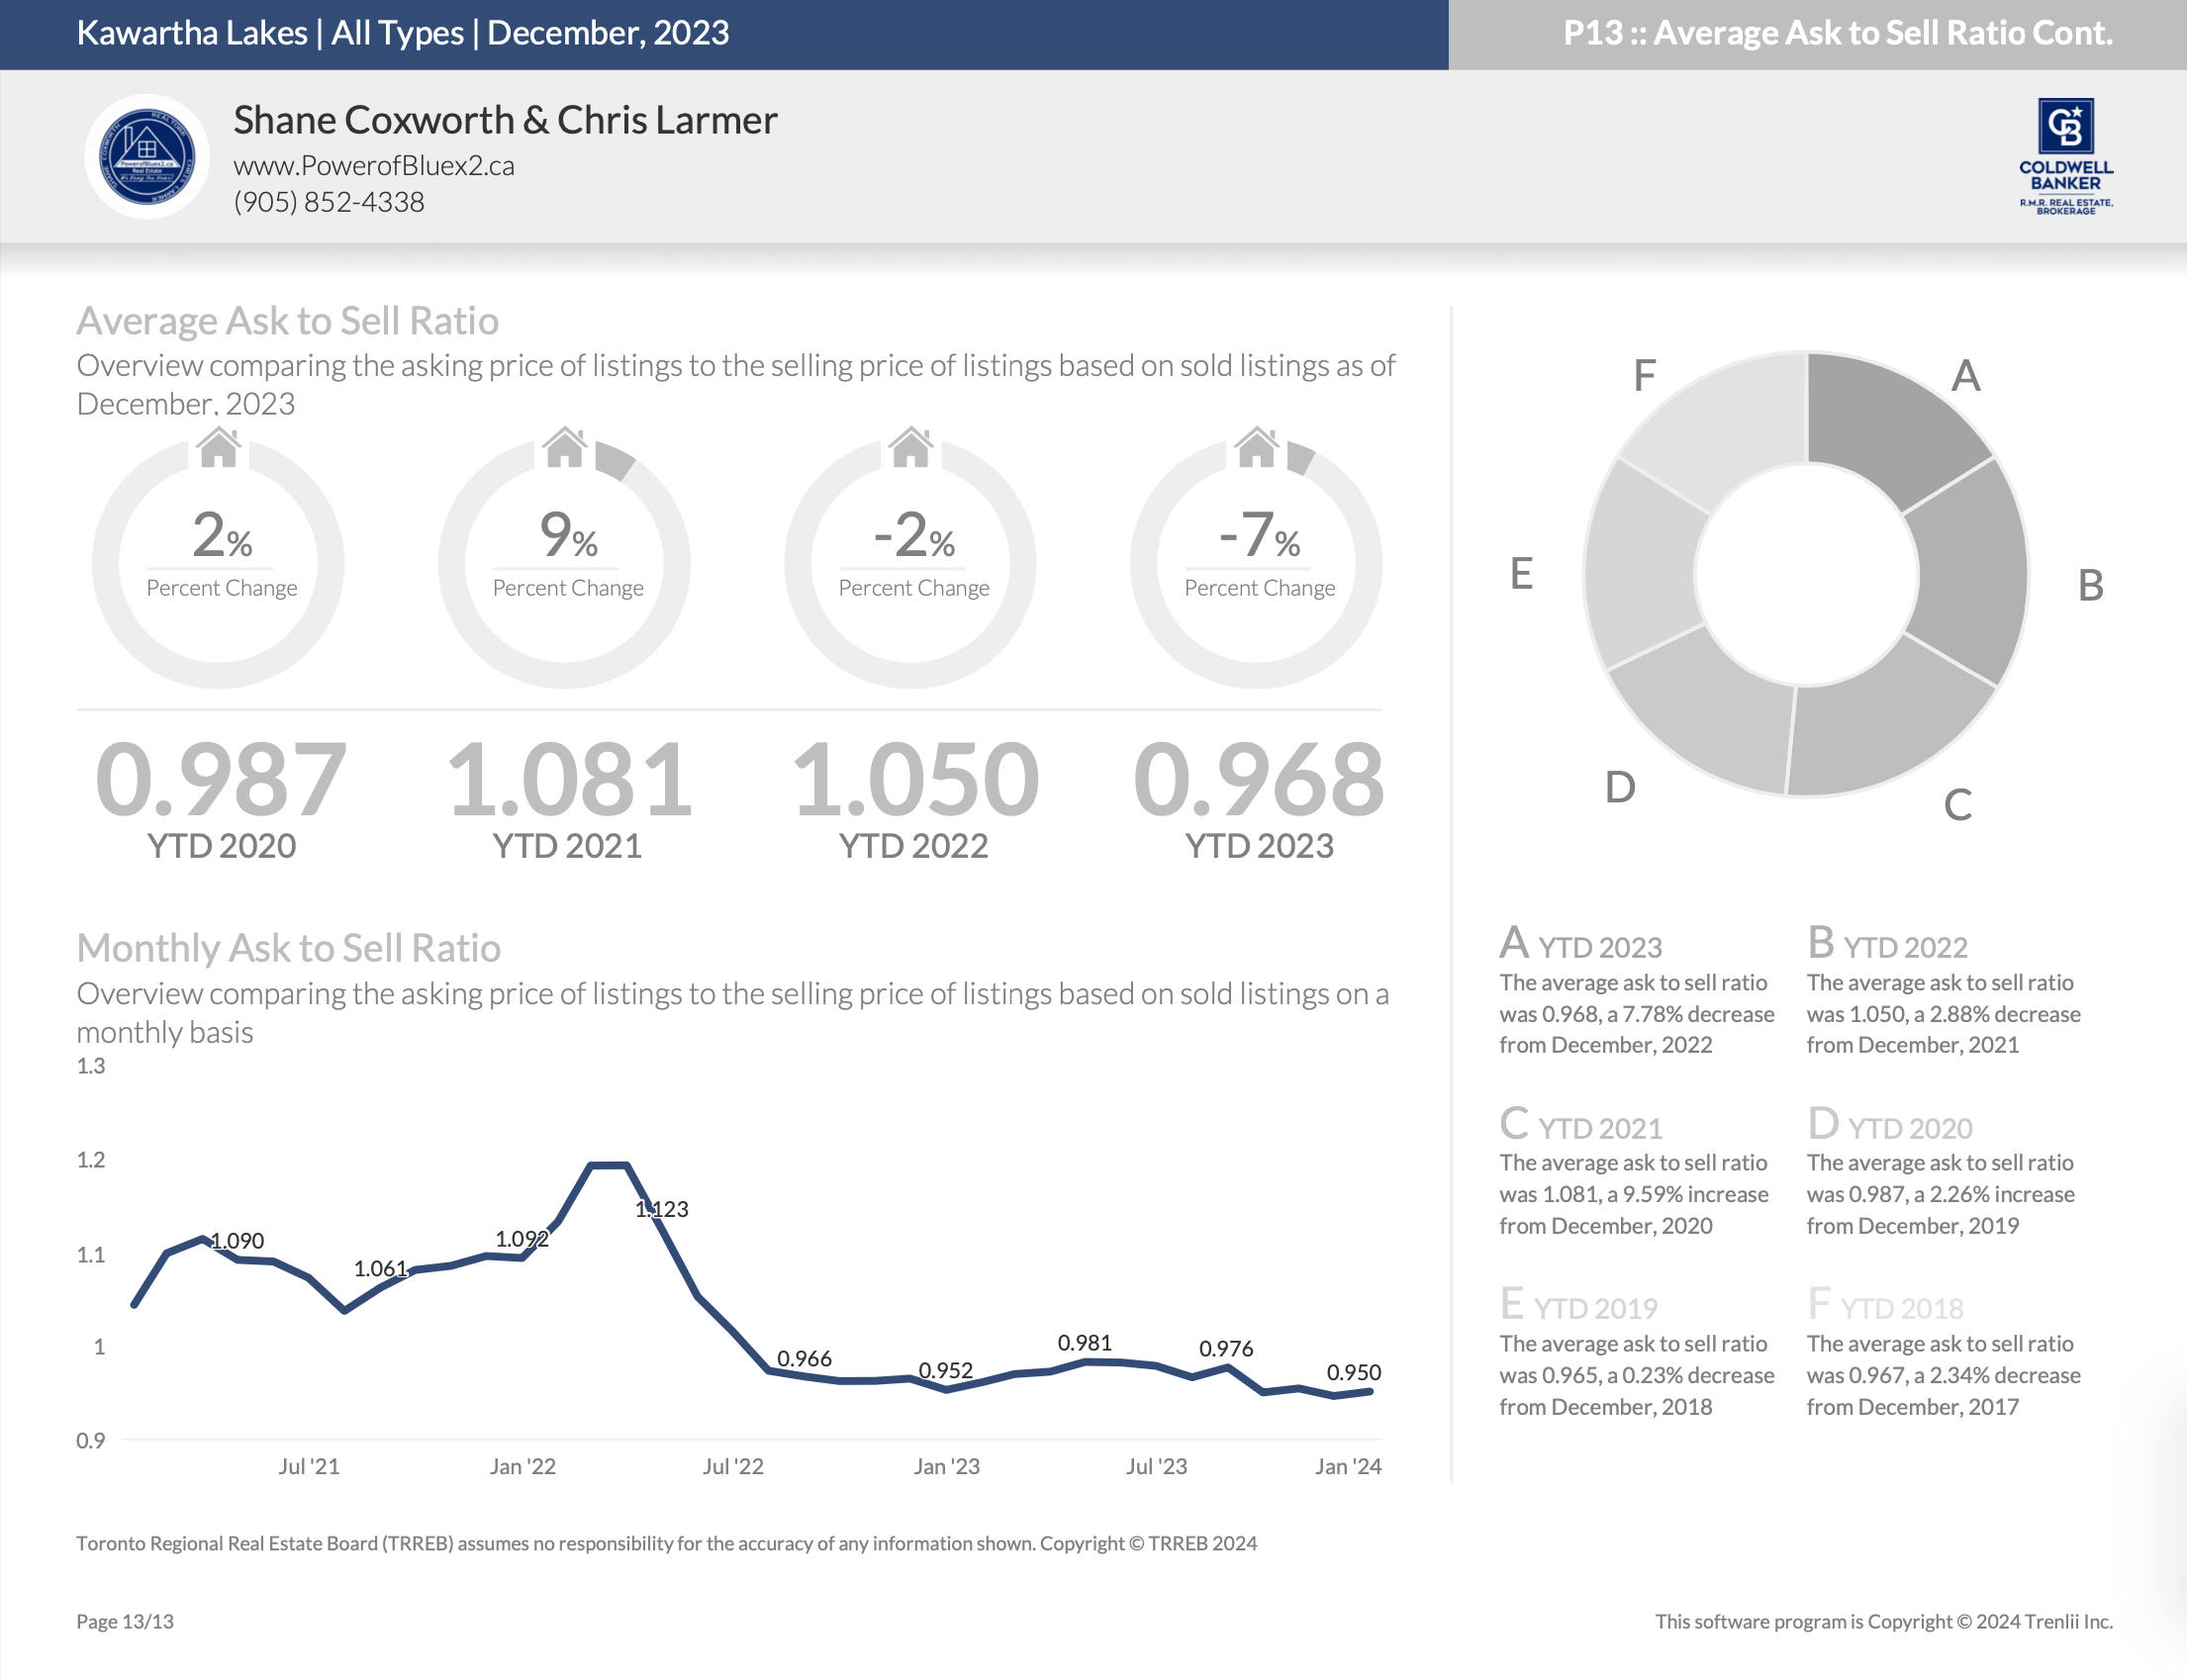
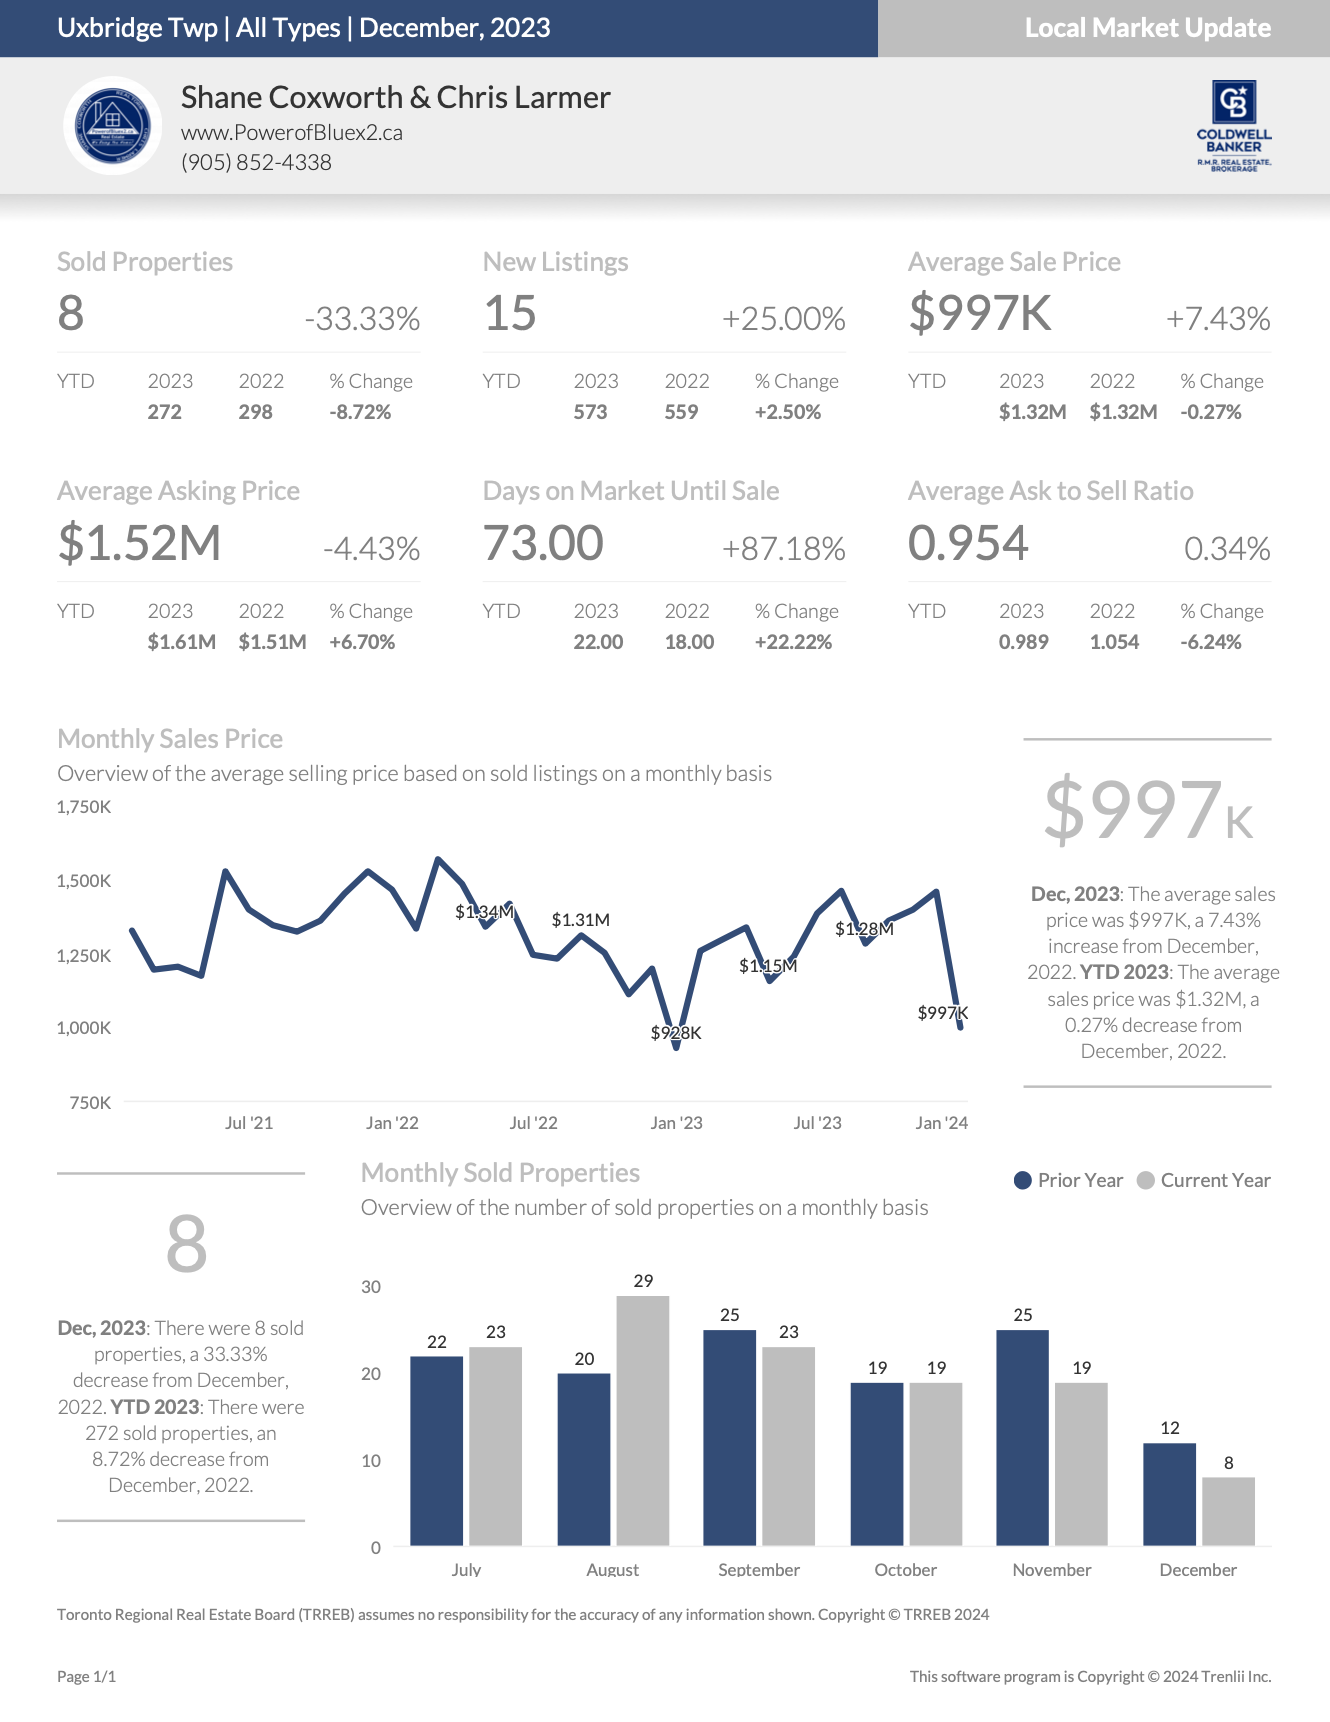
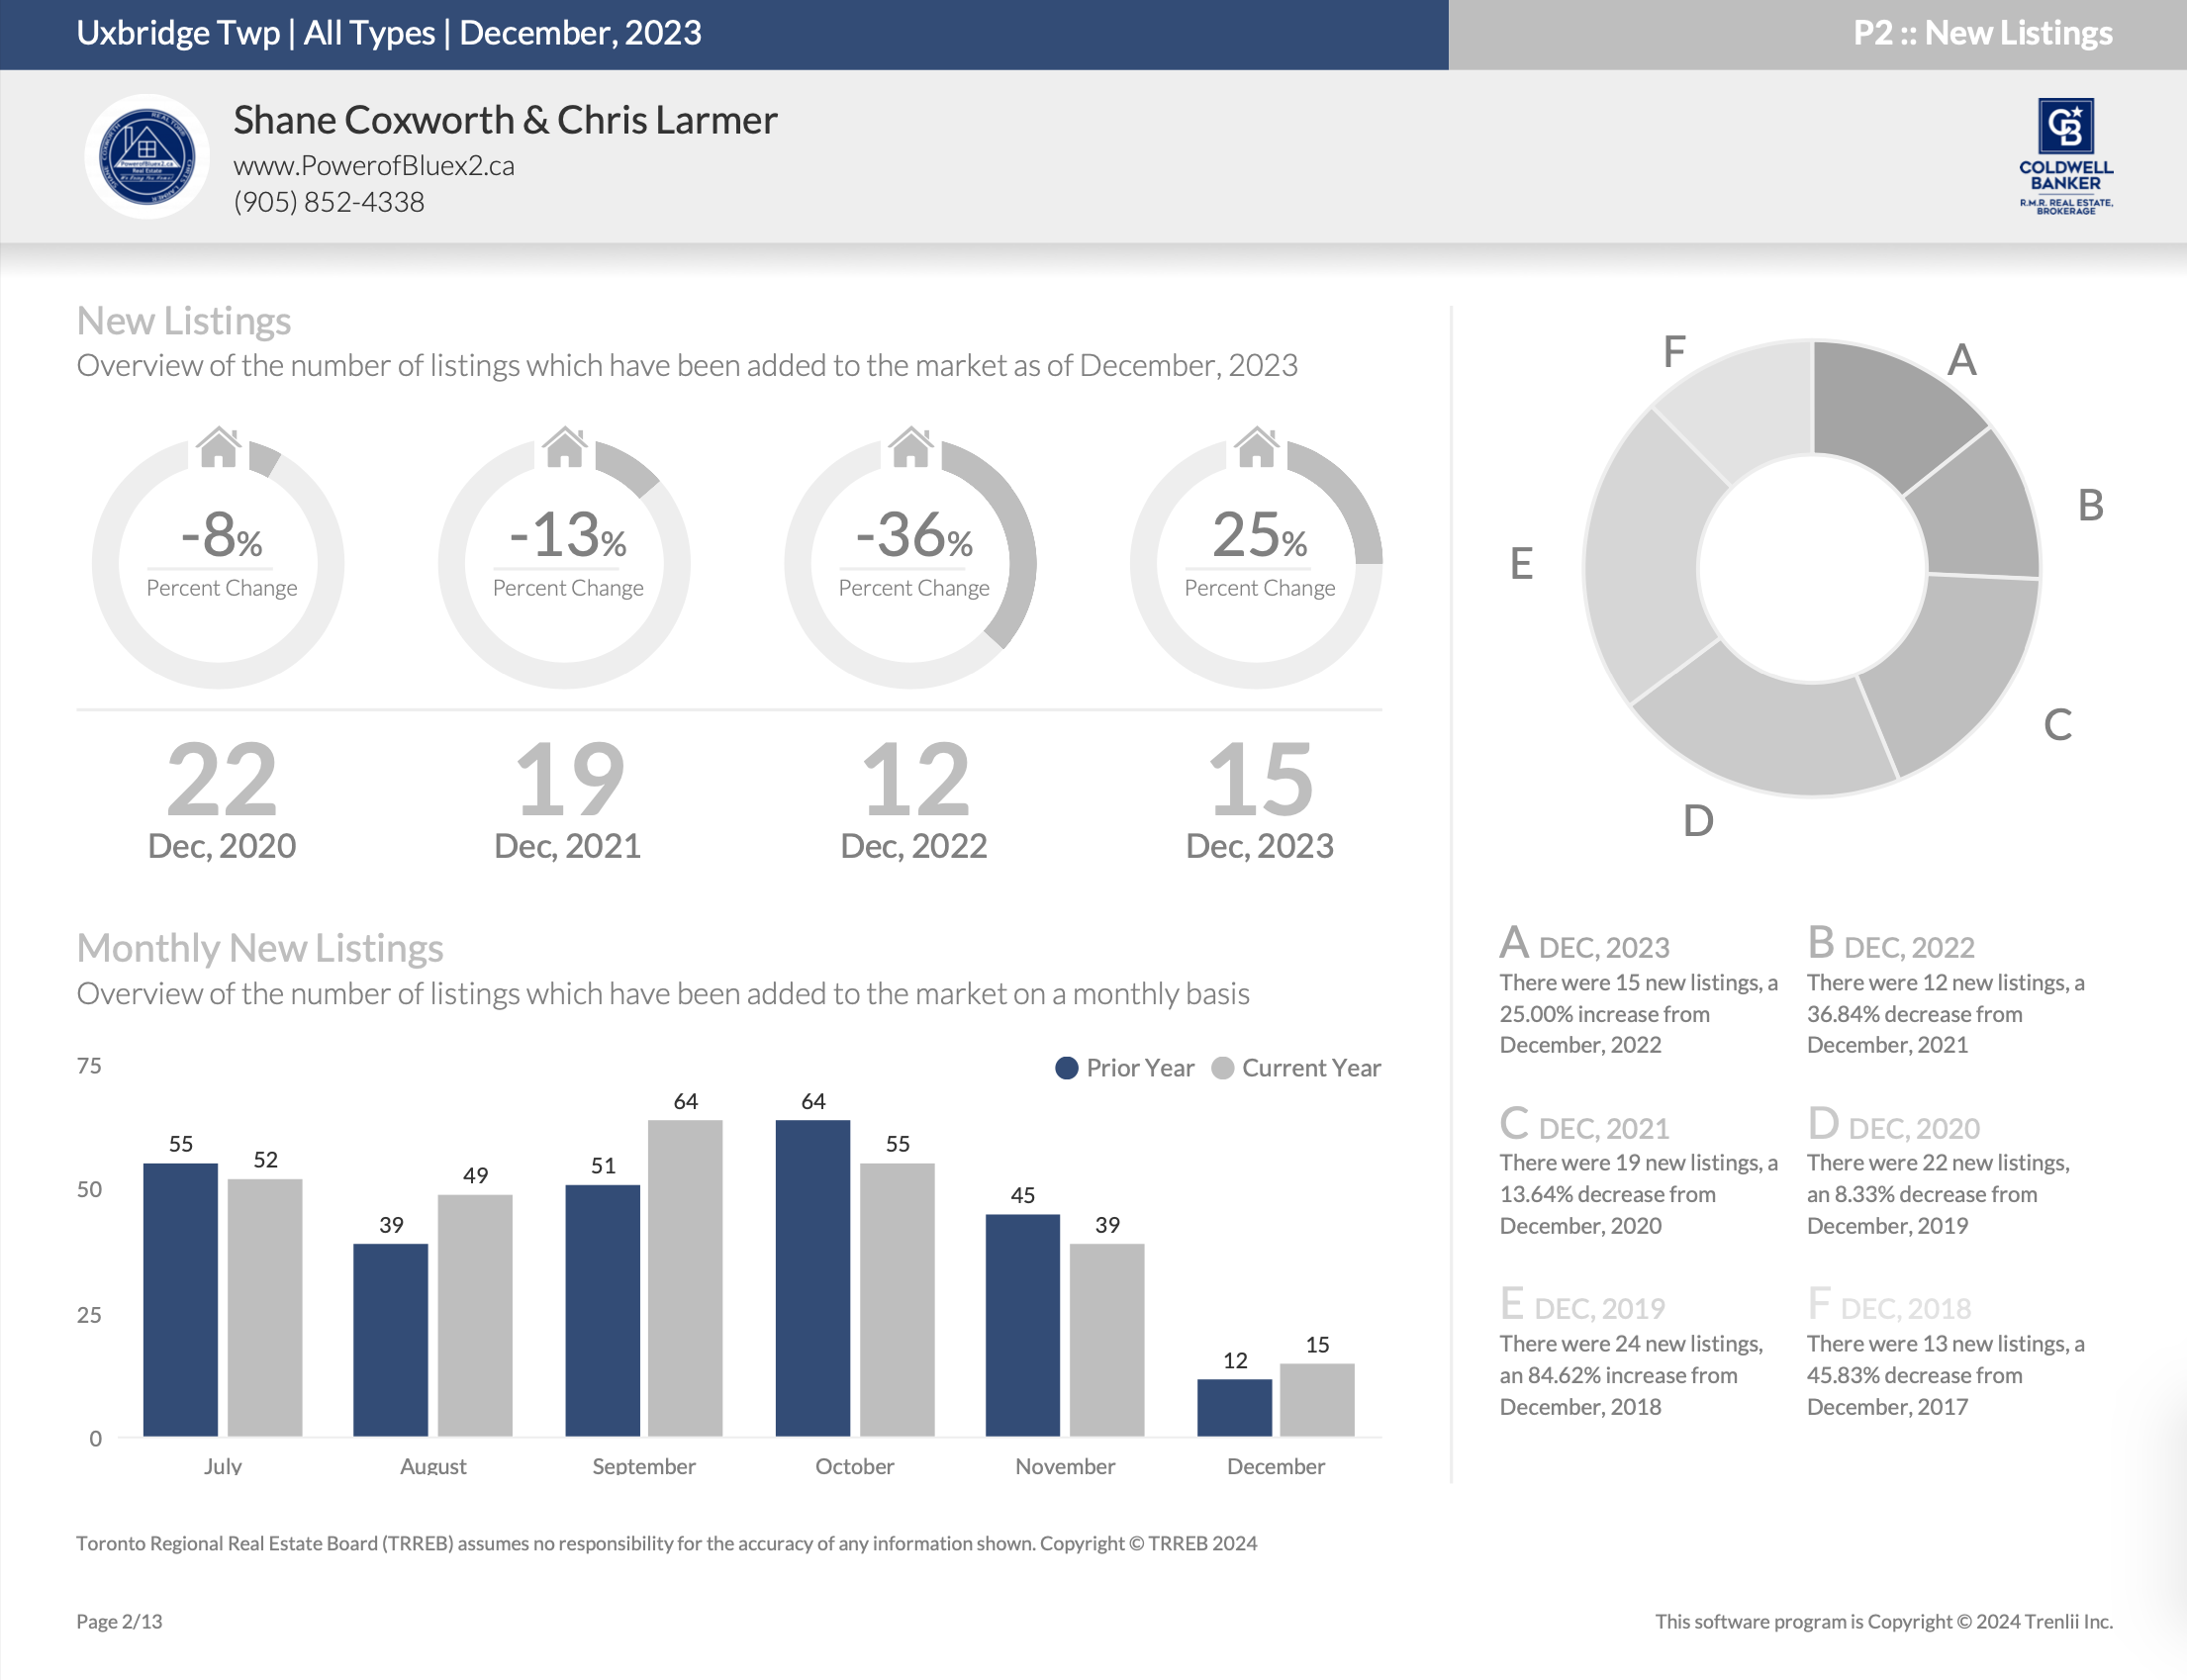
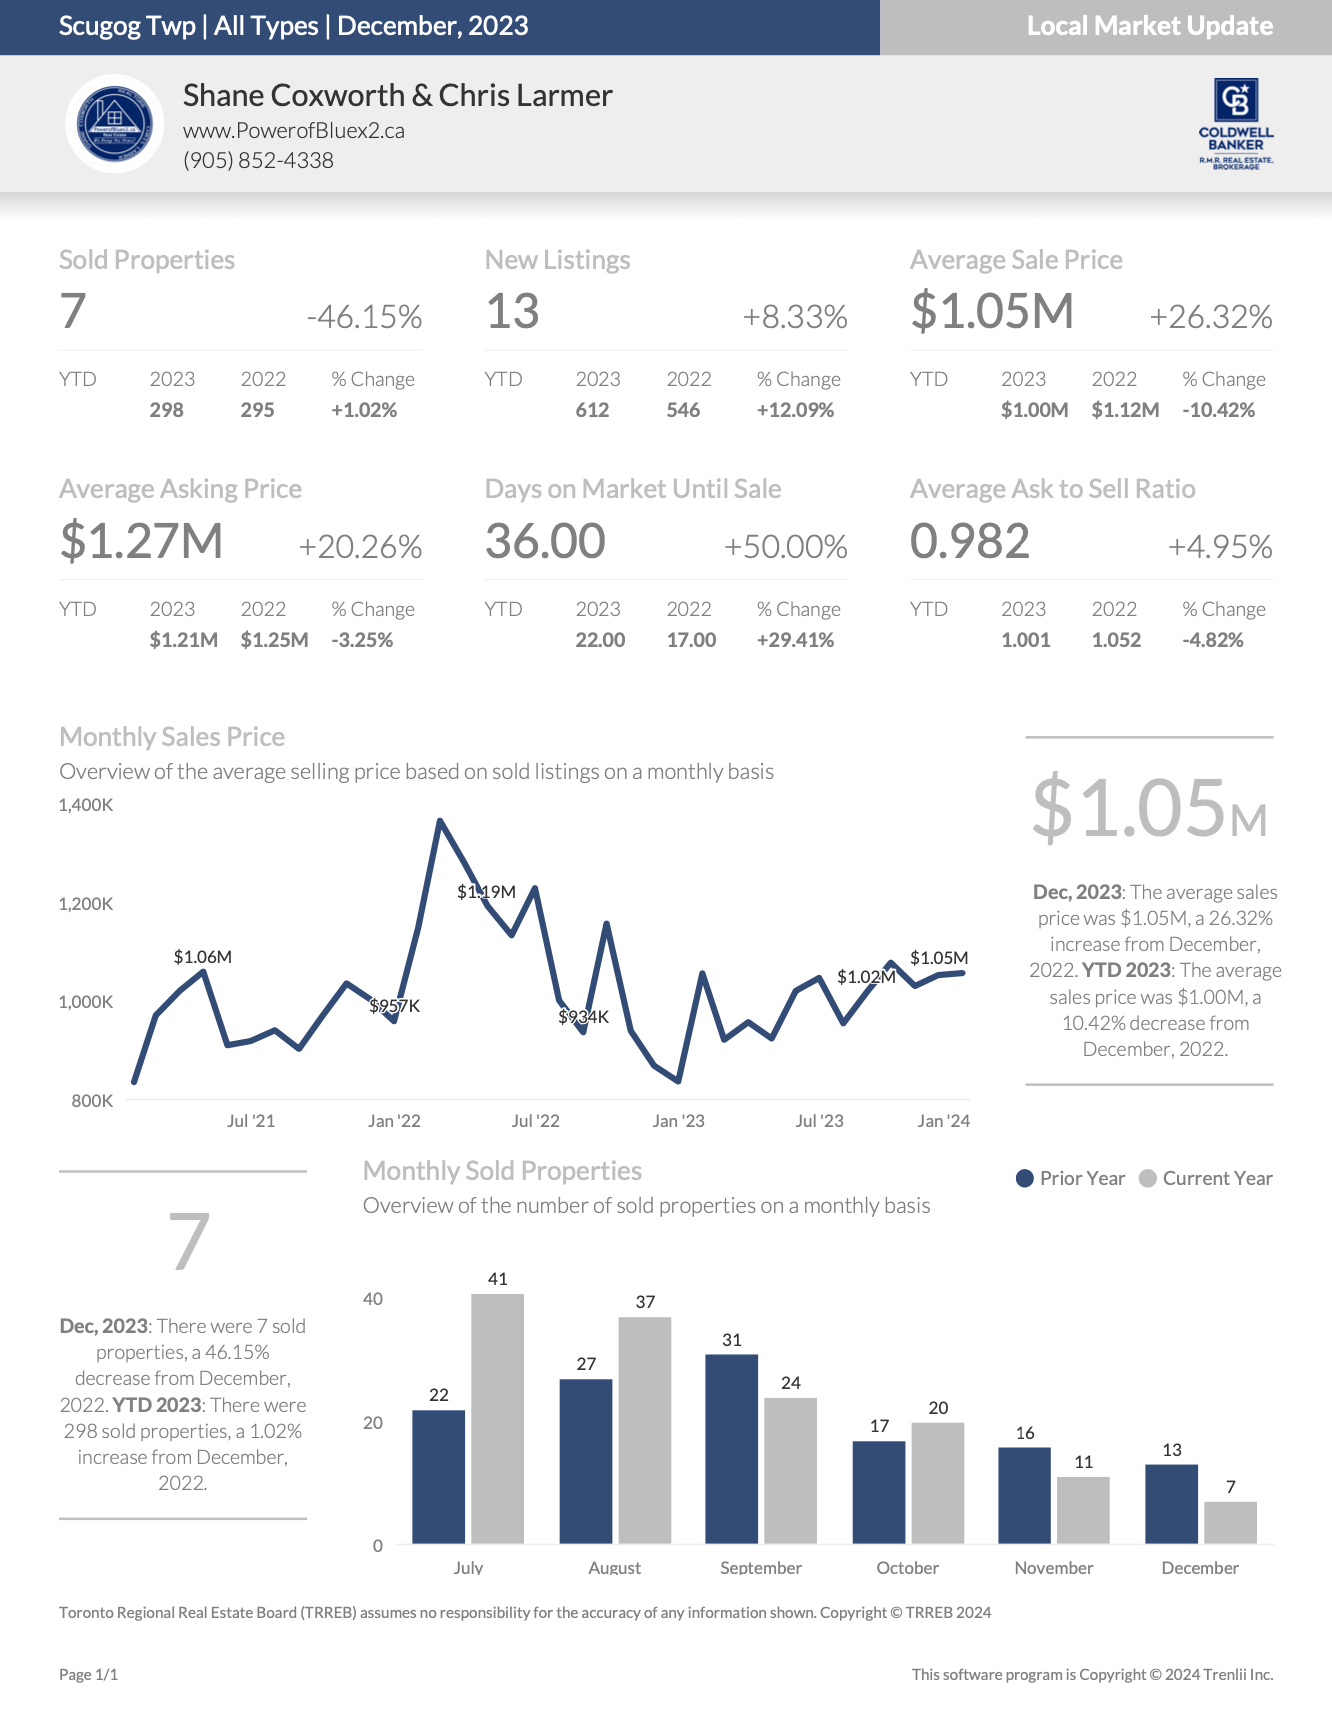
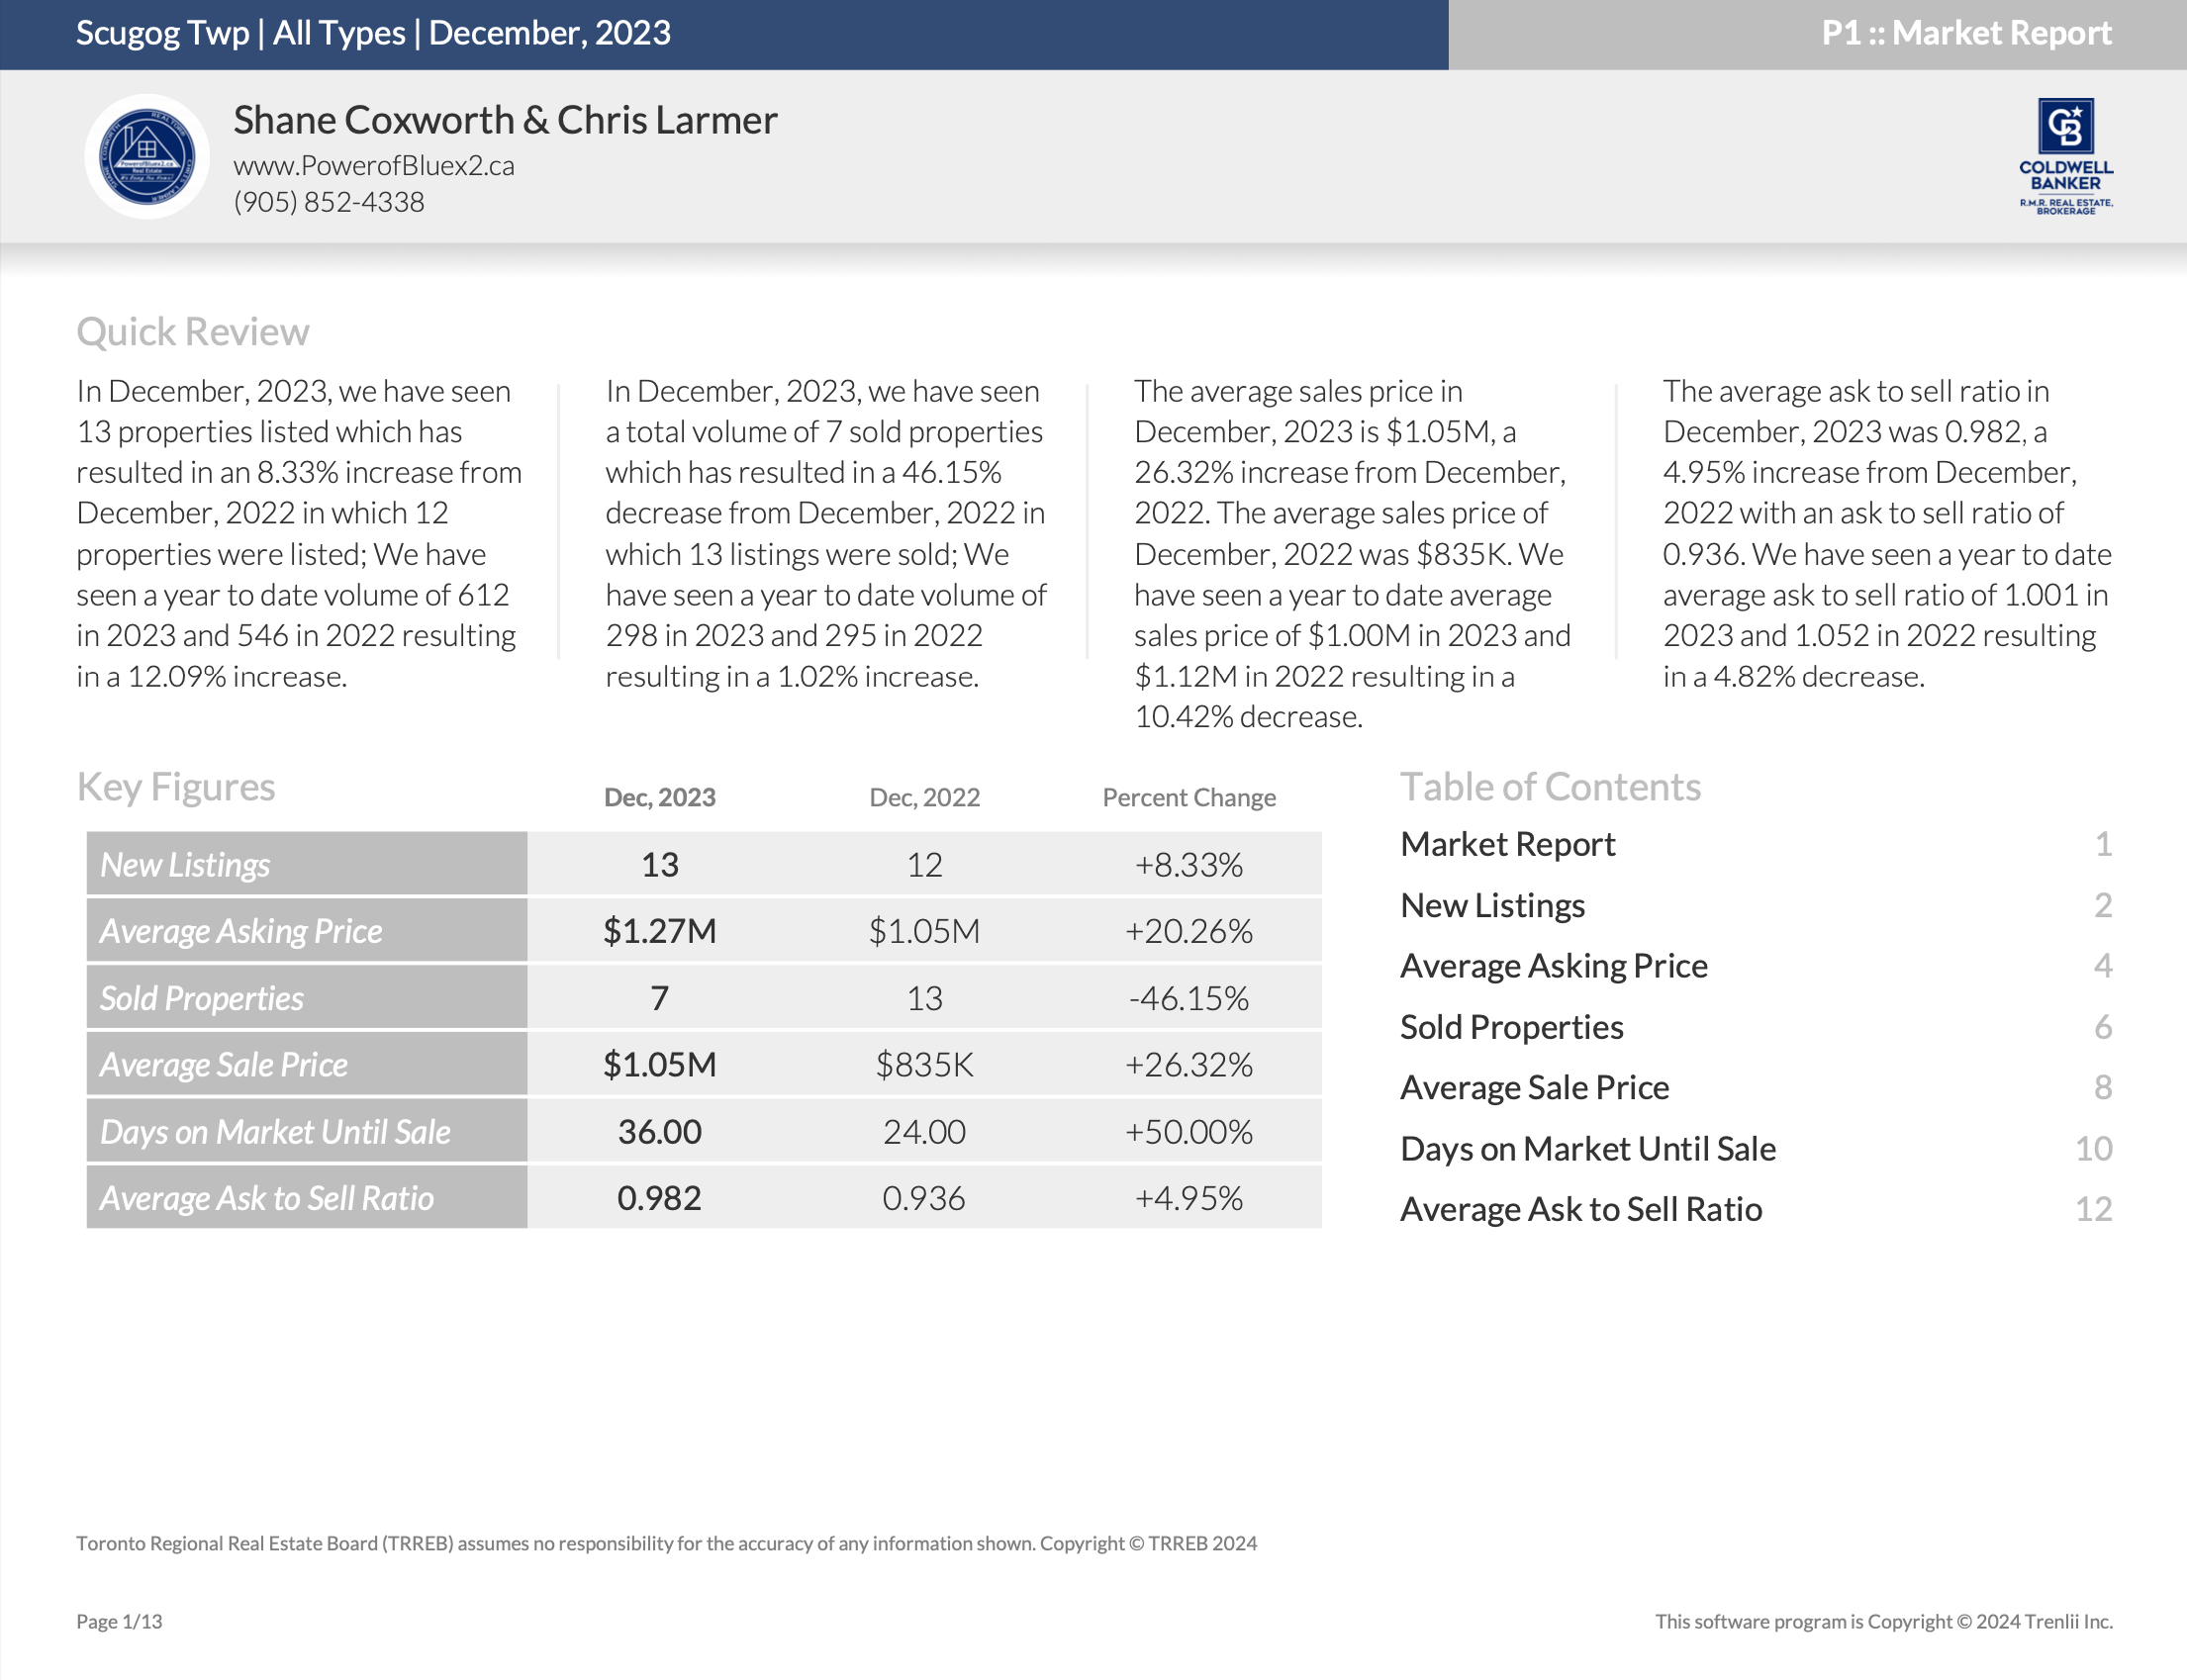
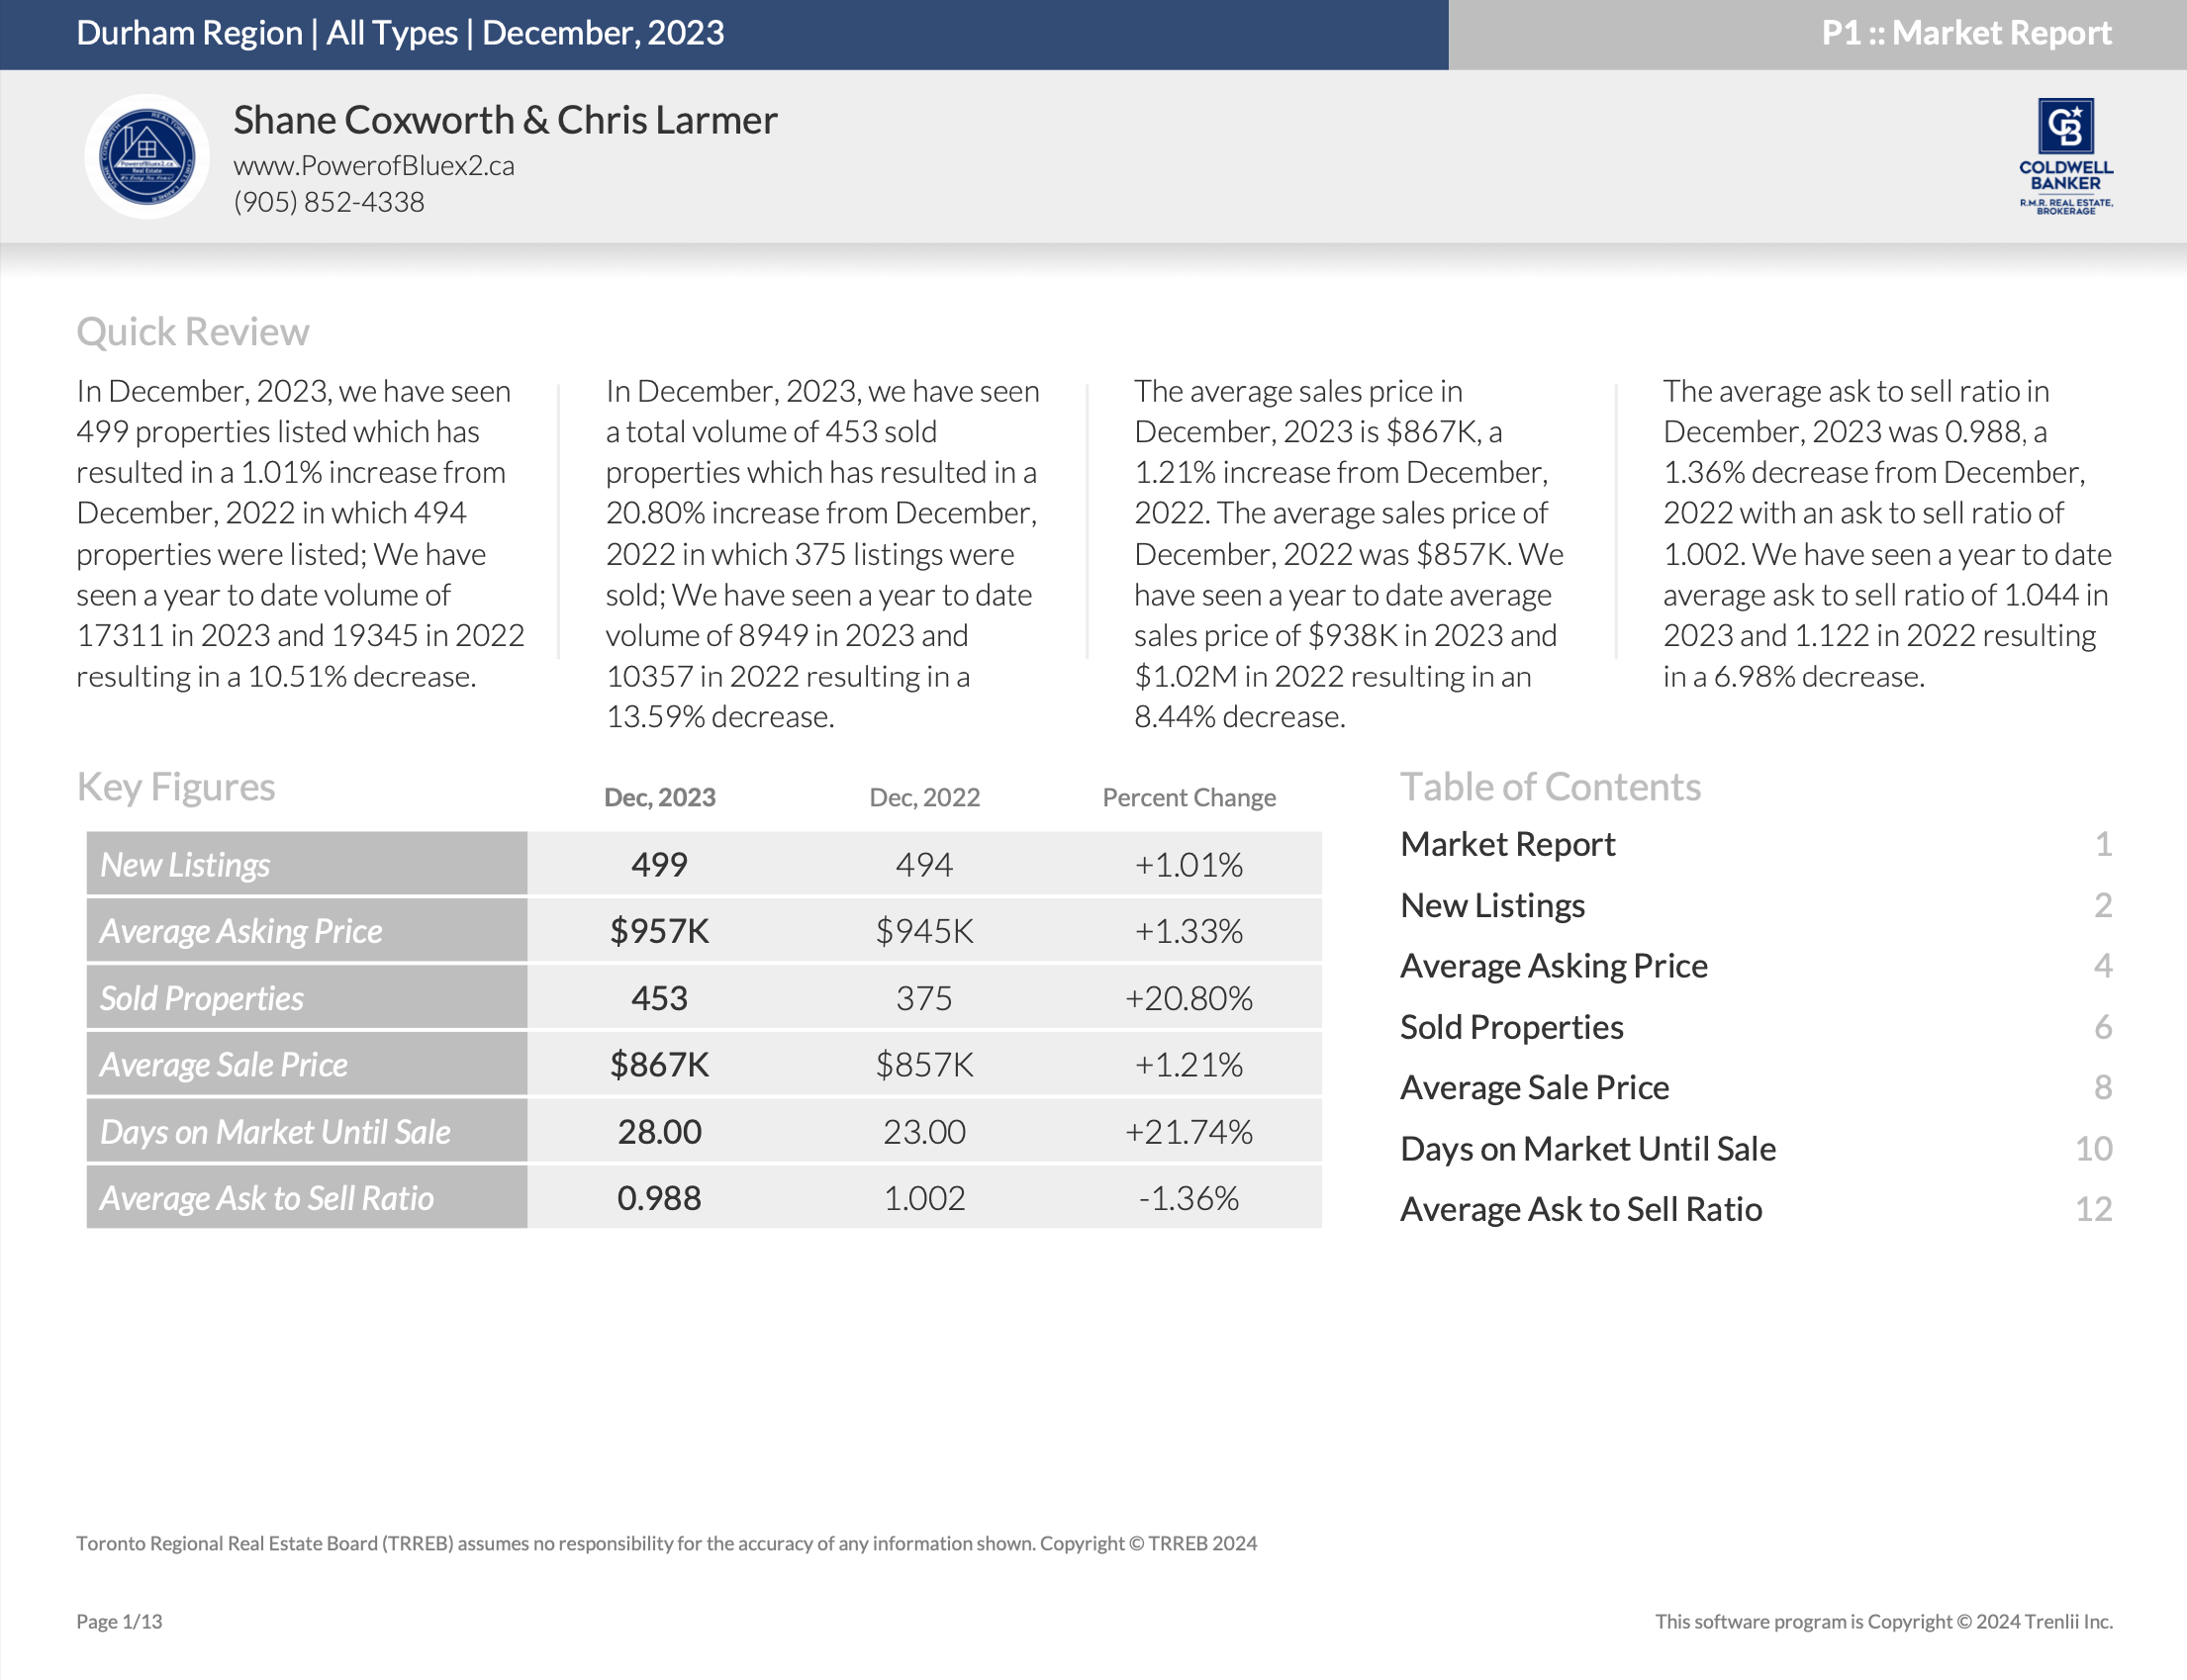
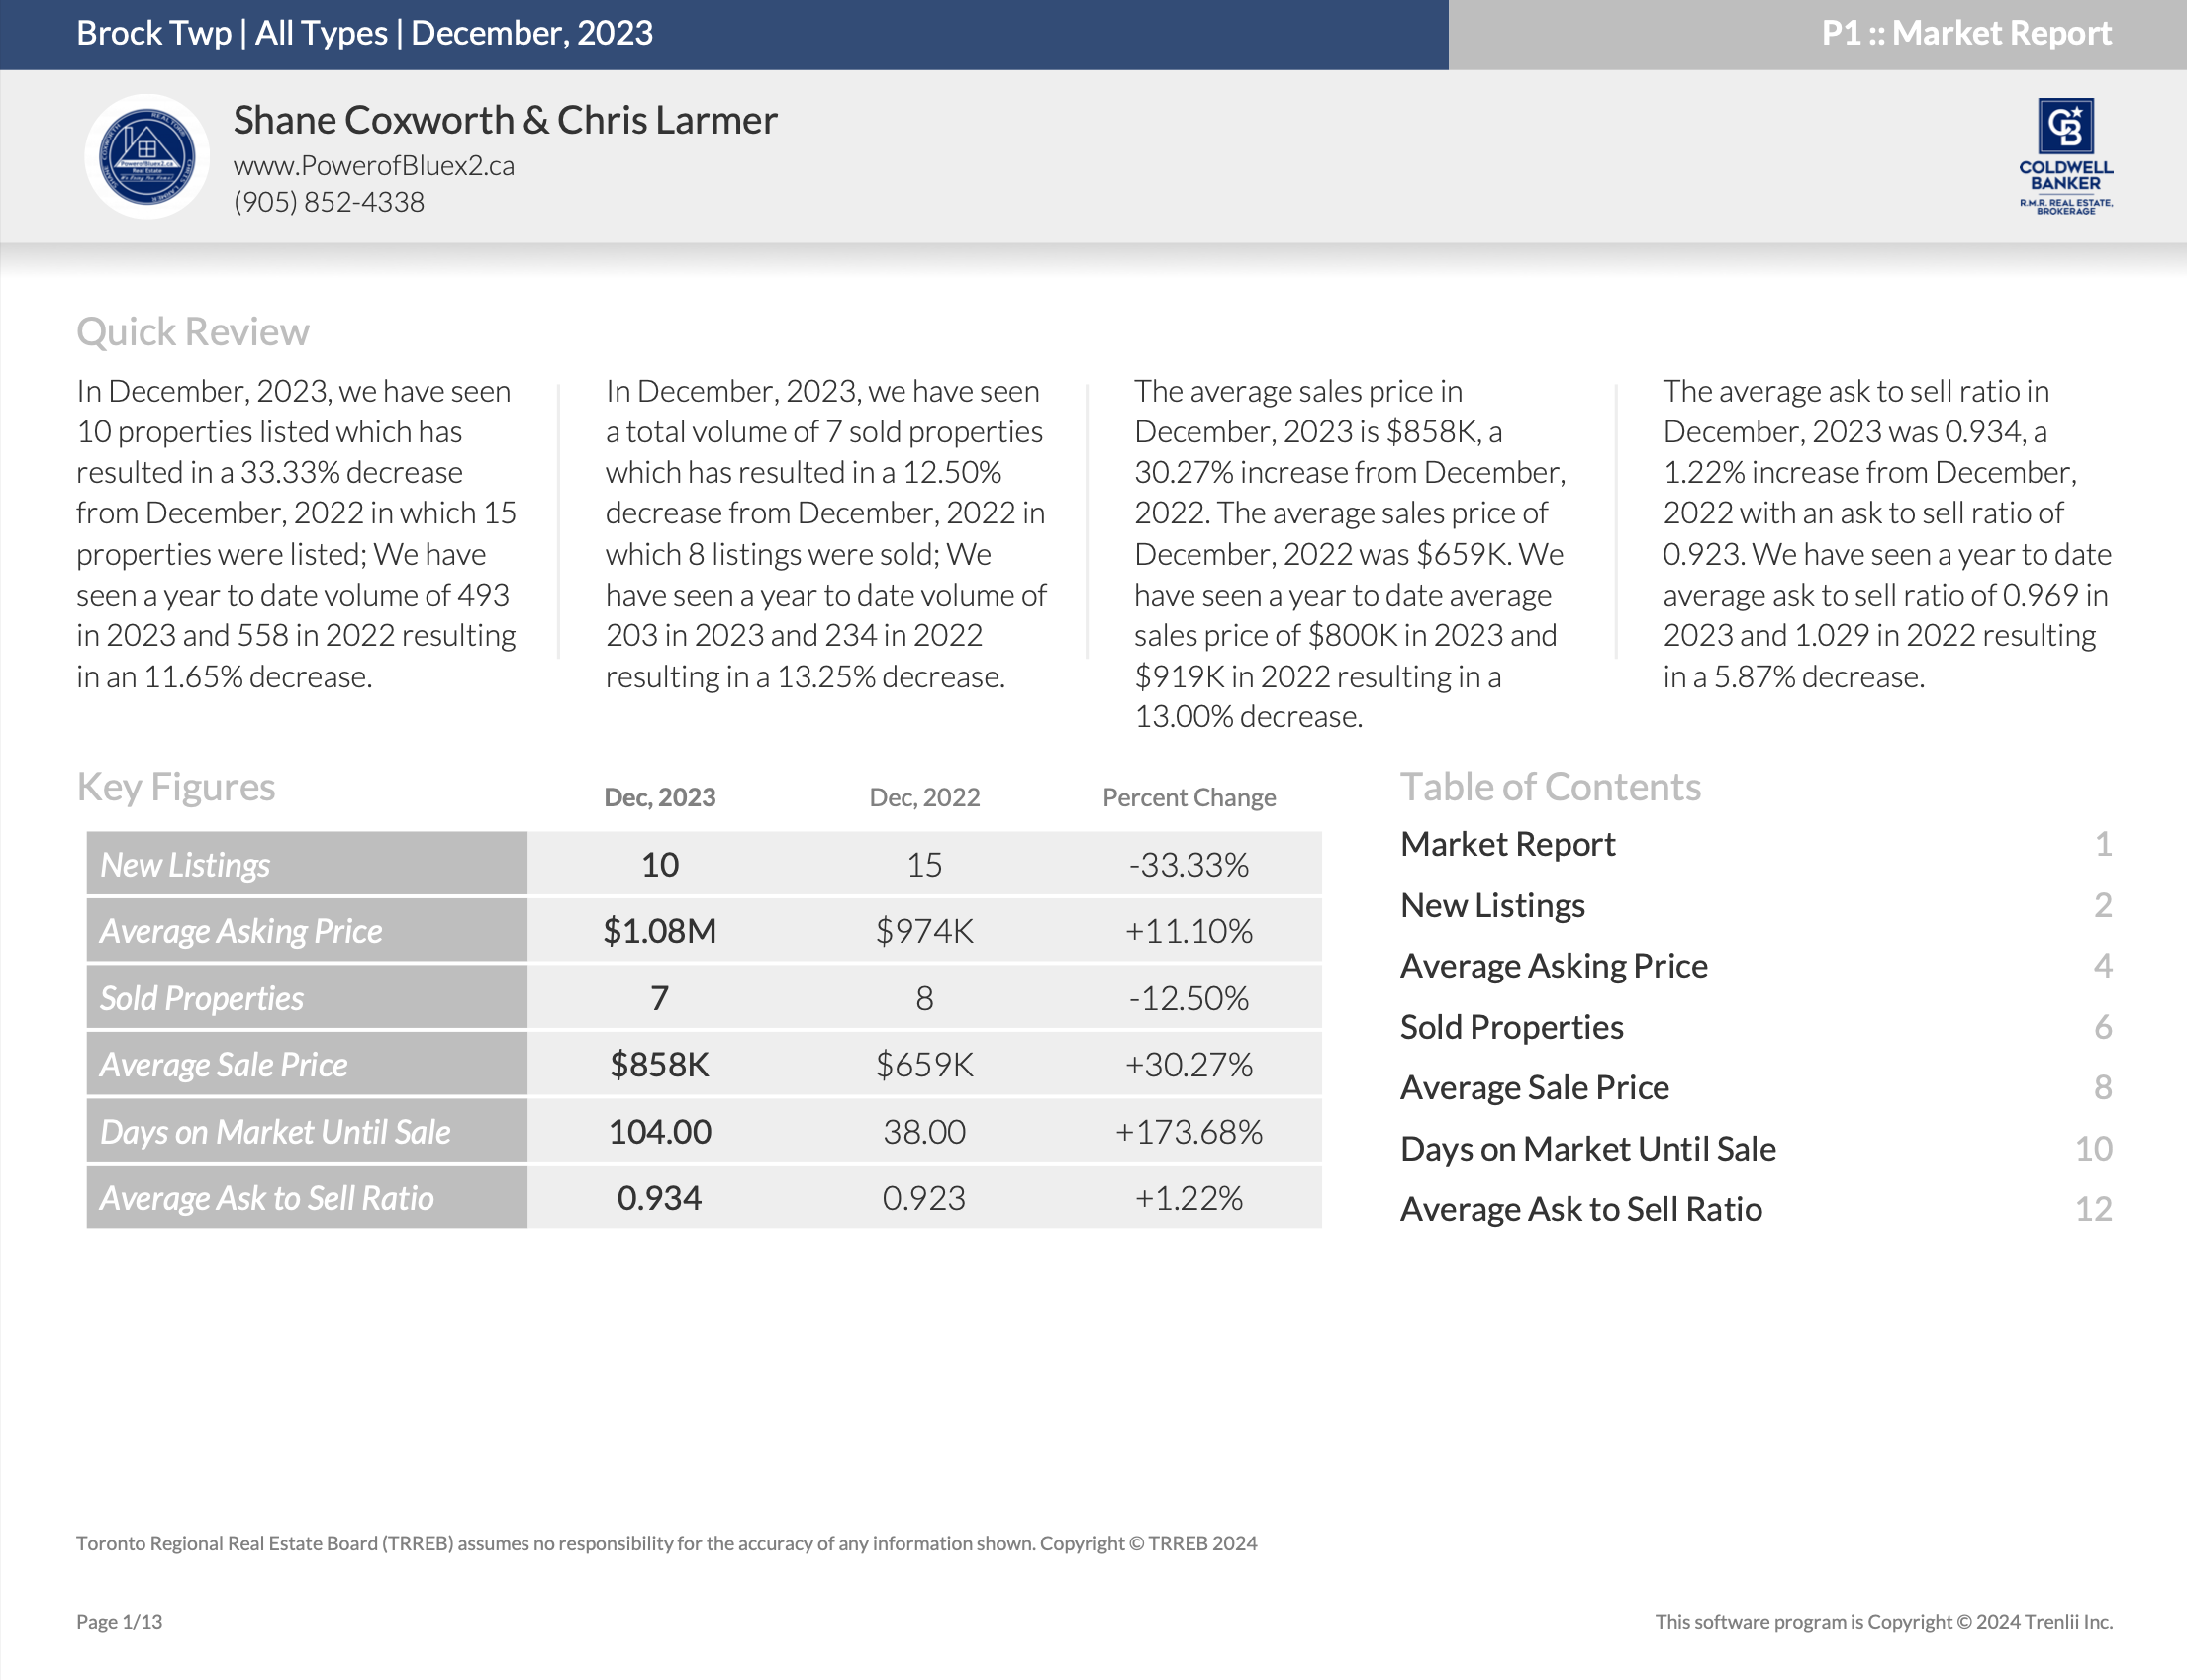
Quick Review

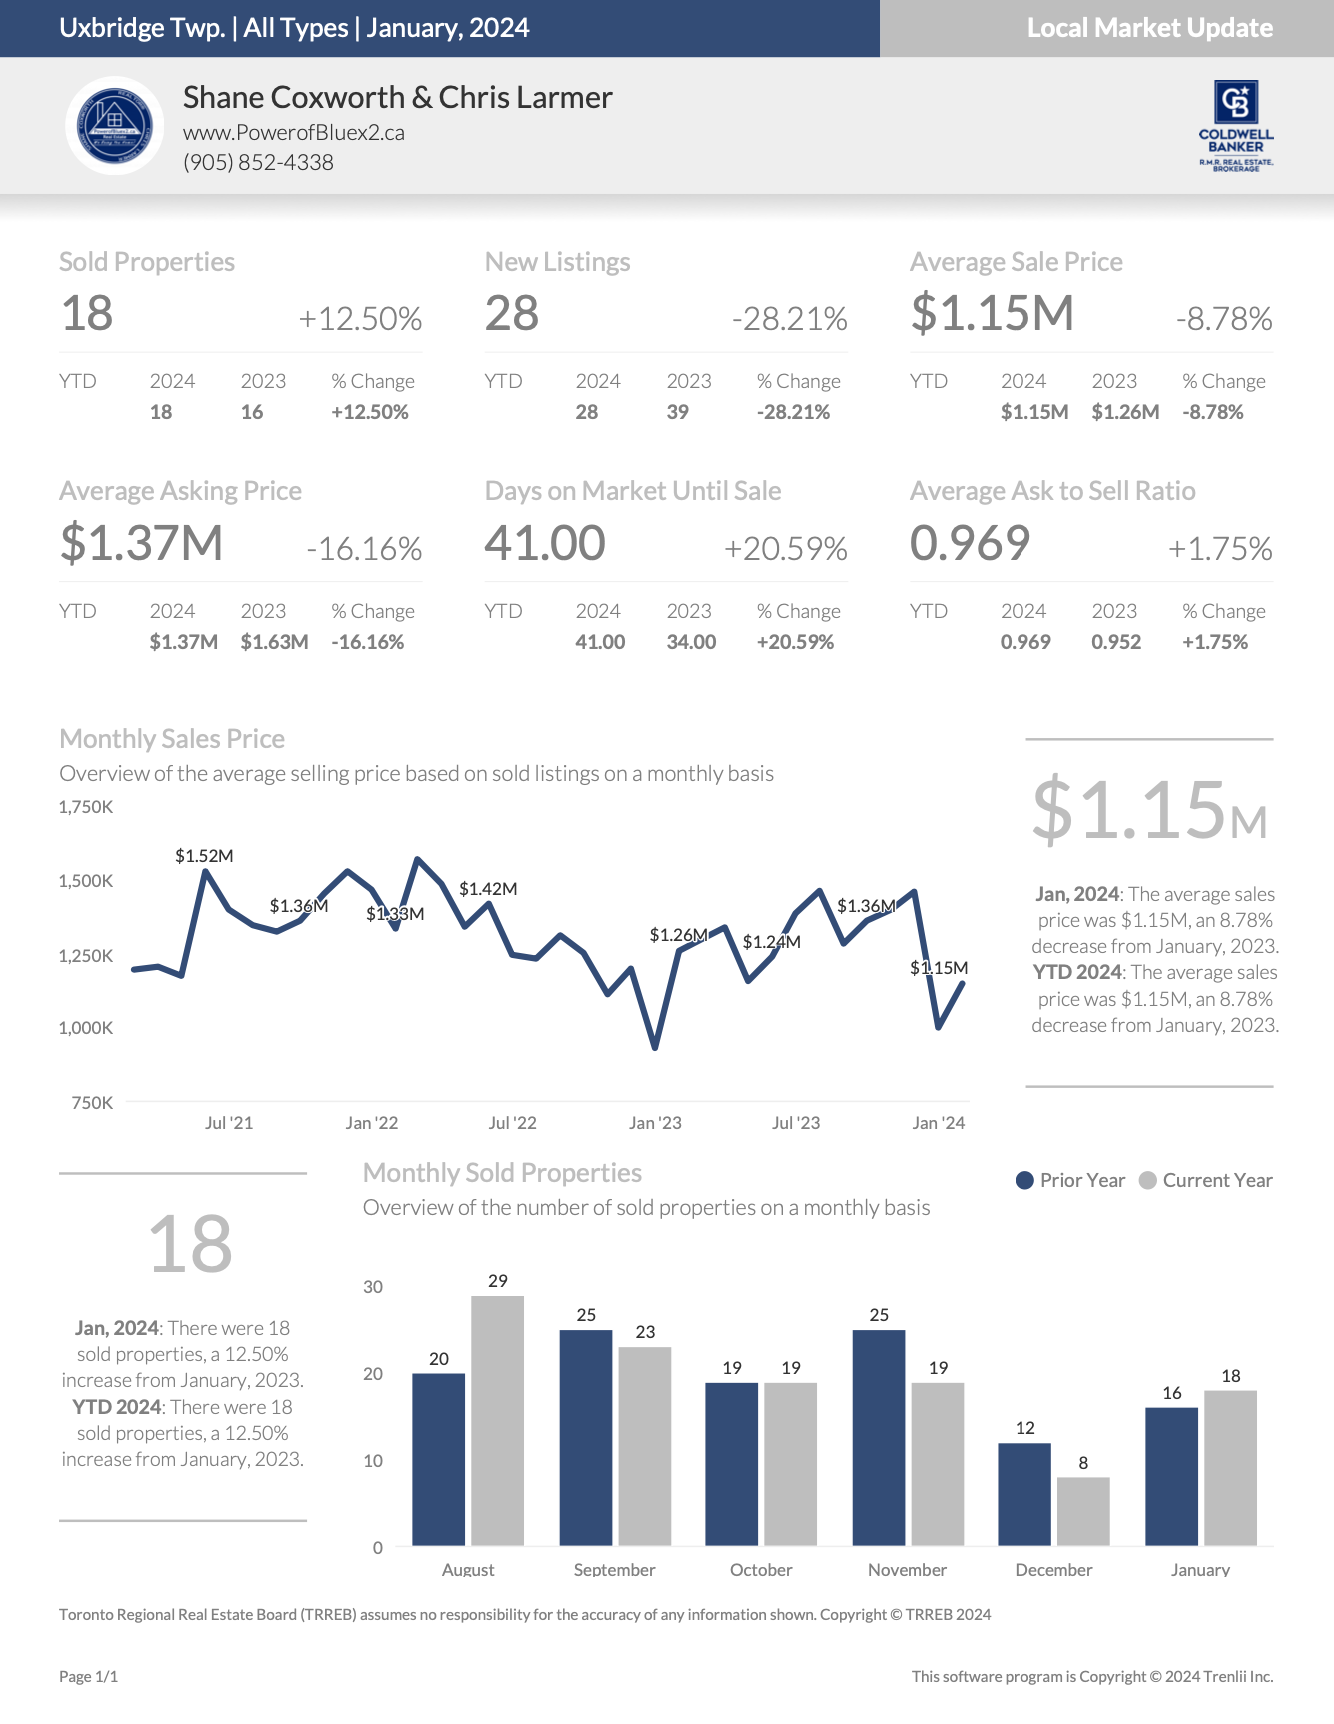
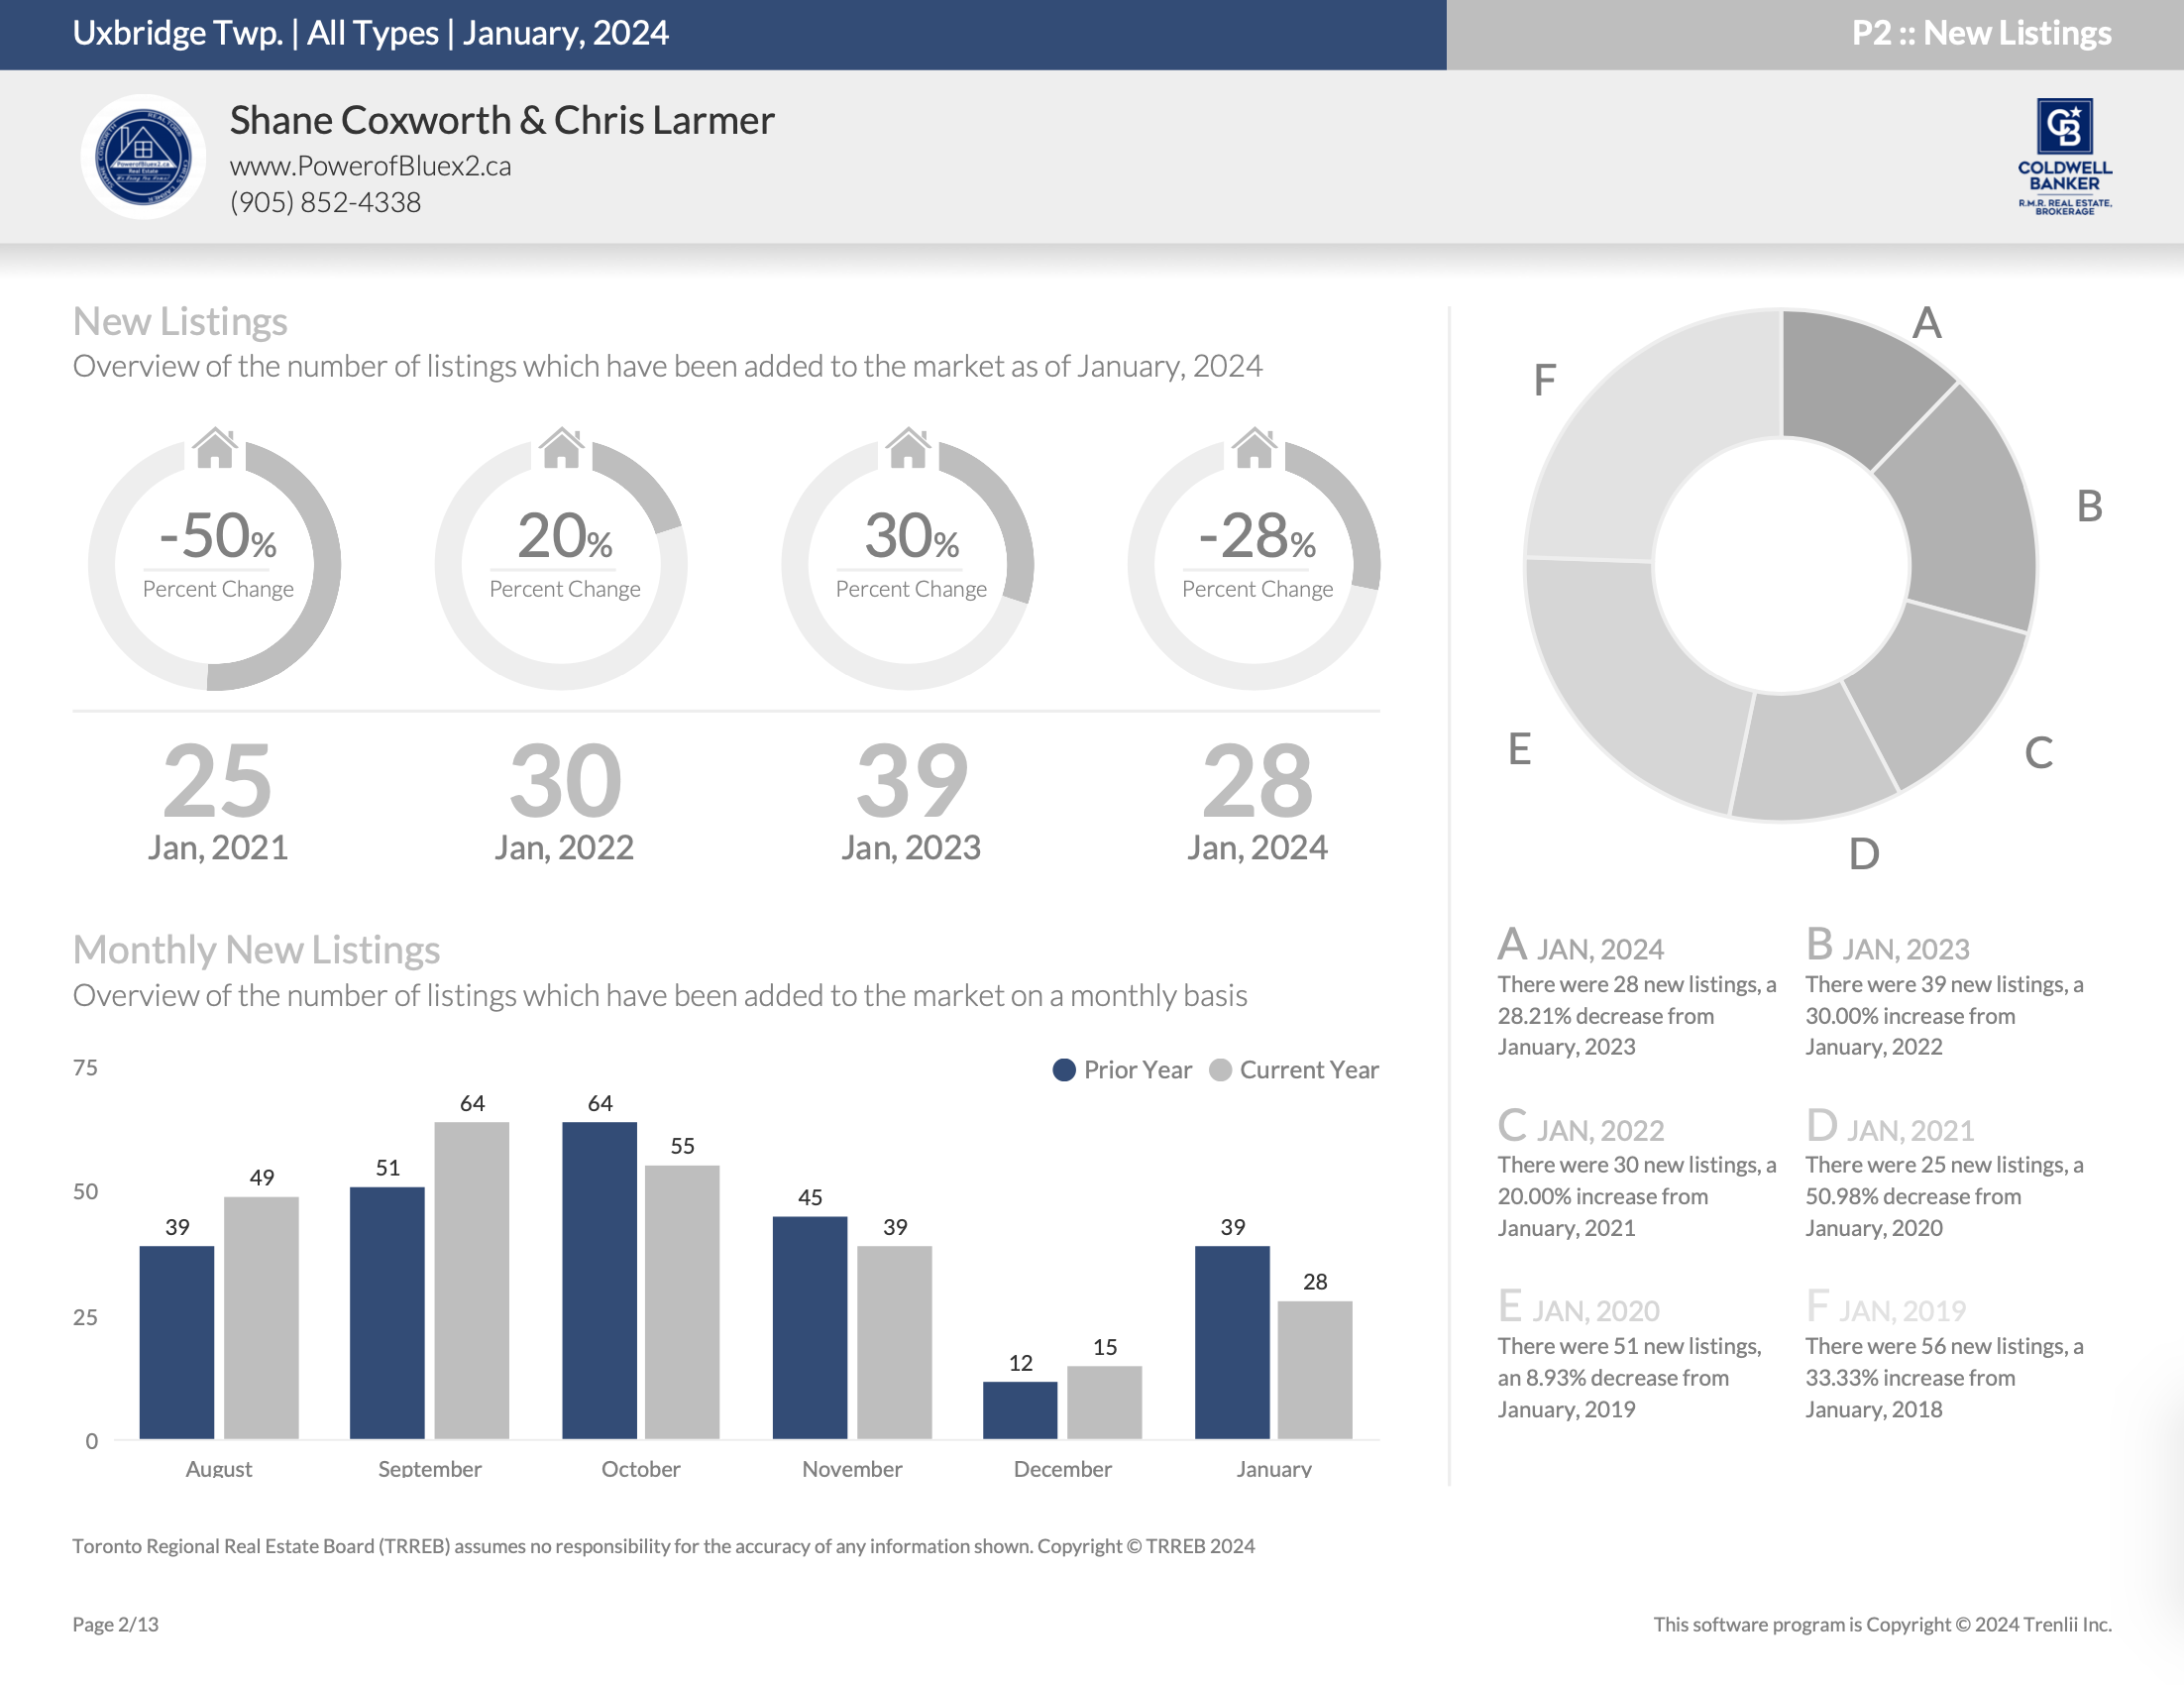
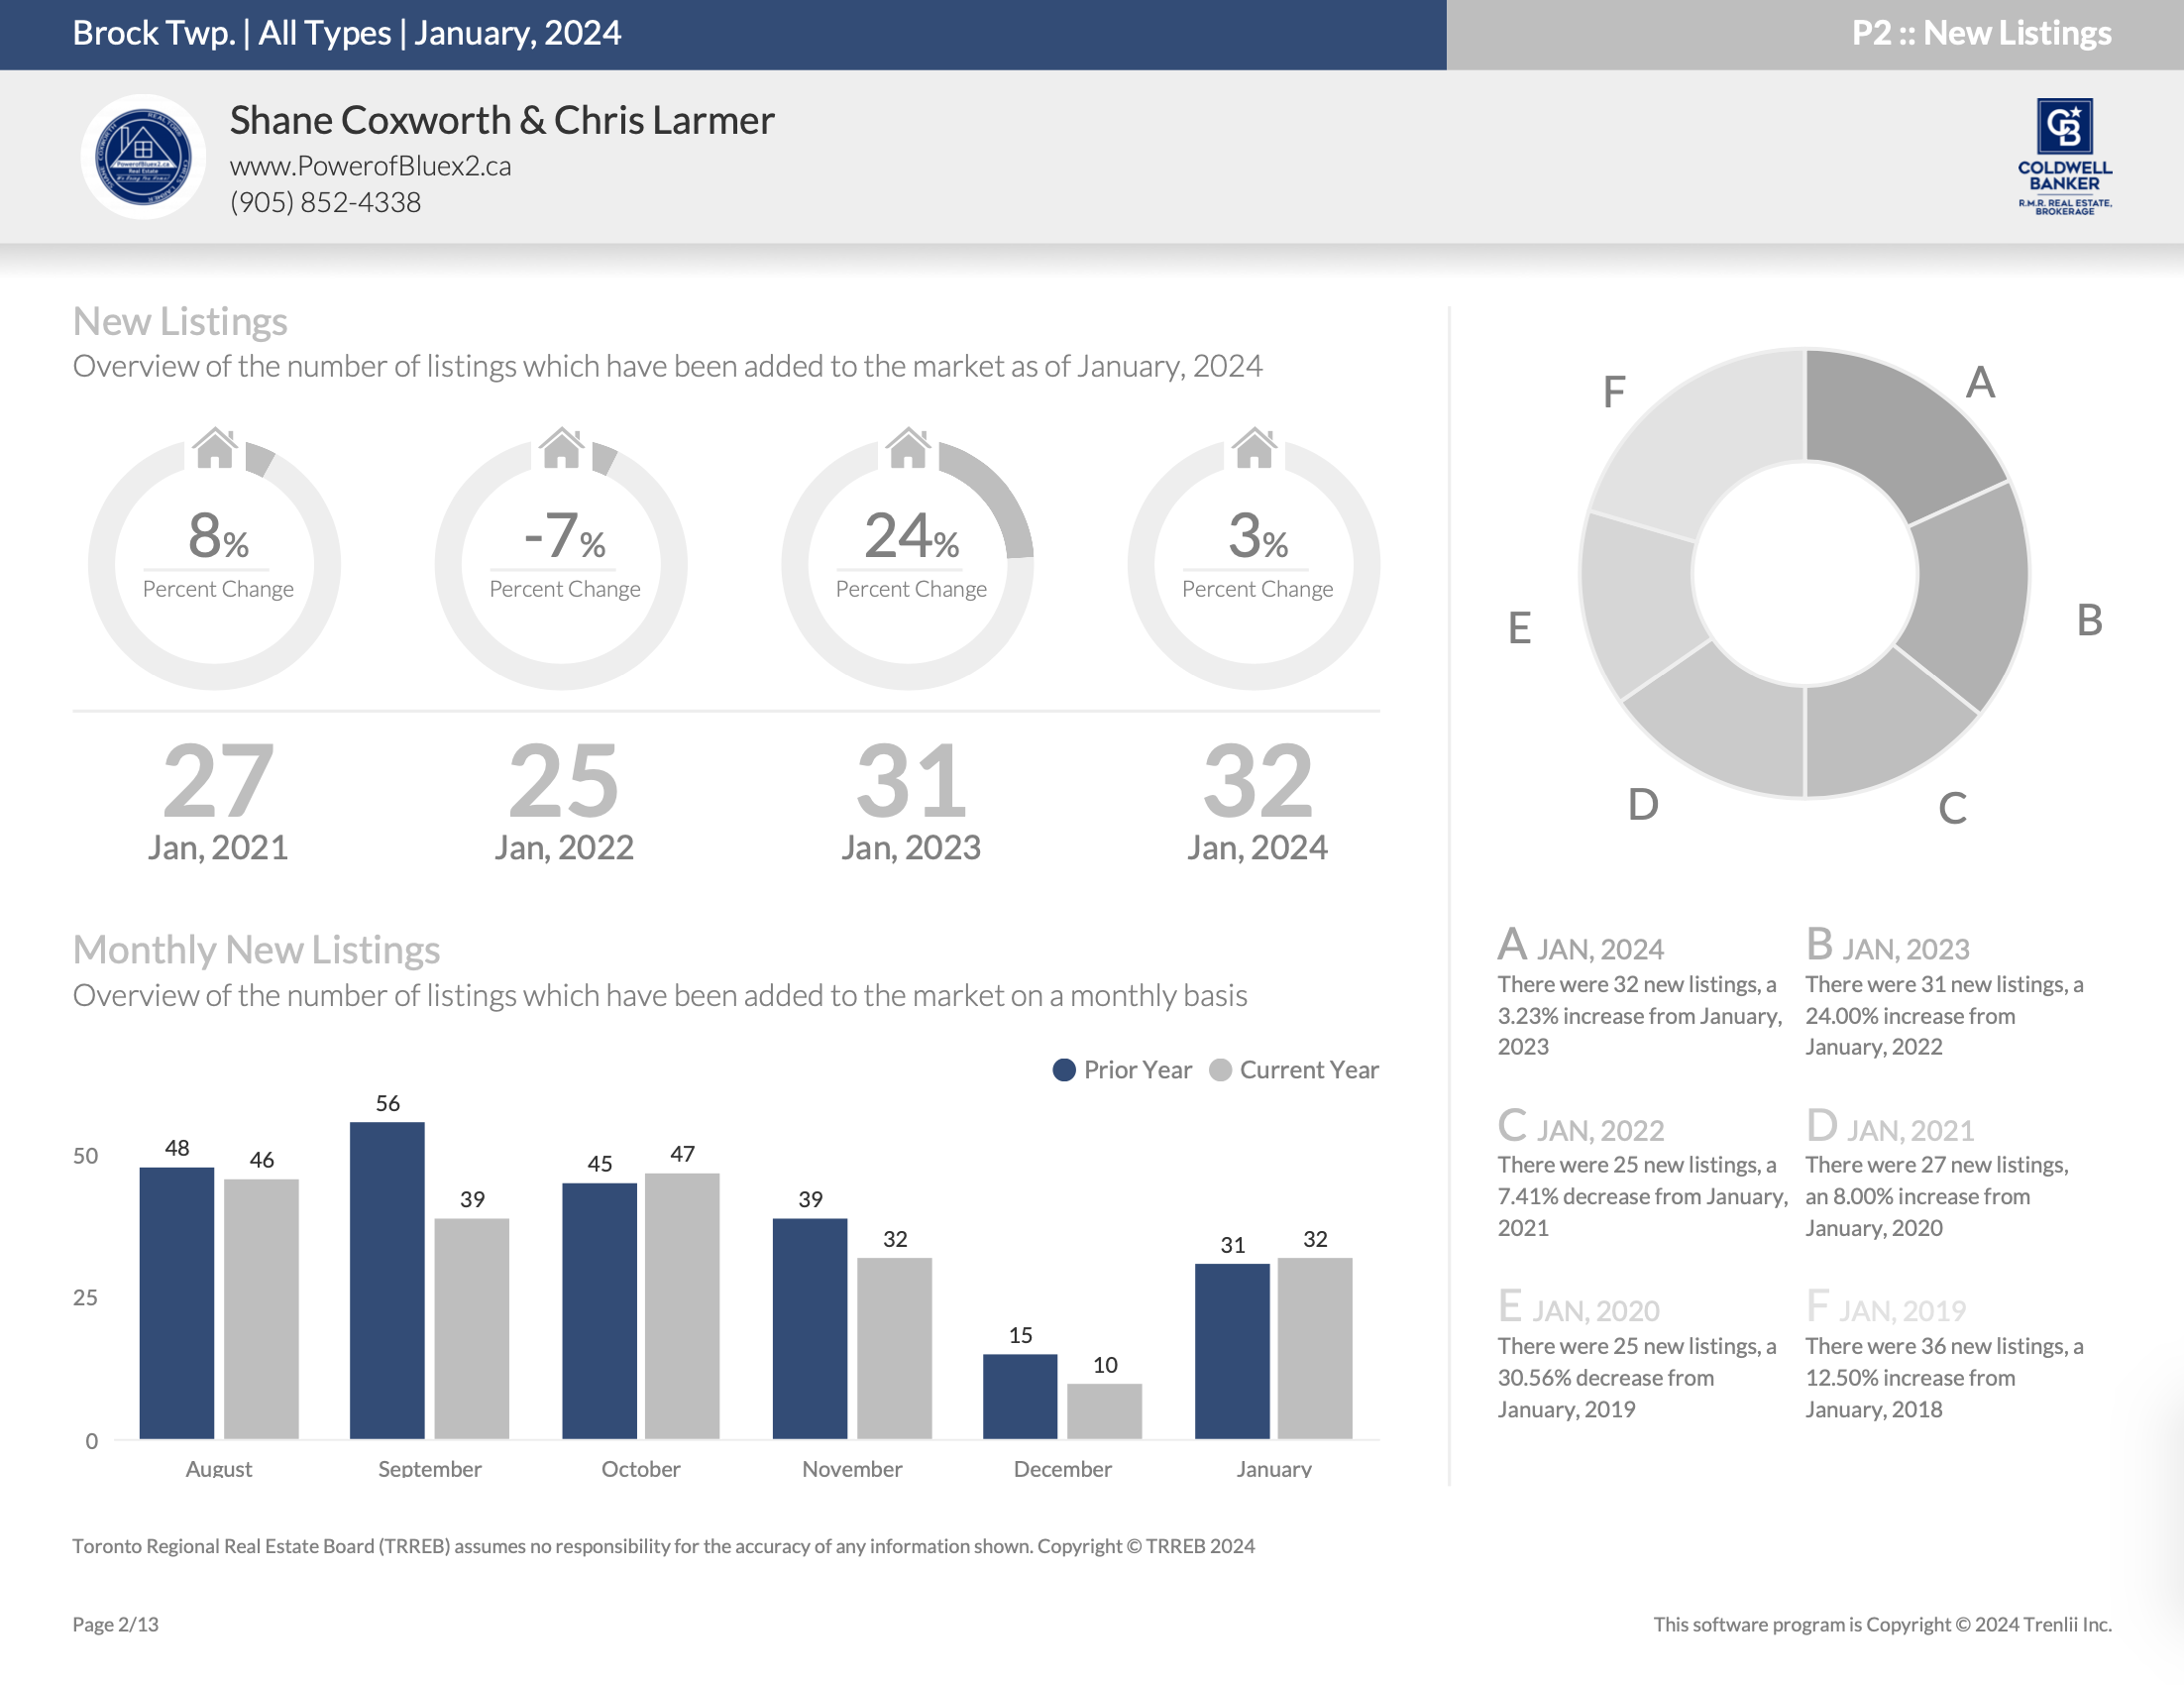
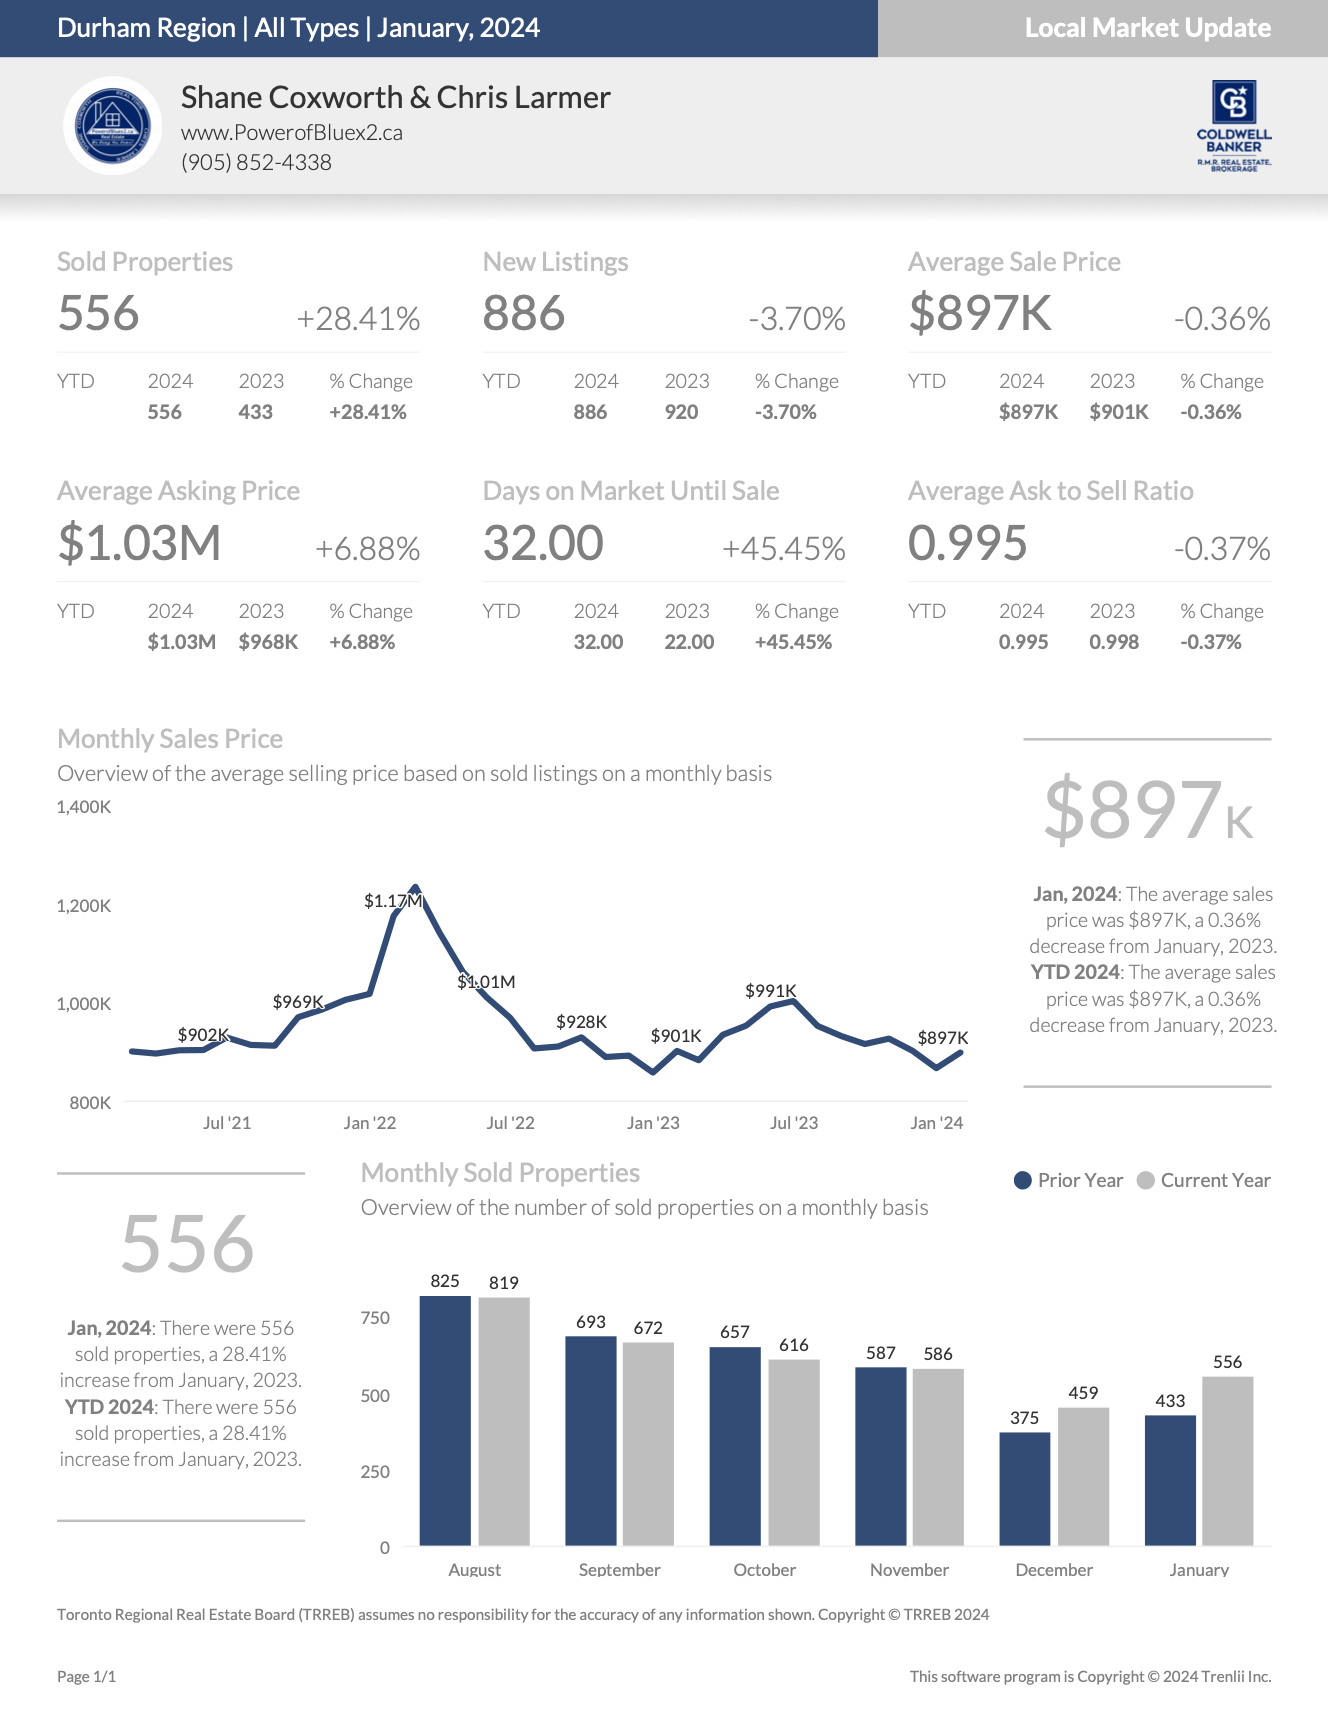
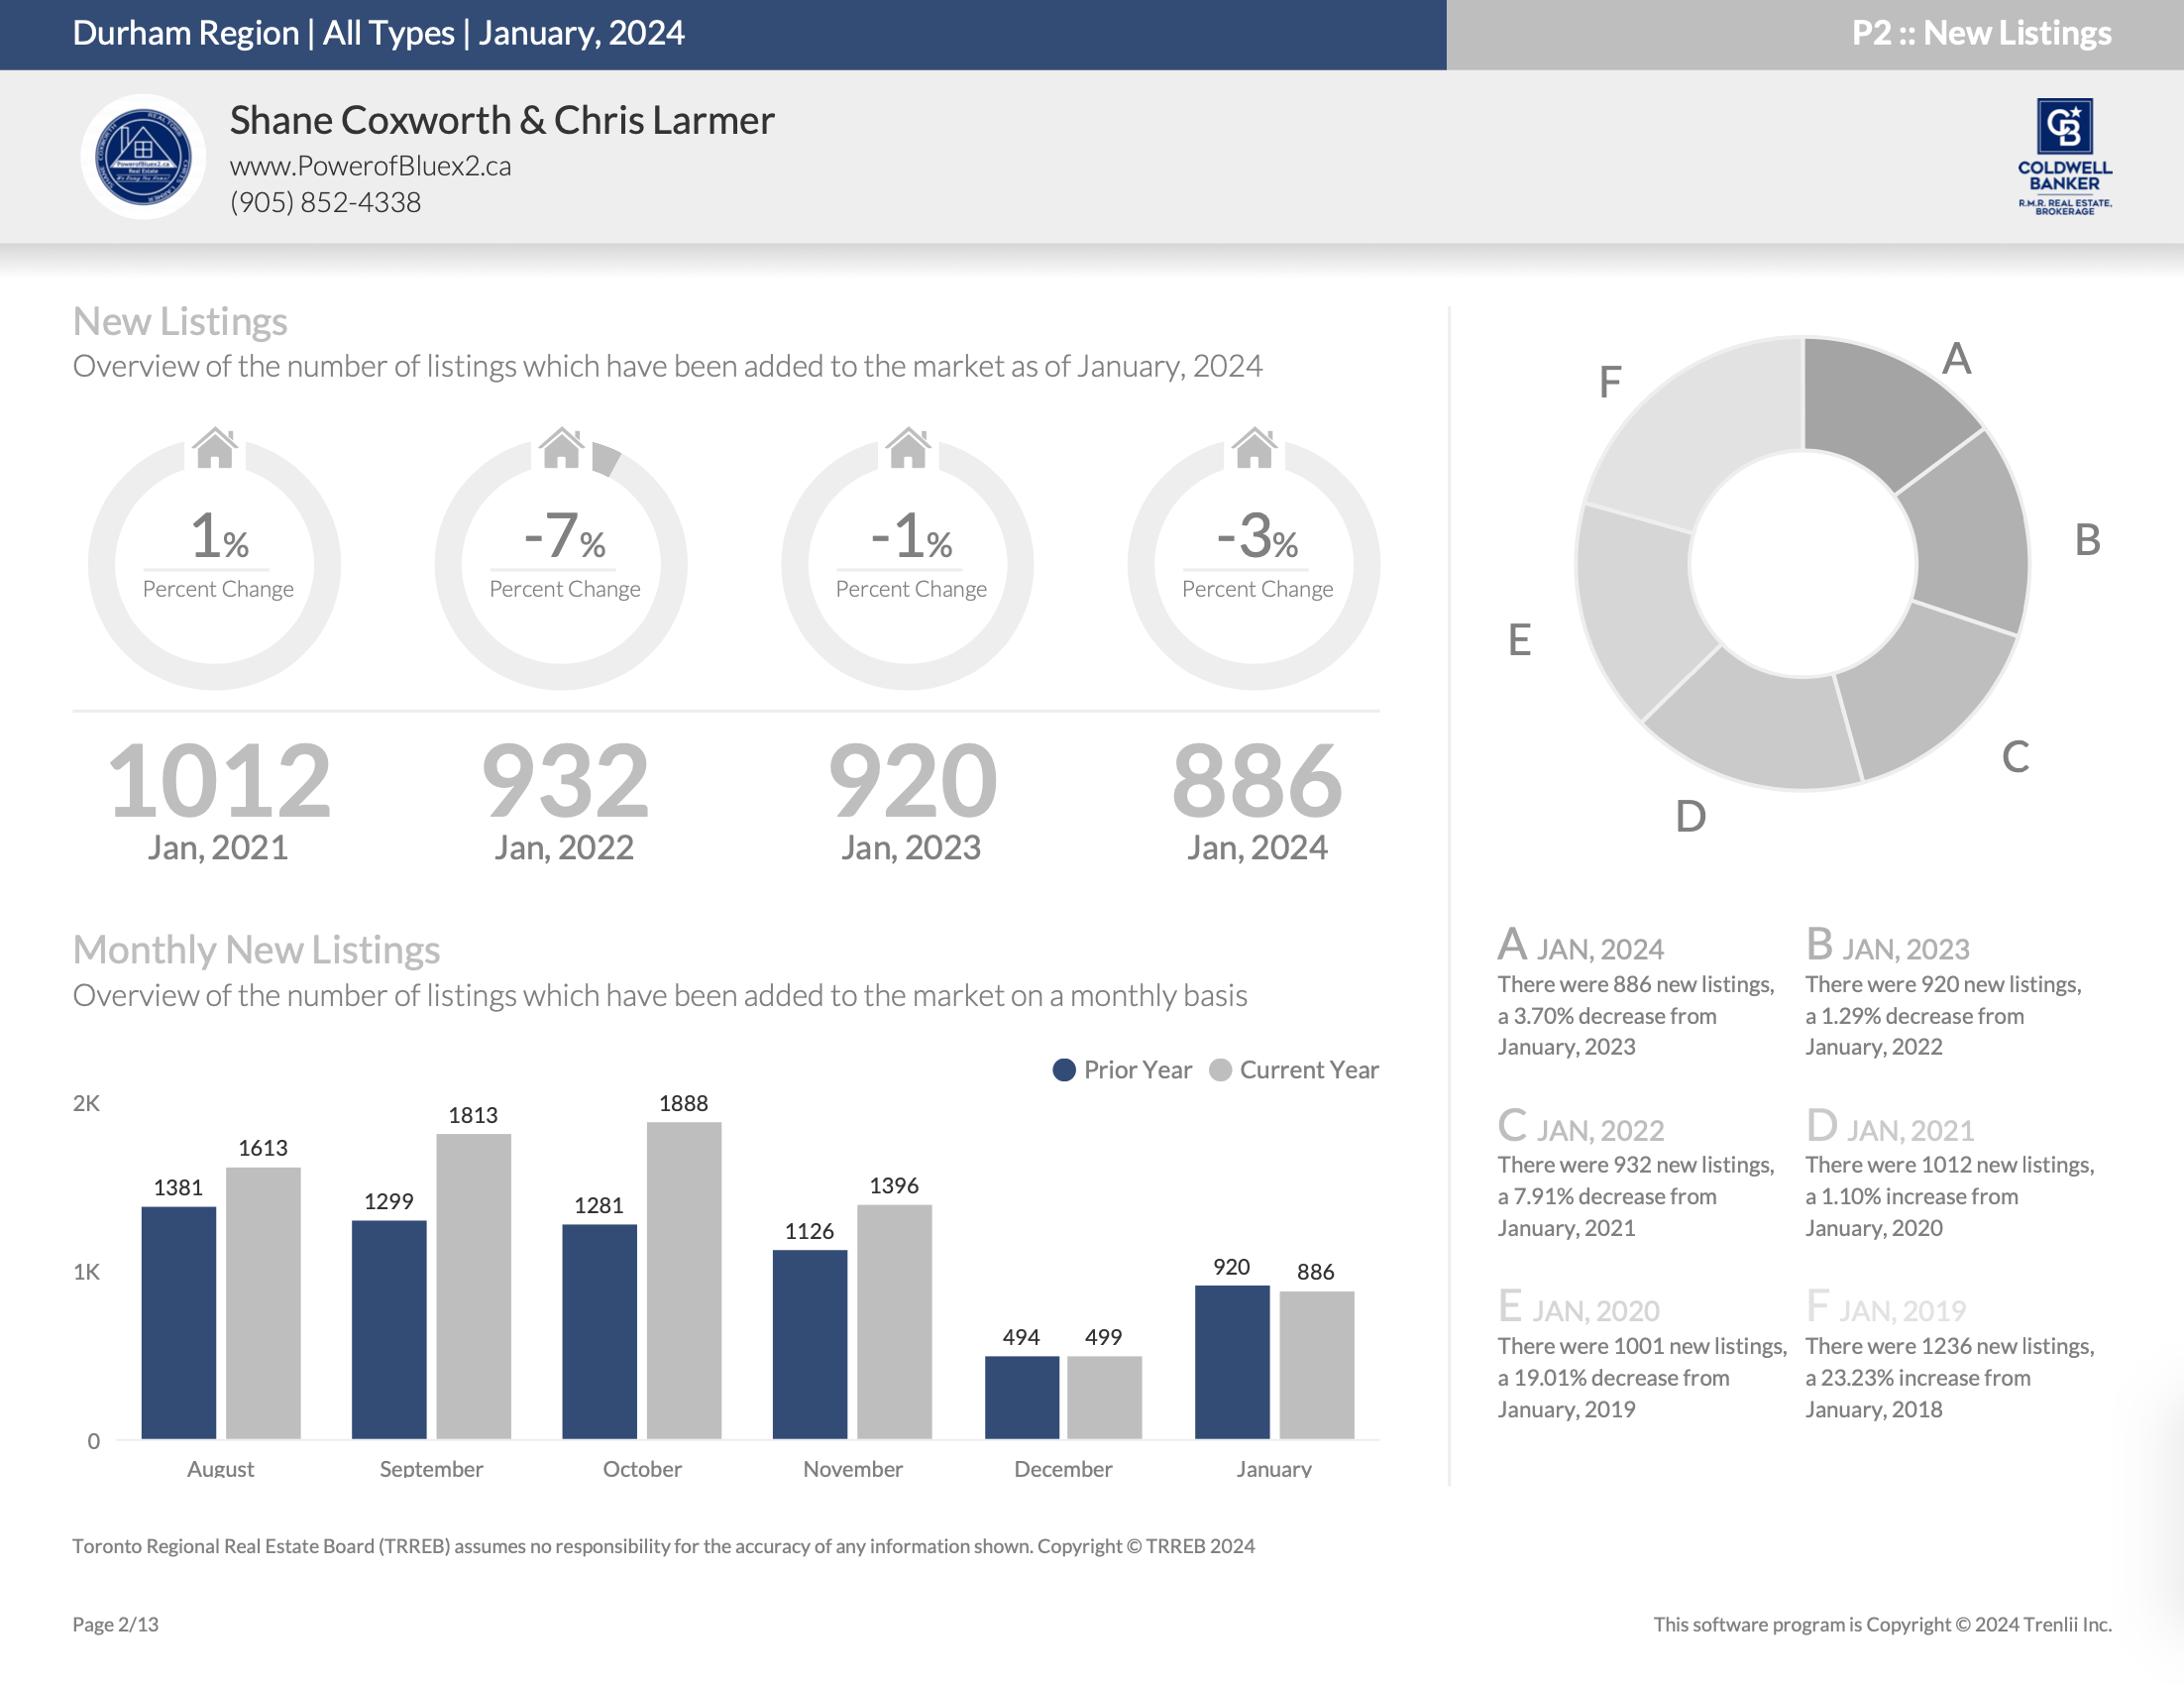
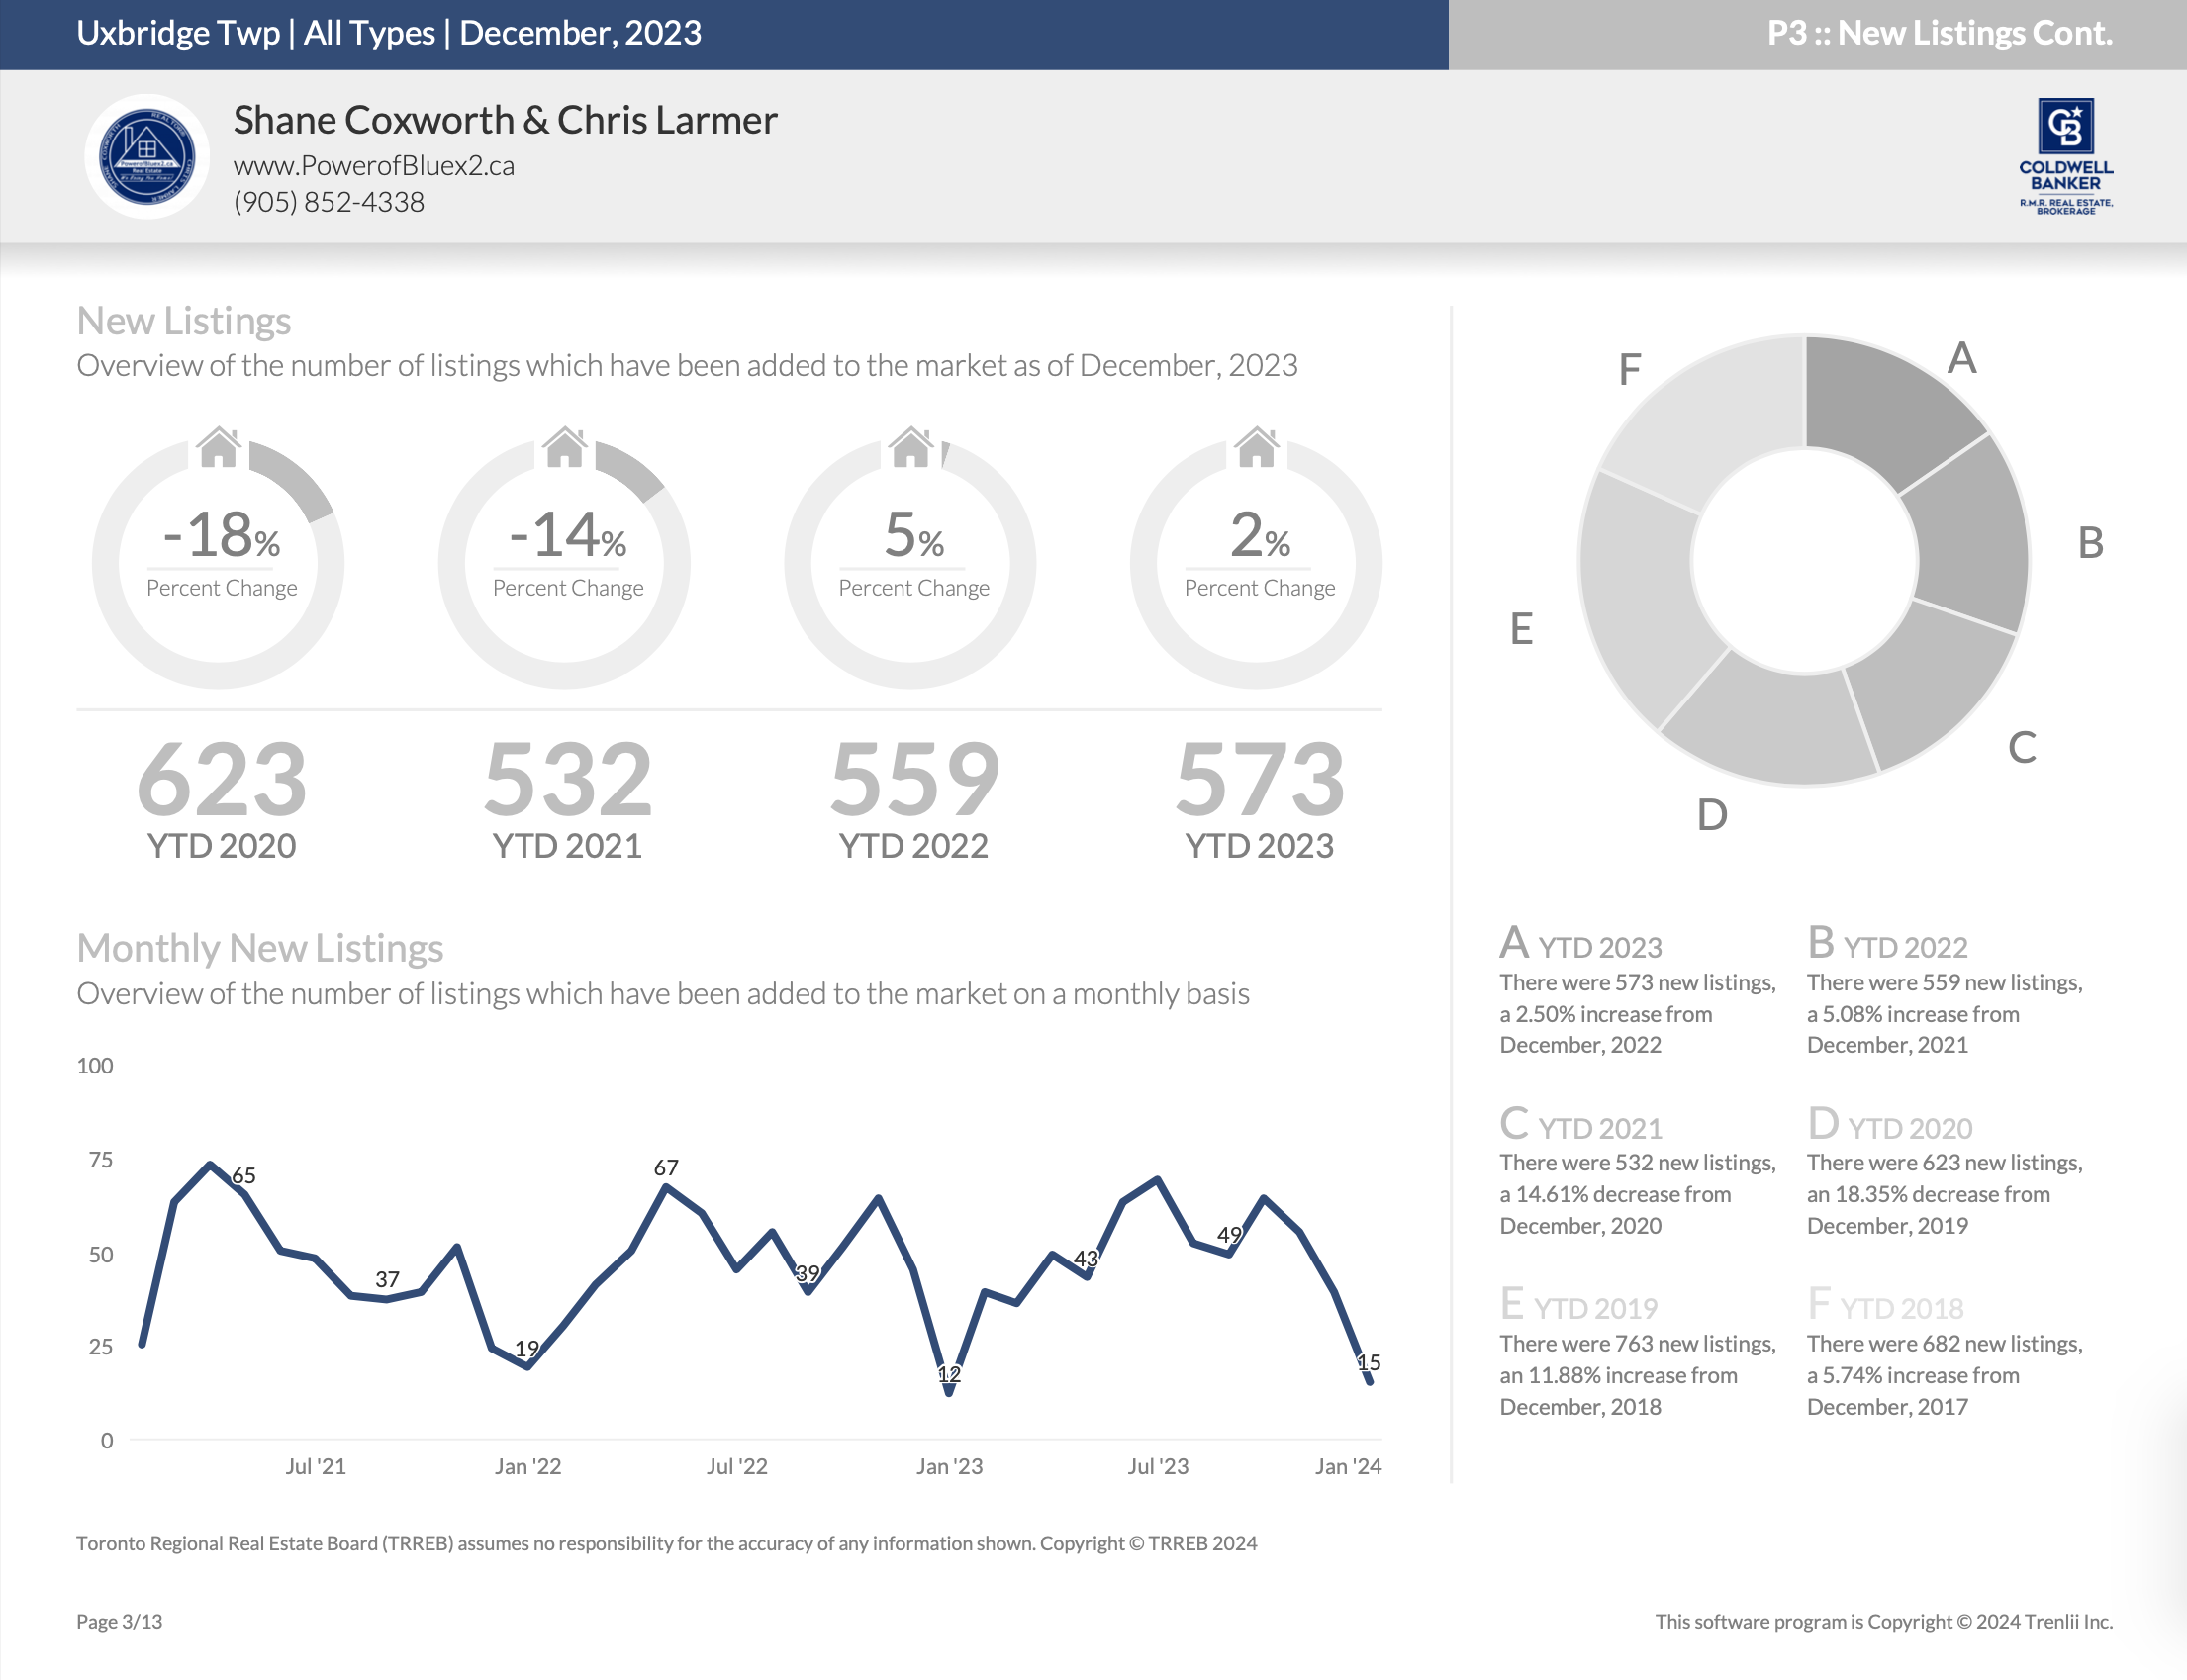
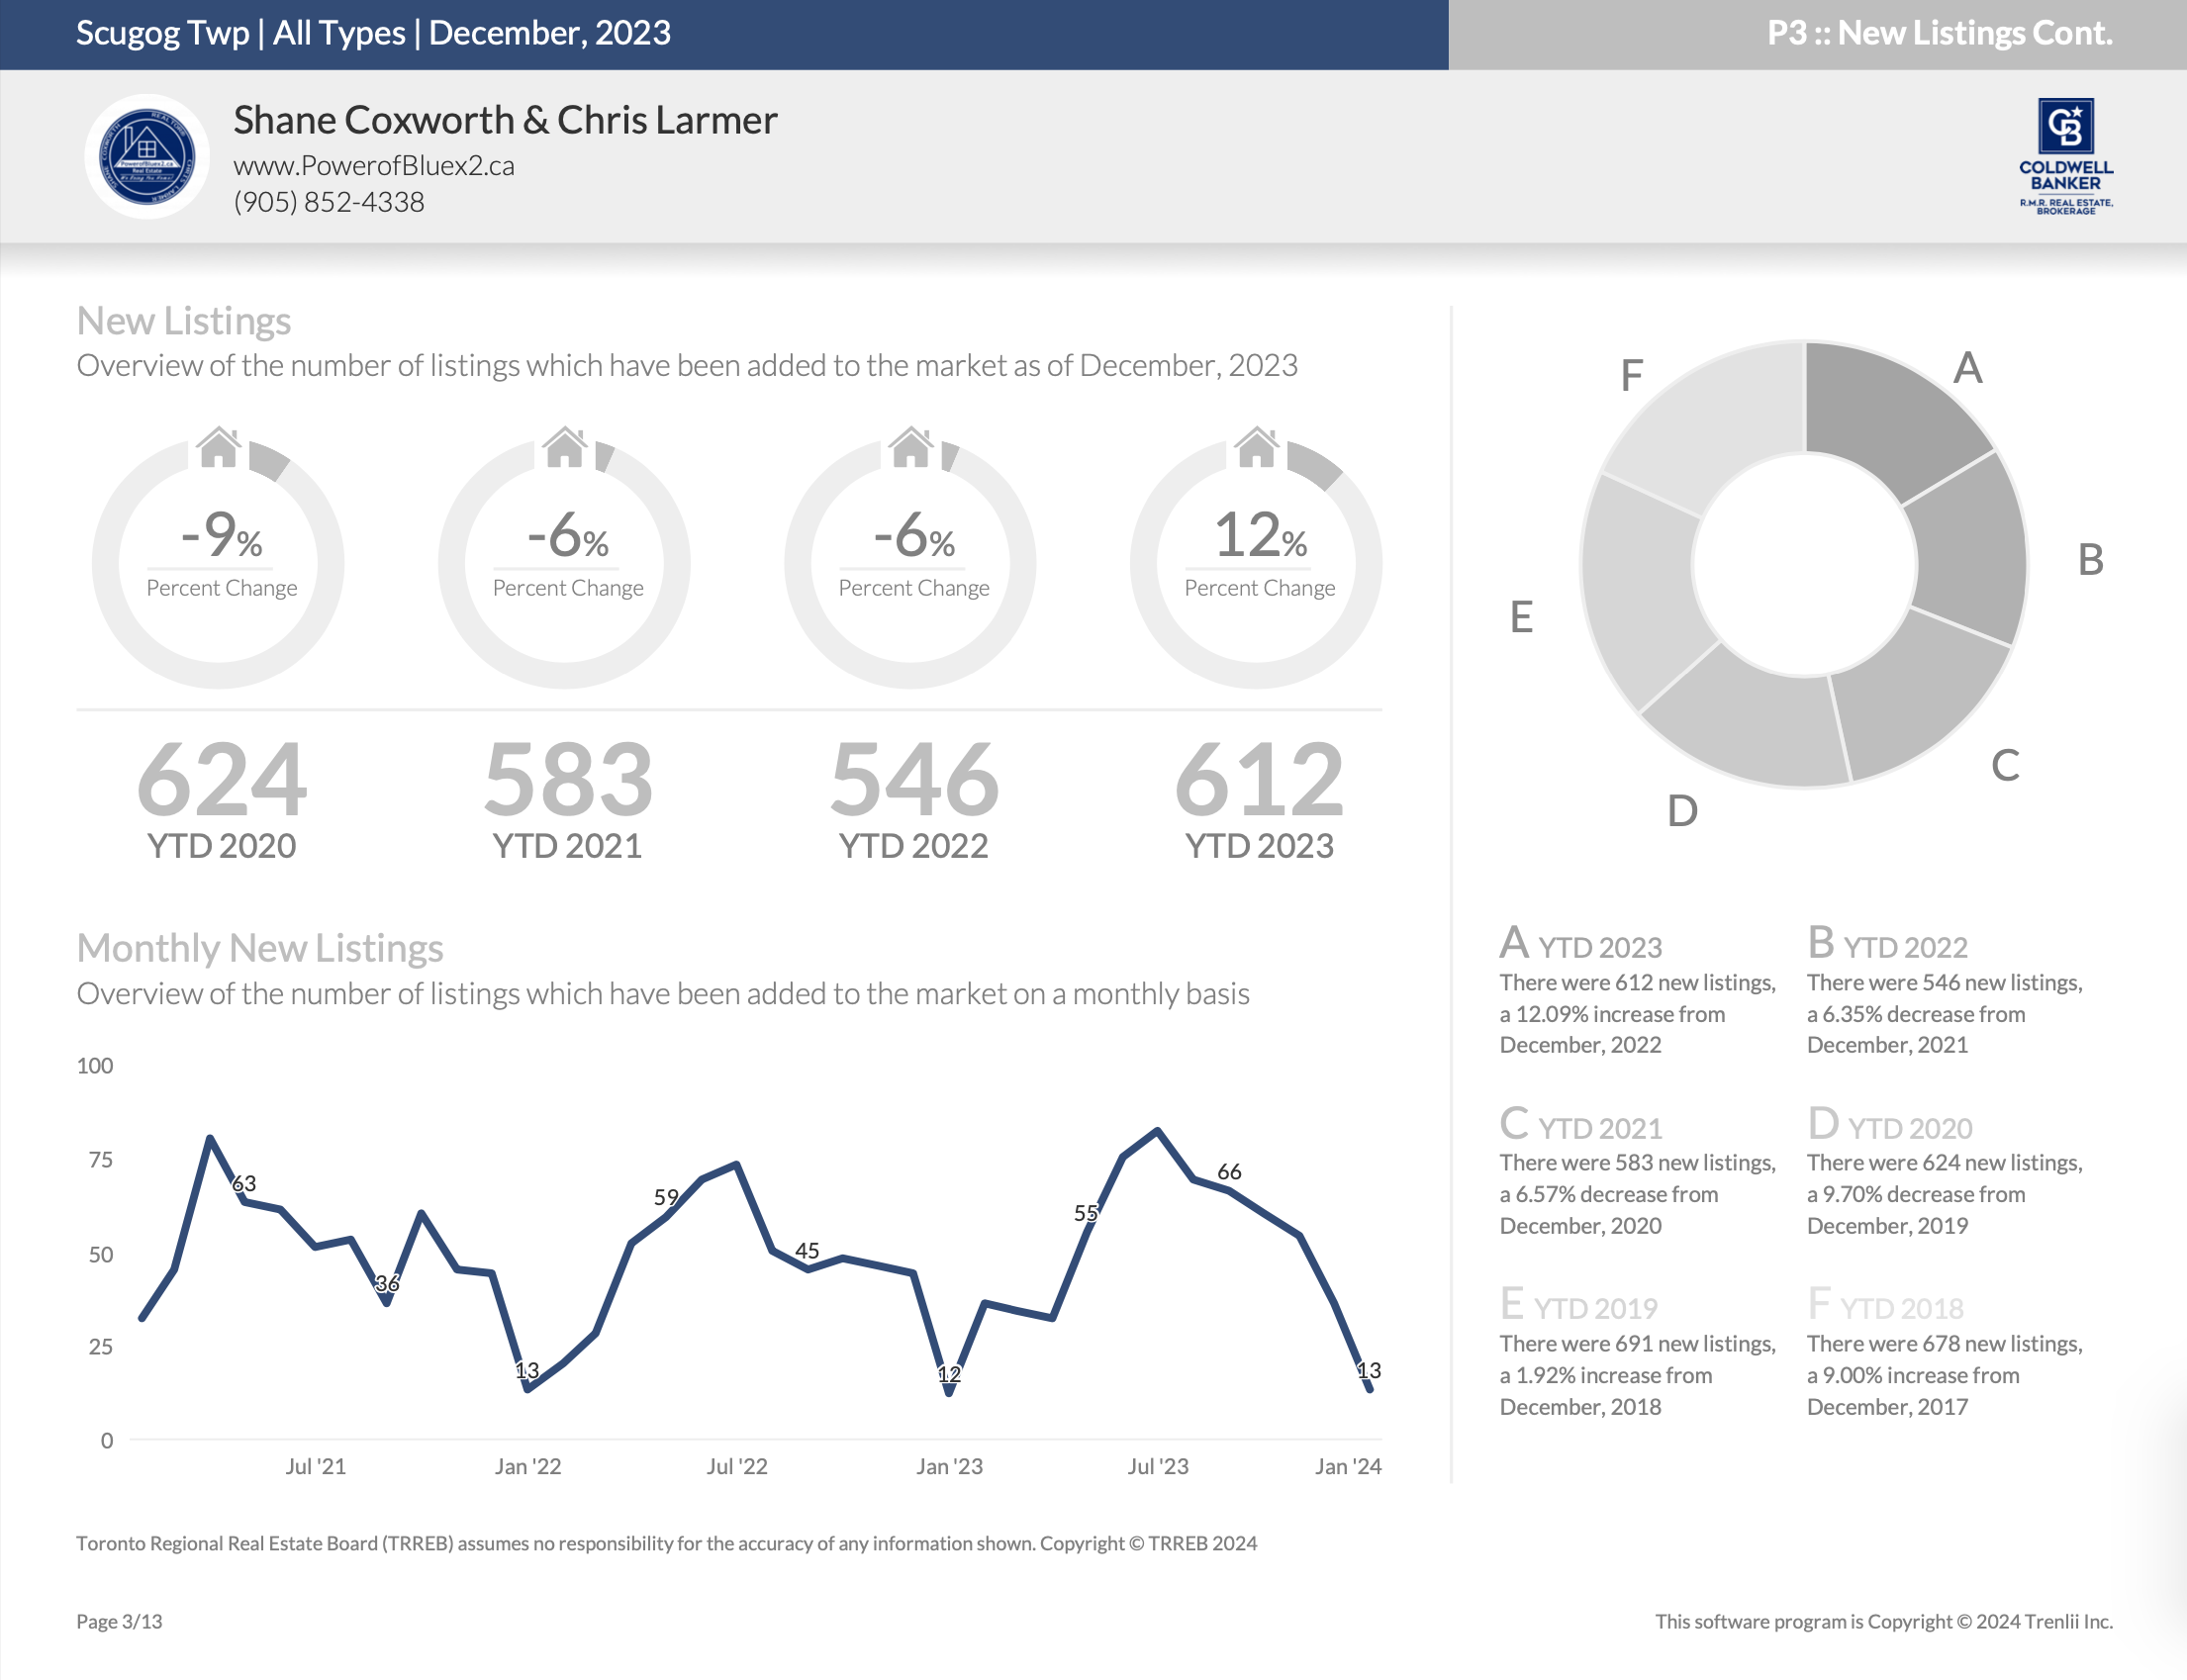
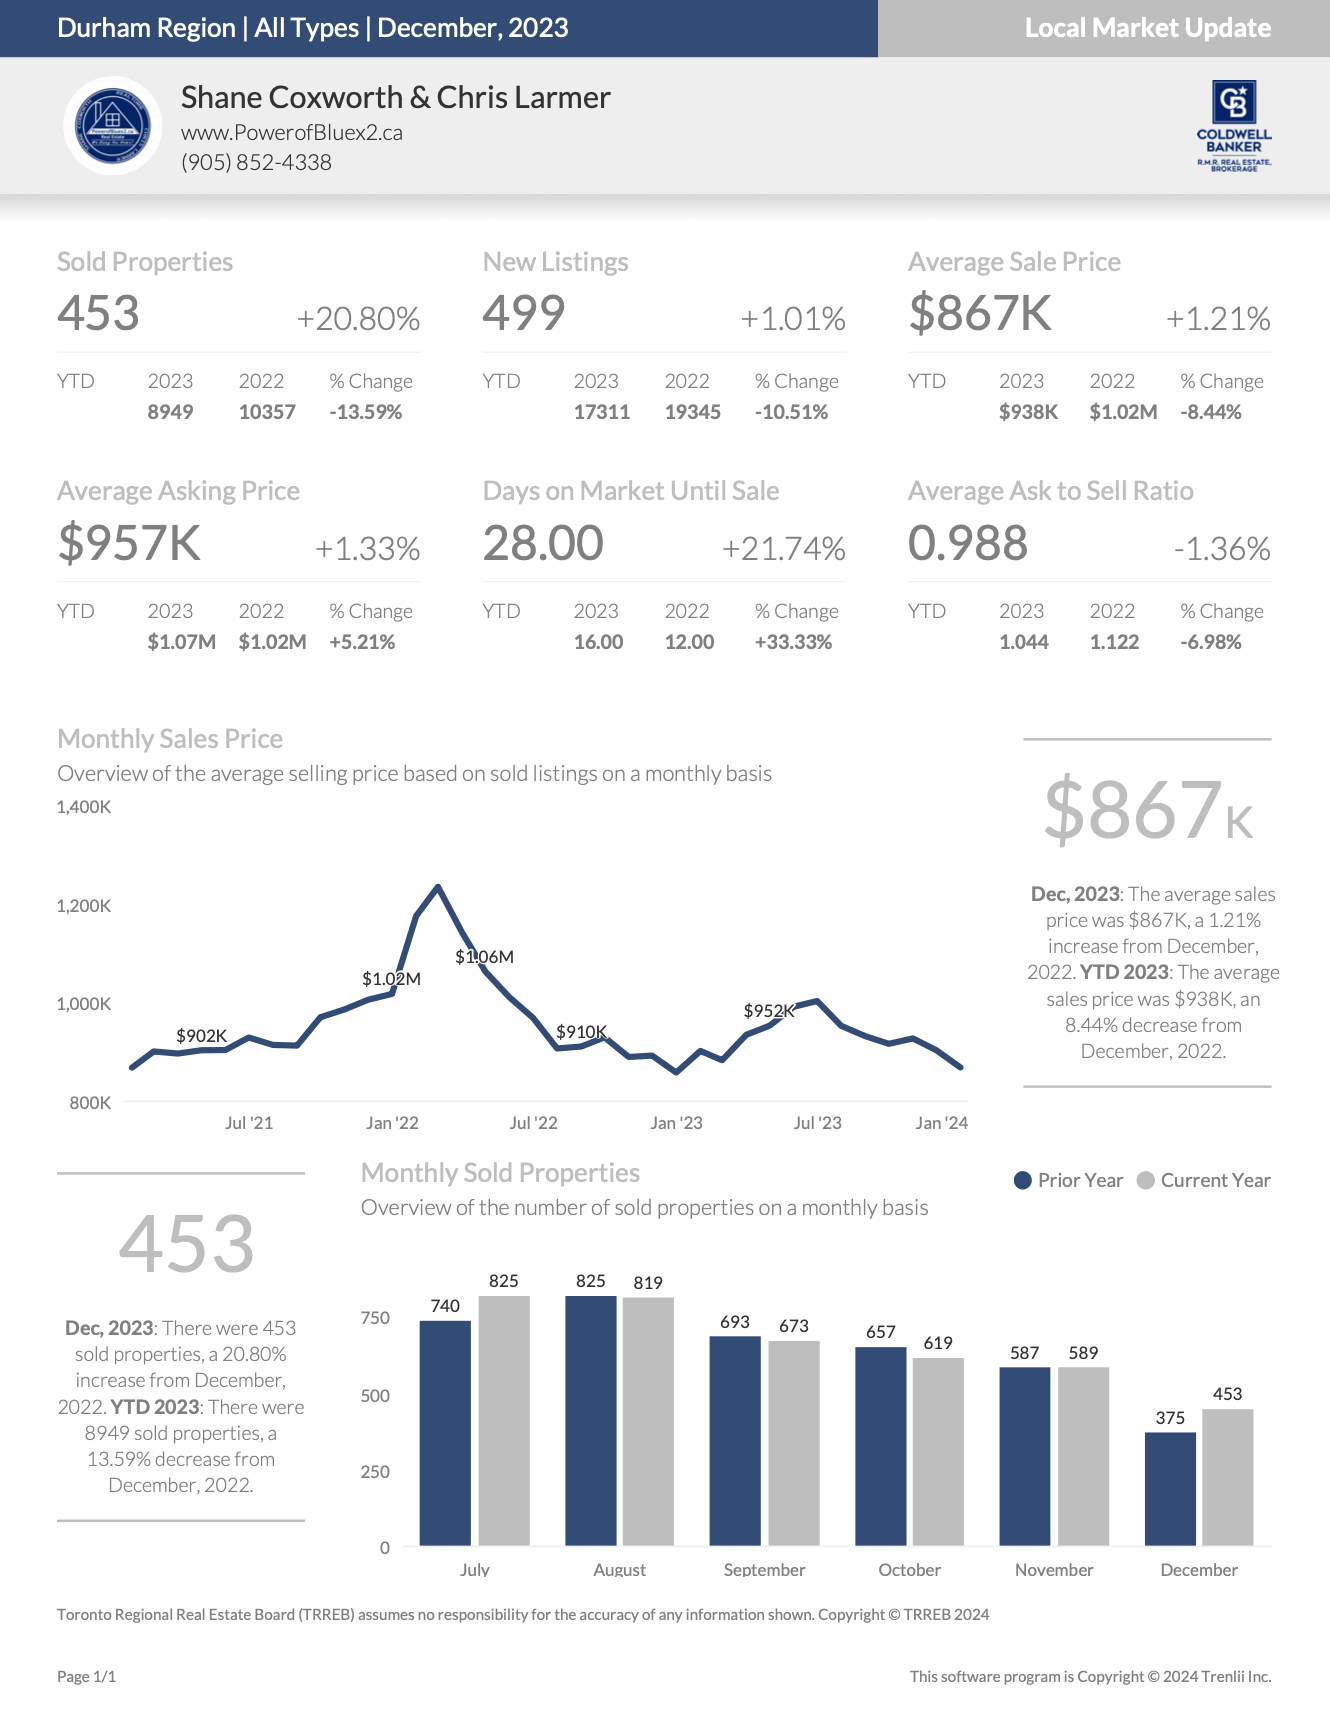
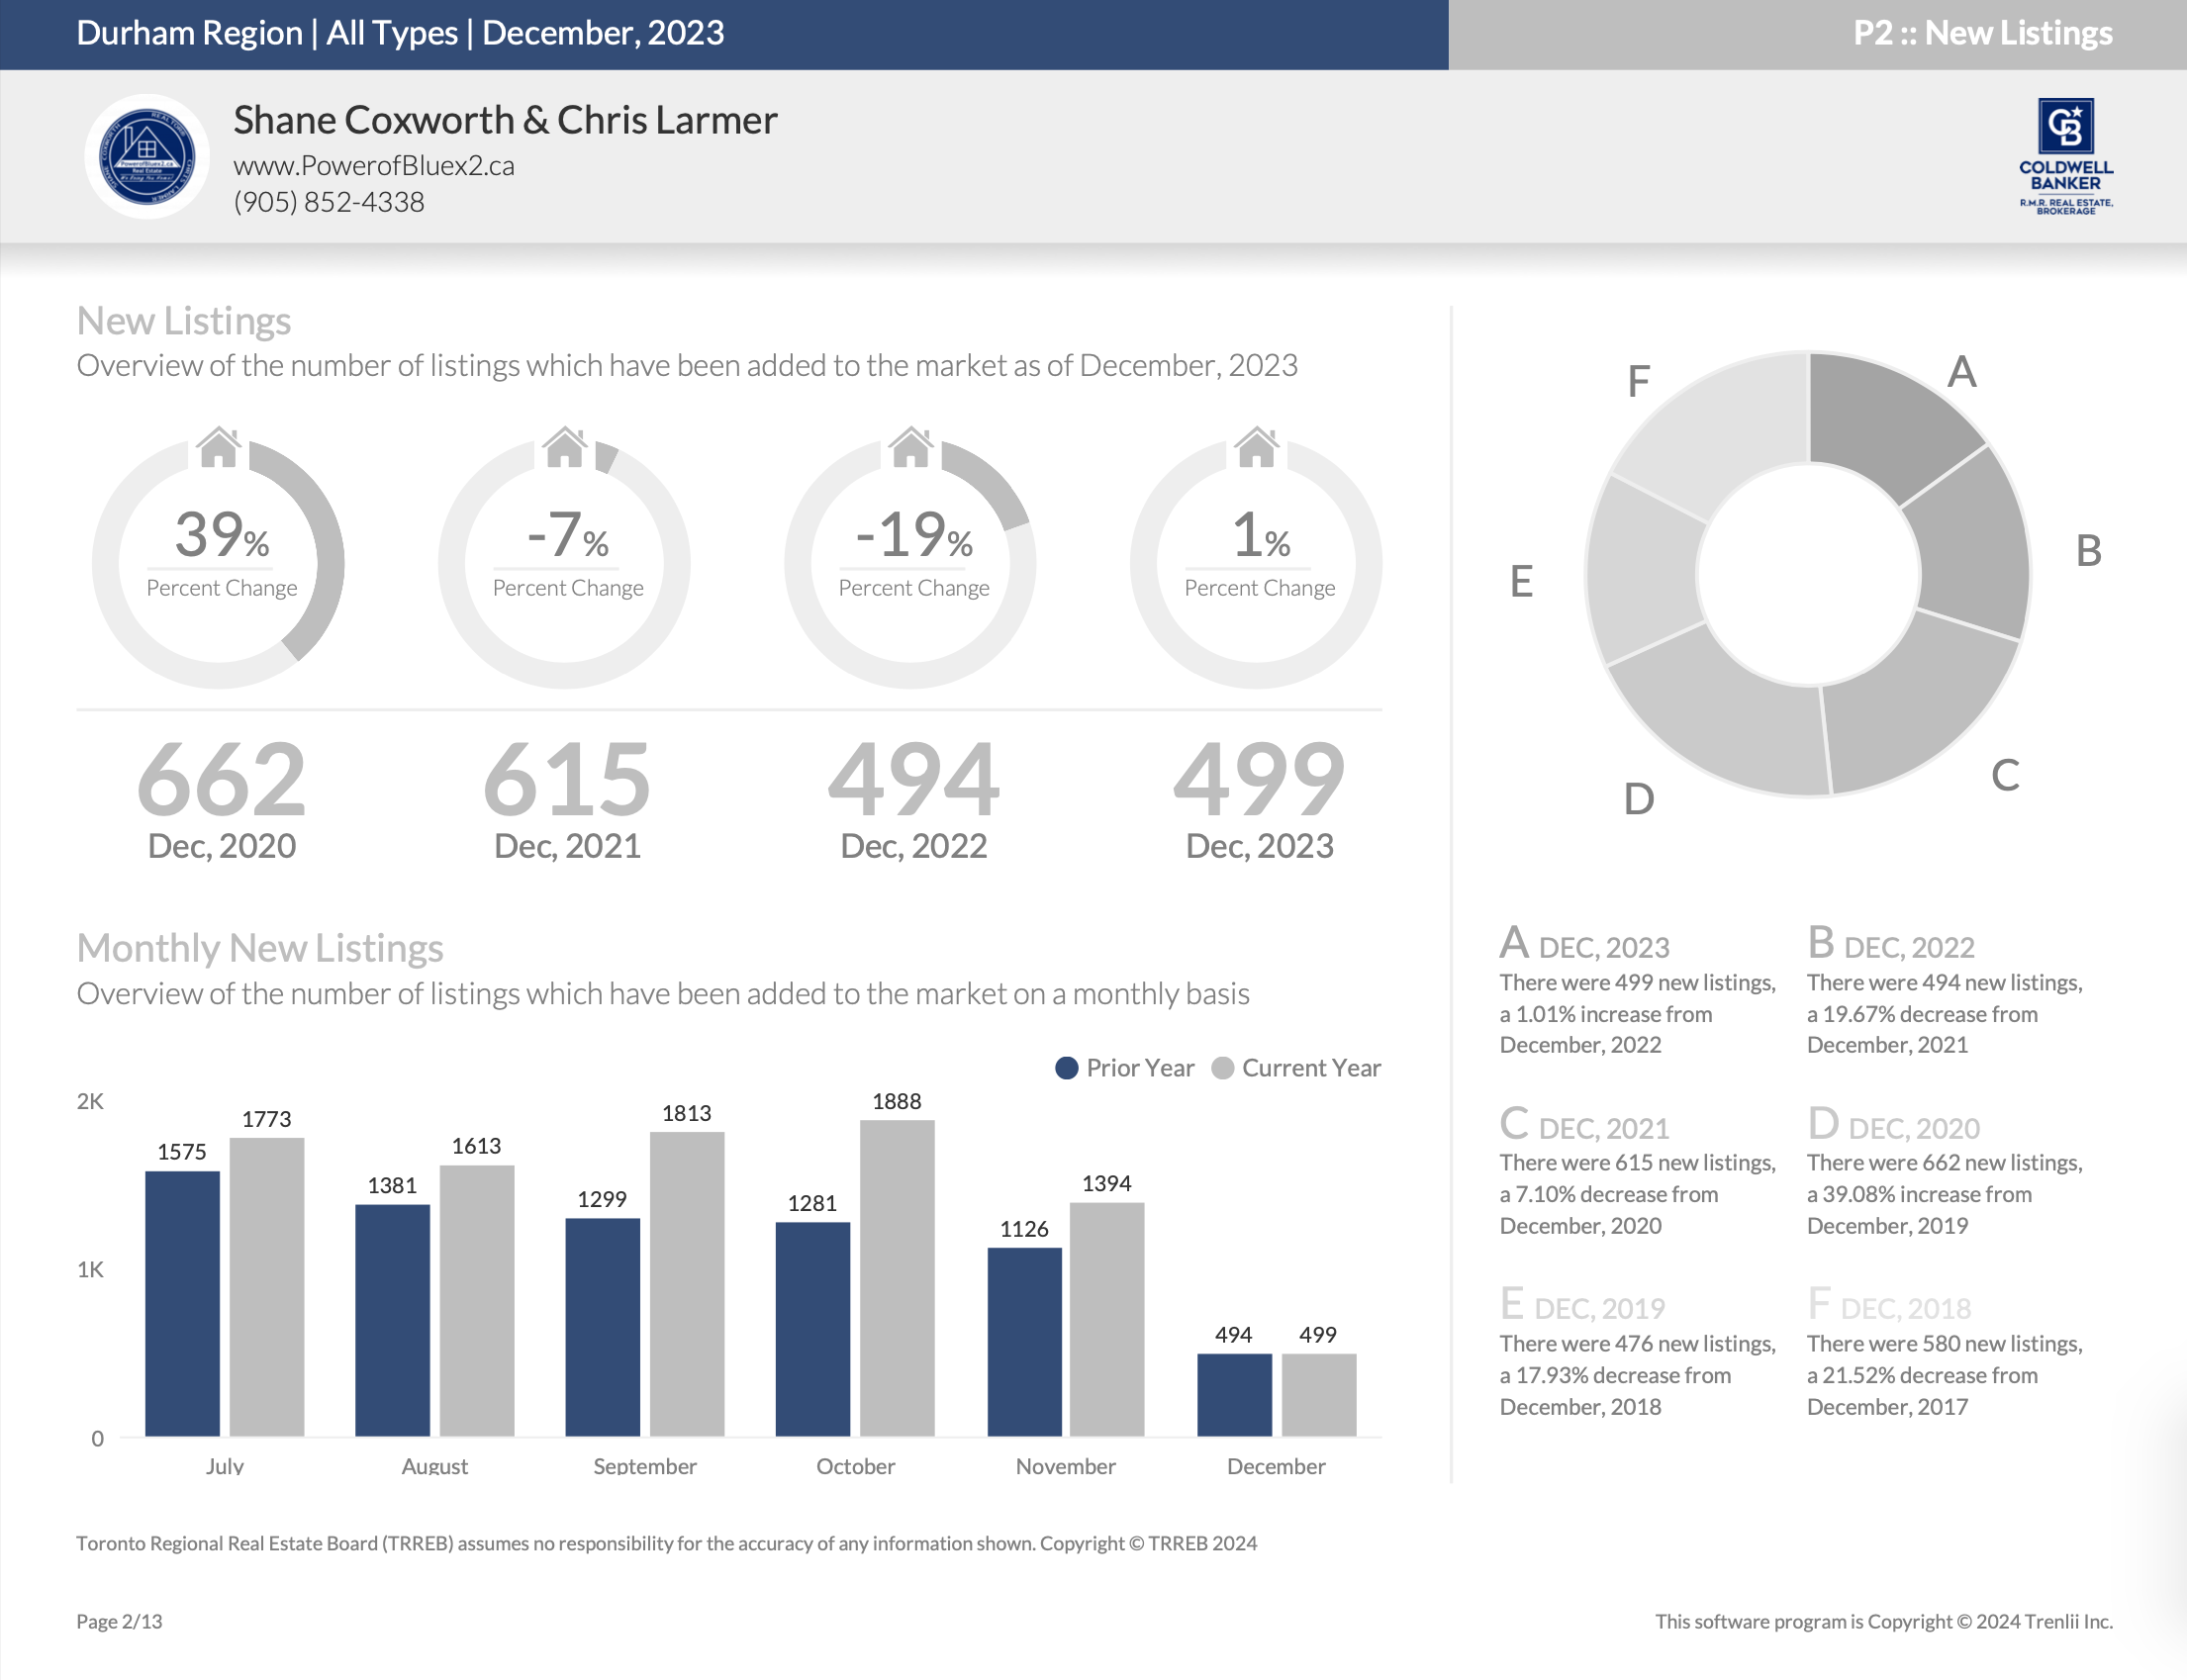
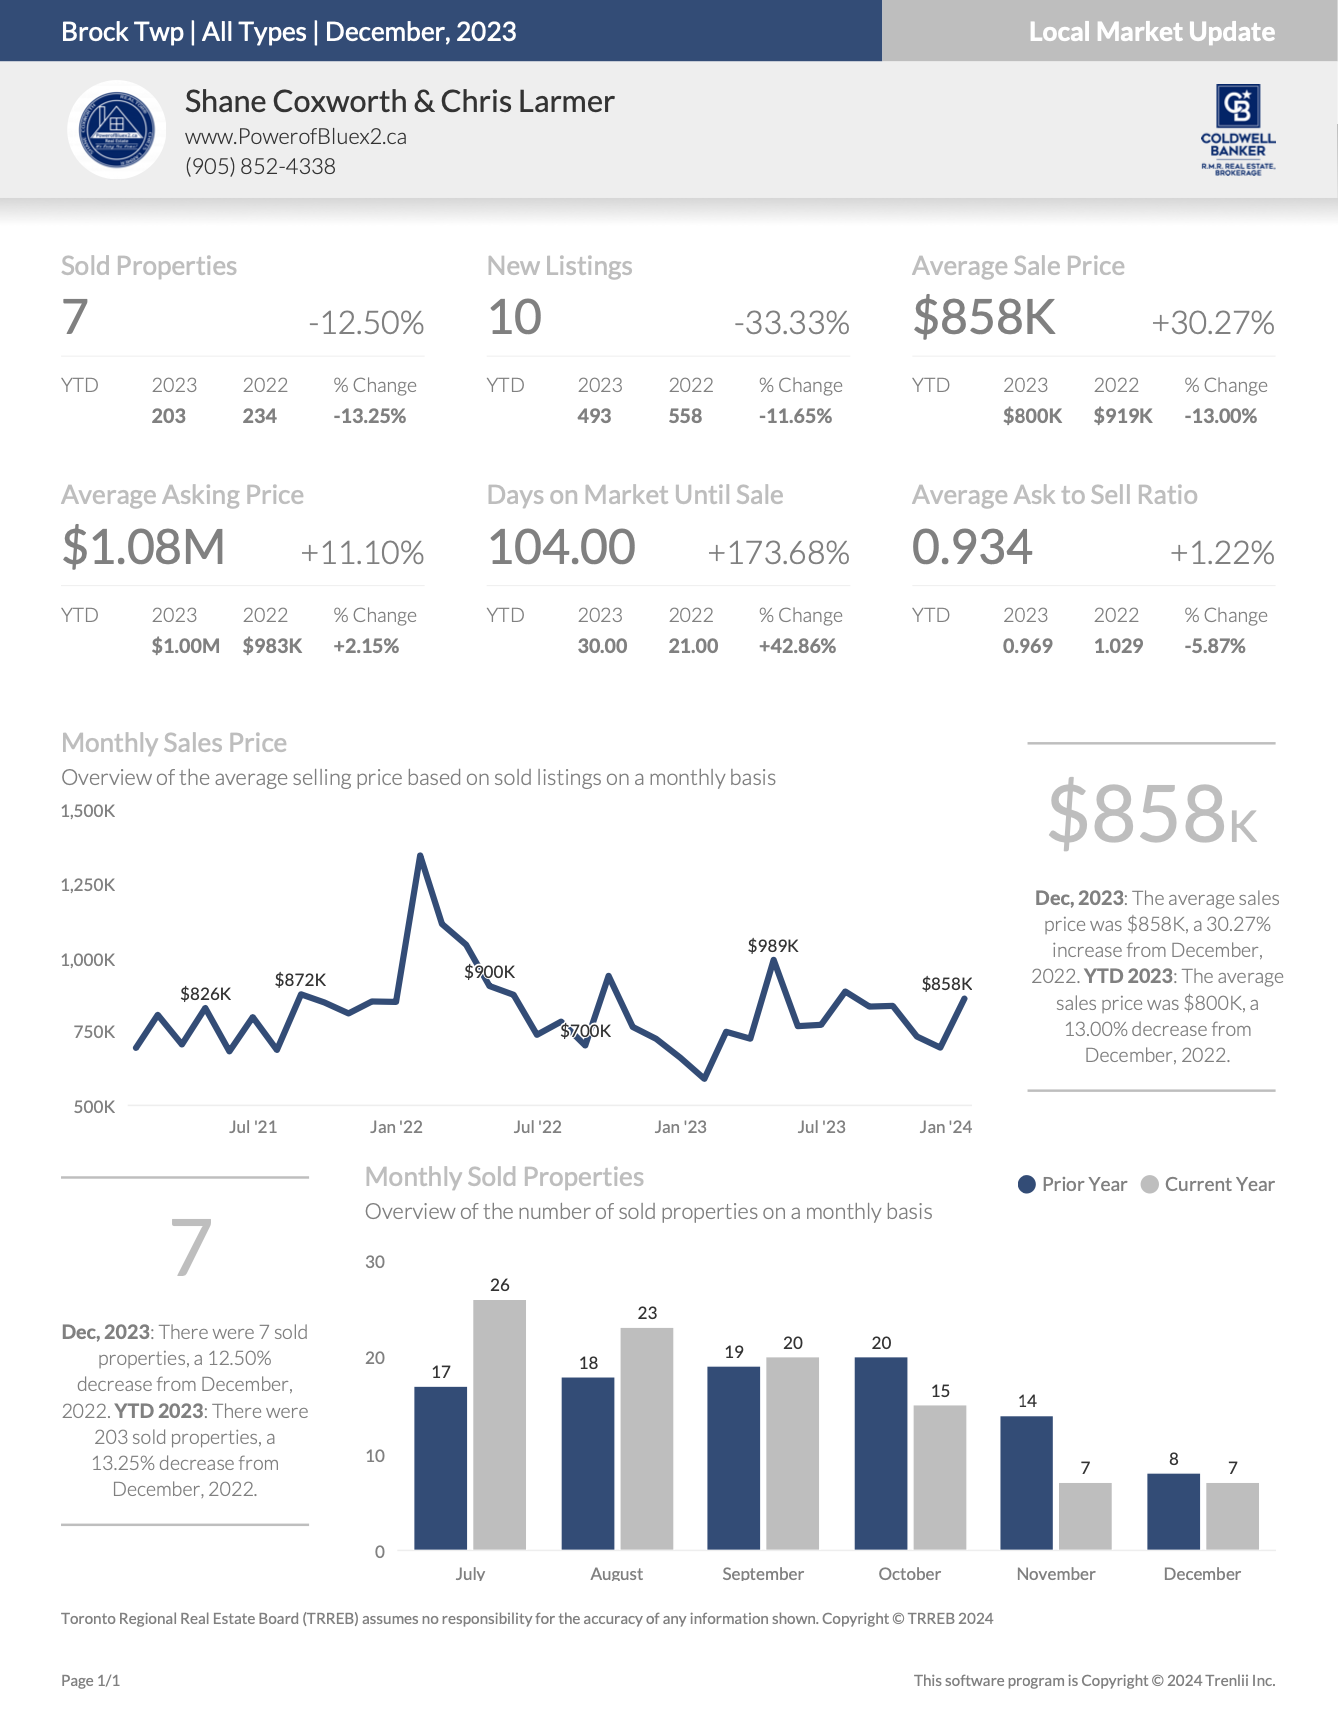
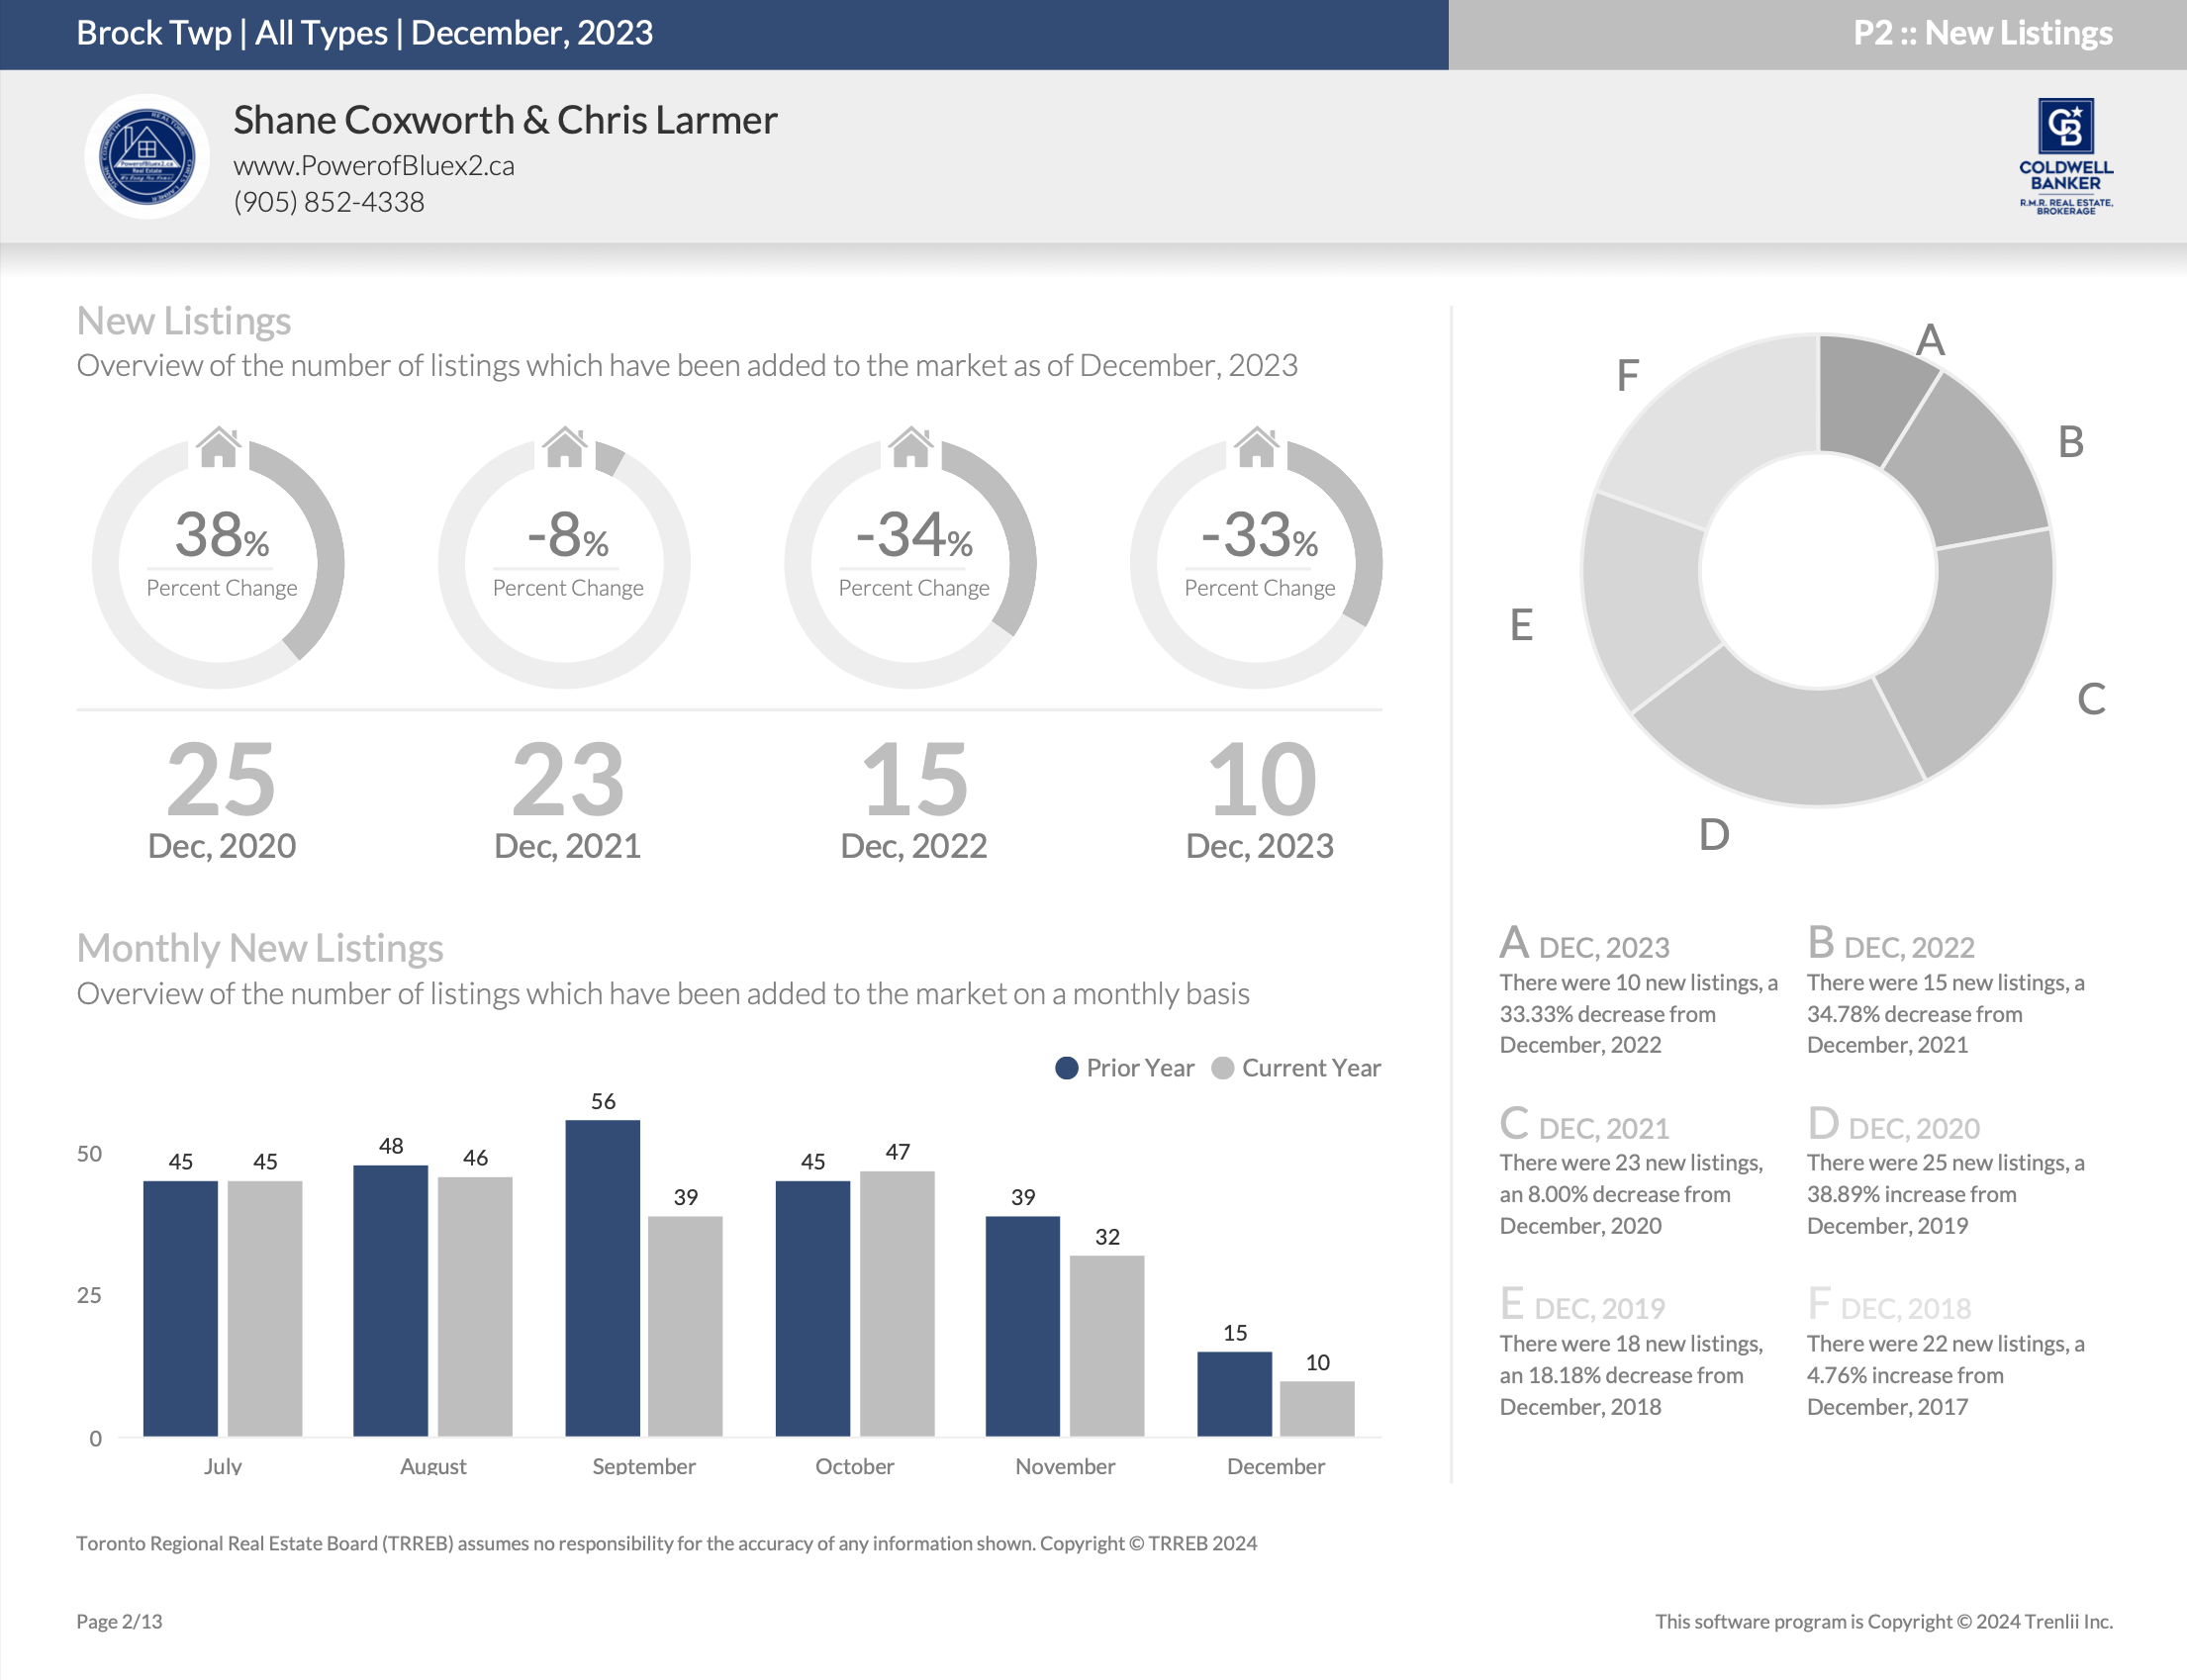
New Listings – January 2024
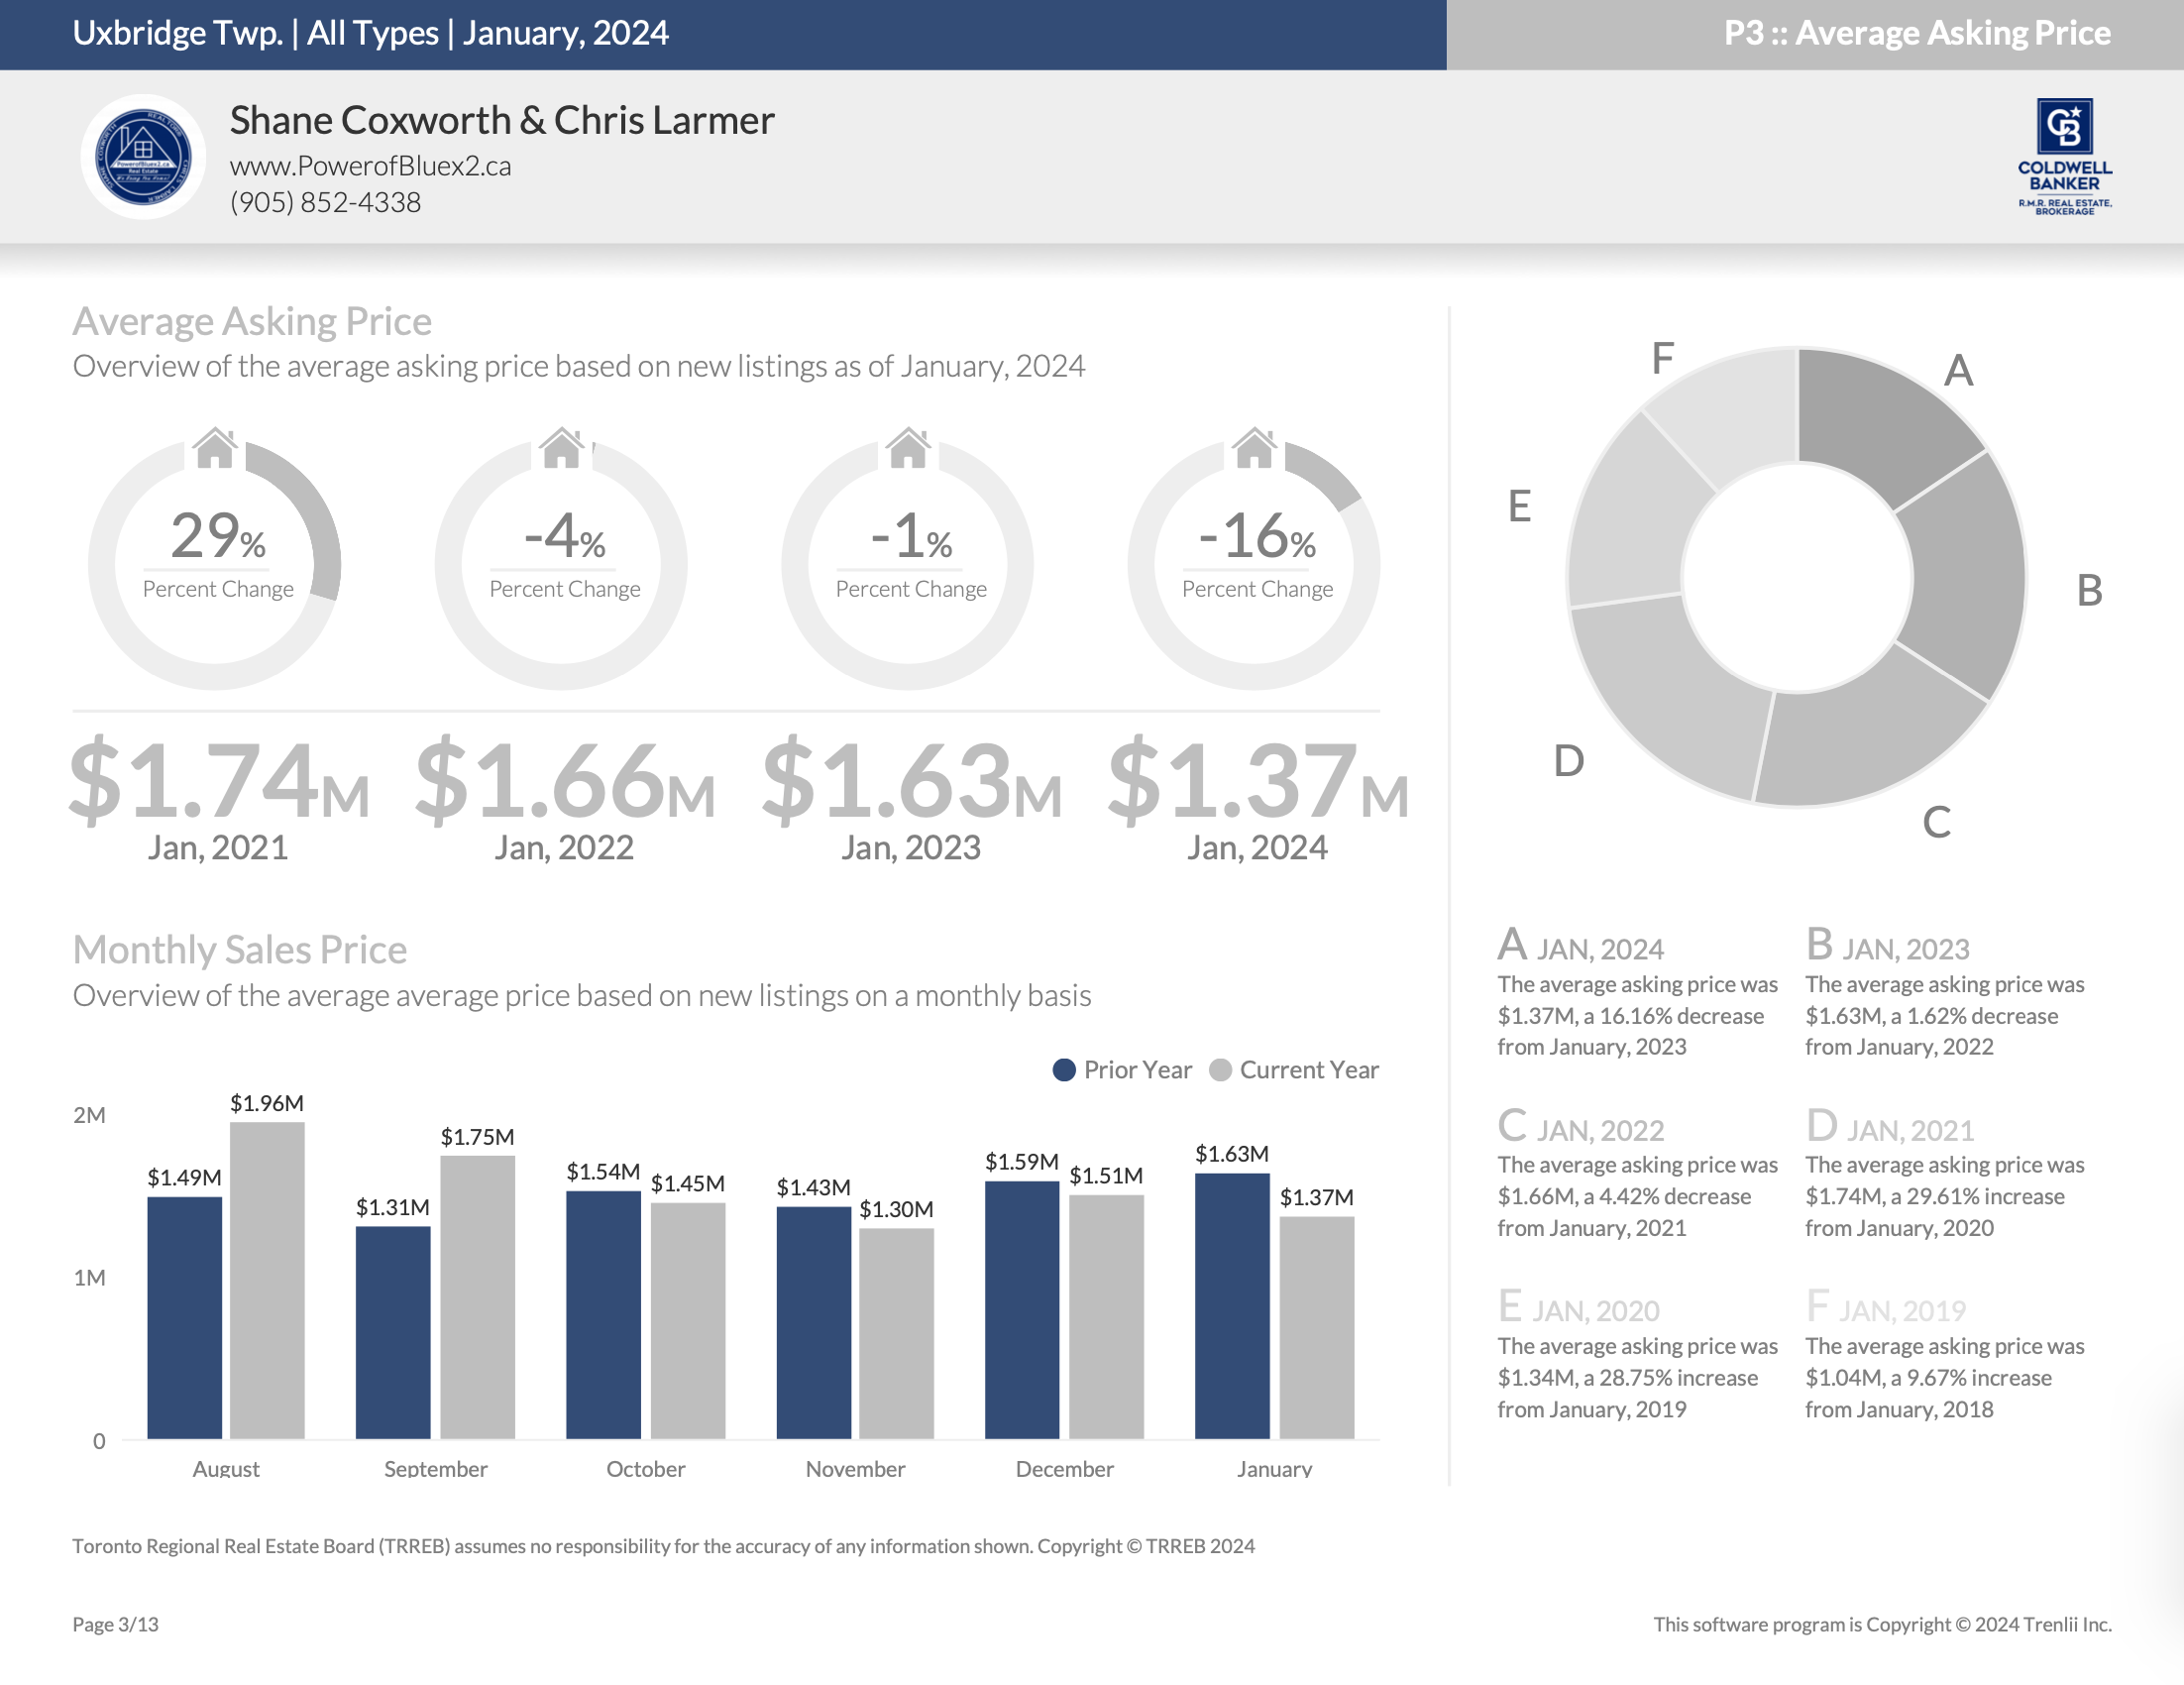
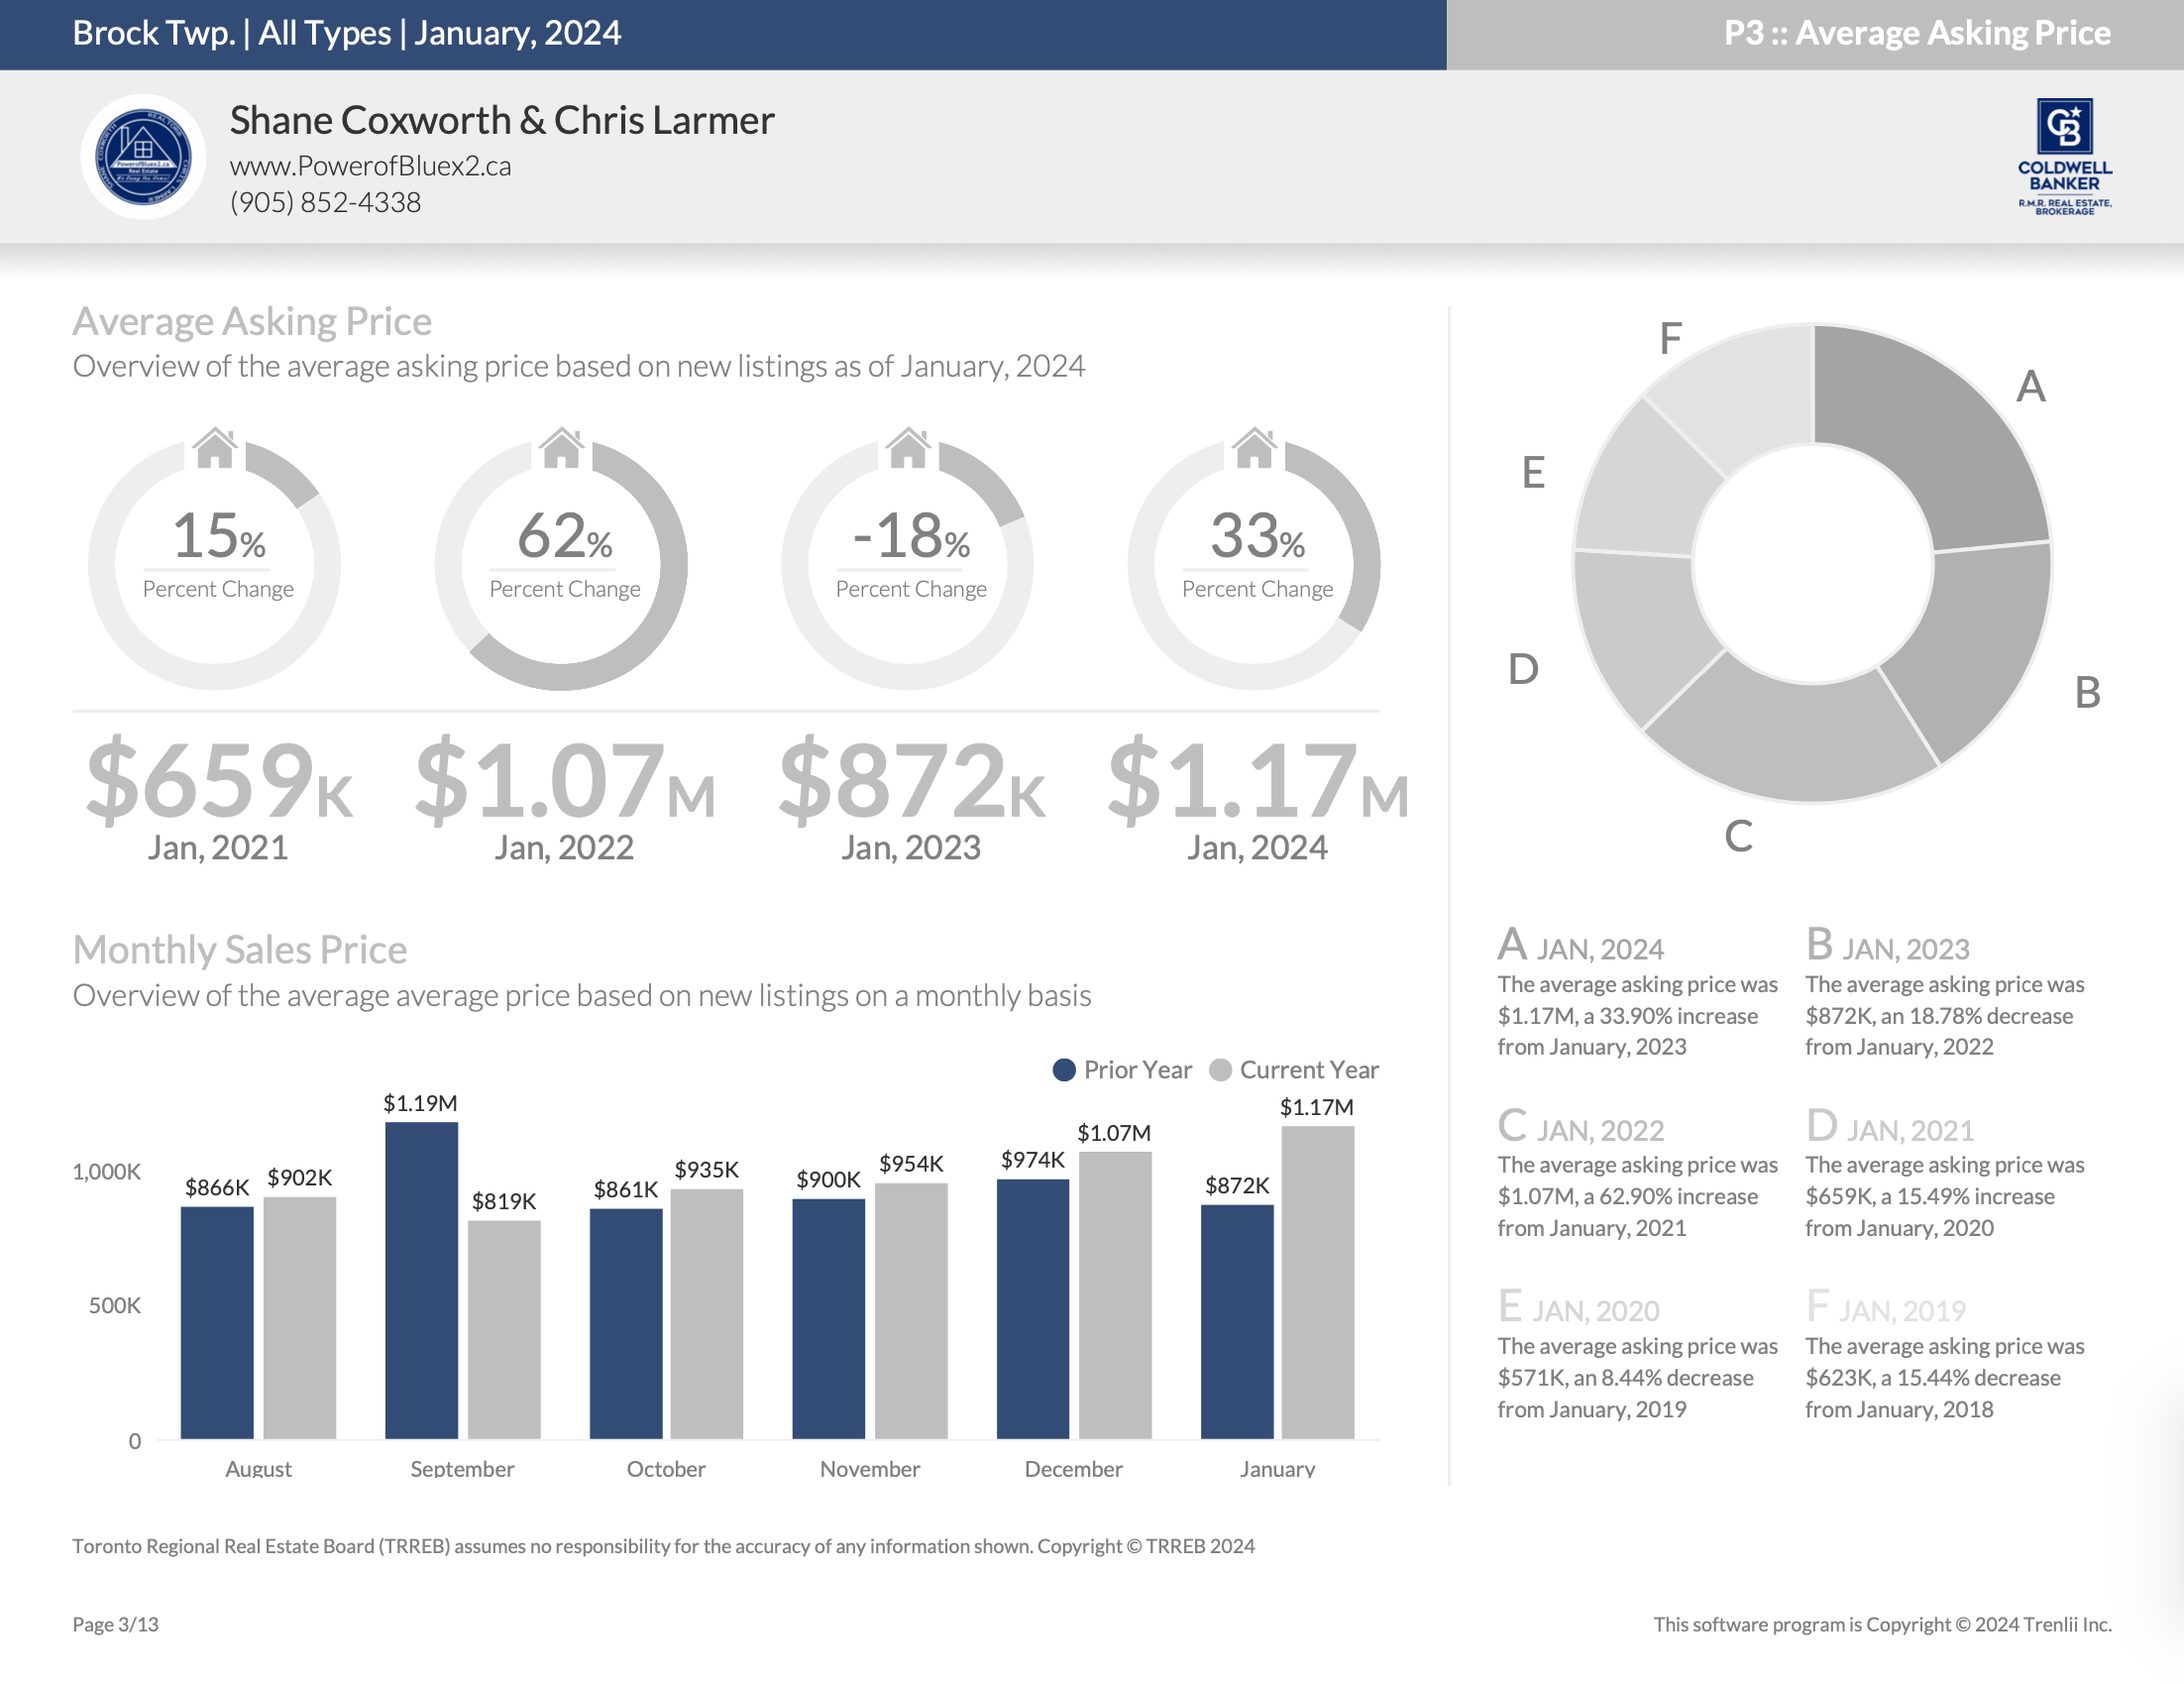
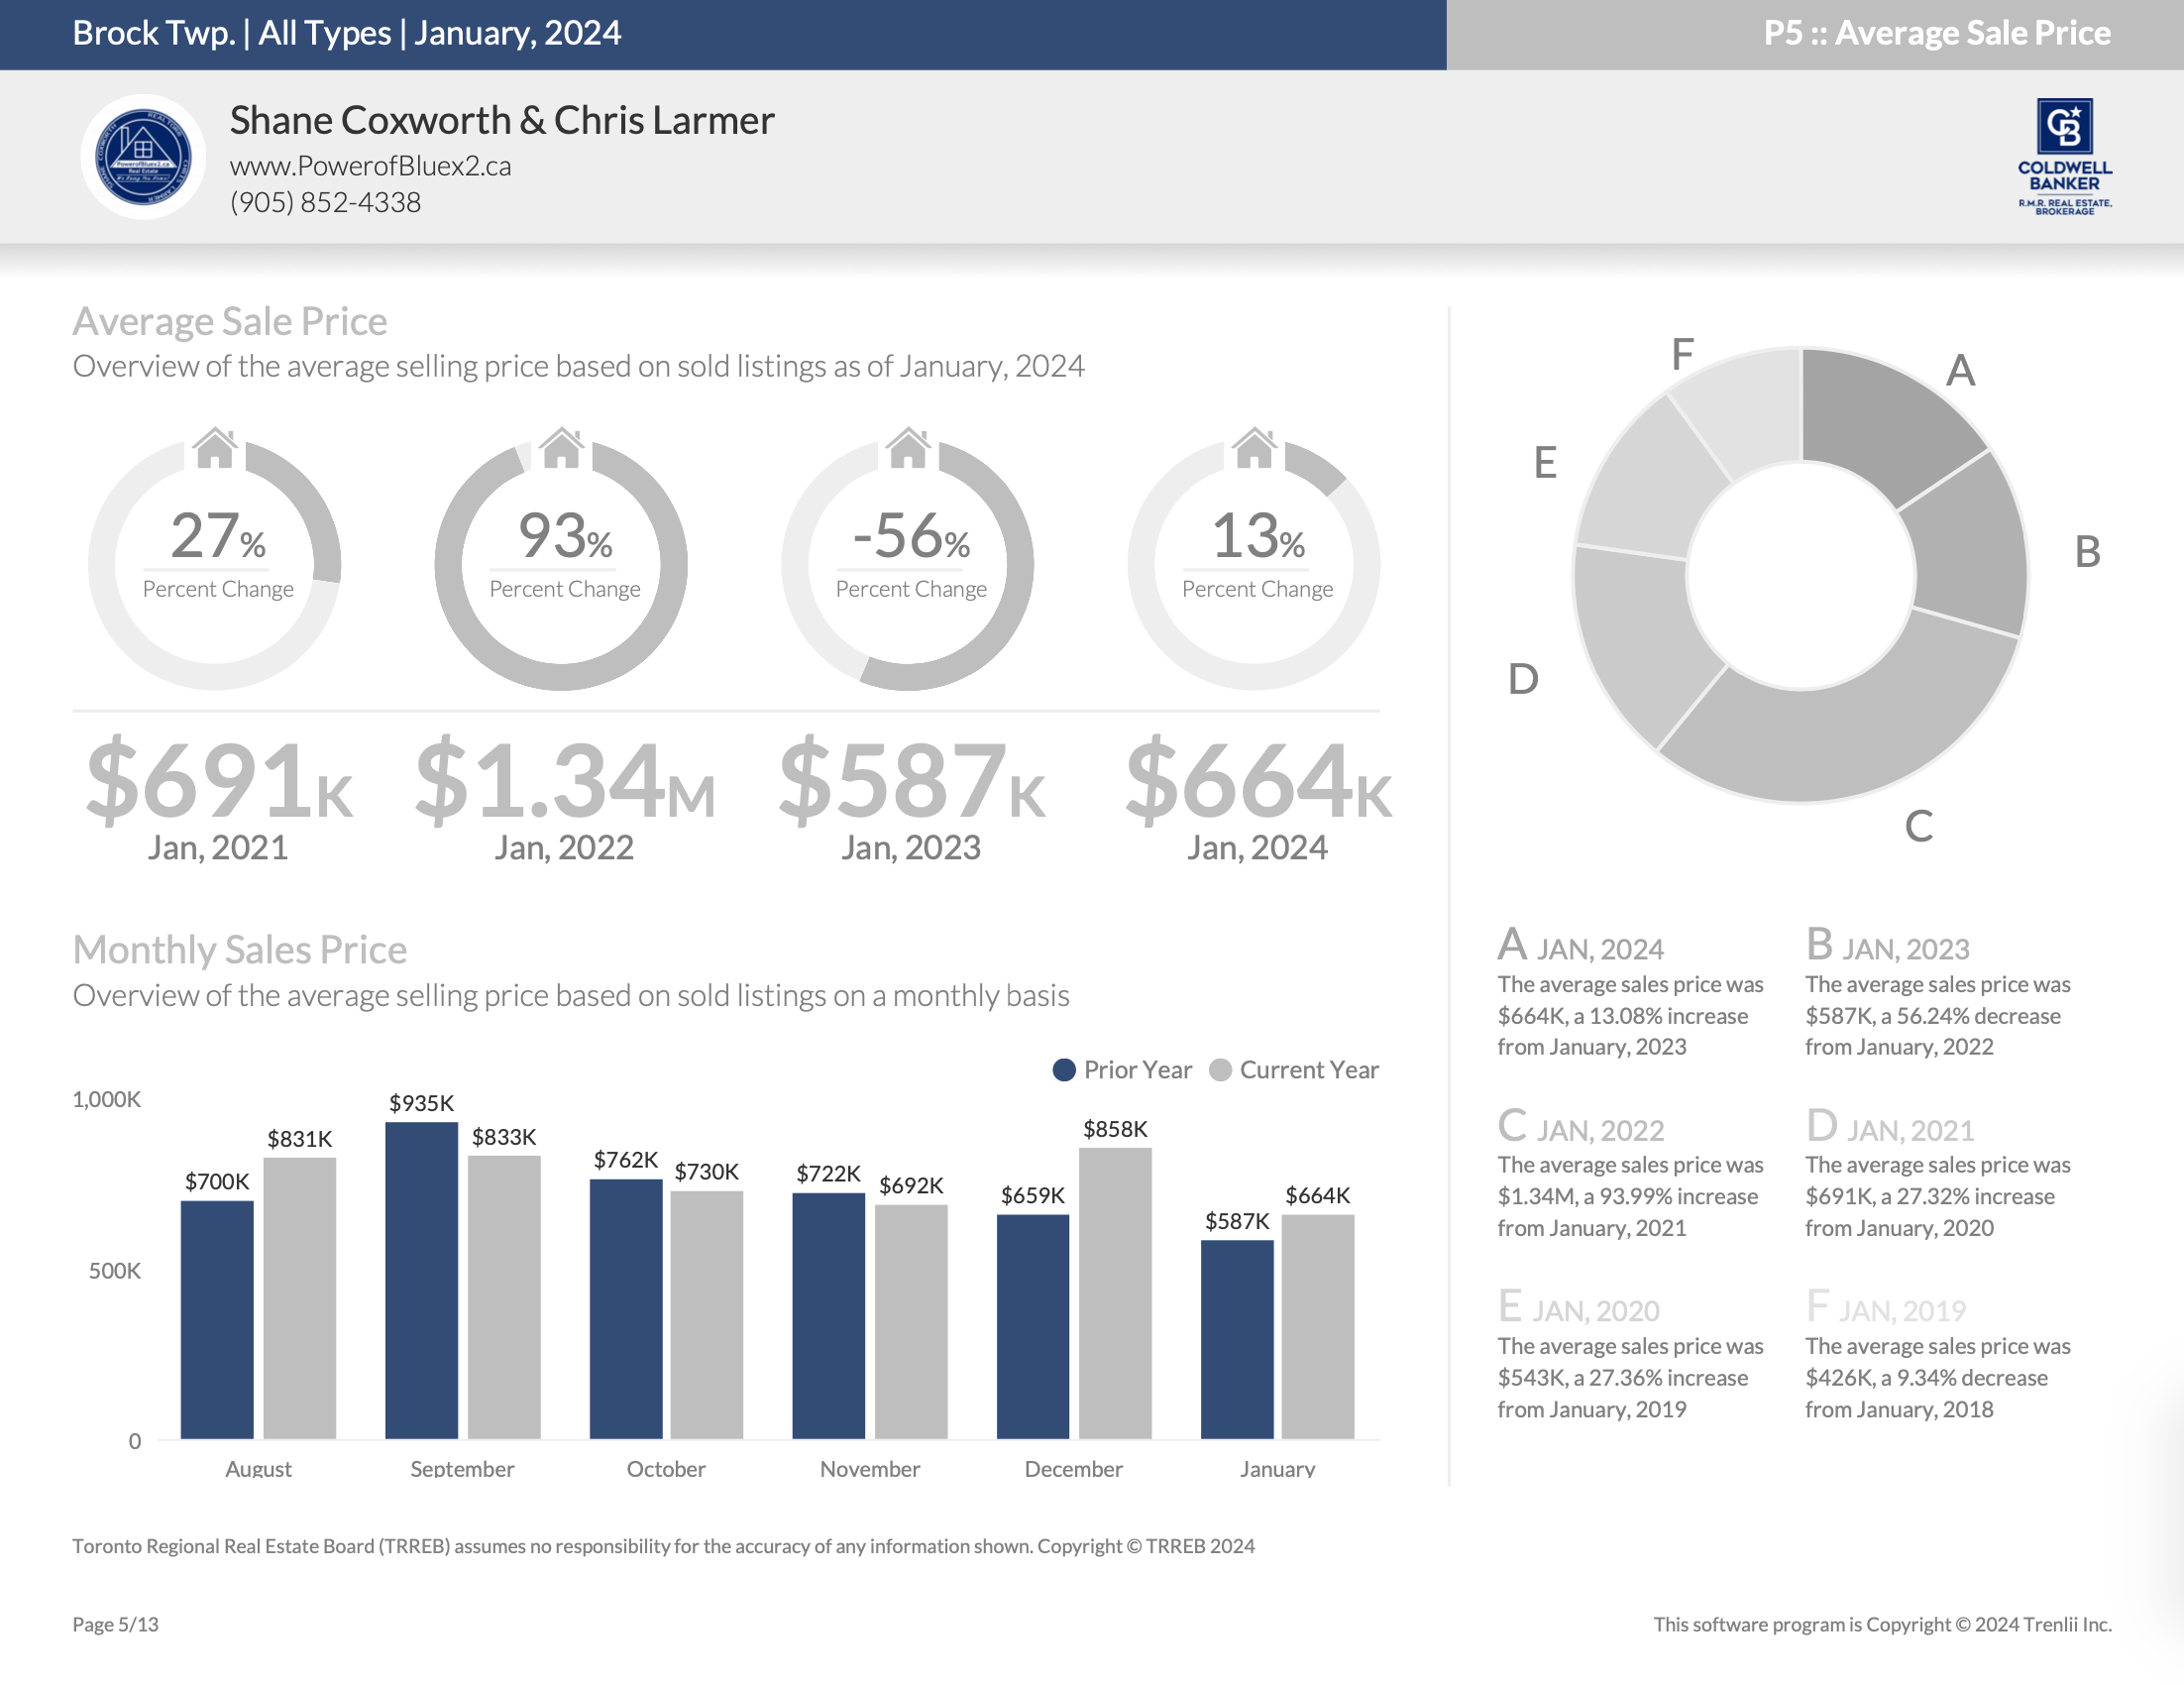
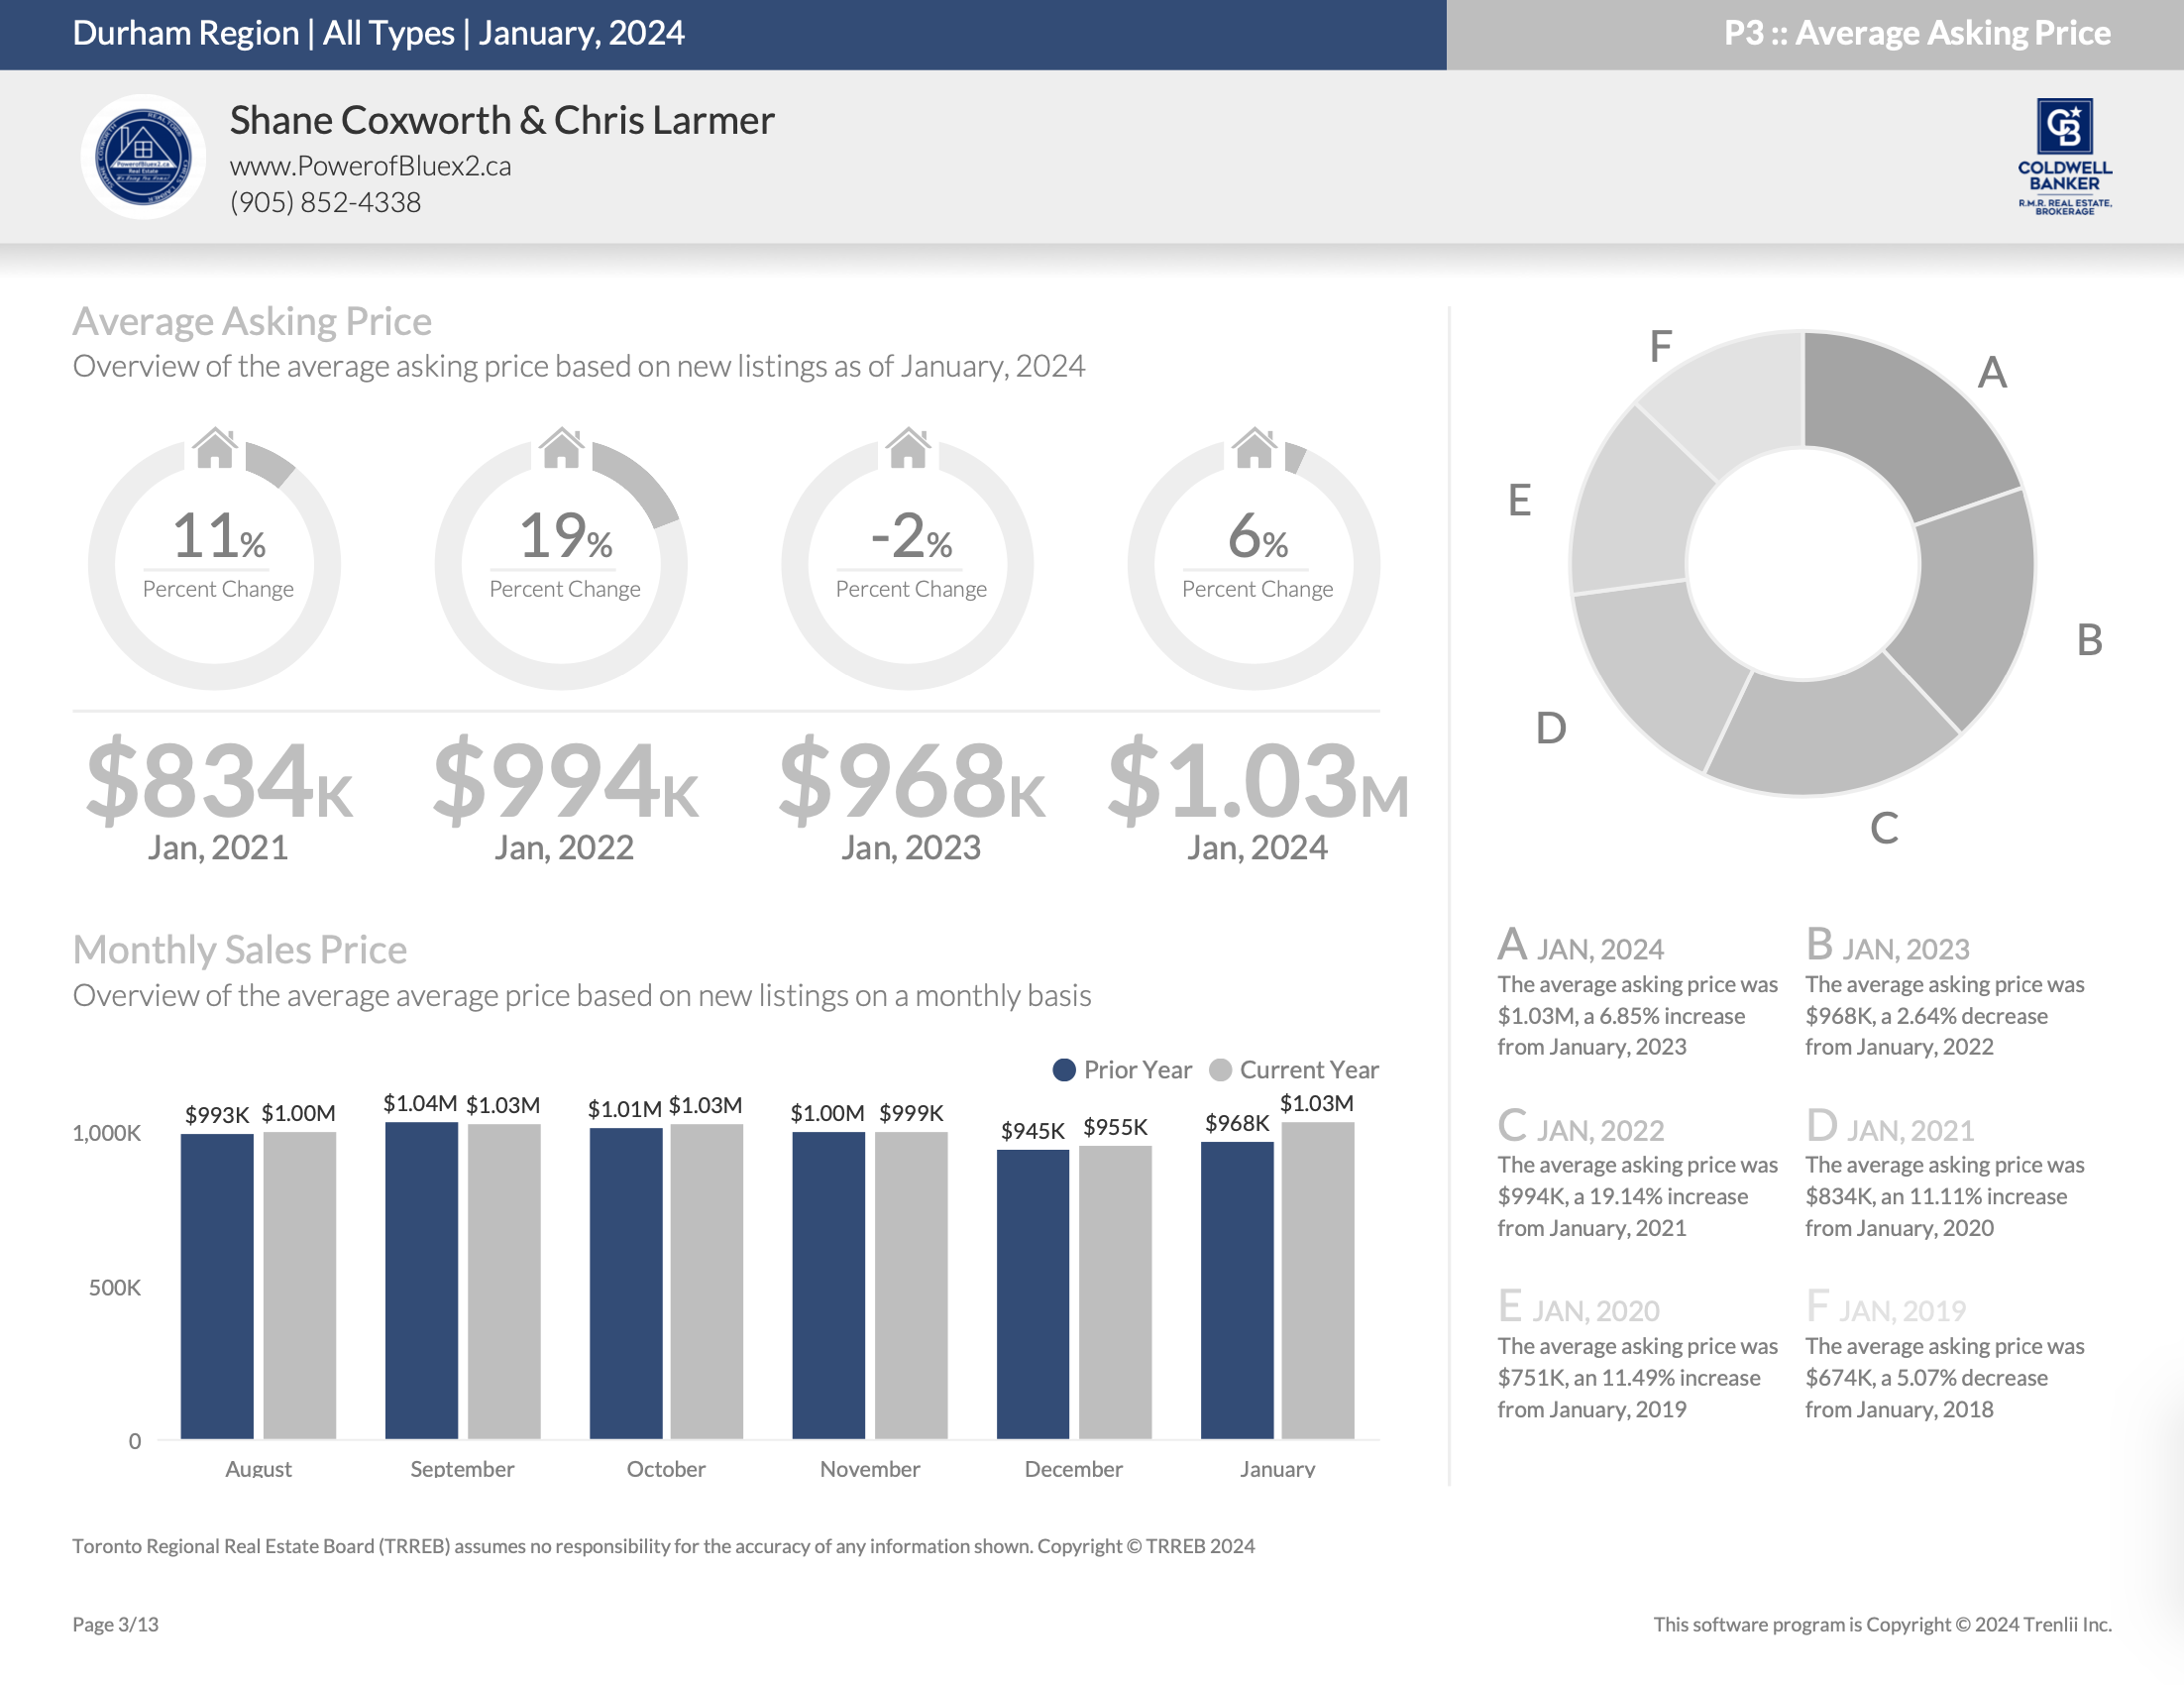
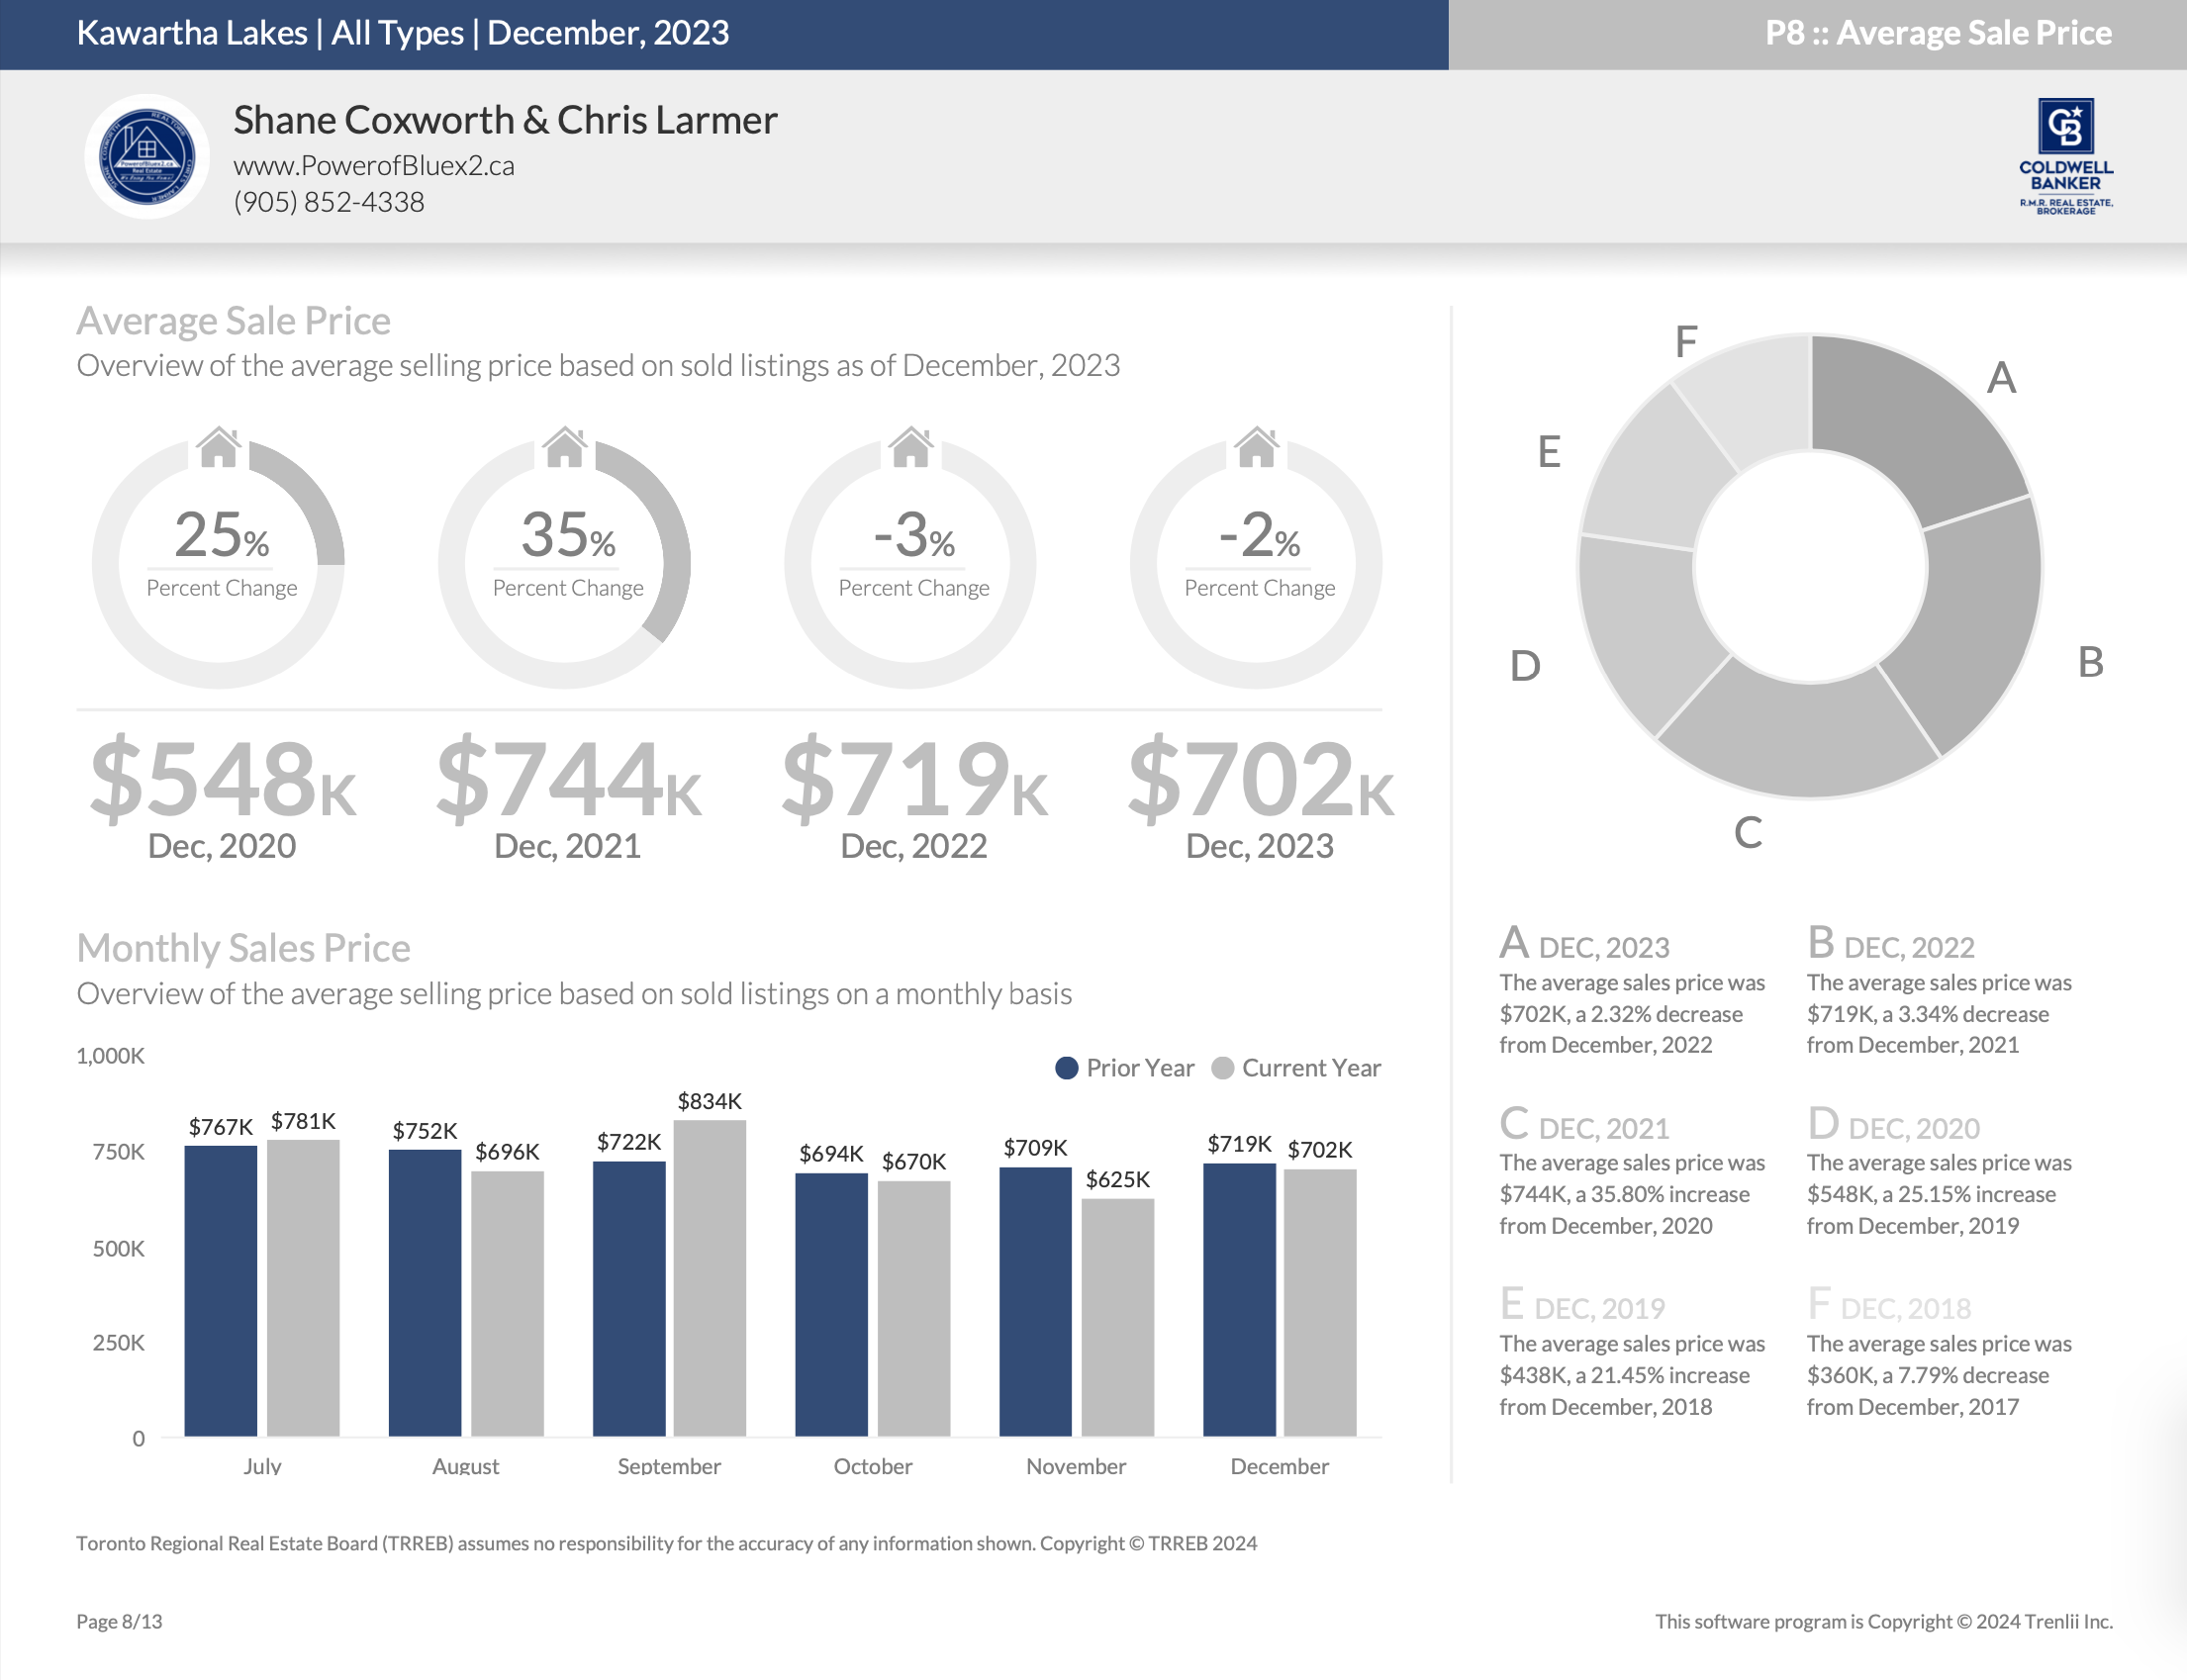
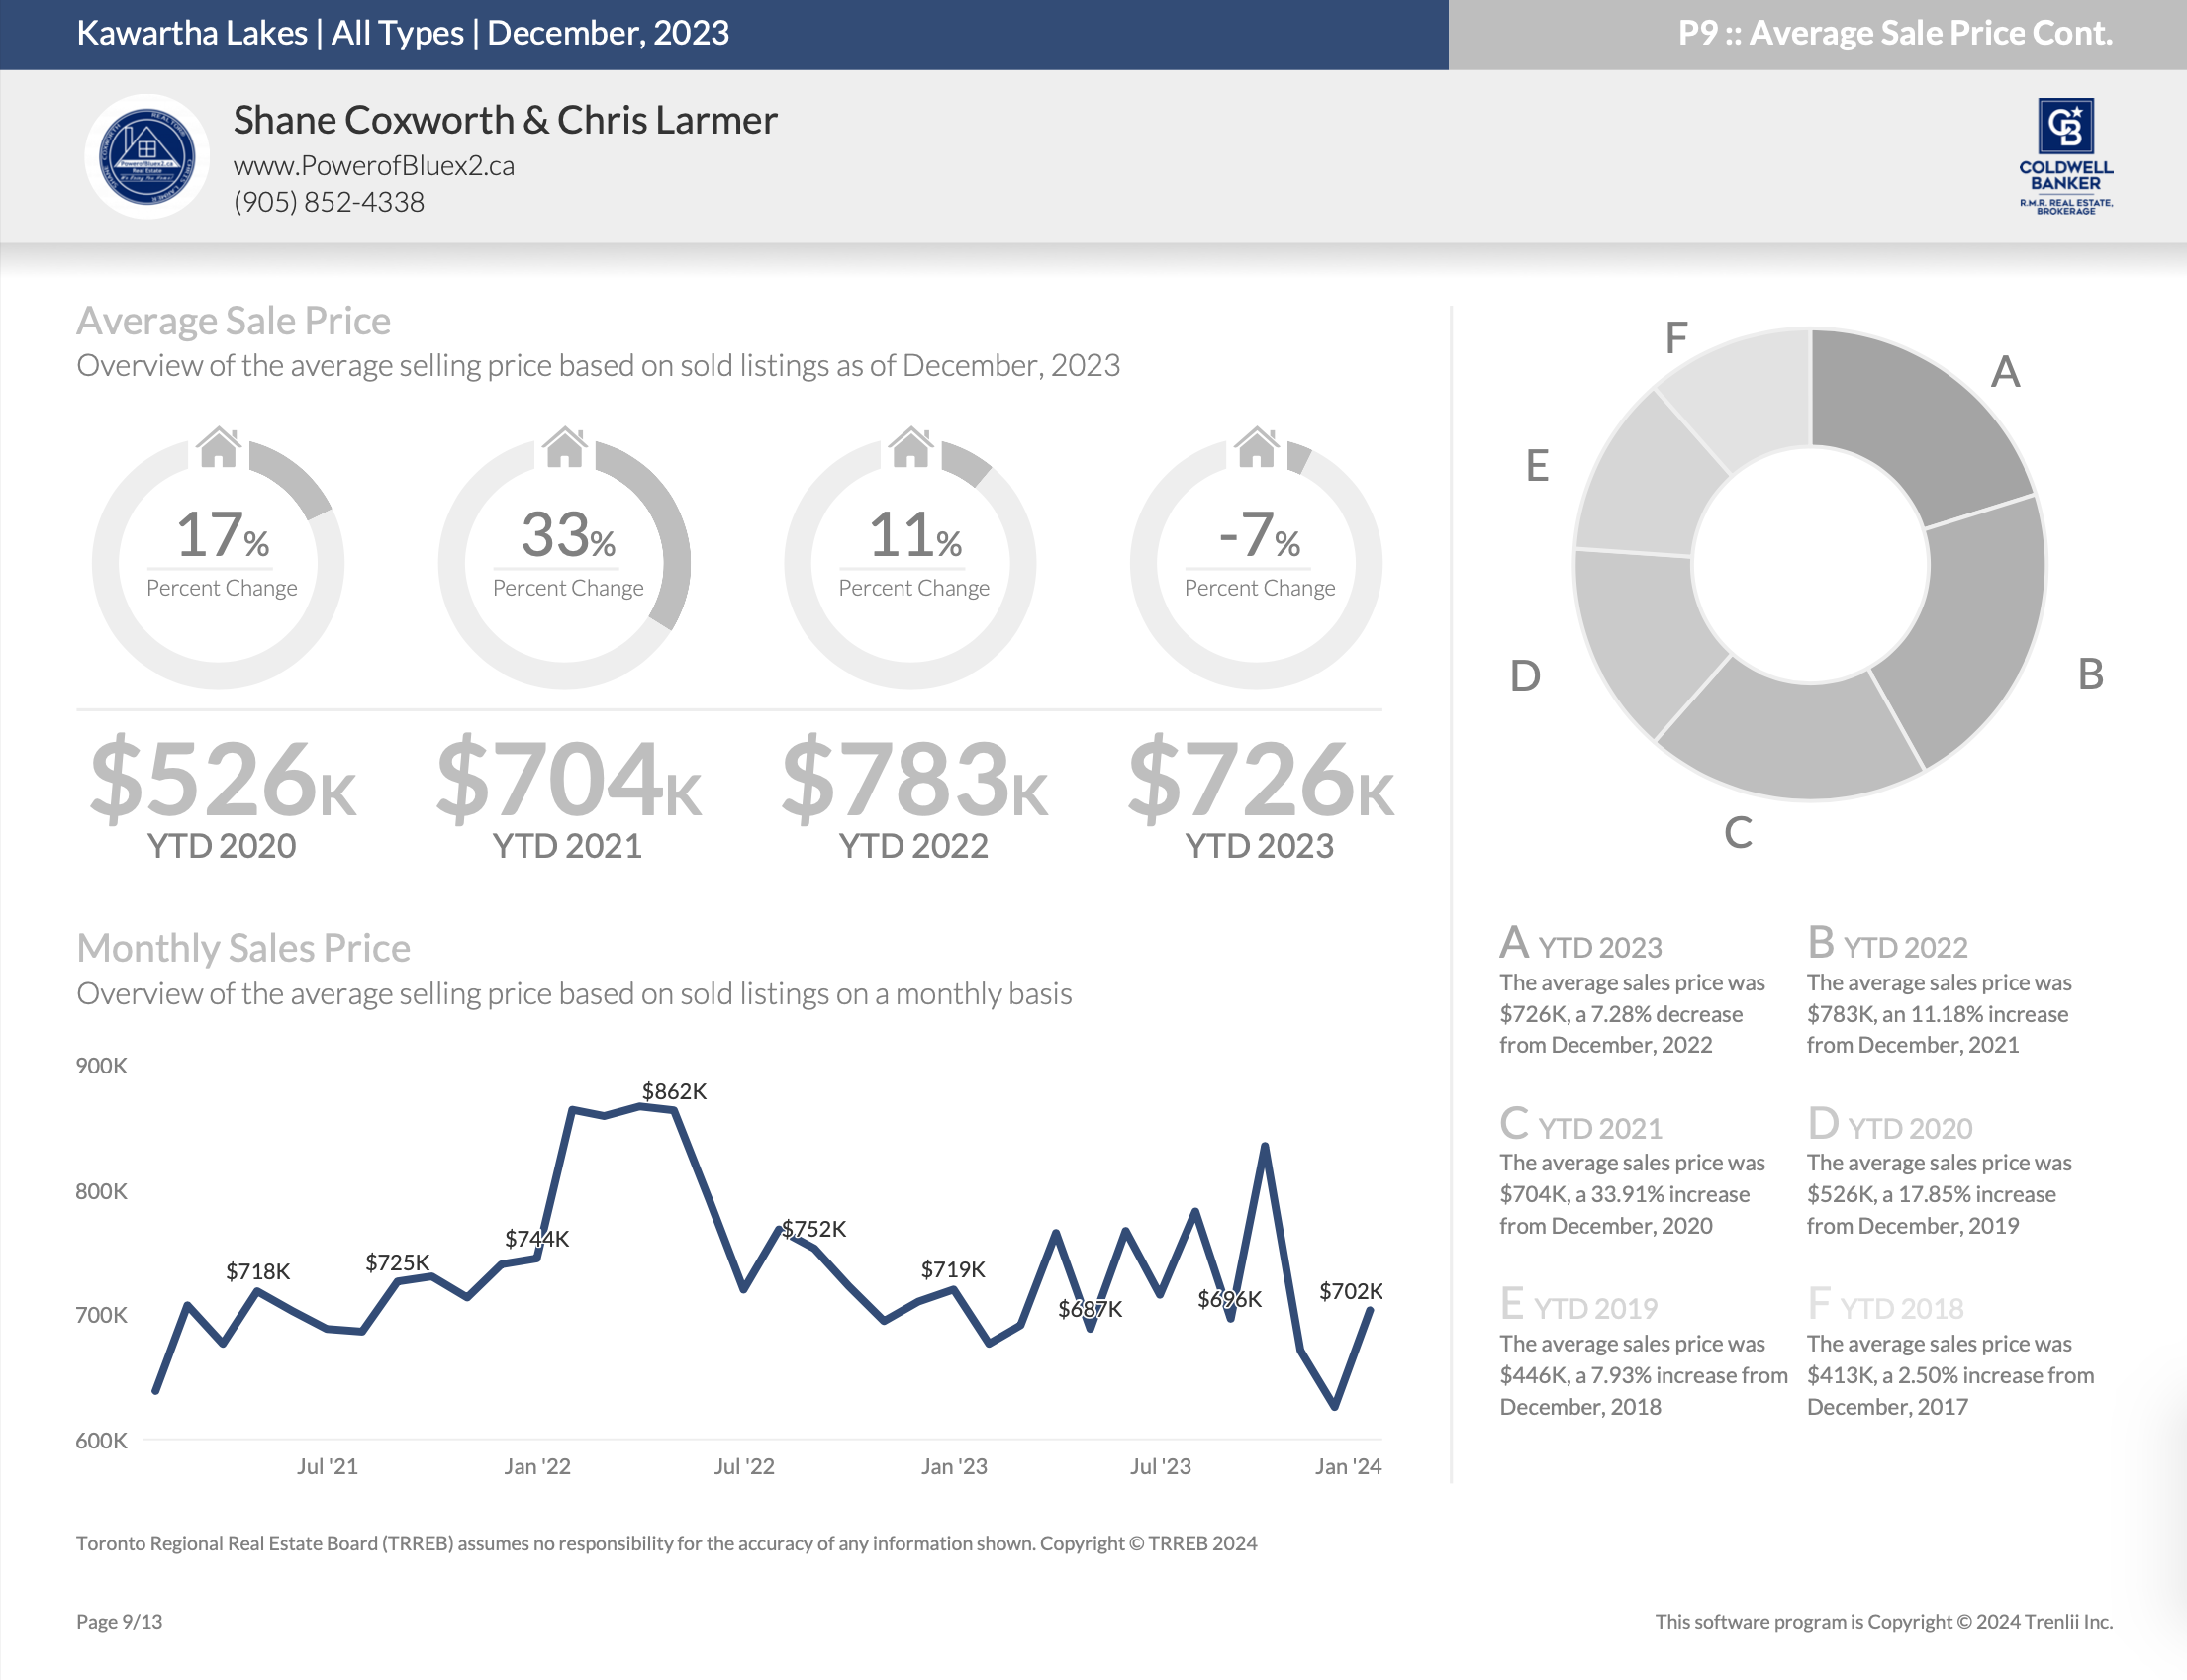
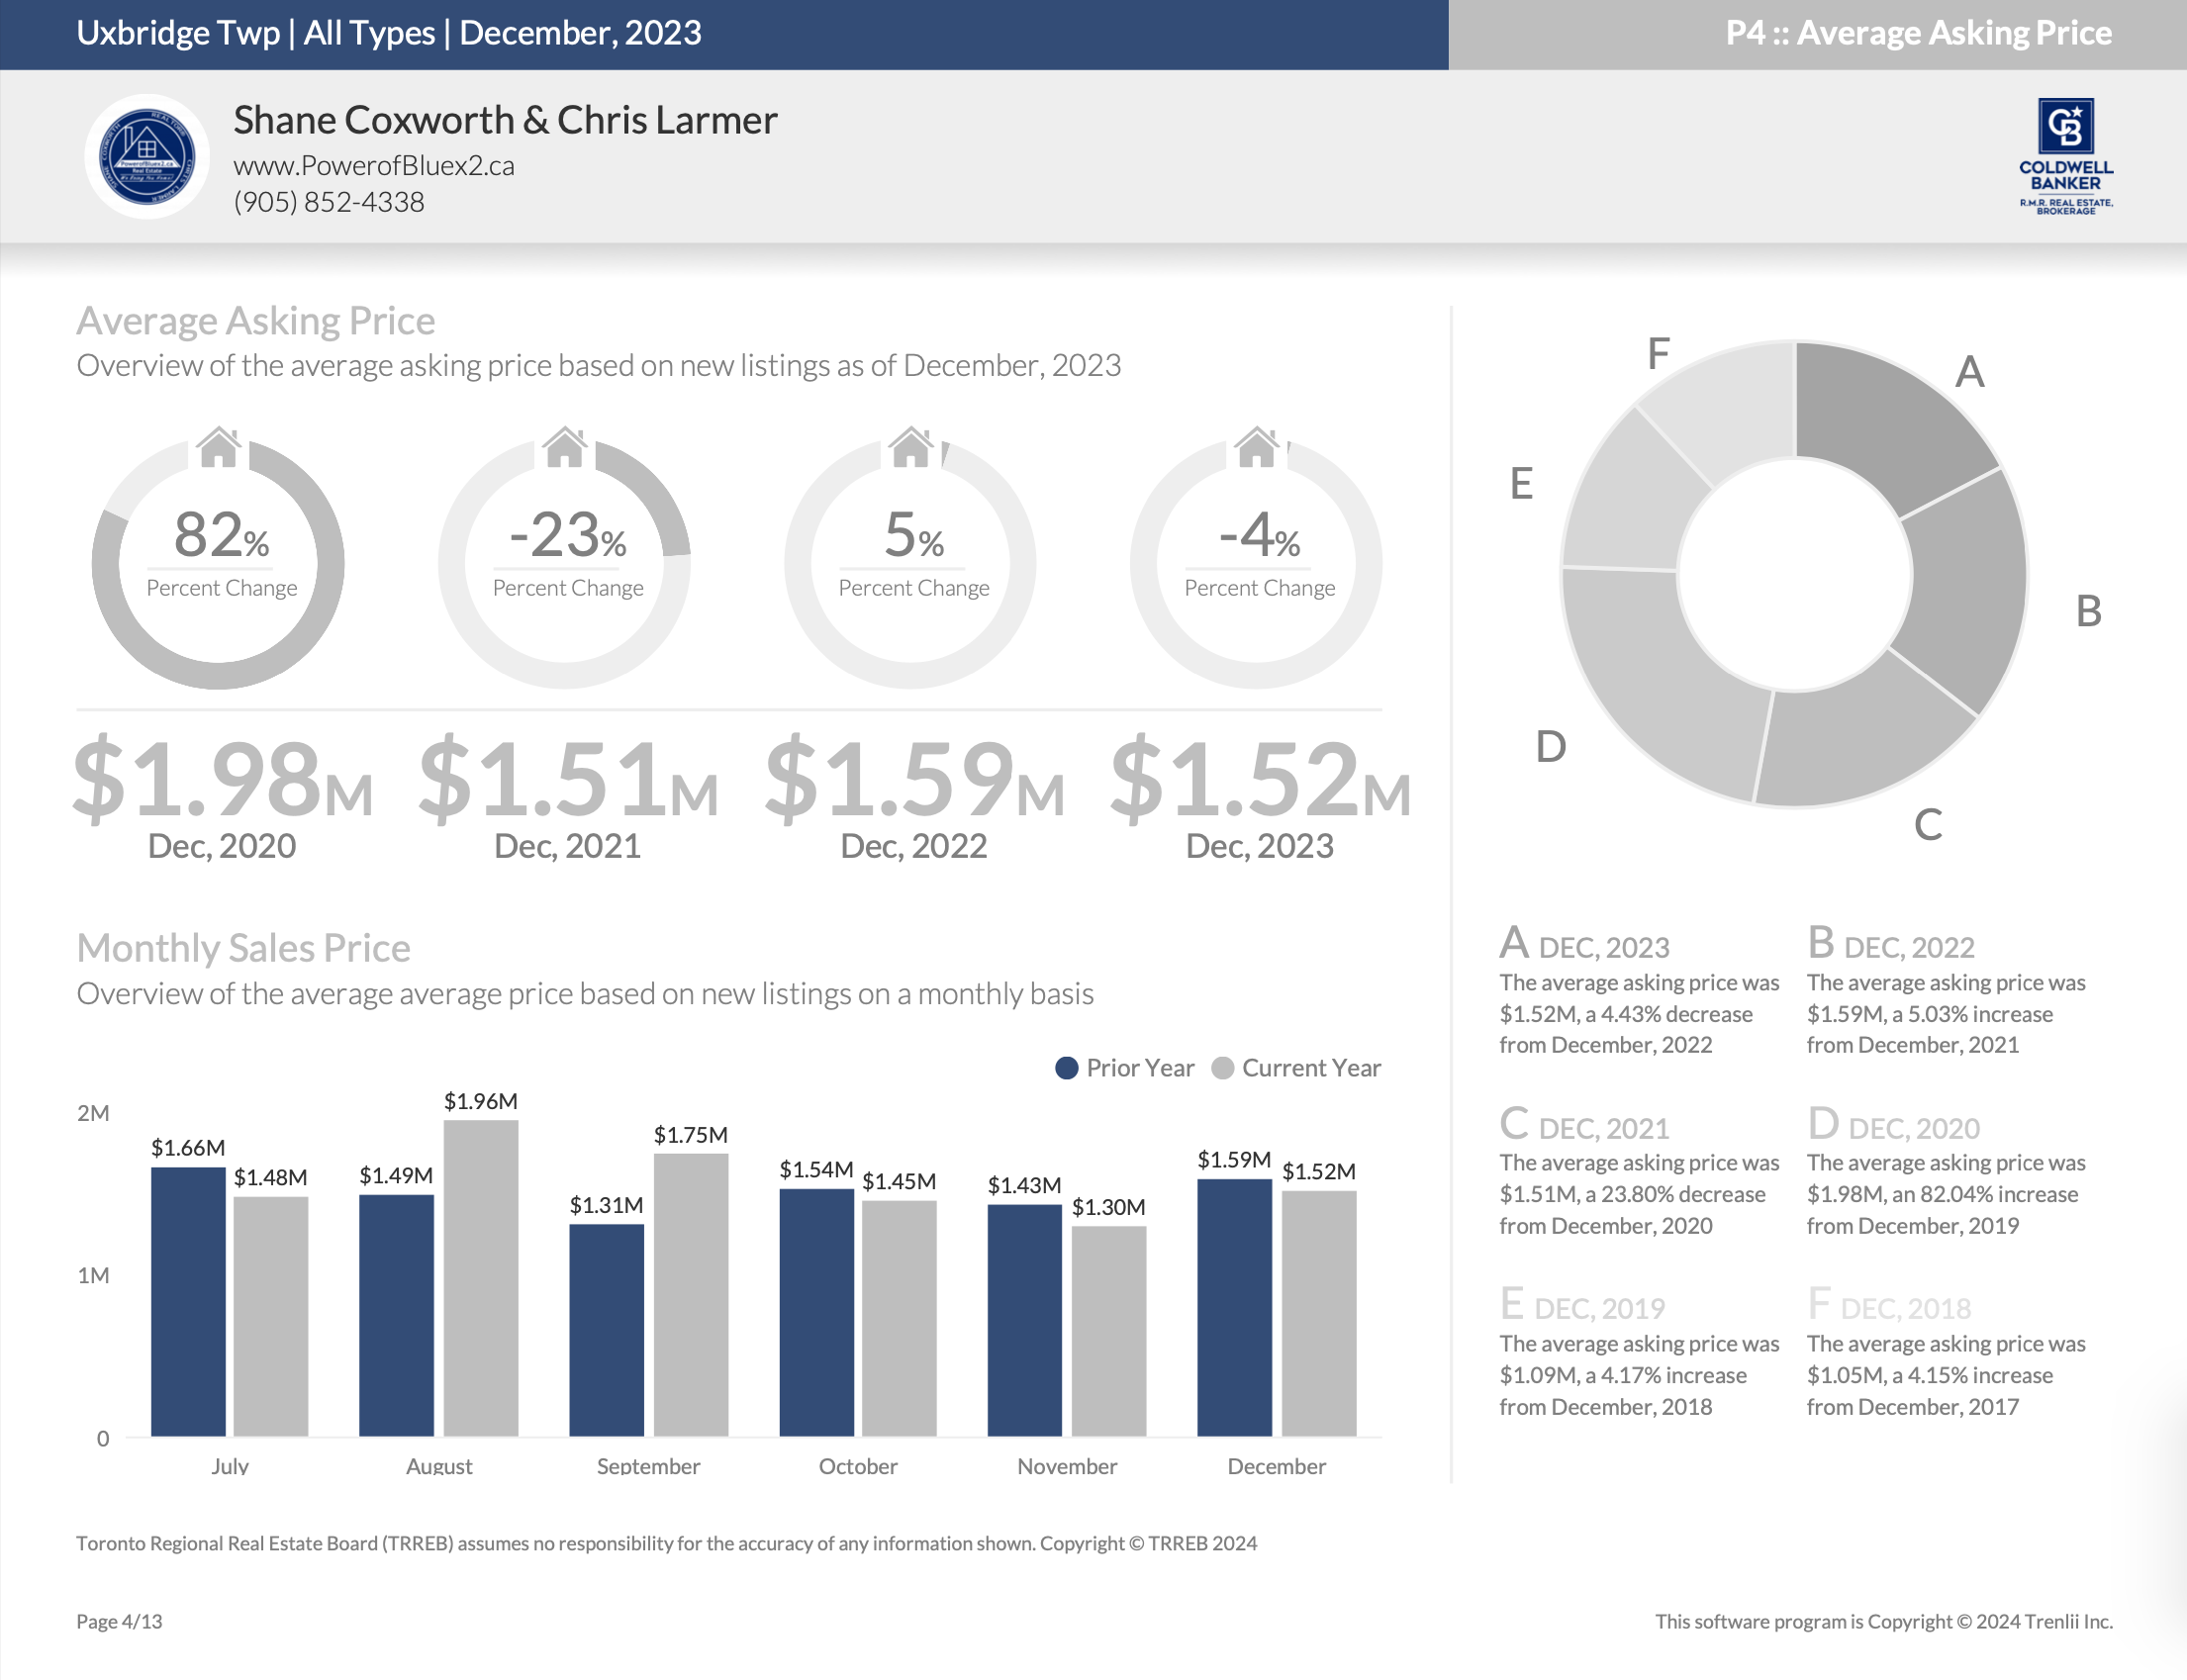
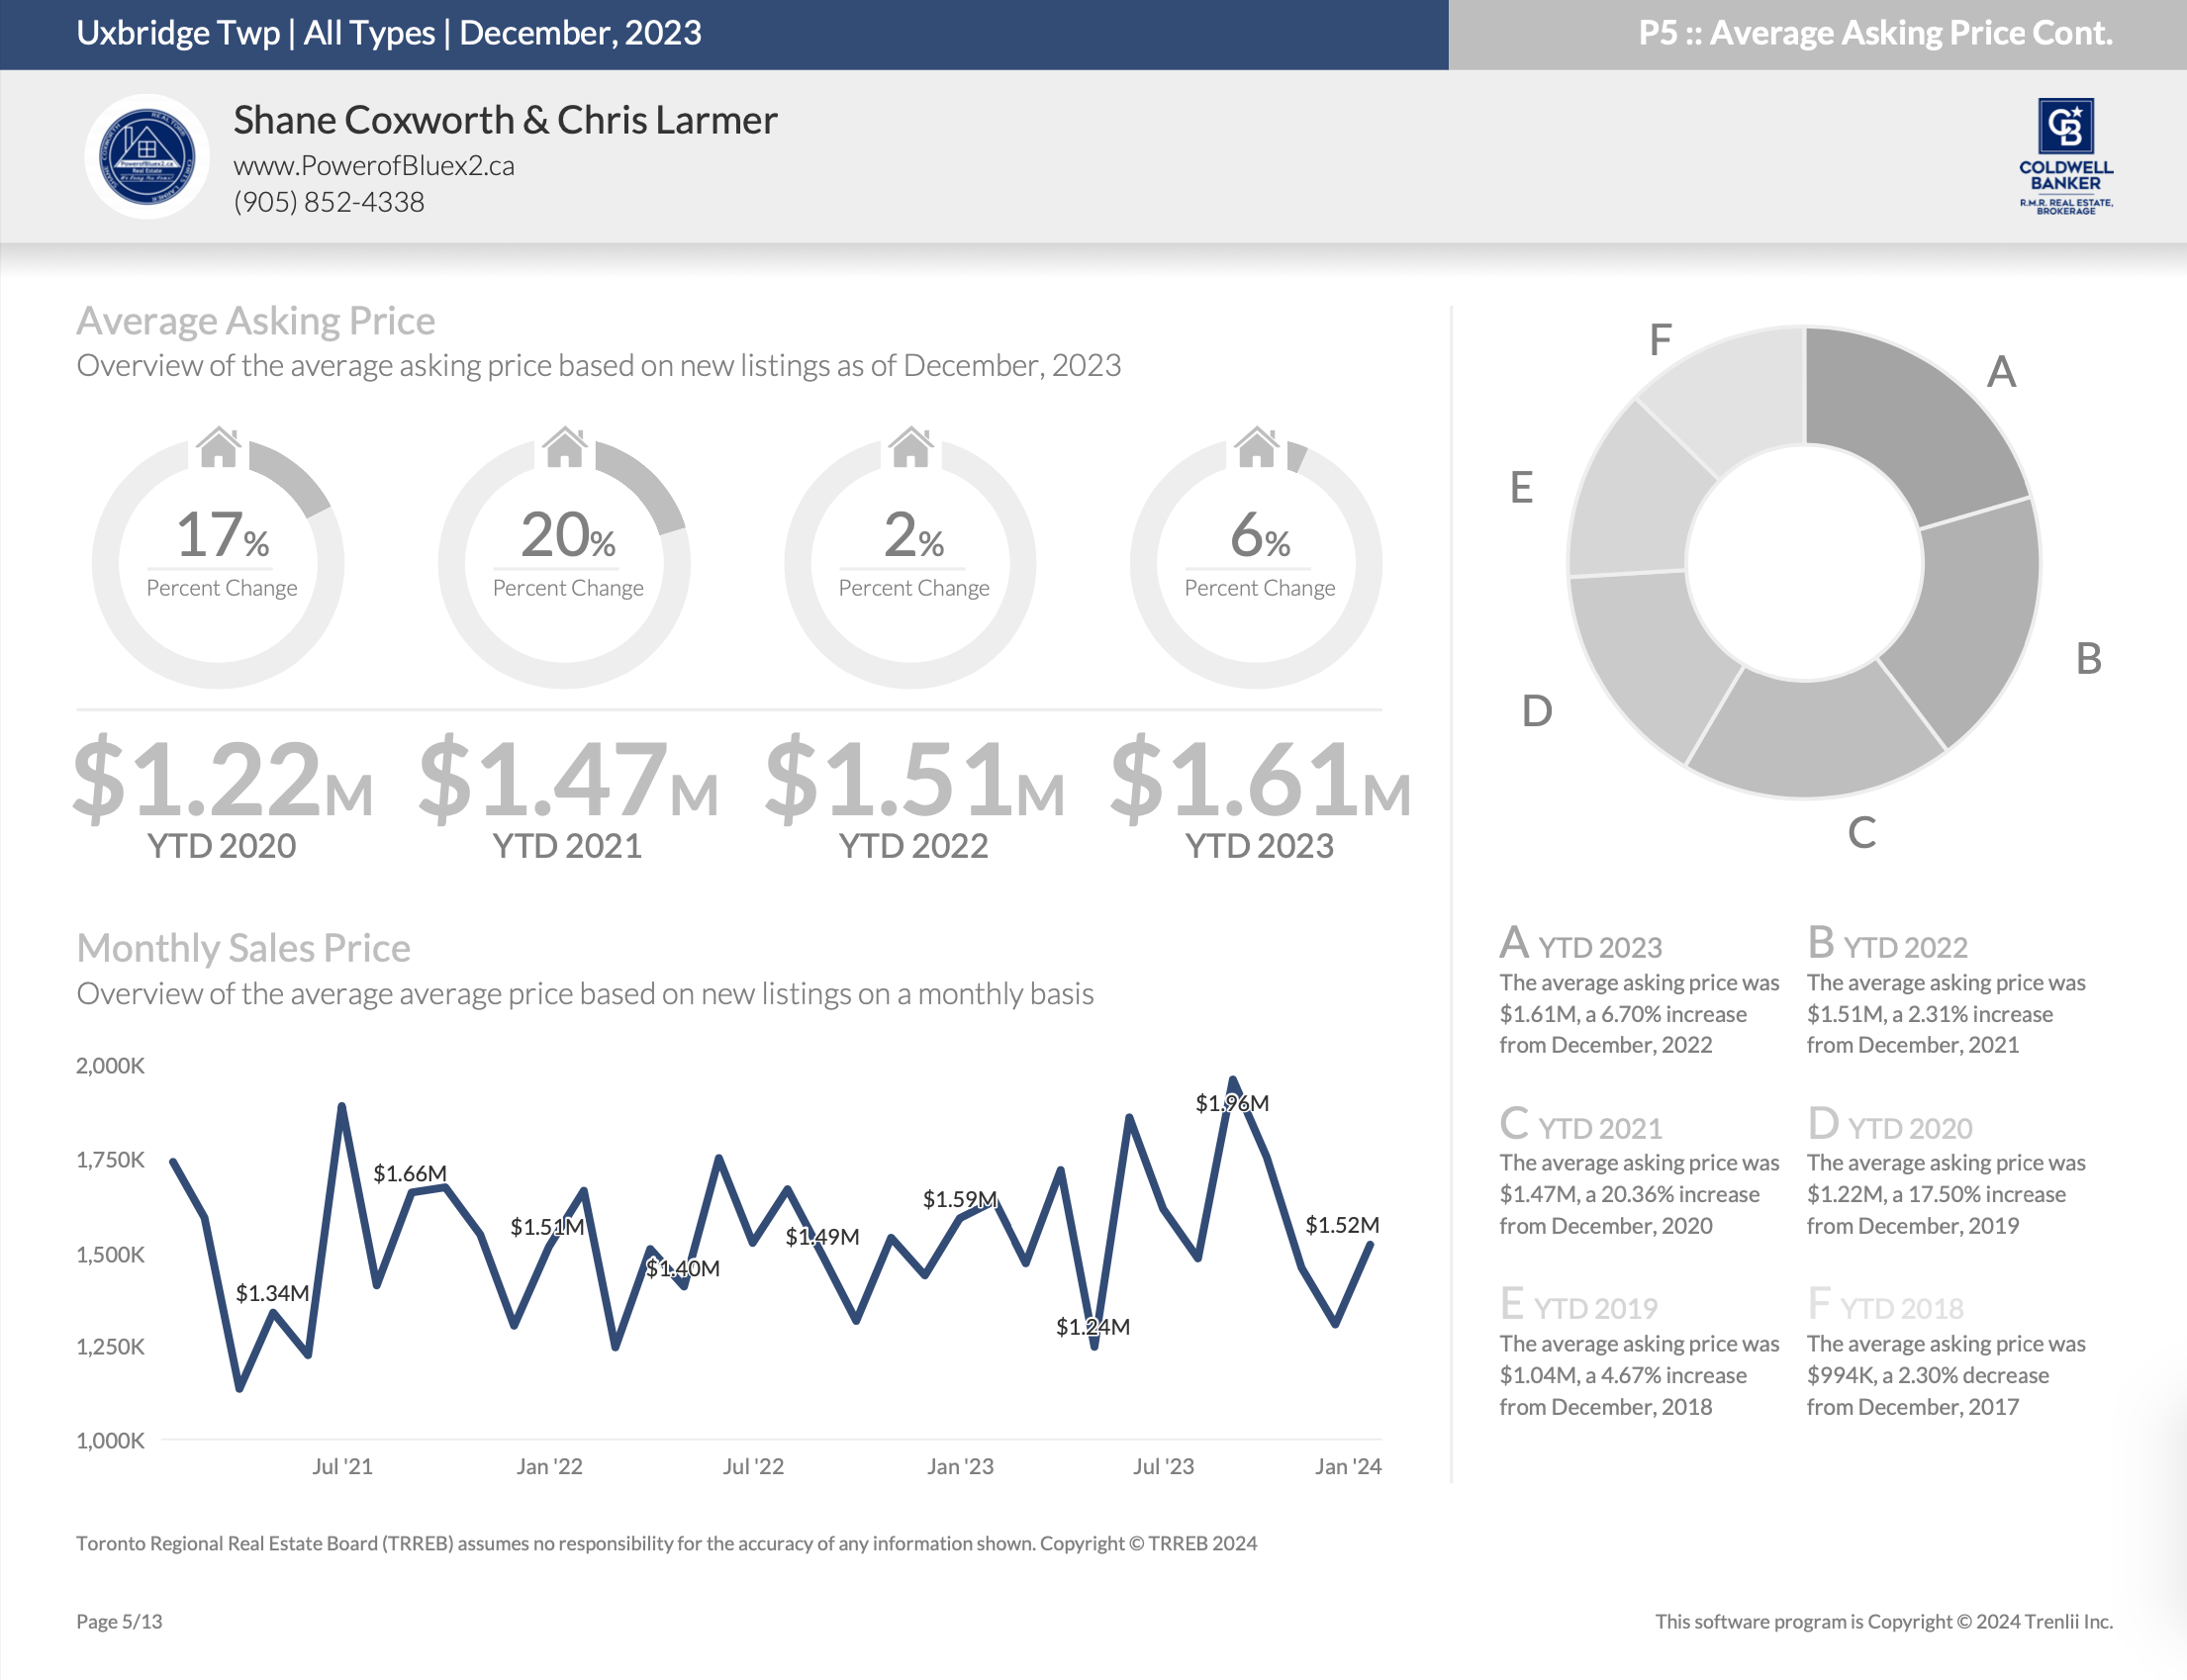
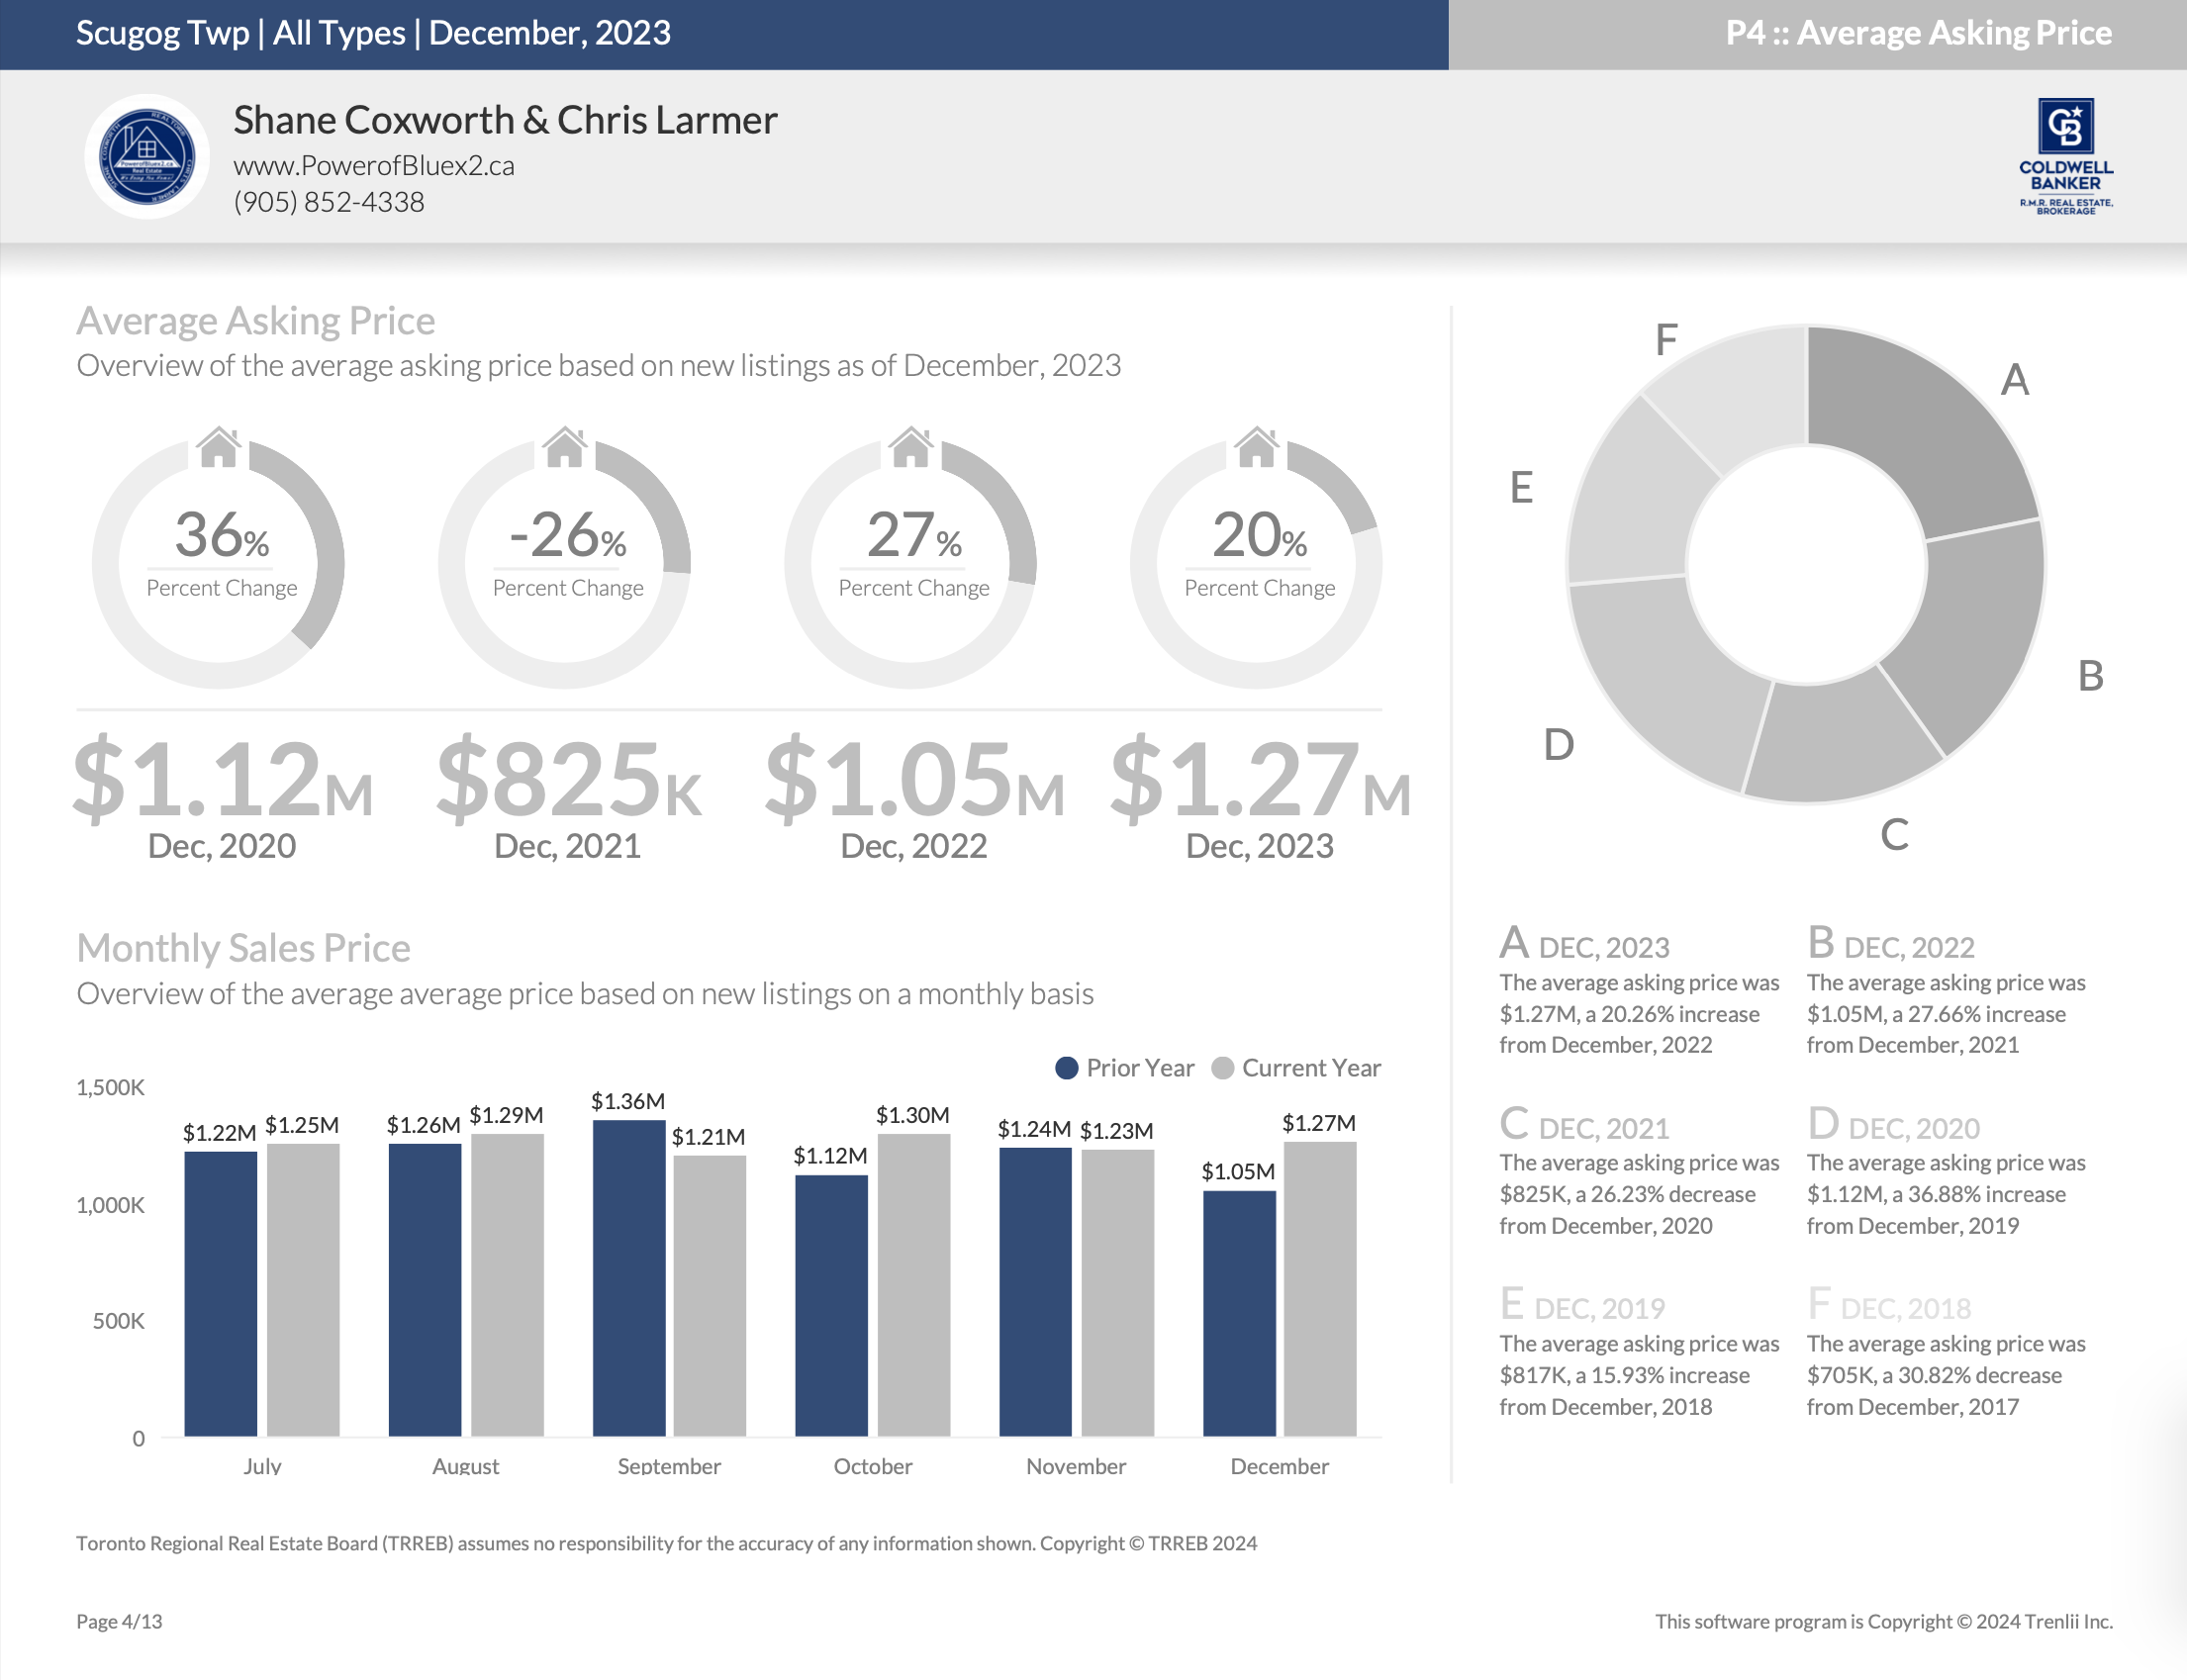
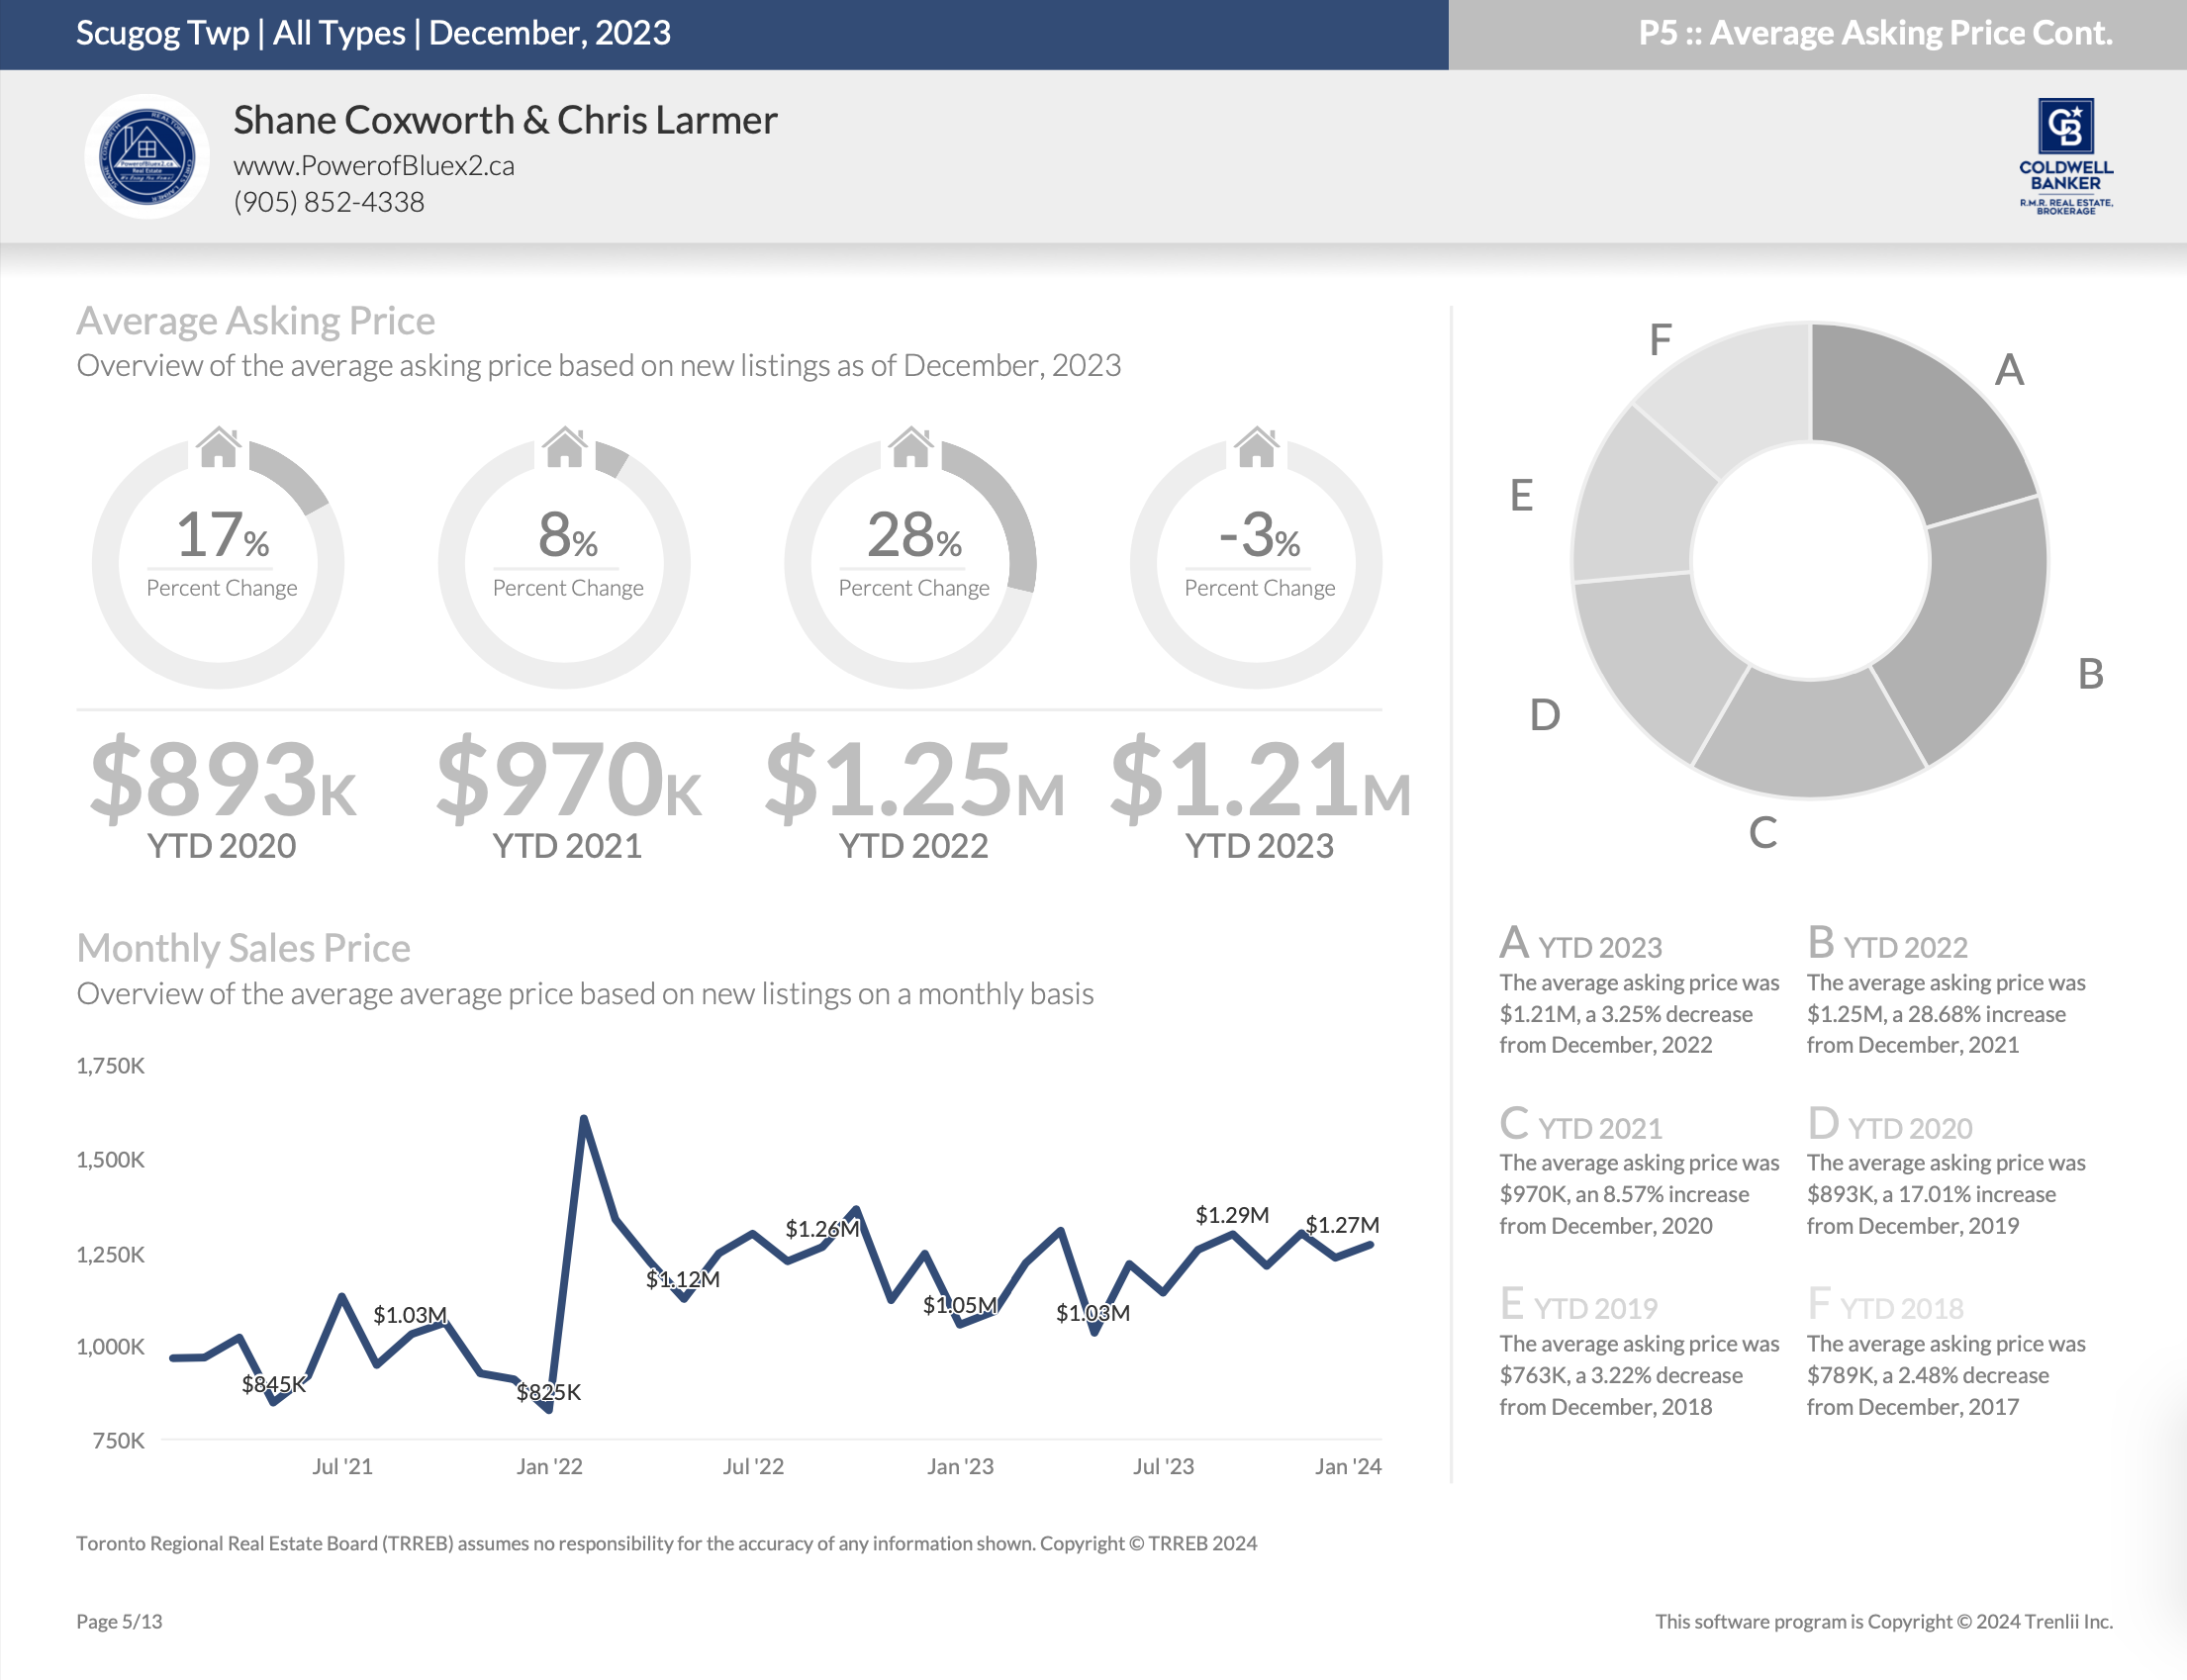
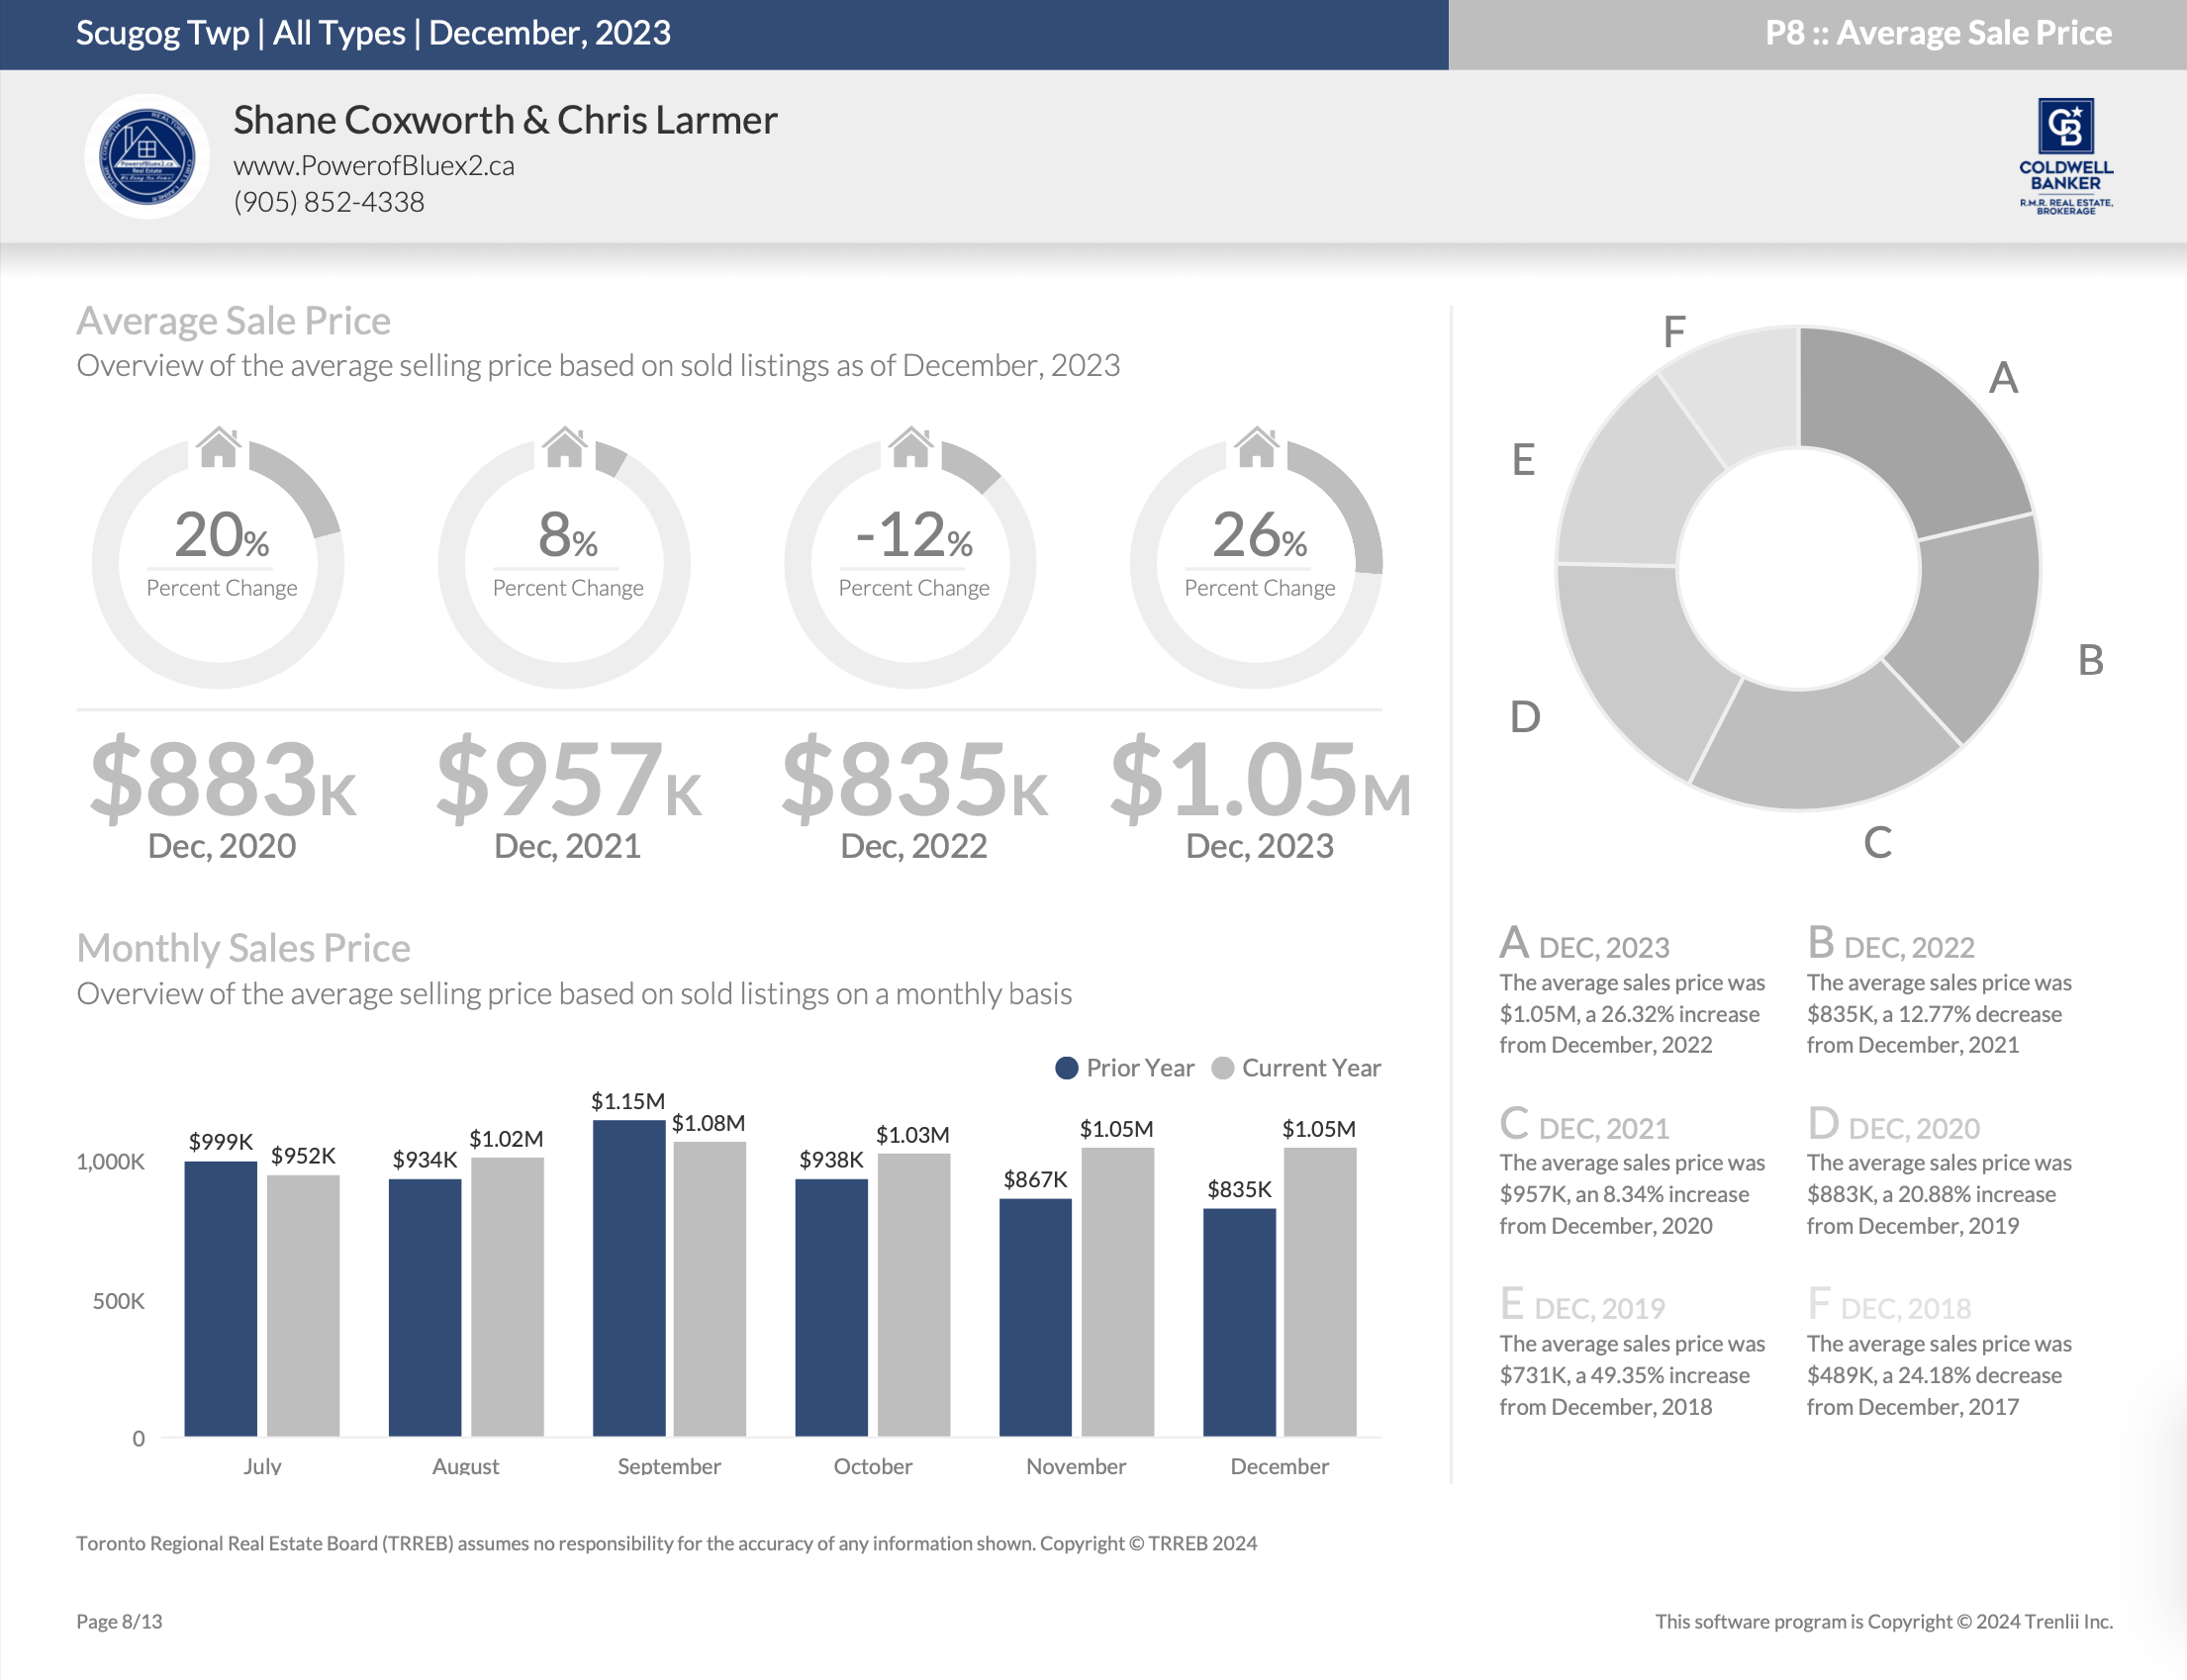
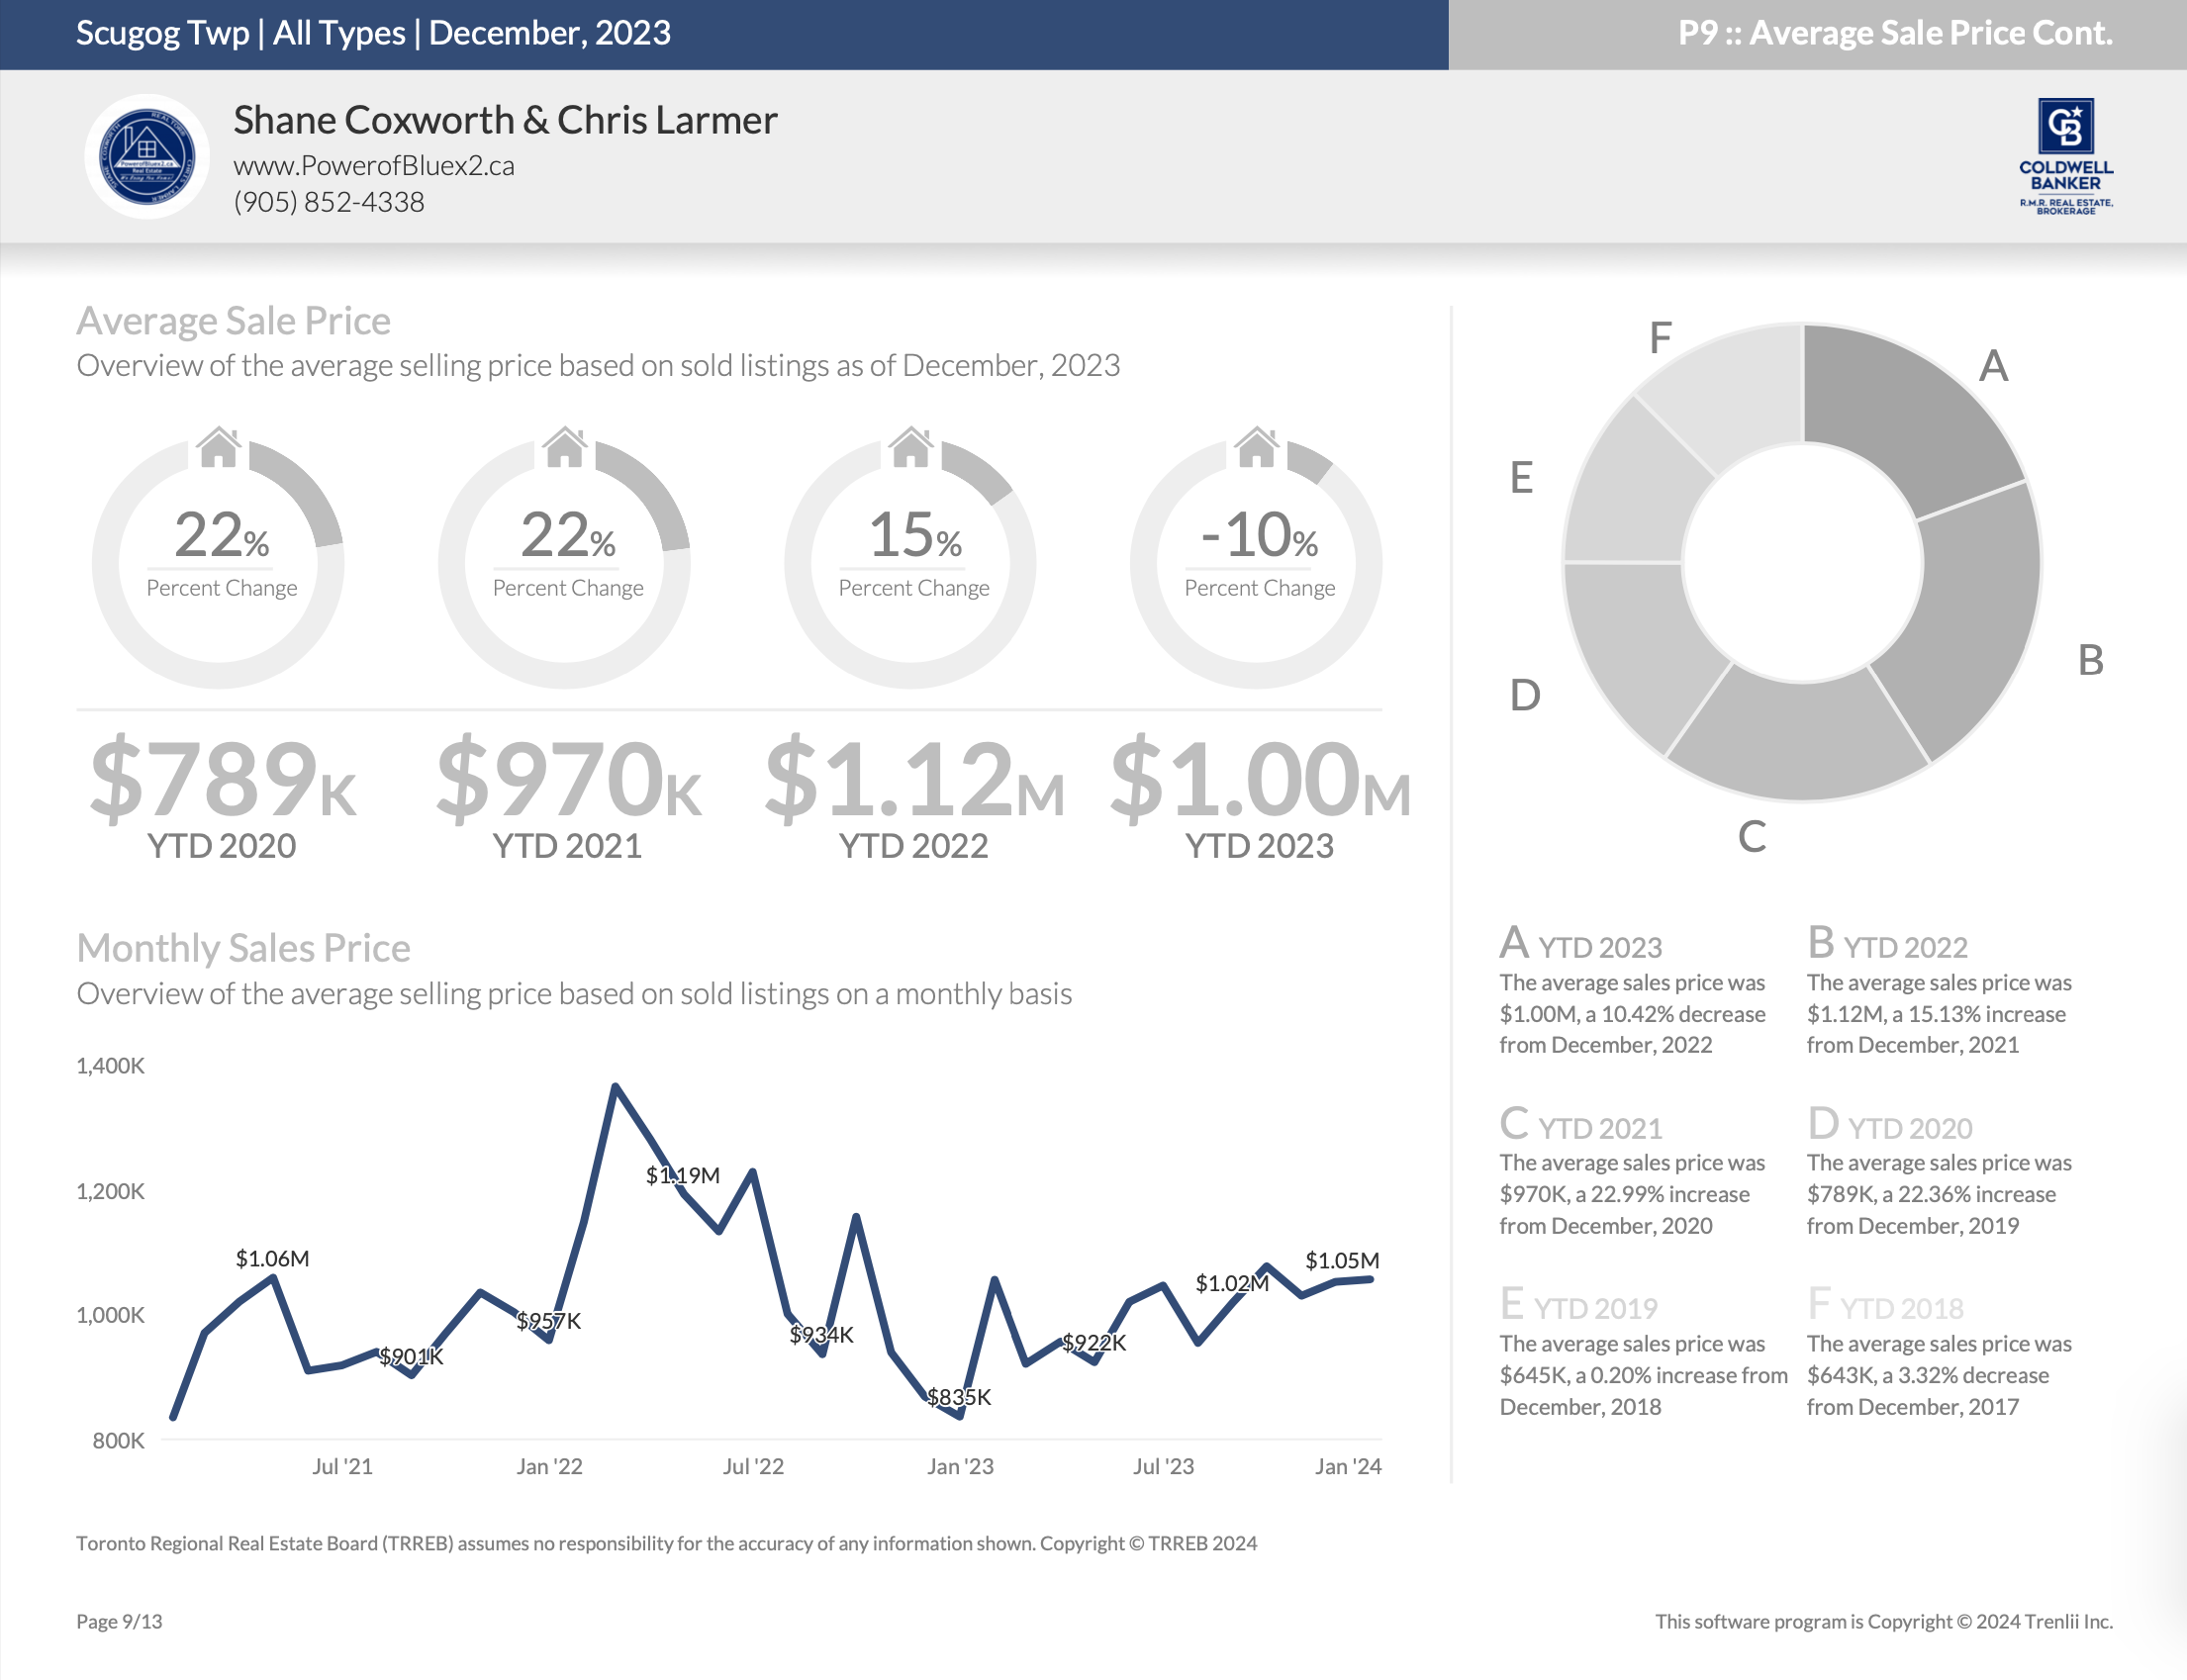
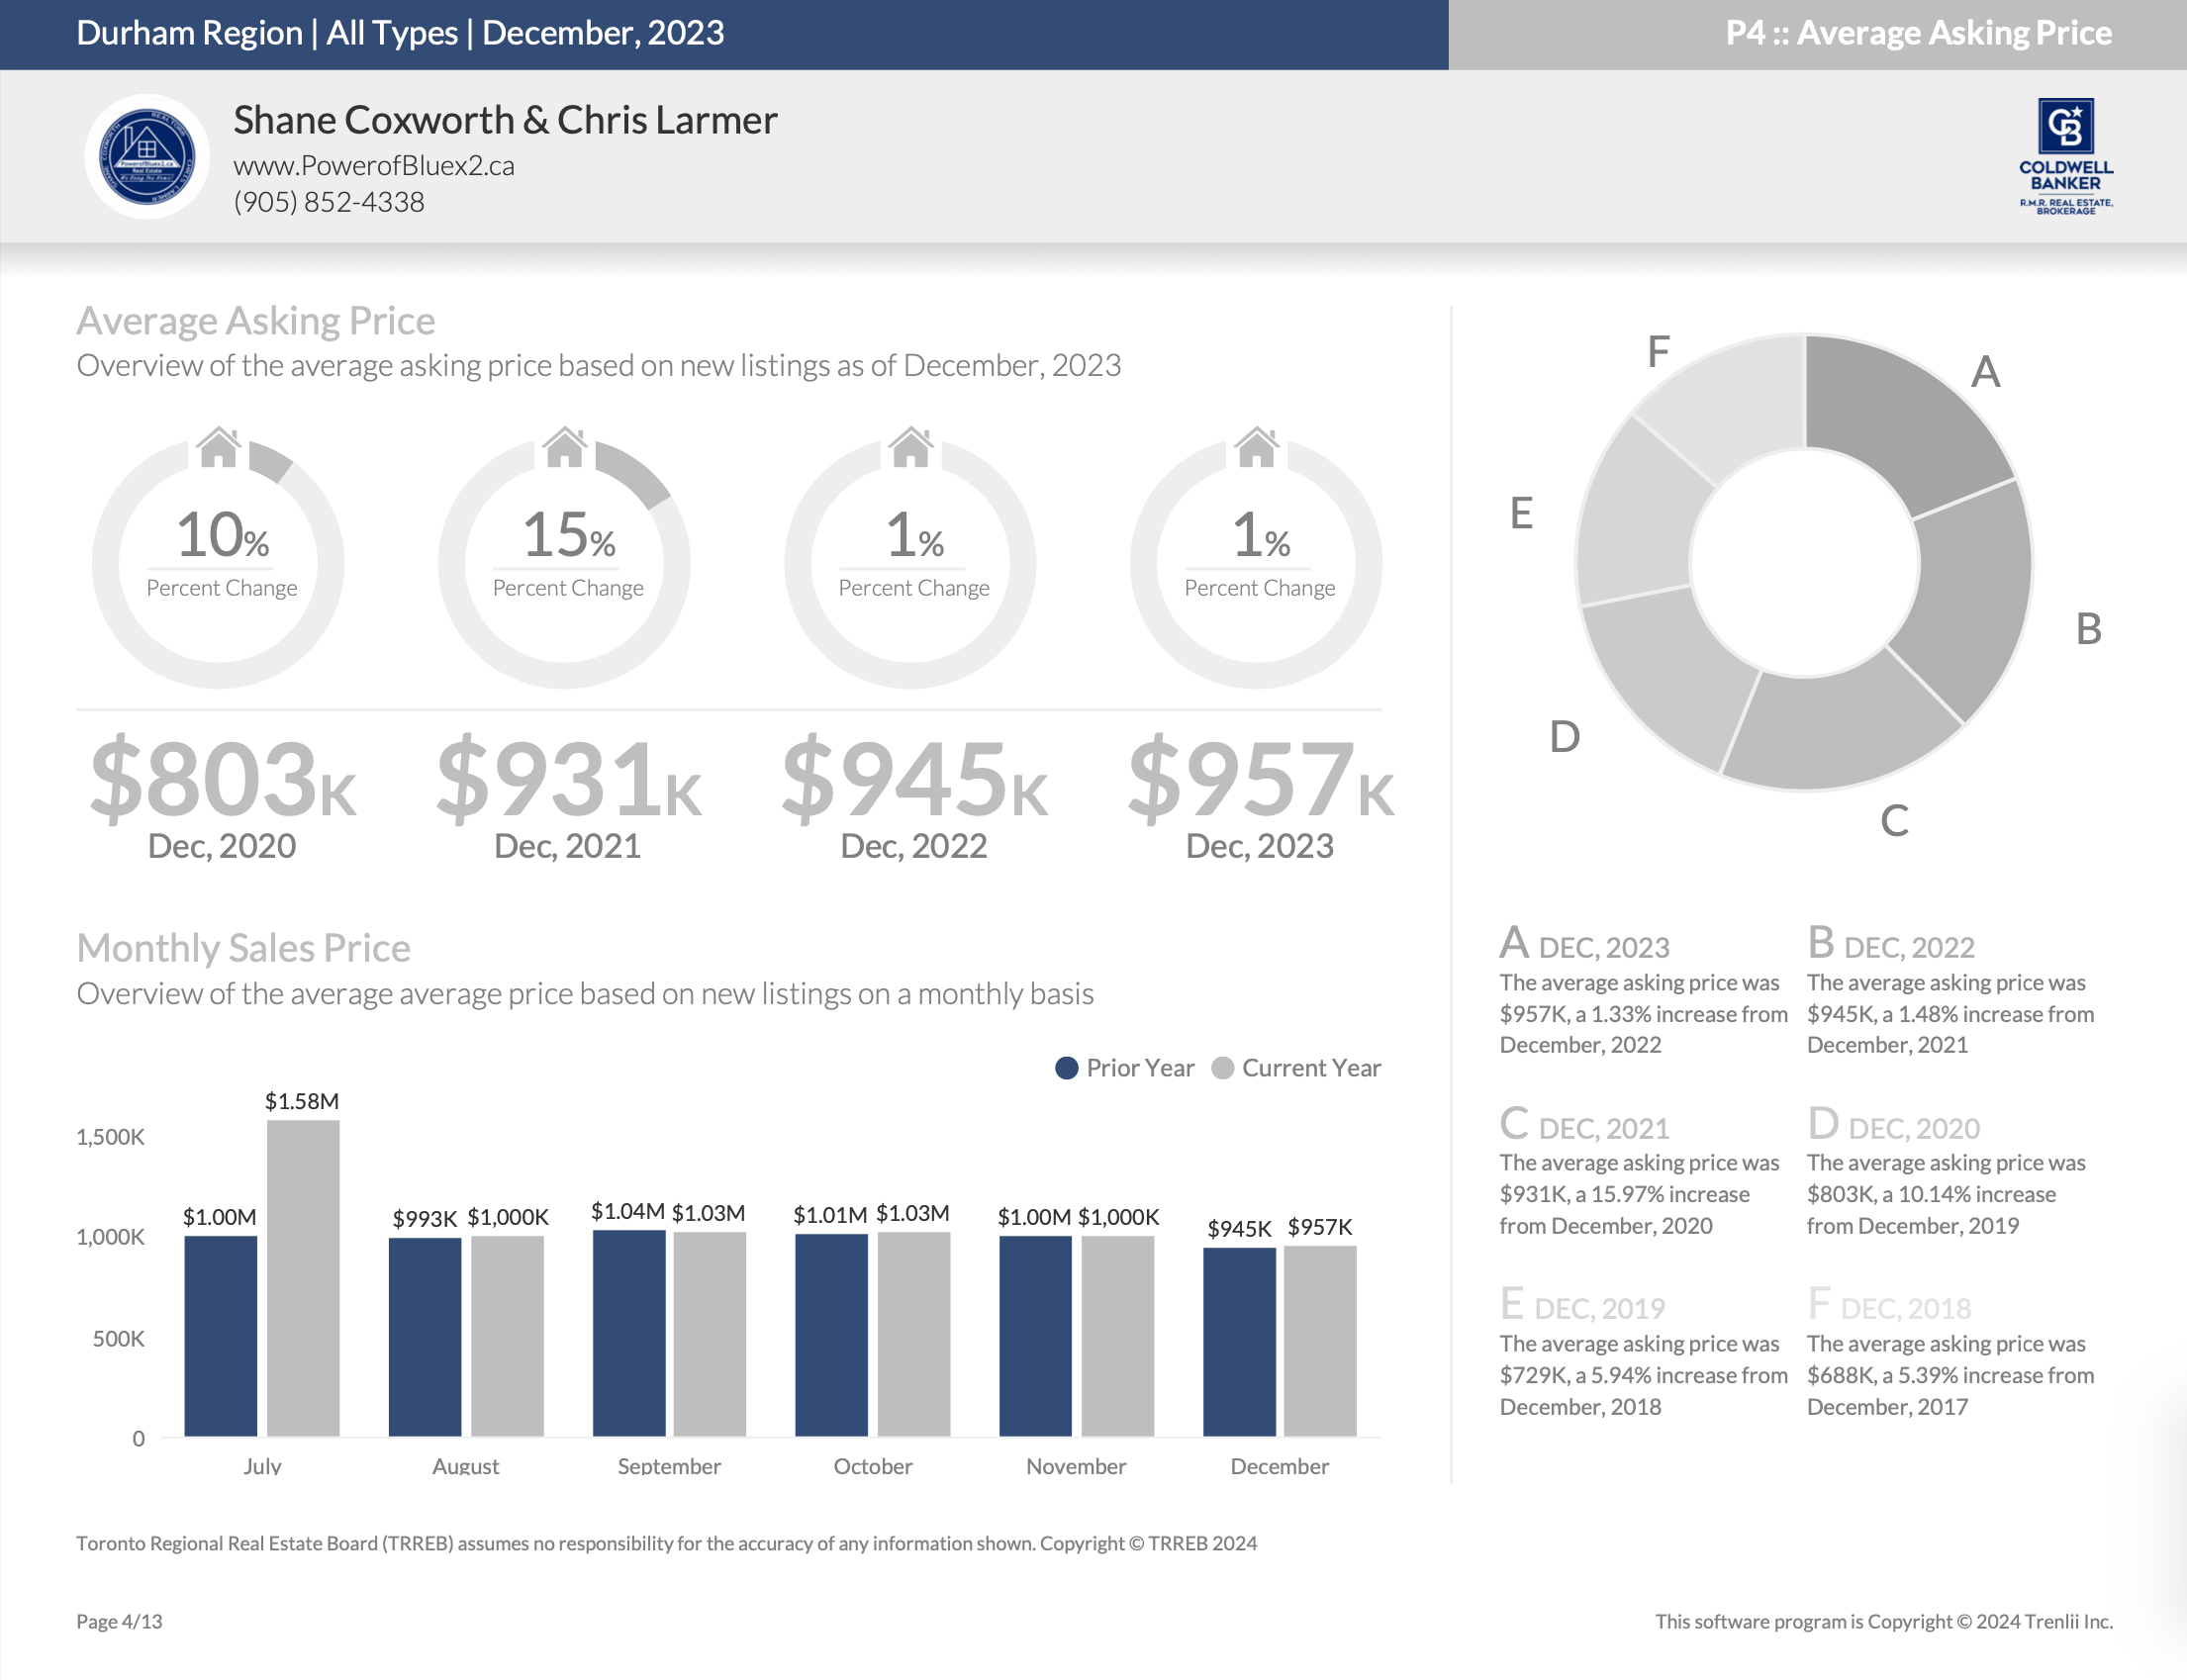
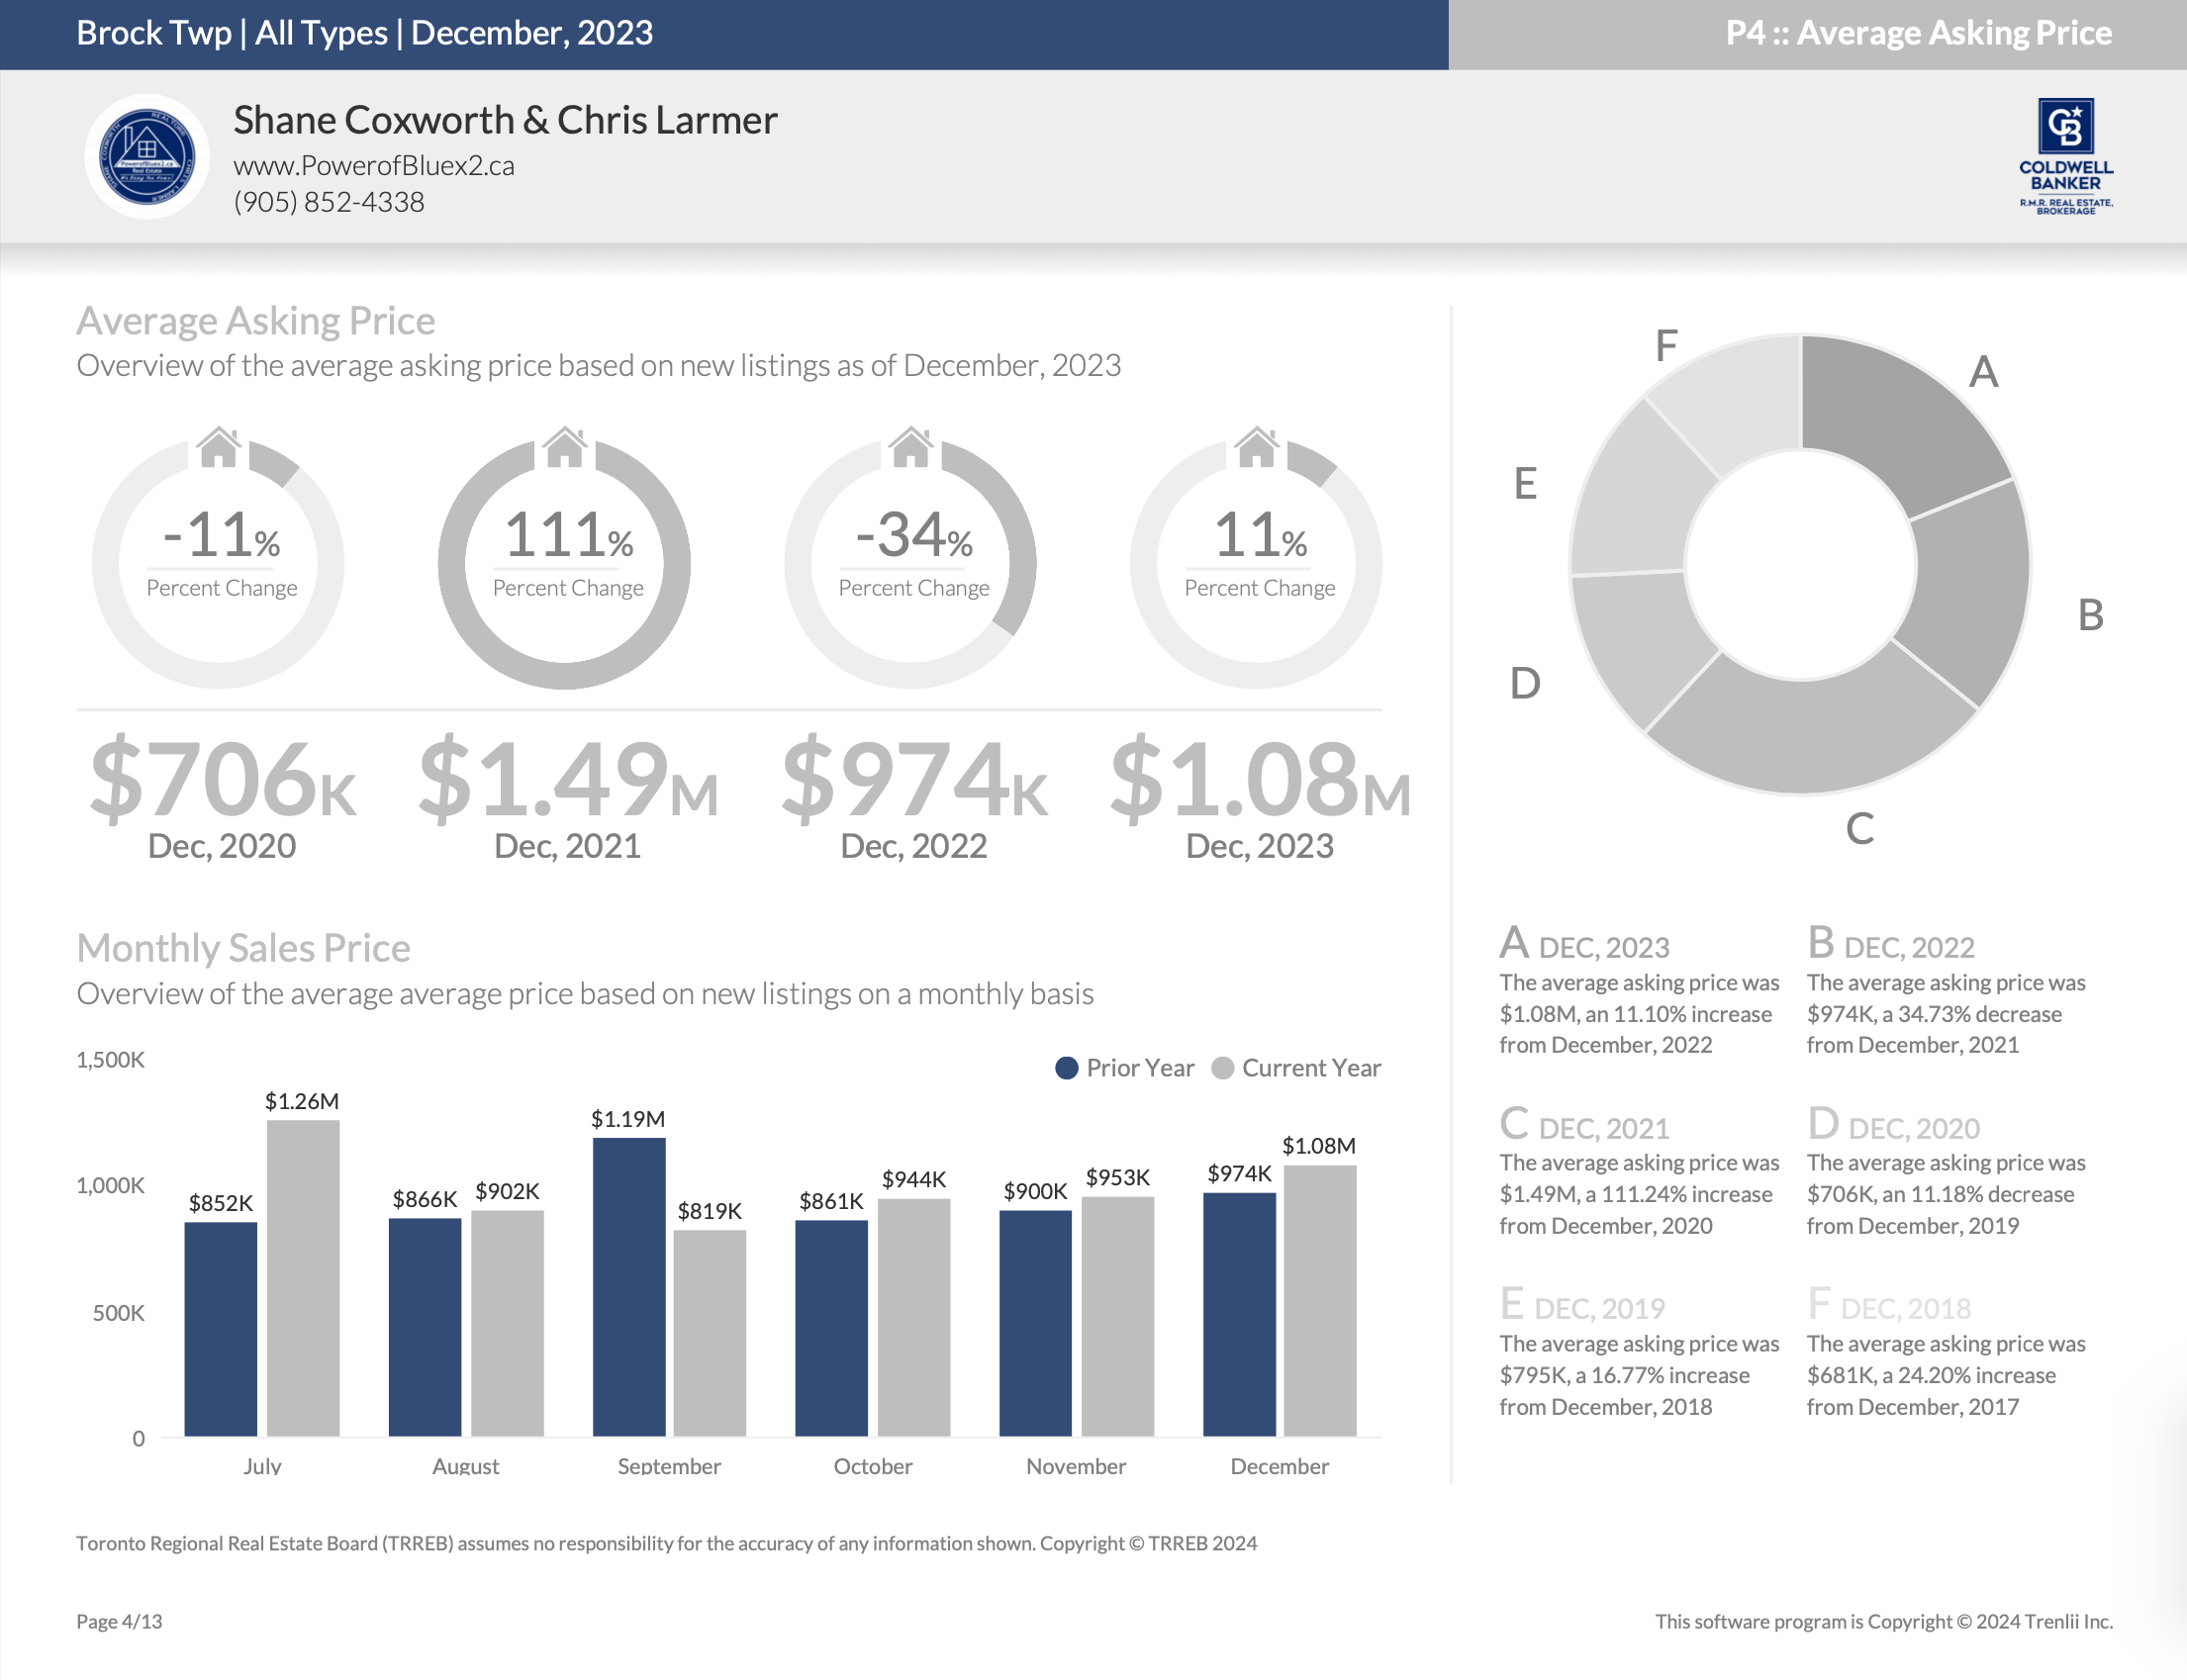
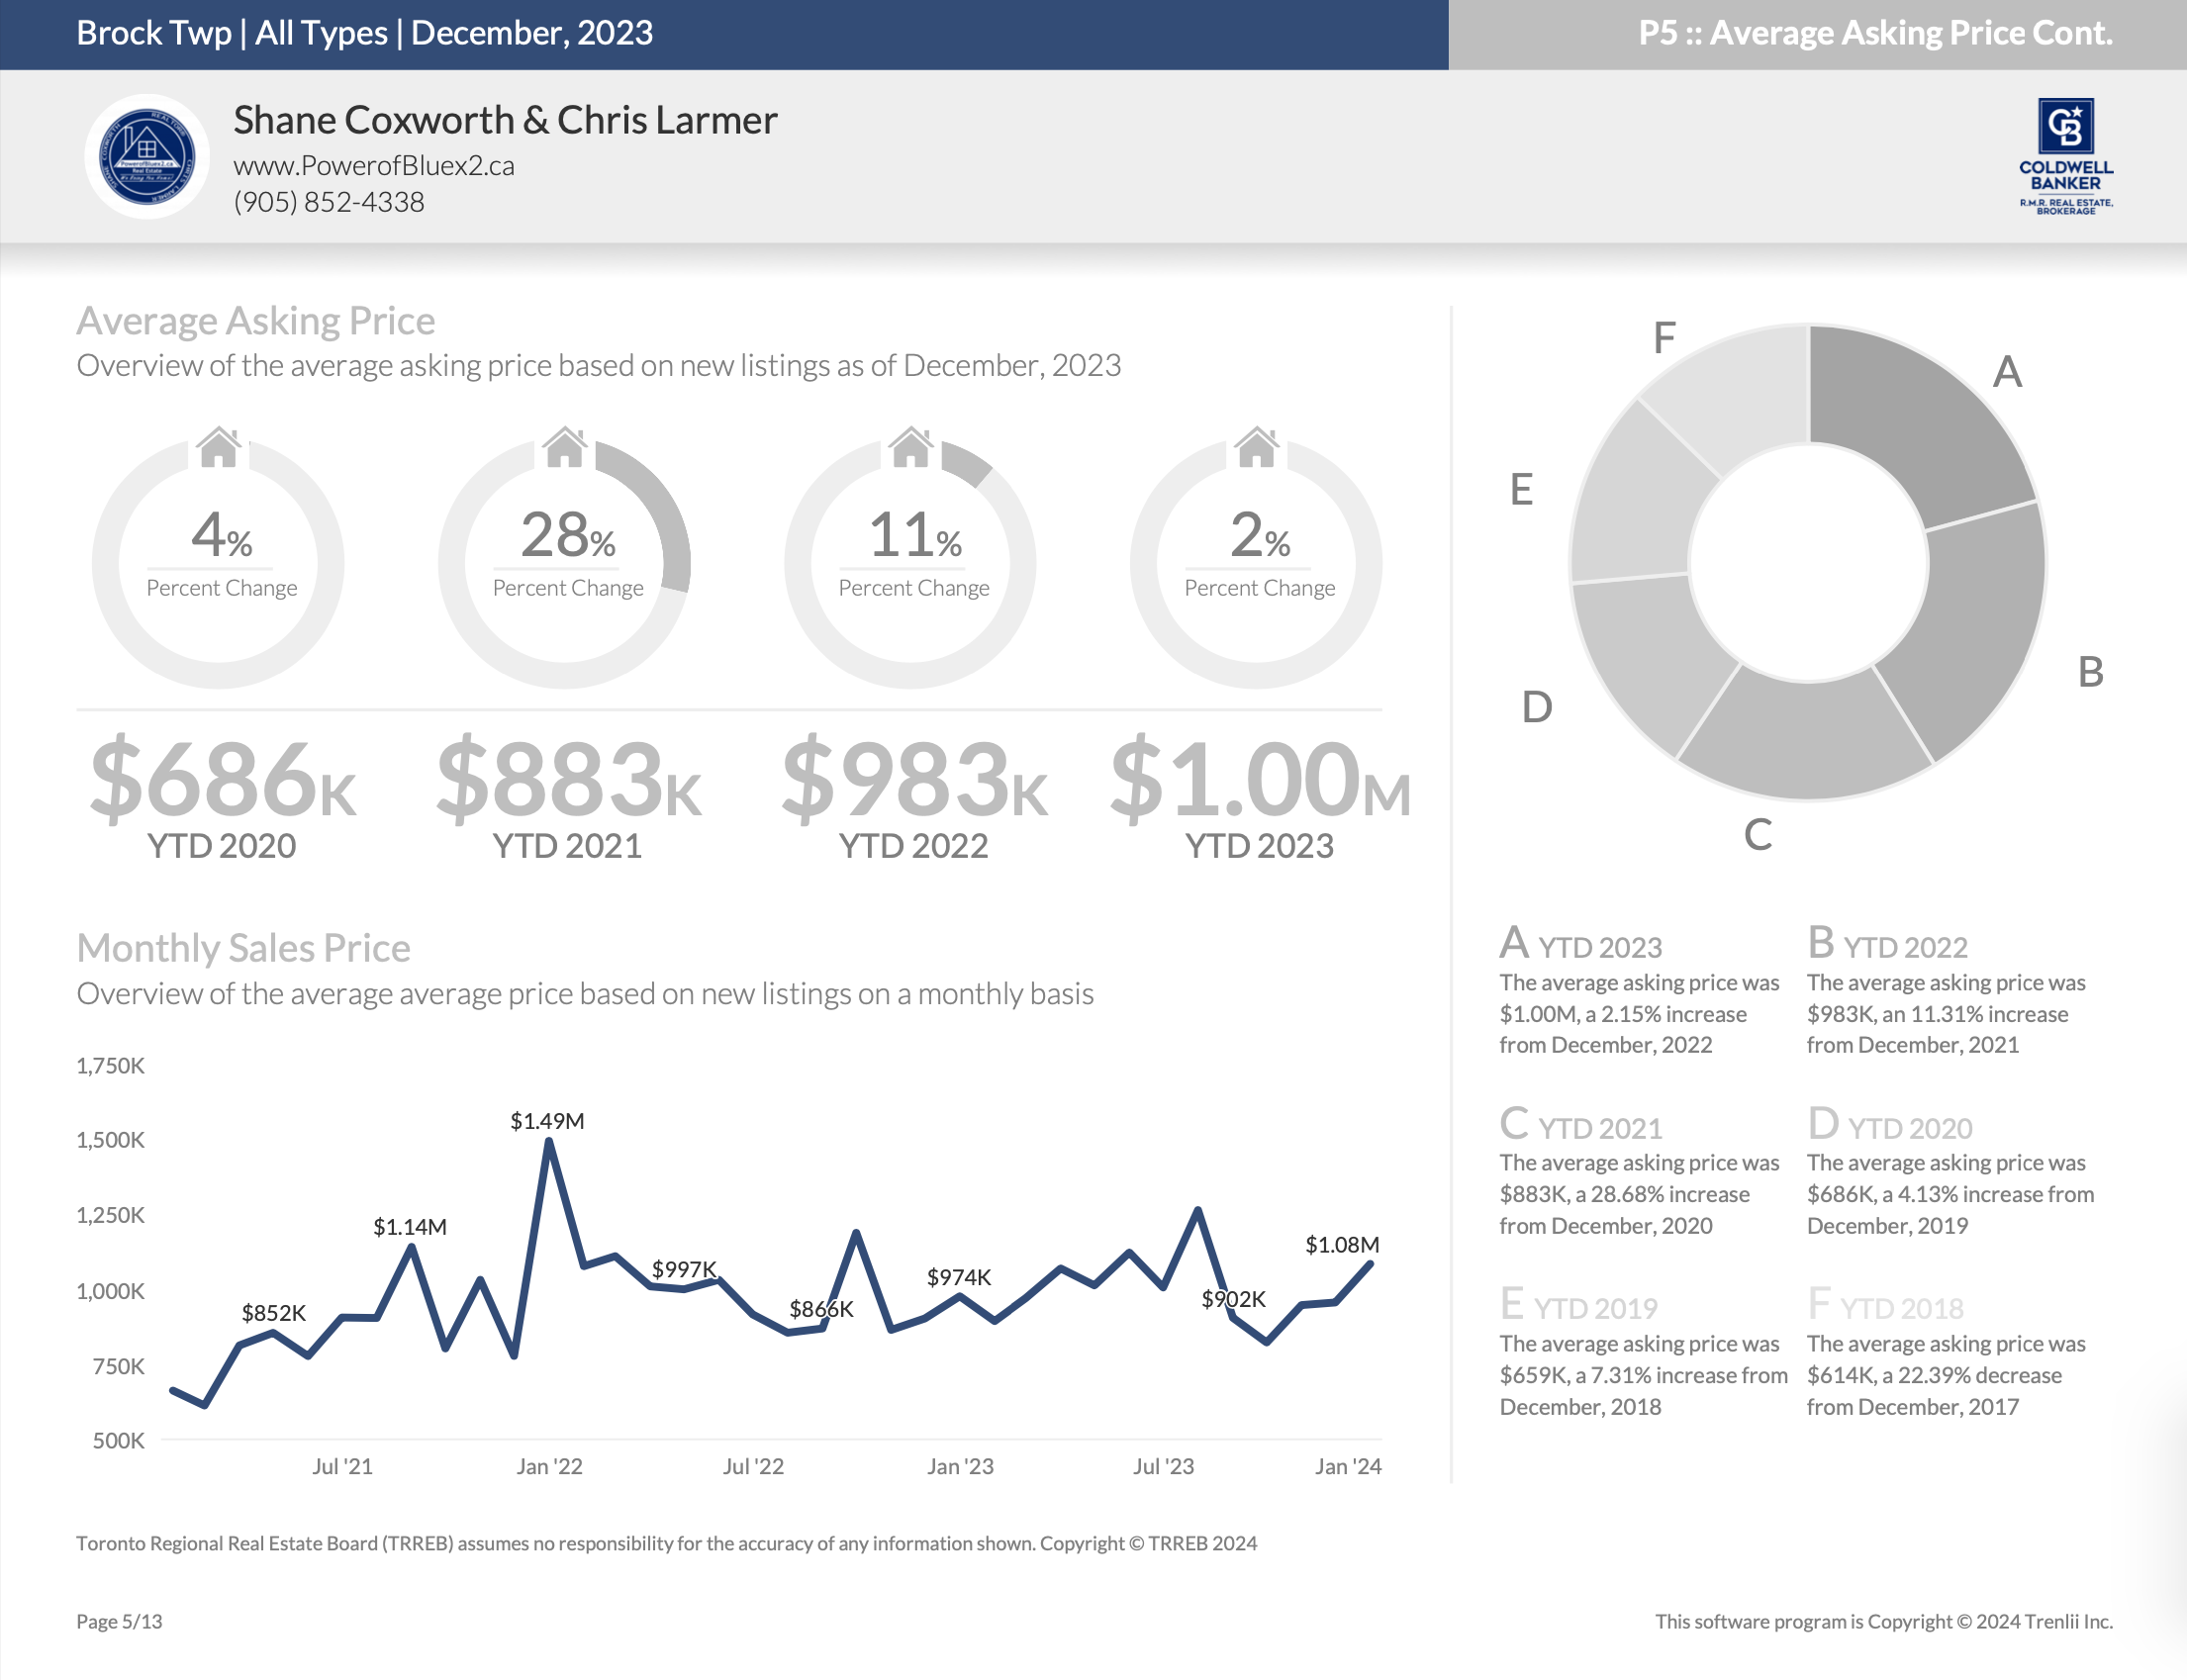
Average Asking Price – January 2024
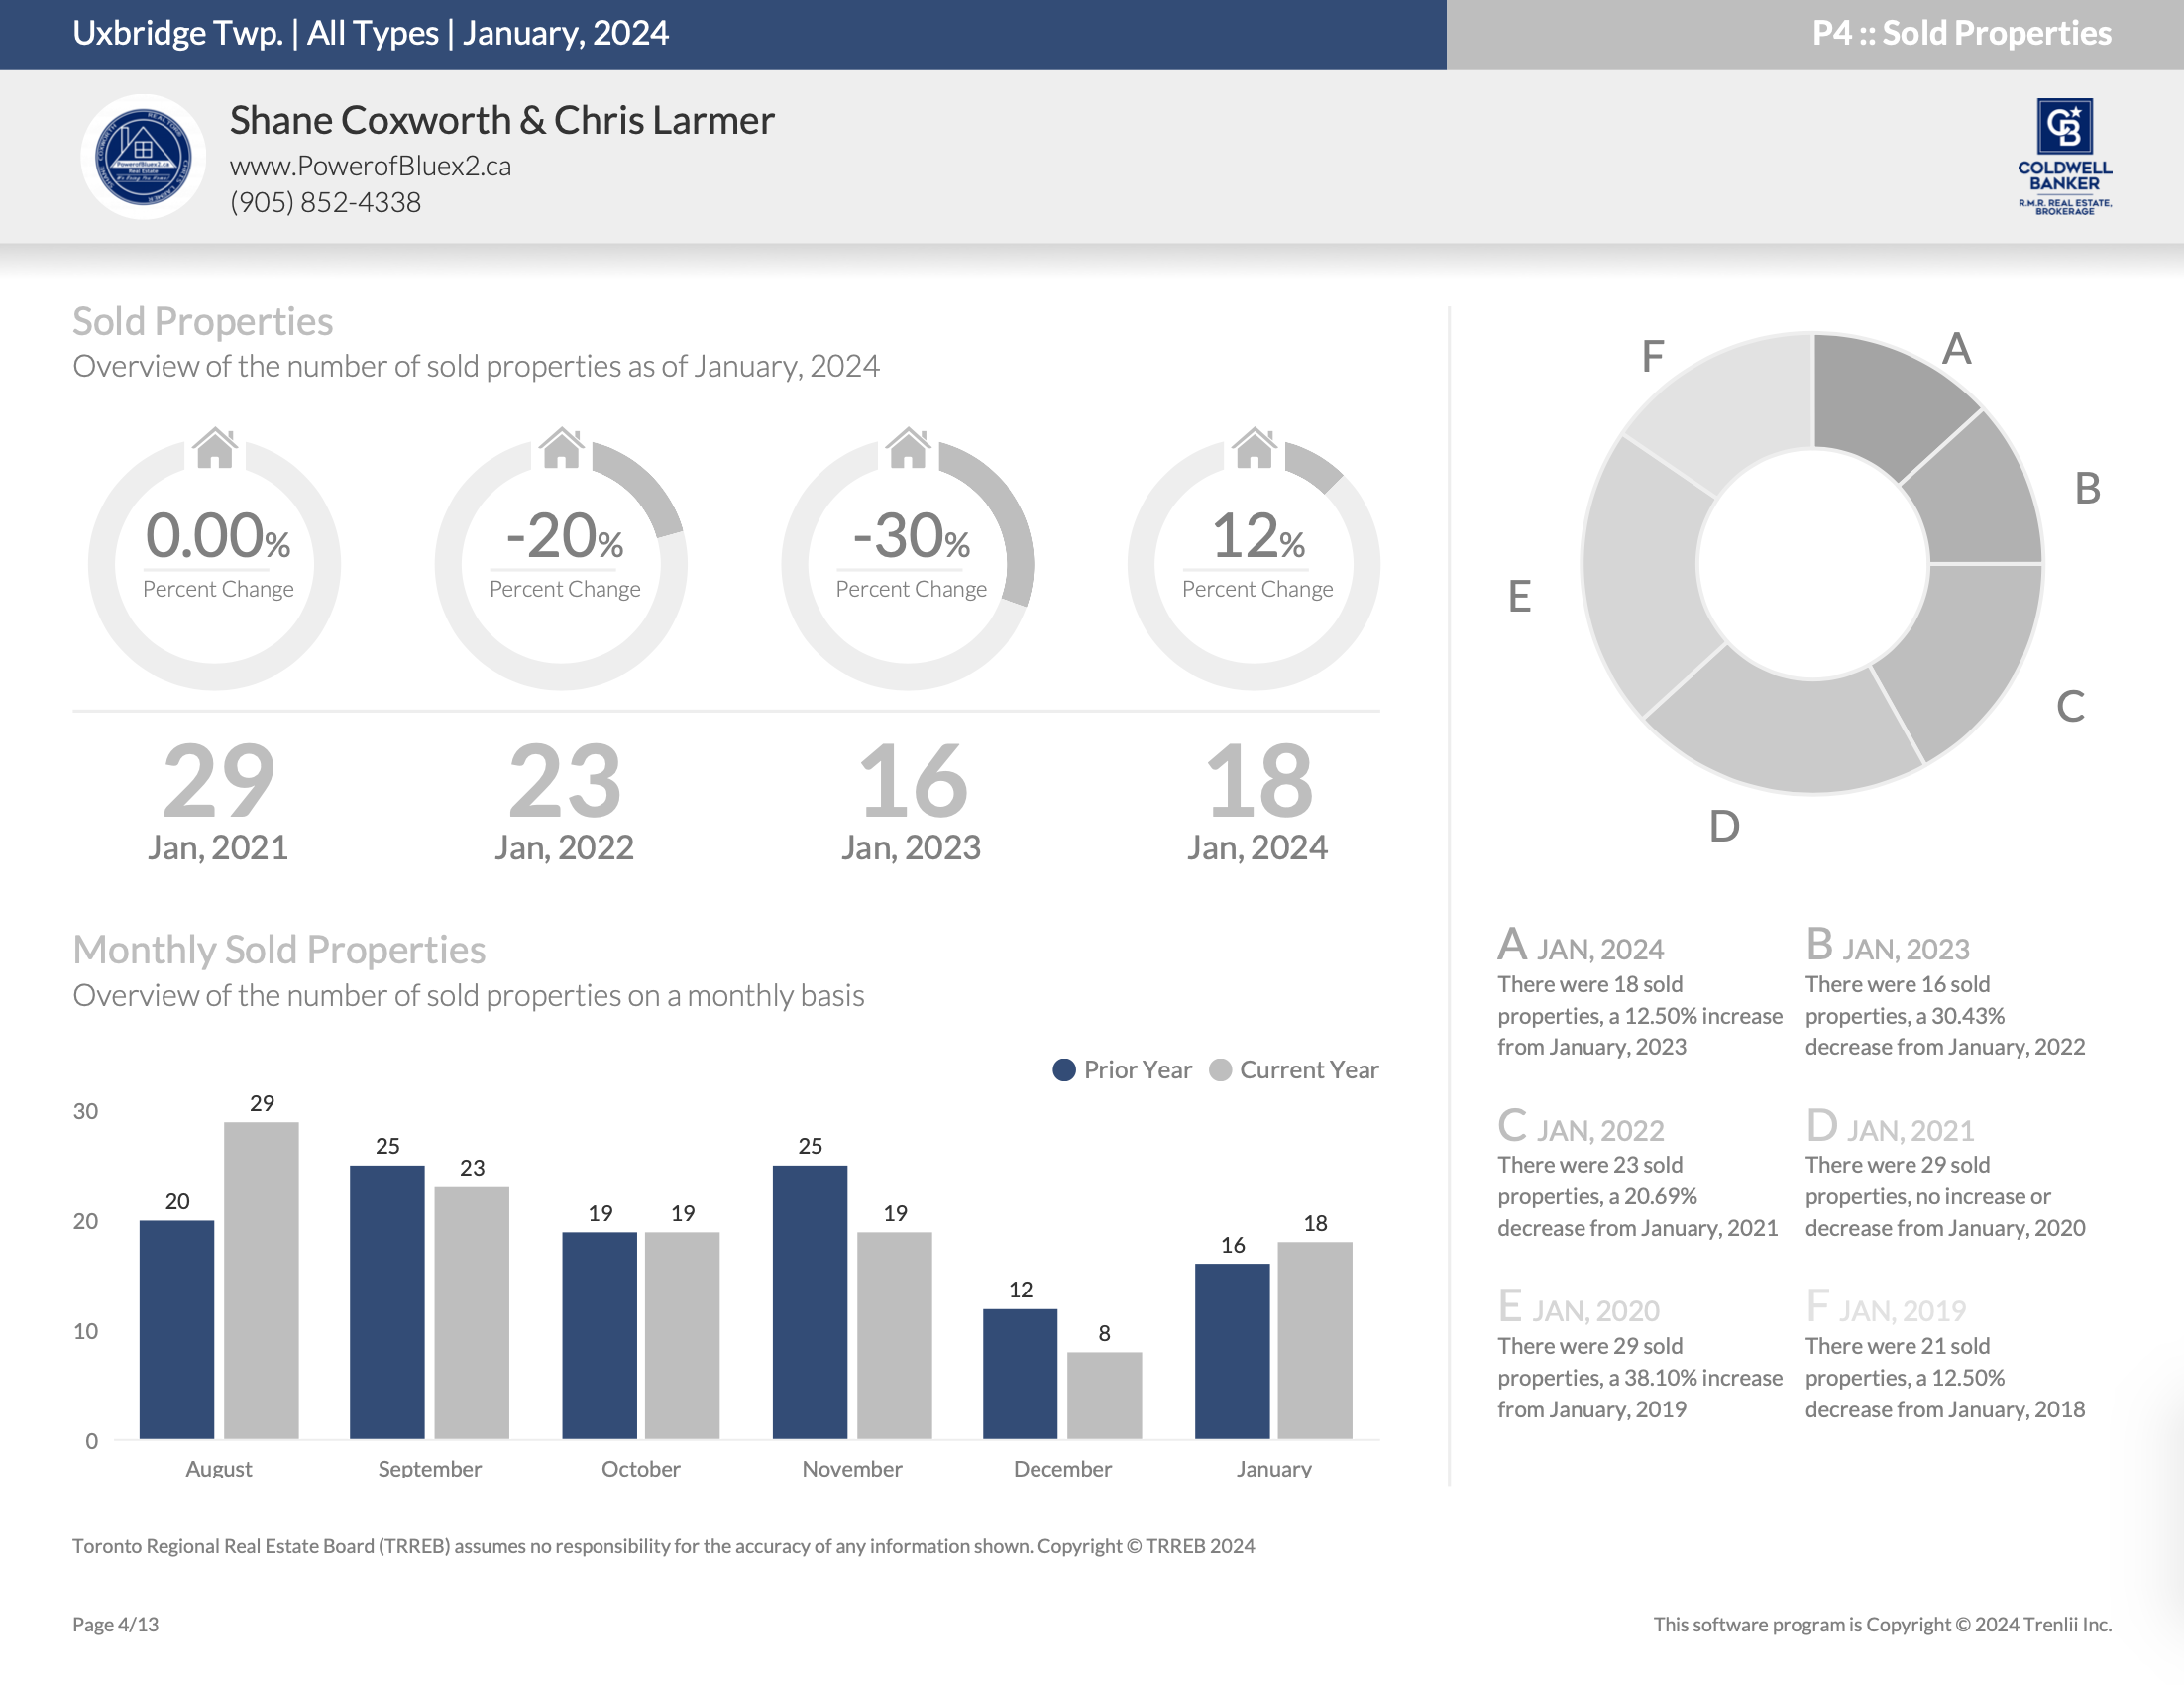
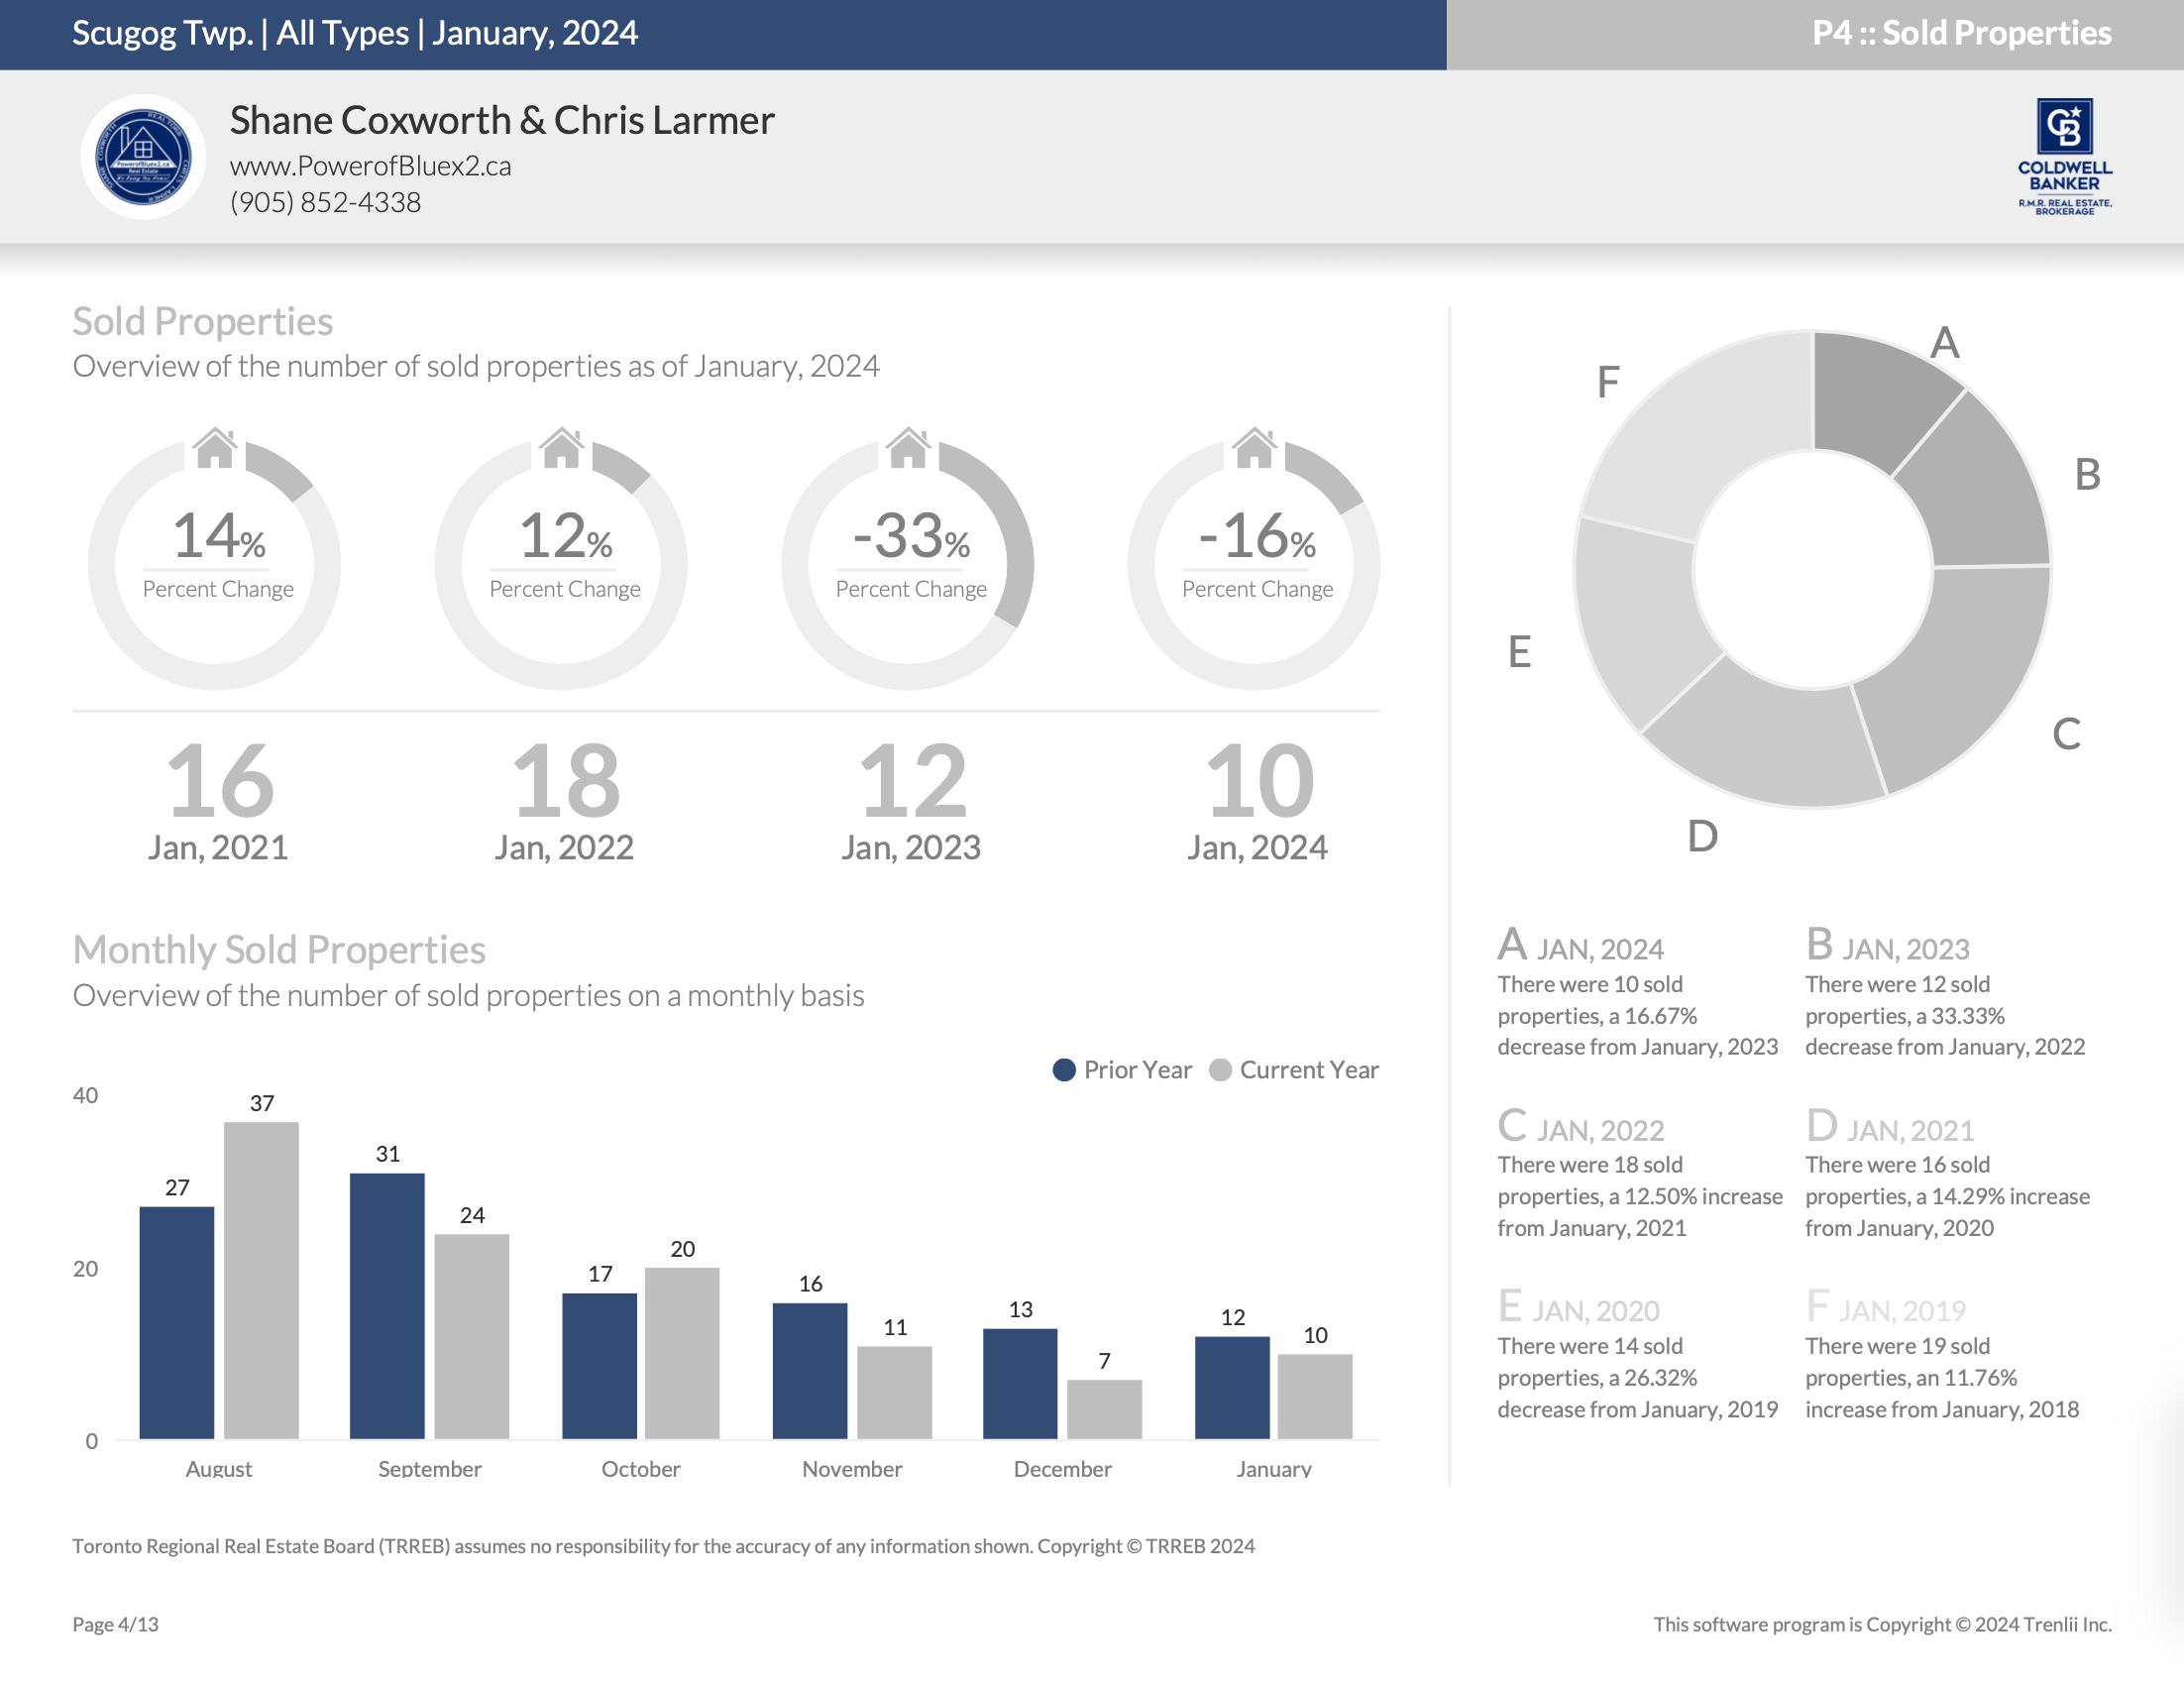
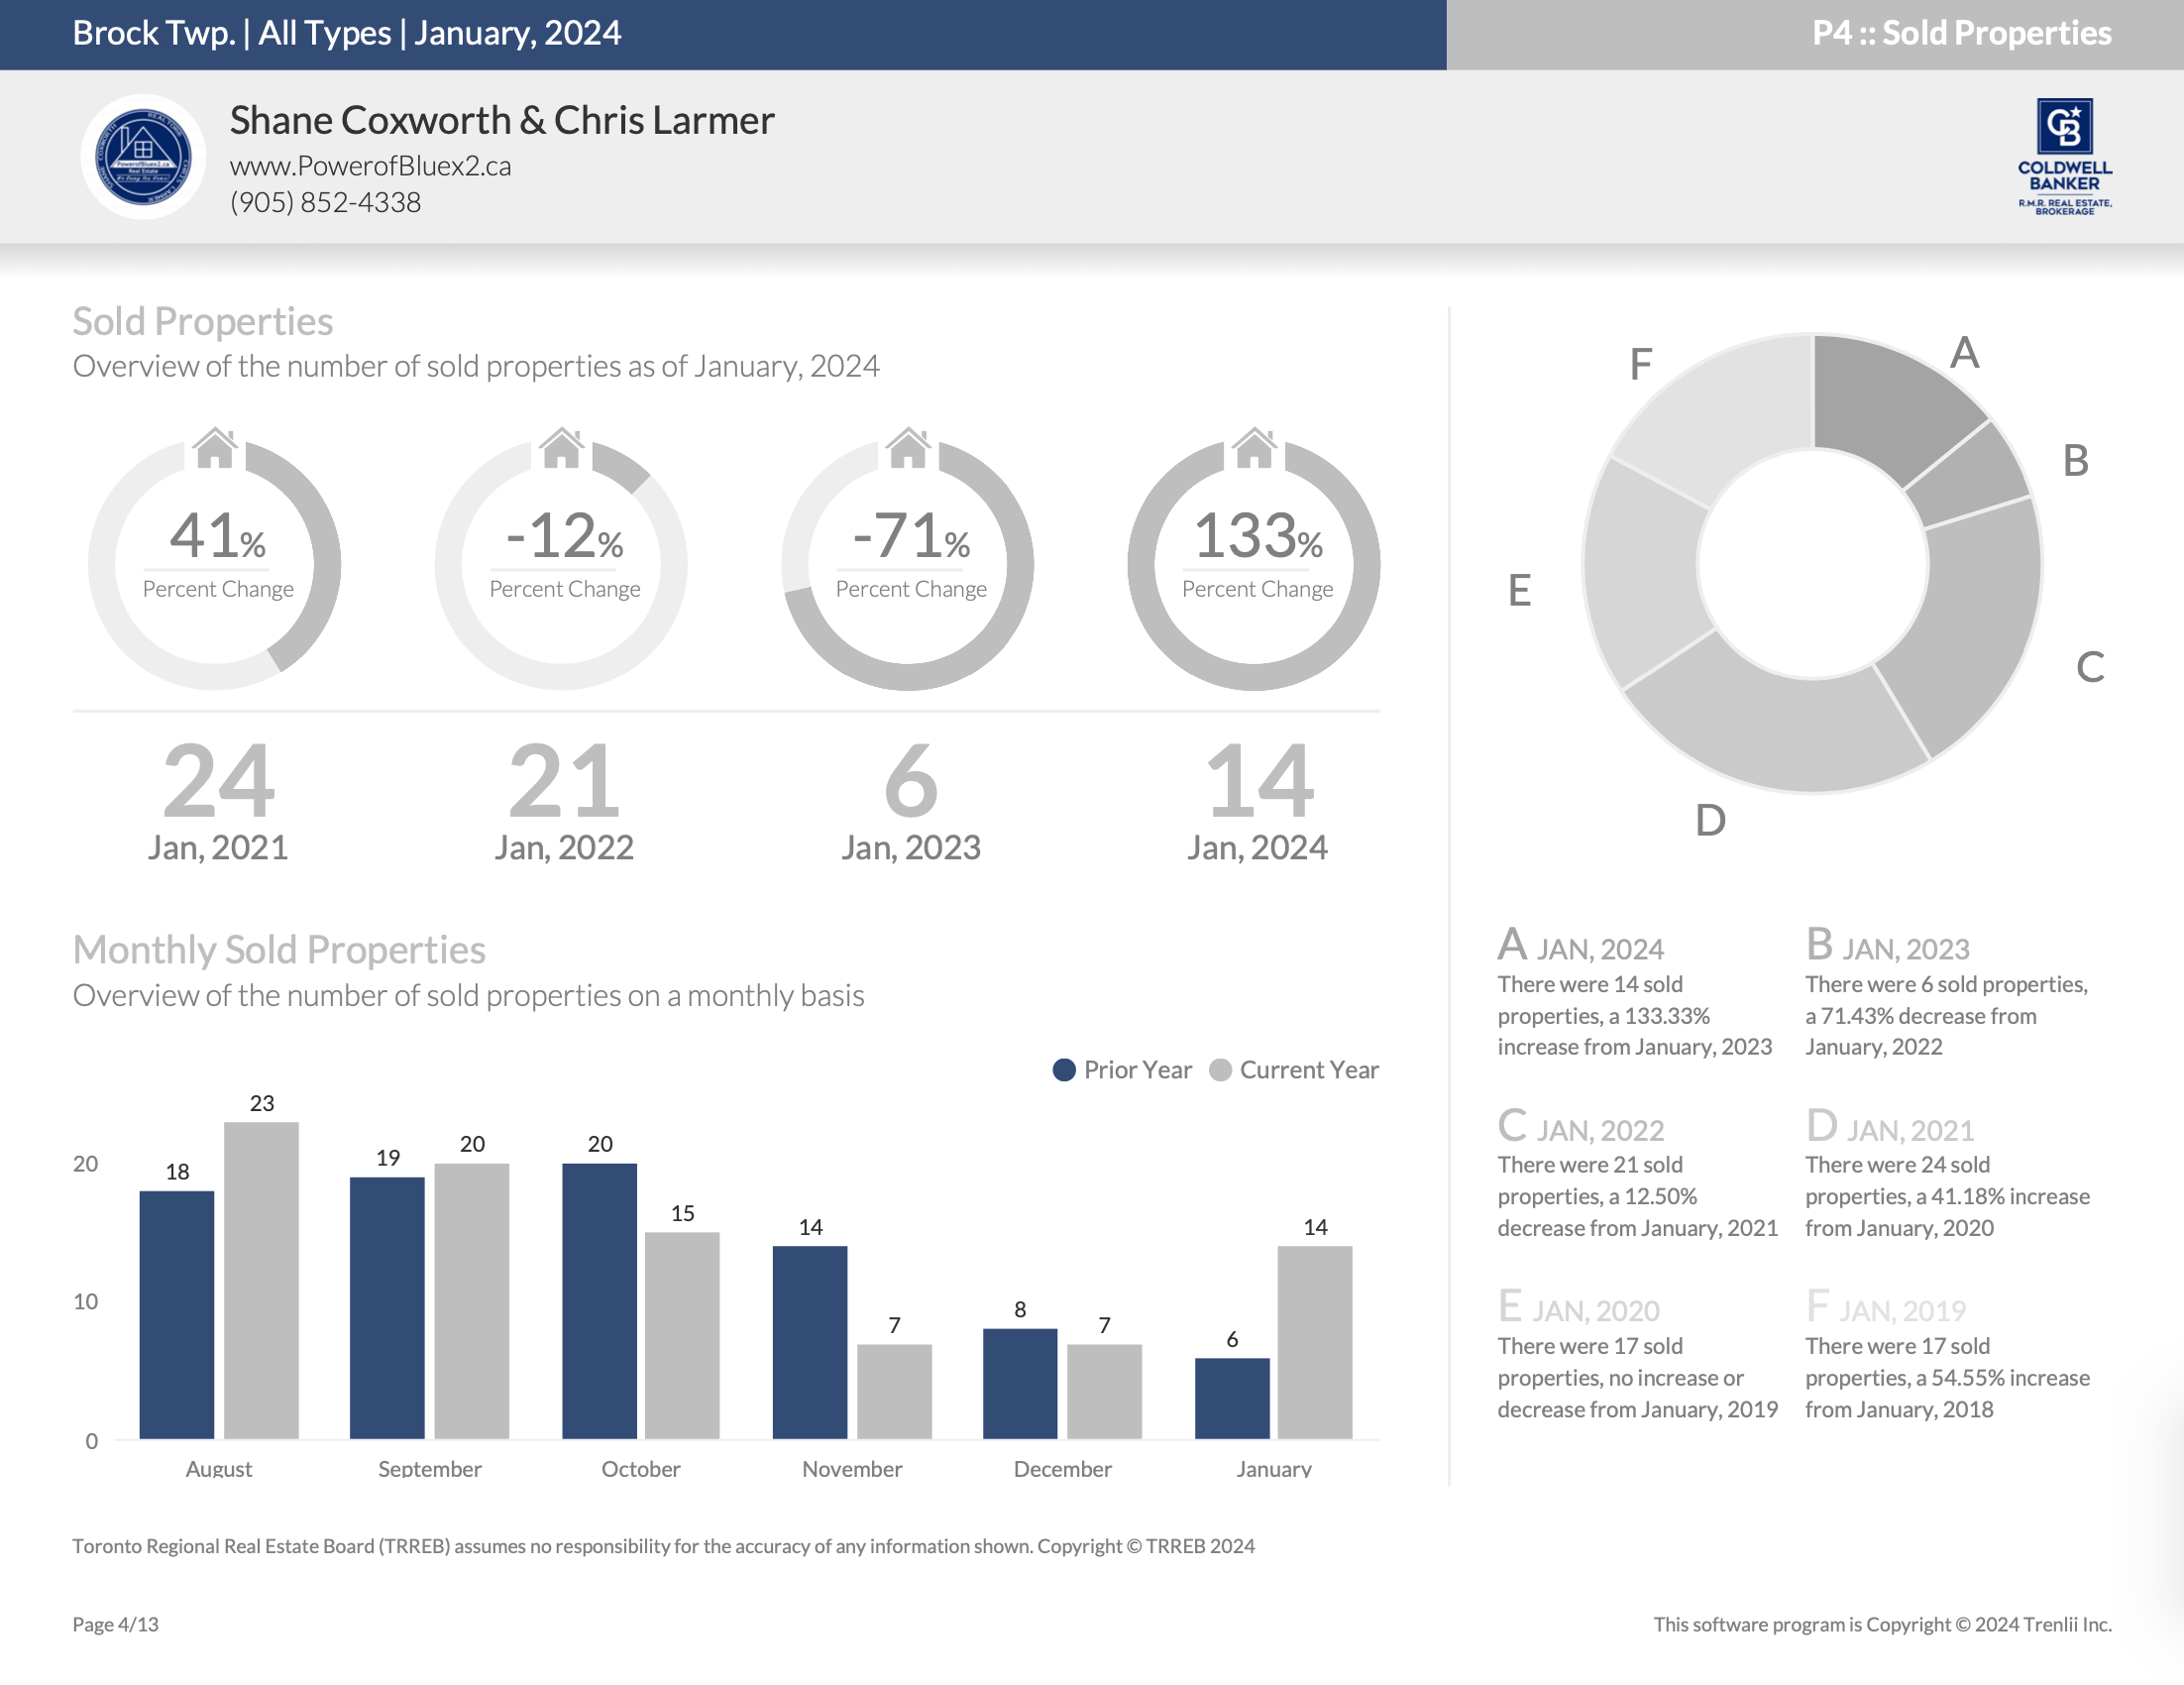
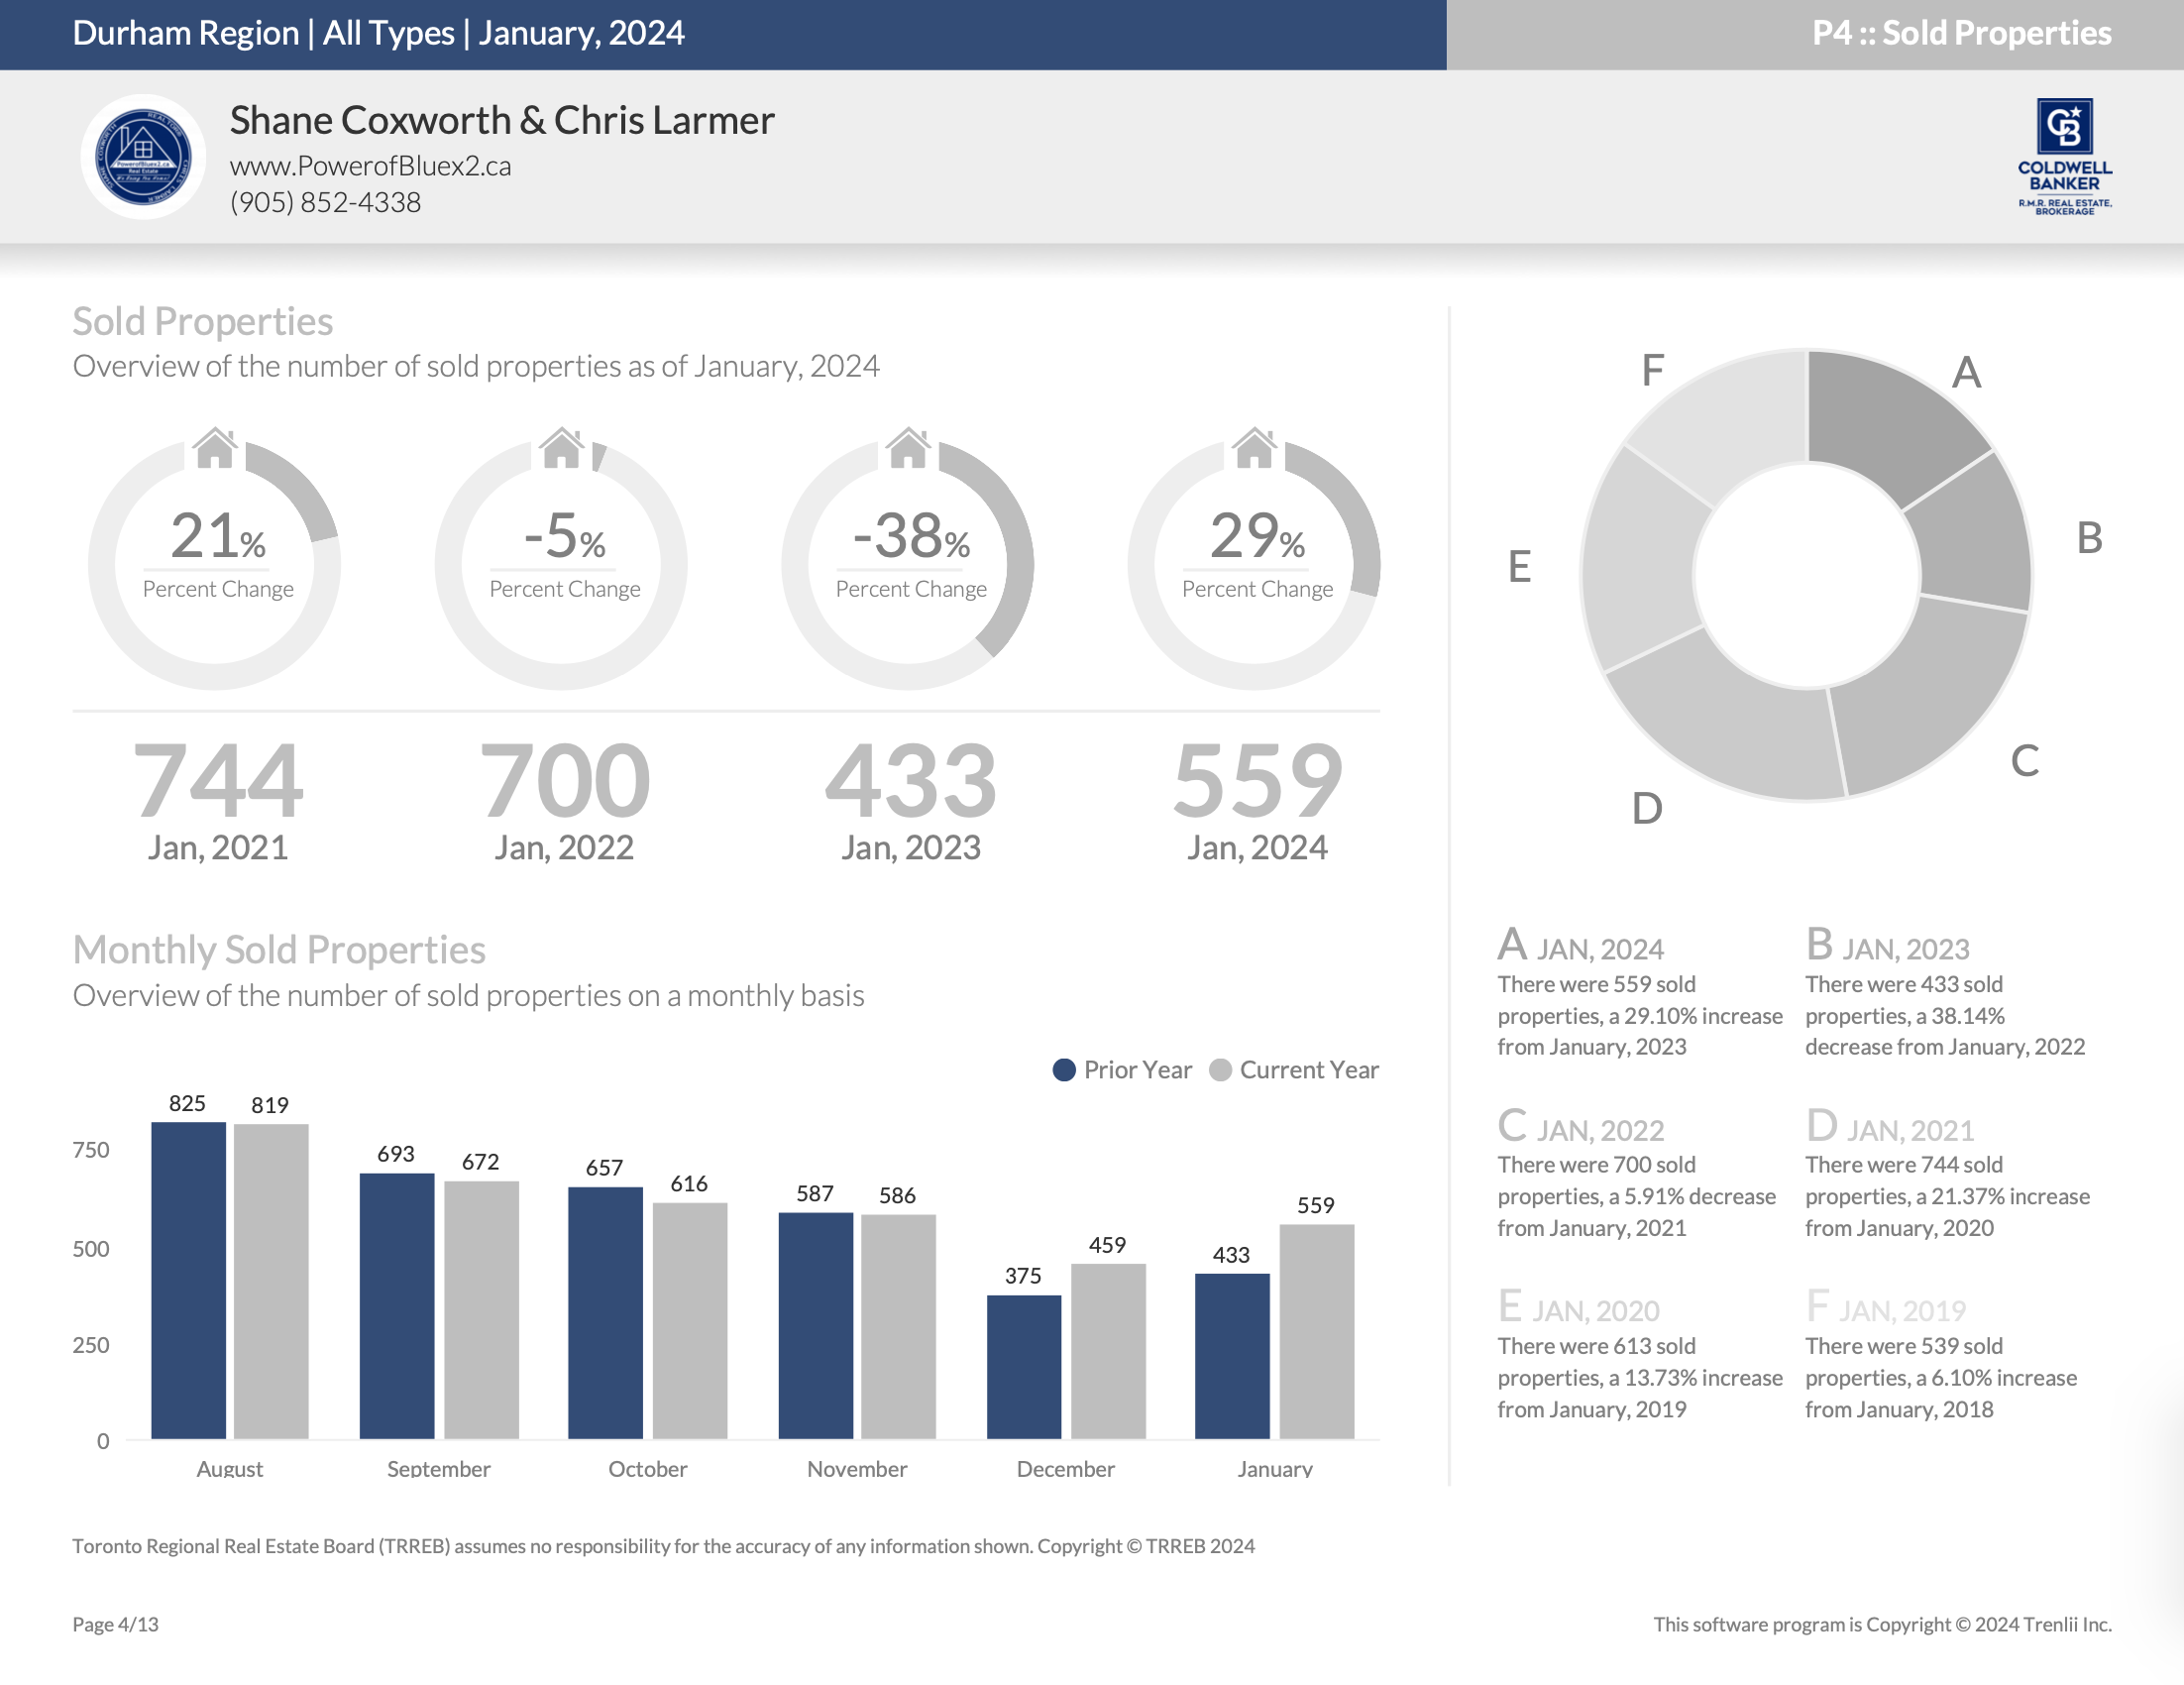
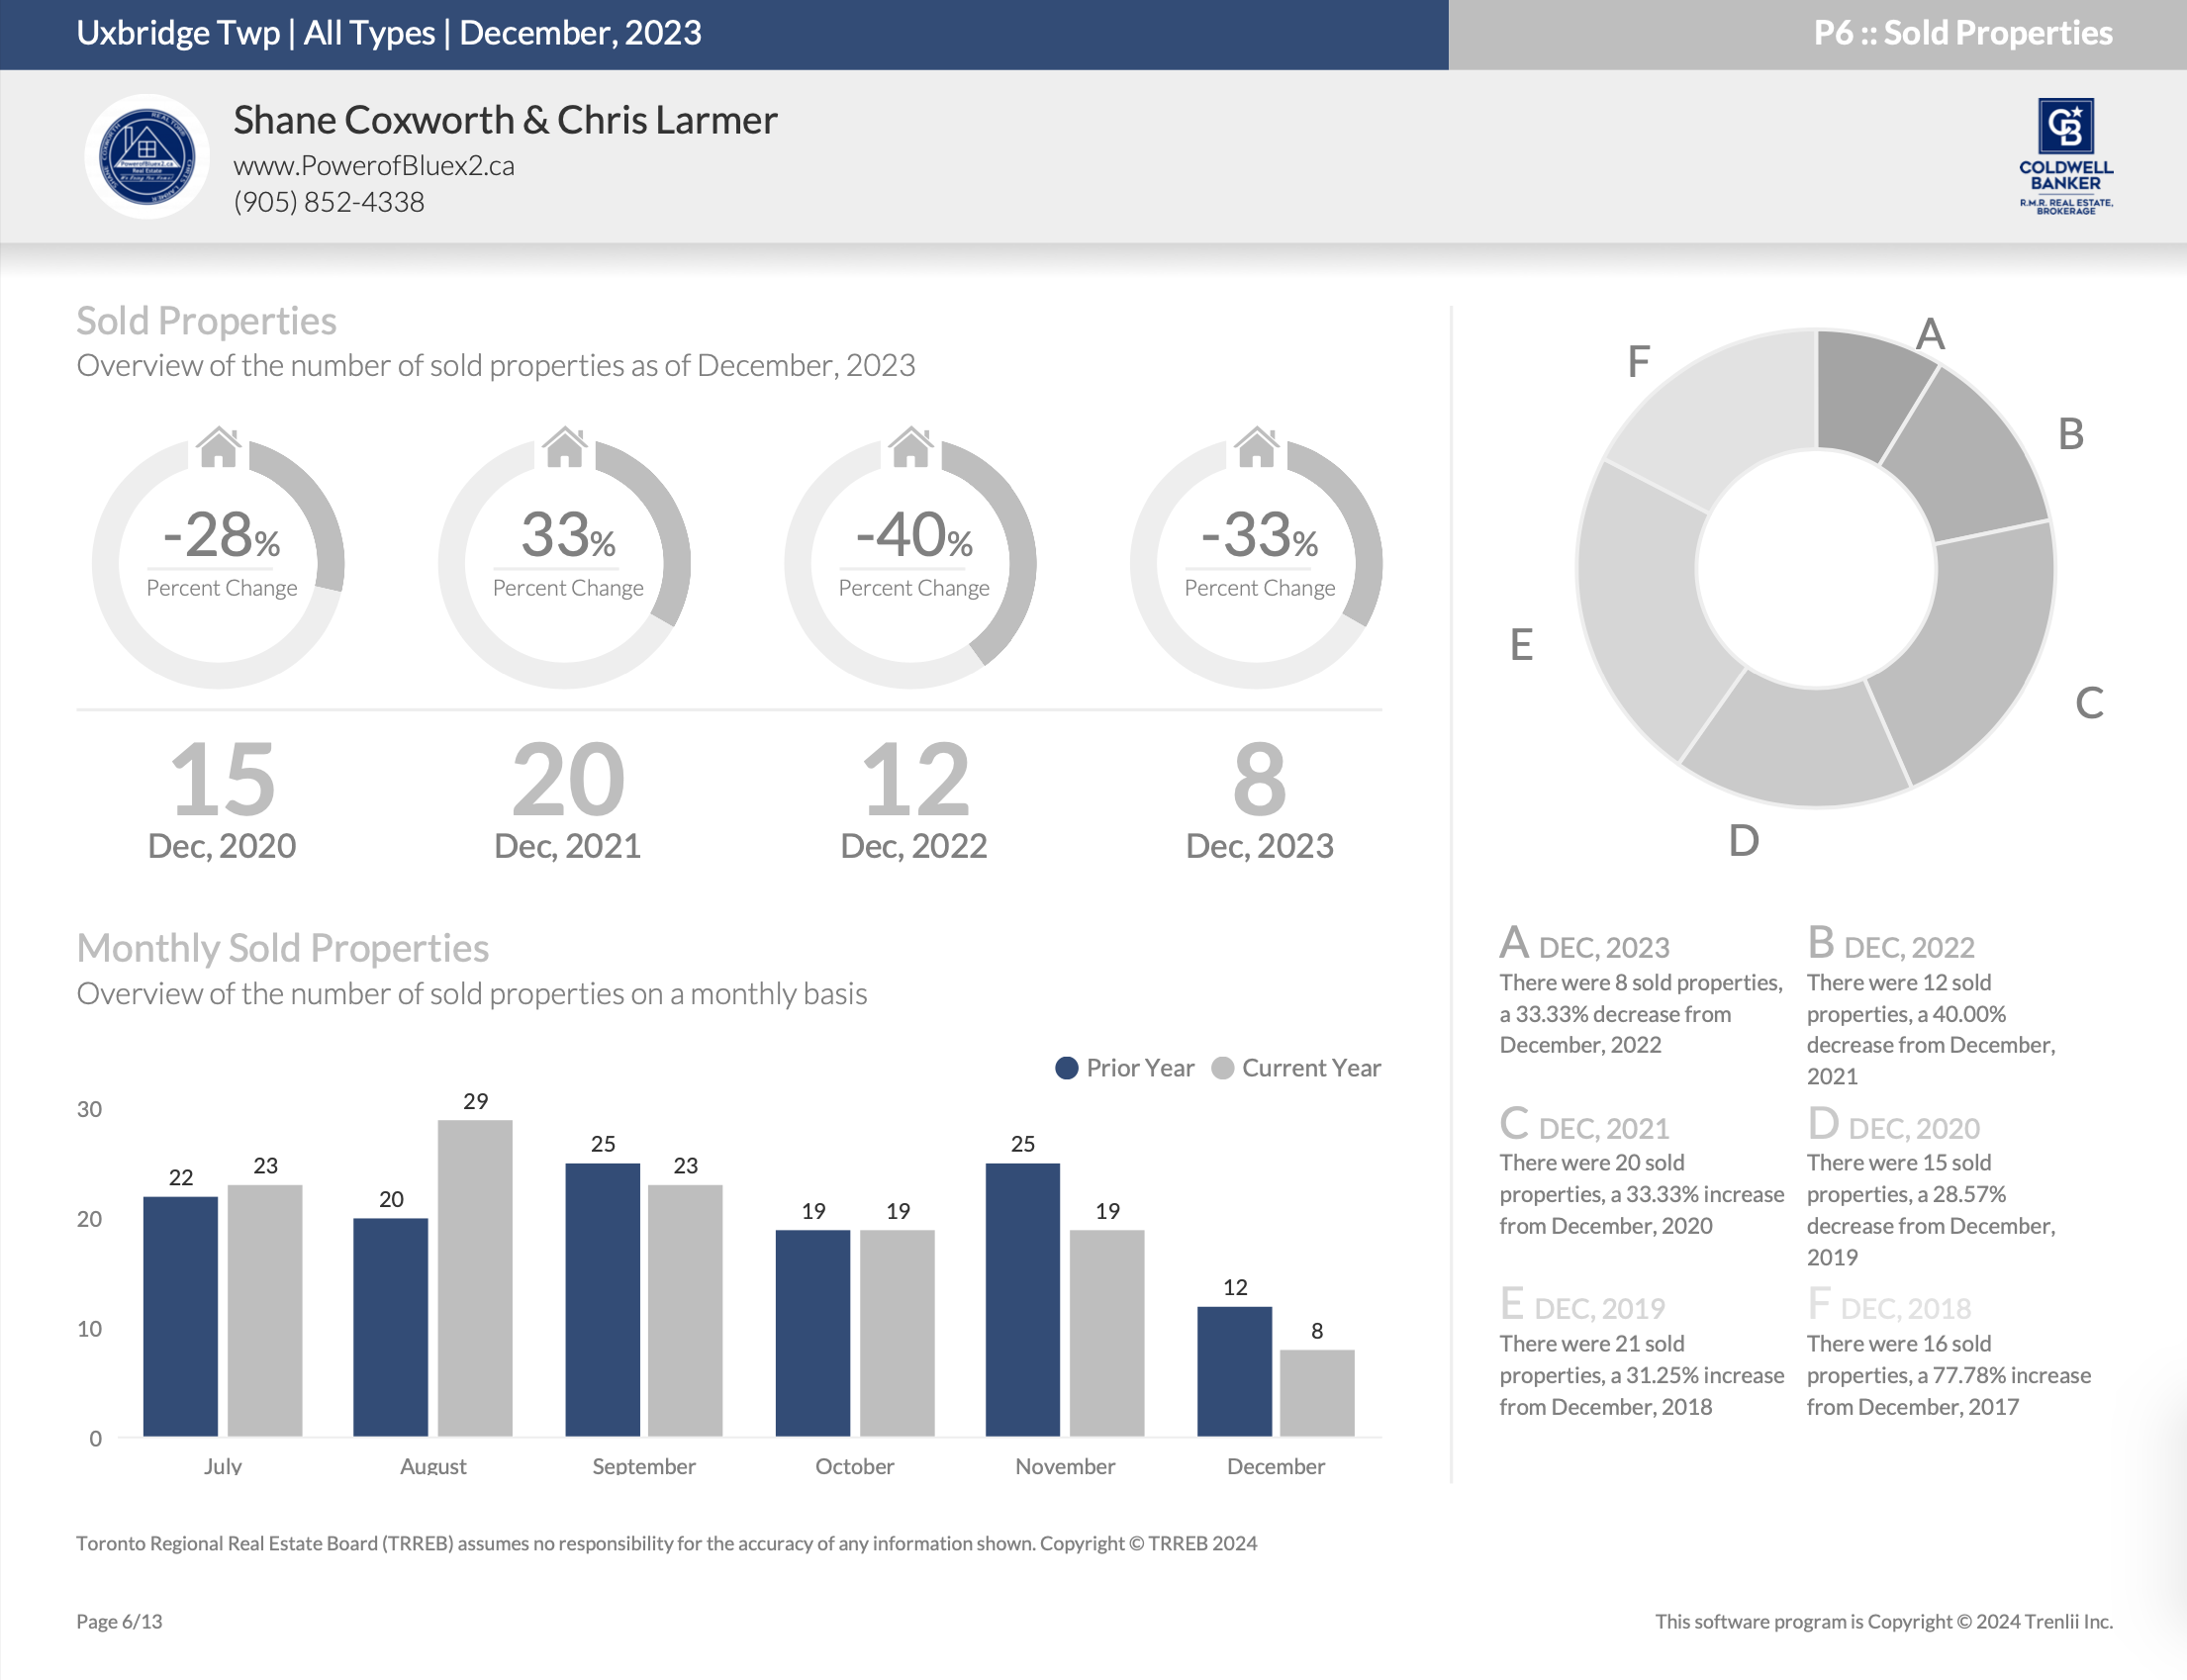
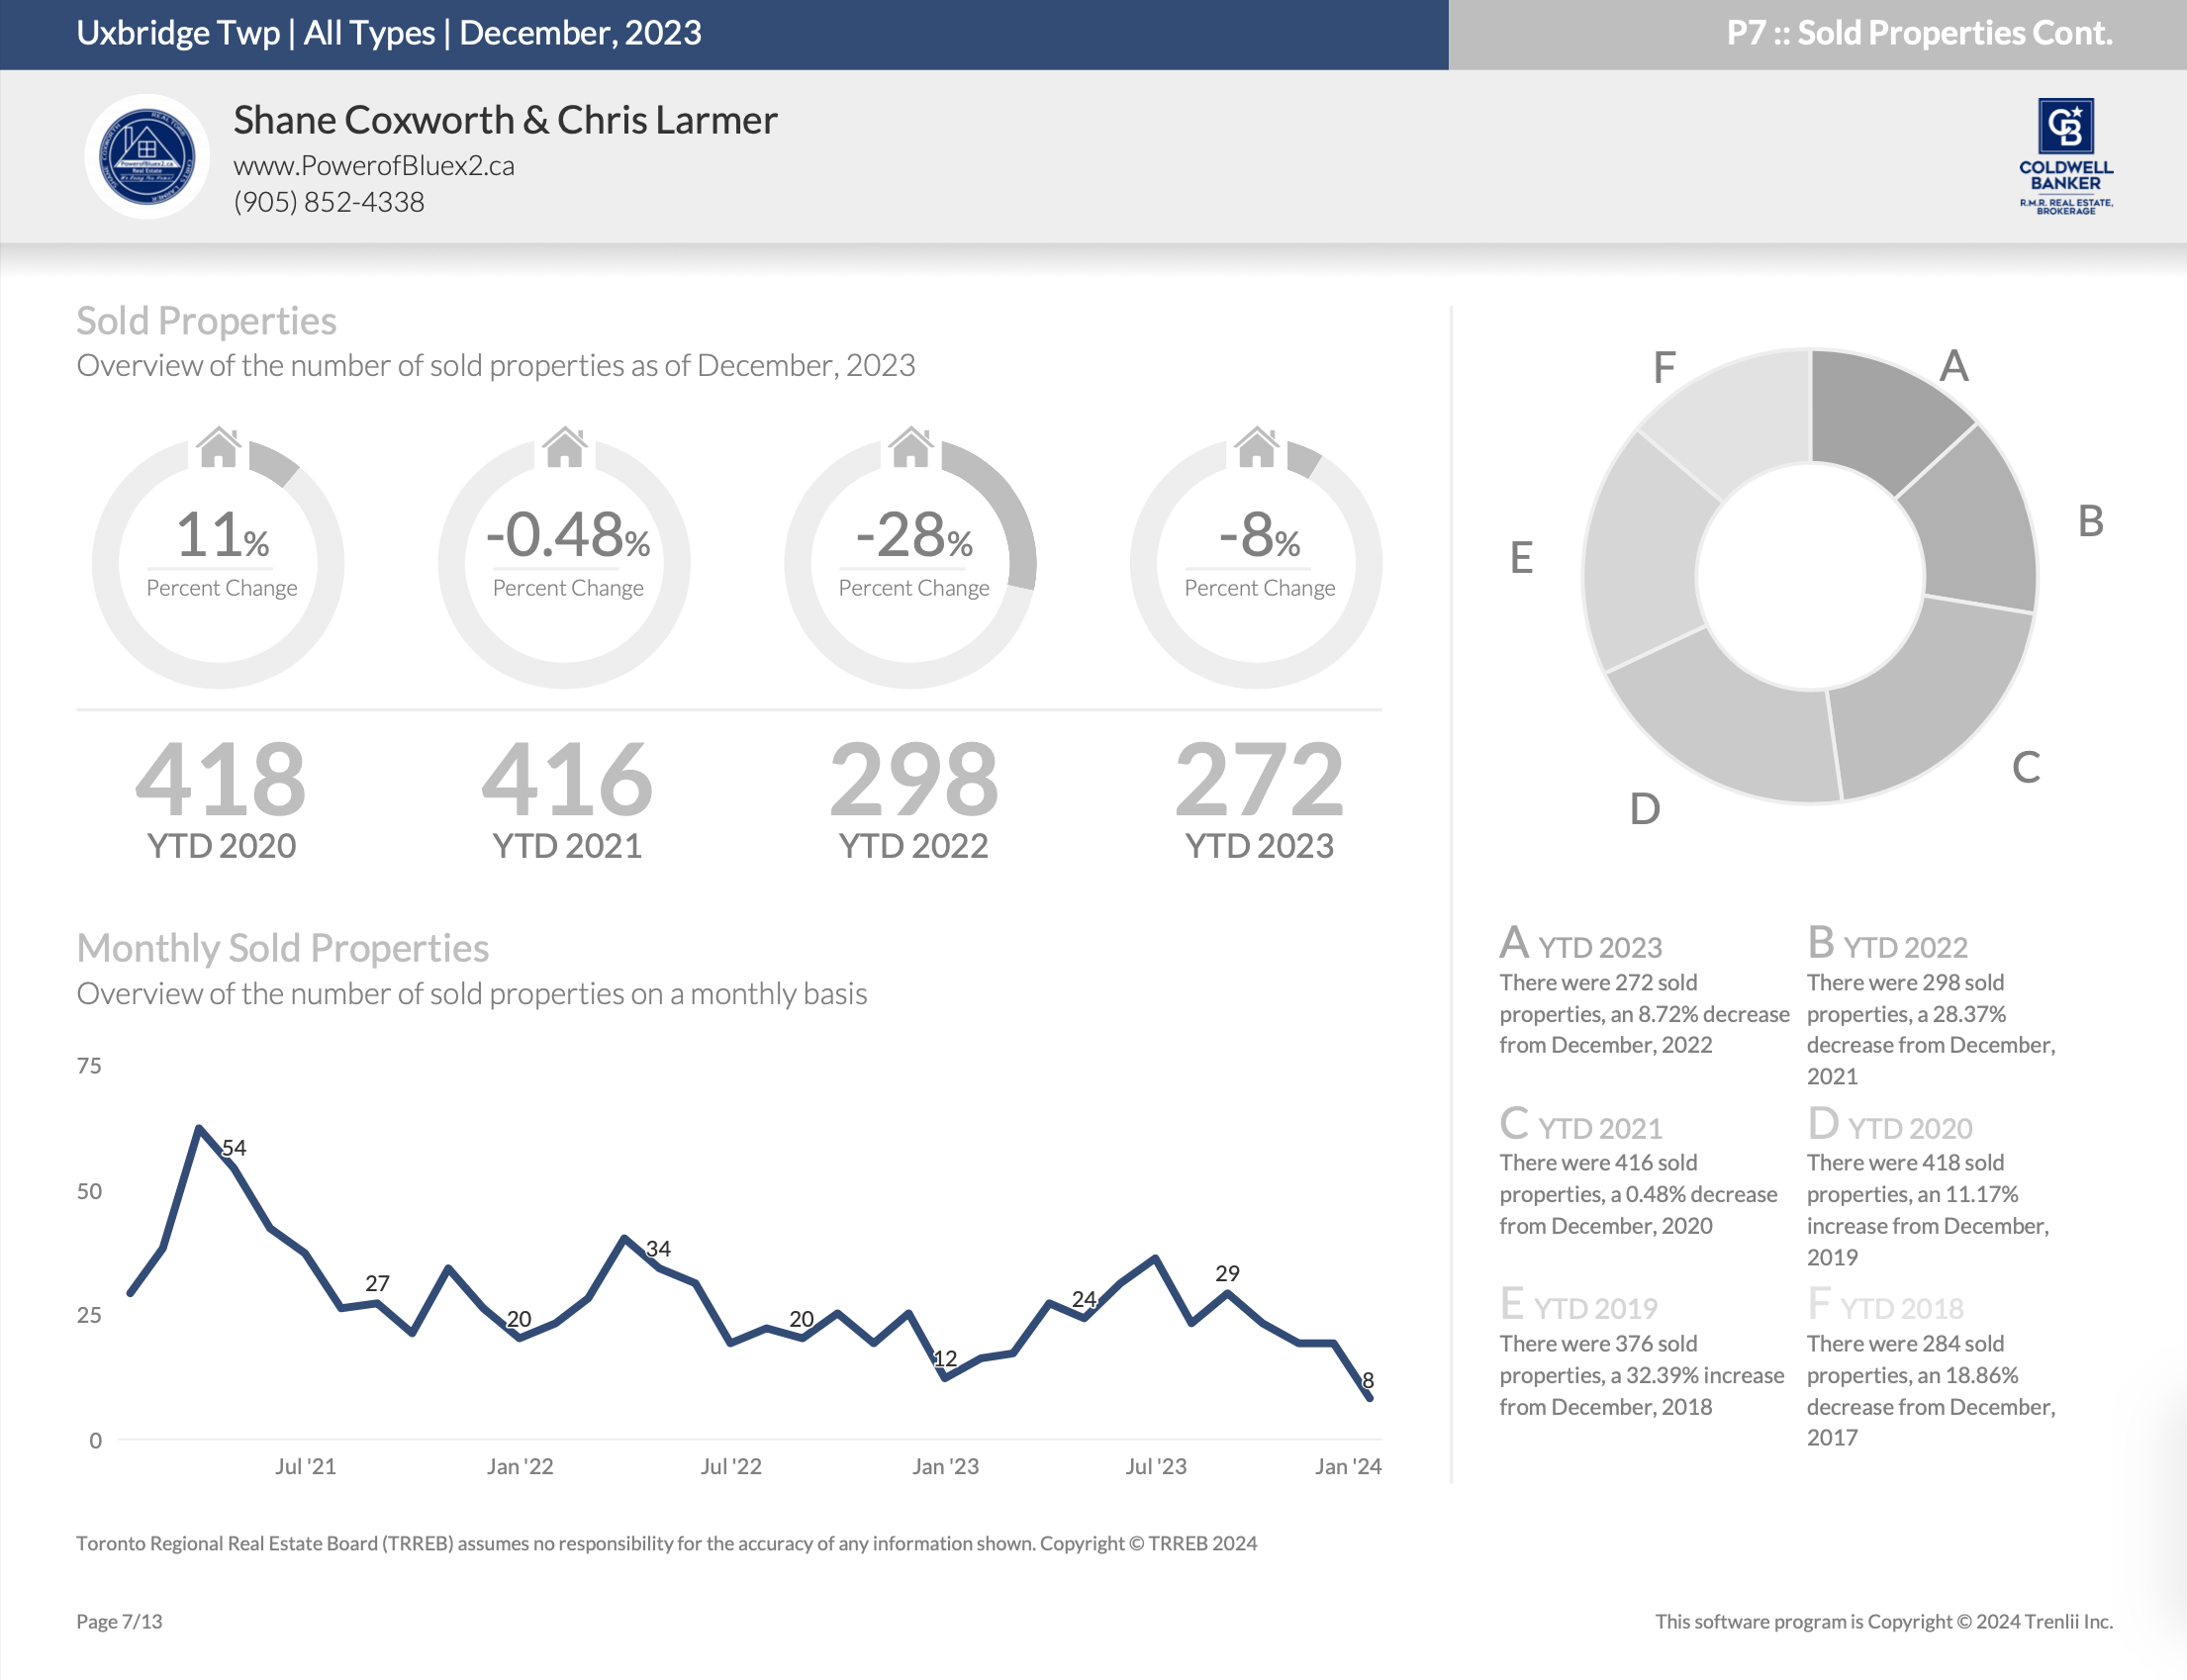
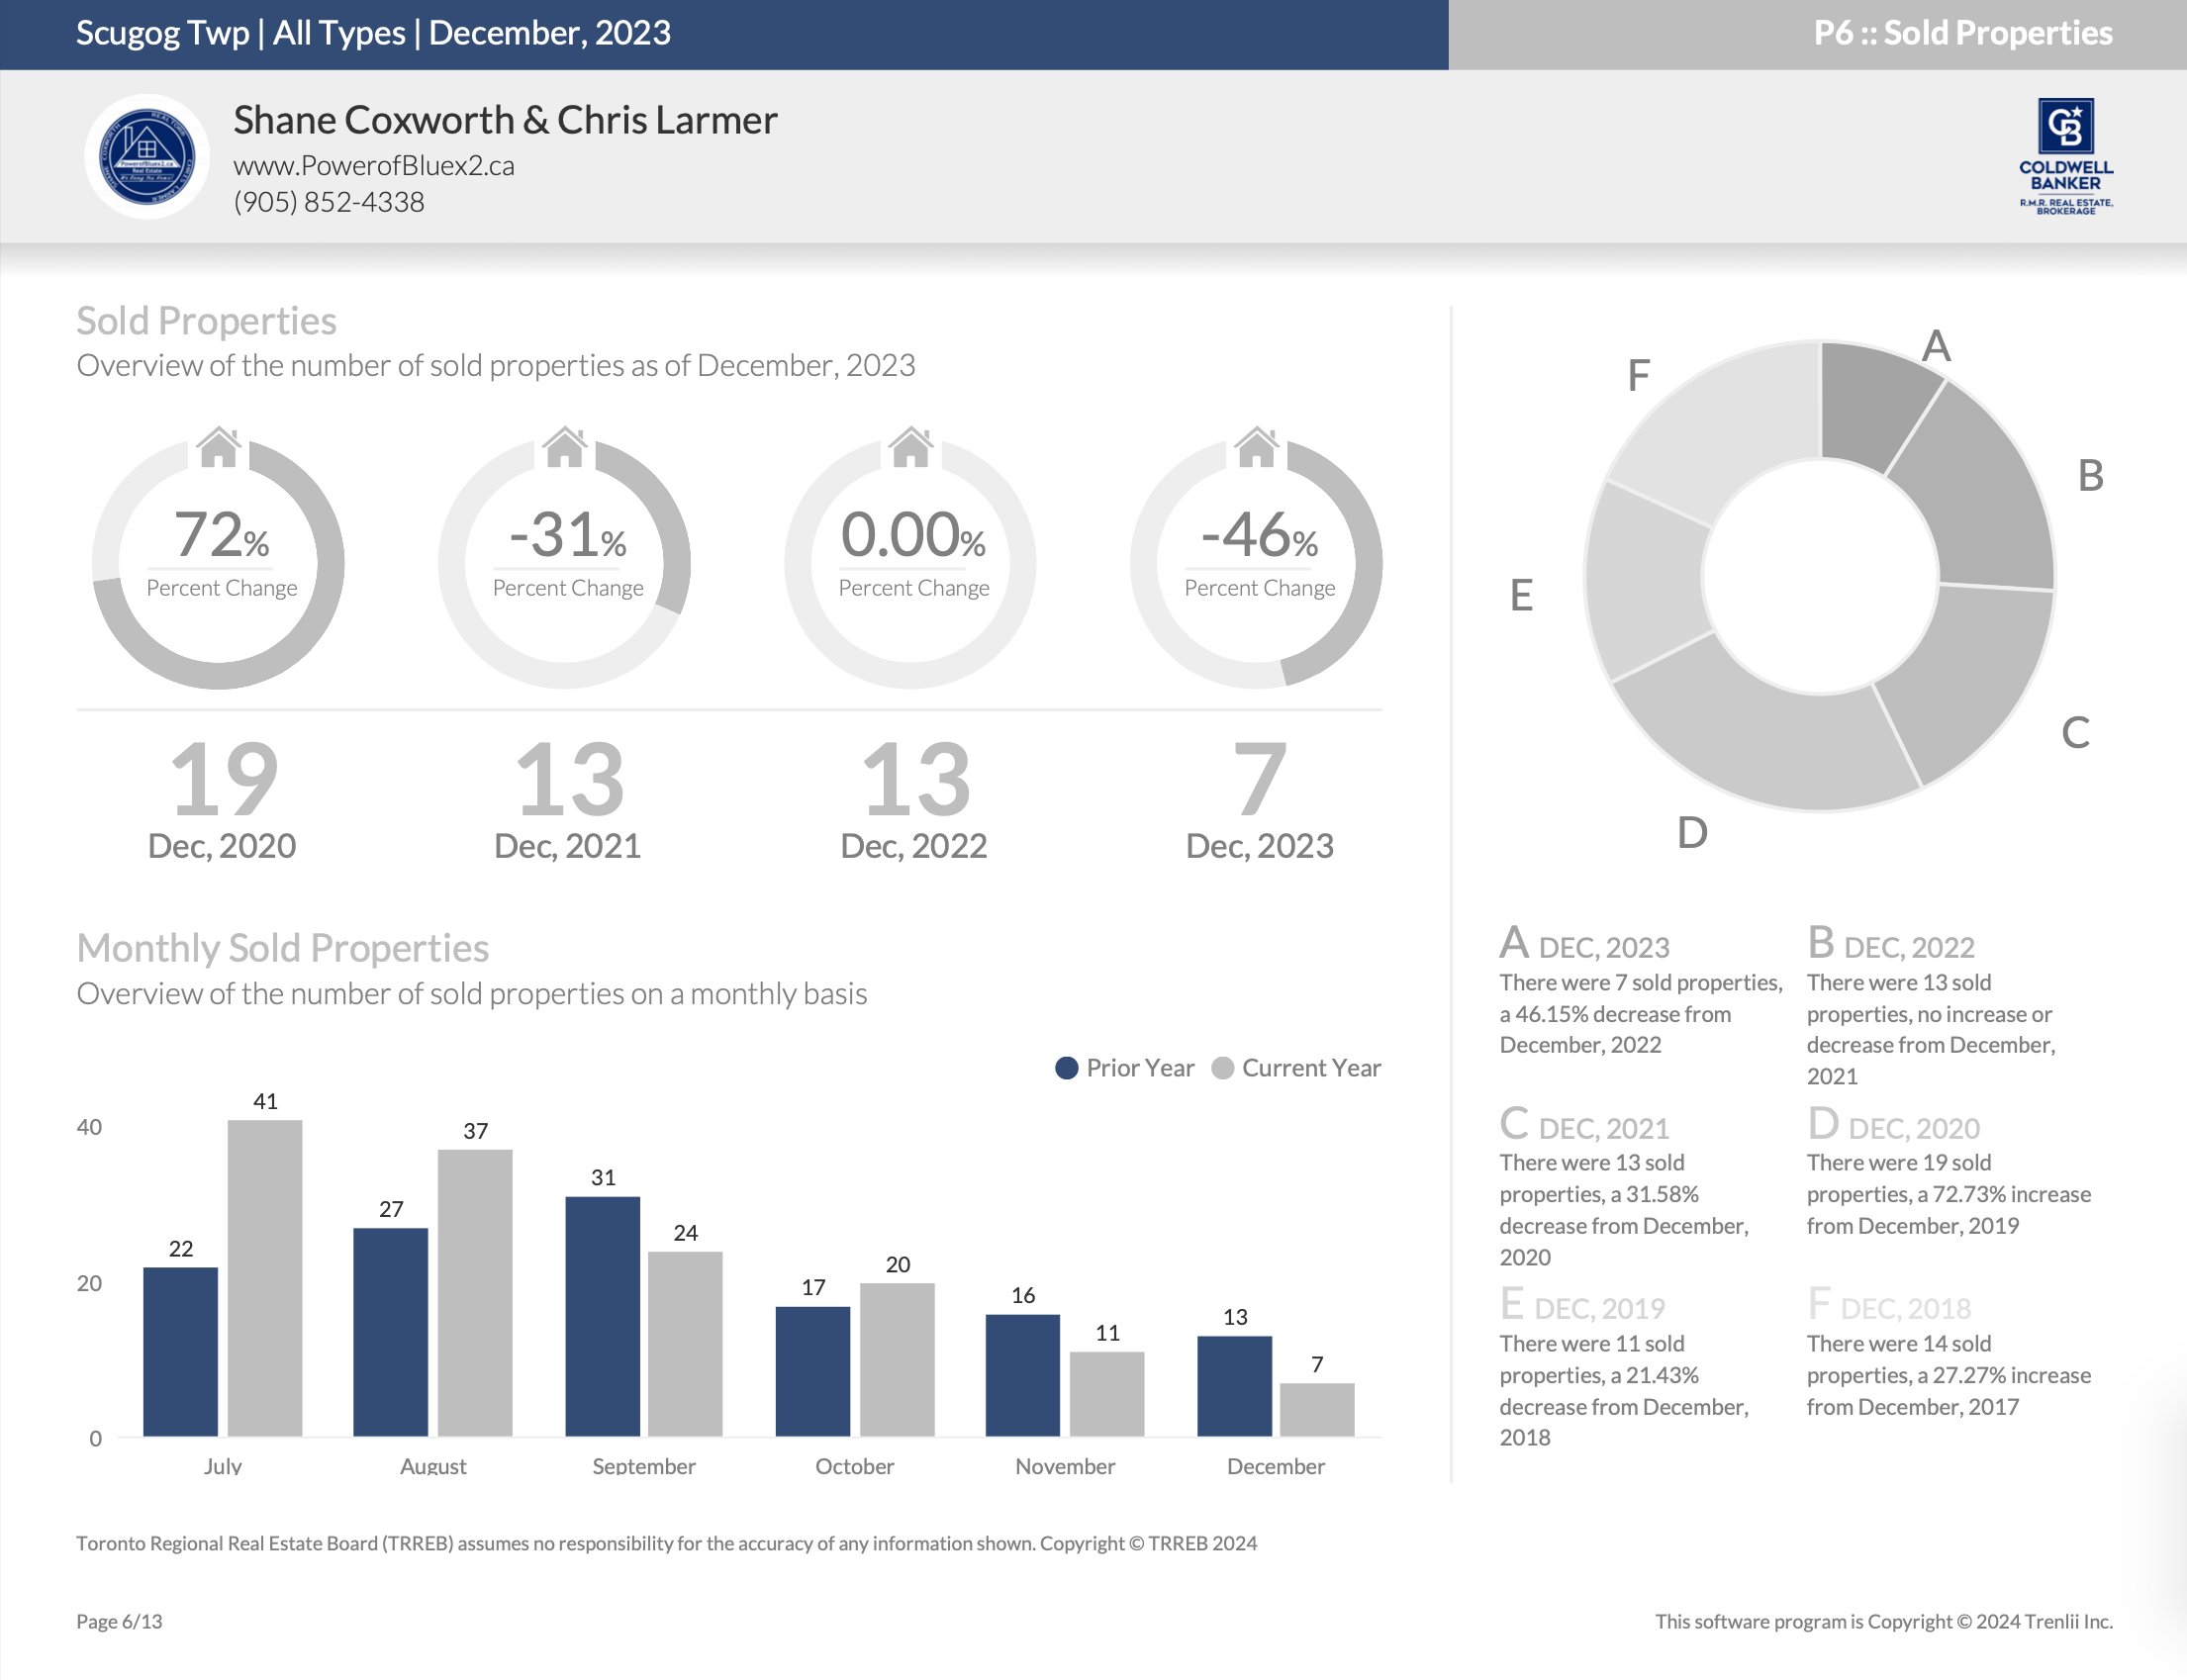
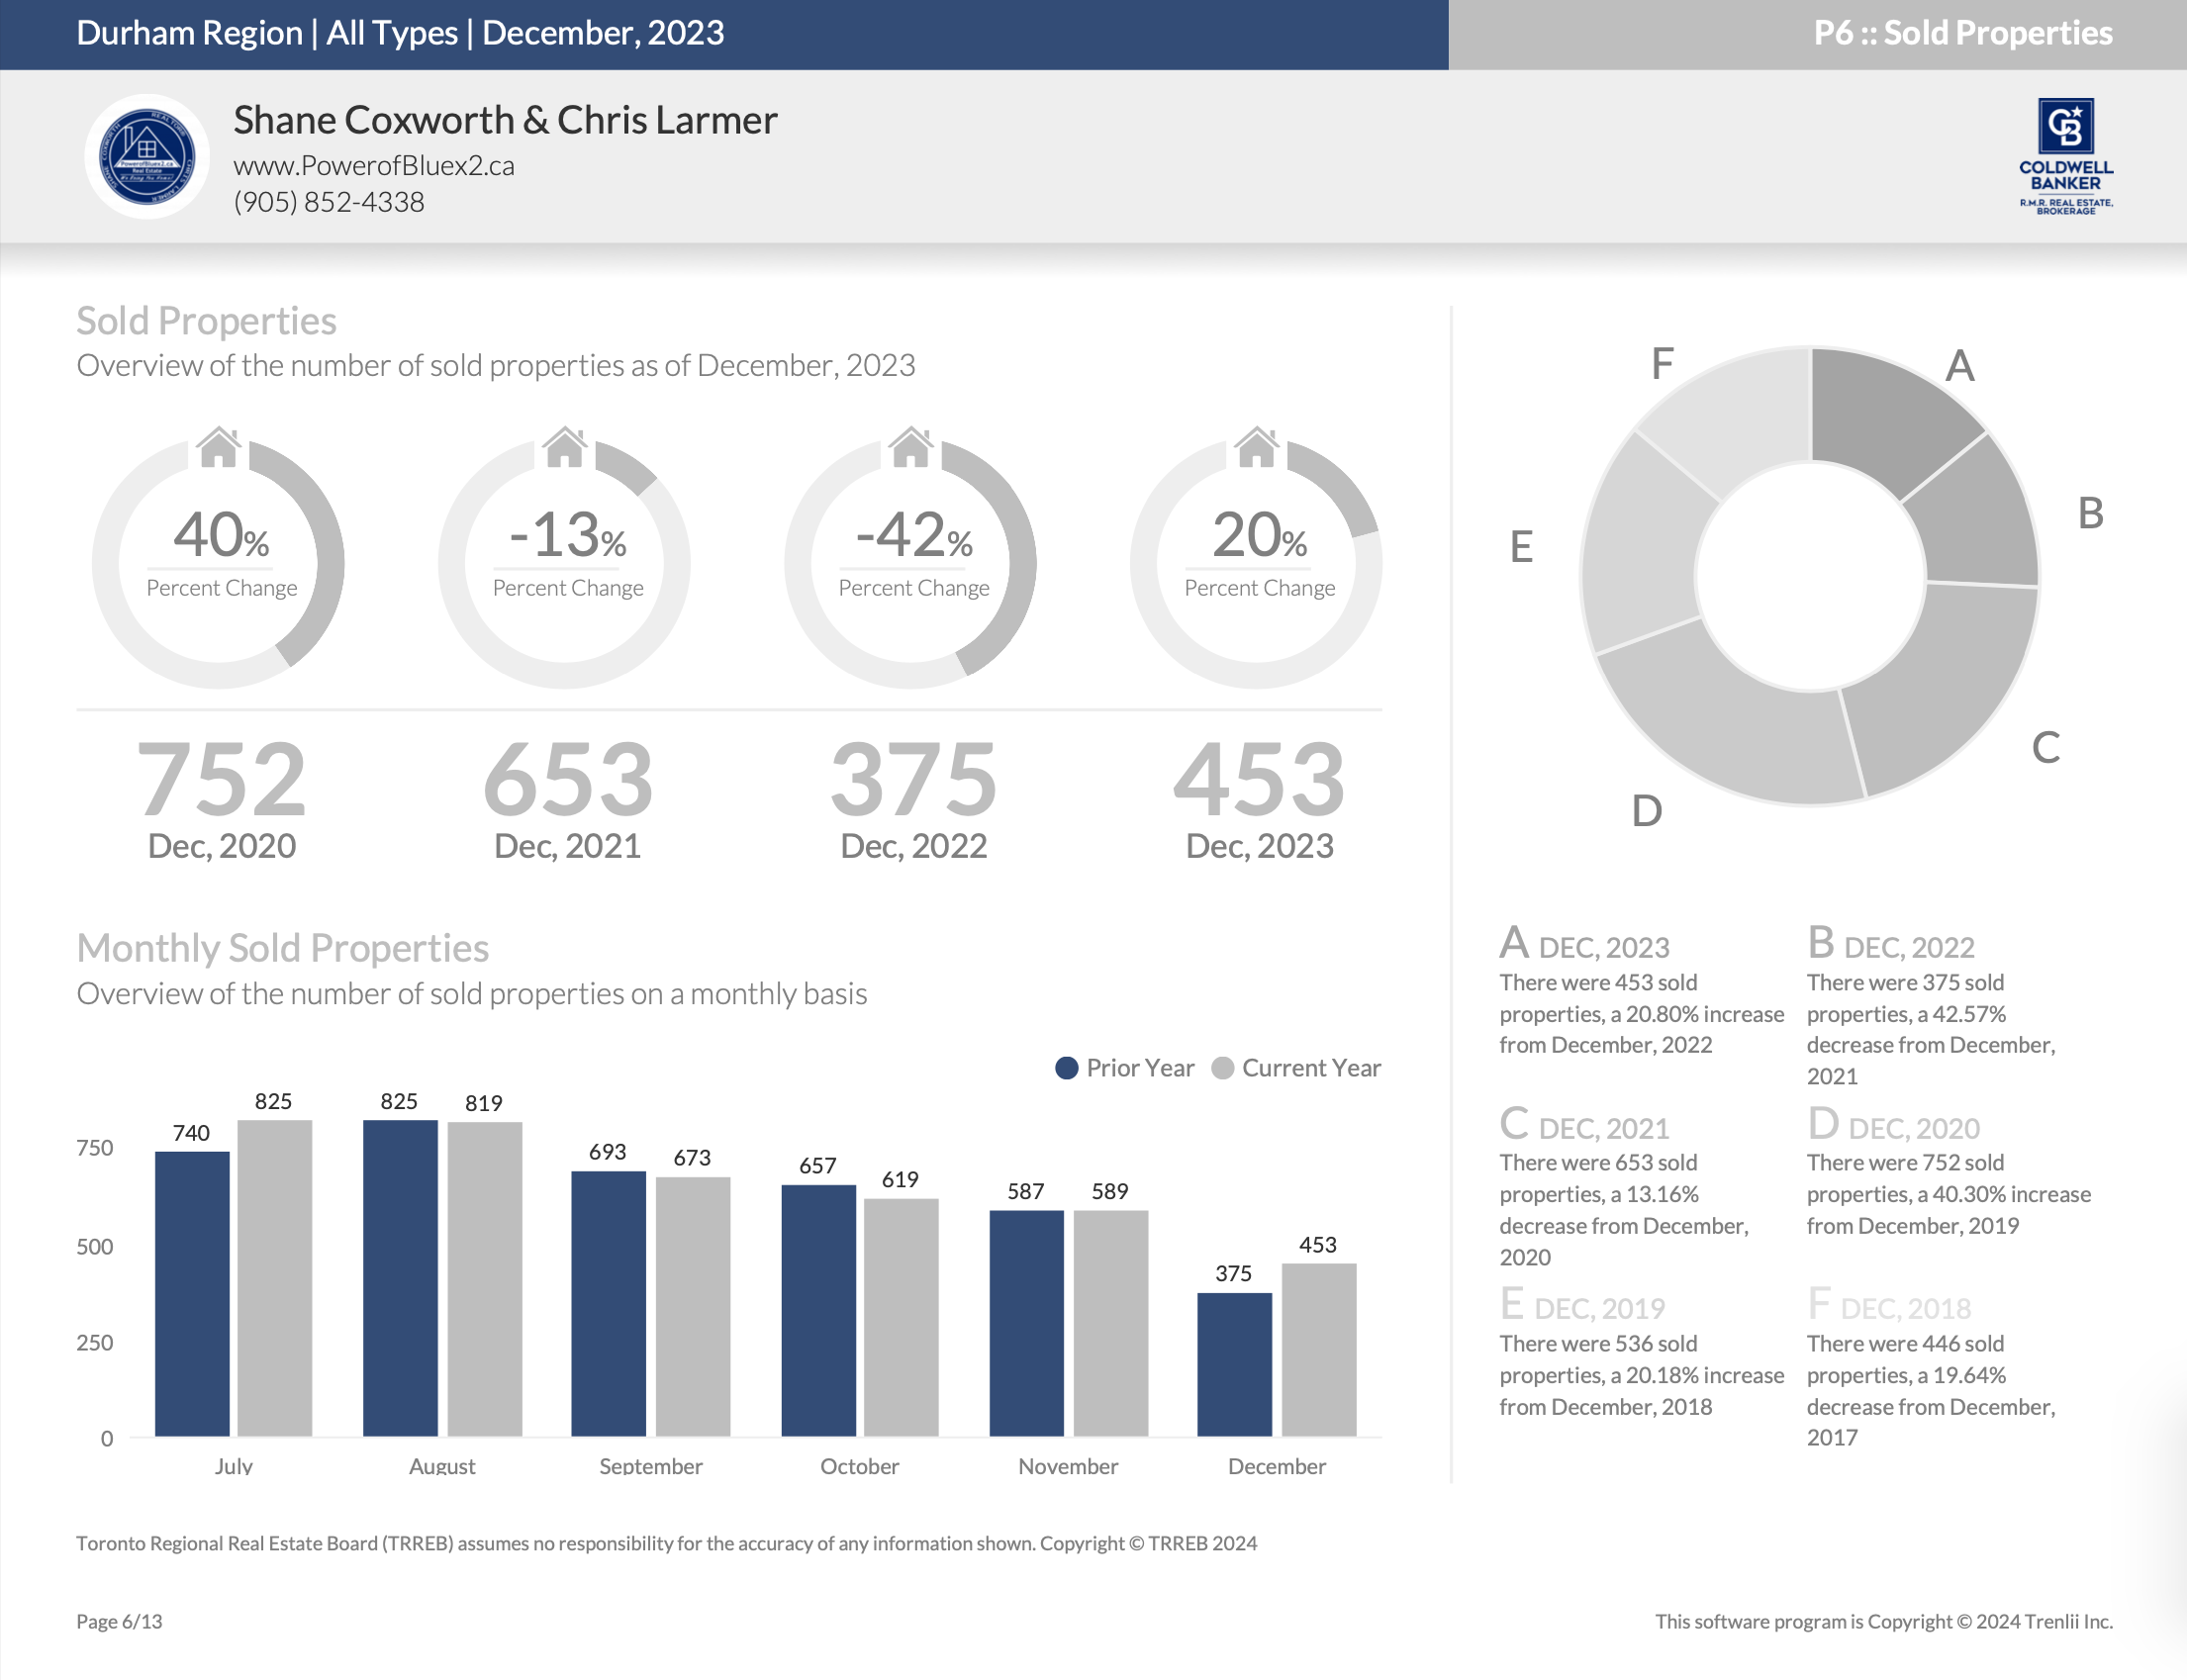
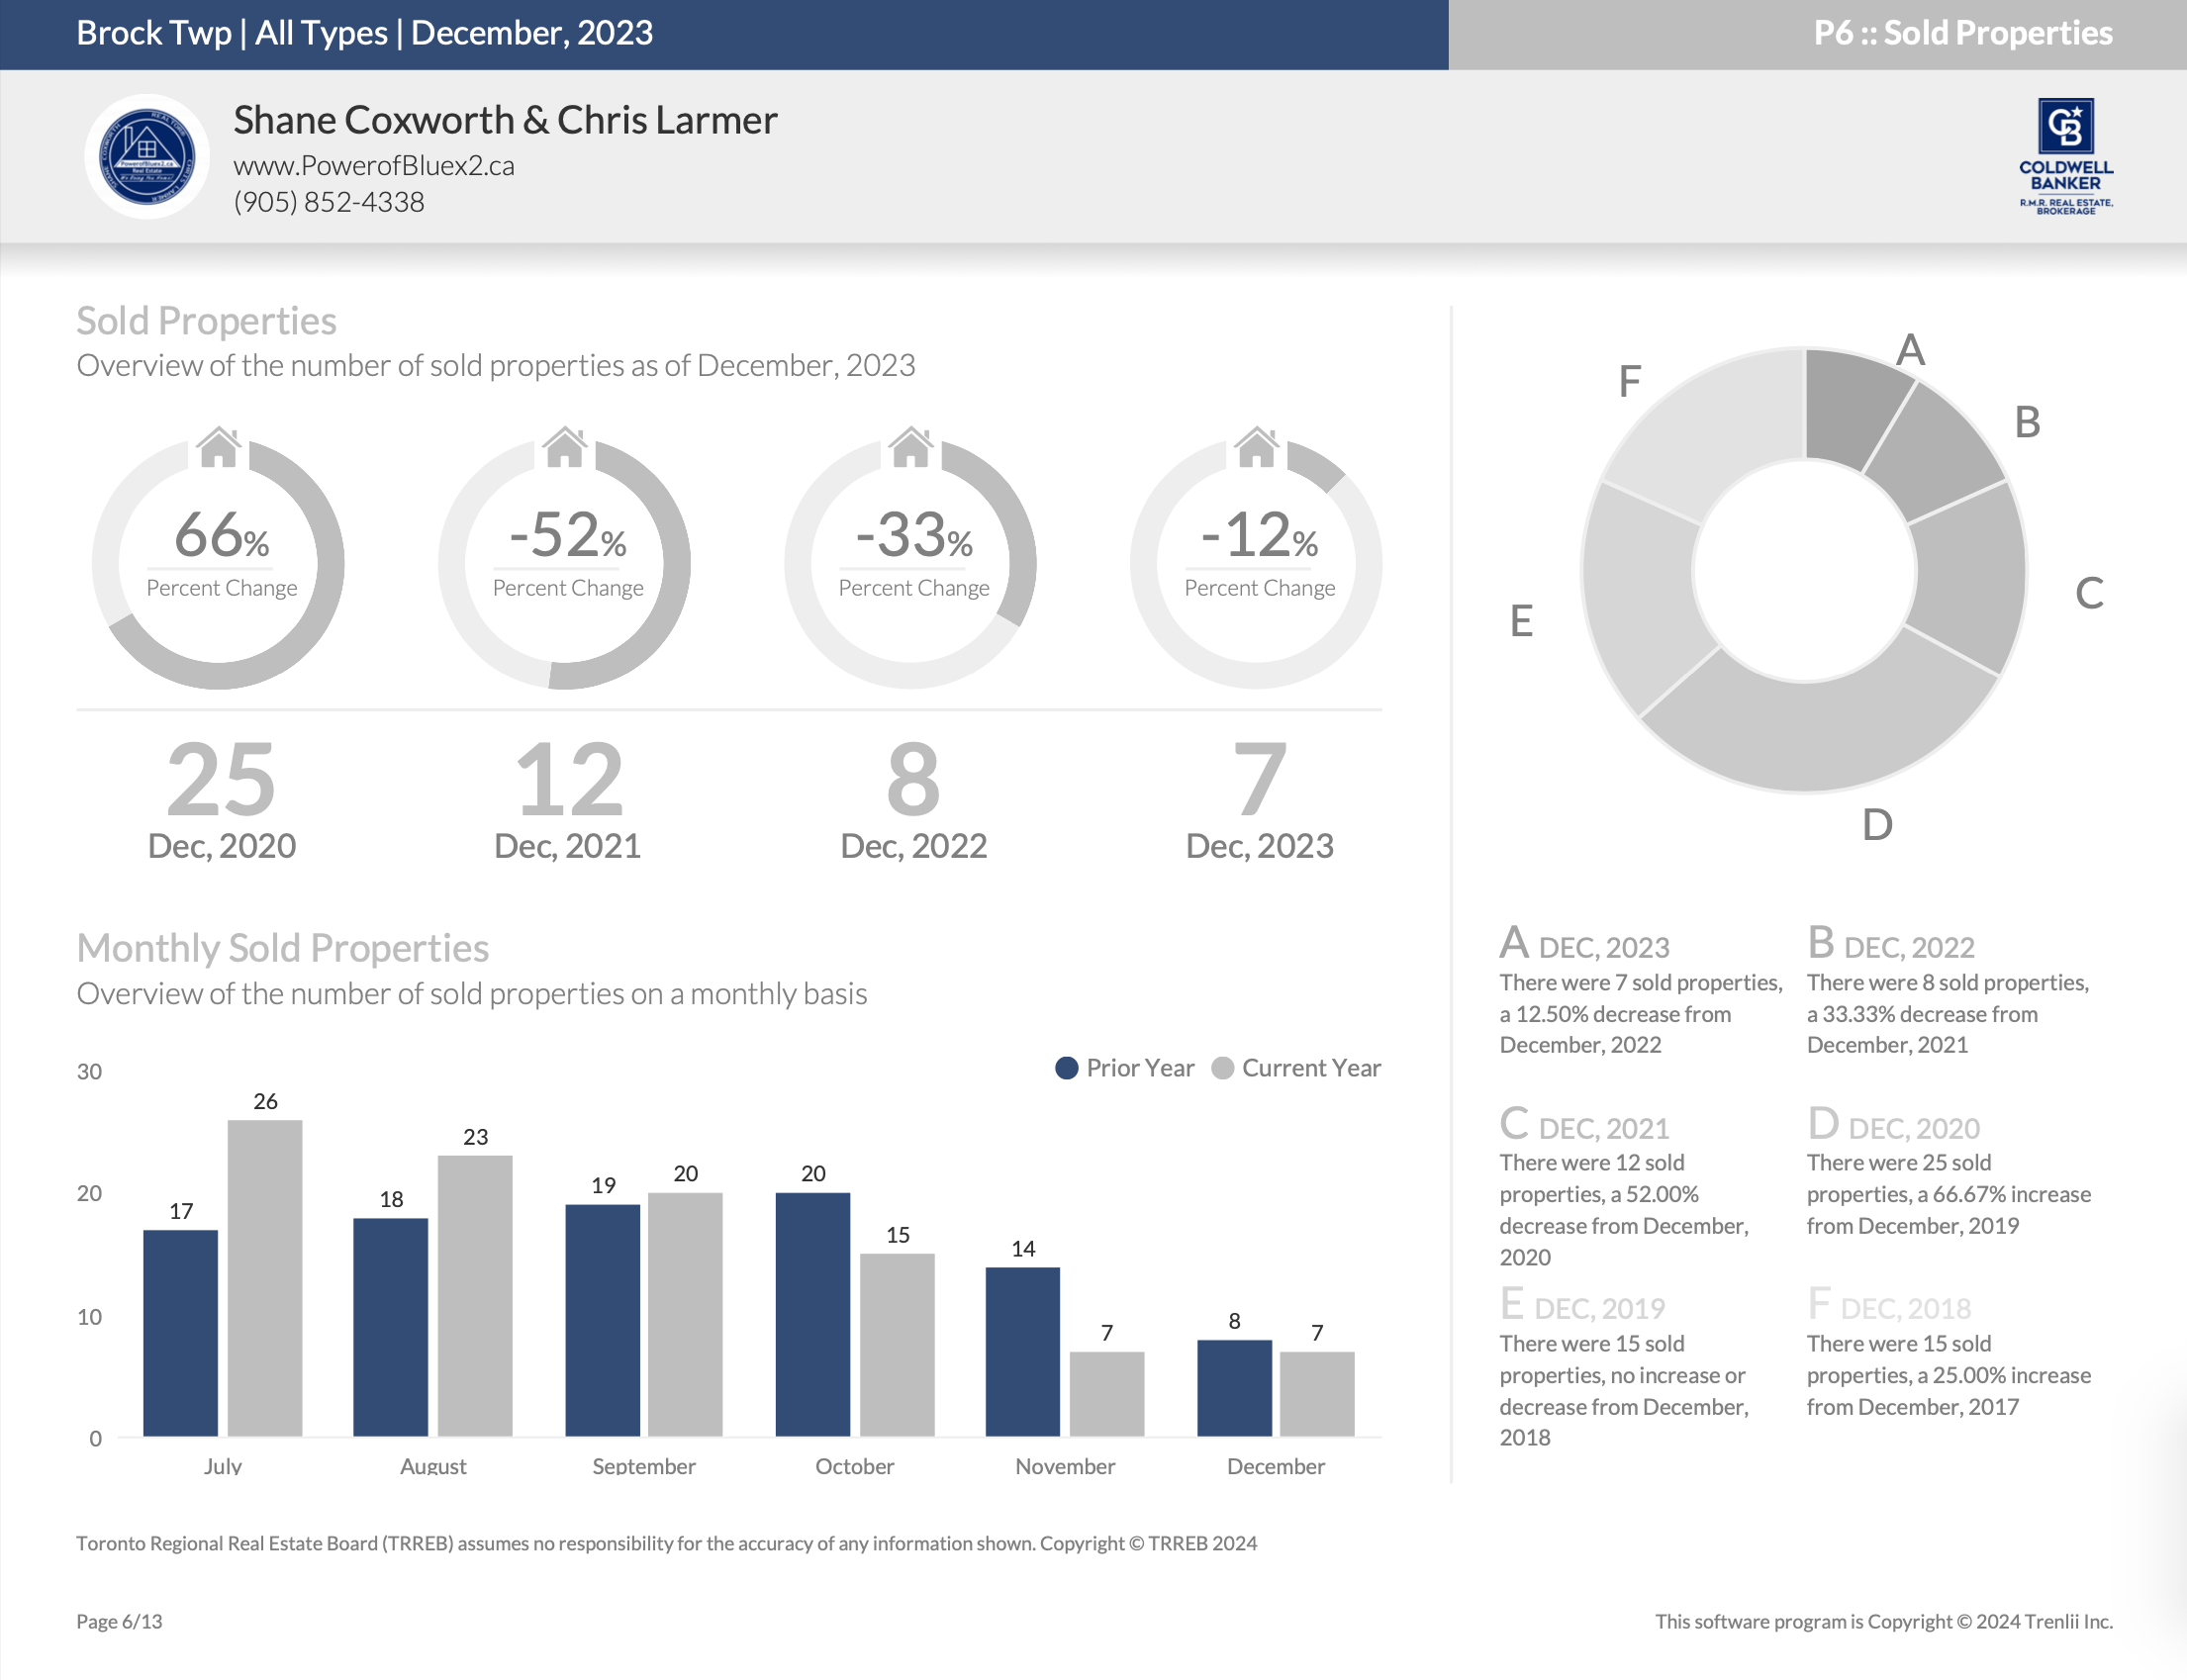
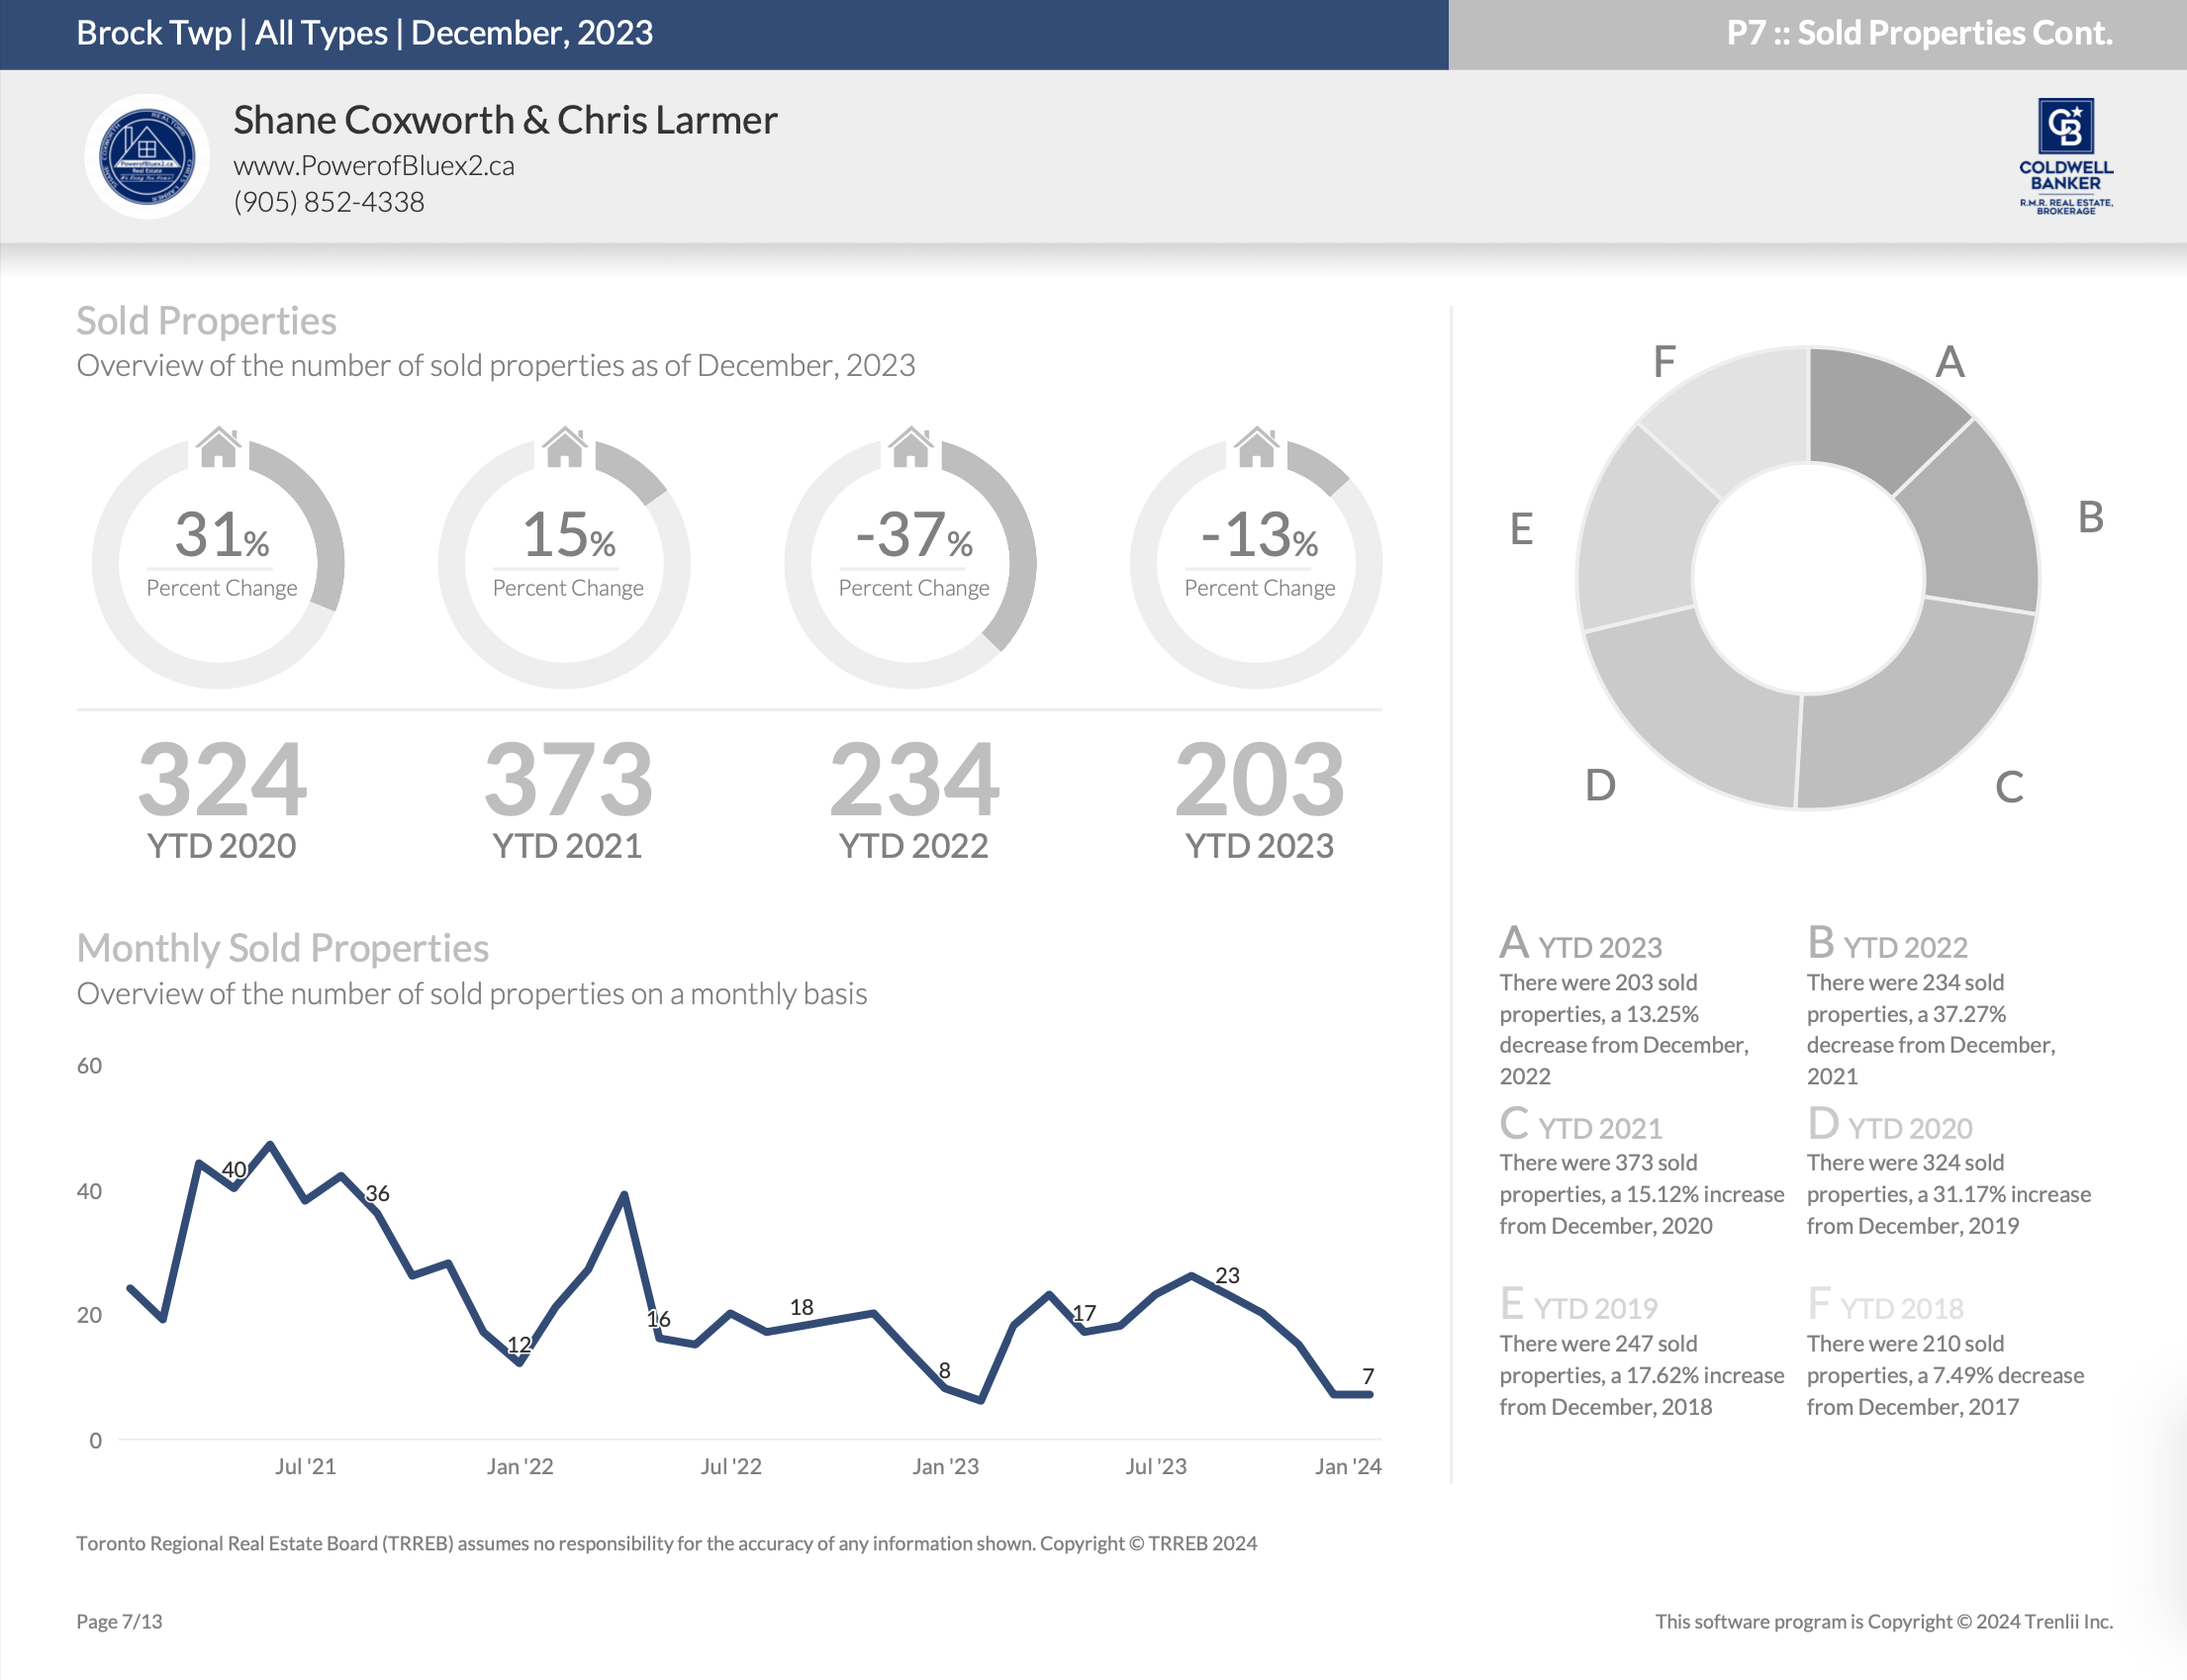
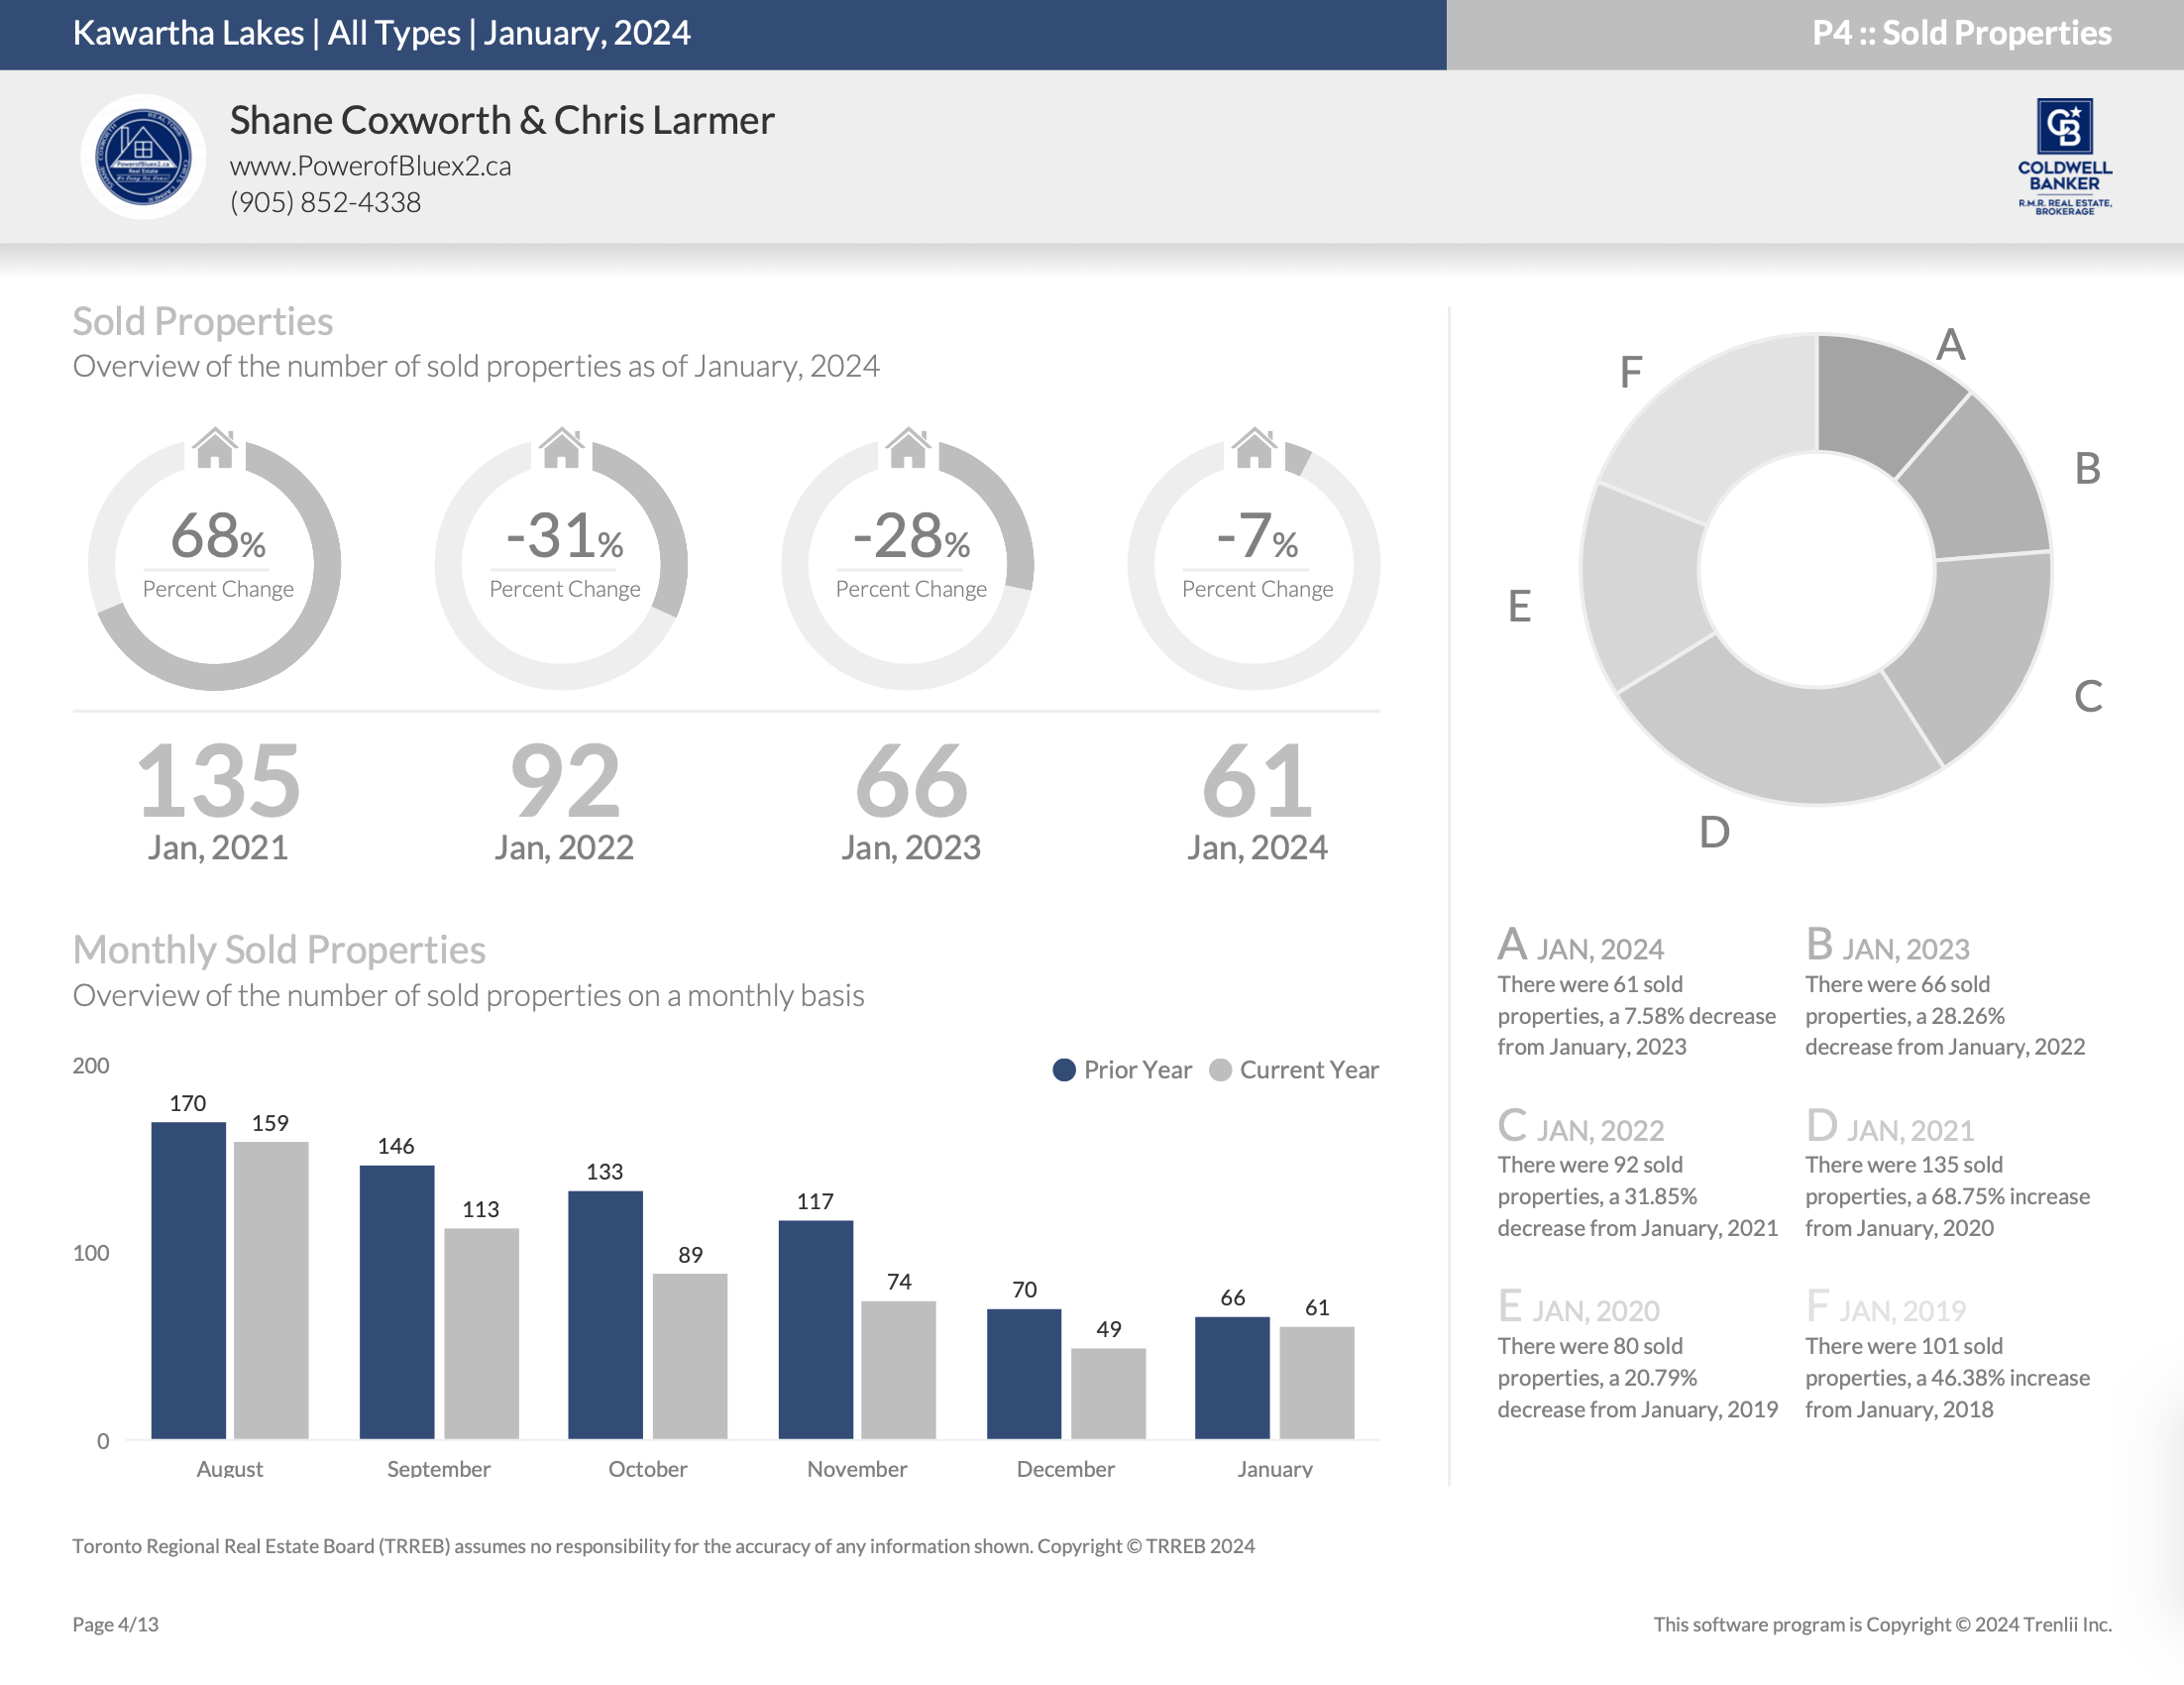
Number of Properties Sold – January 2024
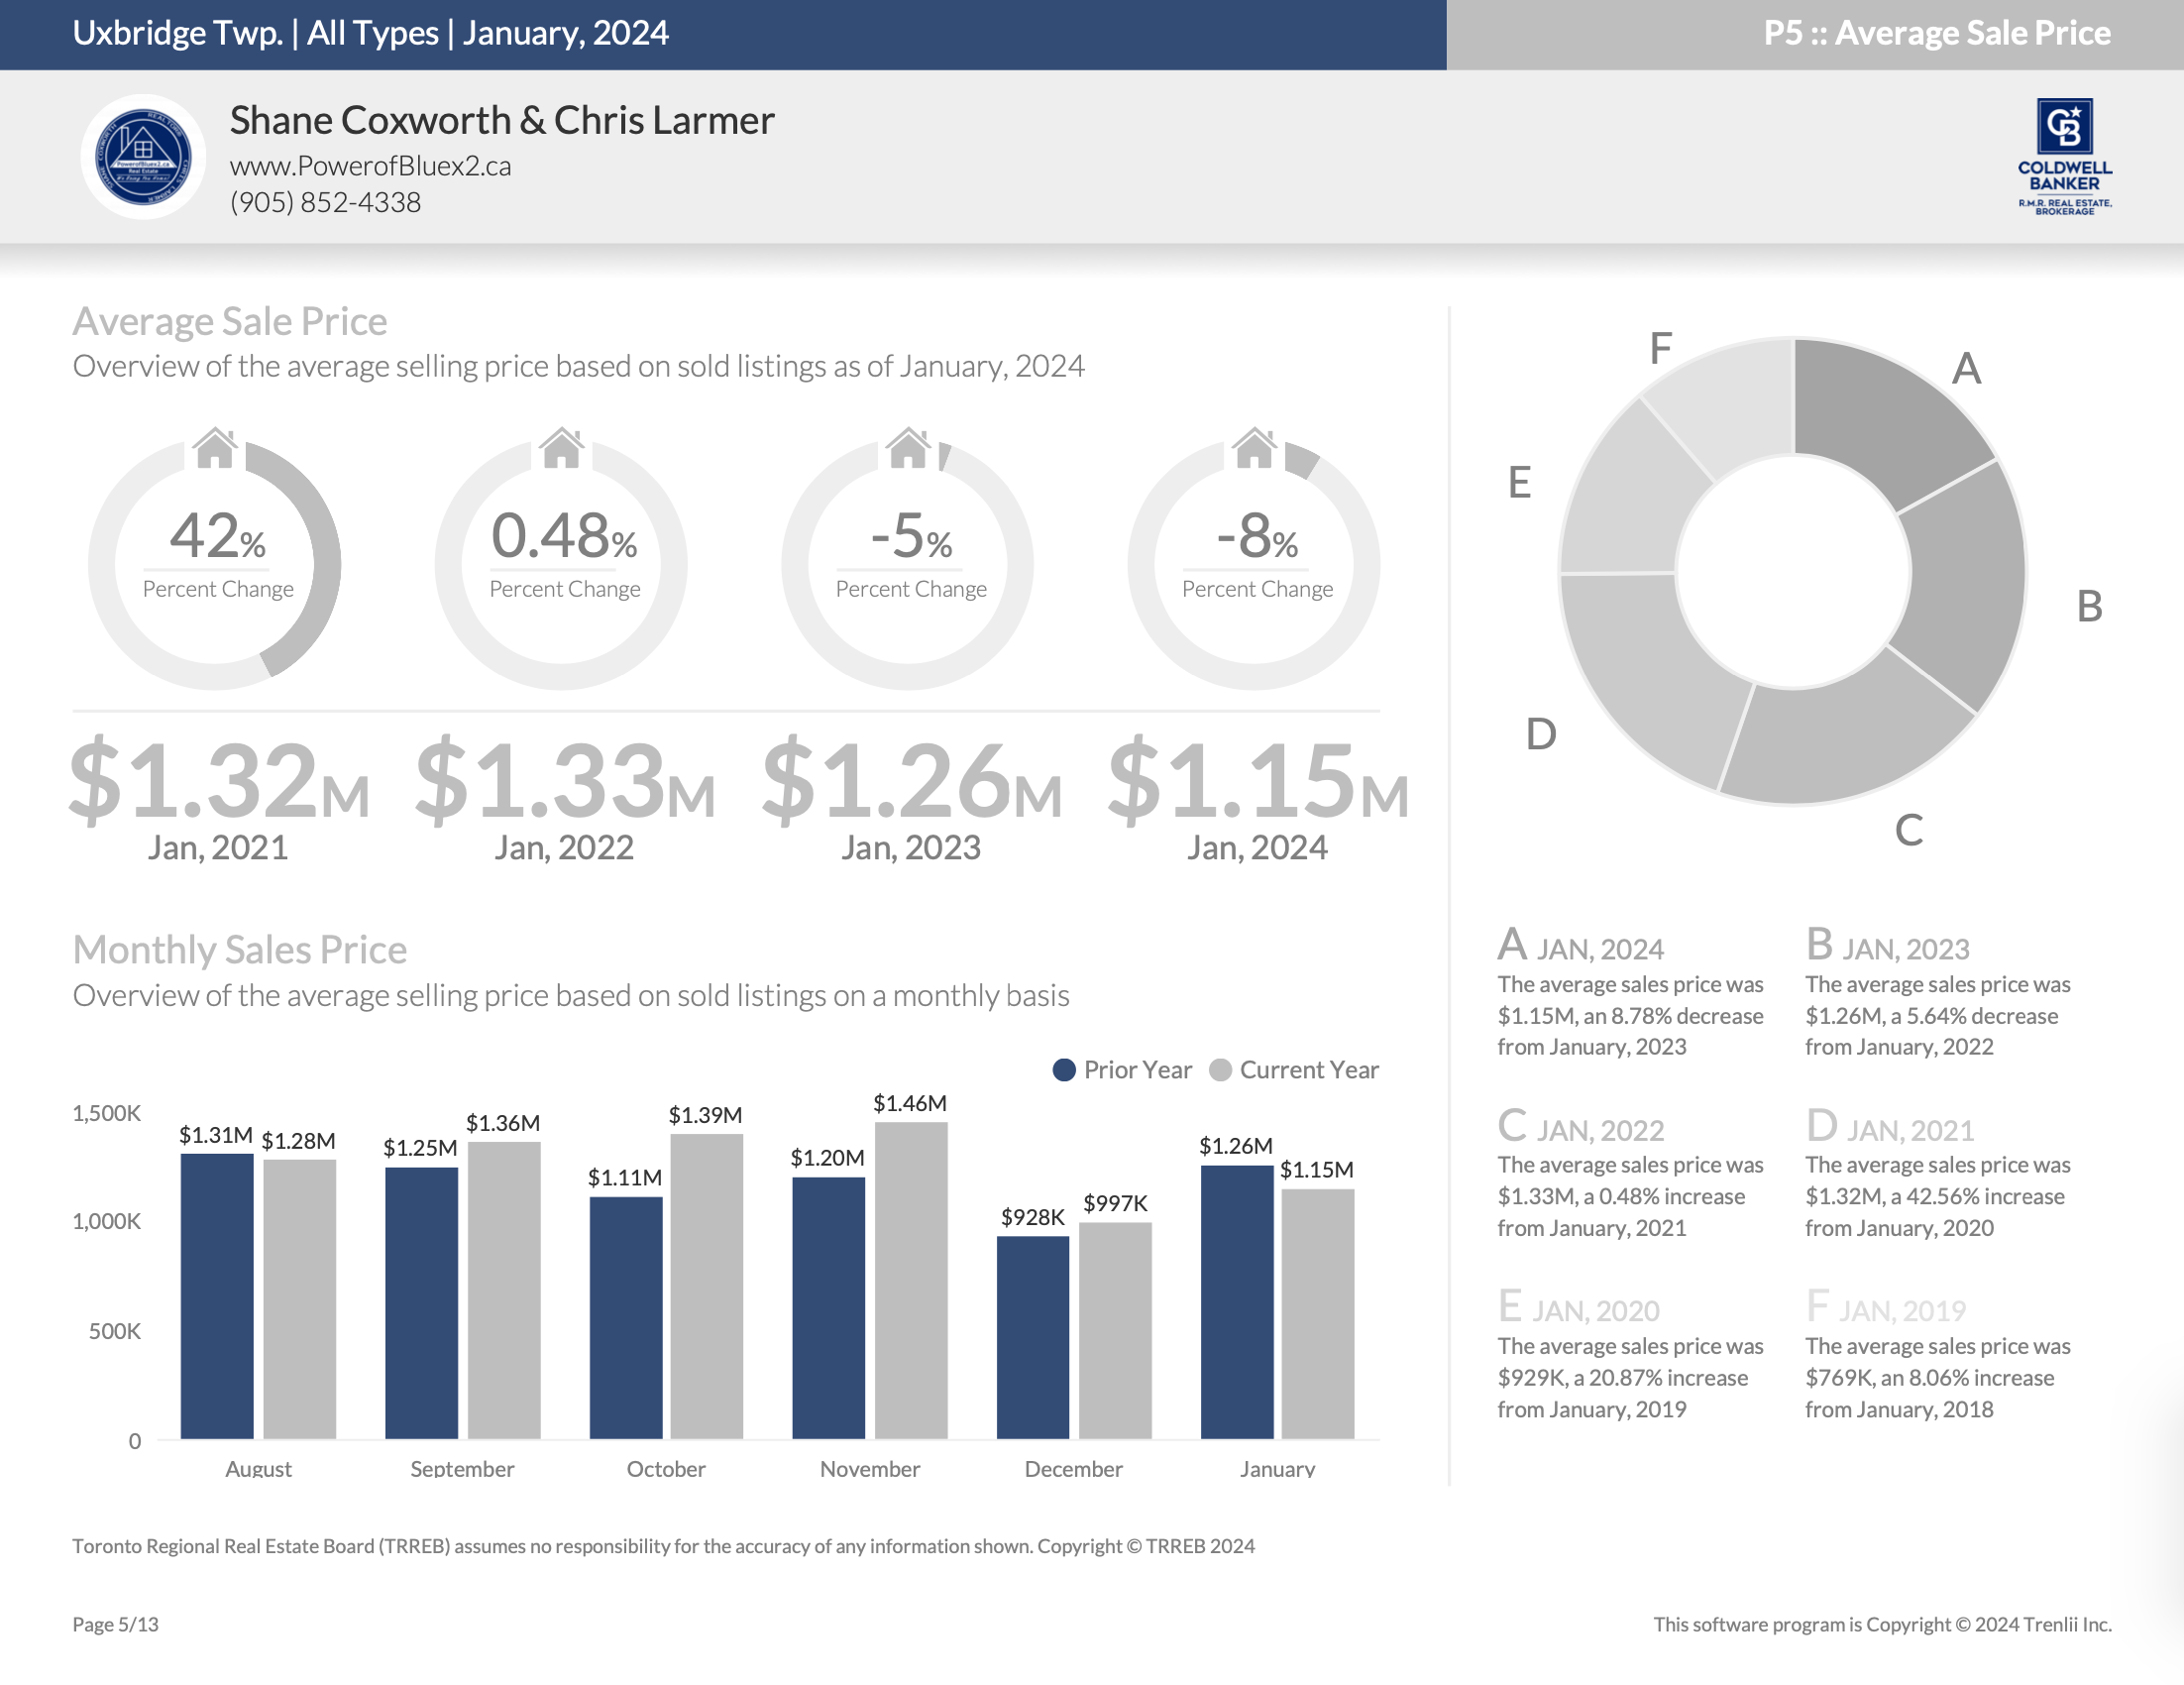
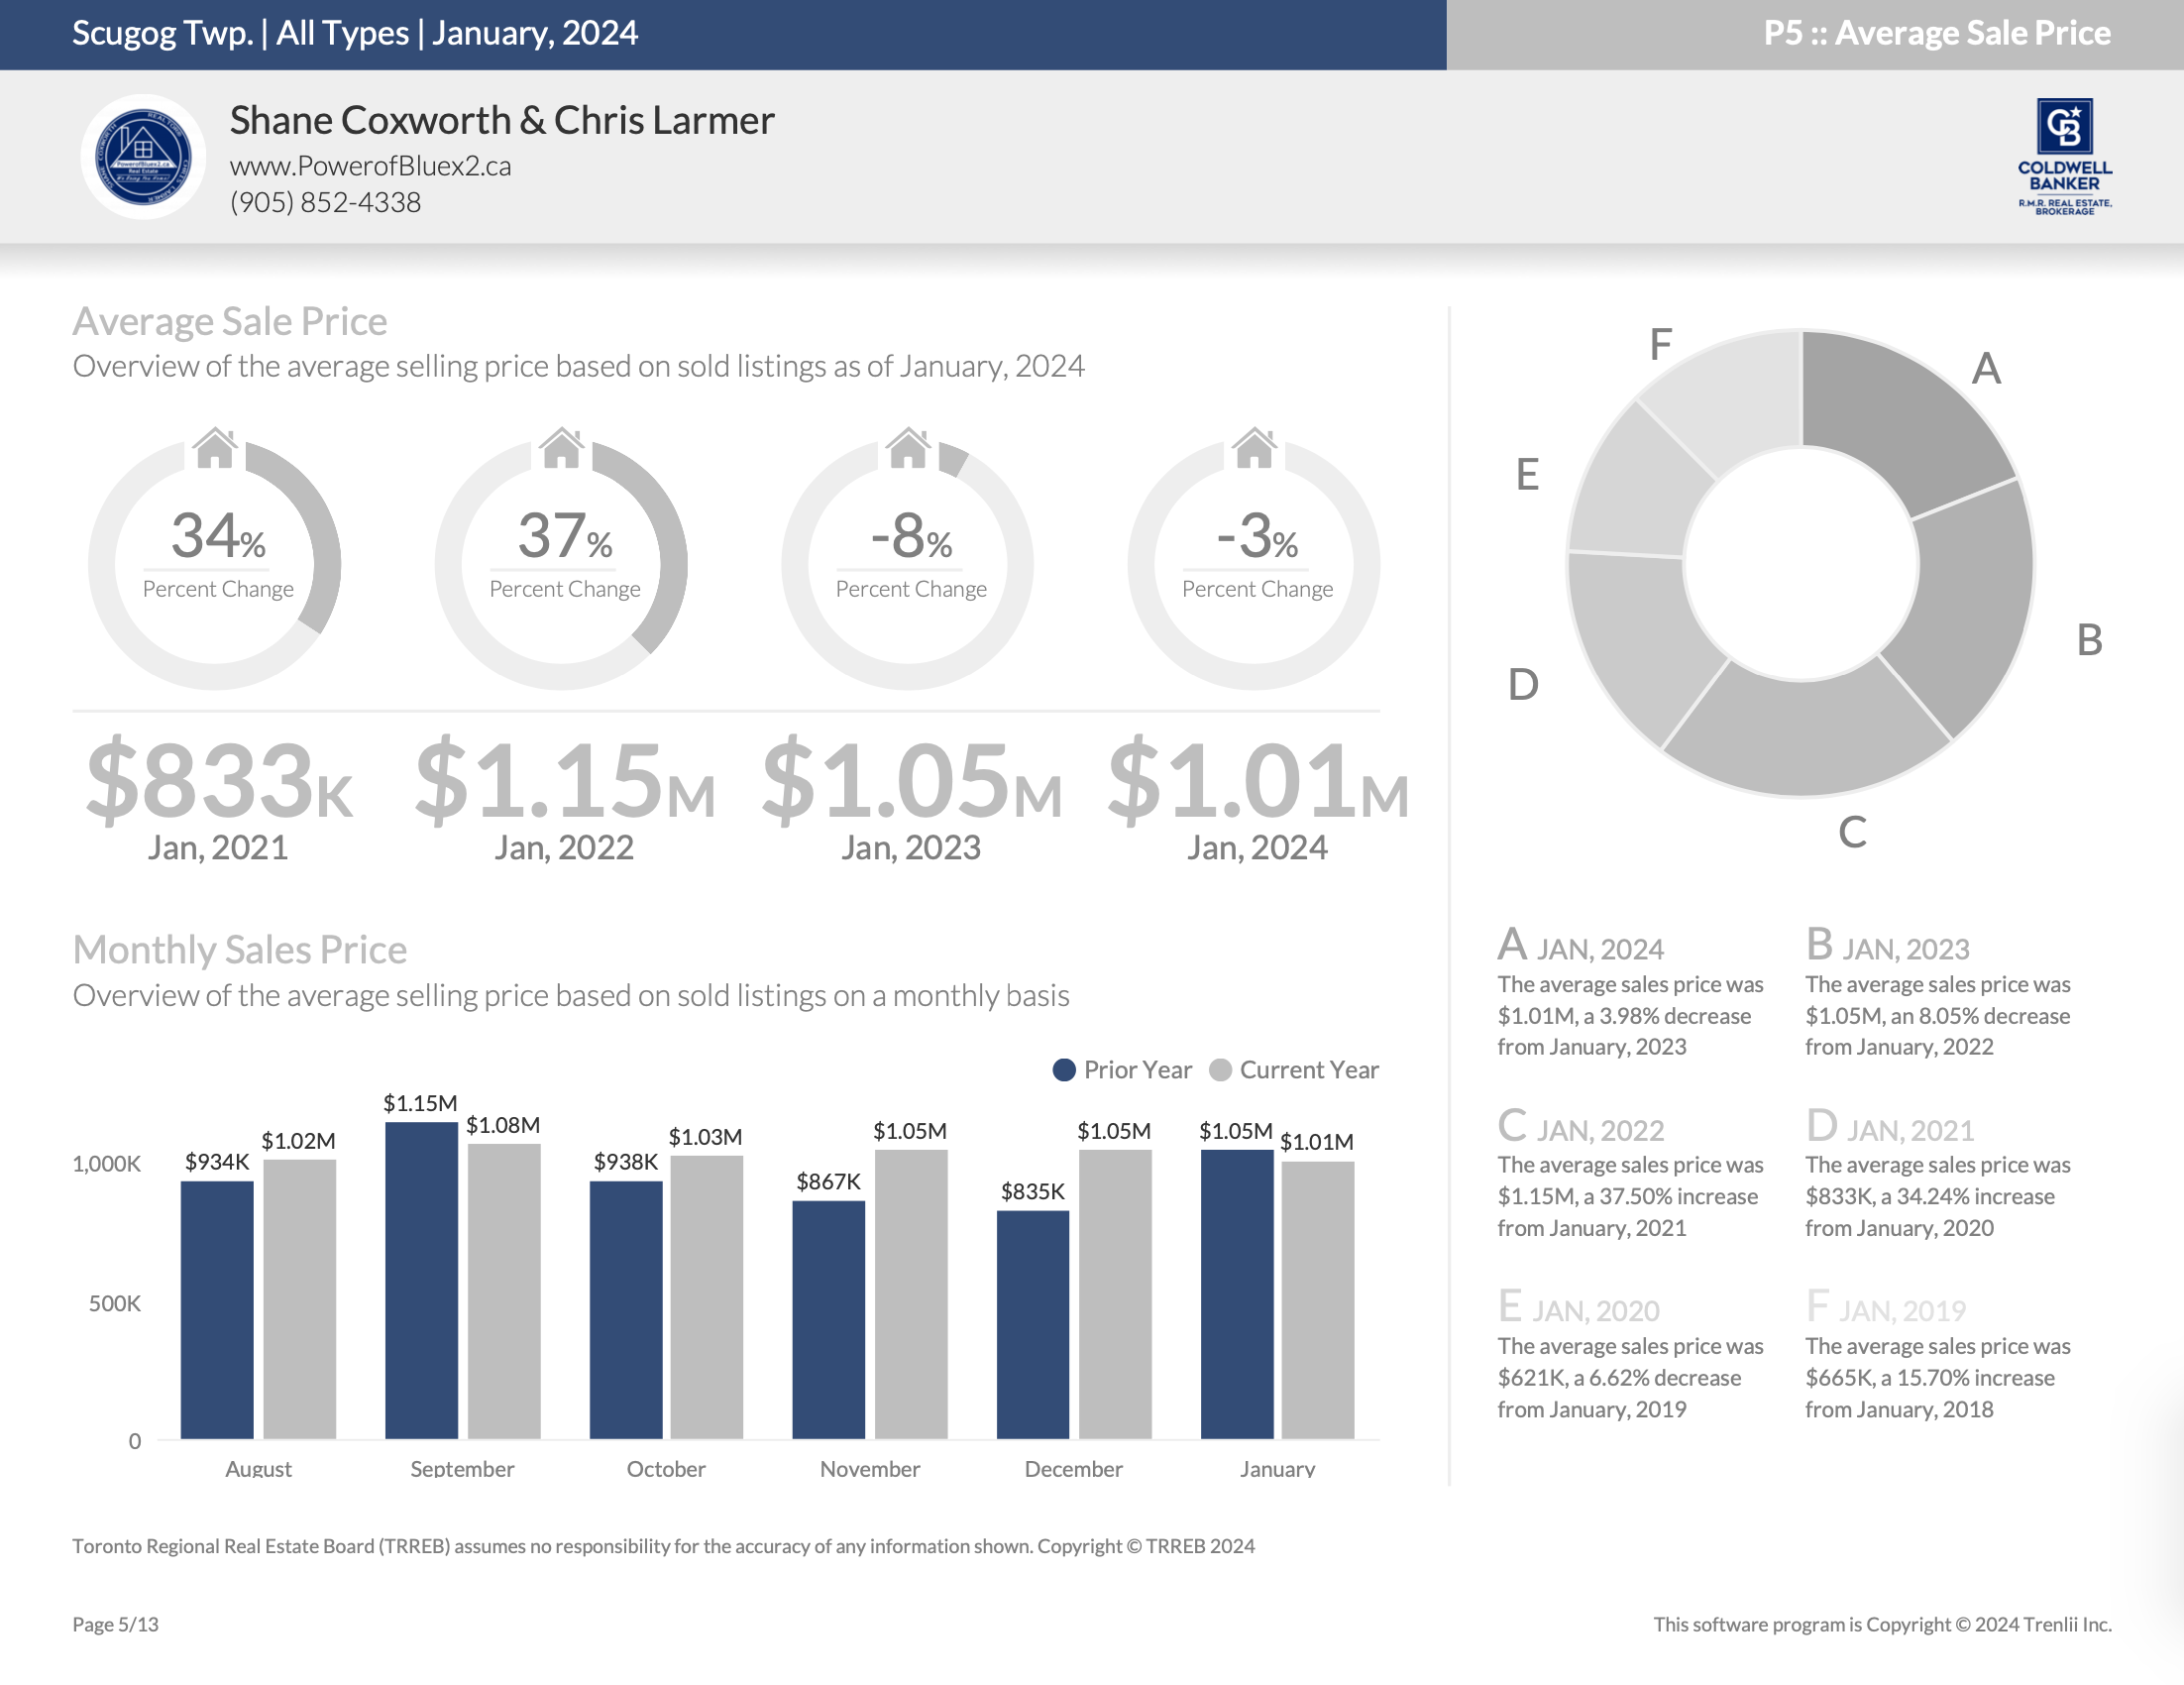
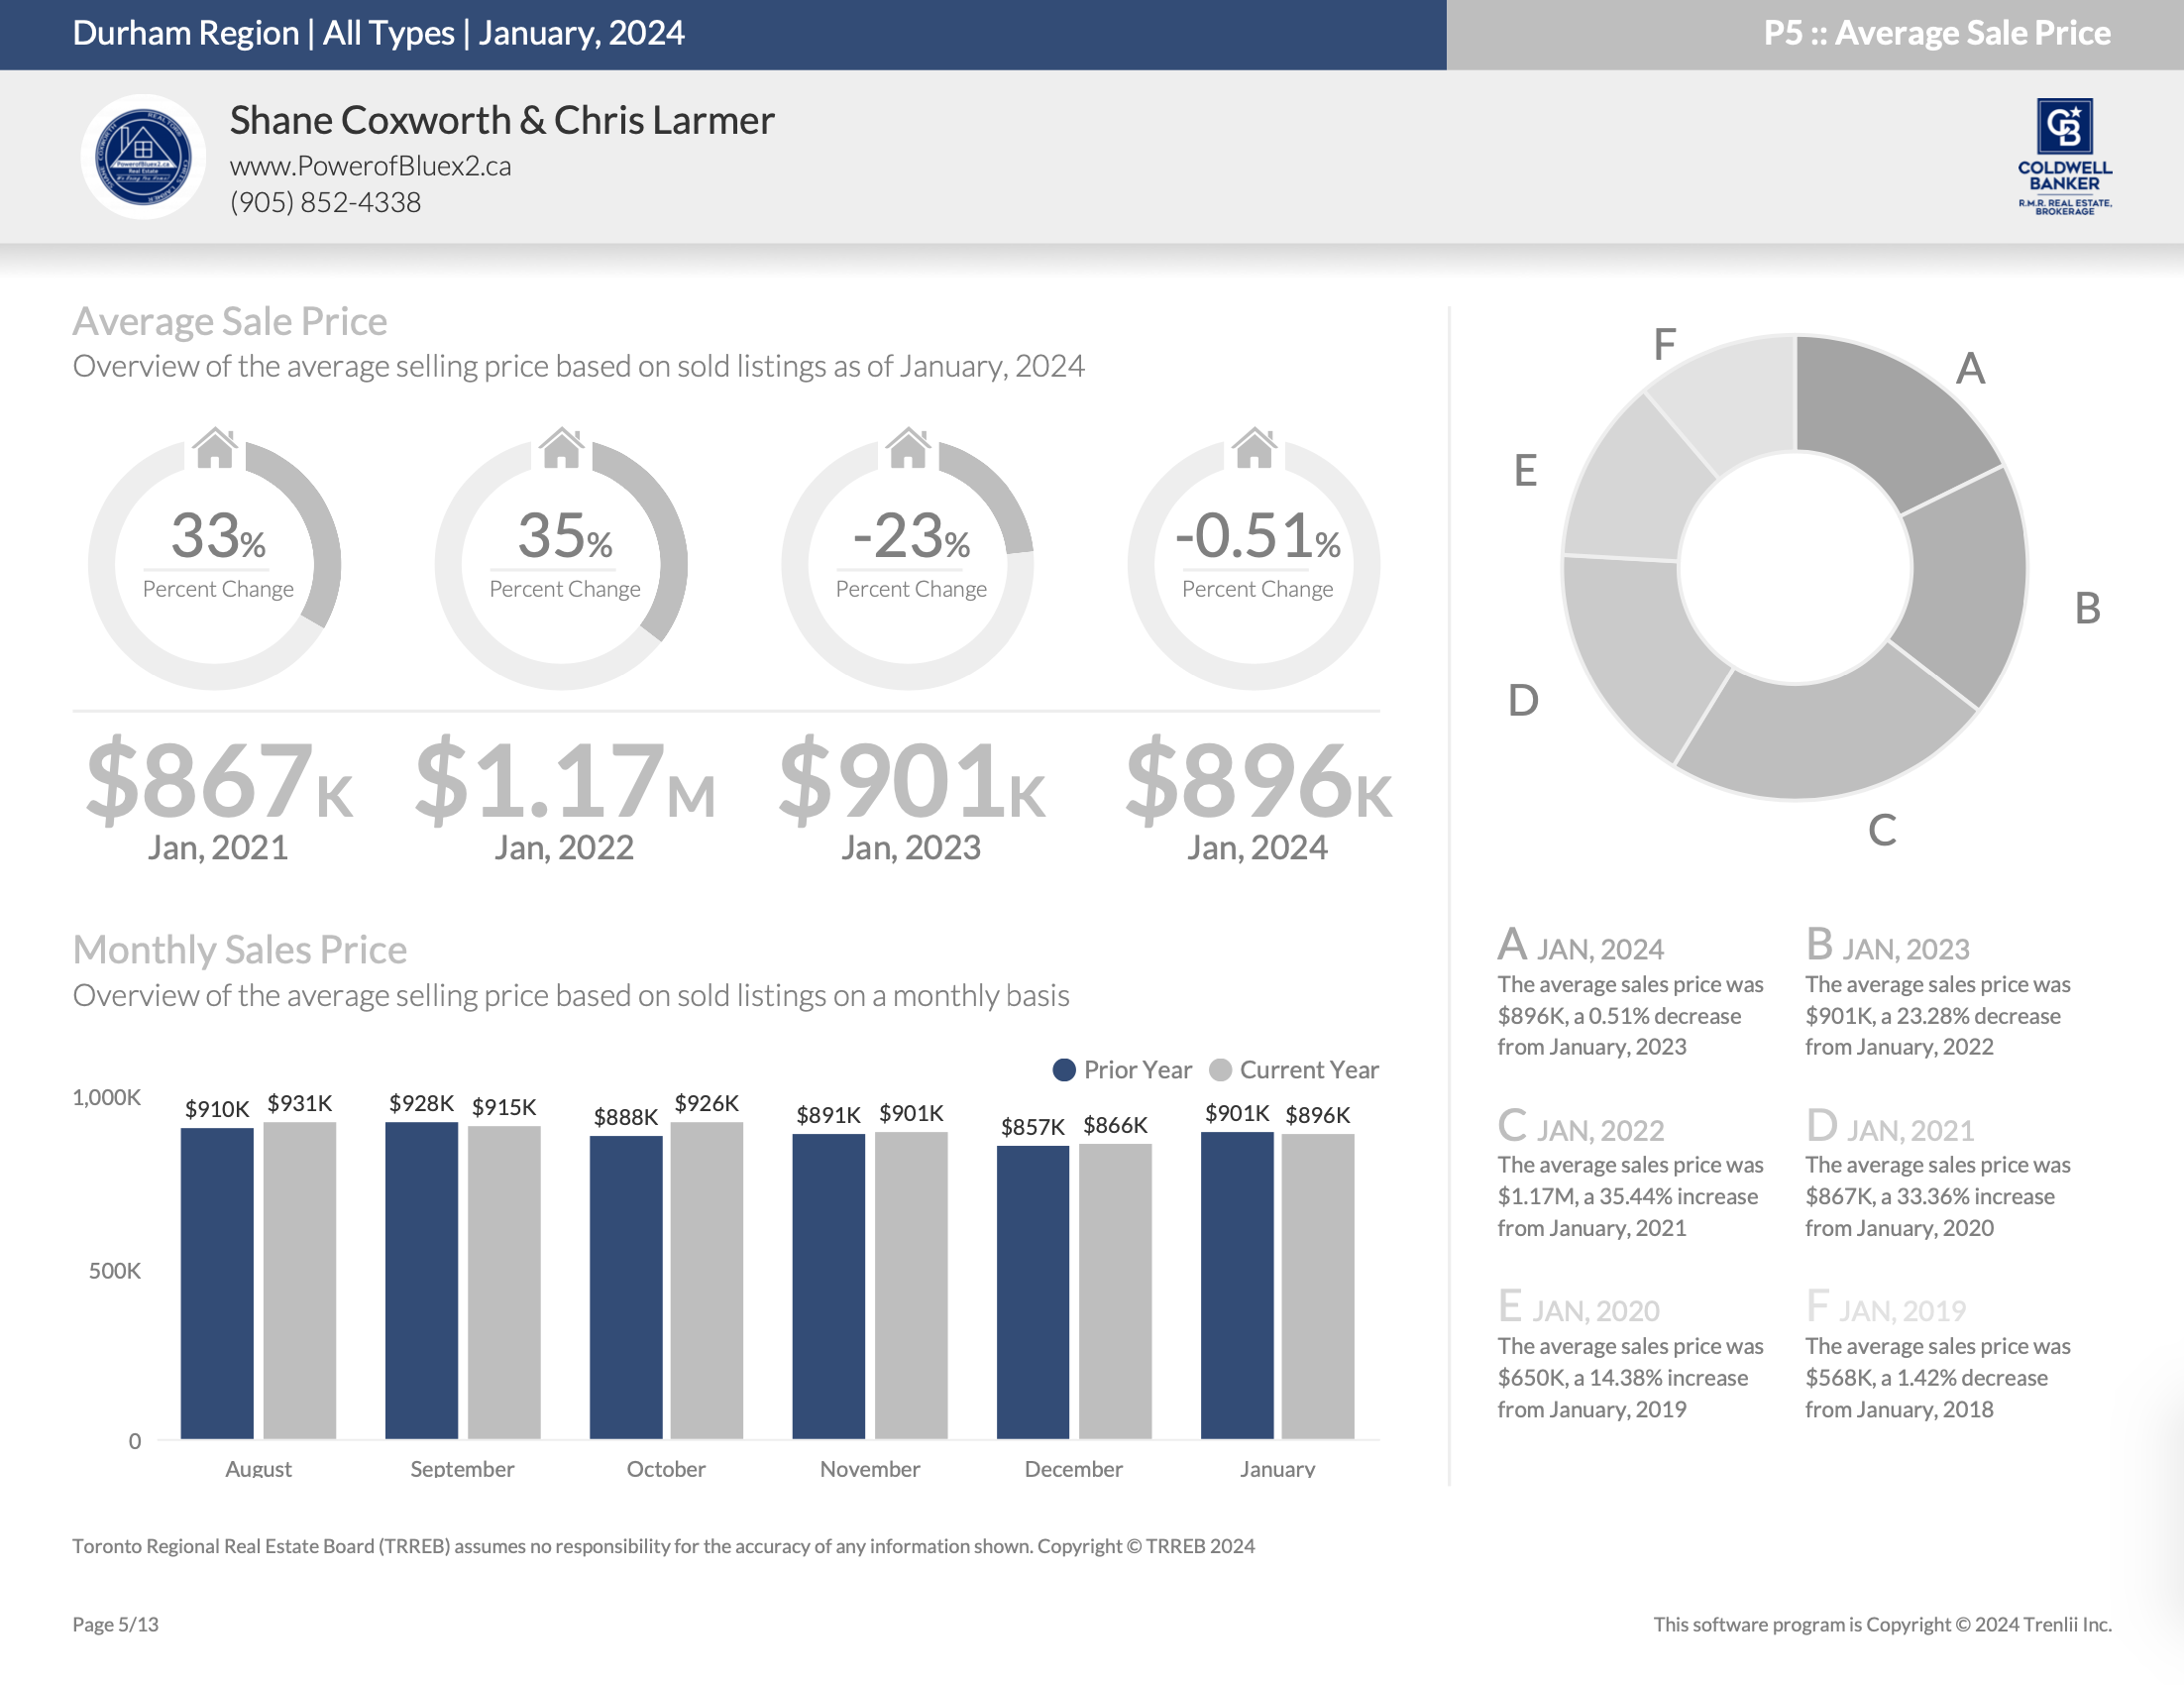
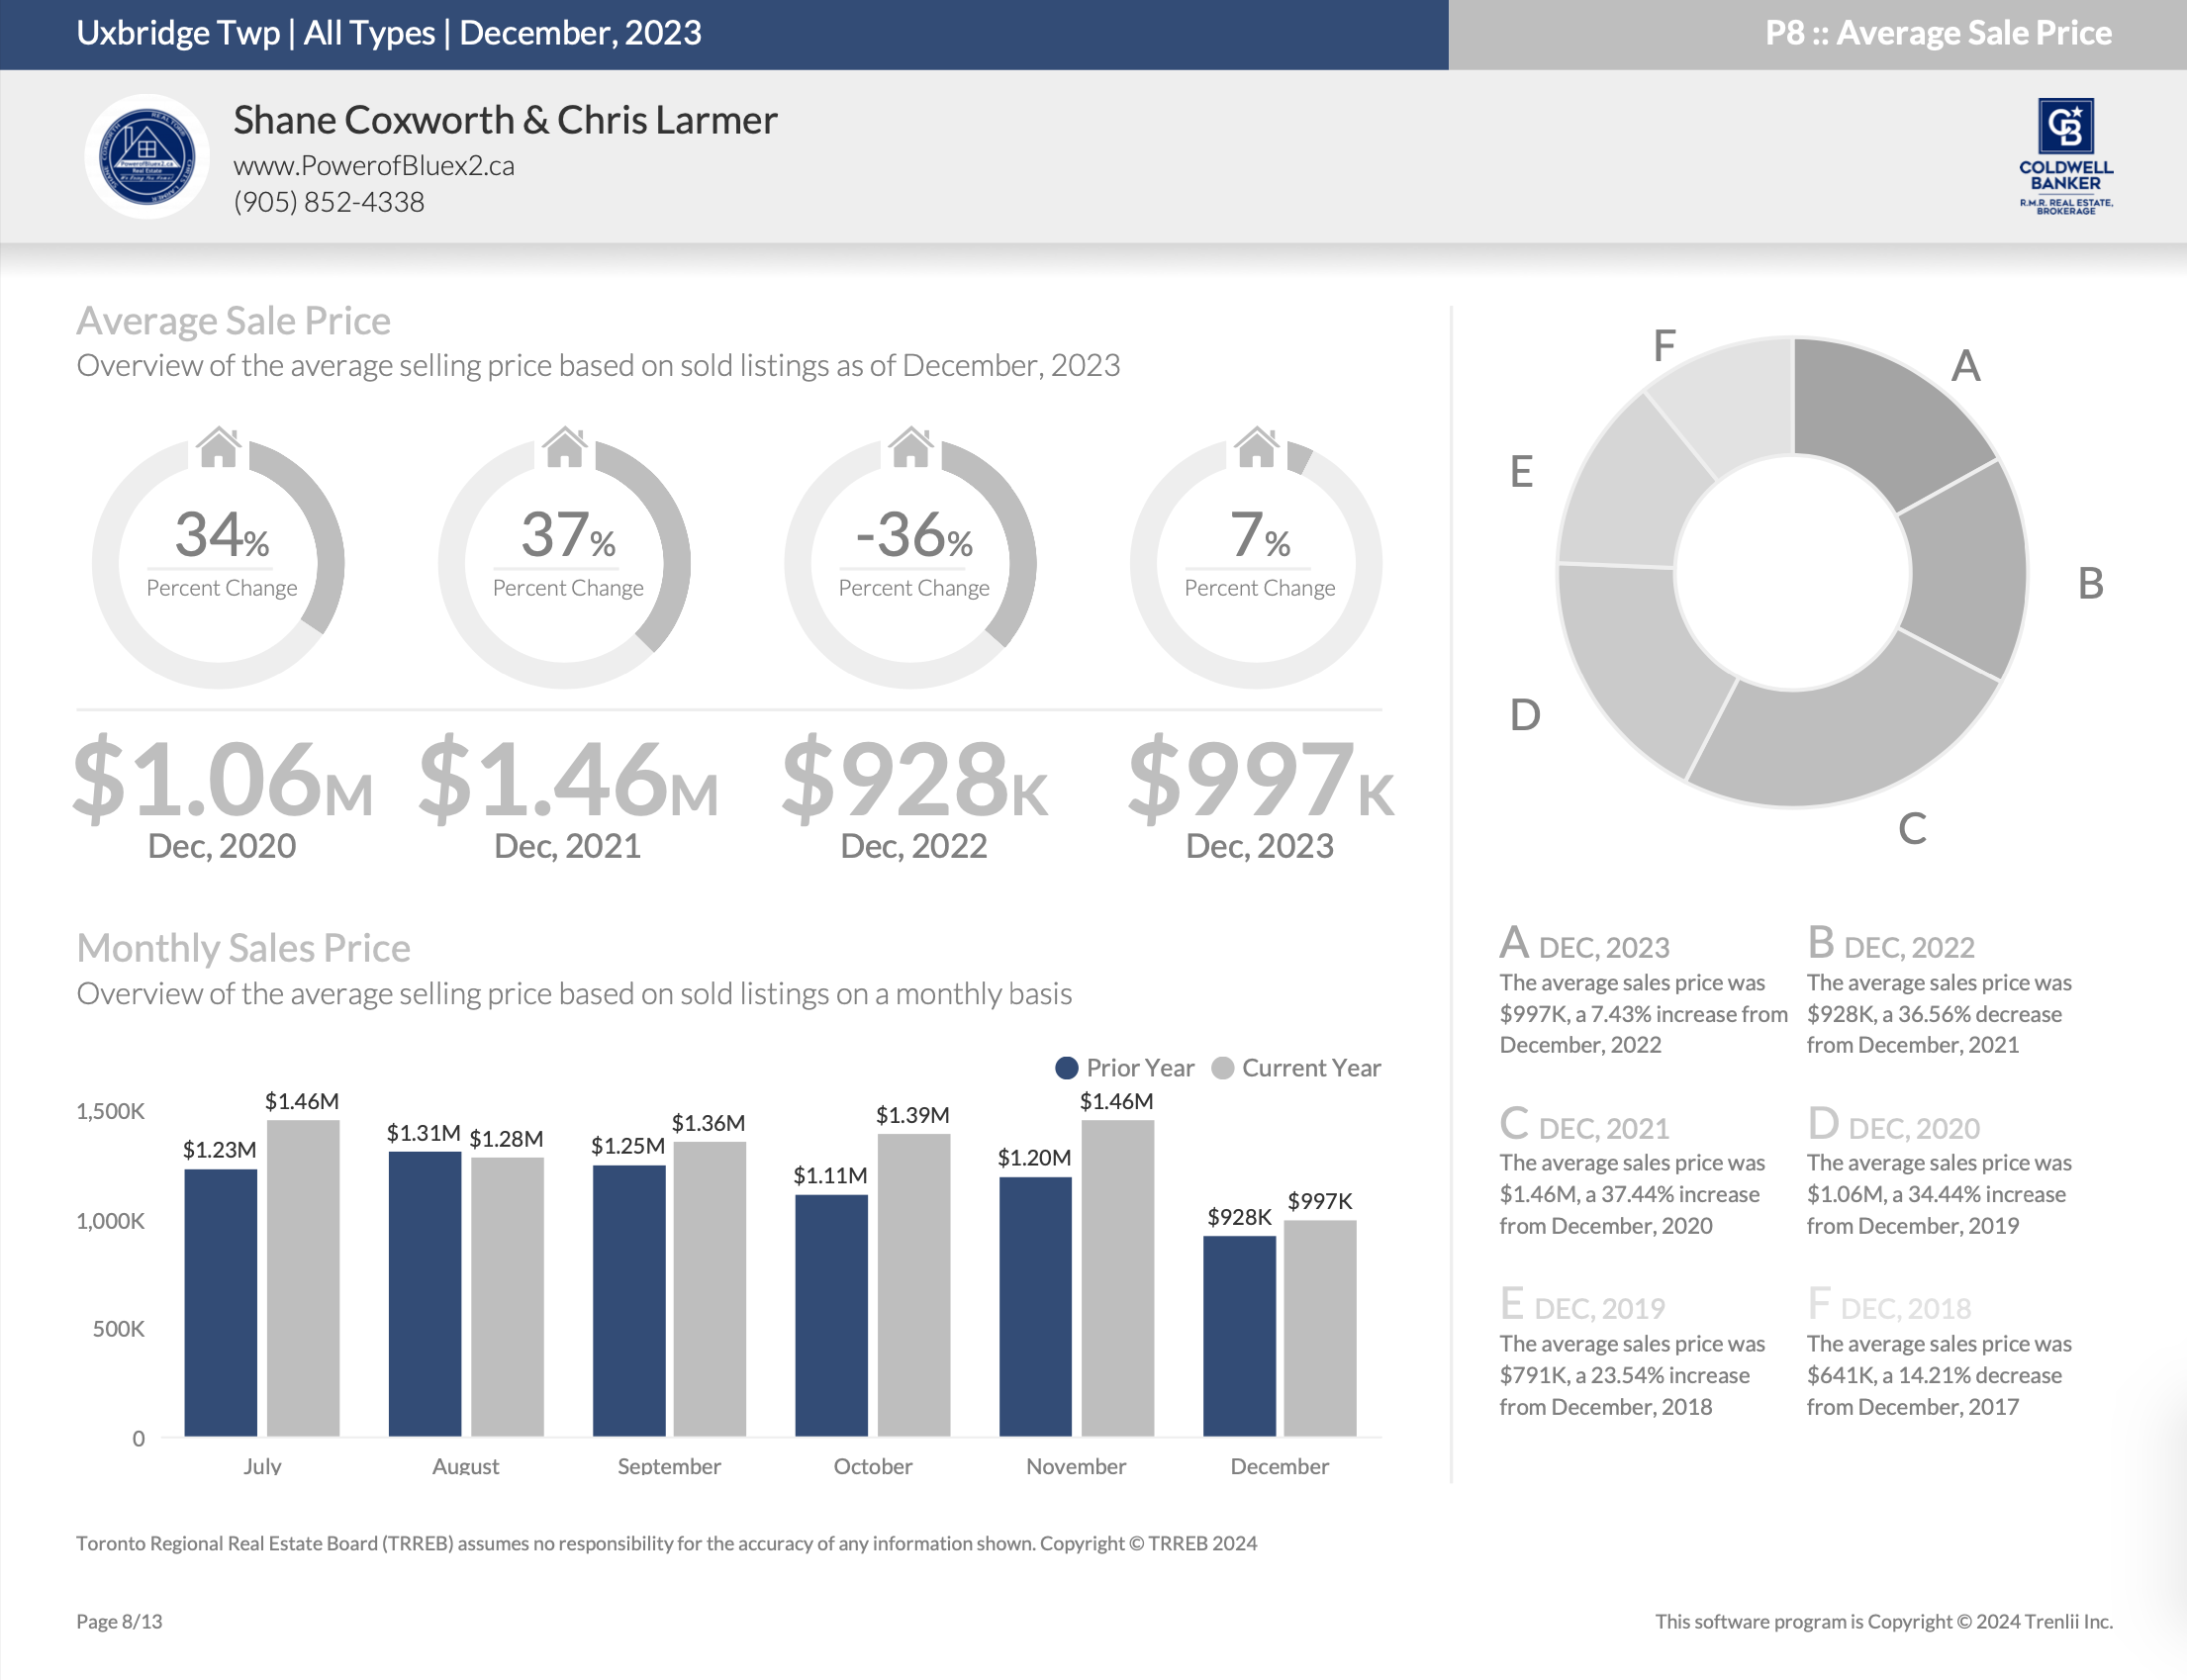
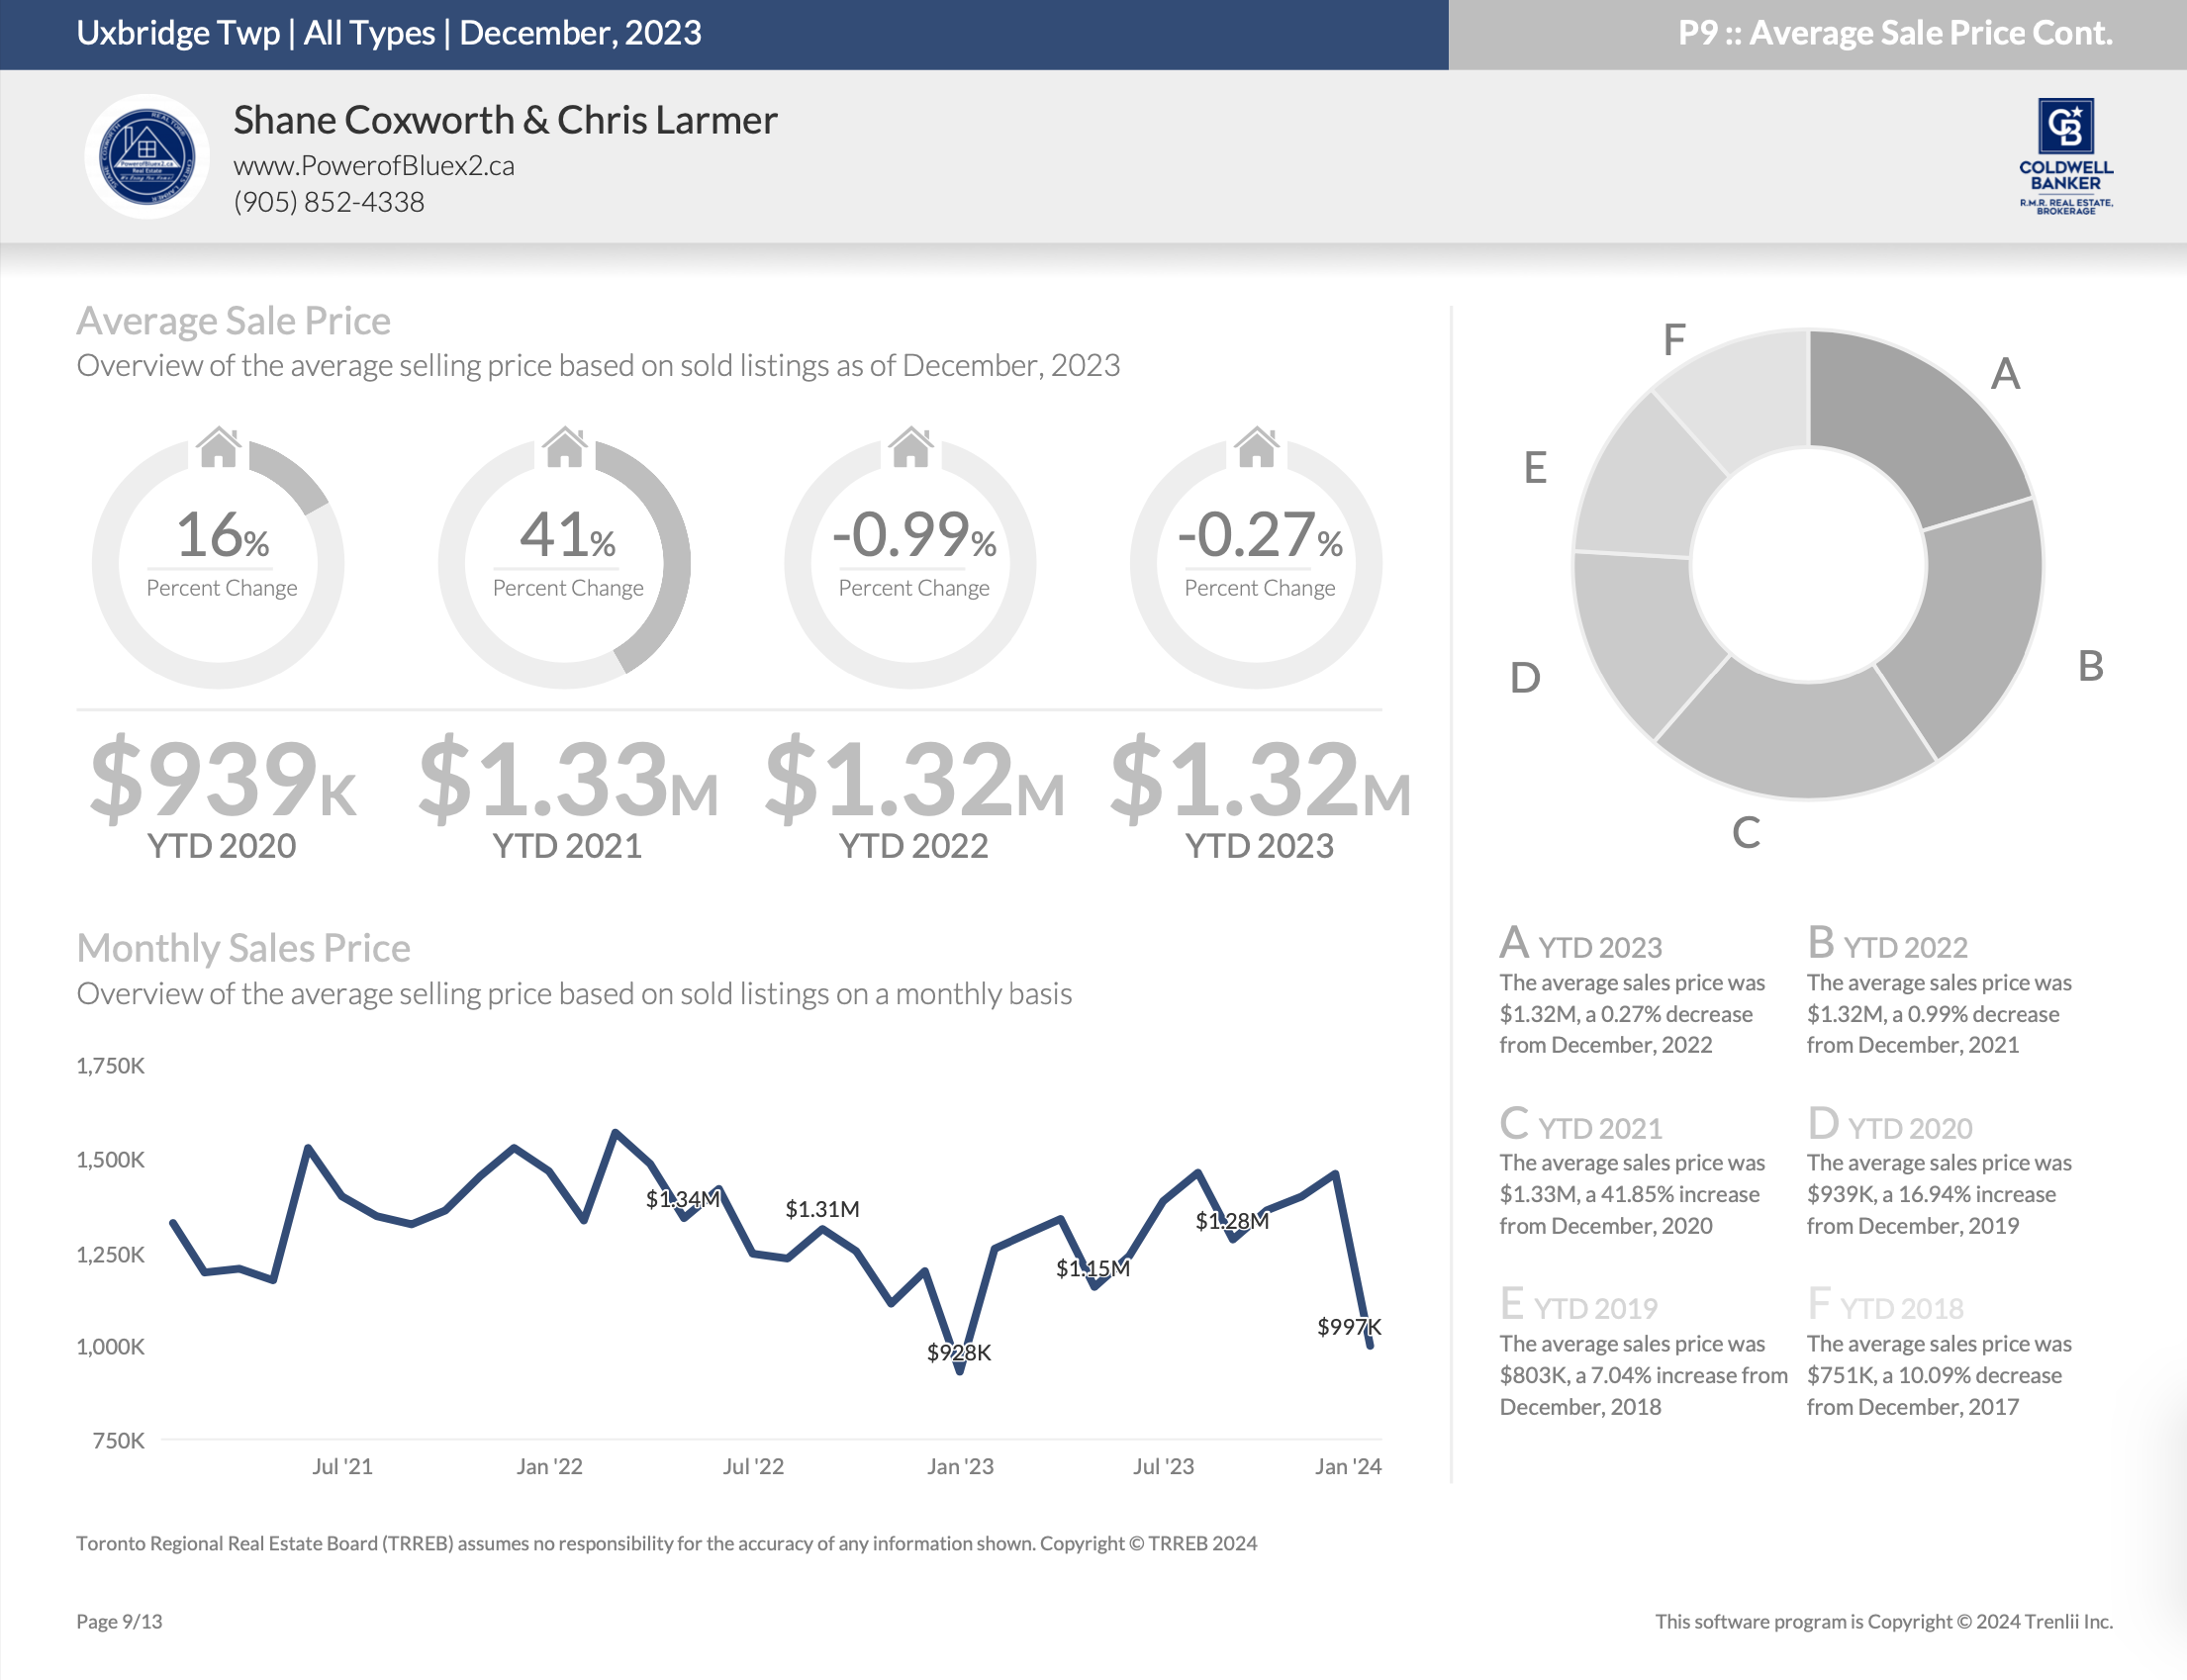
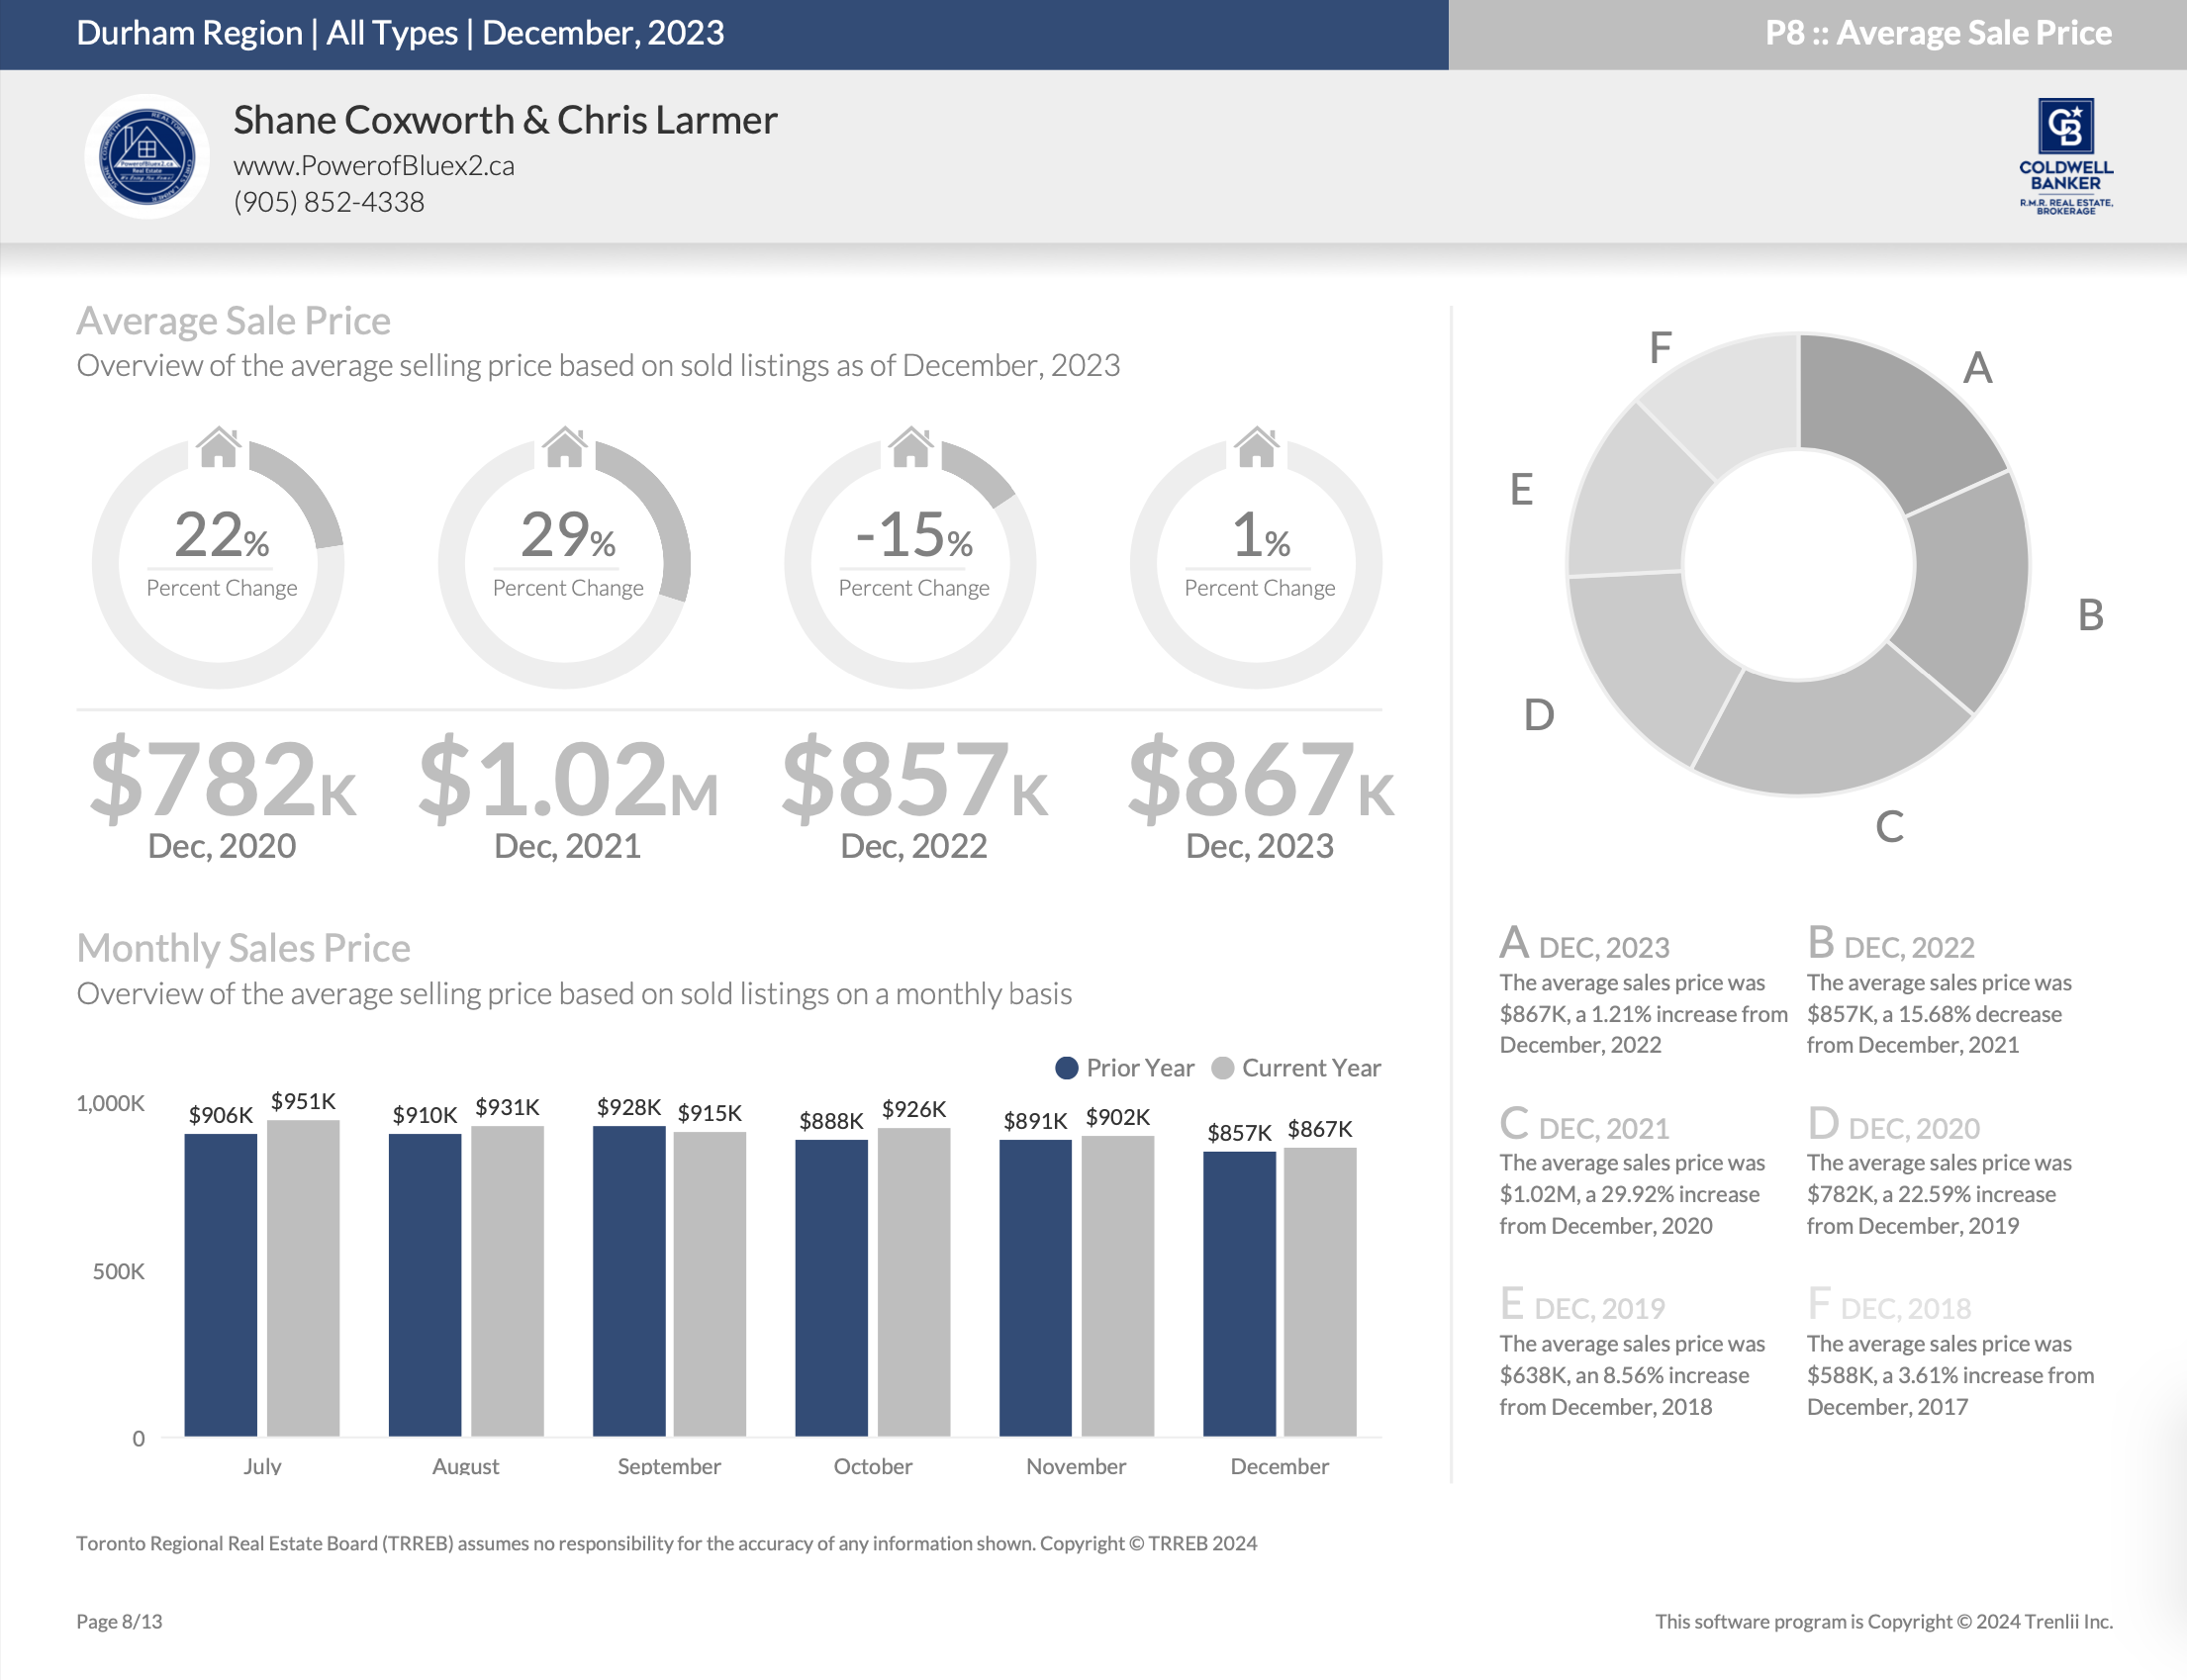
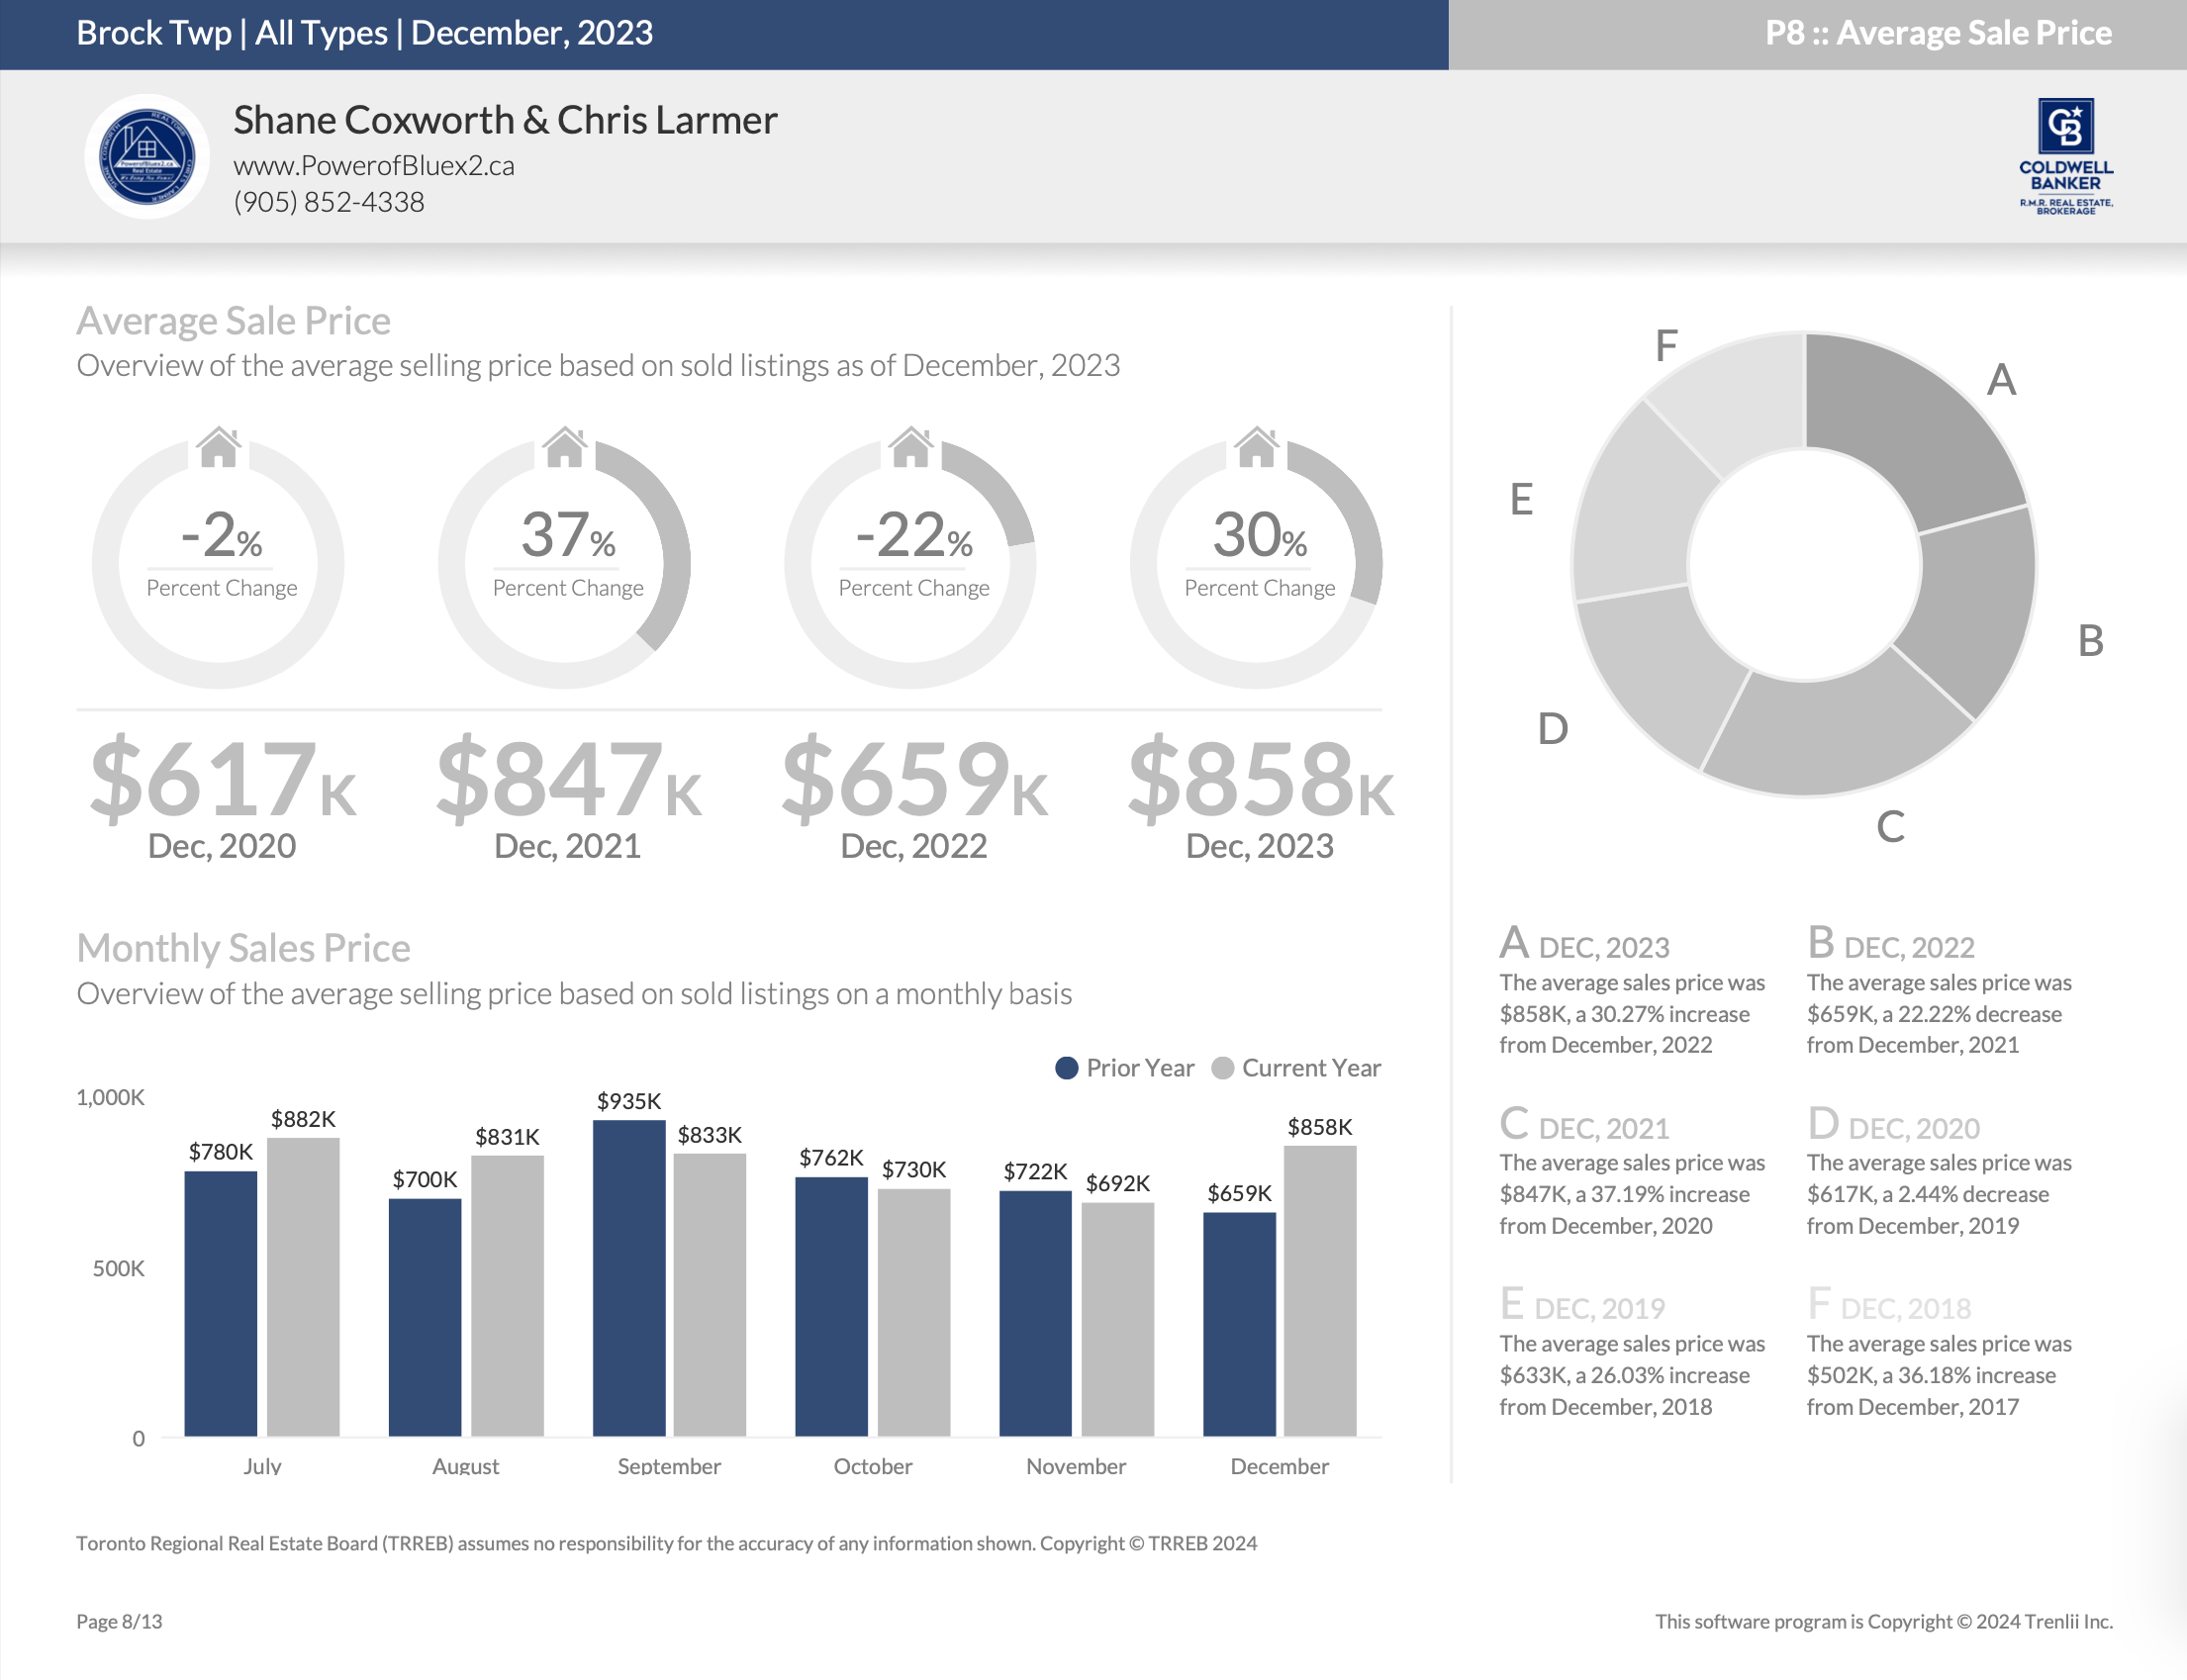
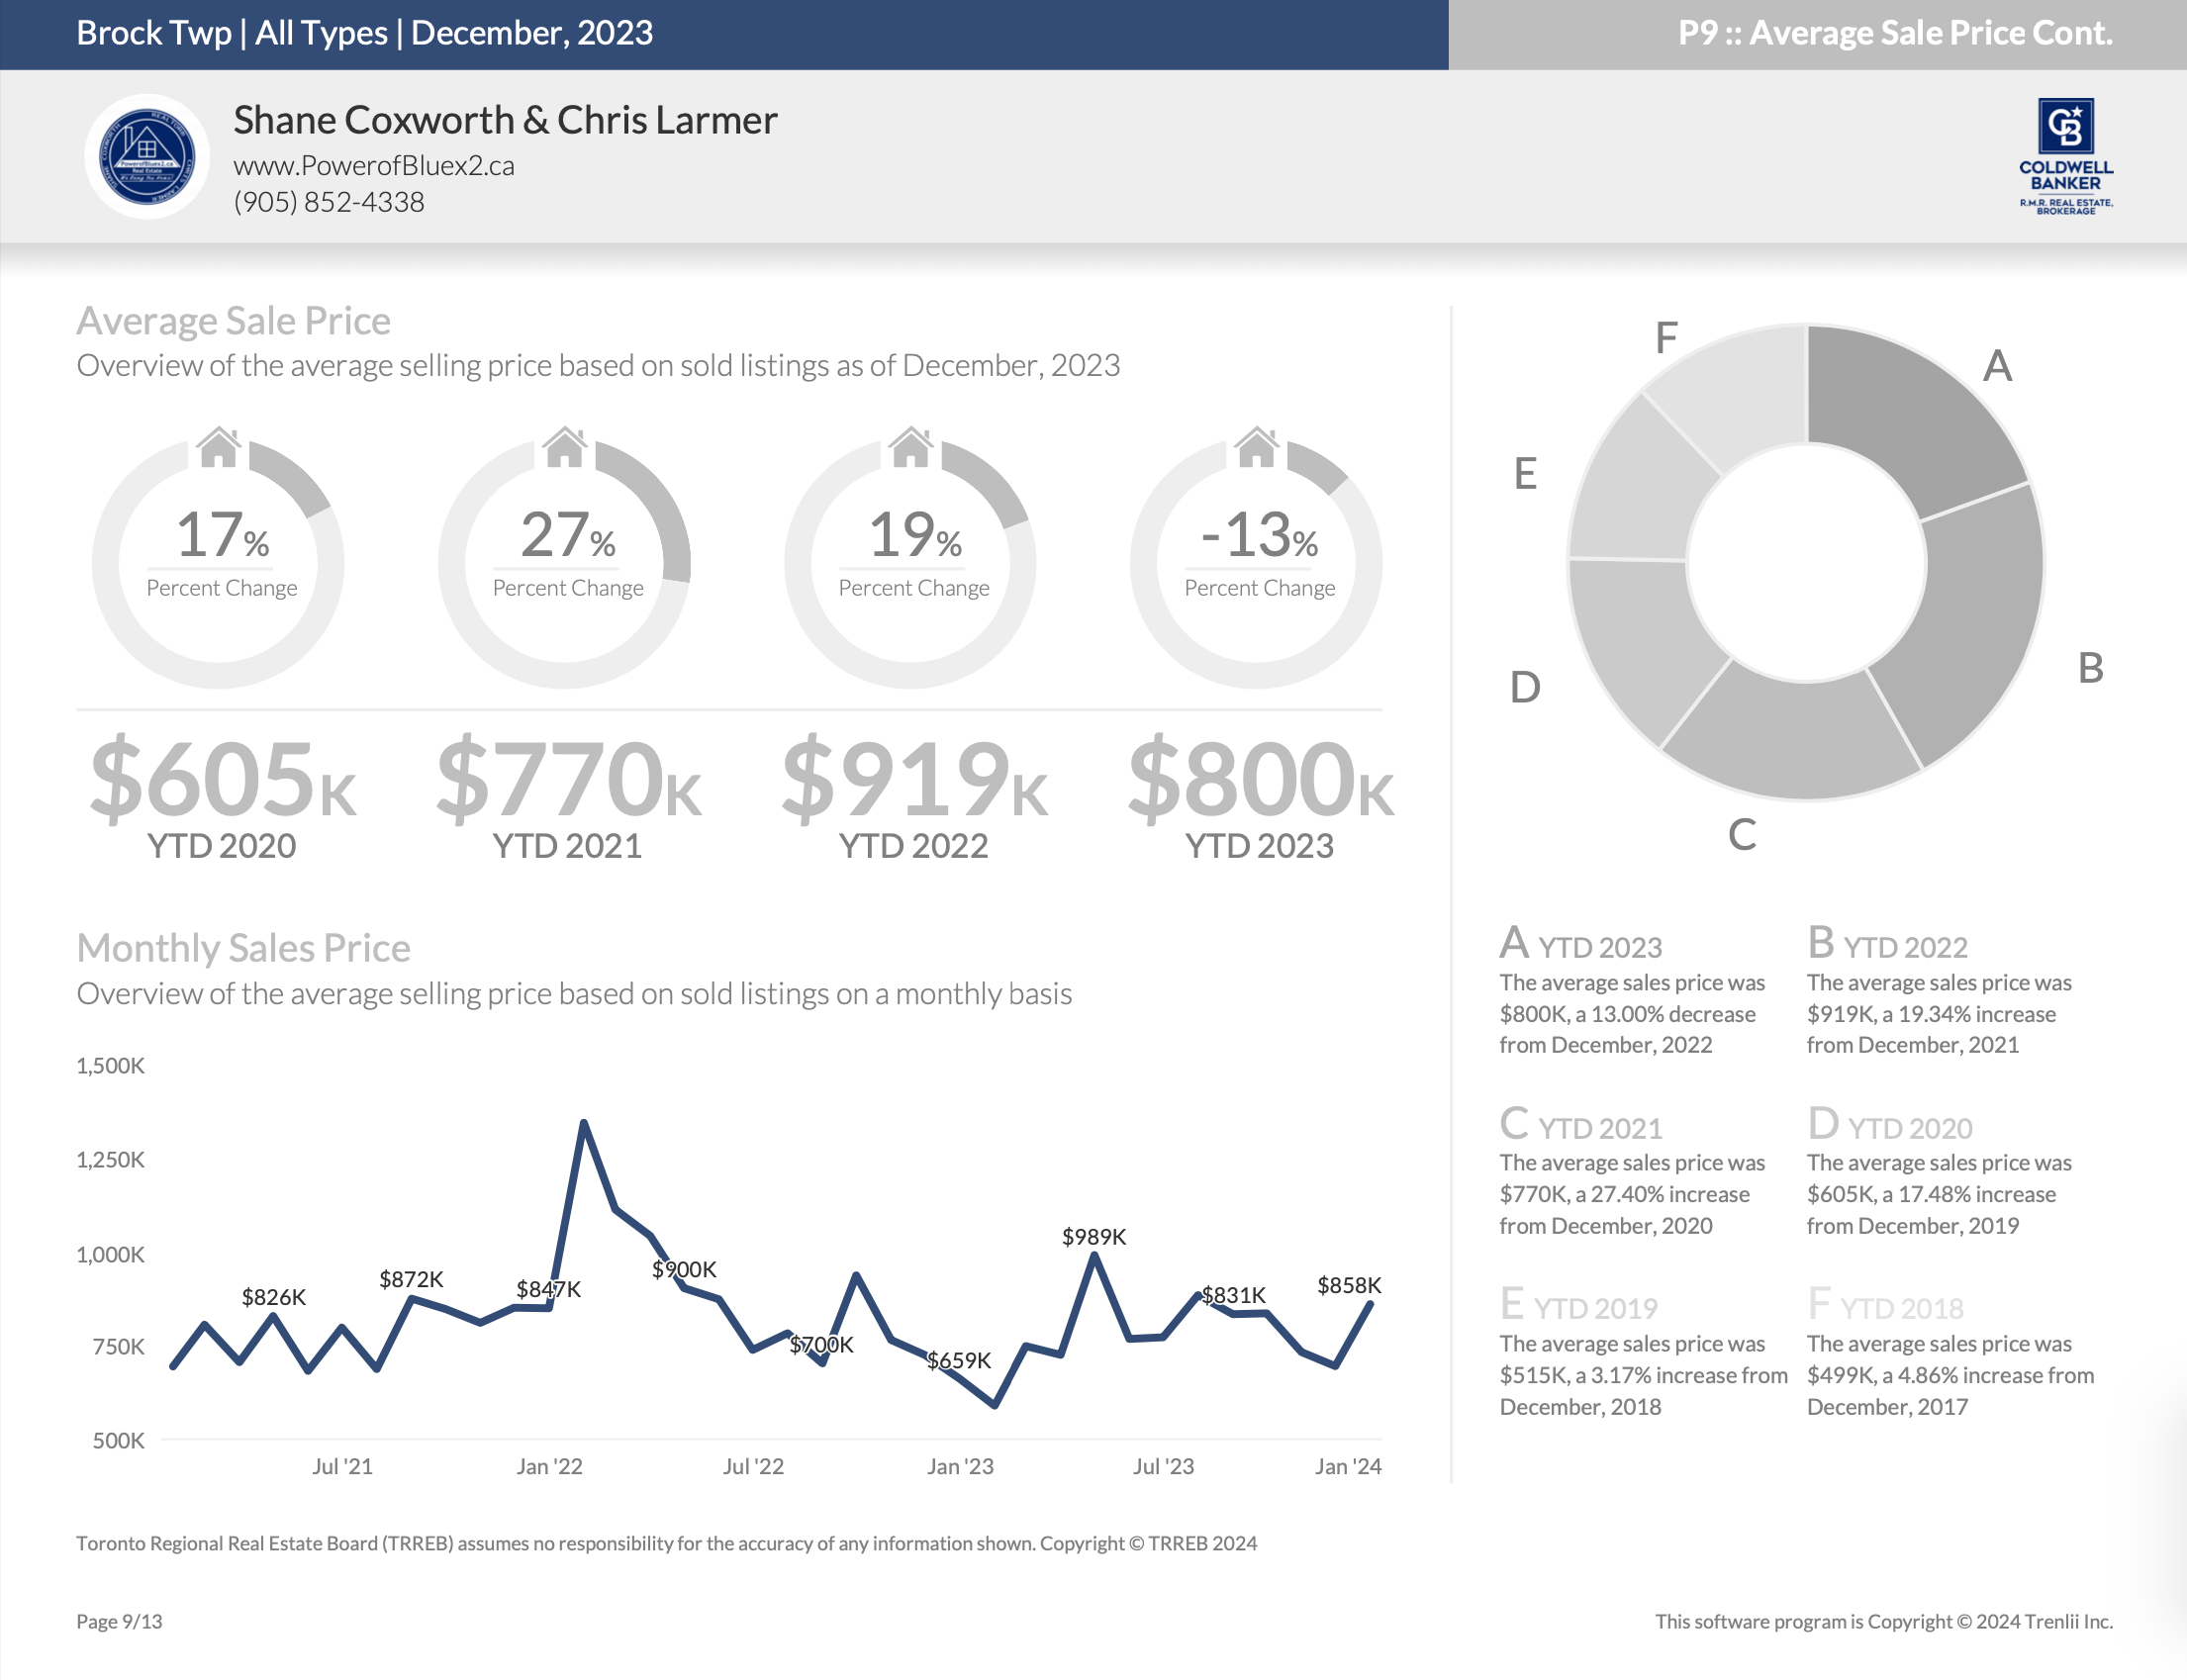
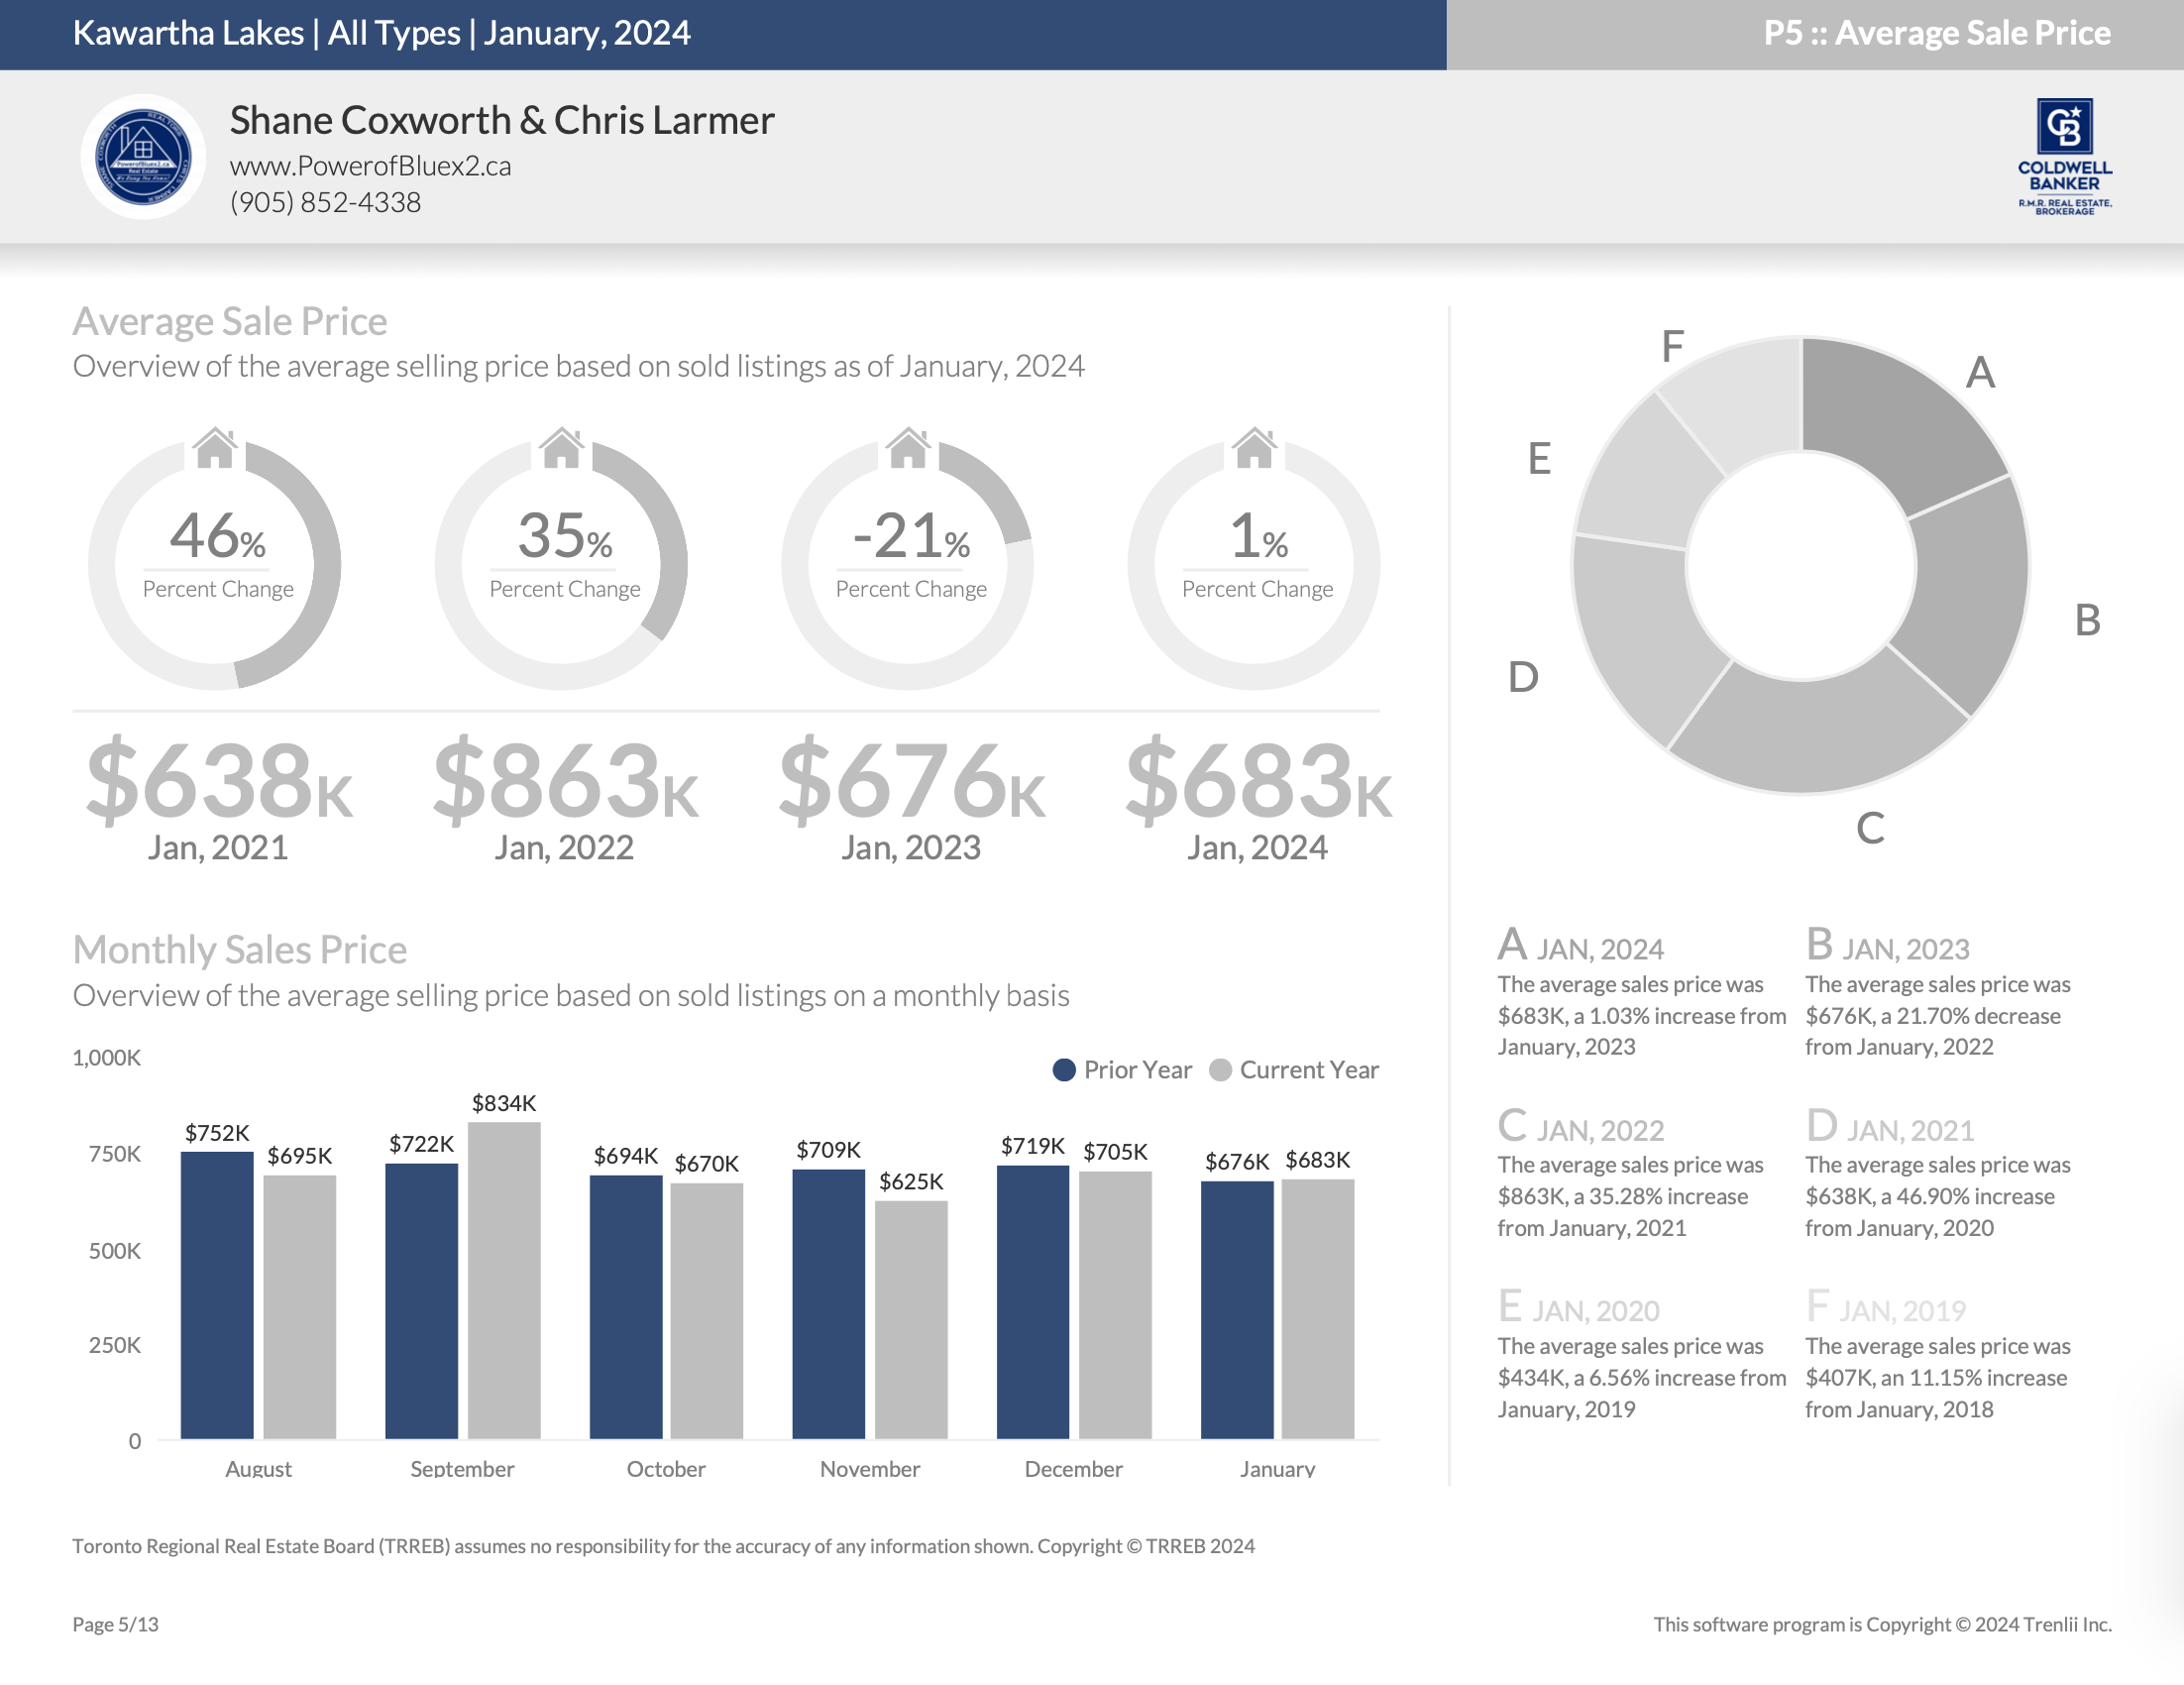
Average Sold Price – January 2024
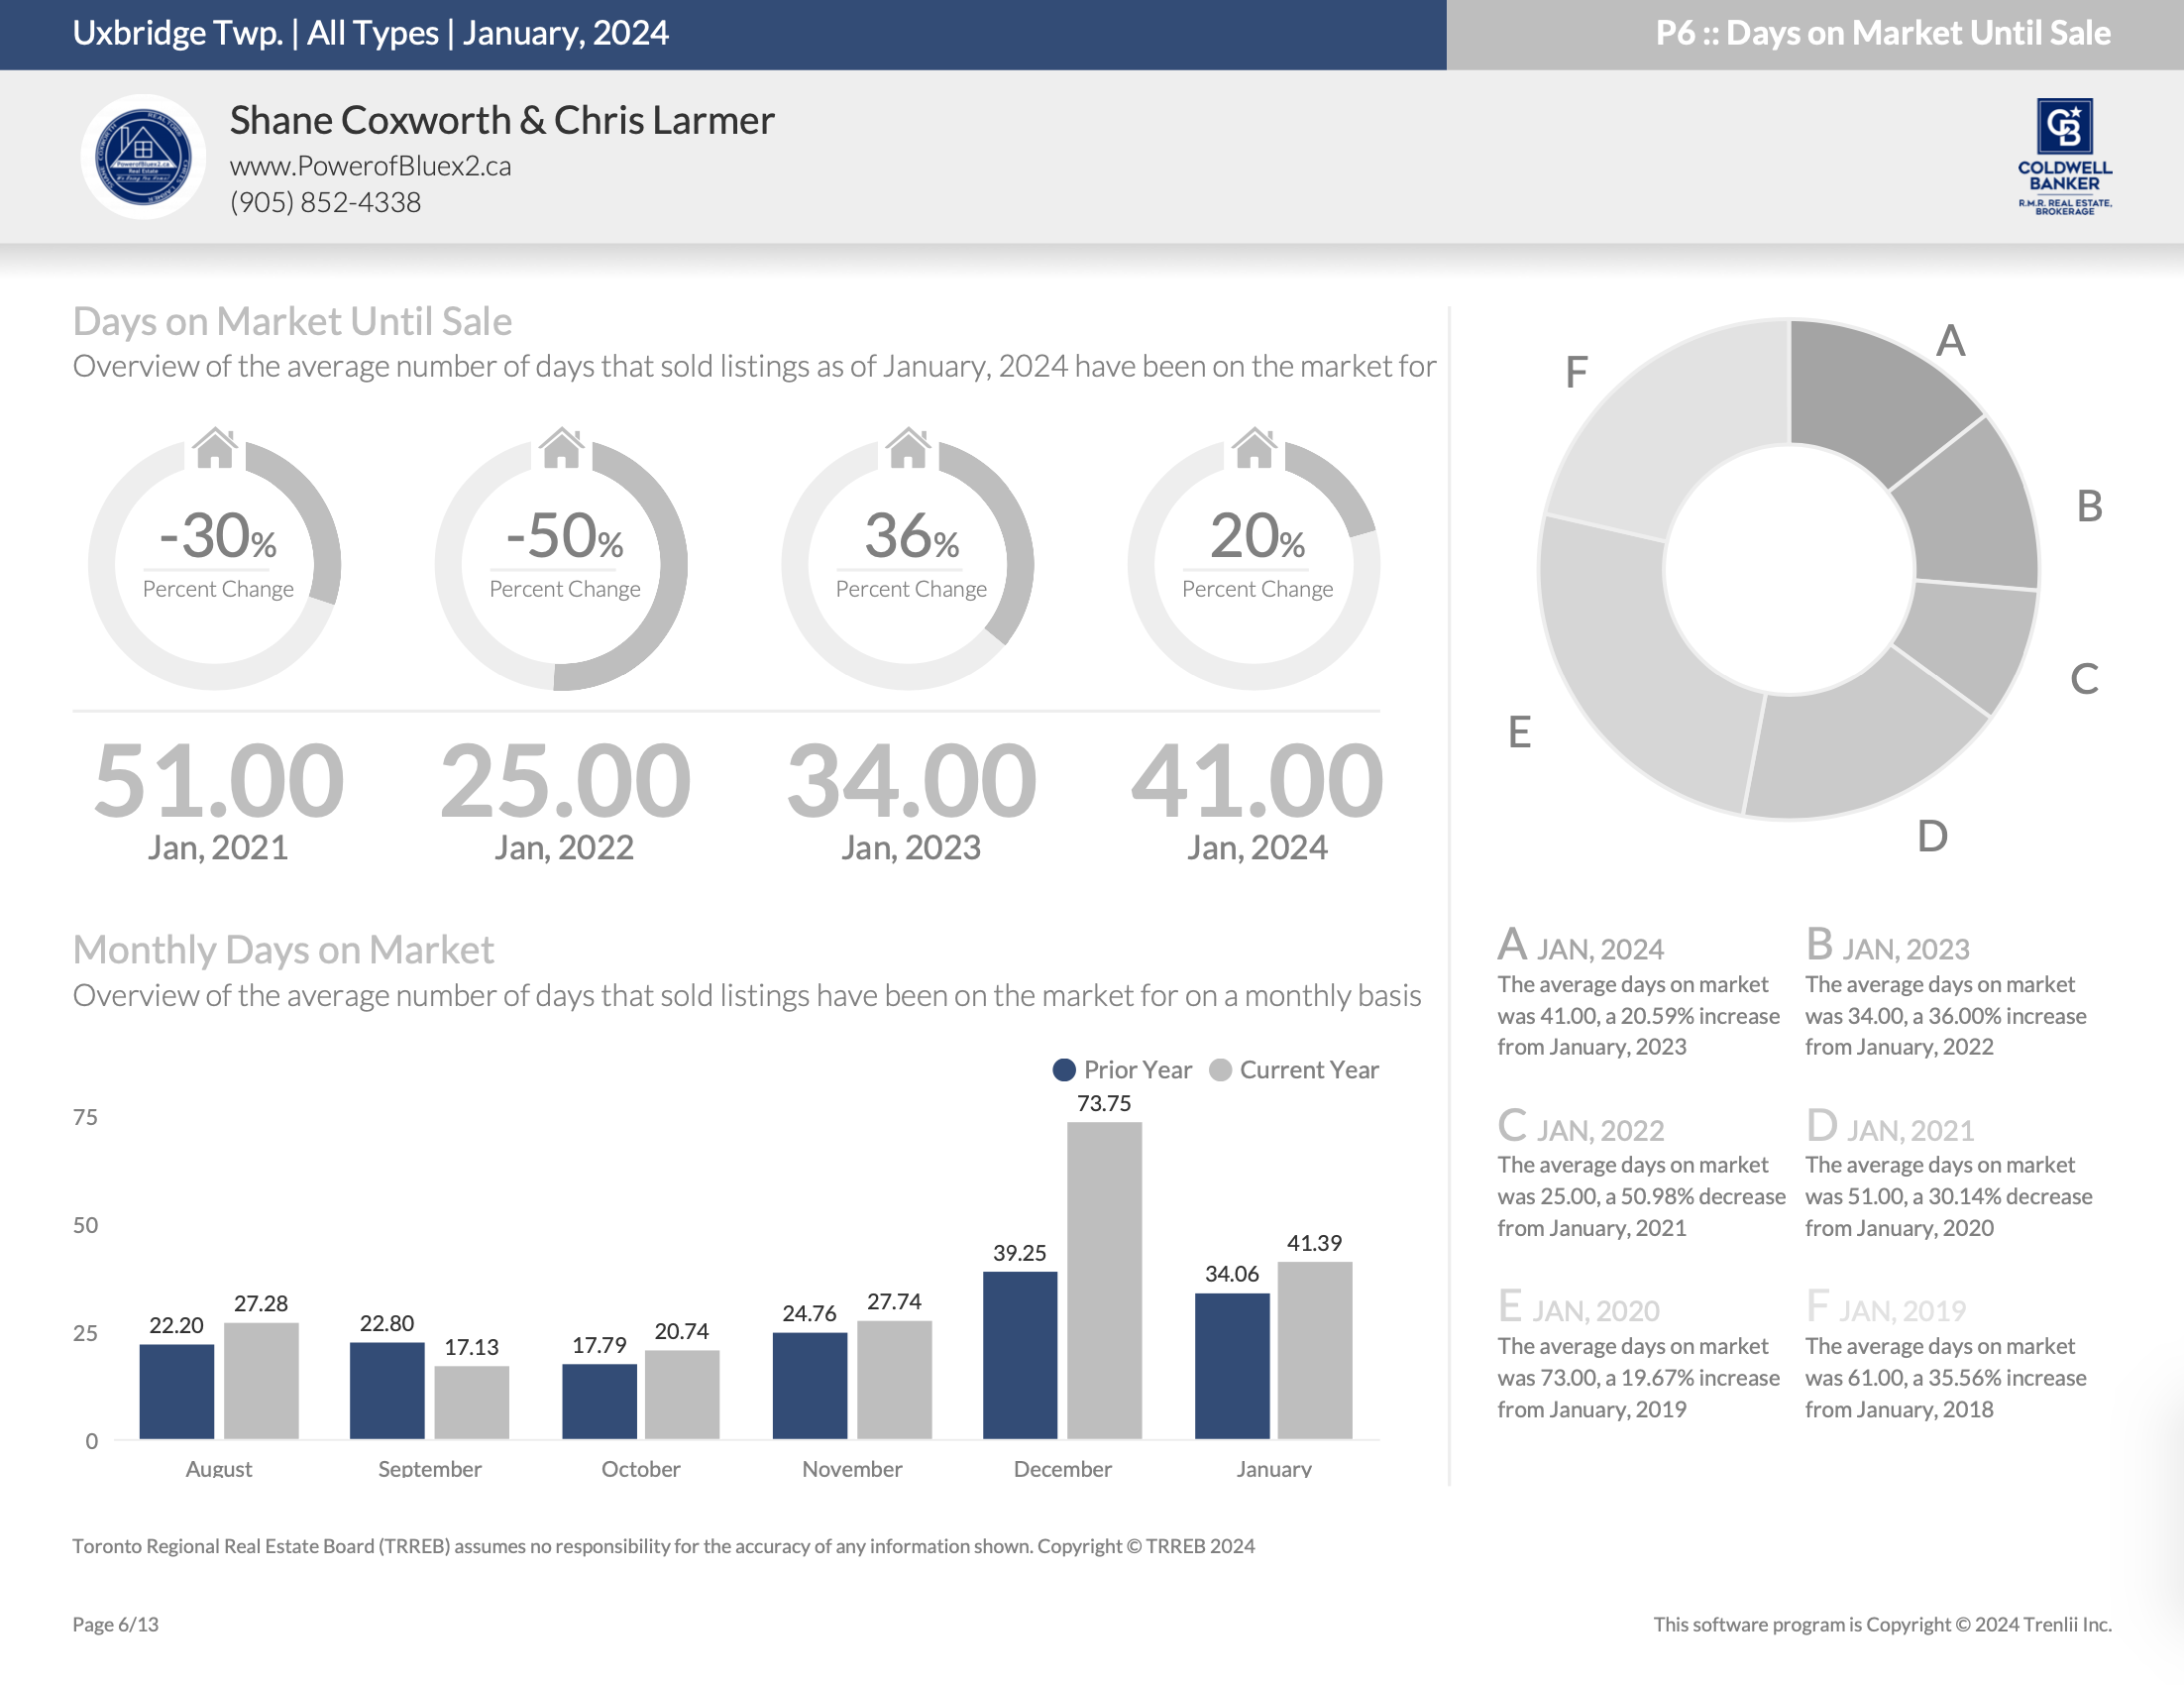
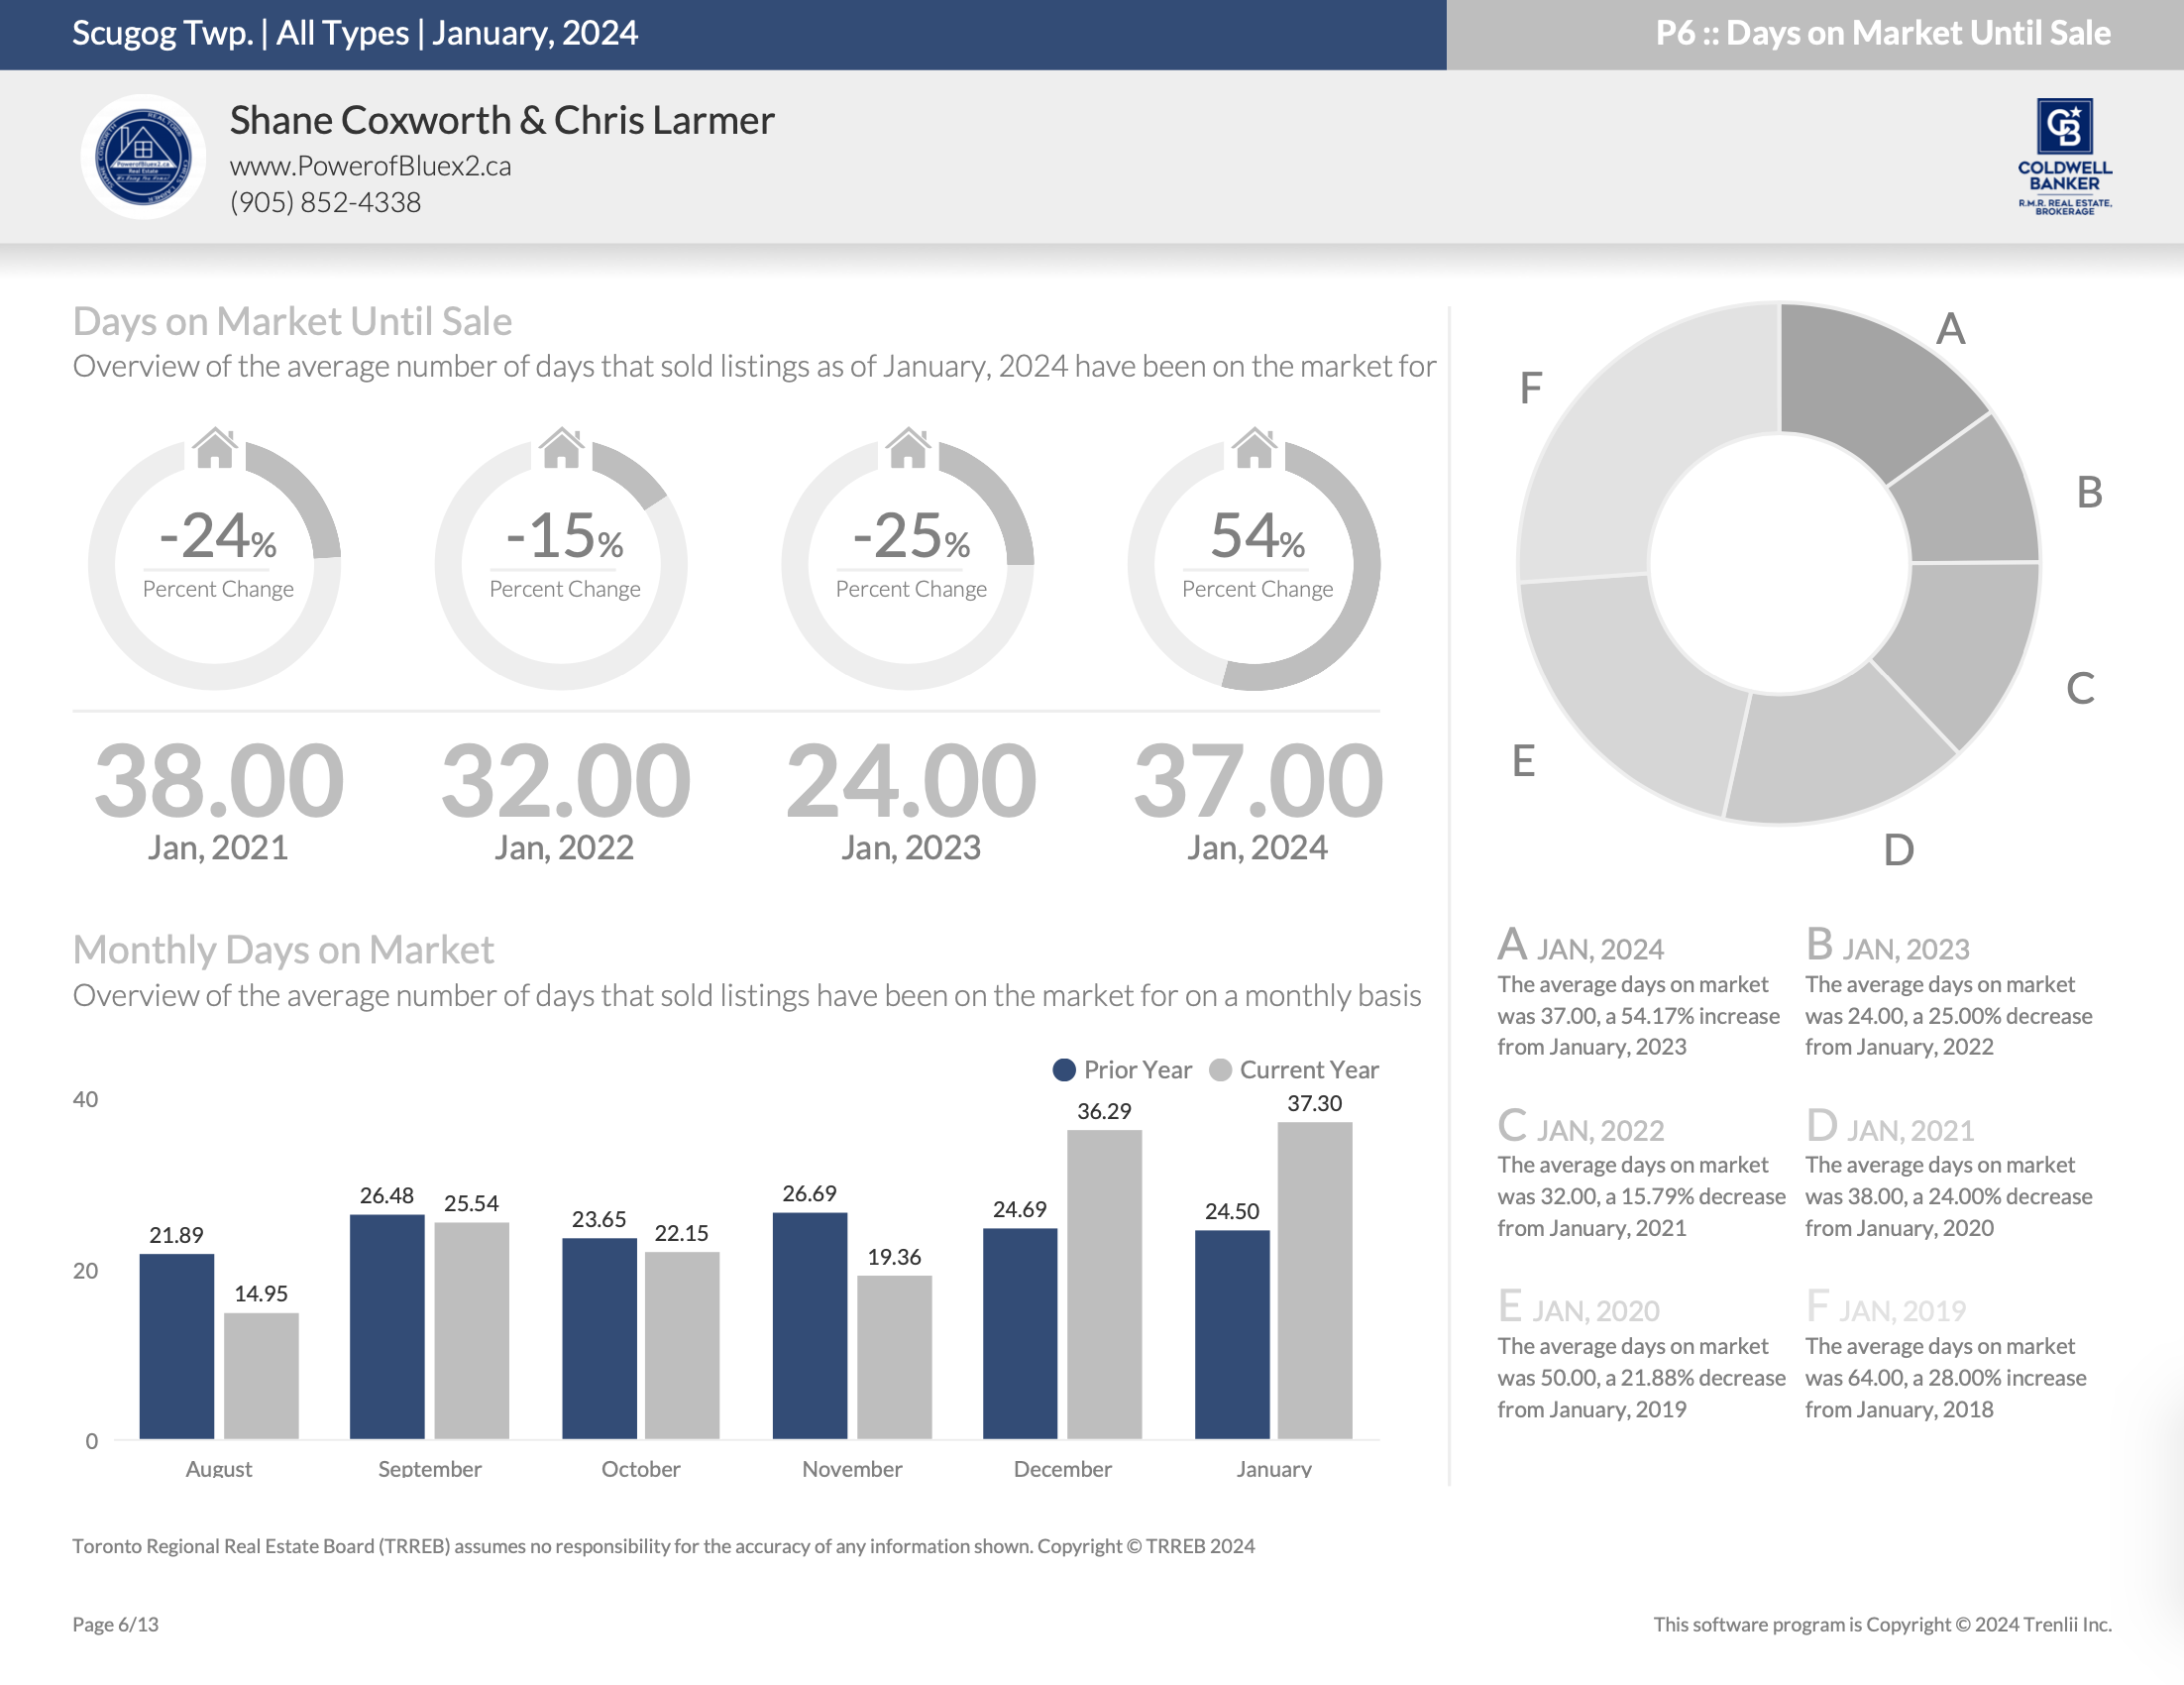
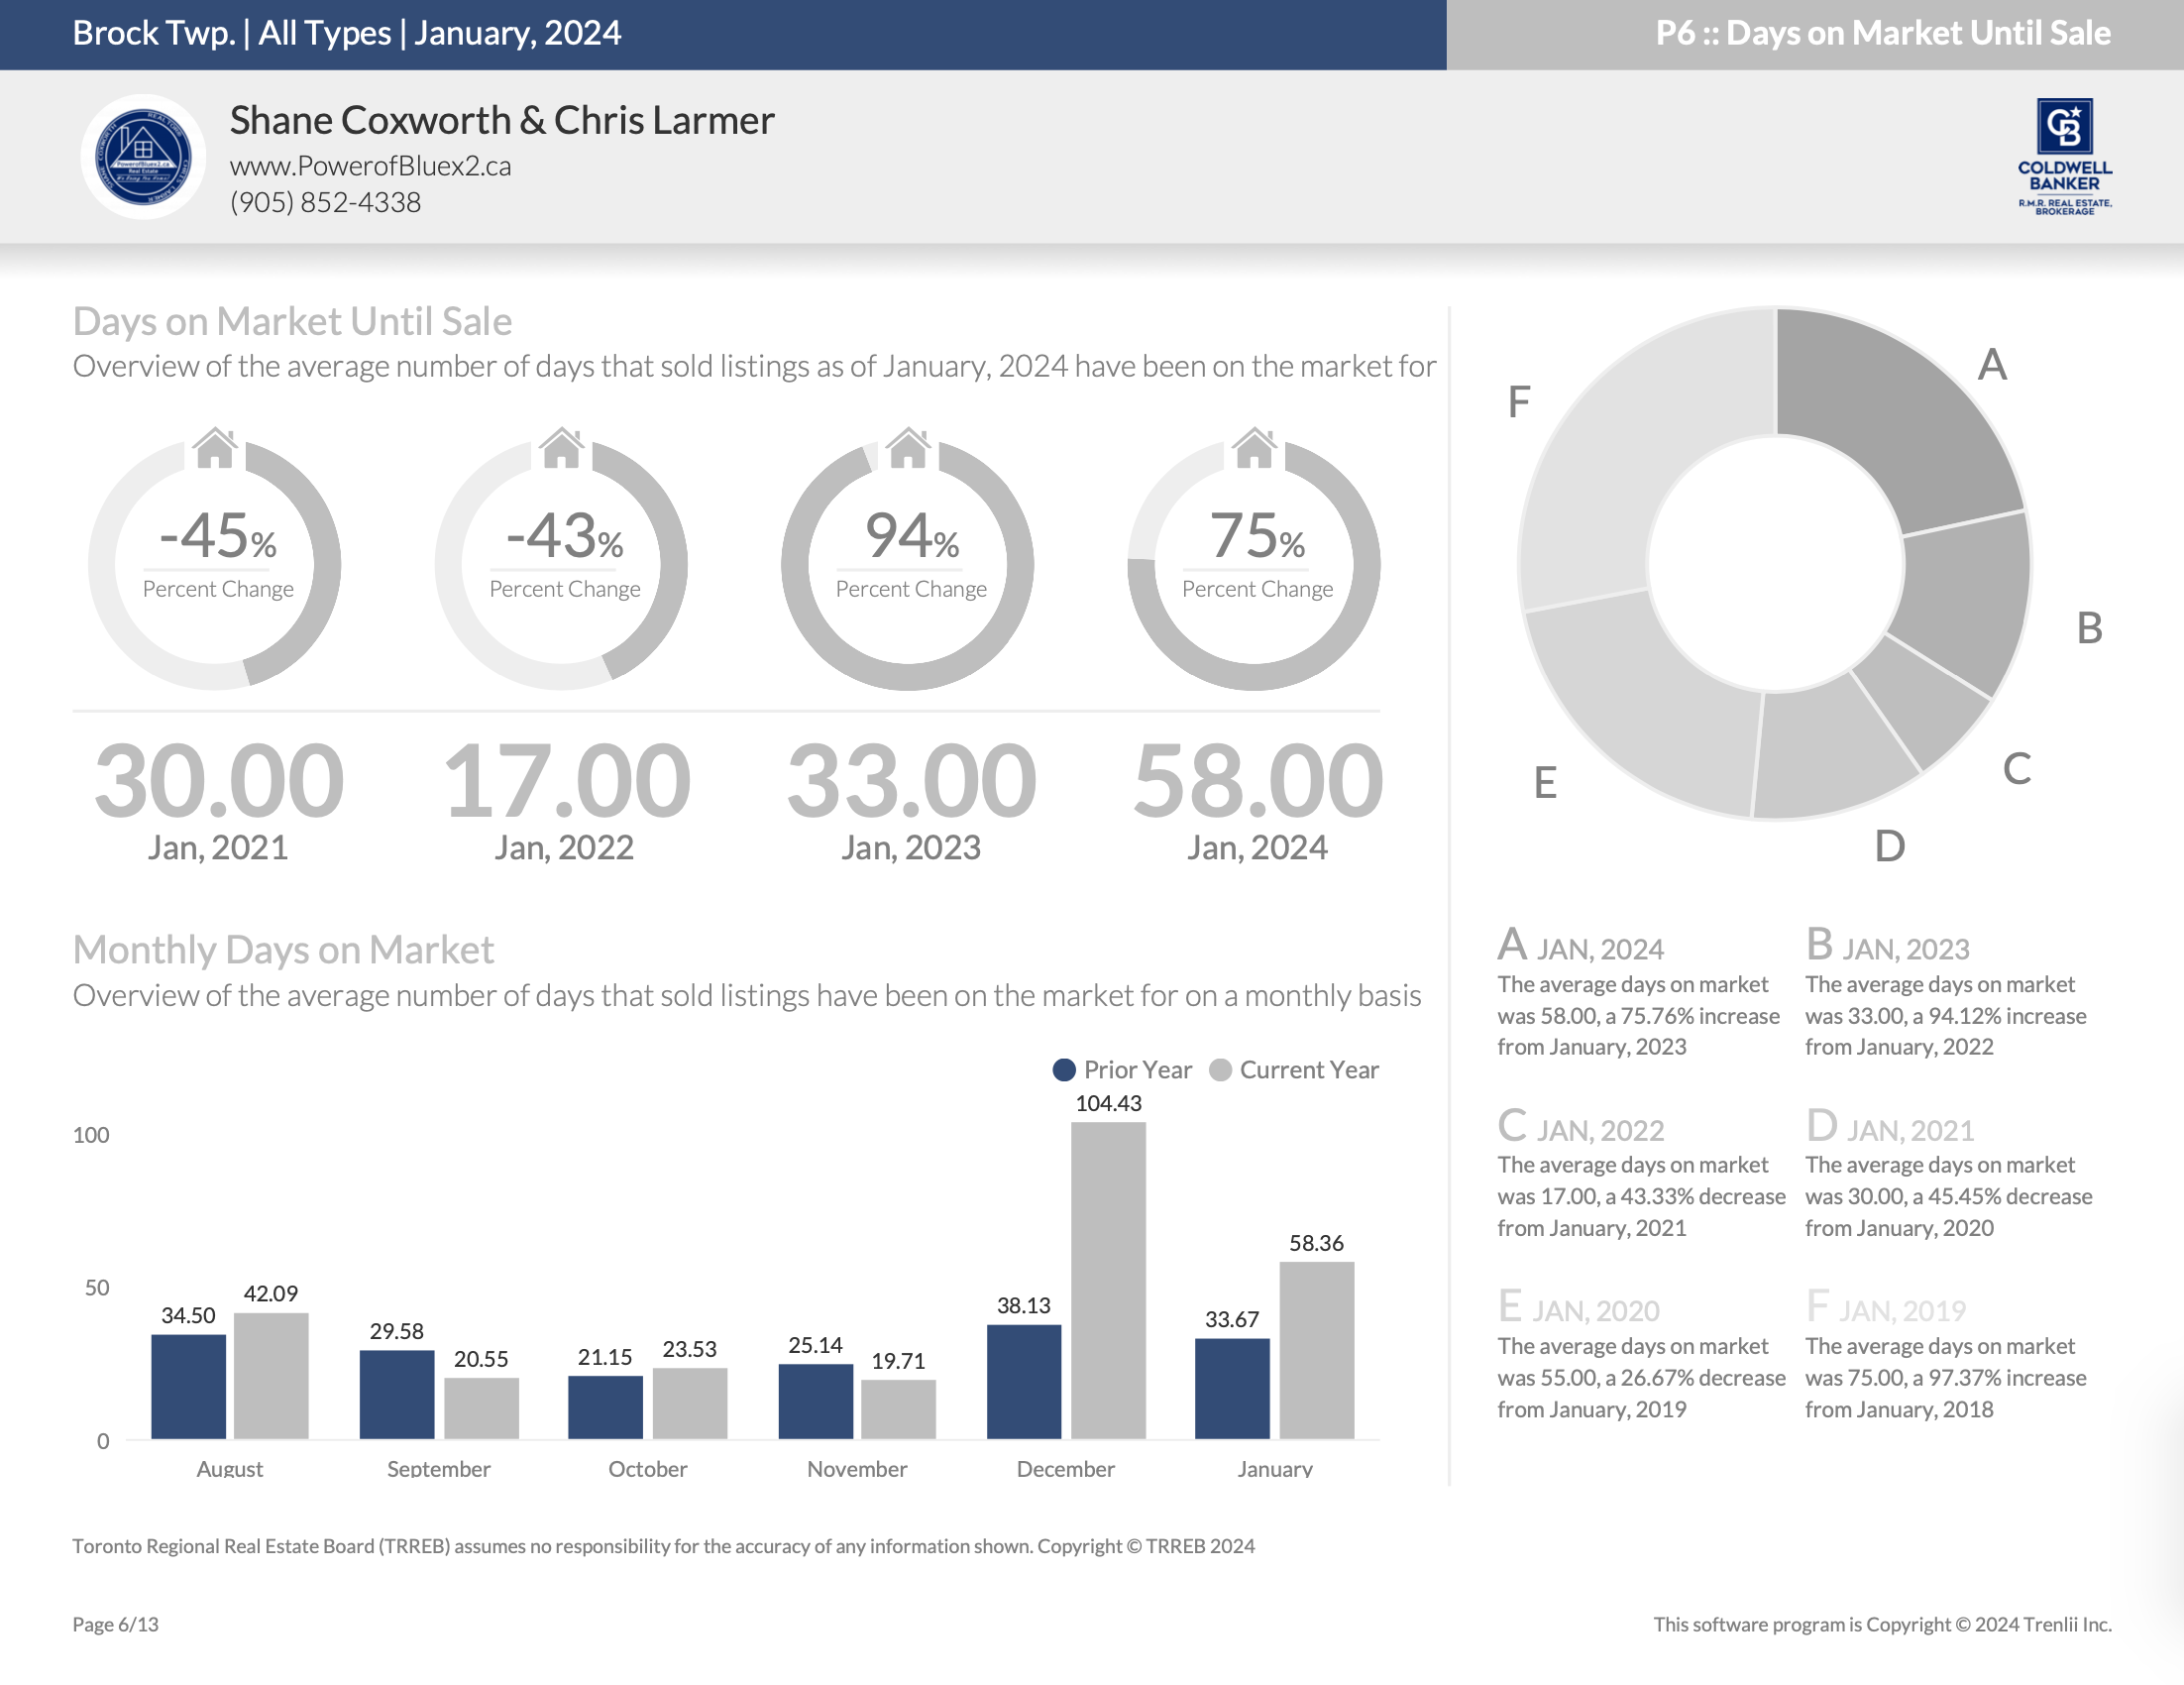
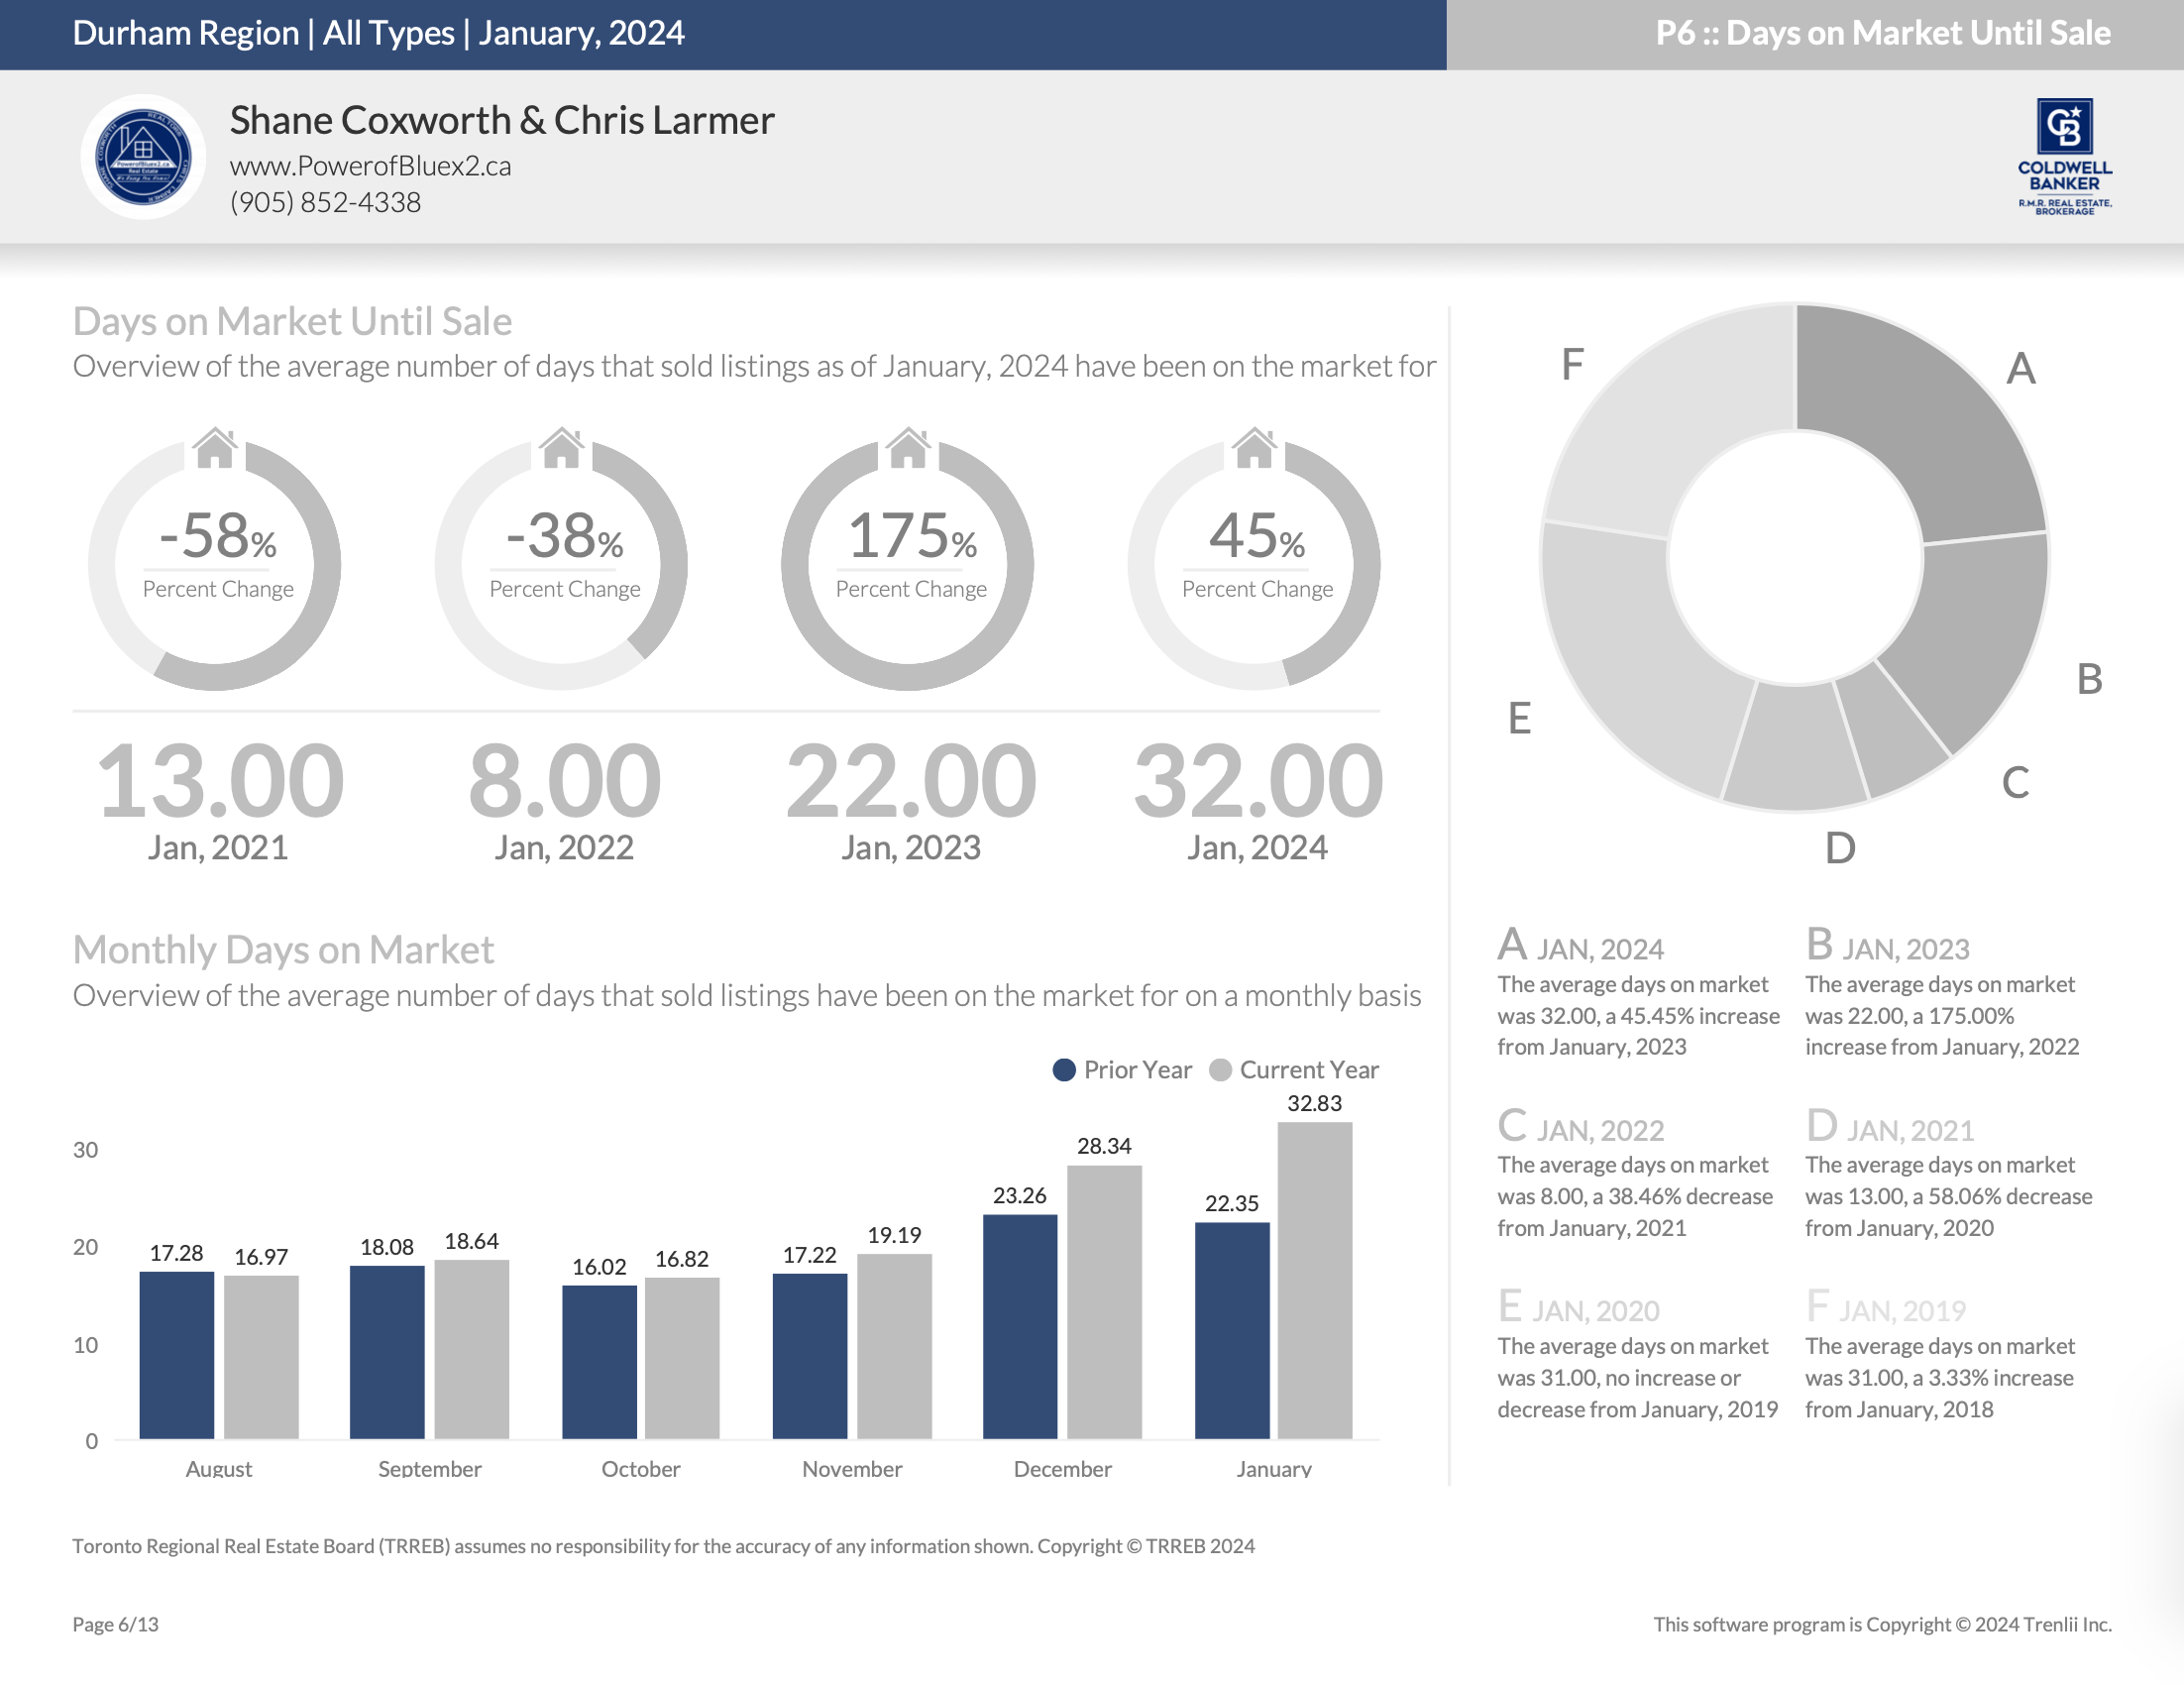
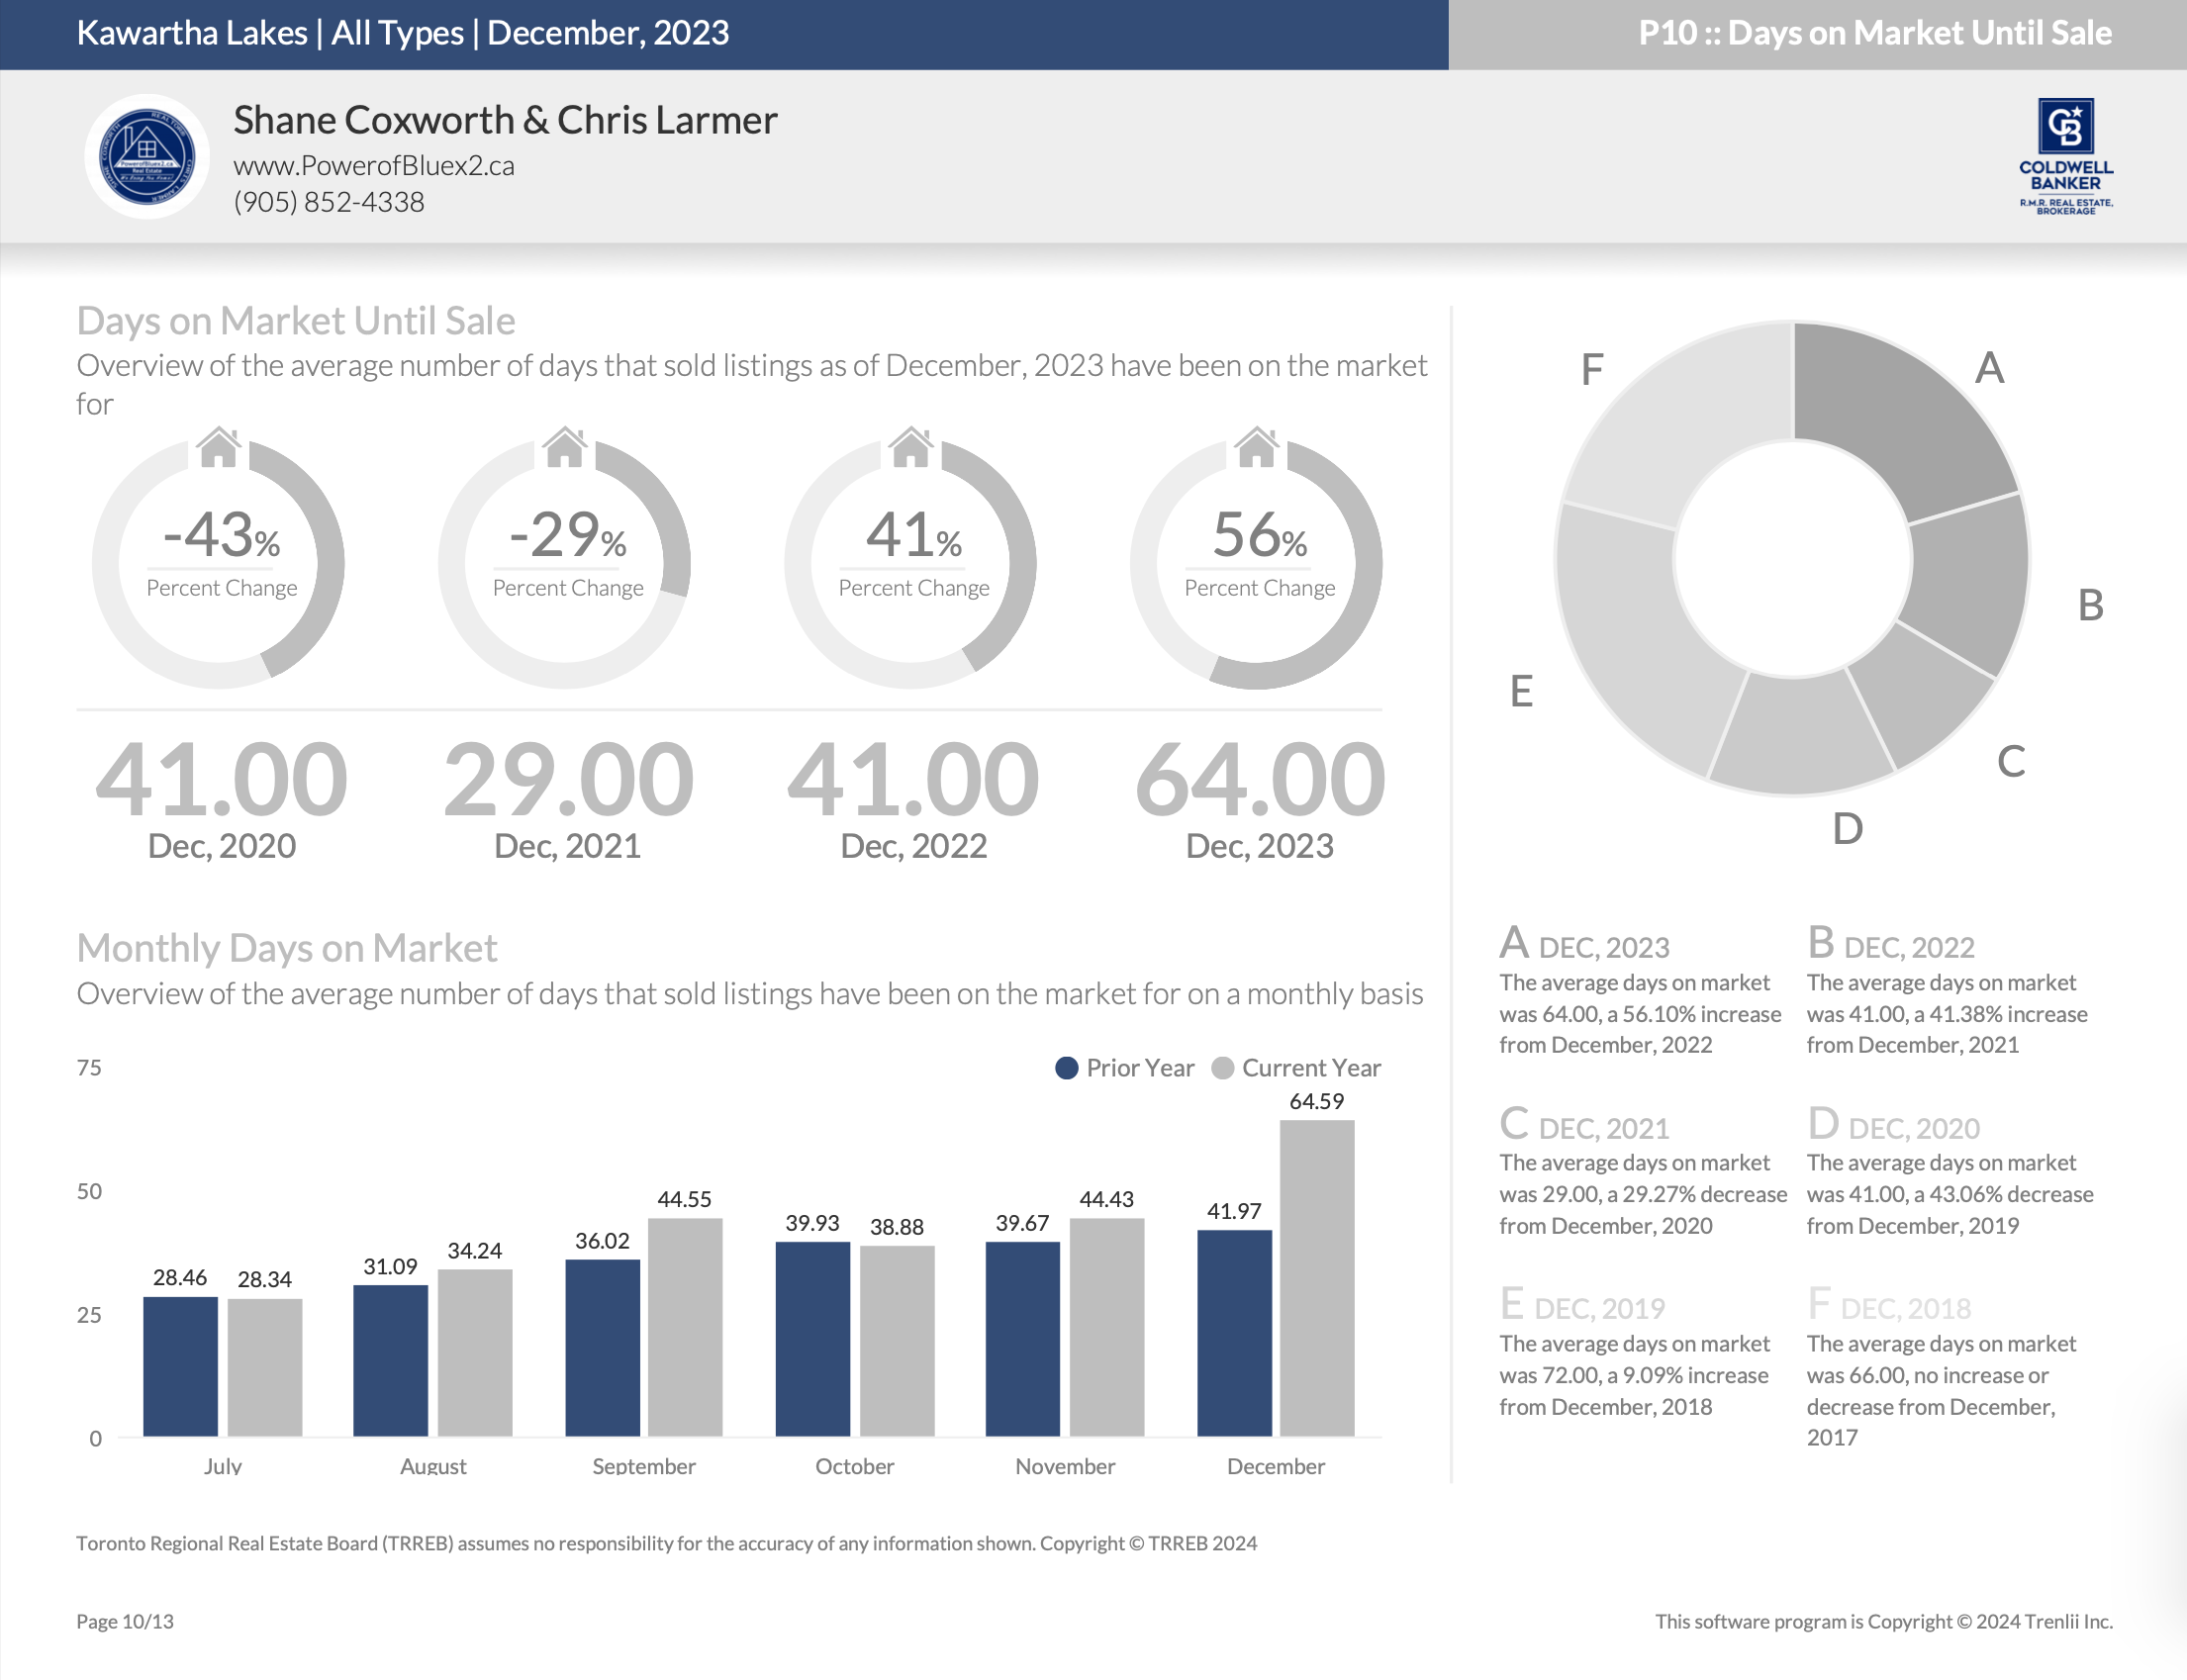
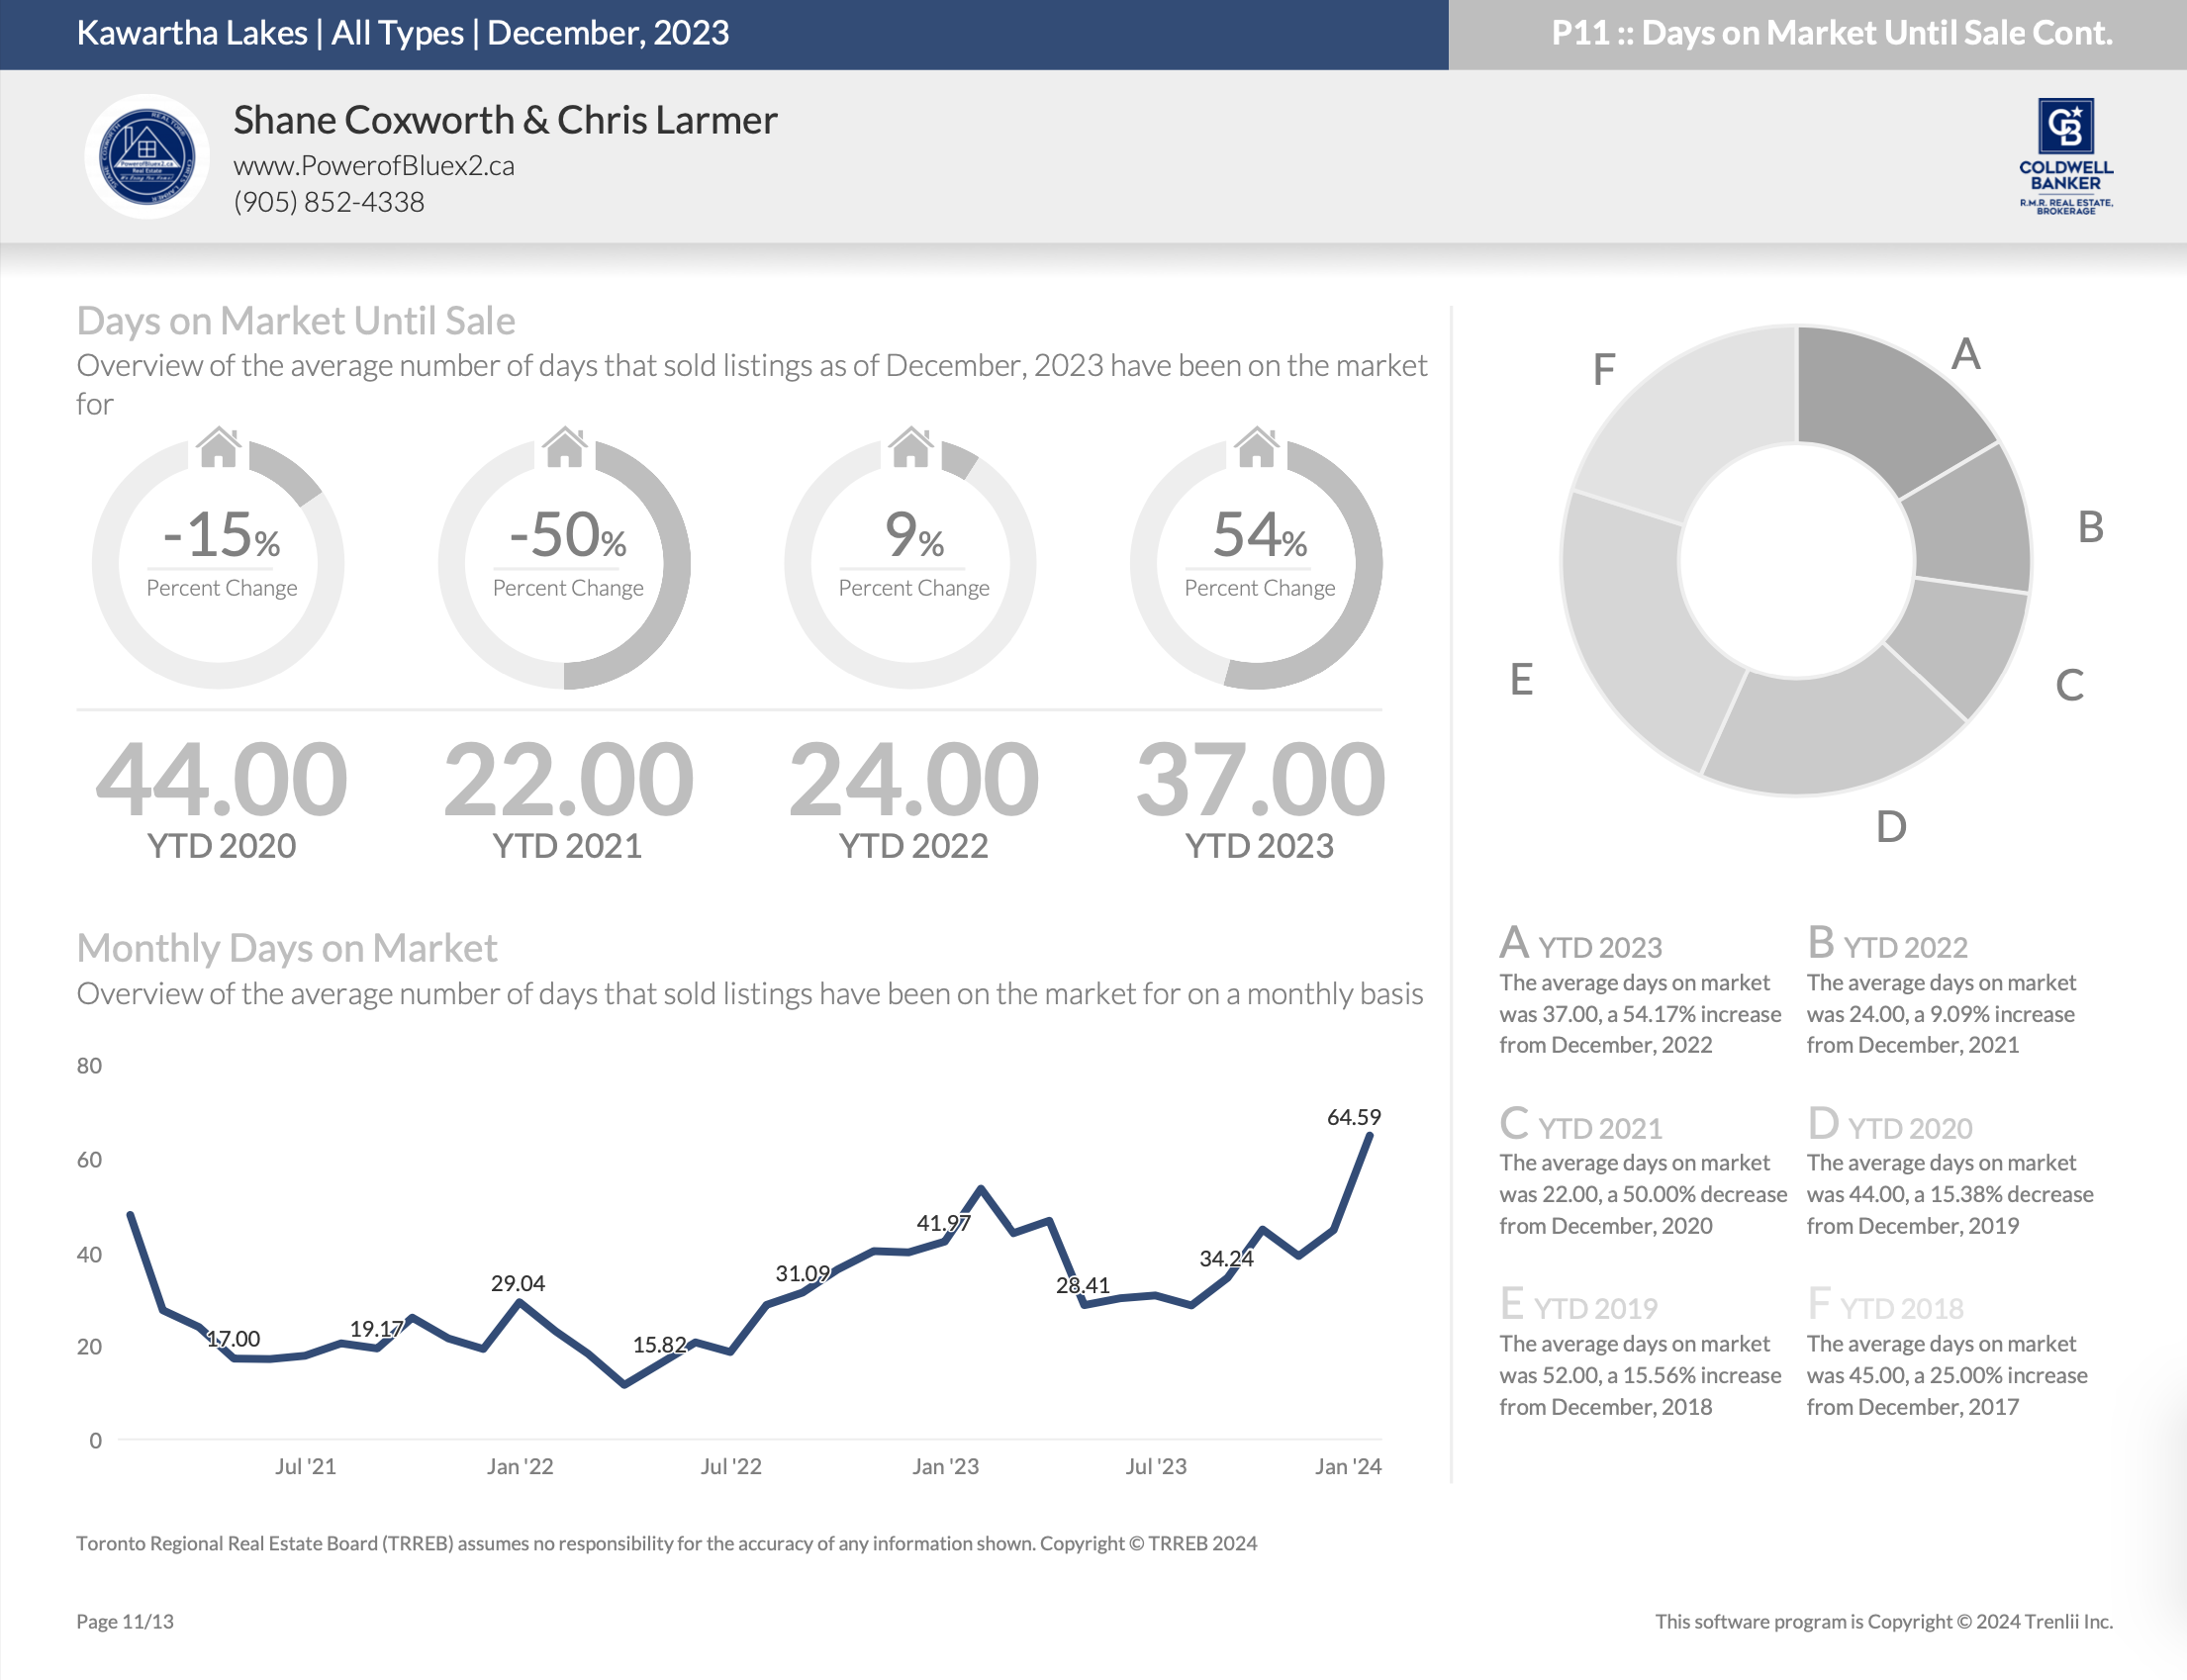
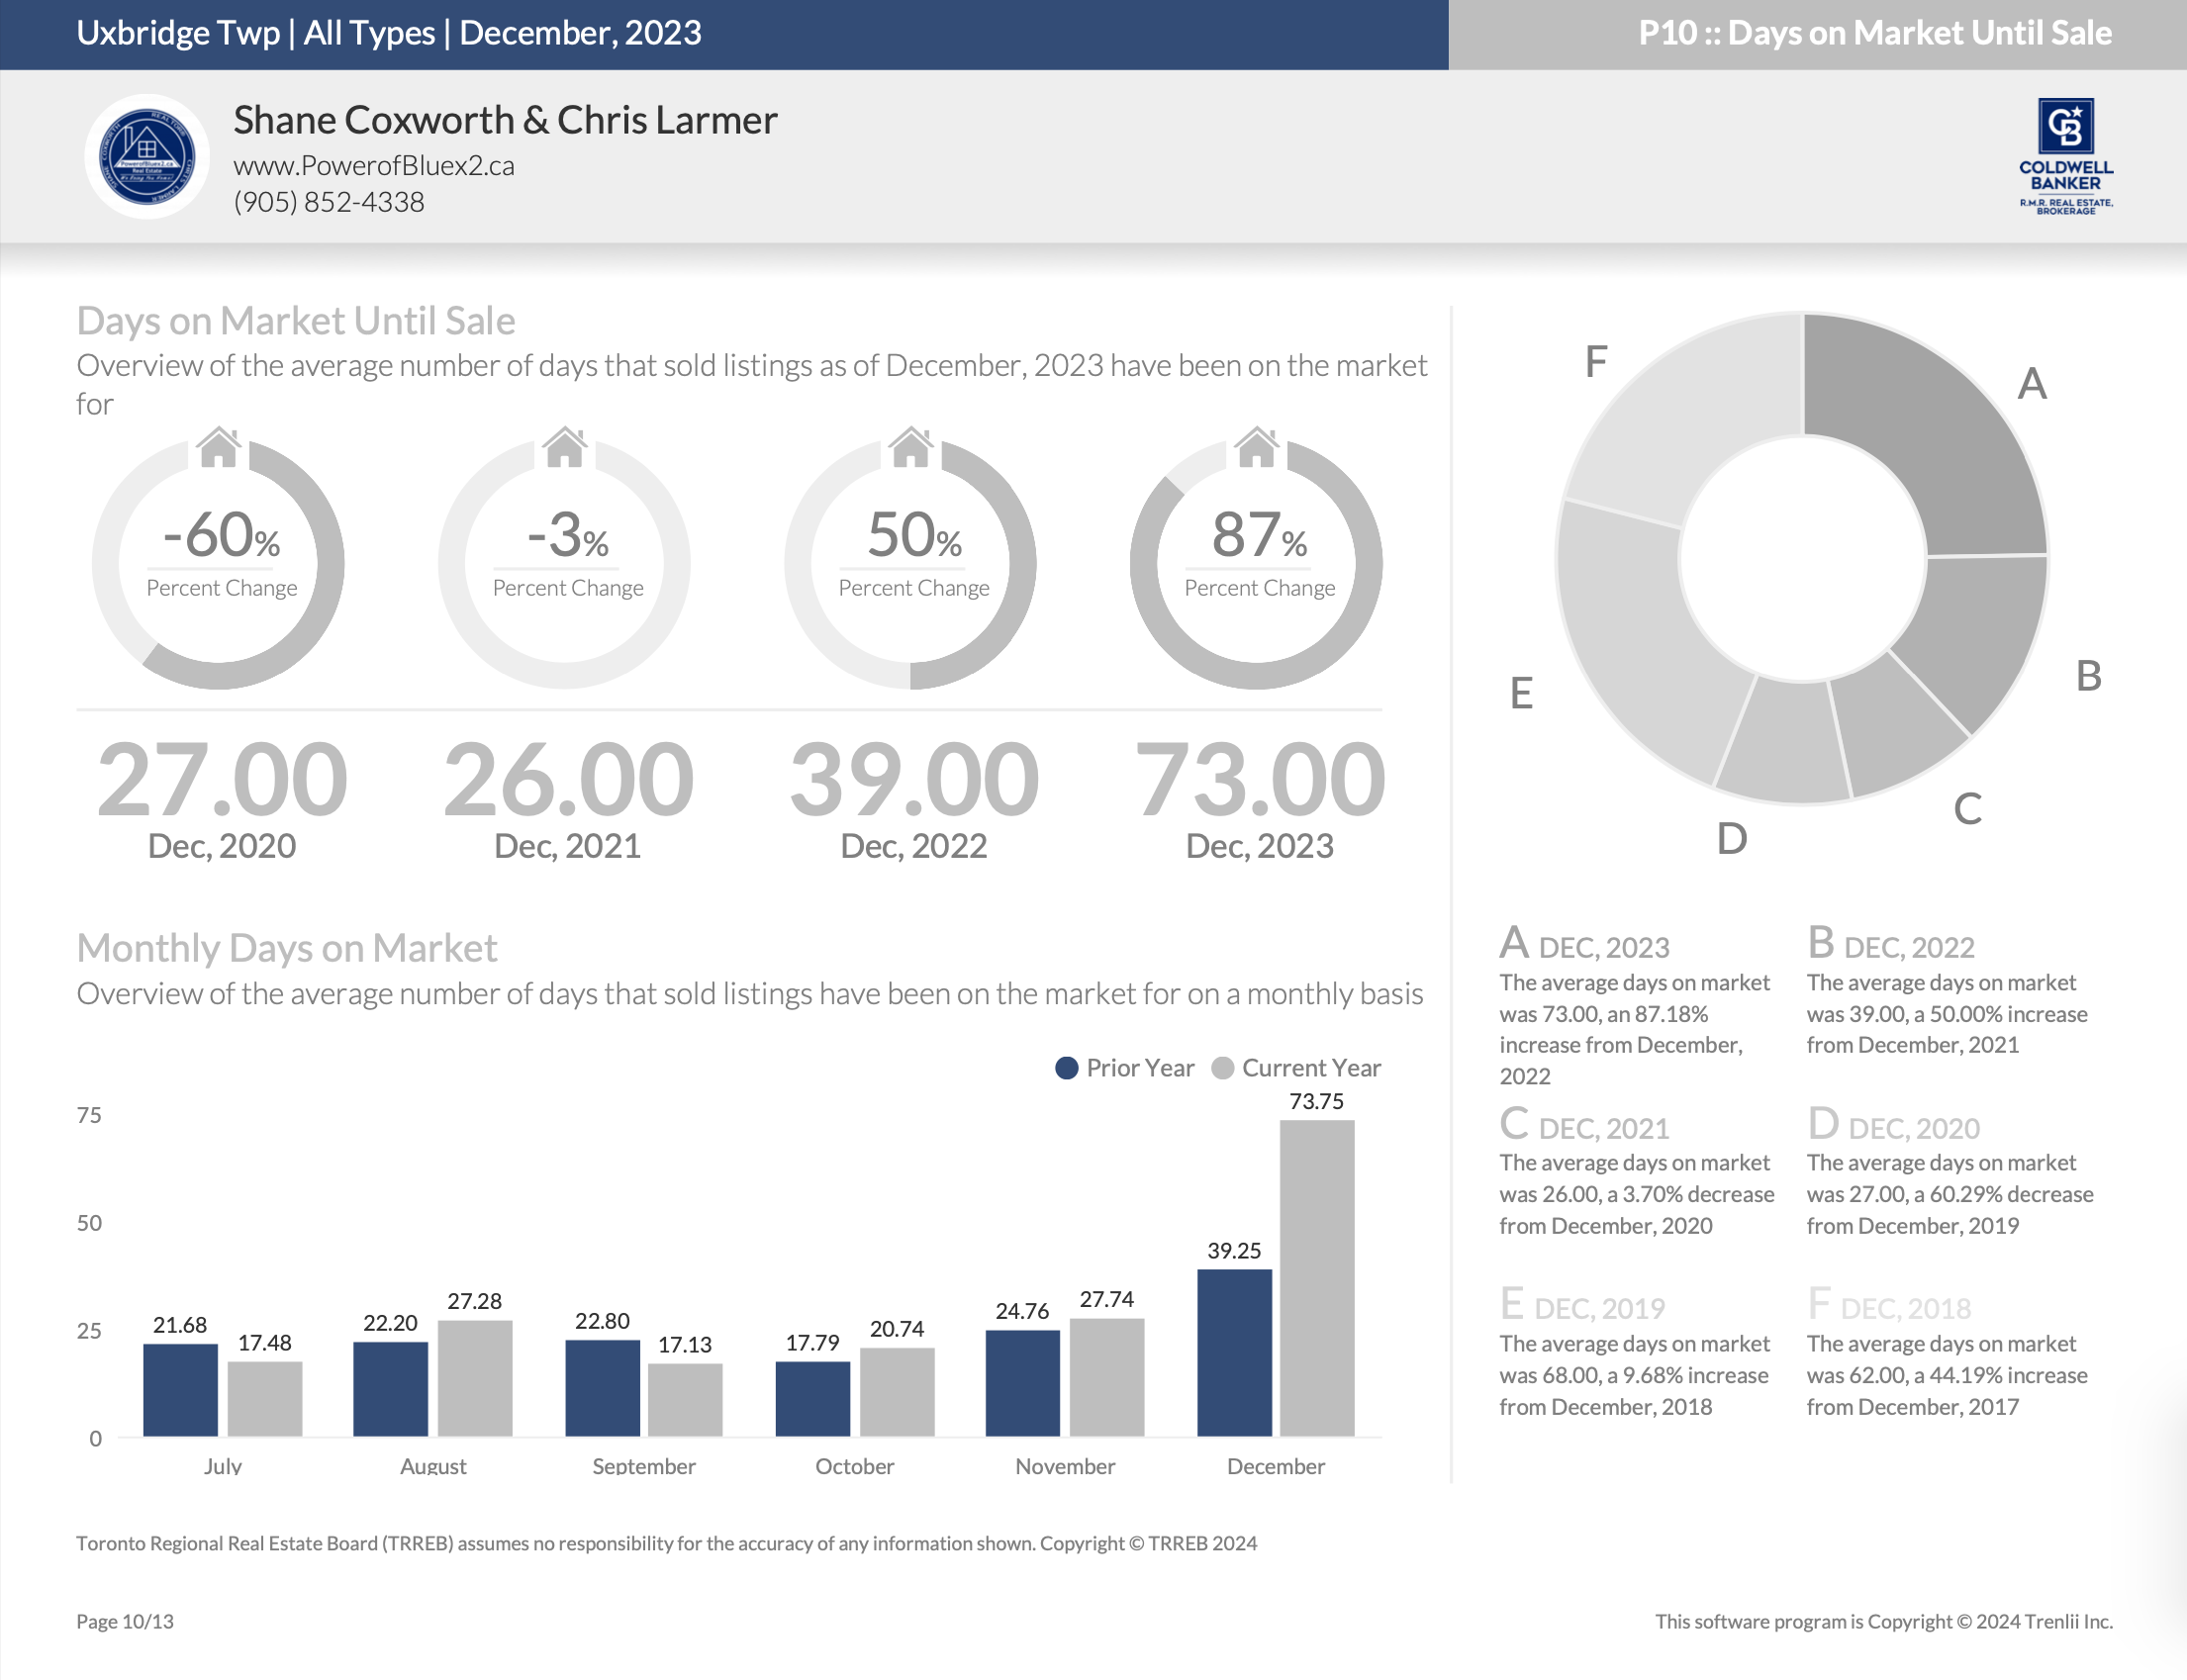
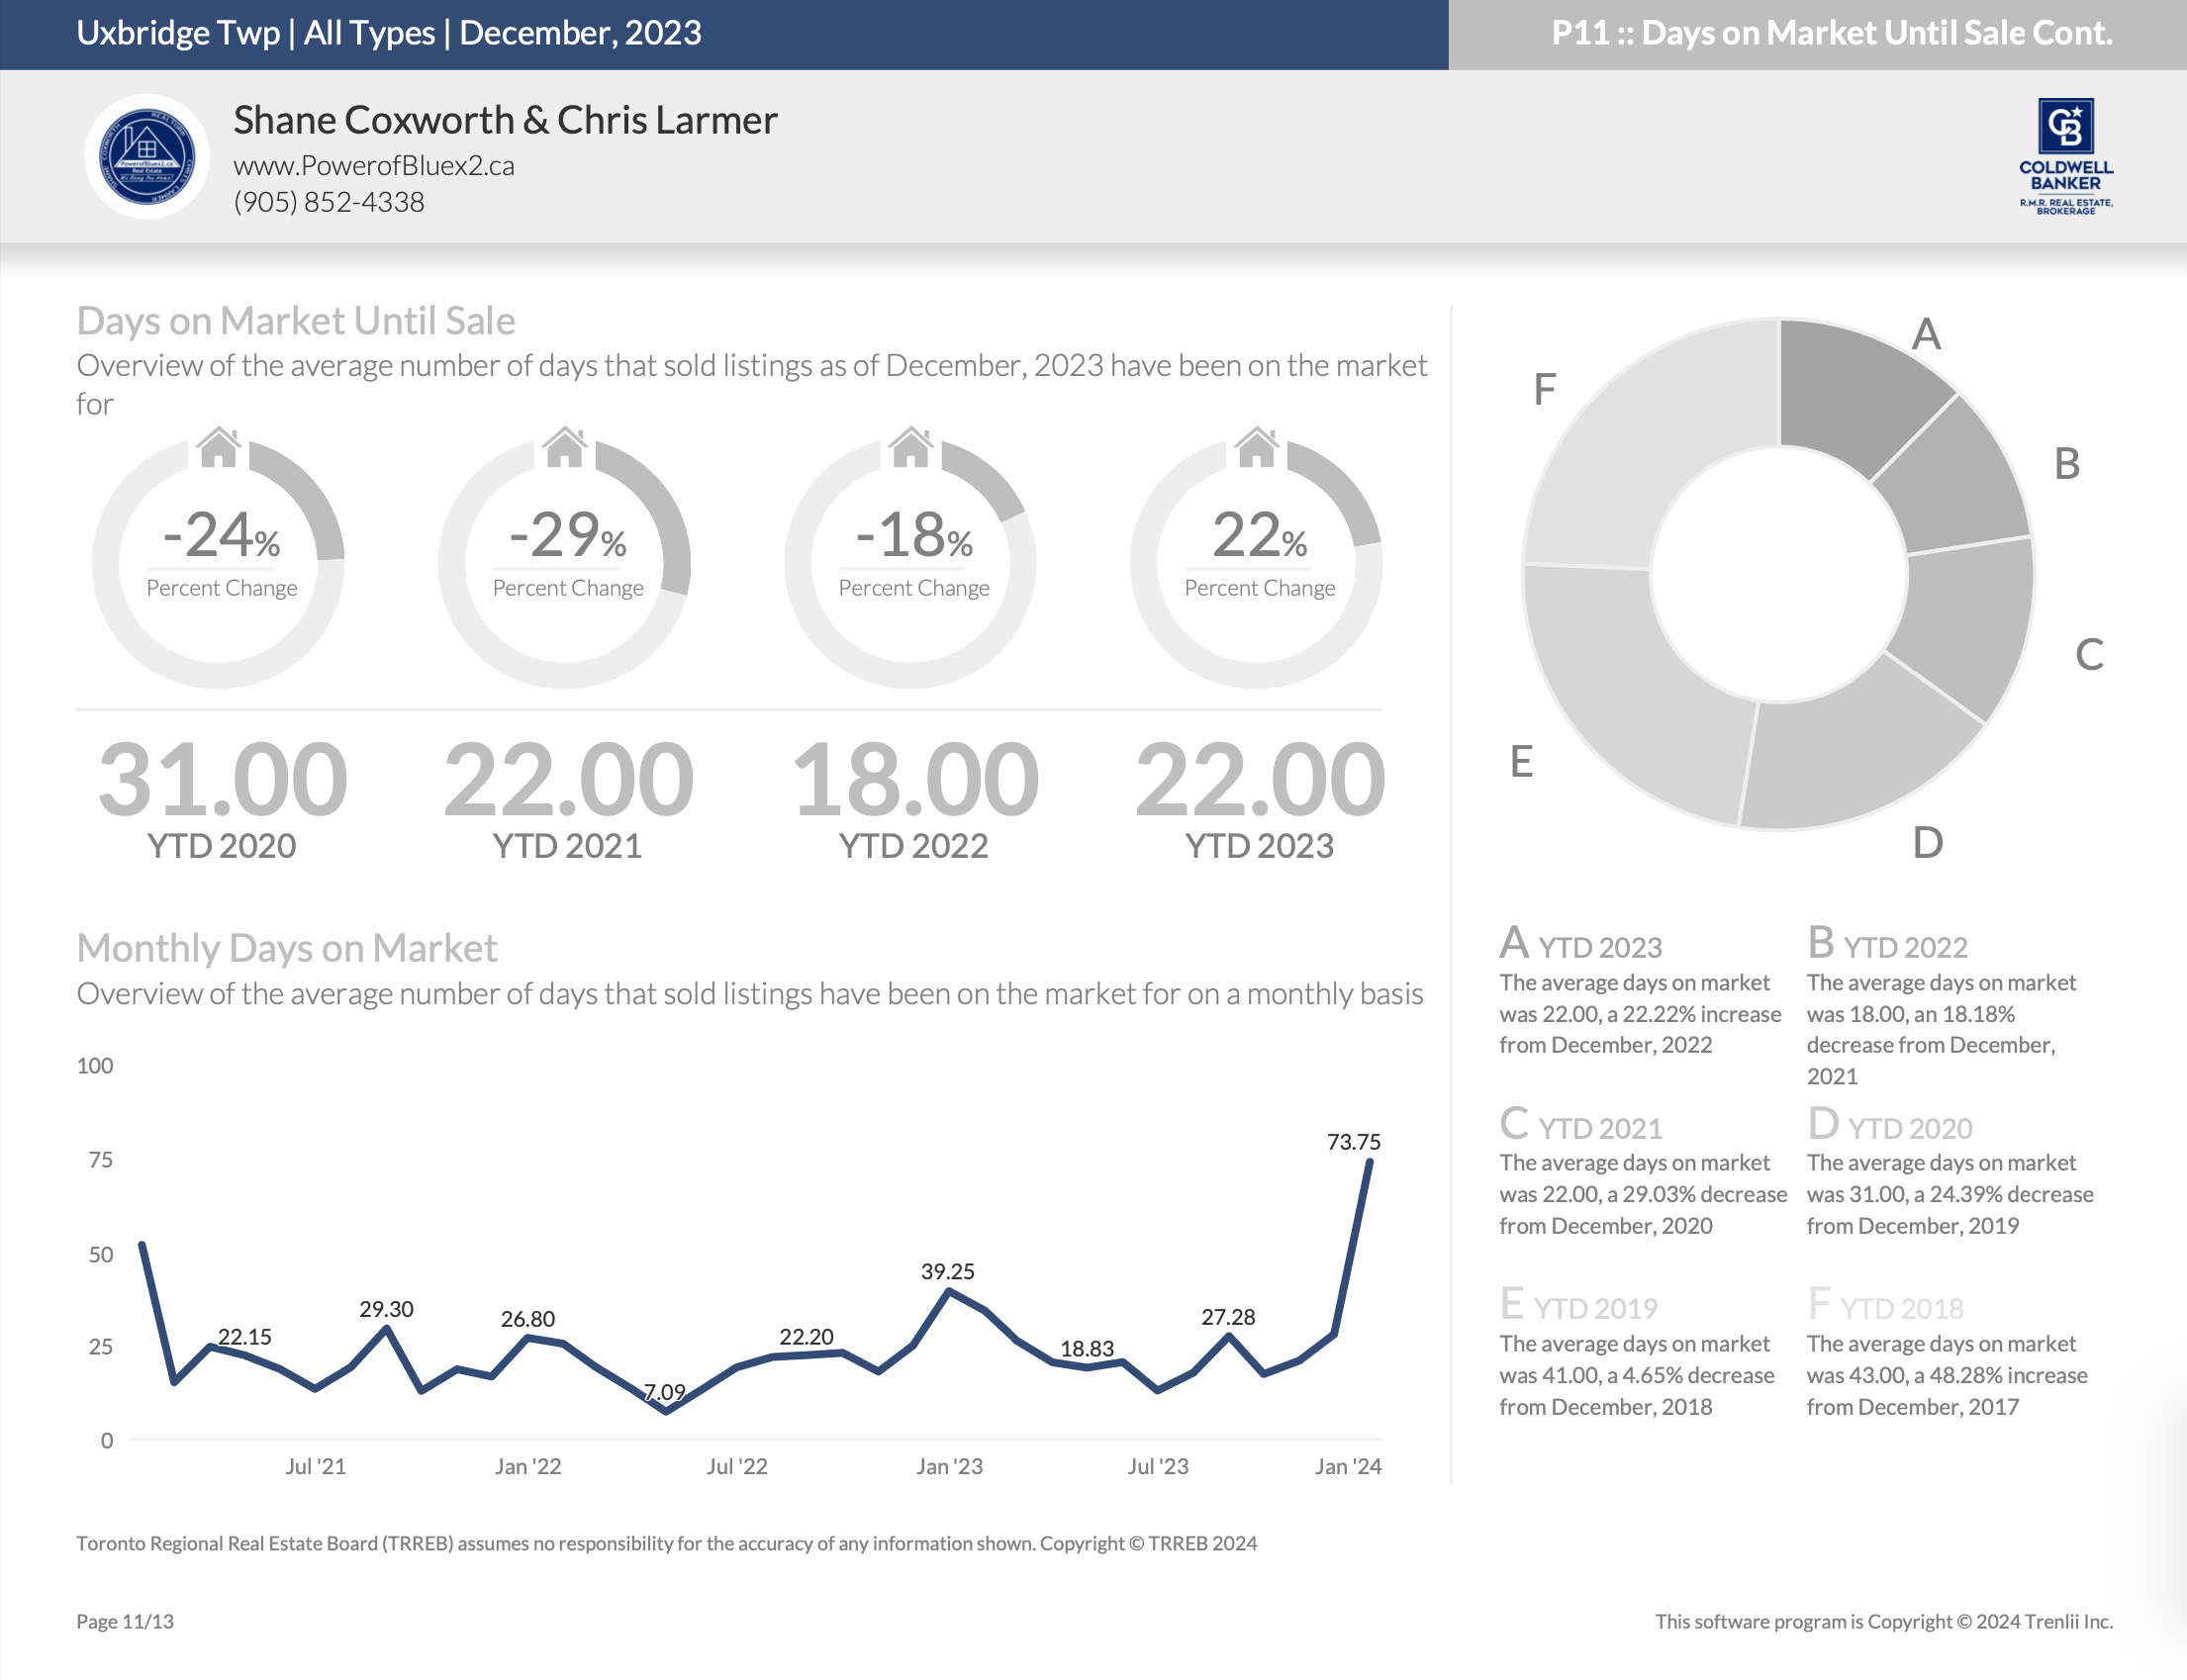
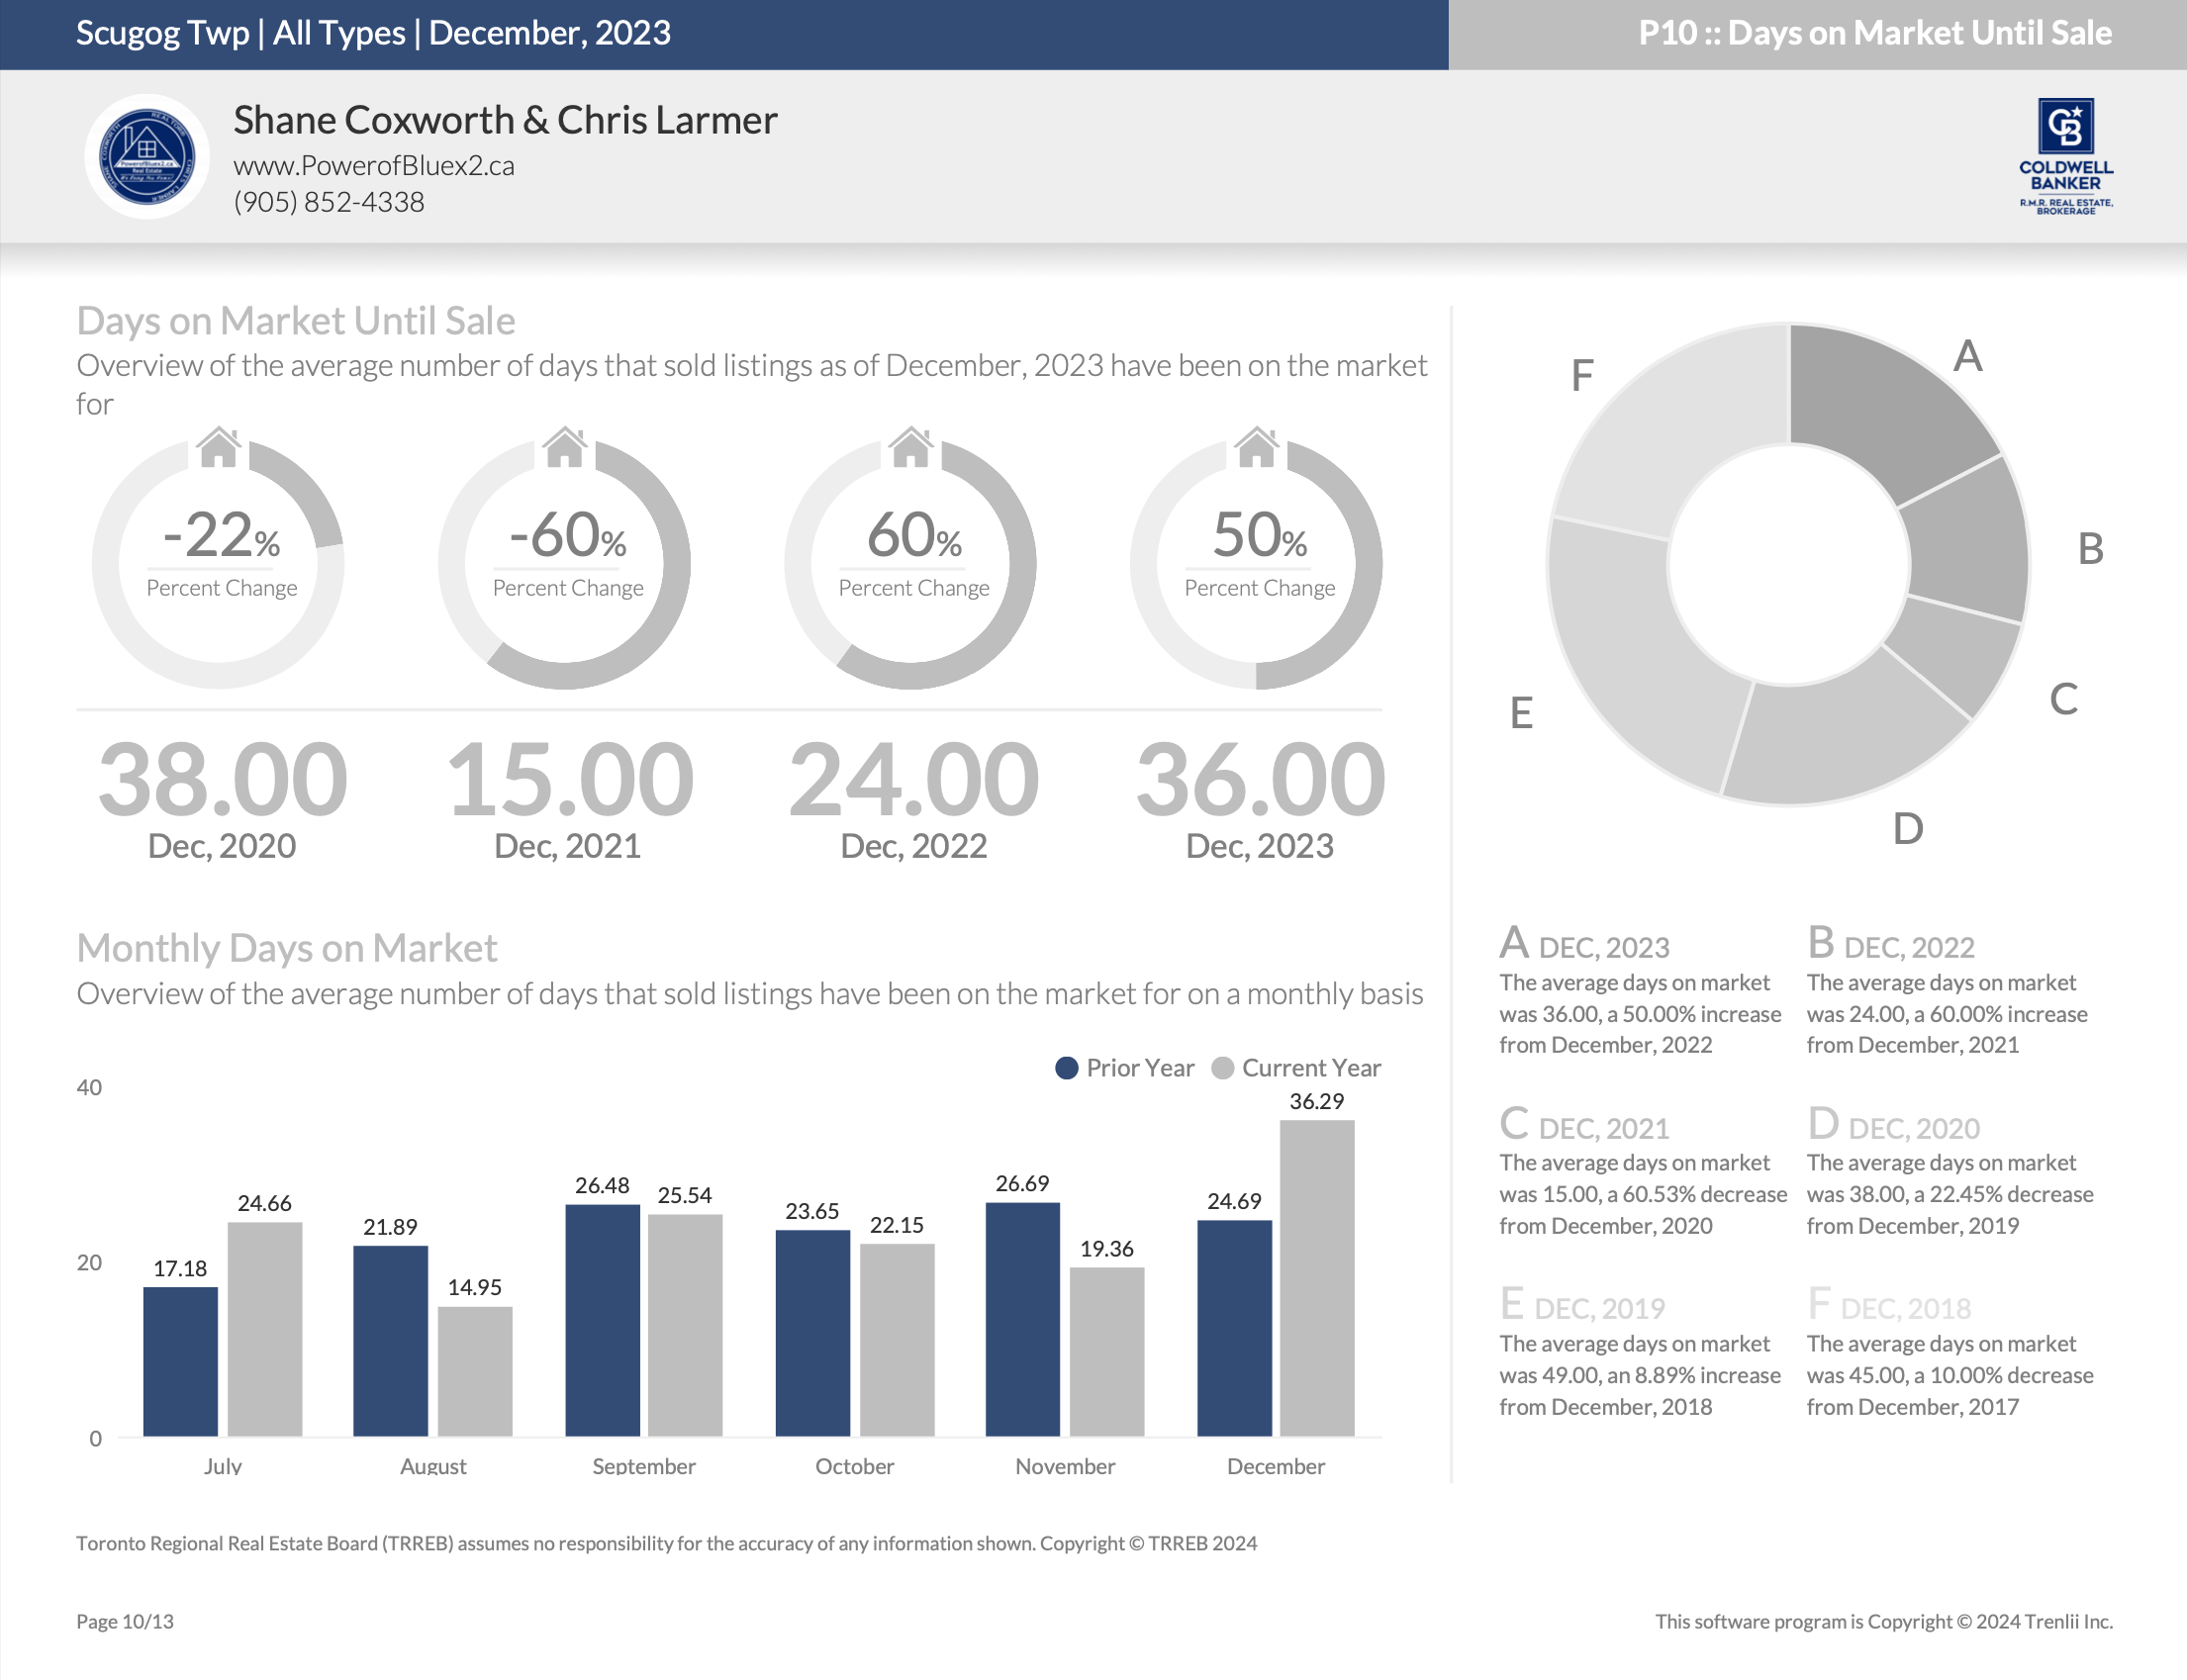
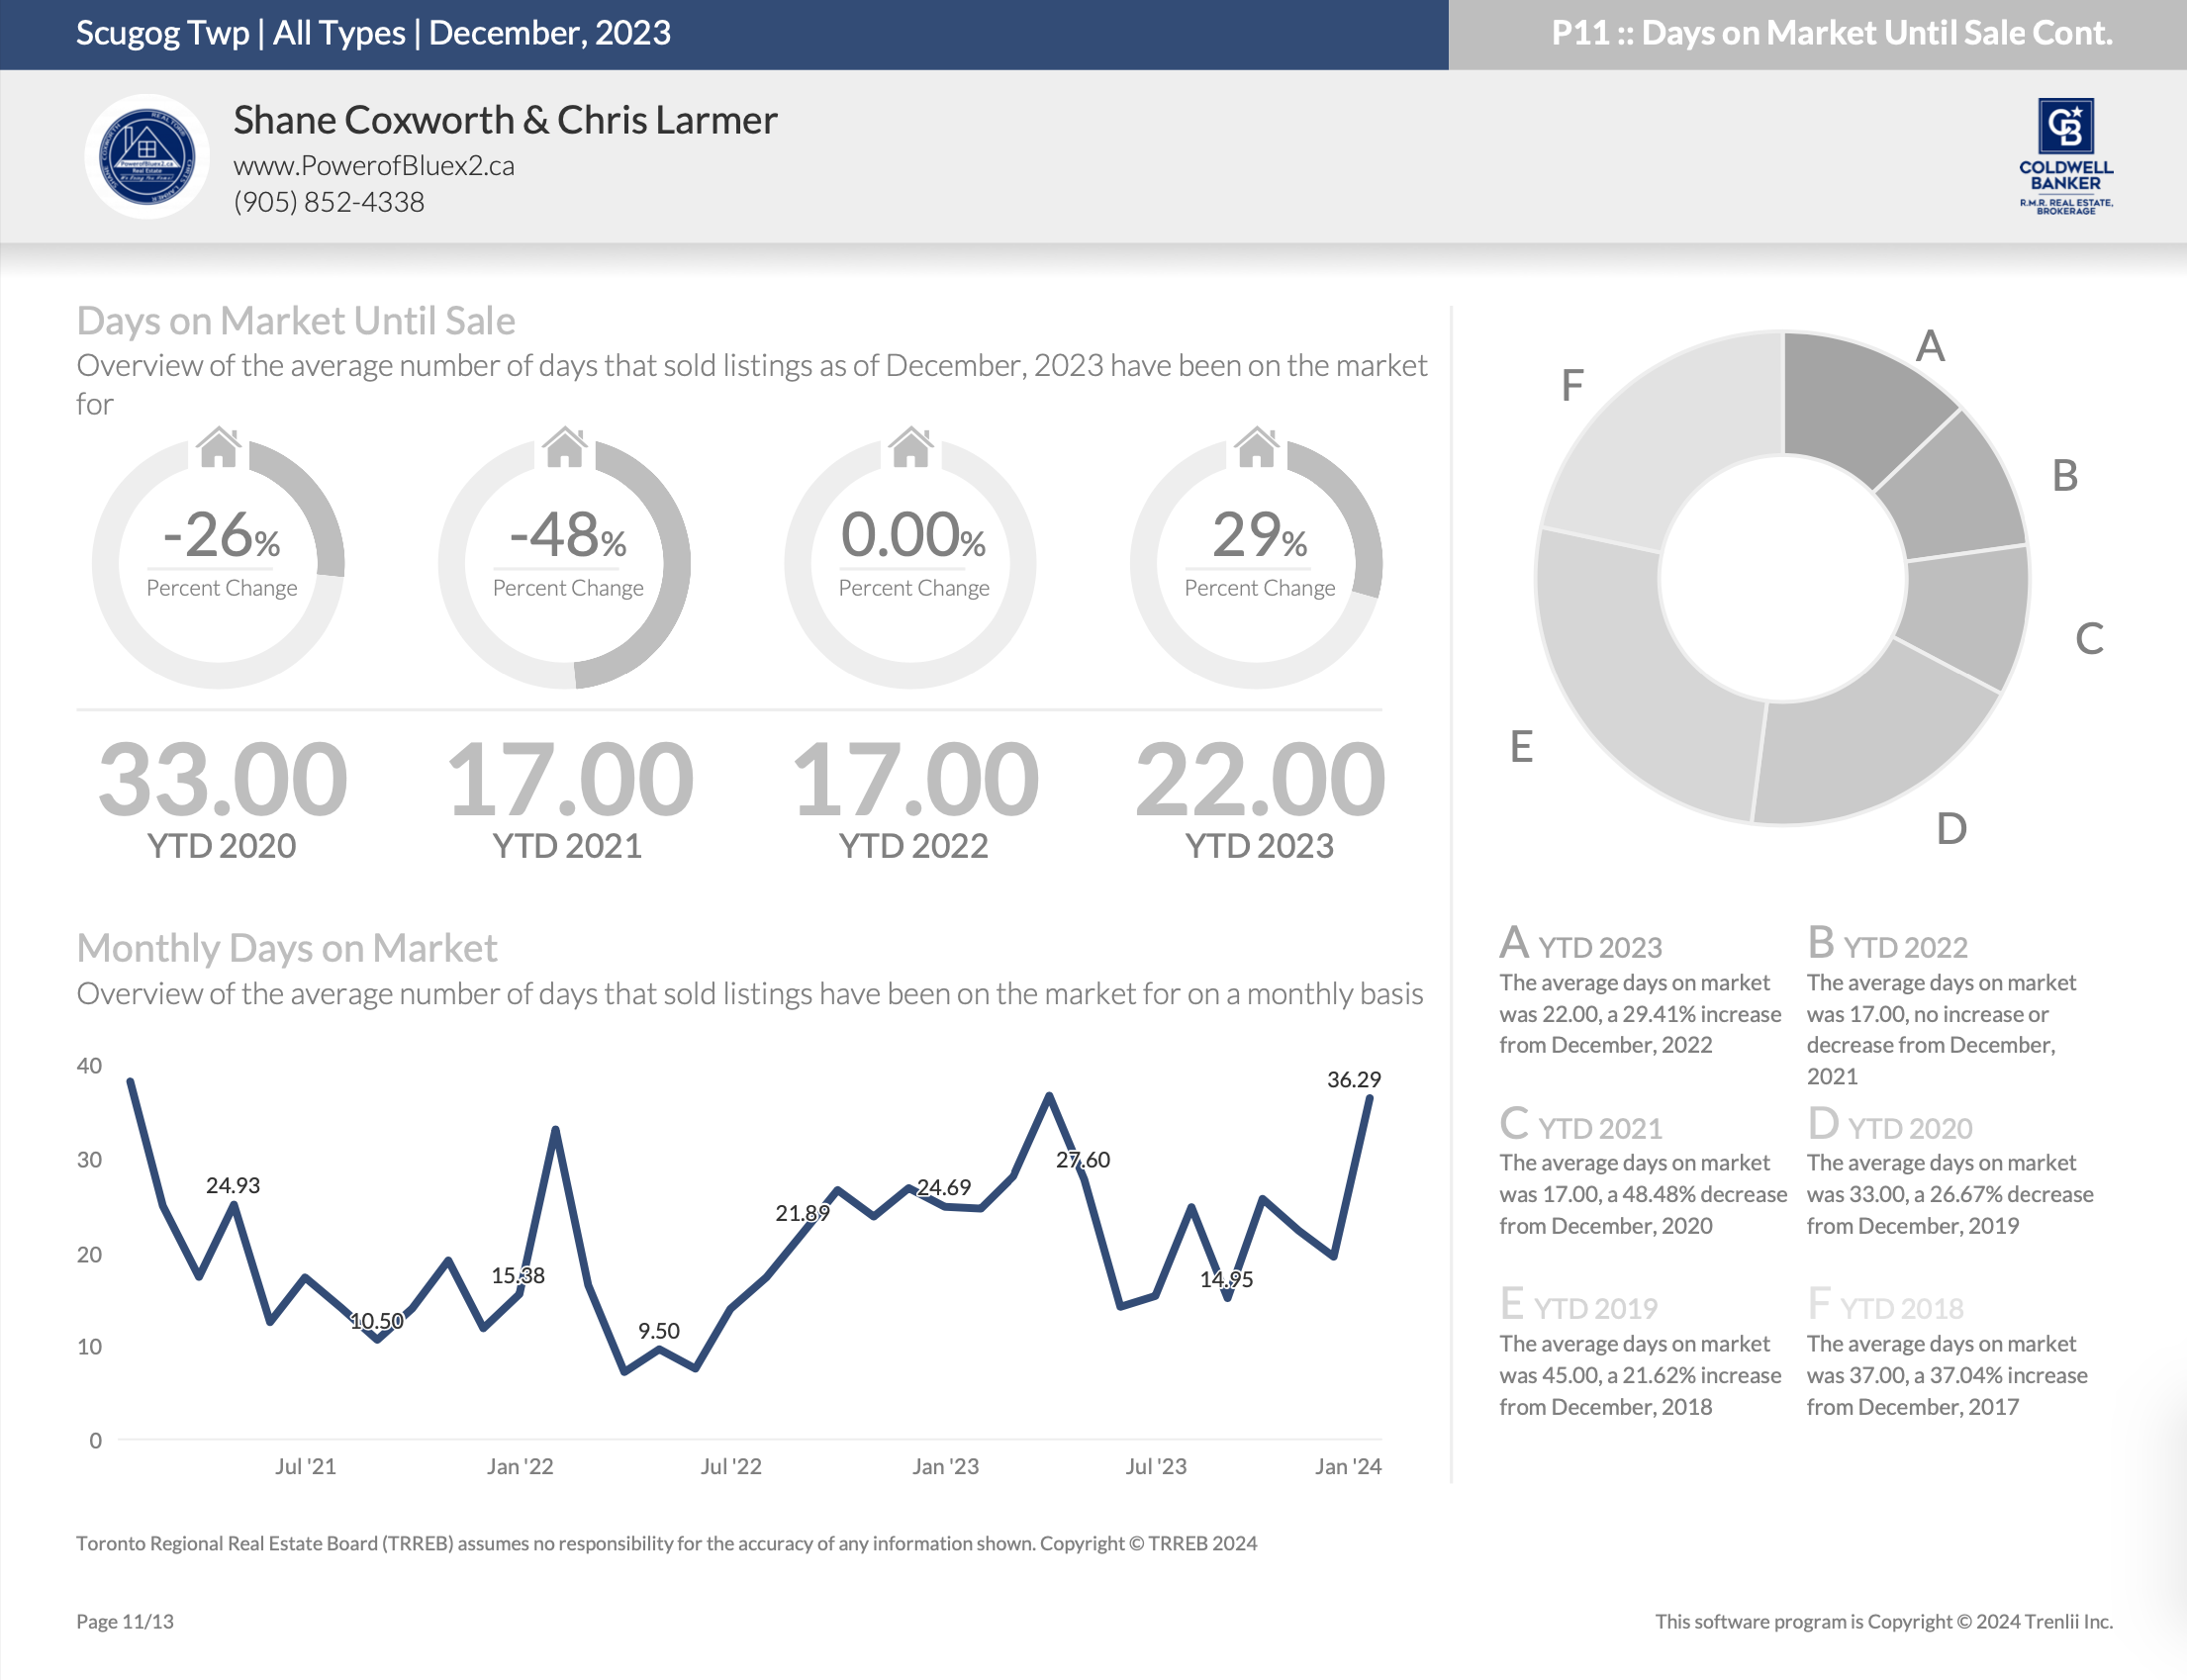
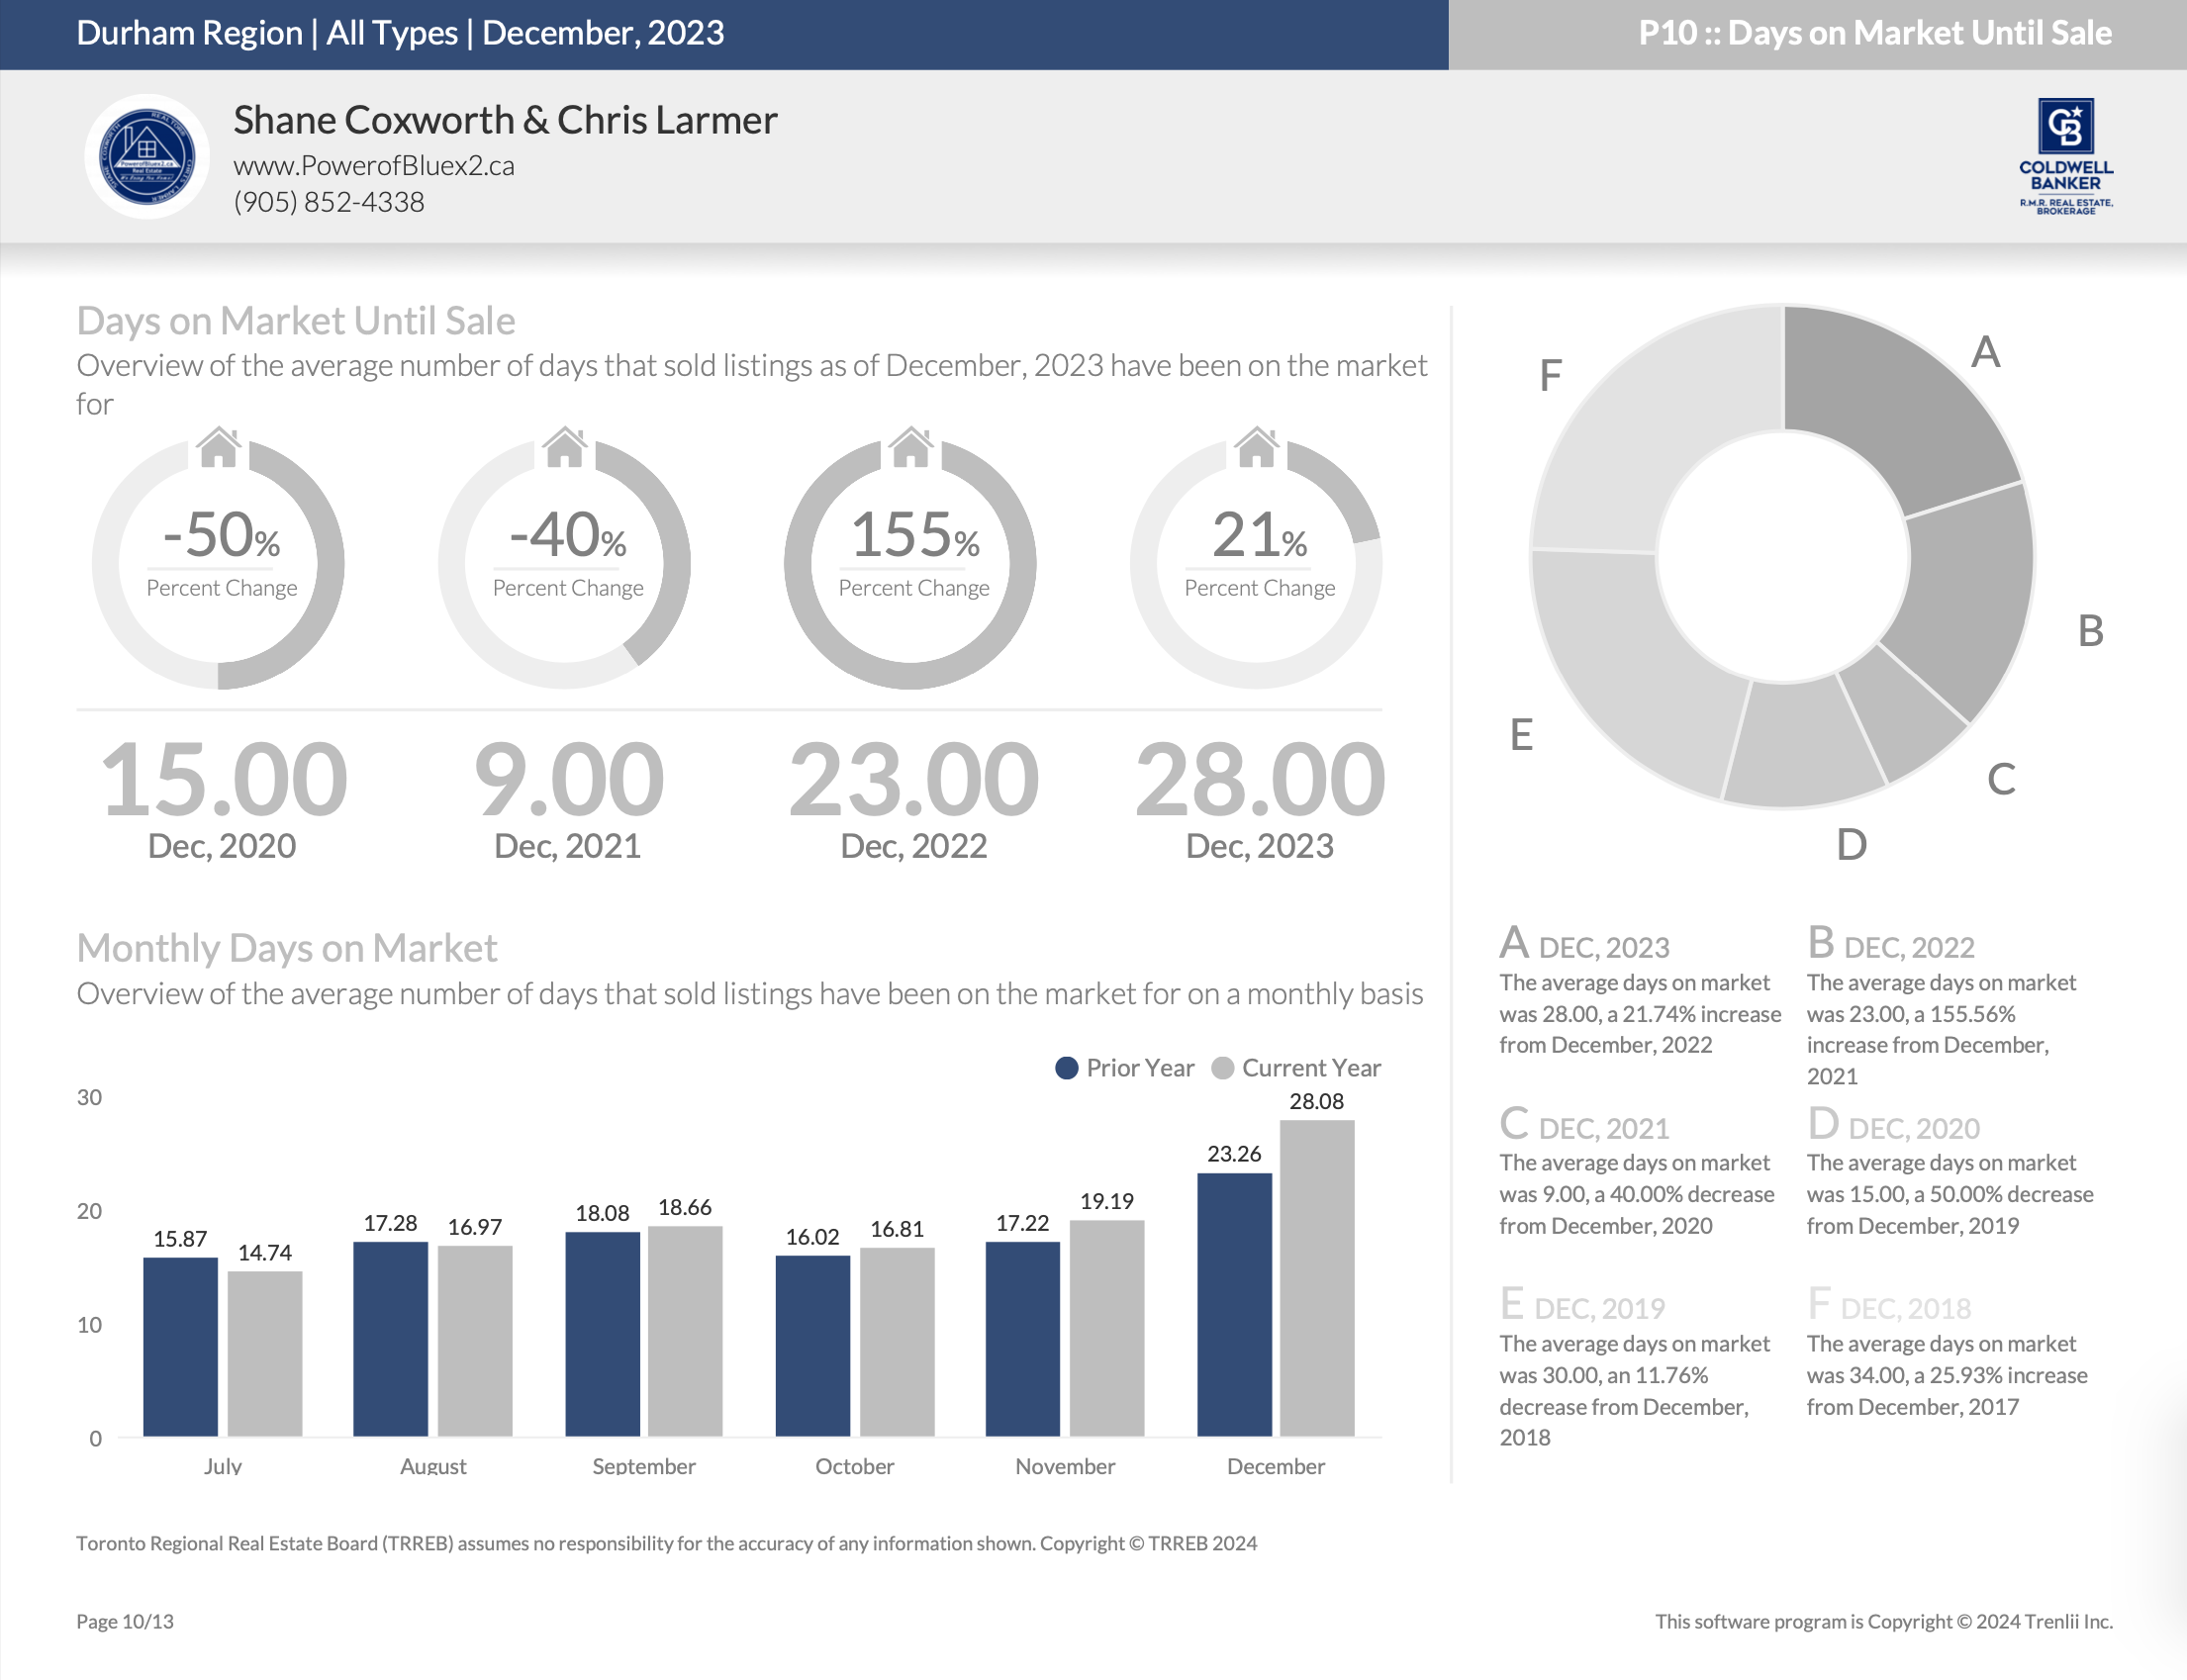
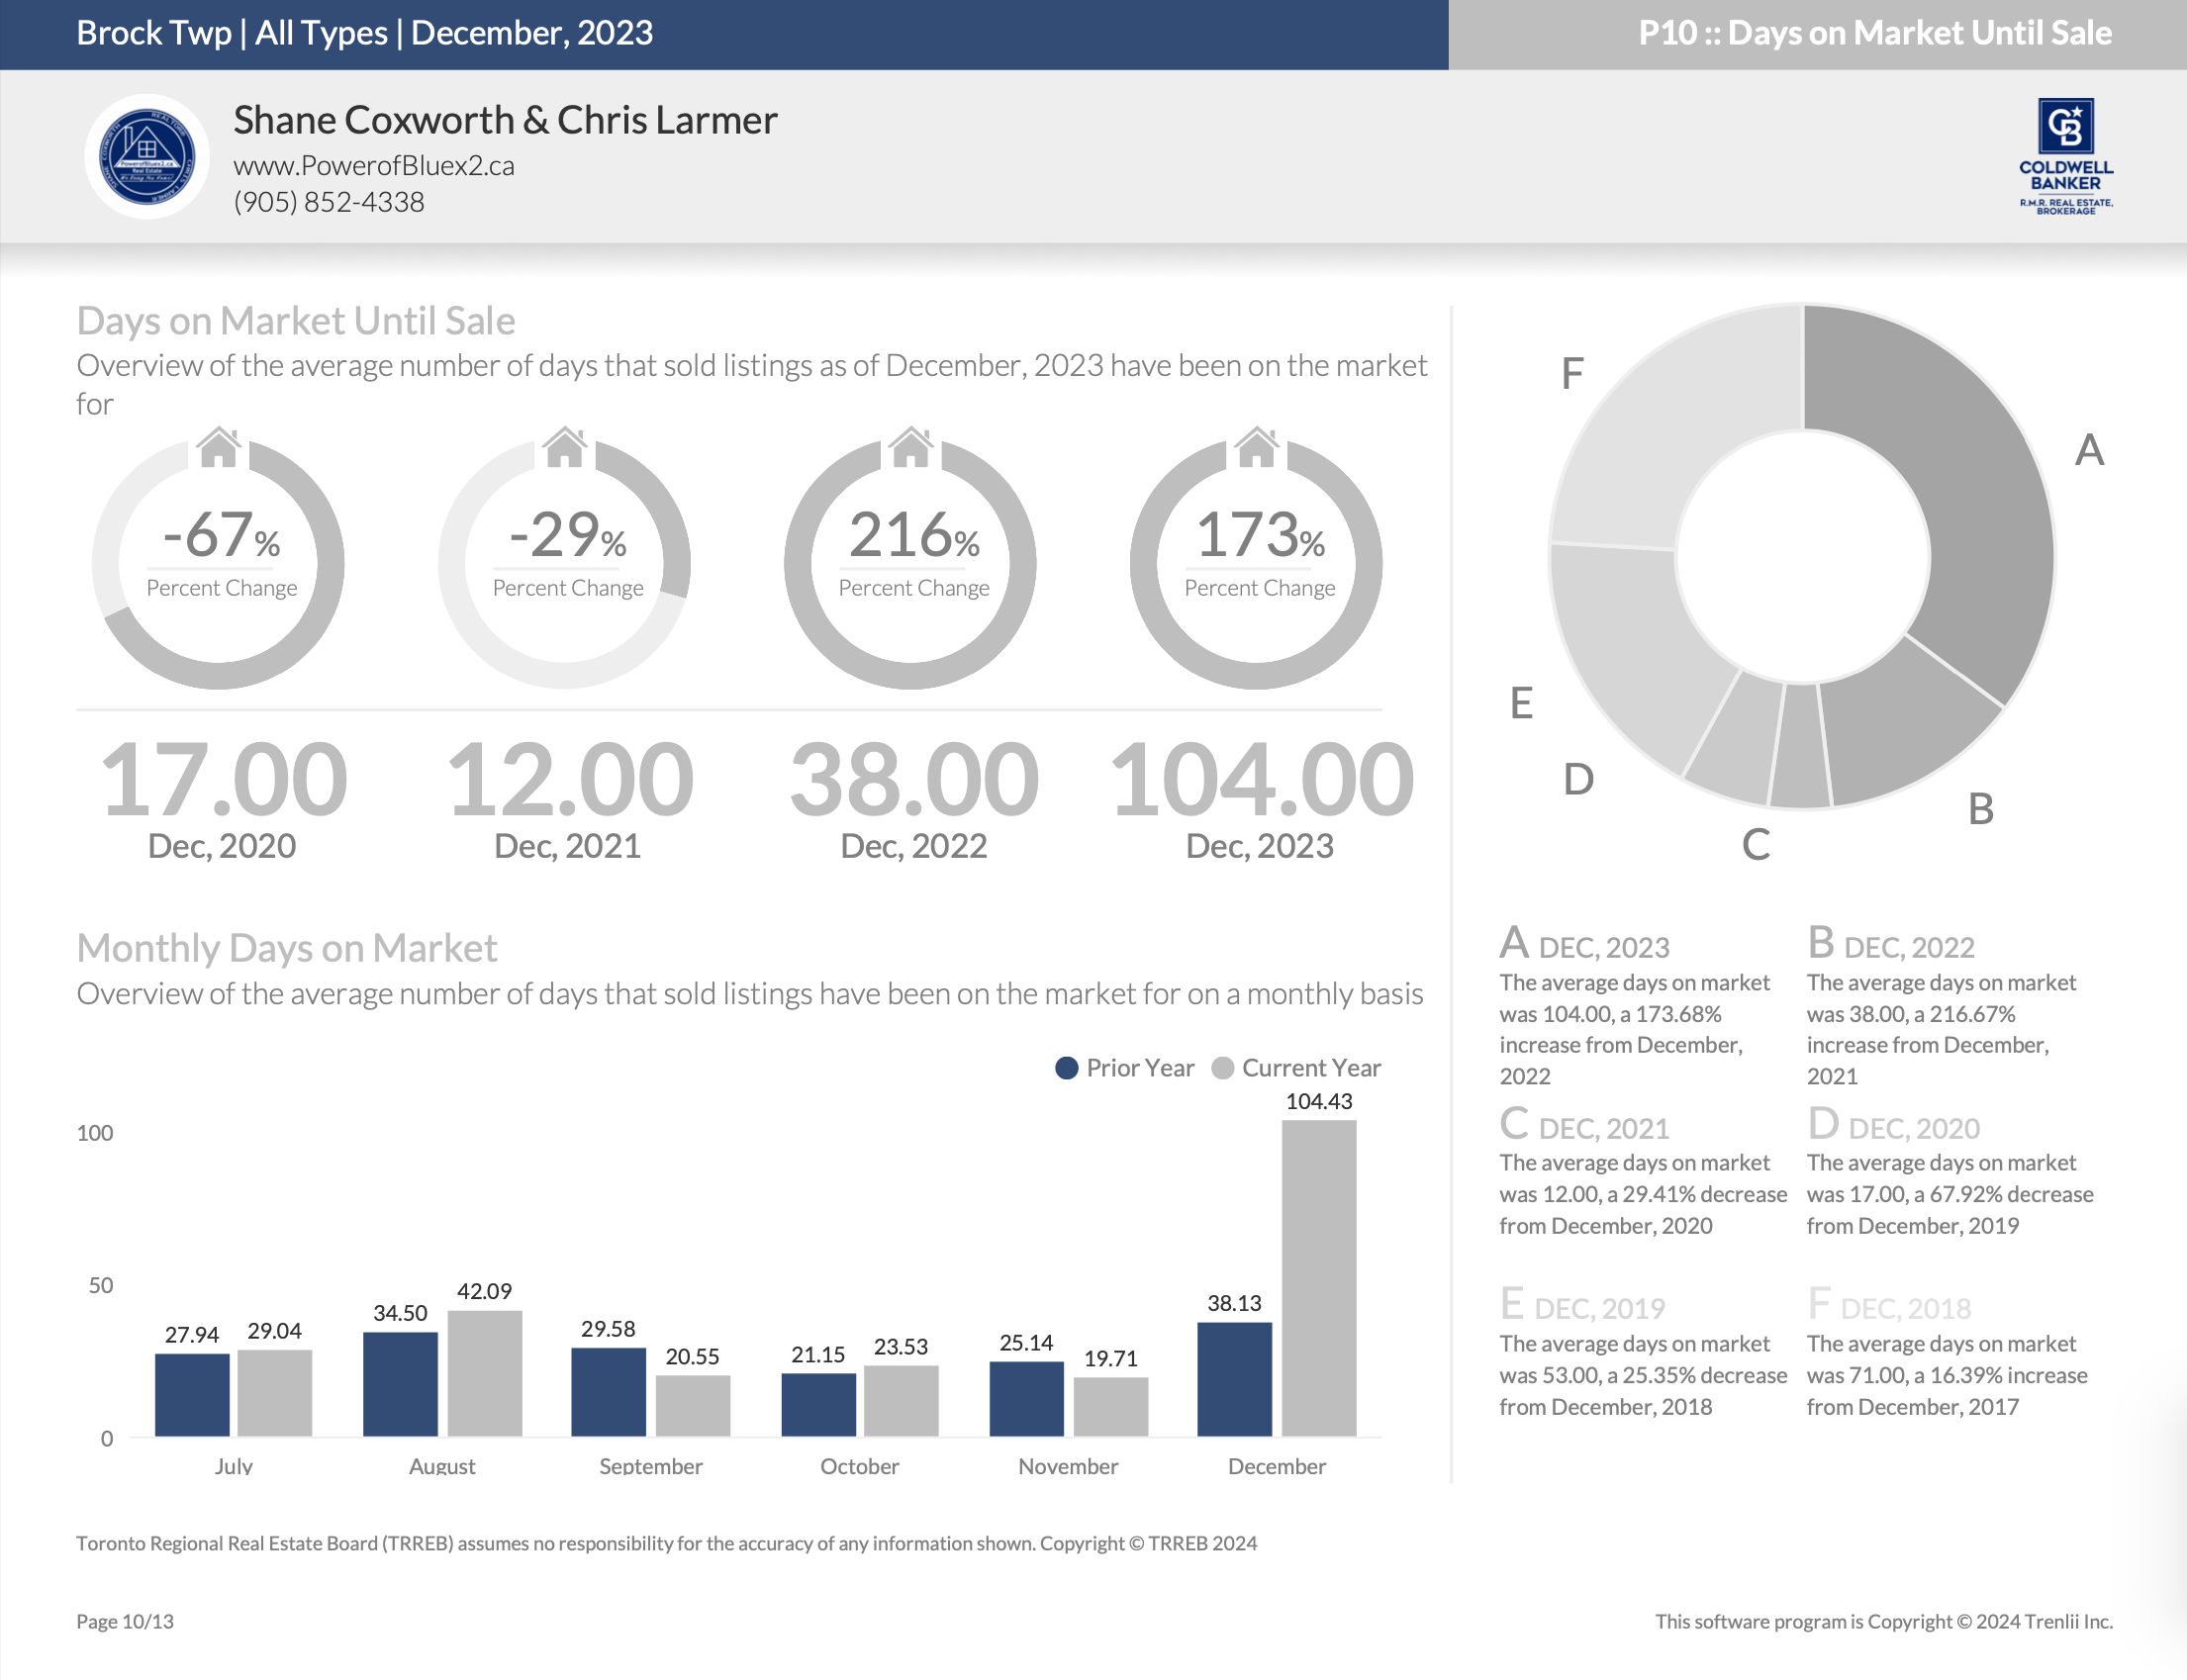
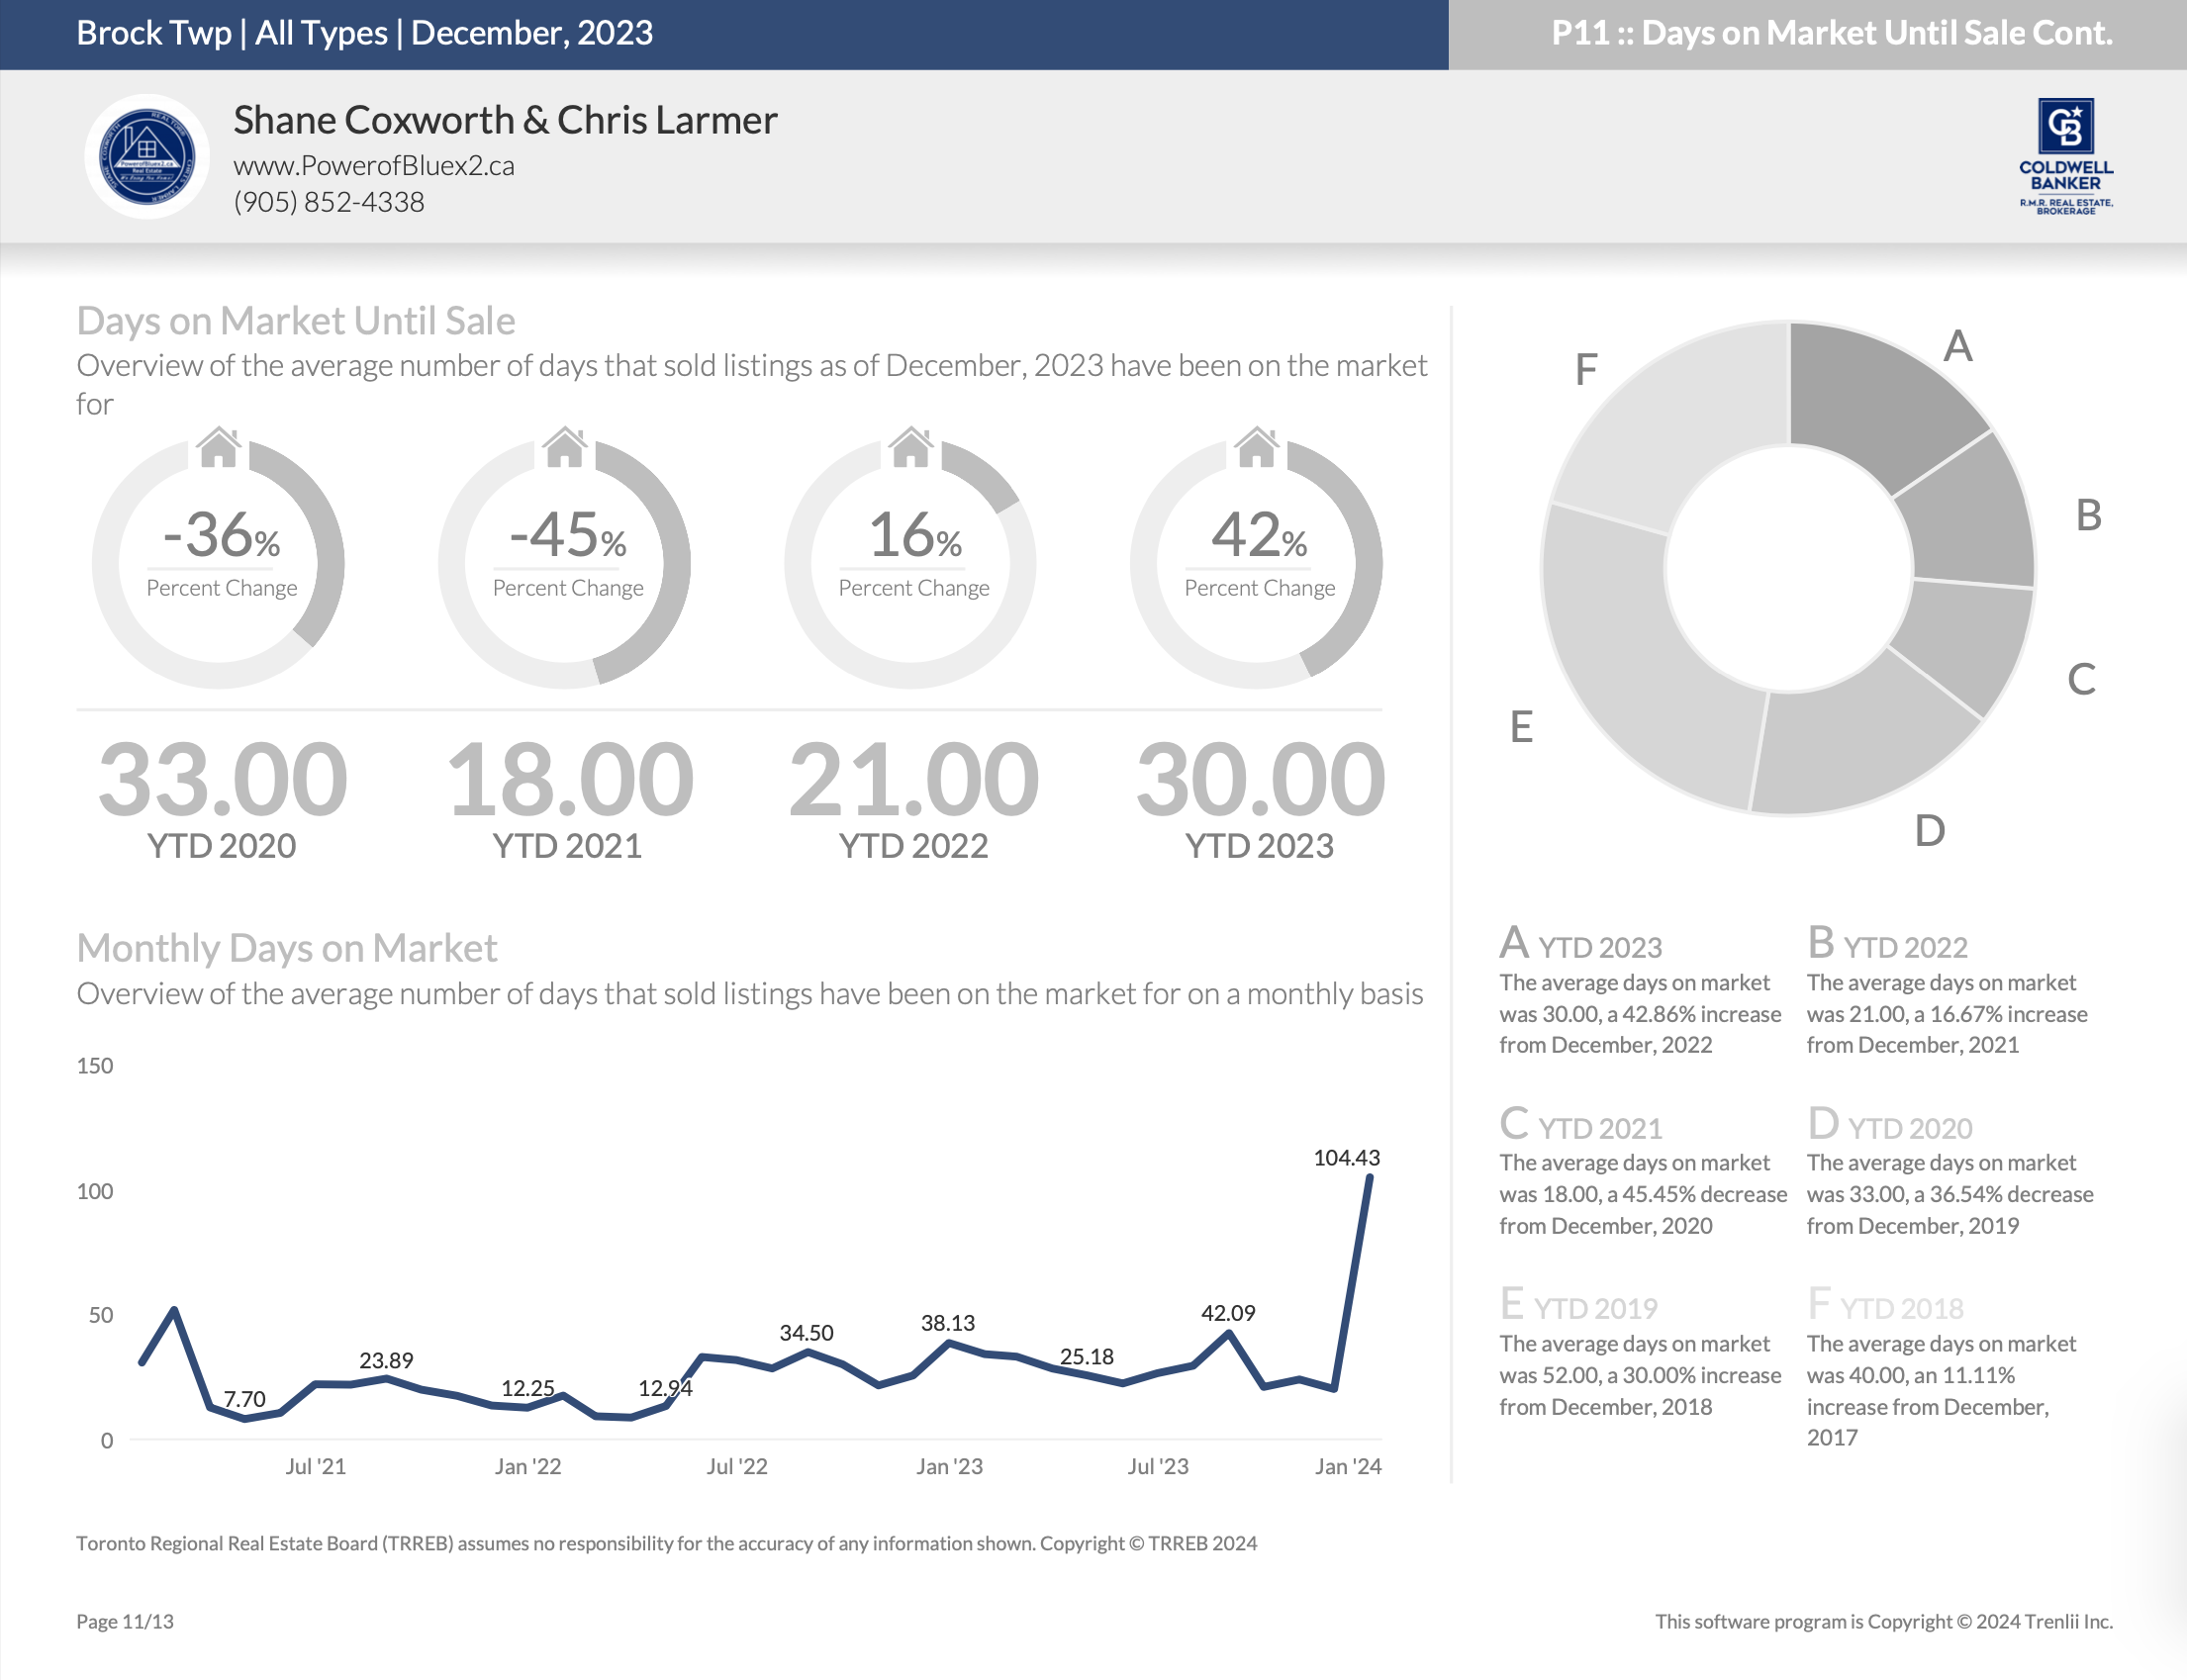
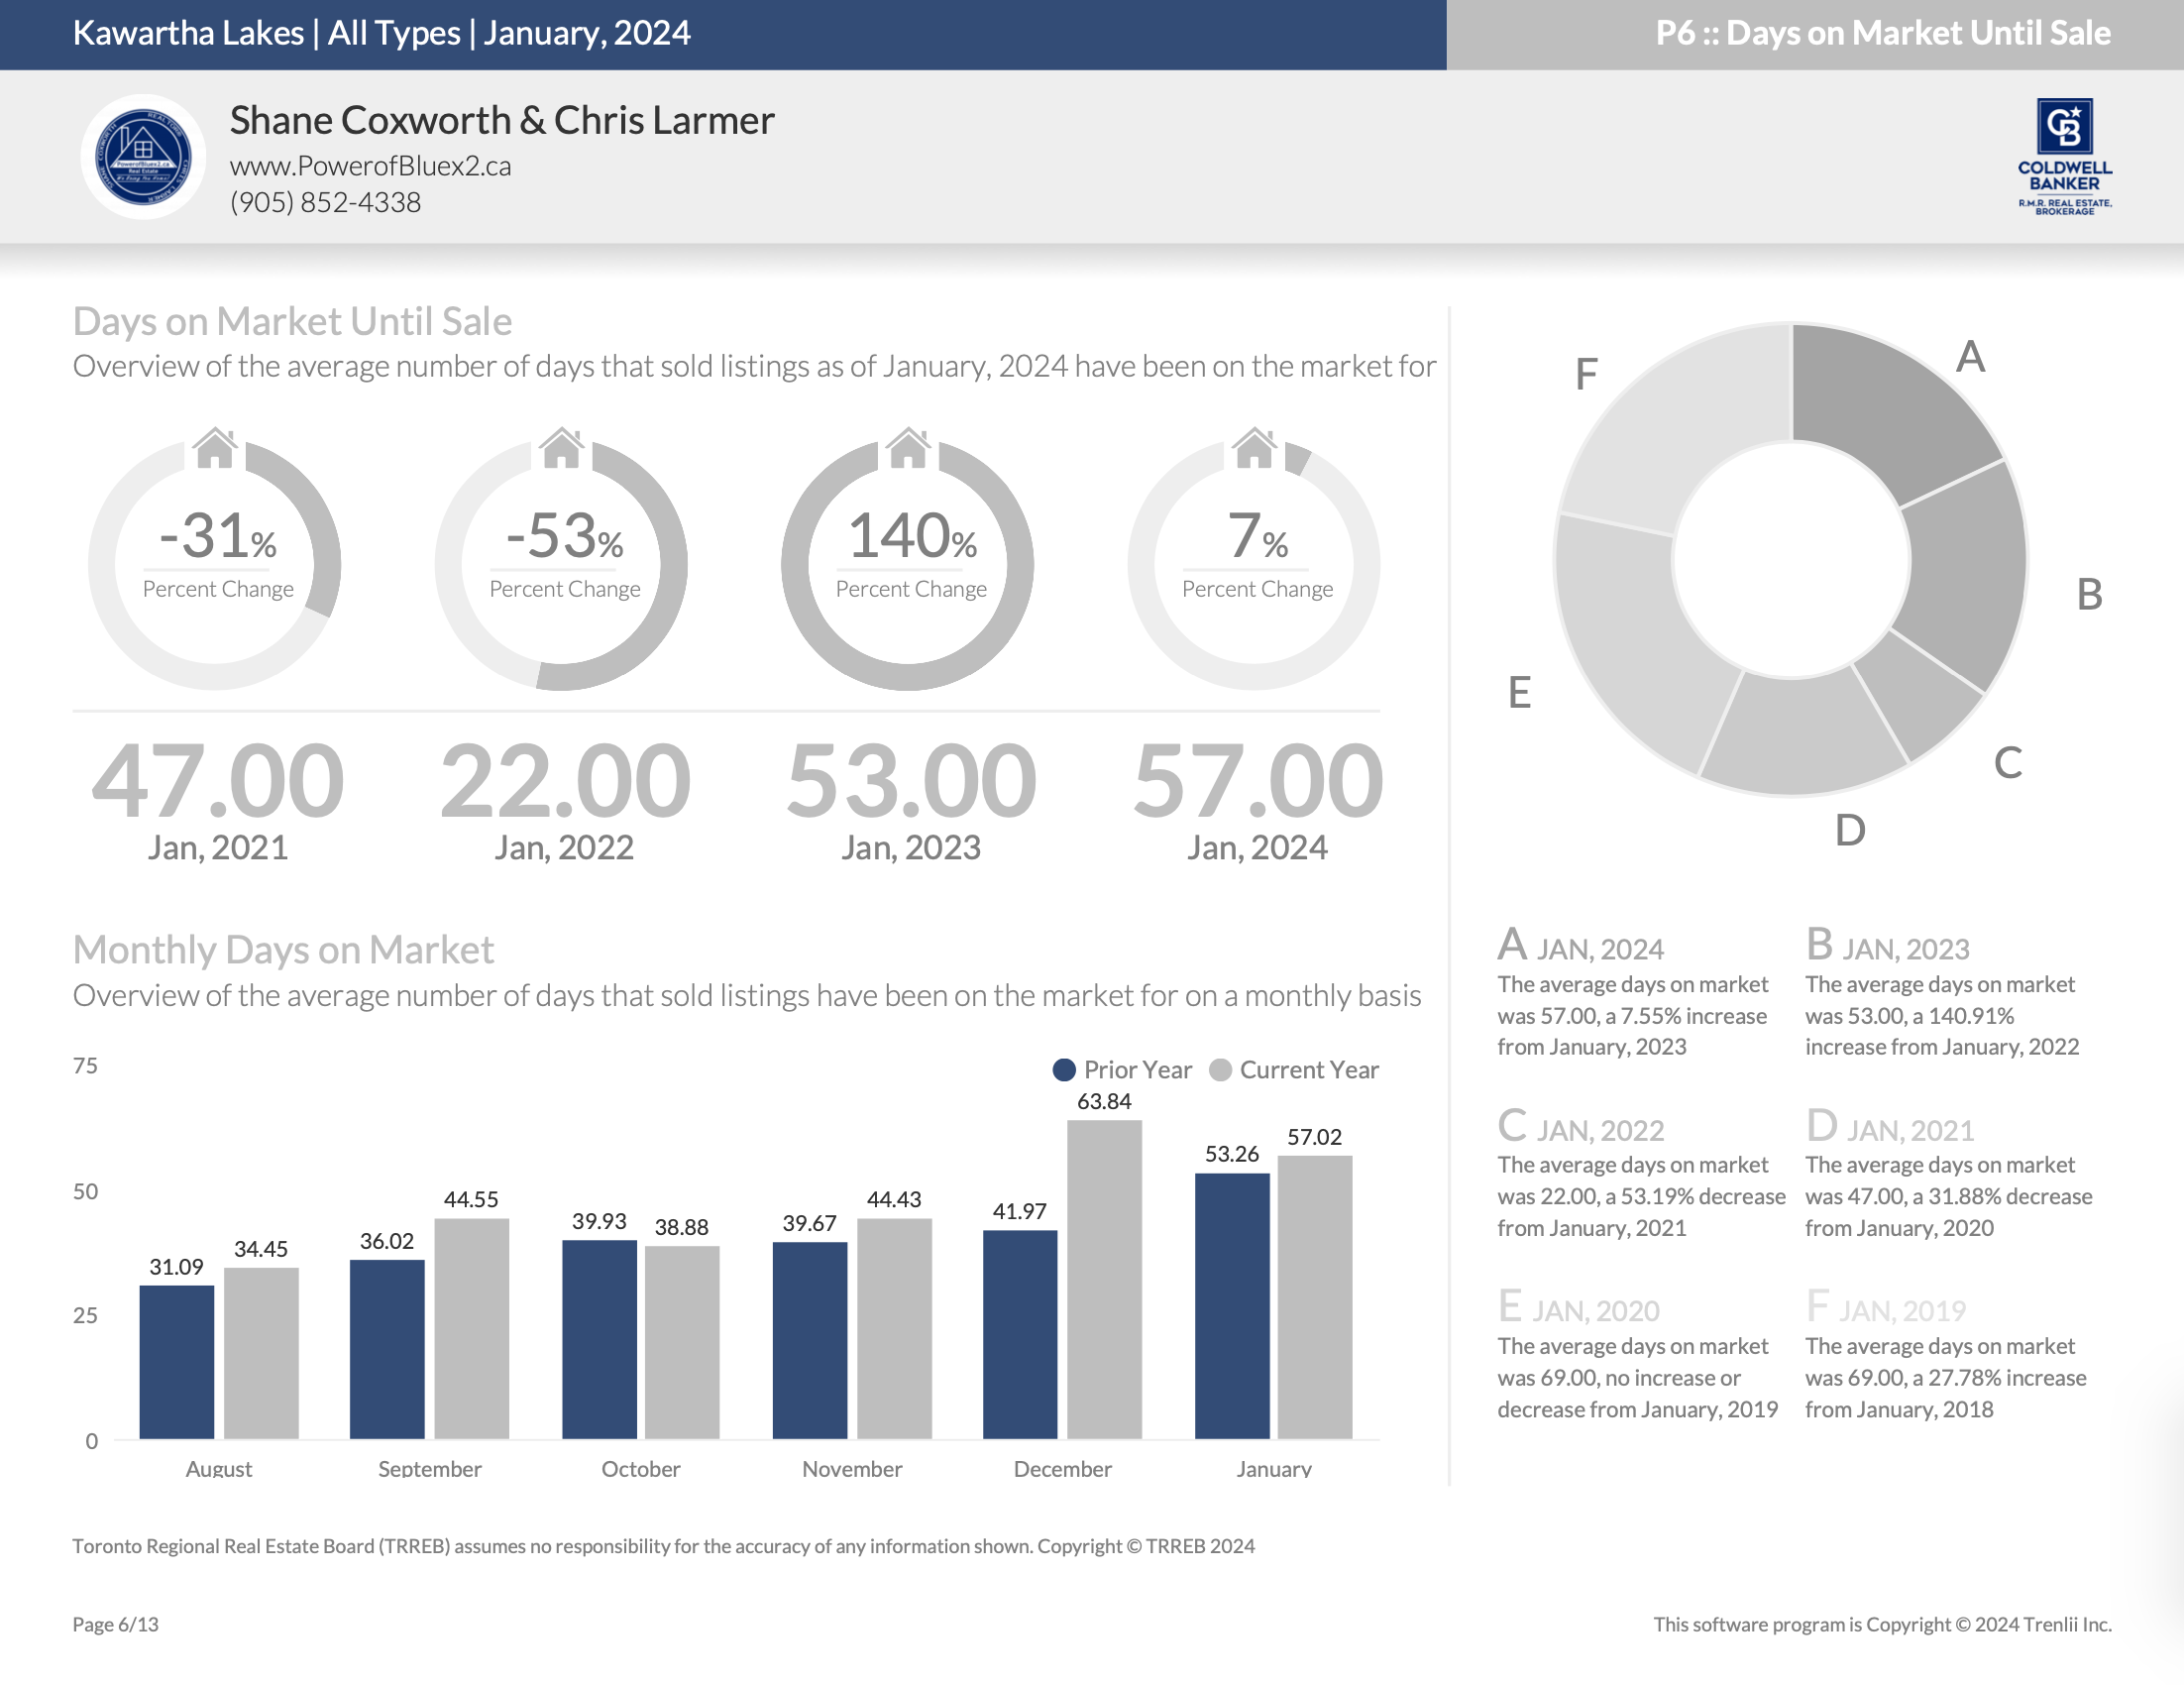
Days on Market – January 2024
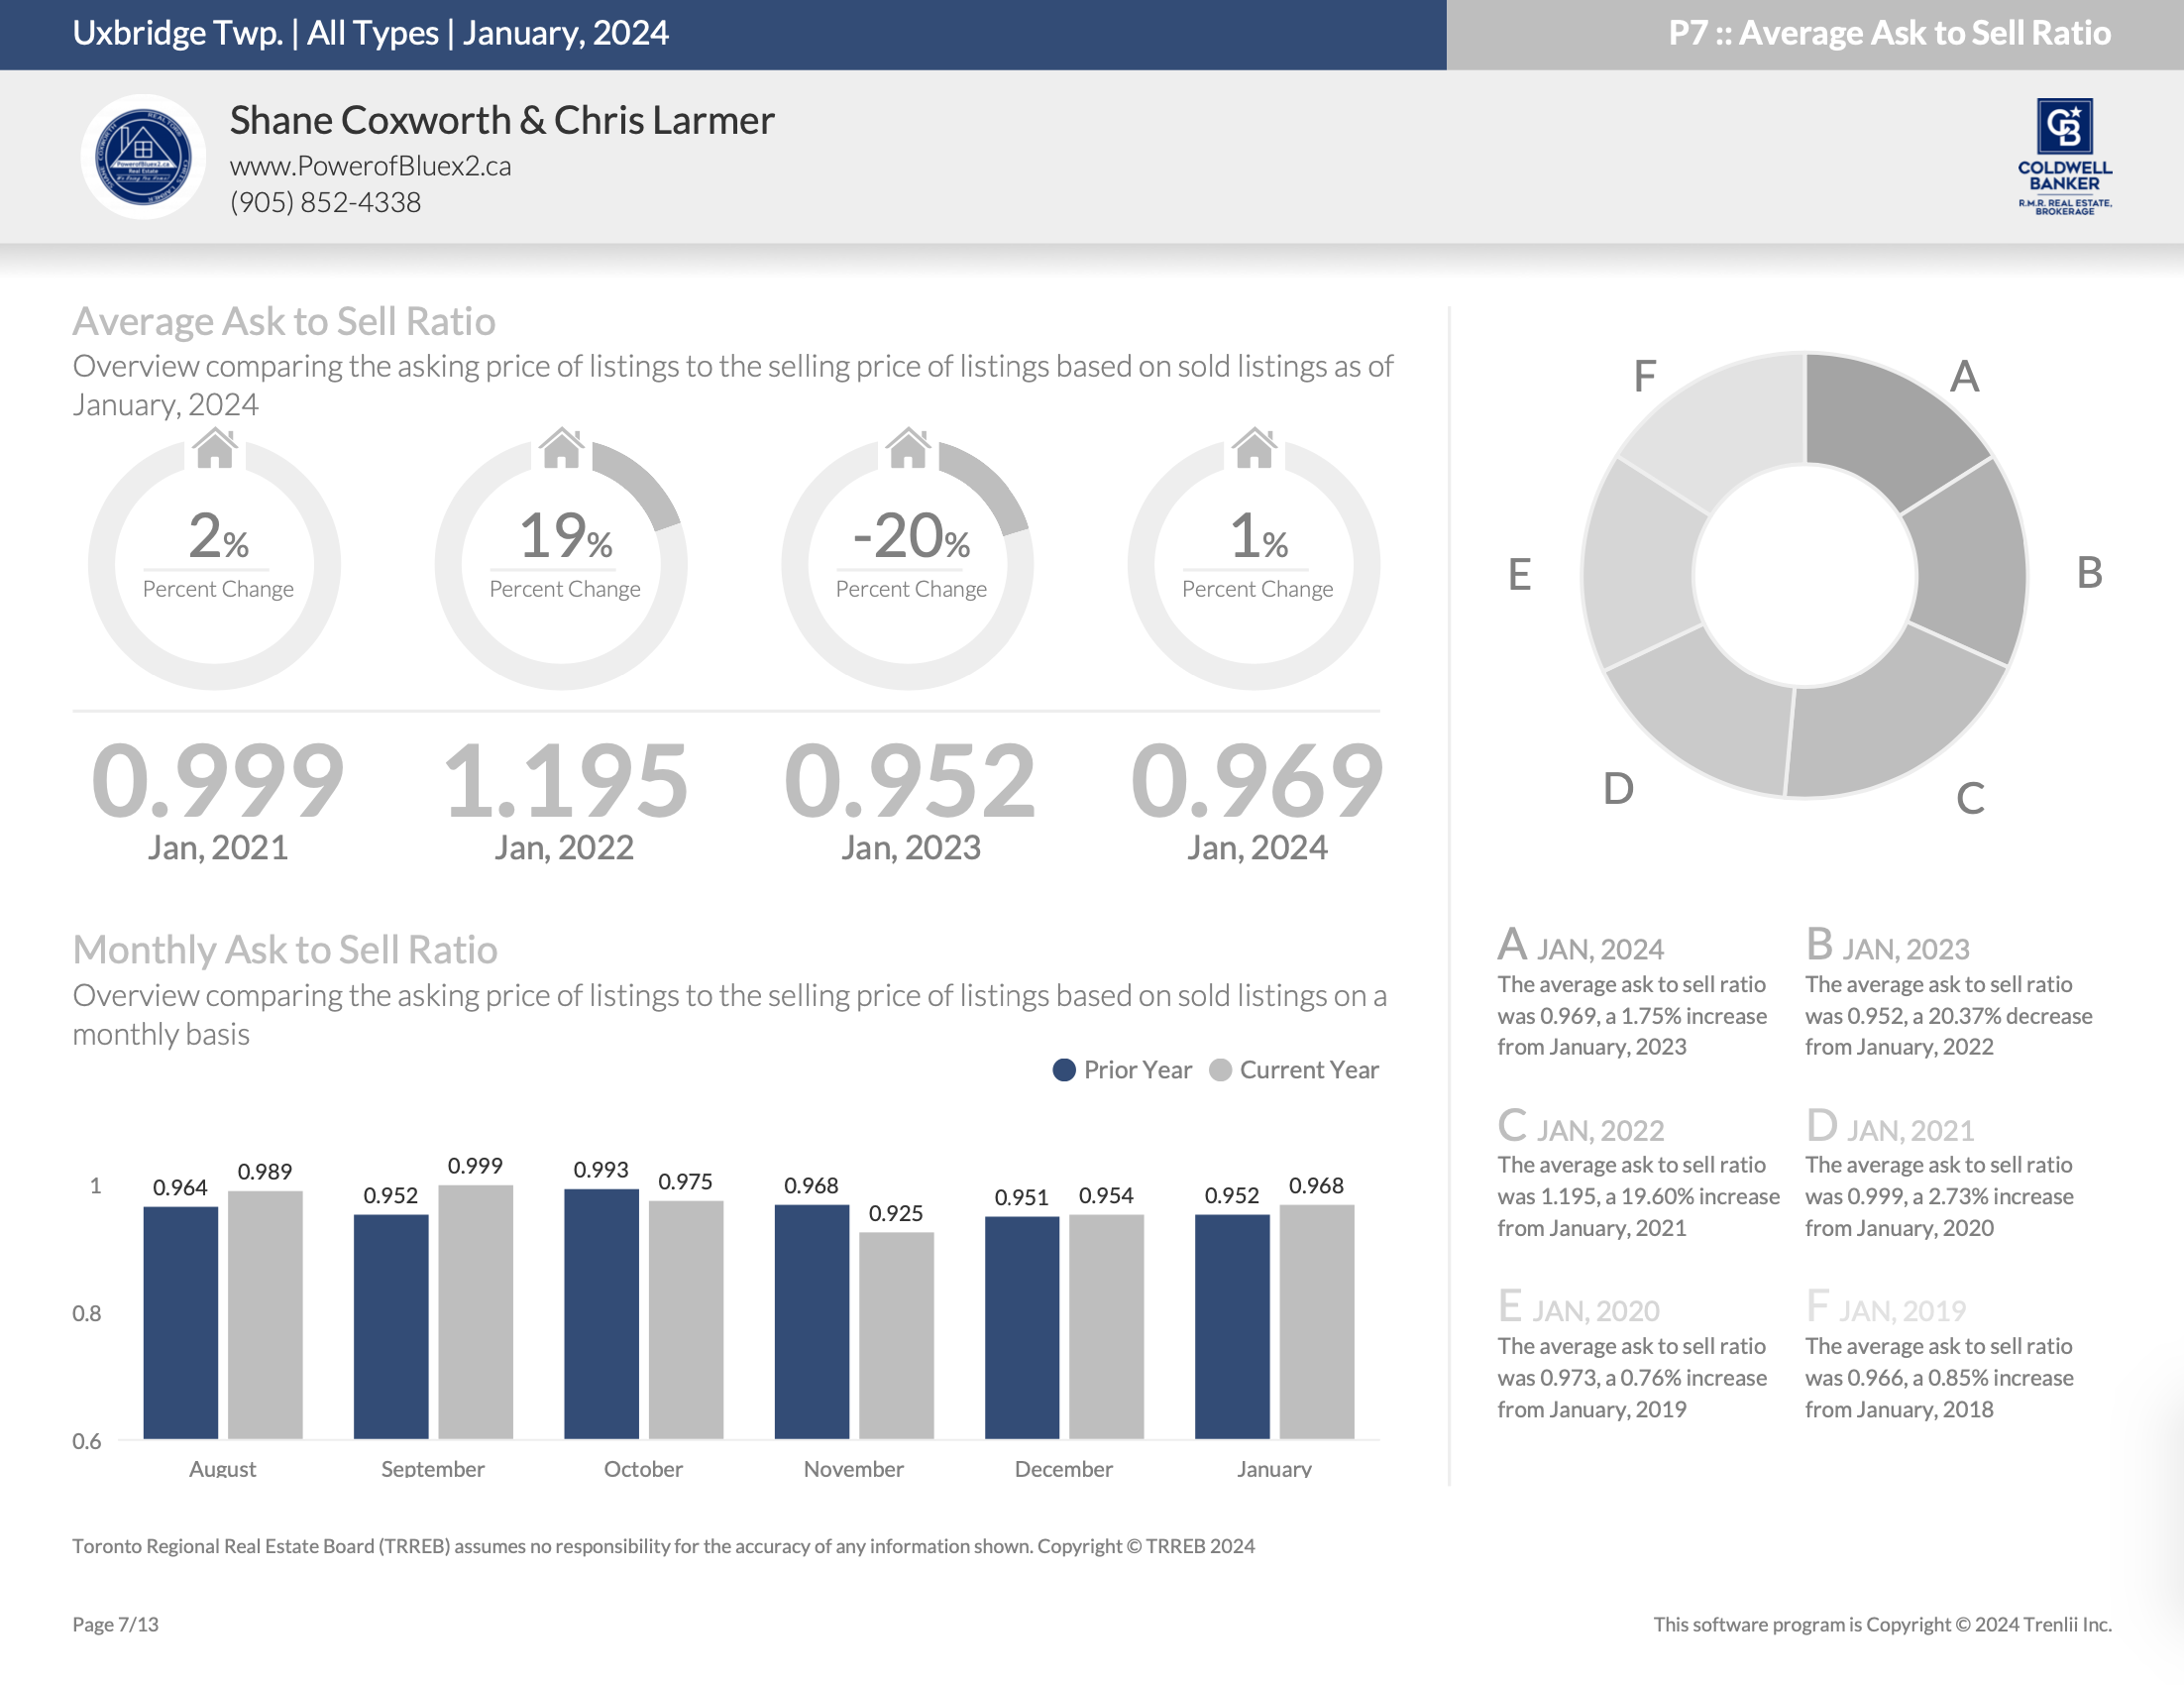
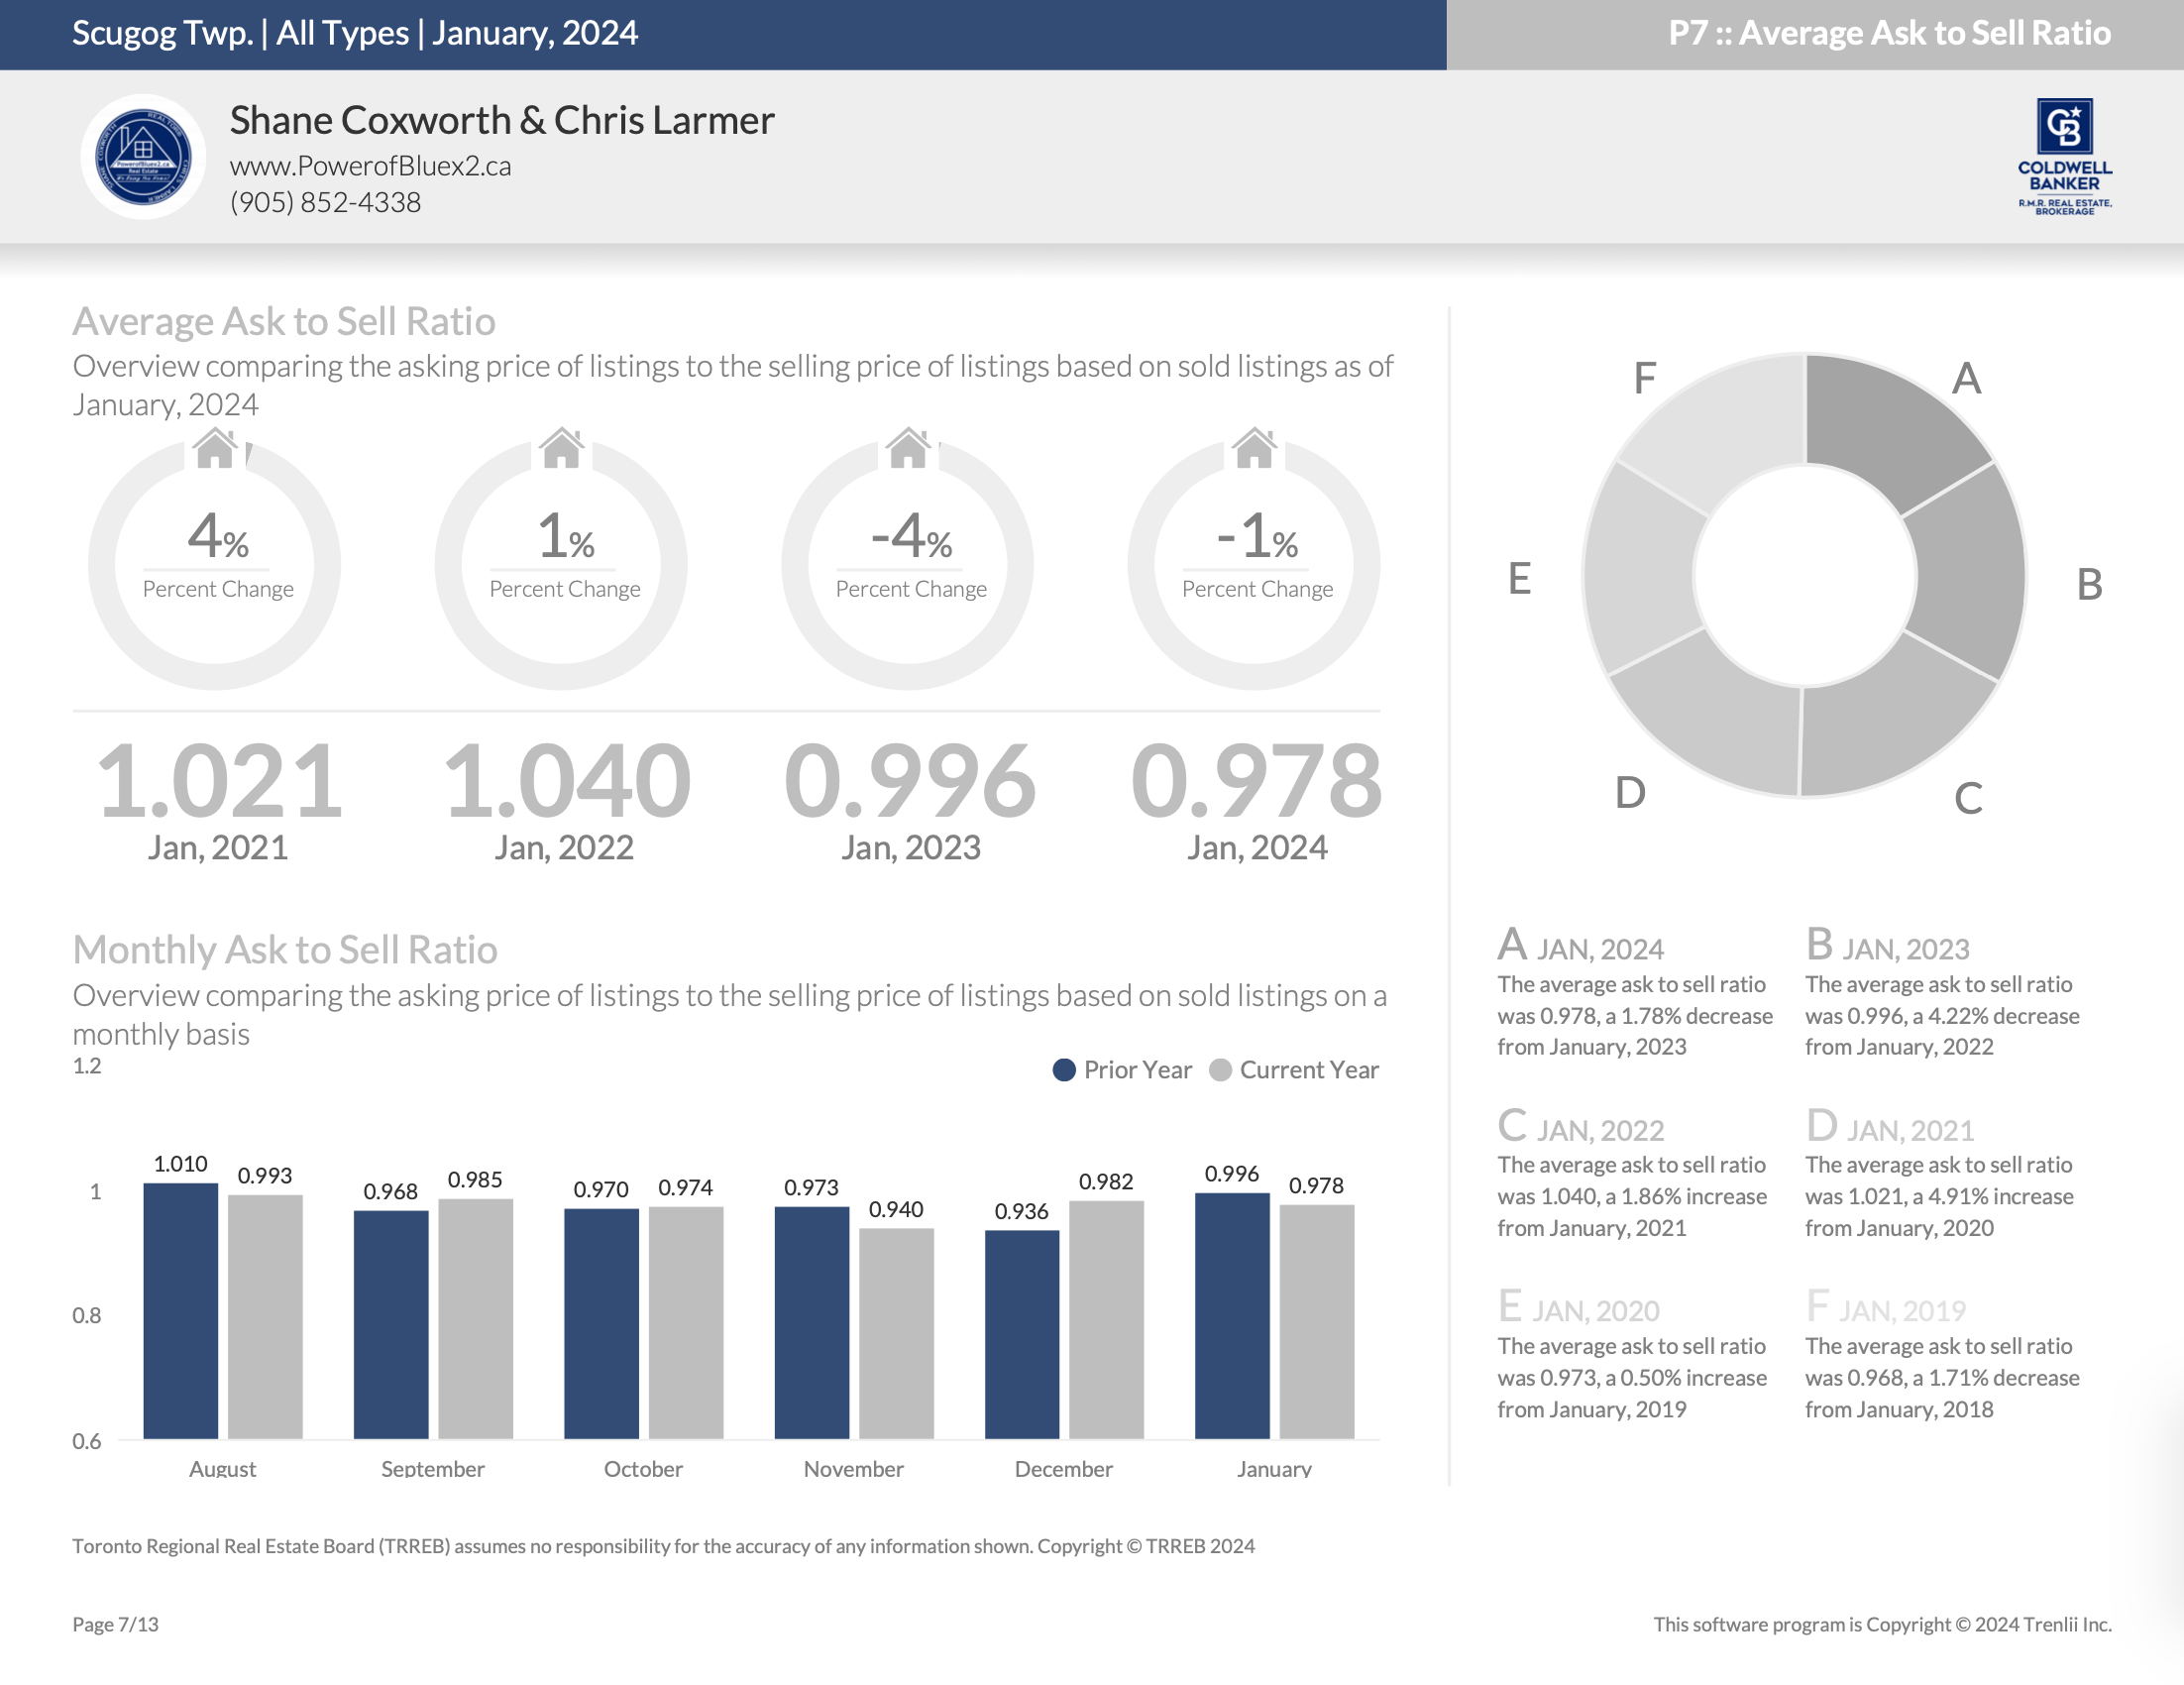
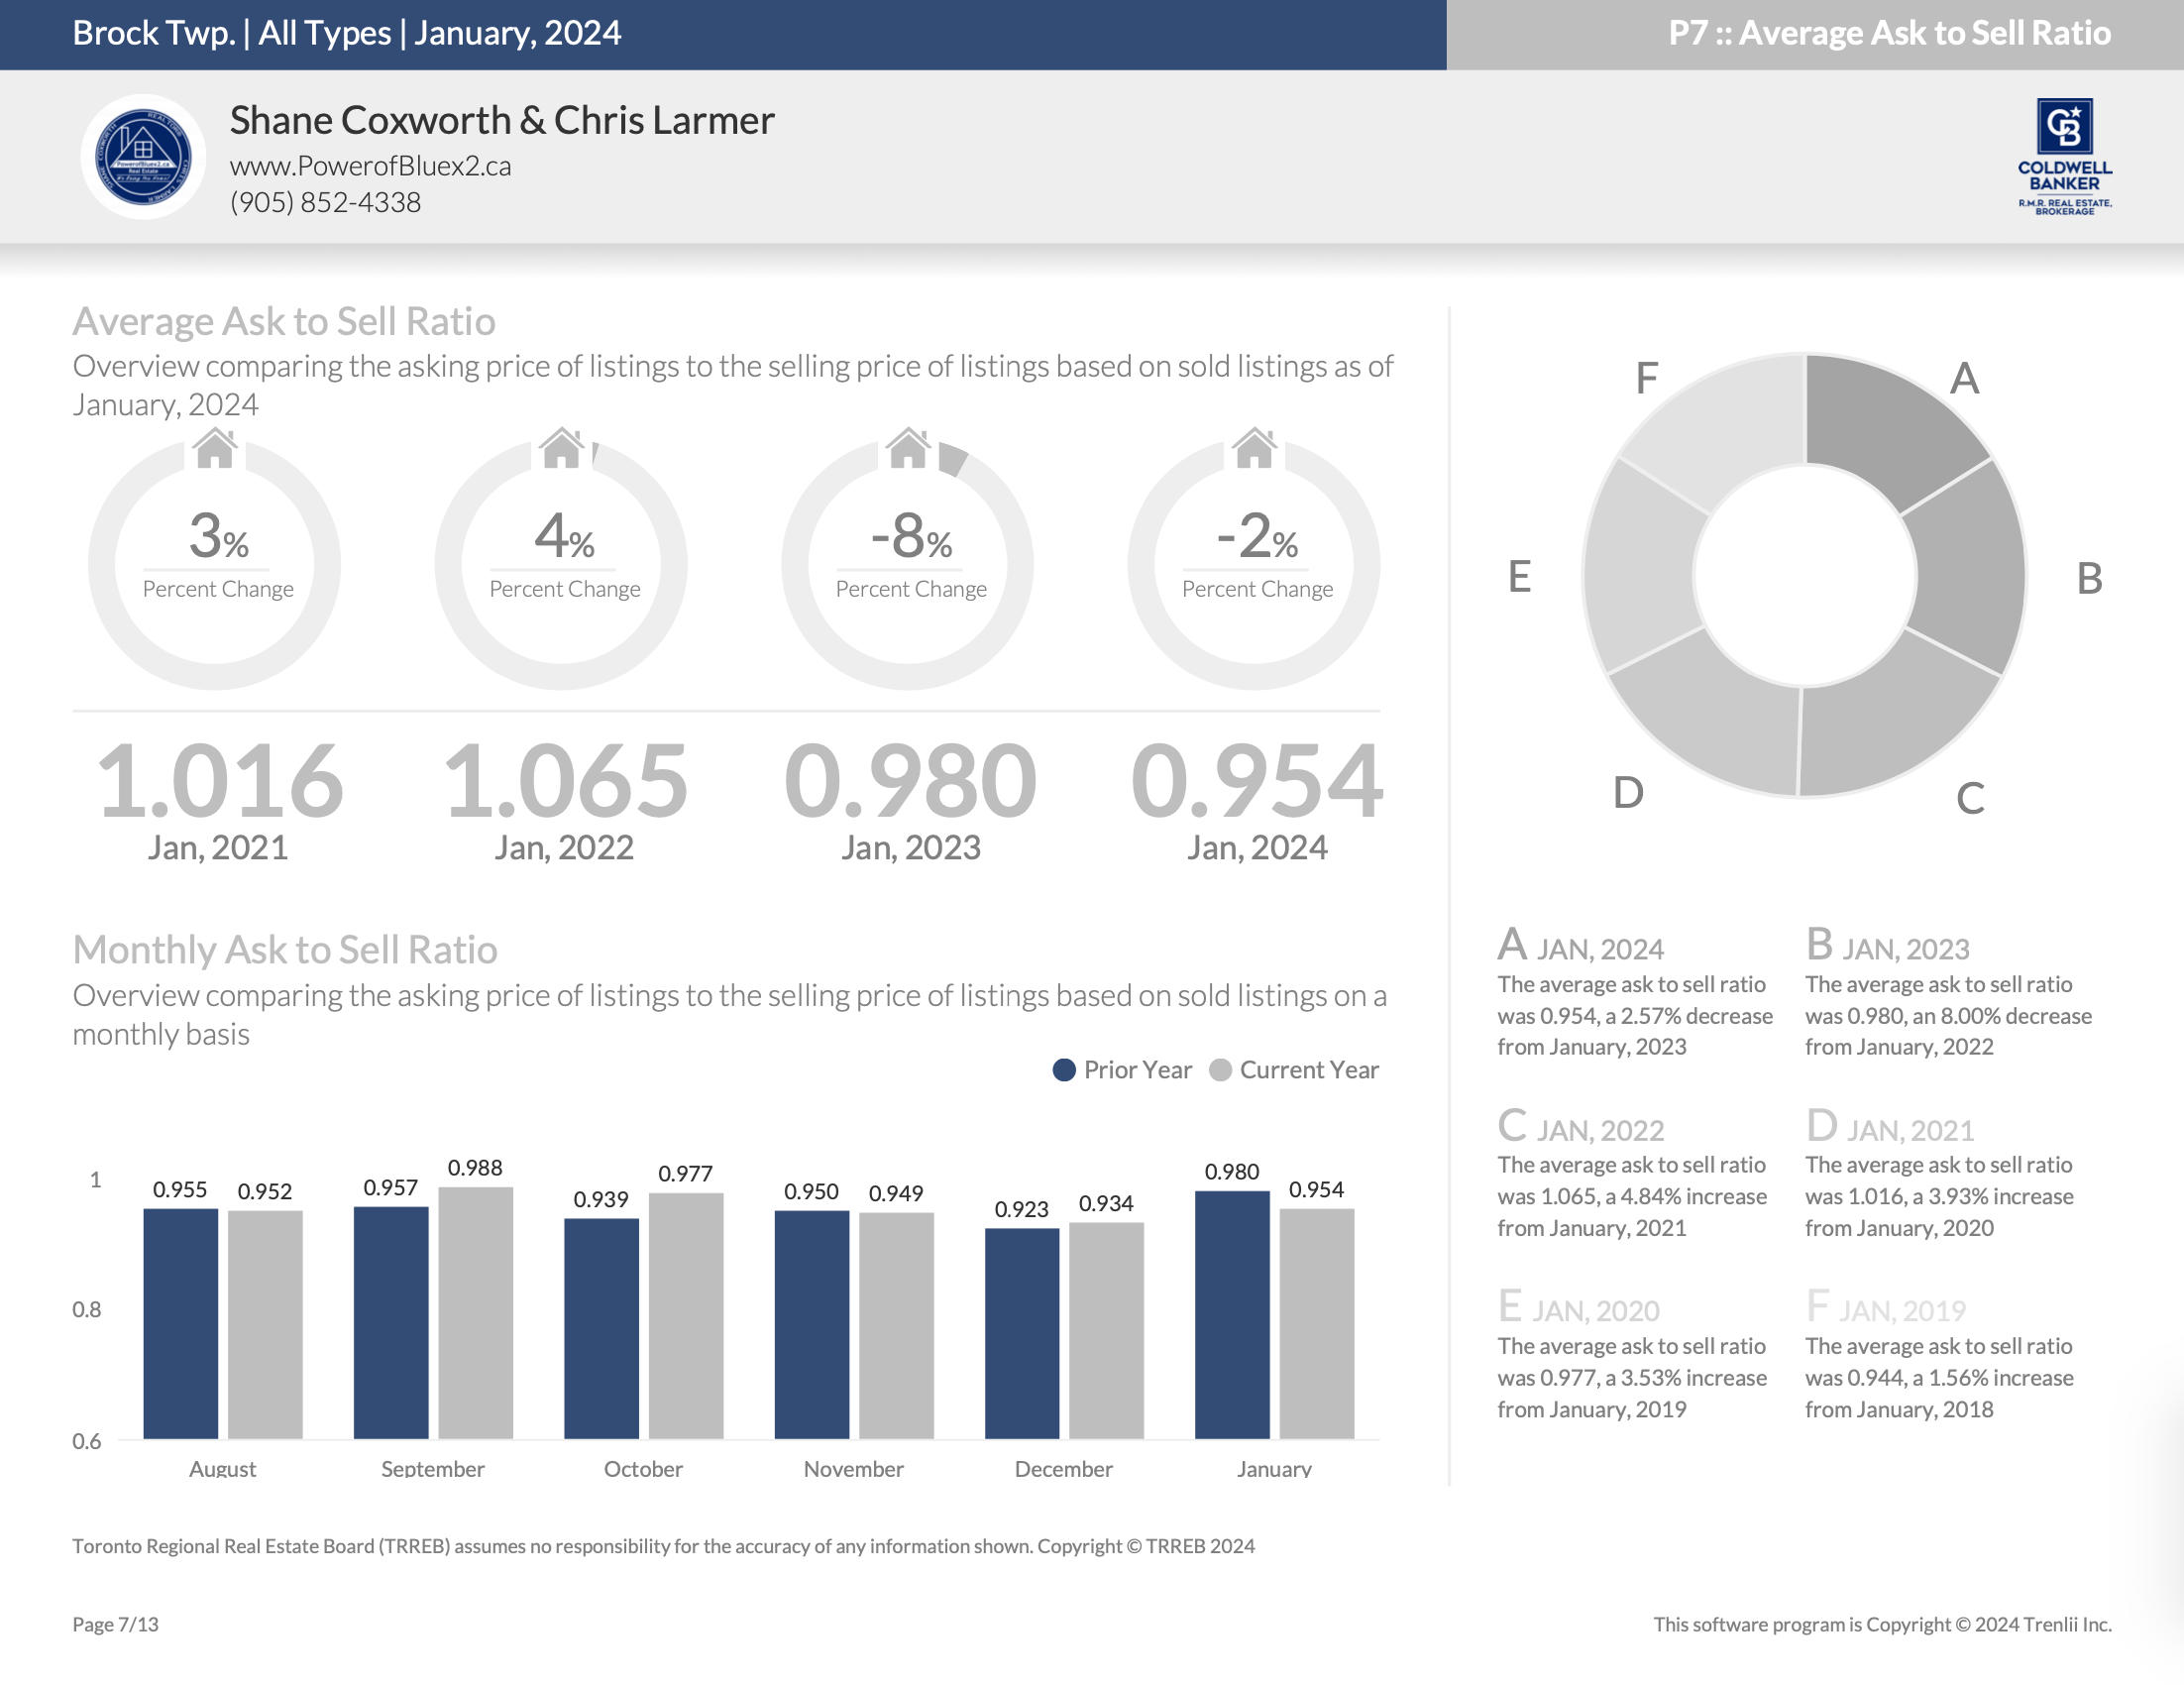
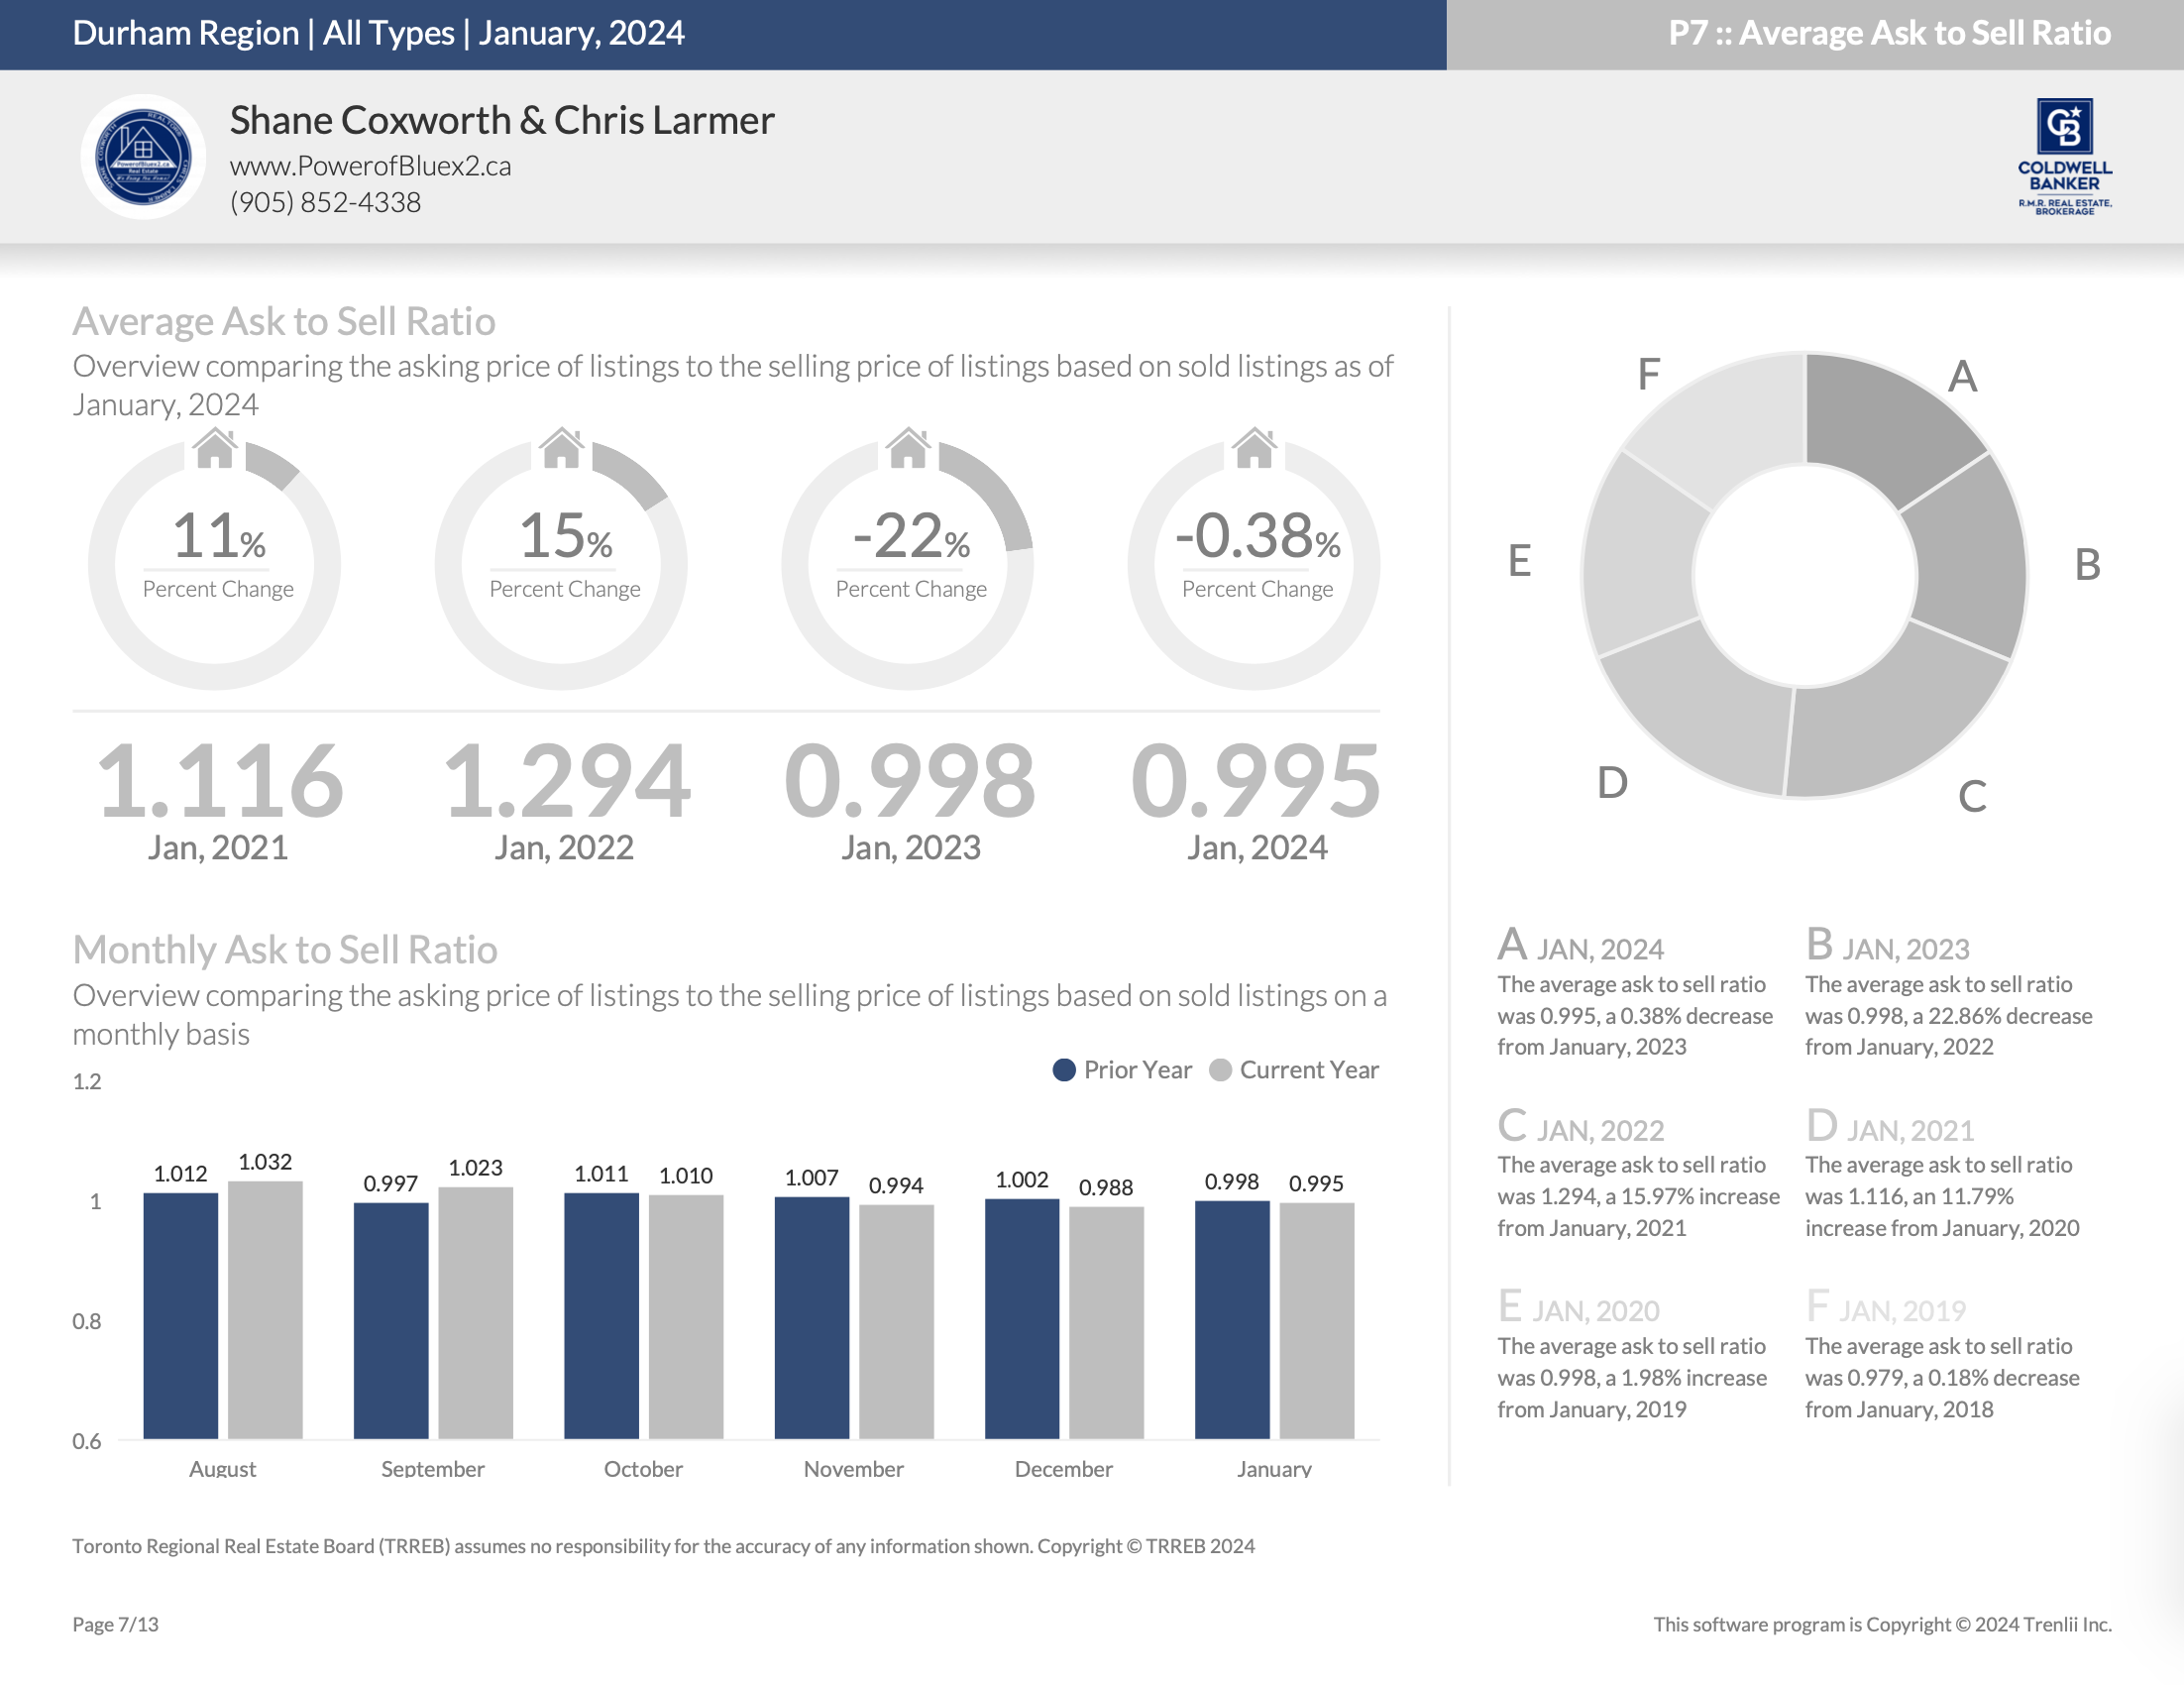
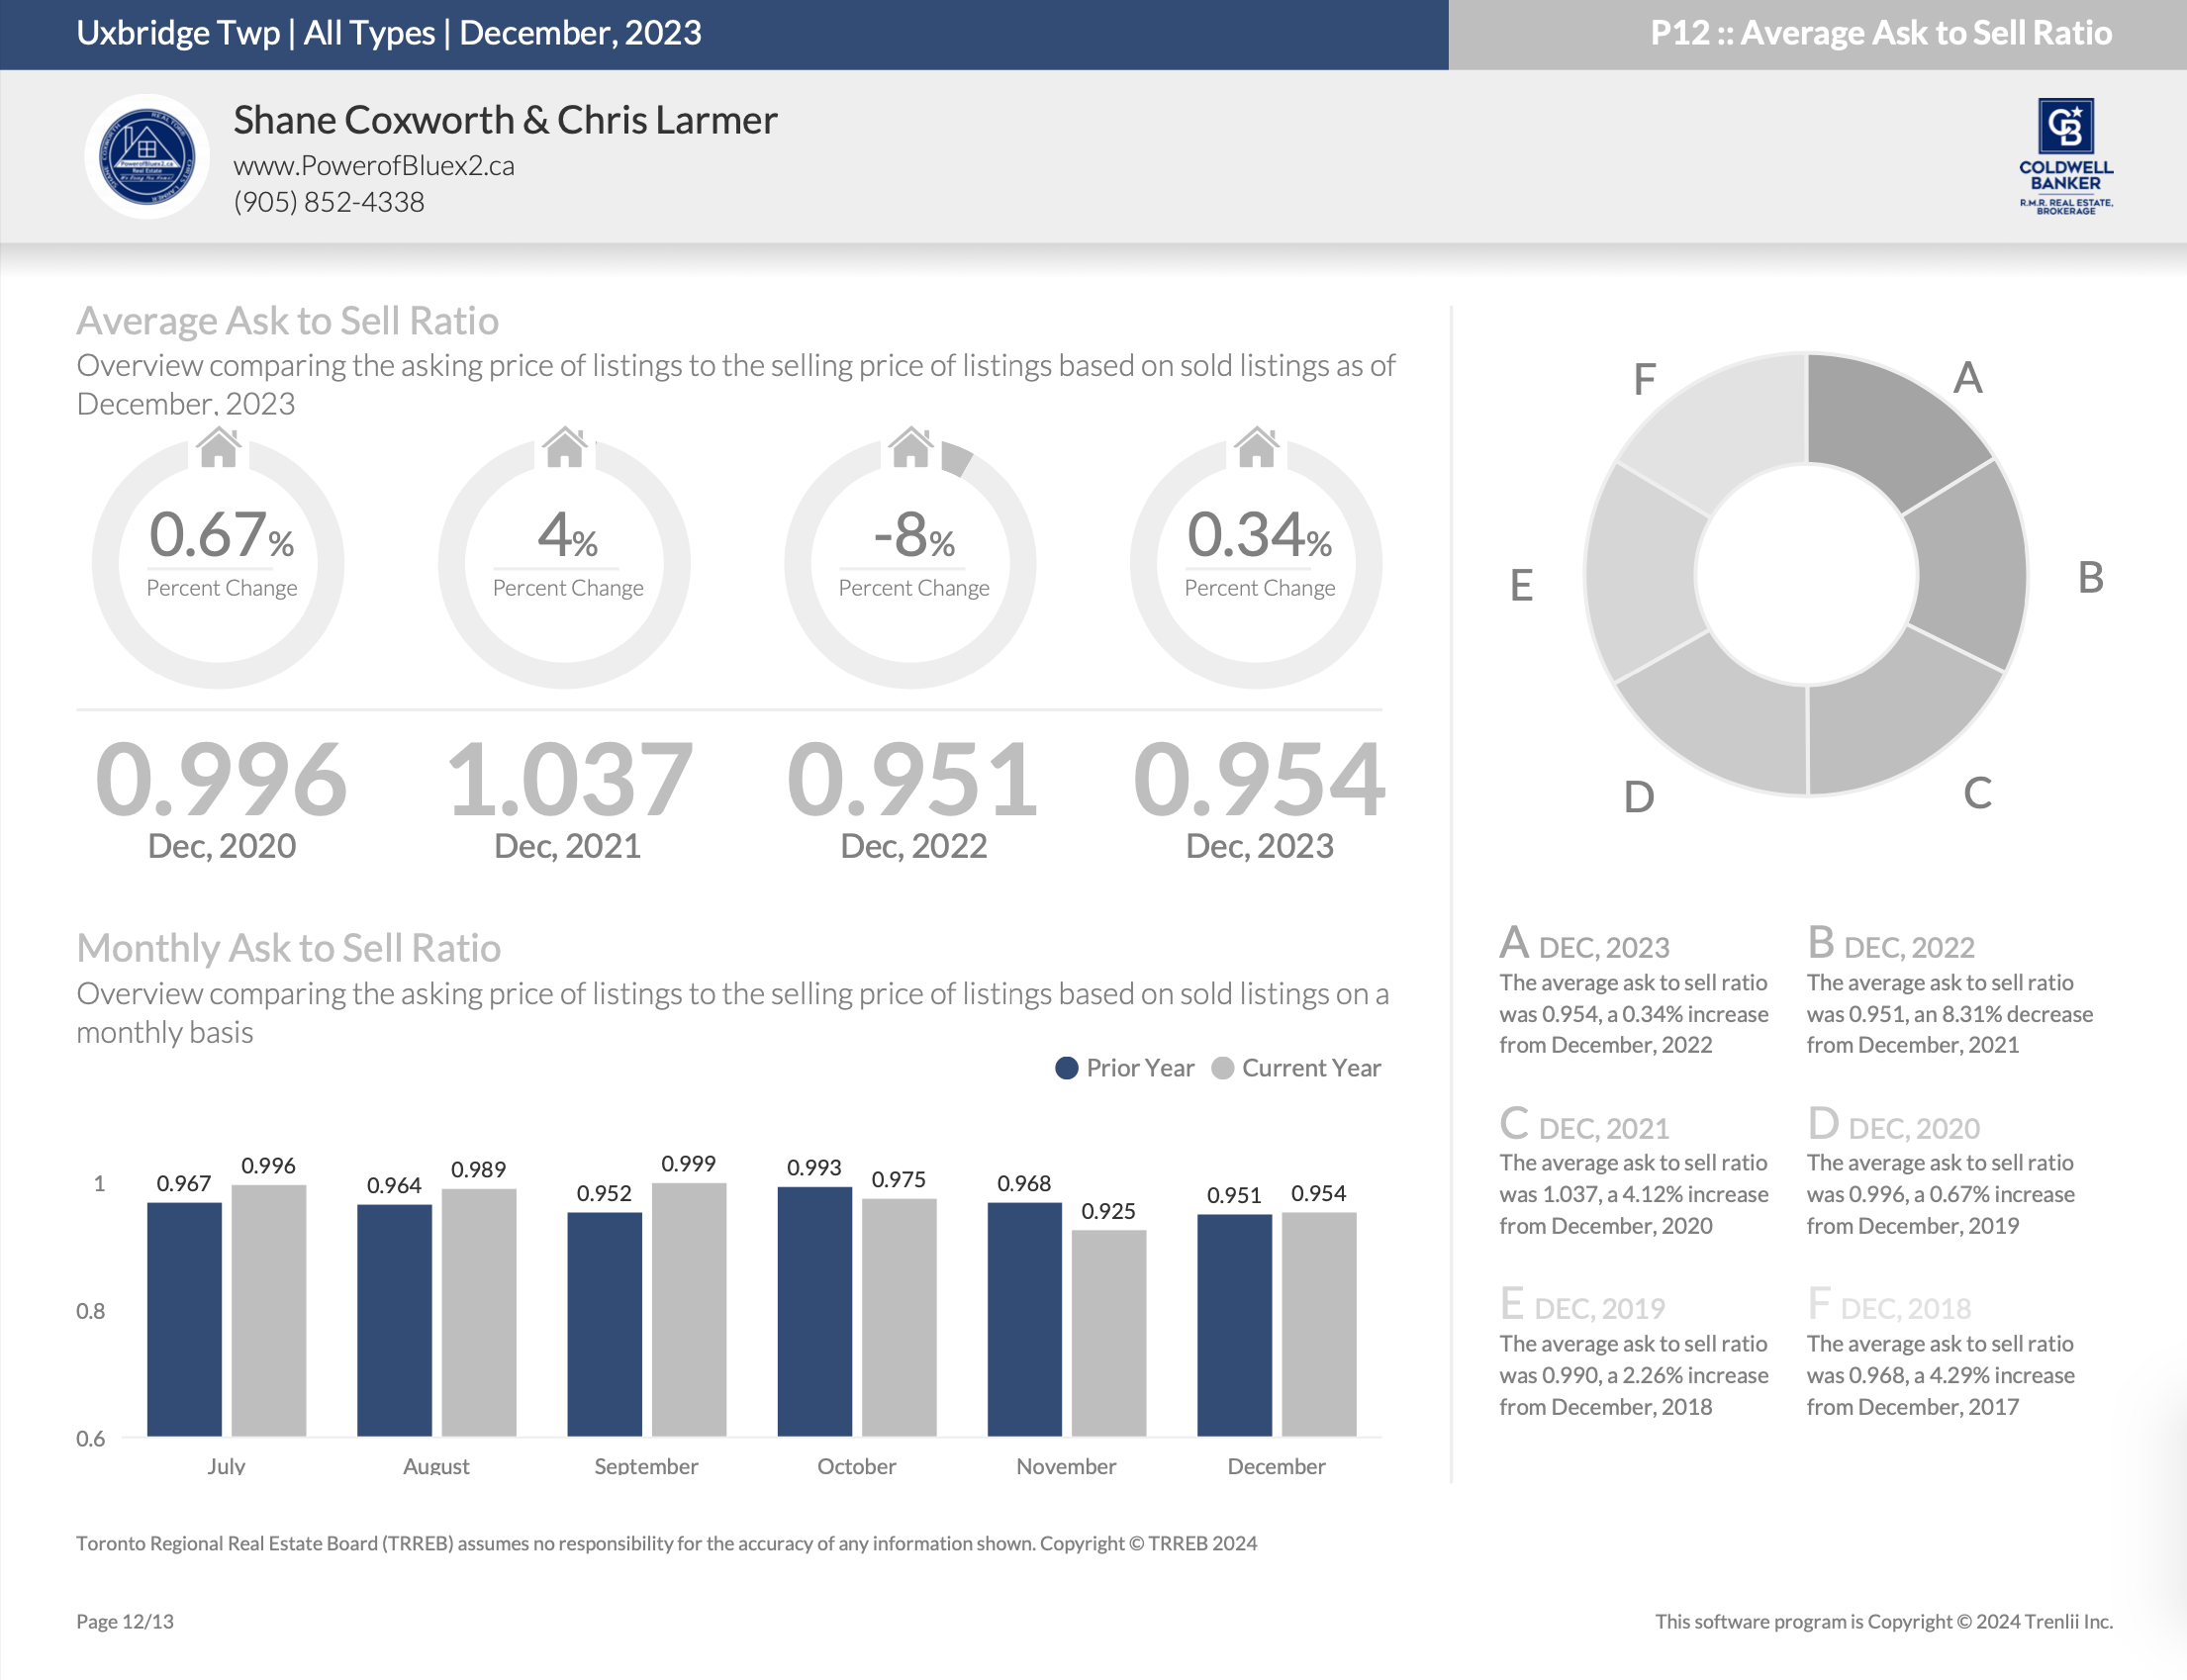
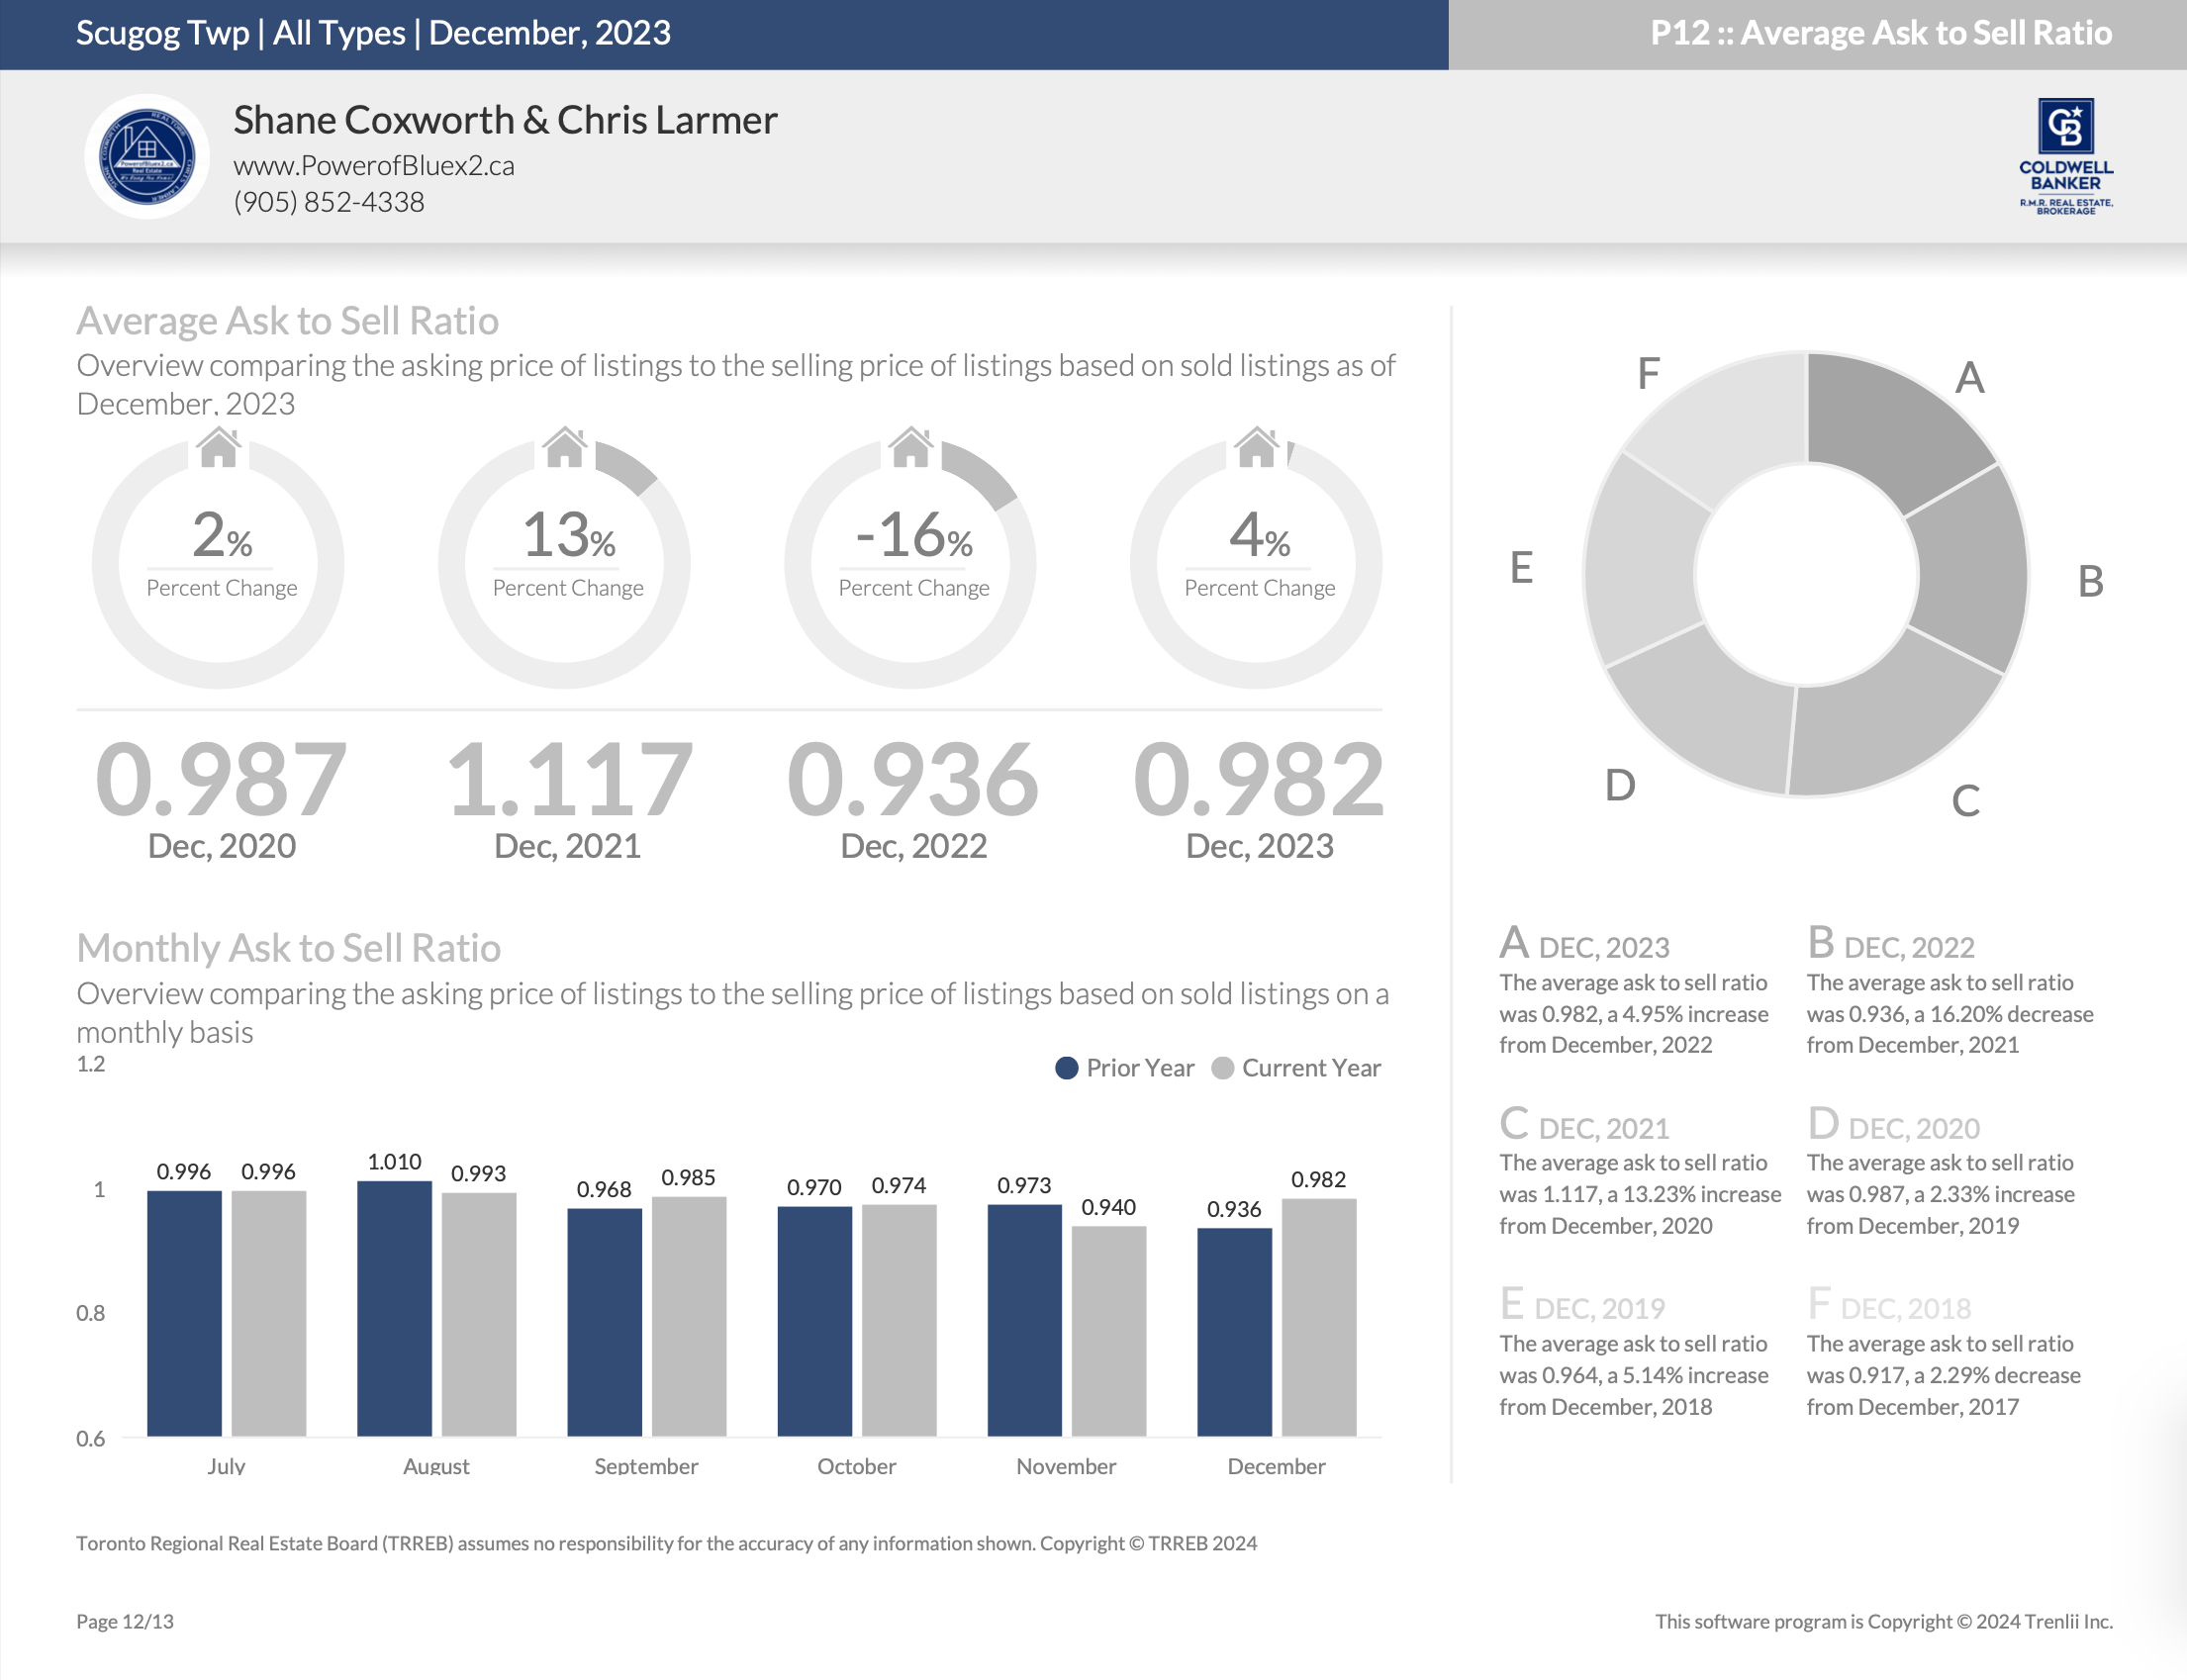
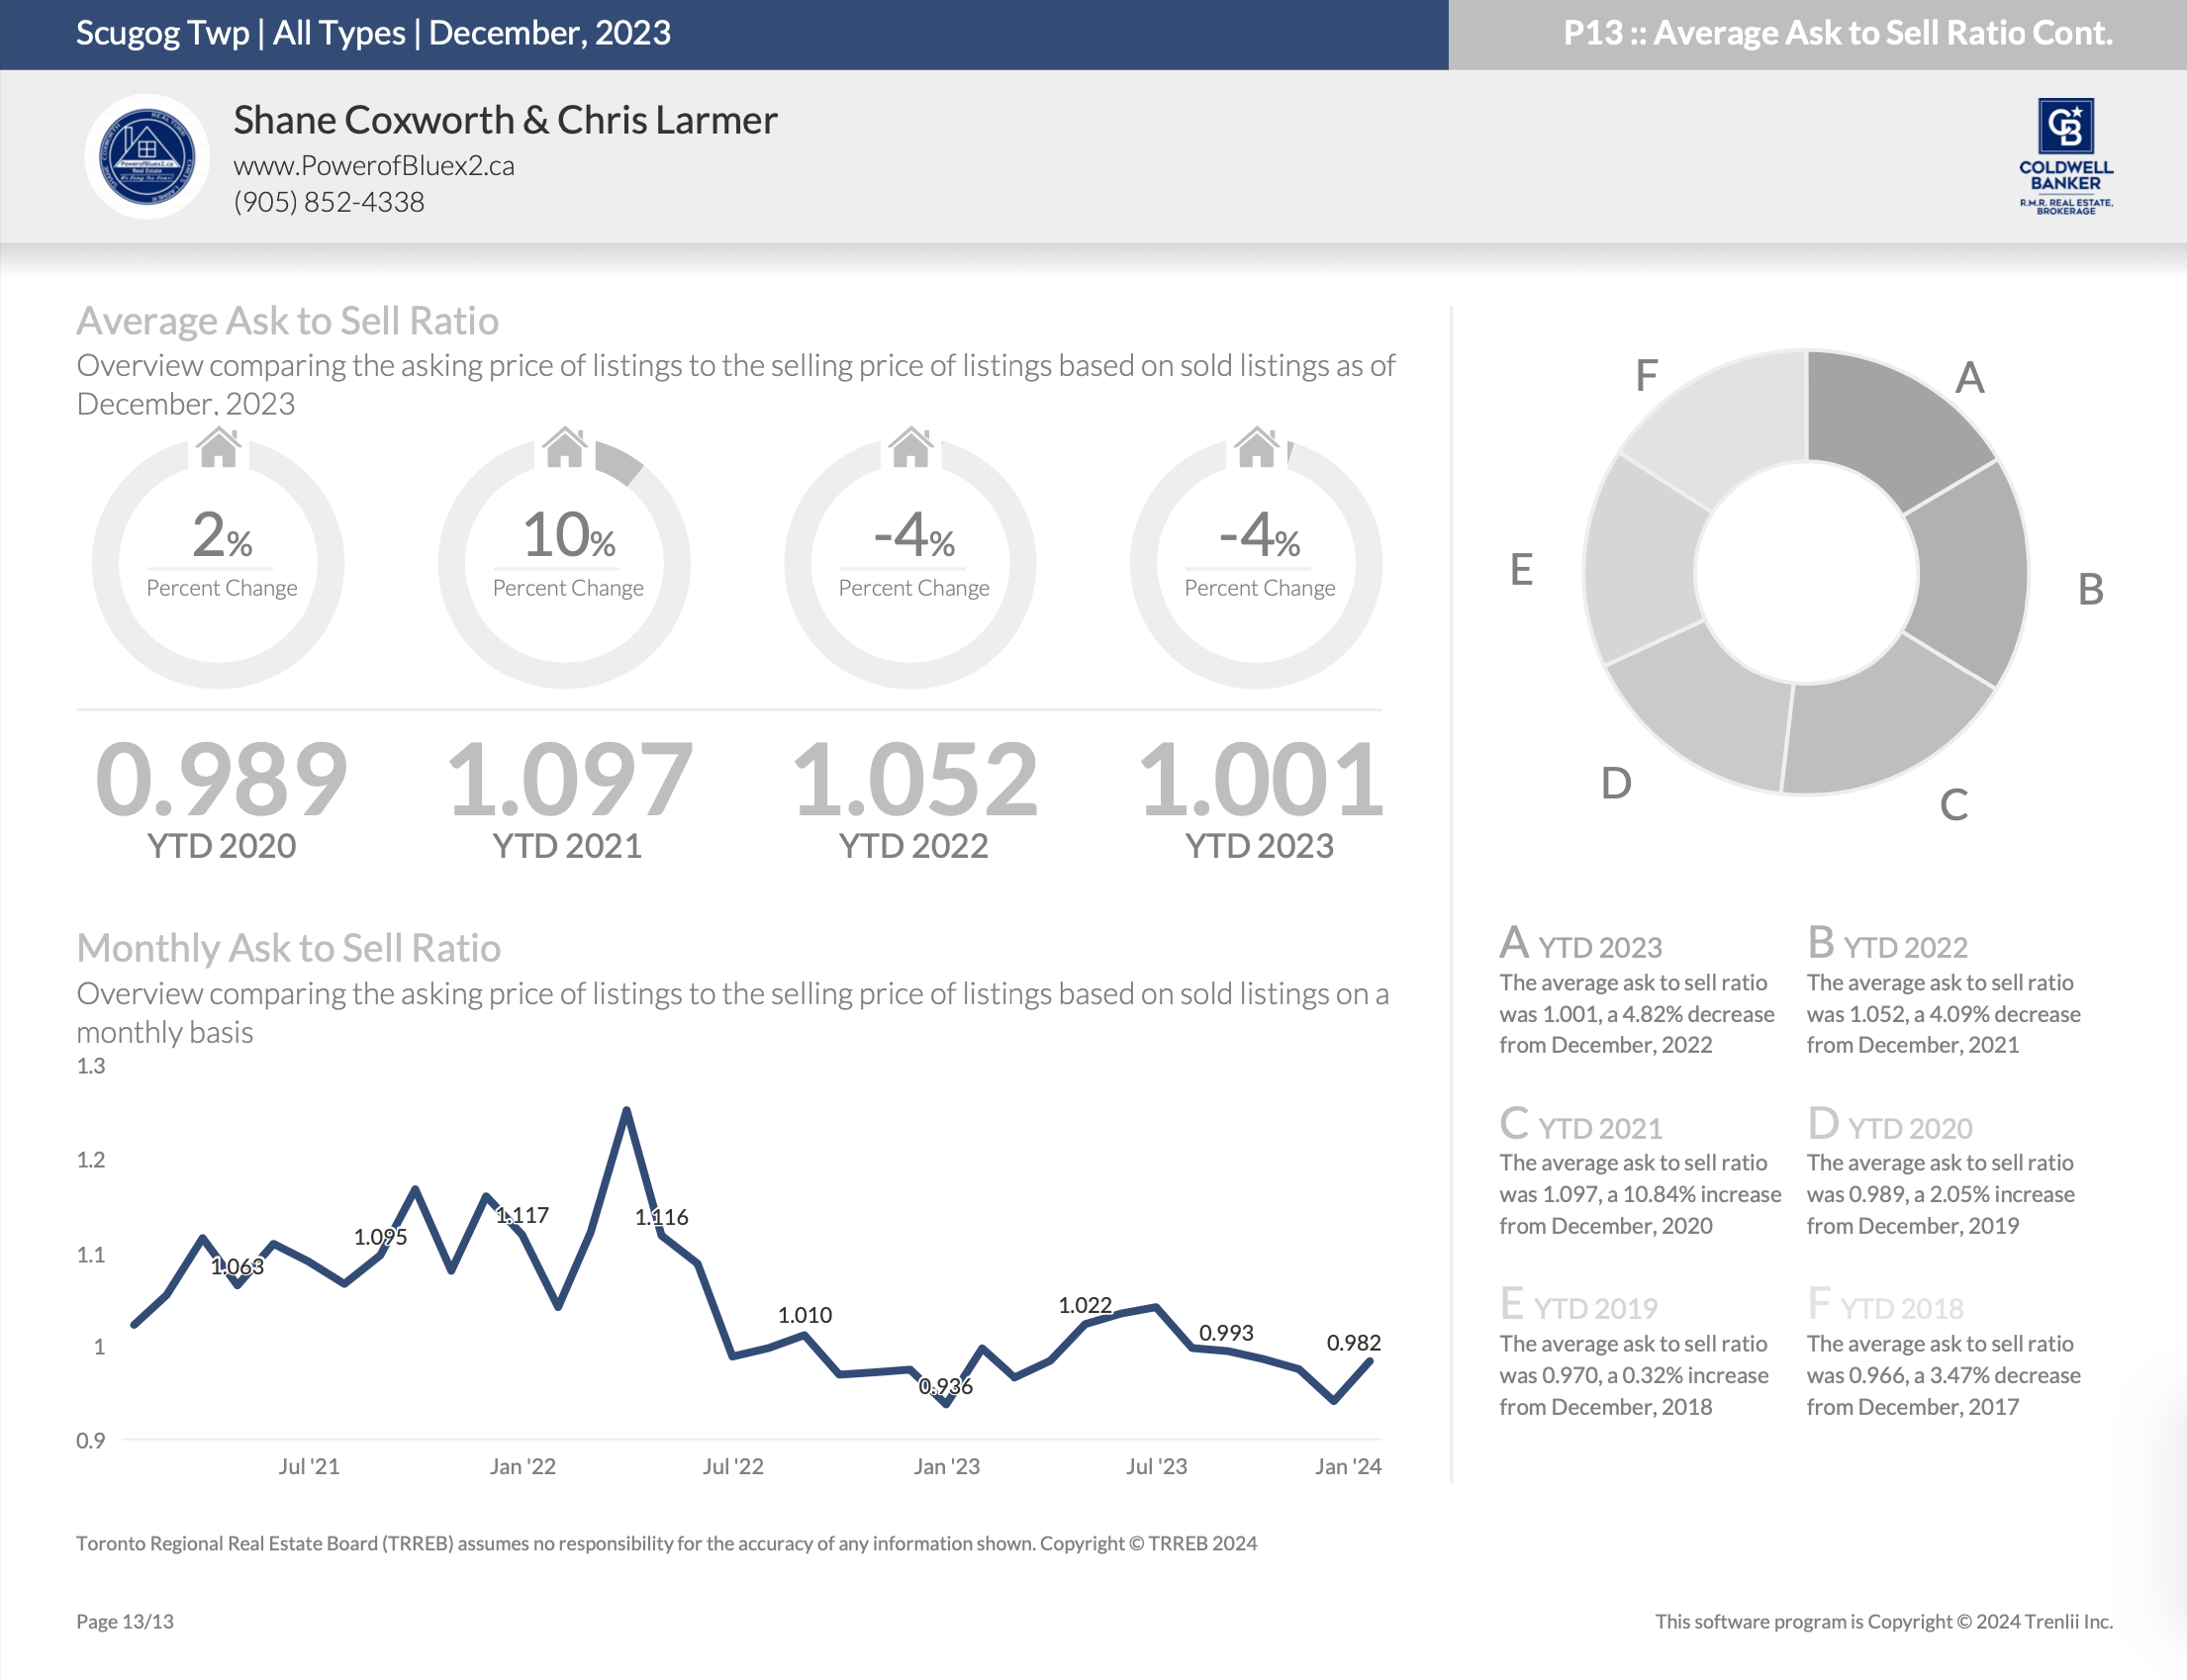
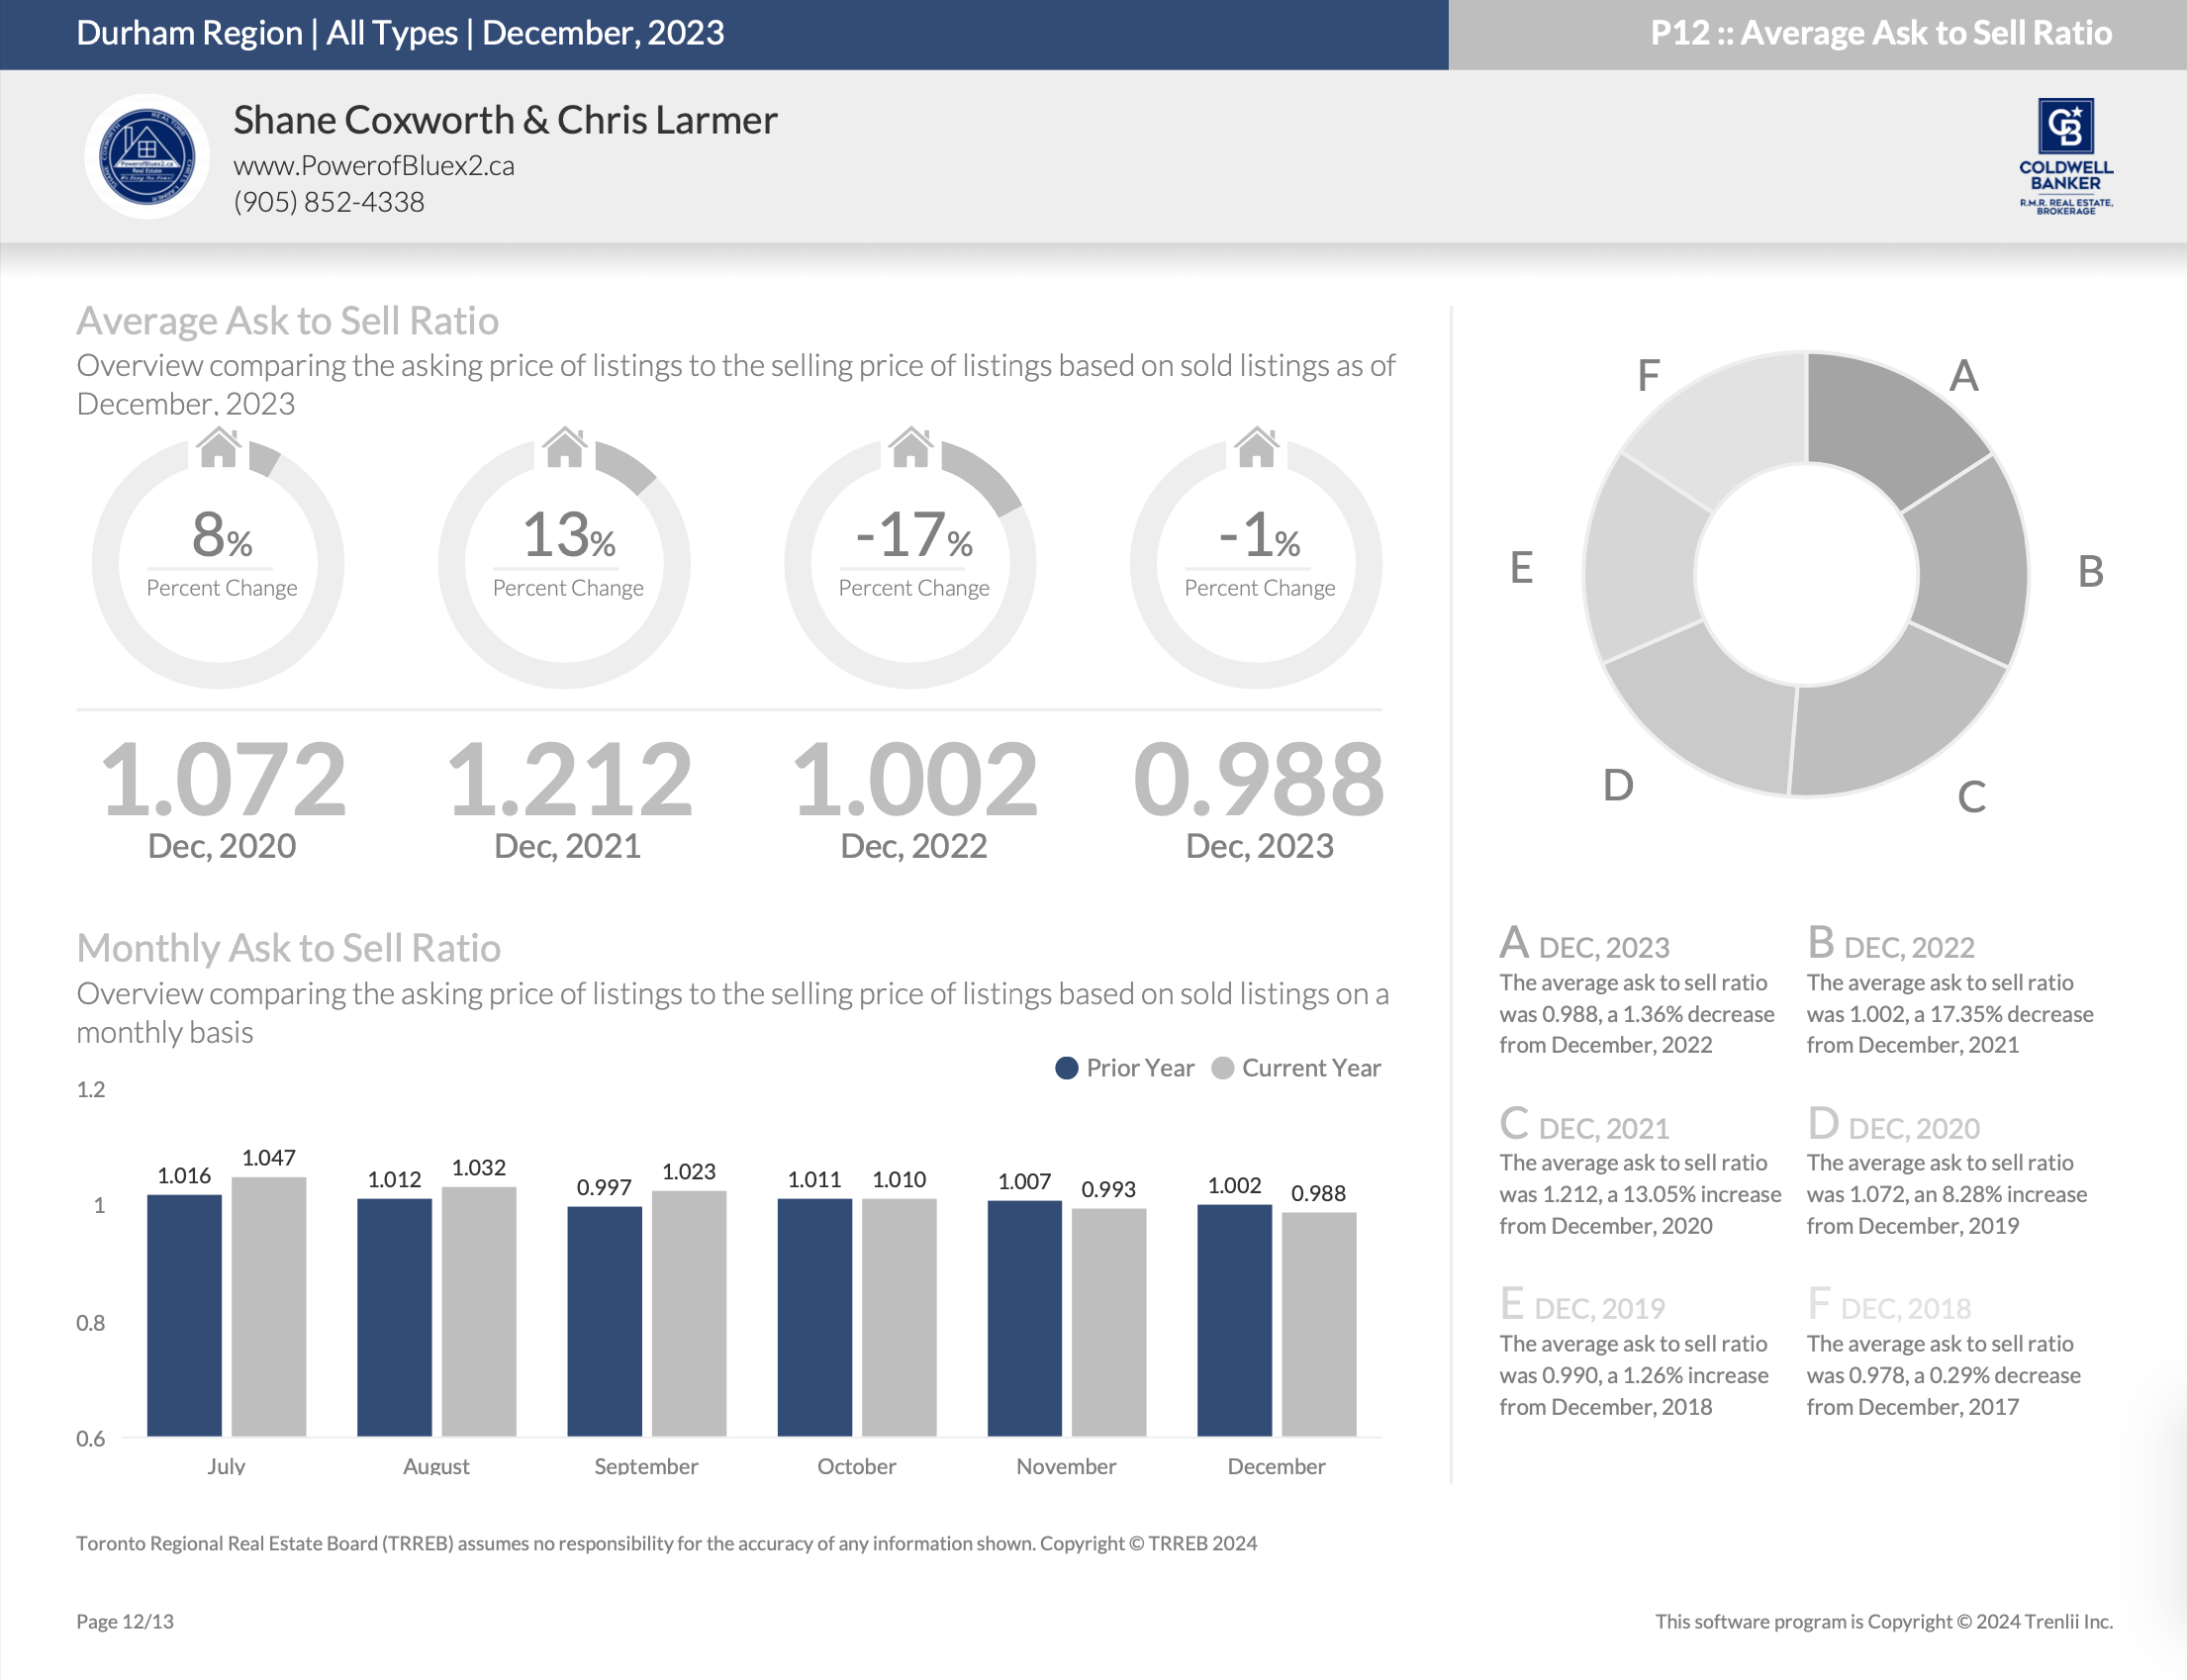
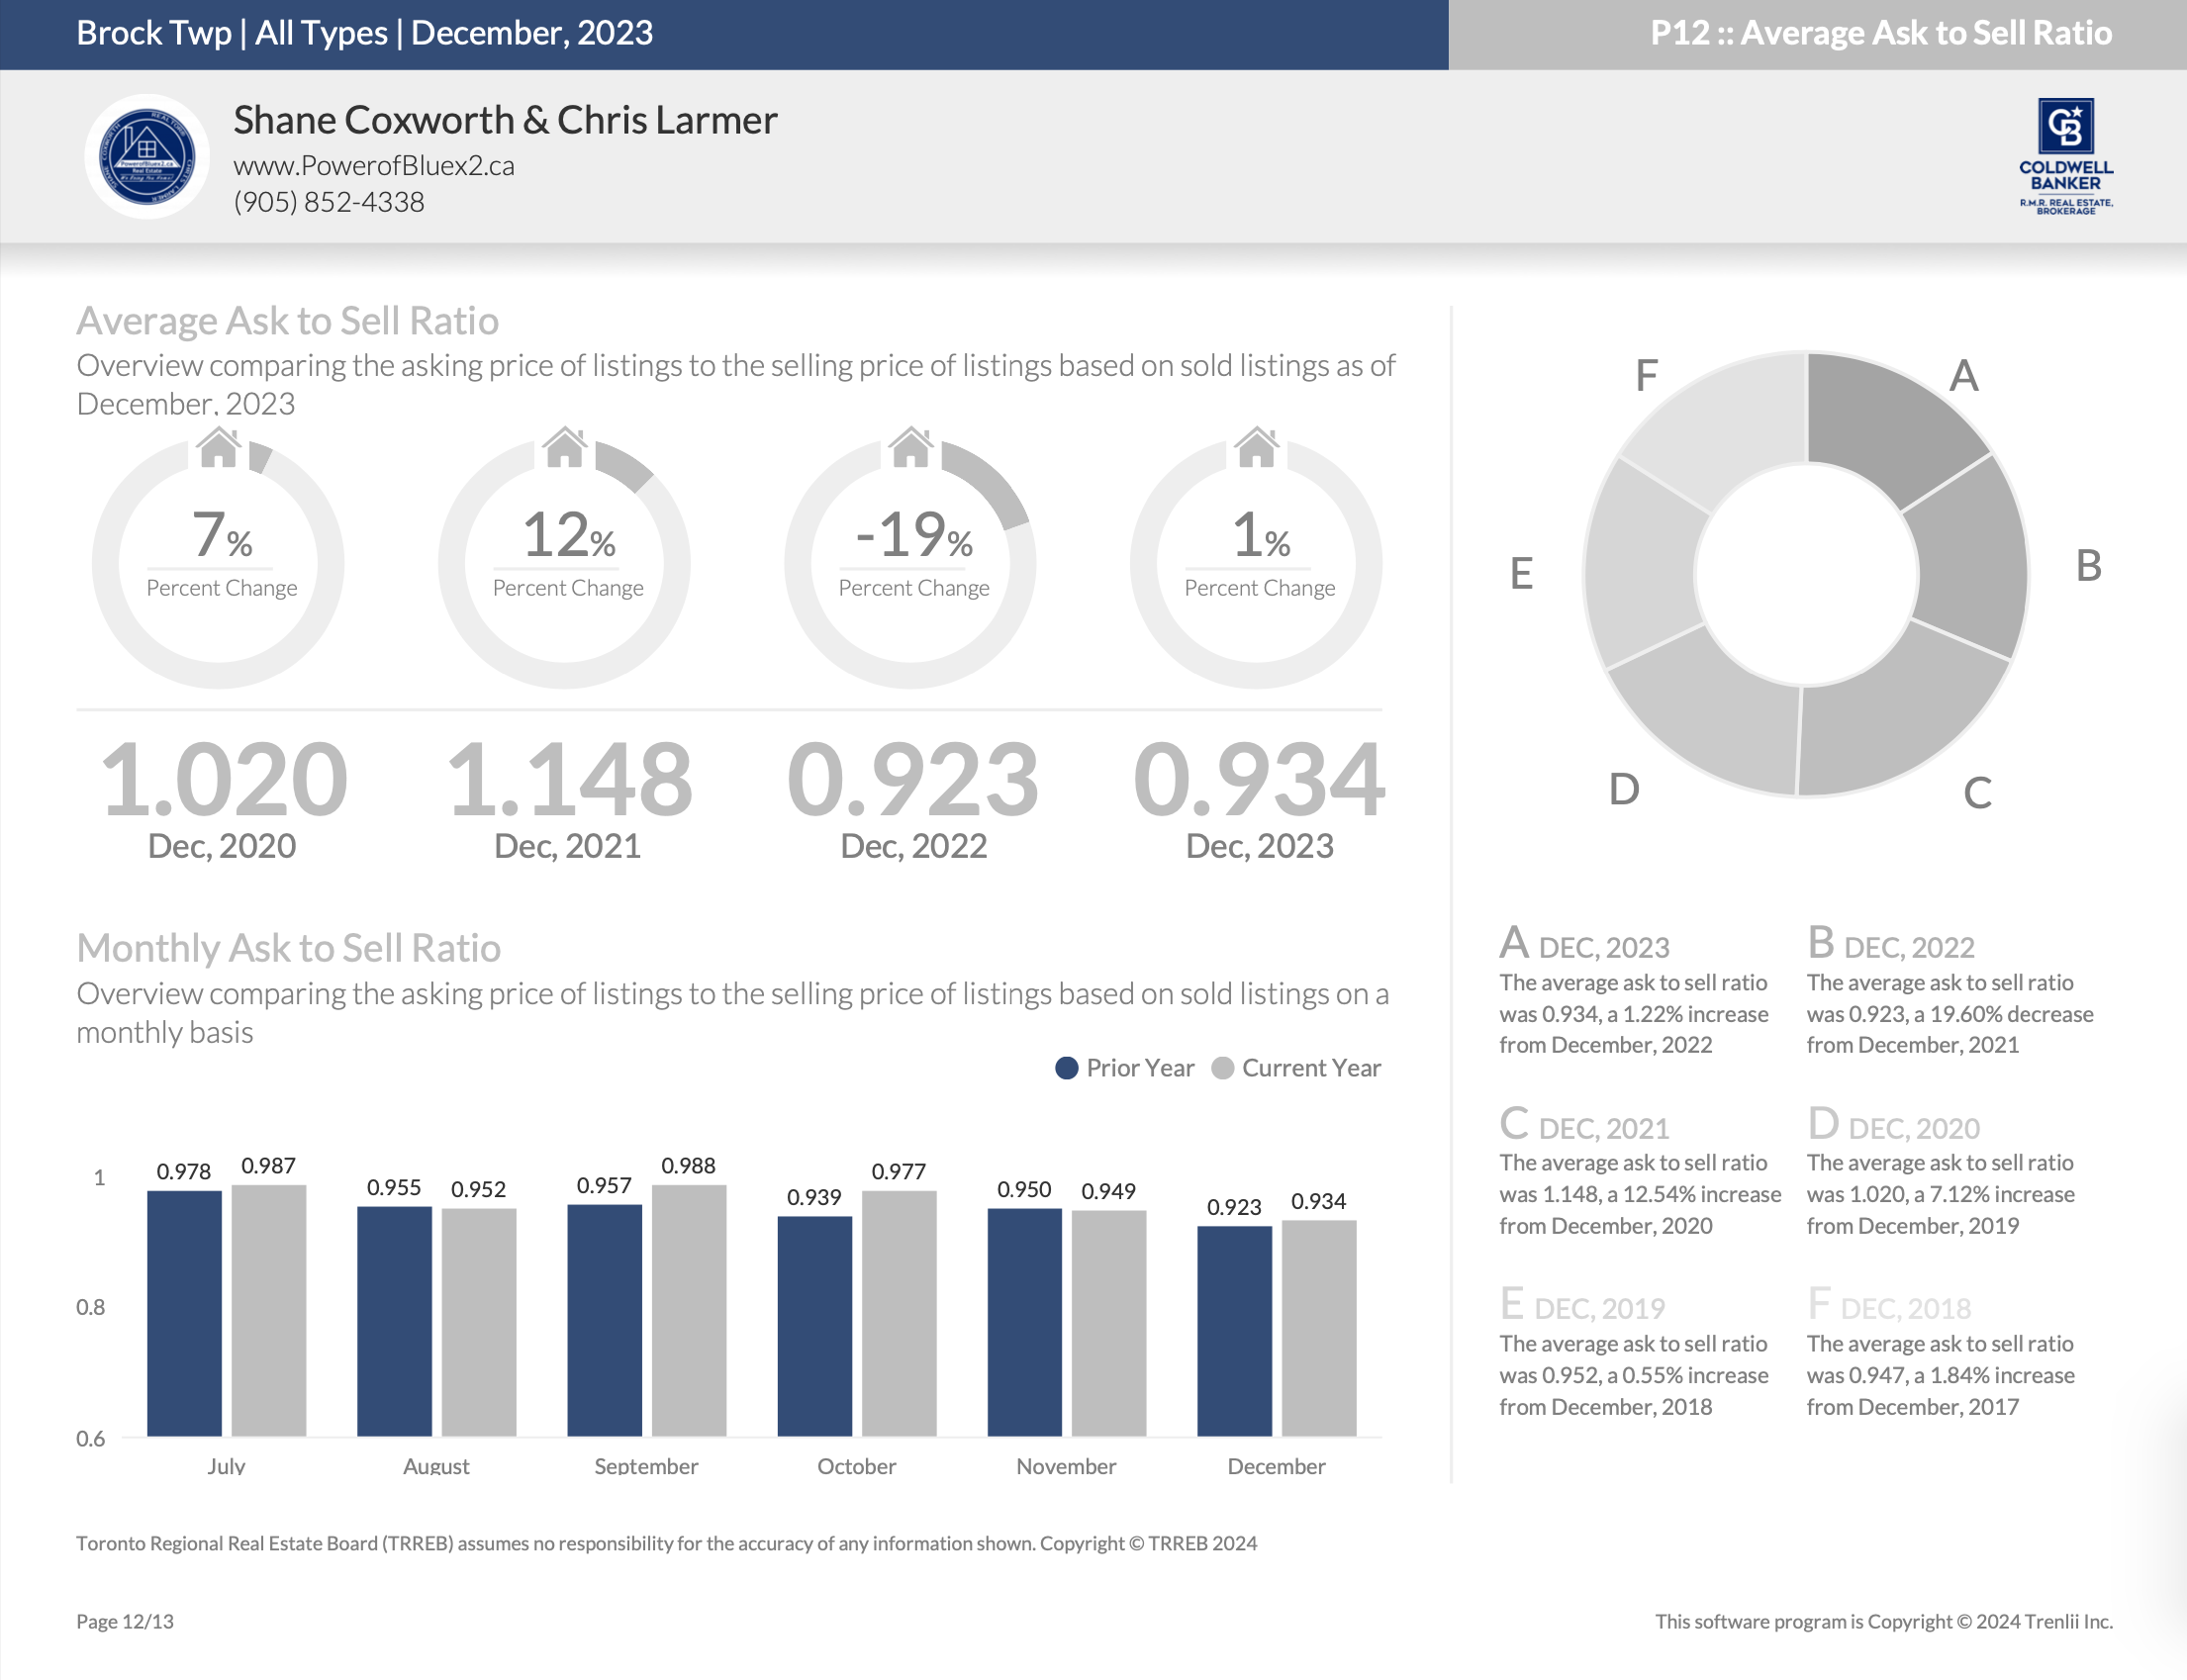
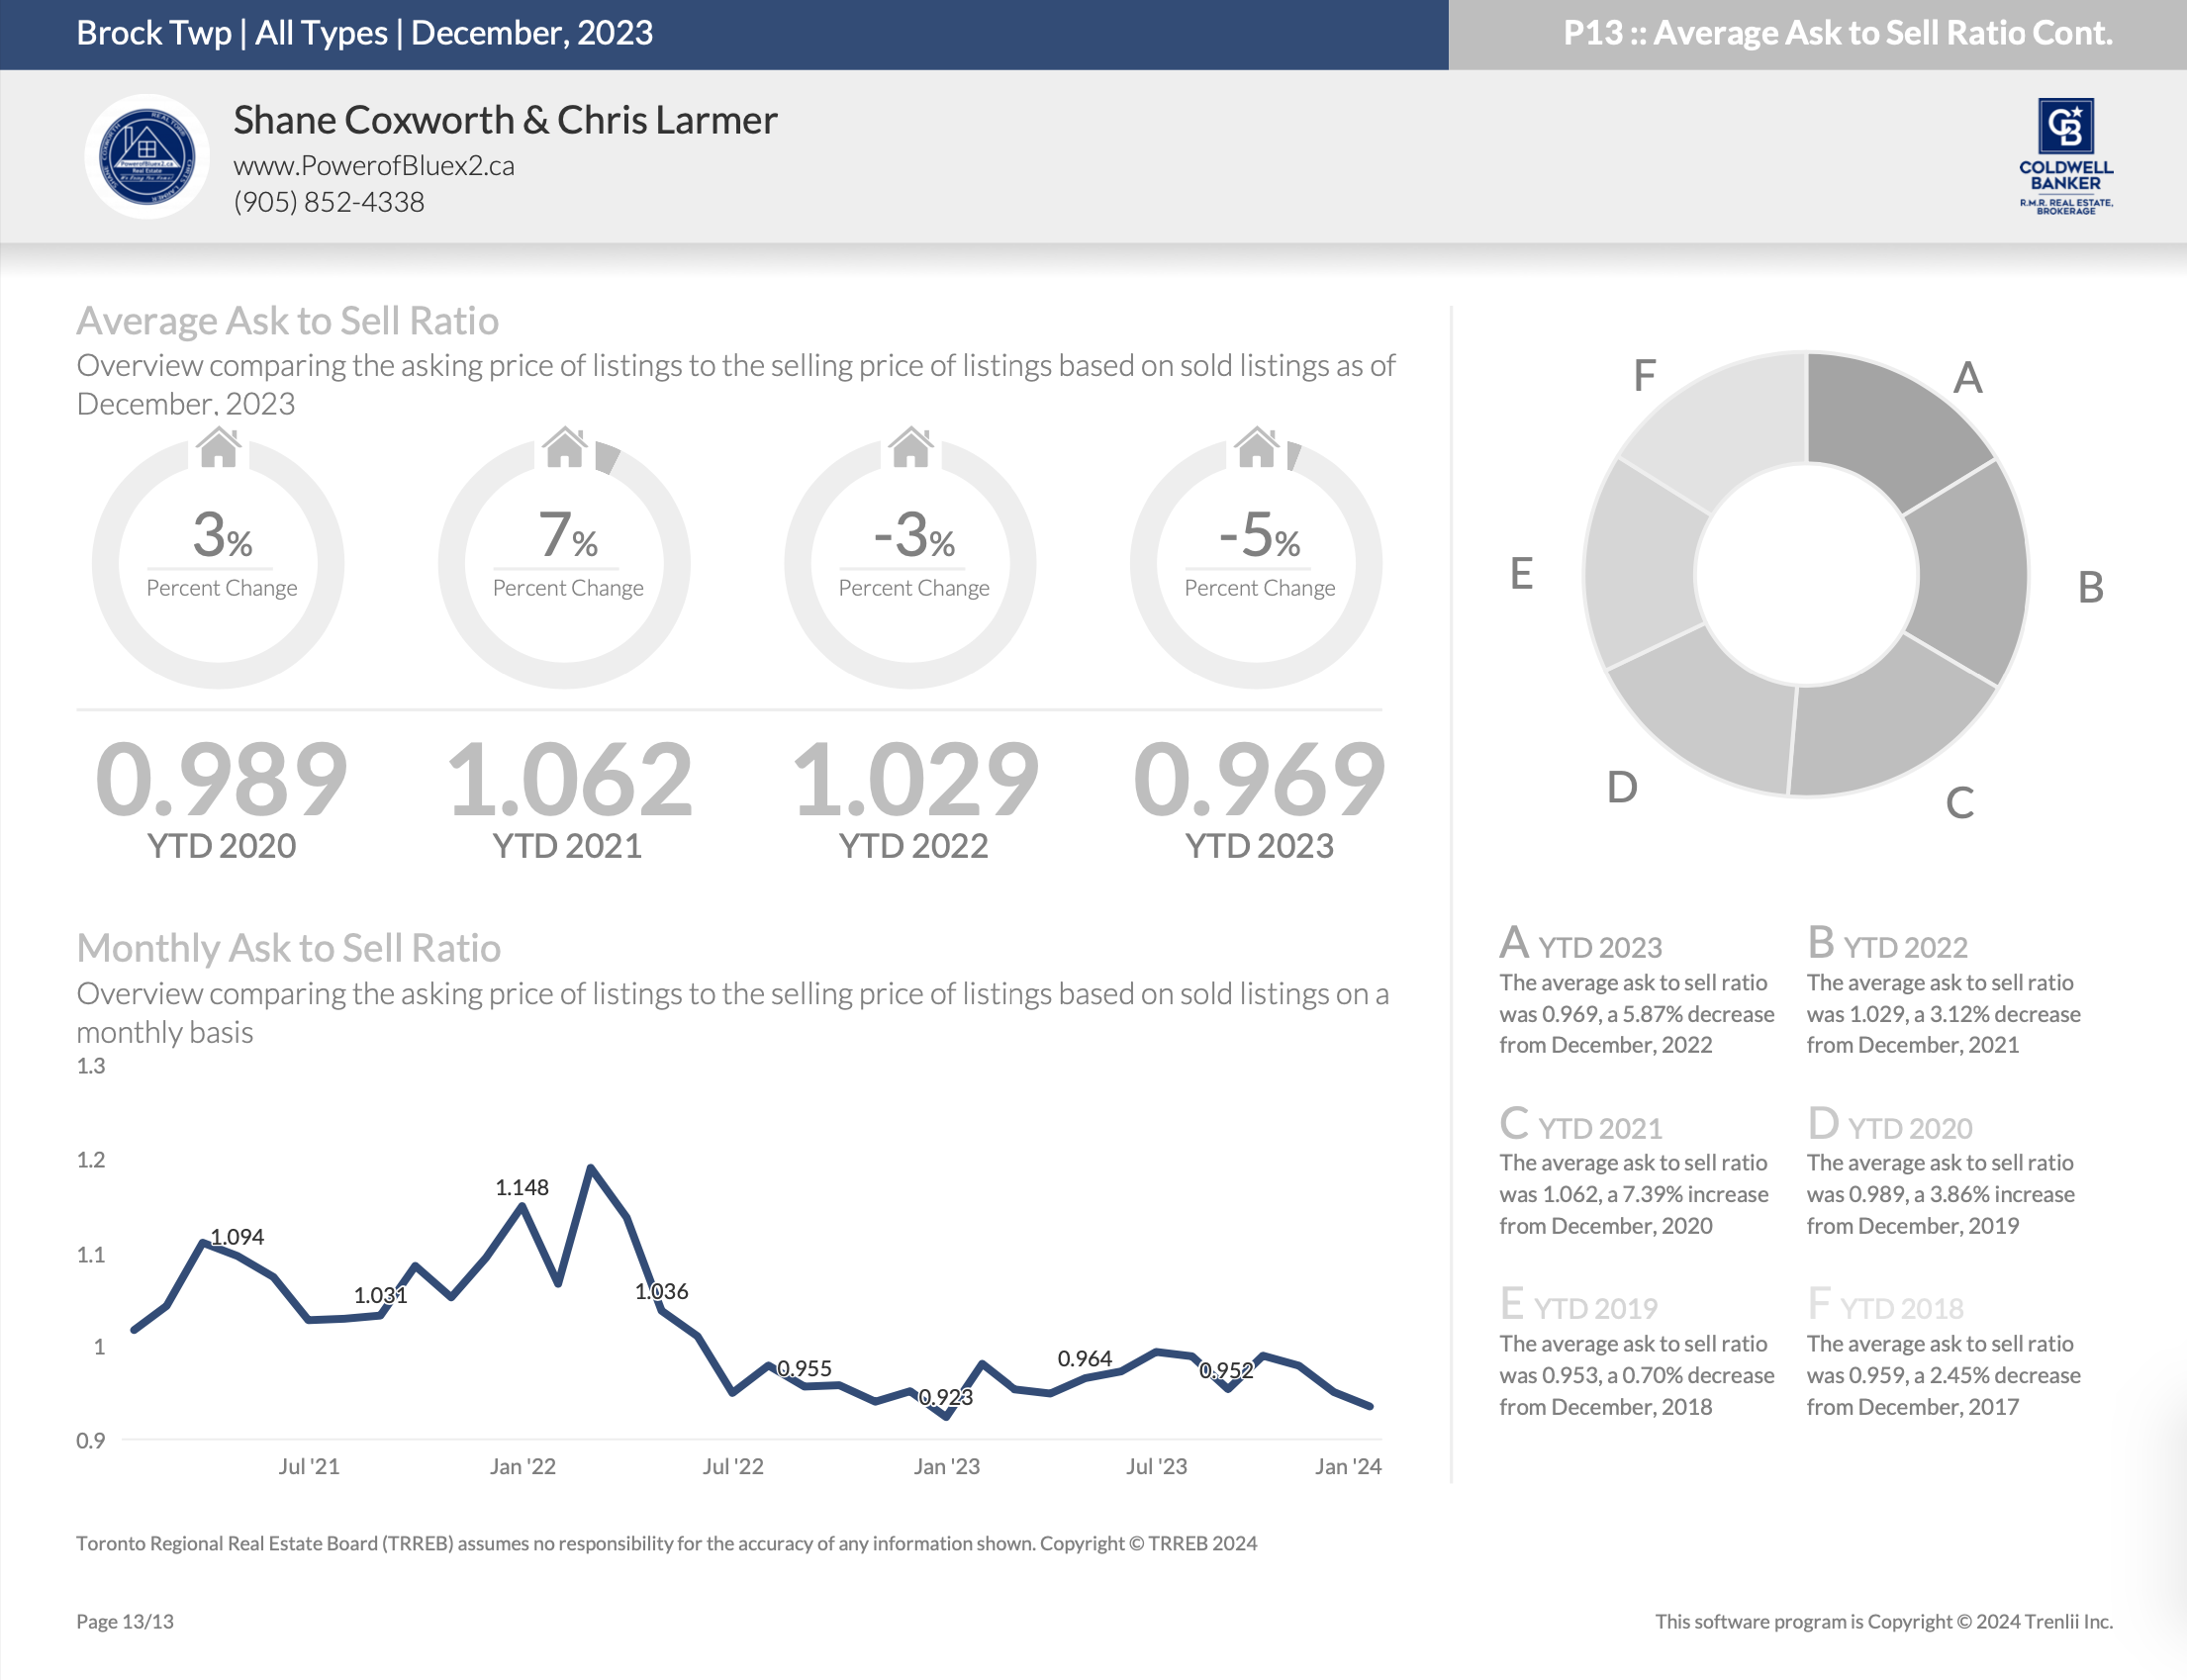
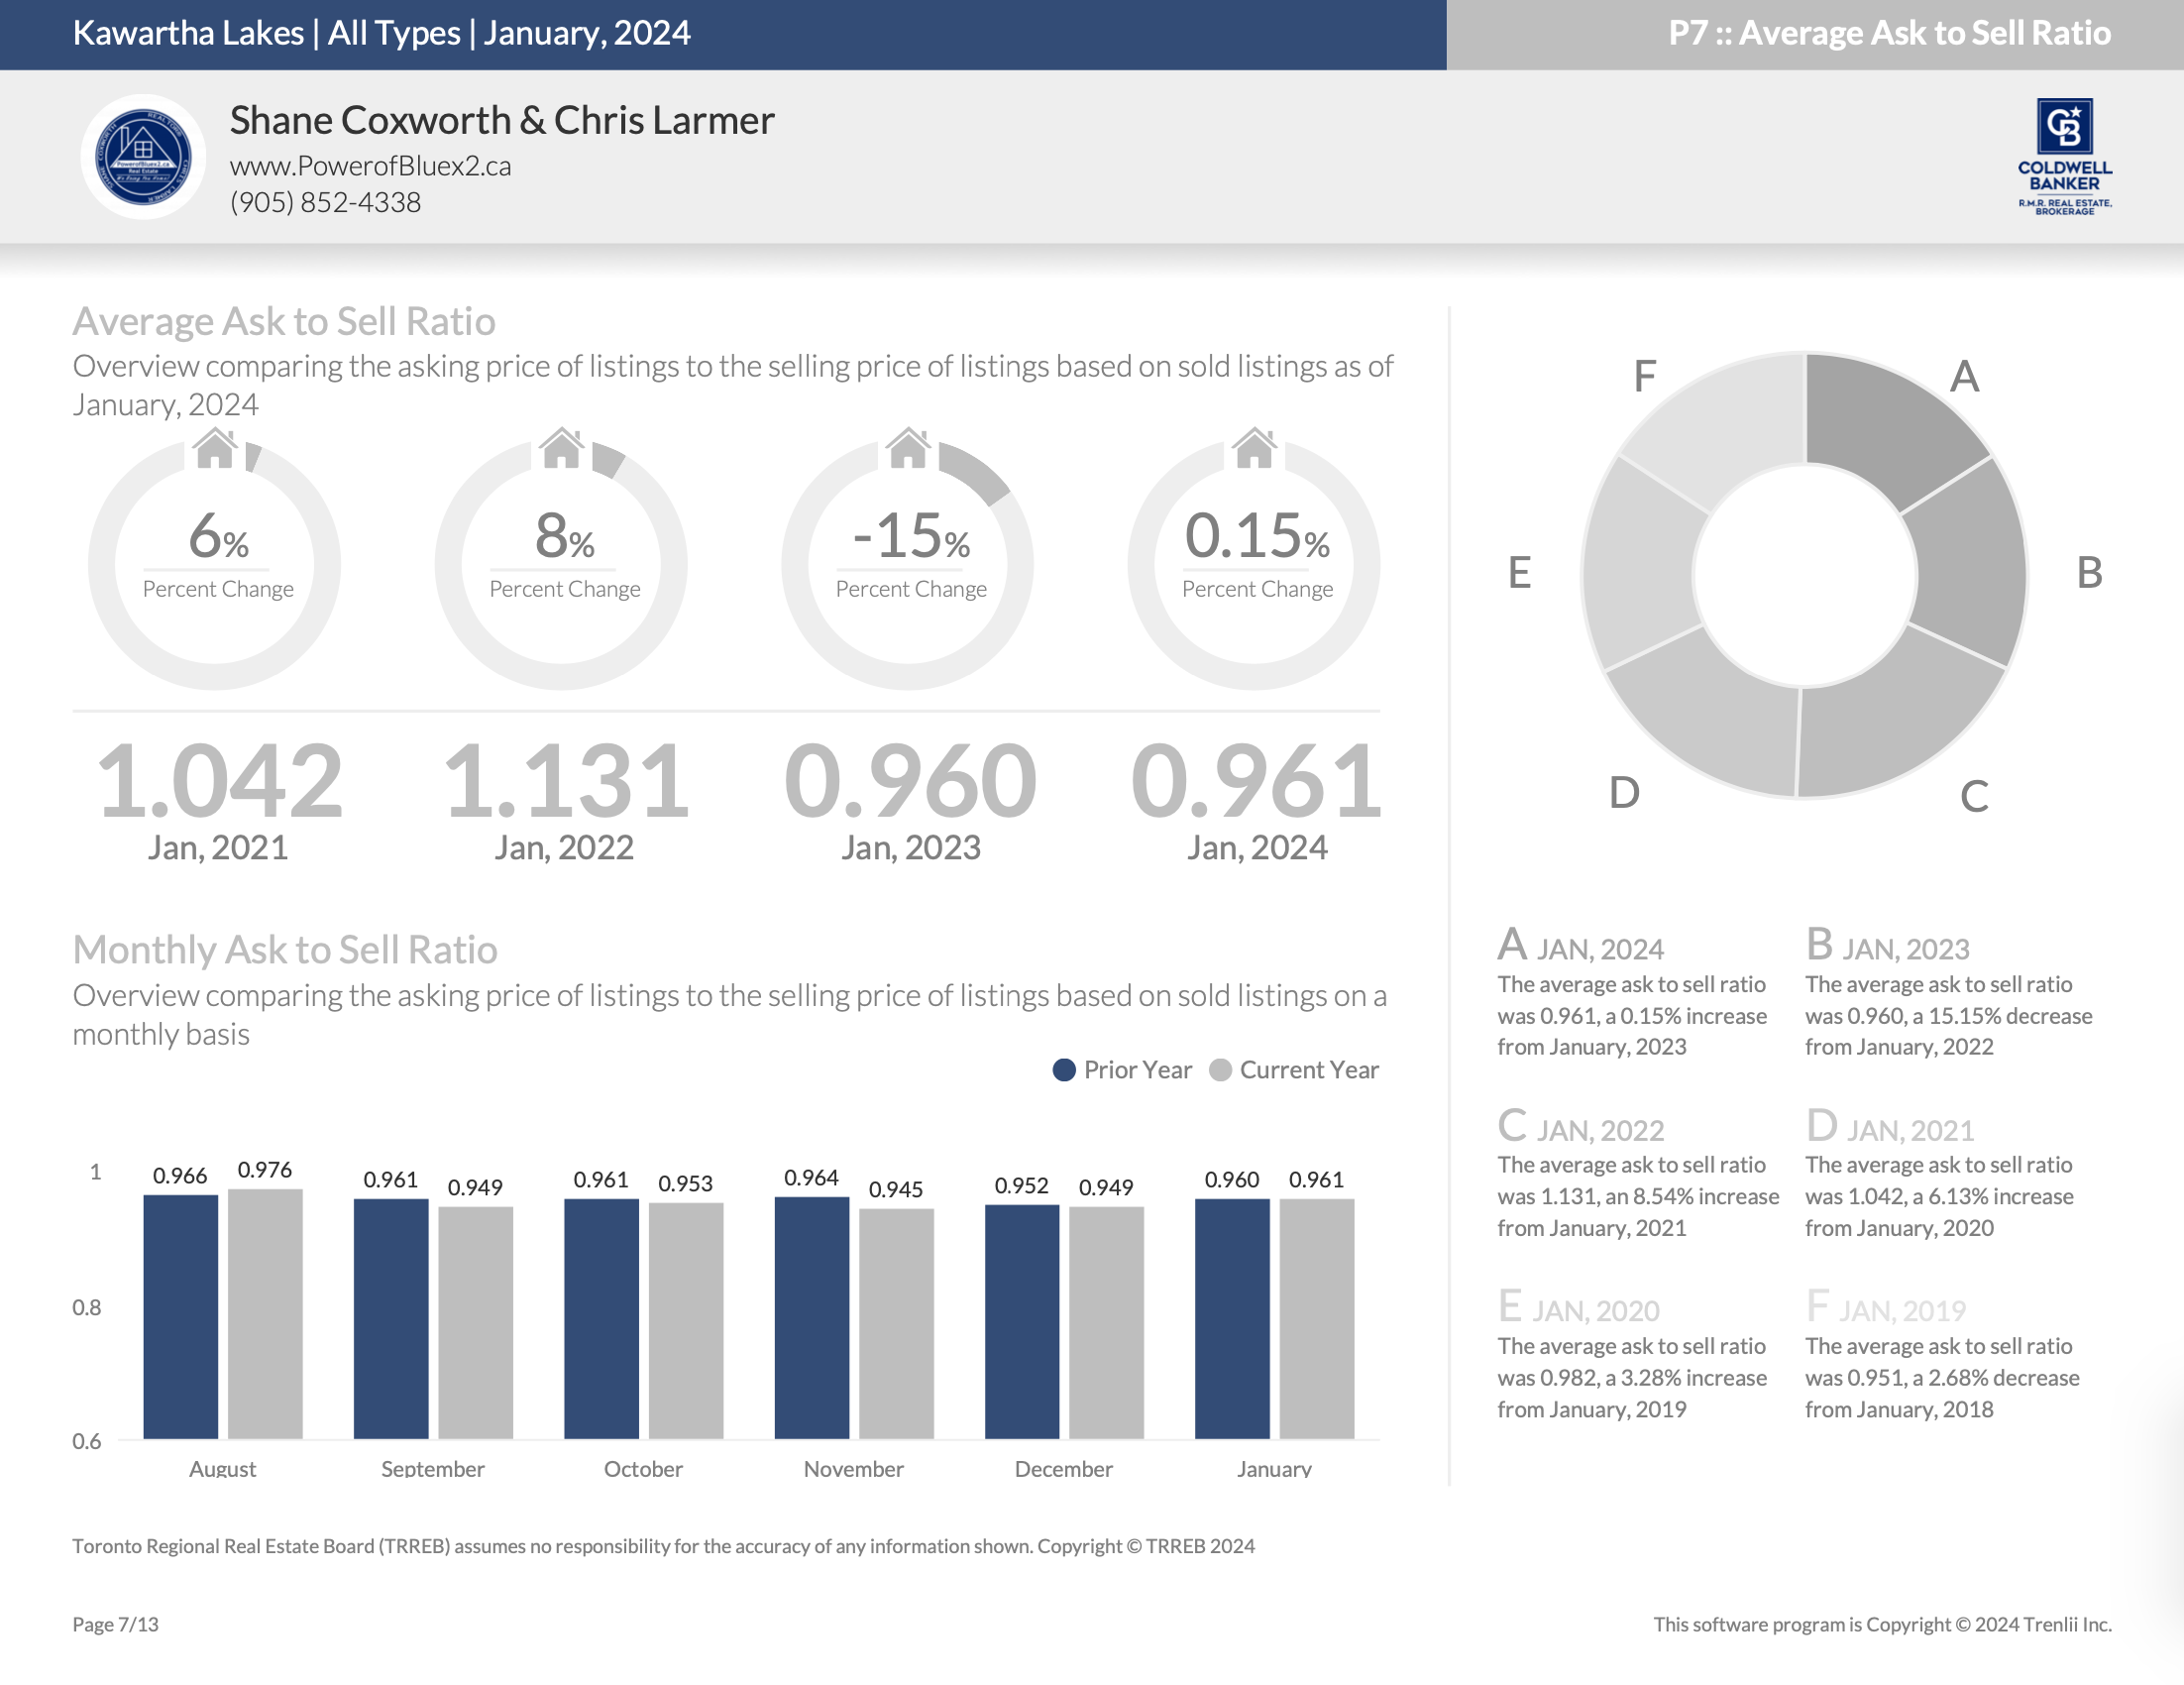
Average List Price to Sell Price Ratio – January 2024
*Information is believed to be accurate at time of posting but is not guaranteed to be correct
Not intended as a solicitation if your property is already listed by another broker. Affiliated real estate agents are independent contractor sales associates, not employees. ©2021 Coldwell Banker. All Rights Reserved. Coldwell Banker and the Coldwell Banker logos are trademarks of Coldwell Banker Real Estate LLC. The Coldwell Banker® System is comprised of company owned offices which are owned by a subsidiary of Realogy Brokerage Group LLC and franchised offices which are independently owned and operated. The Coldwell Banker System fully supports the principles of the Fair Housing Act and the Equal Opportunity Act.
Click below for more reports